echnical eview - mapnaturbine.ir review-no.4... · echnical eview mapna turbine engineering &...
TRANSCRIPT

MAPNA Turbine • October 2015 1
echnical eviewMAPNA TURBINE ENGINEERING & MANUFACTURING CO. (TUGA) No.4 - October 2015
Willpower to Empower Generations

Cover page:MAPNA Gas Turbine Simulator MGTS-30.1

1
Editorial
MAPNA Turbine • October 2015
“Excellence must be achieved through the eyes of those who judge us; once achieved, it can only be maintained with constant innovation.” Tom Collins
Dear Customers, Partners and Professionals,
Never getting complacent about what has been already achieved, MAPNA Group has been aspiring to continually identify the ever-changing requirements of the energy sector. Such endeavours keep resulting in establishing and achieving brand new milestones in the pursuit of excellence. Widening the propositions put to all stakeholders, this 4th issue of MAPNA Turbine Technical Review presents a brief account of a few exciting and innovative packages.
Gas turbine operation in dusty, humid and salt-laden areas has always been a challenge and coming up with an effective filtration mechanism to address a good part of these issues can enhance the life cycle of the machine drastically. The first essay provides information on a new upgraded filtration system to overcome harsh environmental conditions.
The second essay covers the efforts made to practically measure size and velocity of liquid fuel droplets of fuel oil burners. The results have been and will be used to investigate on atomization parameters, in order to improve the burner design for fuel flexibility of MAPNA Gas Turbines.
An integrated real-time code, MGTPC, has been introduced as the third item in this issue. It is a powerful tool to calculate performance characteristics of single-spool and triple-spool machines in different sections both accurately and rapidly. The extremely short calculation time, makes this package a highly suitable one to serve real-time performance simulation and monitoring purposes.
Another product to simulate logics and control system performance specifically for MGT-30 machines has been showcased as the fourth essay. MGTS-30.1 gives the users the capability to simulate operation conditions for their machines with a high degree of precision to serve a wide range of purposes.
The major hassle of dealing with control system obsolescence for GE frames has also been innovatively addressed in this issue. A flexible solution to upgrade the control system independently from the OEM has been put forth and expounded on in some detail.
Finally, MGTCD, a compact package assisting in conceptual design of gas turbine combustorsor alternatively, design review of existing ones, is rather elaborately unveiled in this fourth issue.
The material in Technical Review issues is based upon the information meticulously produced by our research engineers of different technical disciplines, whose invaluable sharing is hereby appreciated.Respectfully,Mohammad Owliya, PhD
Vice President for Engineering and R&D
MAPNA Turbine Company (TUGA) - October 2015

MAPNA Turbine • October 2015 2
Get the Filtration Back on Track, Even when up and Running!
Developing LED Pulsing IlluminationSystem to Implement Backlight PIVTechnique
Get the Performance Characteristics ofthe Machine, in no Time Flat!
MAPNA Real Time Gas Turbine Simulator MGTS-30.1
Generation of the Standard MS6001BGas Turbine Control Logic
Conceptual Design and Preliminary Sizing of Gas Turbine Combustors (MGTCD)
taBlE oF ContEnts
3
6
11
16
25
28
123456

MAPNA Turbine • October 2015 3
Get the Filtration Back on track, 1 Even when up and running!
introductionExperience of operating Air Intake System and facing some challenges in performance like premature life time expiry of the filters (especially in dusty and humid areas), prompted TUGA to upgrade the filtration system and introduce some improvement to the original design to achieve better performance in function, operation, maintenance and unit availability. Through these changes, function of filtration system has improved and lifetime of filters has increased. In addition, total pressure drop of the filtration system has decreased and last but not the least, restoring the filtration quality of Pre-Filters (even while the gas turbine is working) has been enabled.
Upgrading the air intake systemThe new Air Intake System for MGT-70 turbine is equipped with several filtration stages. Two Pre-Filter stages plus one fine filtration stage will protect the GT from contamination in the incoming air. The first filtration stage consists of metallic
Pre-Filters for removing big particles and moisture from the incoming air. The second filtration stage has an integrated static Pre-Filter which is made up of glass fiber pads. Both first and second filters are framed in galvanized panels and are easily fitted into the structure of the intake system.
The final filtration stage is composed of conical-cylindrical cartridge filters which are cleanable by pulse jet system. Pairs of conical-cylindrical filters are coupled and installed horizontally onto filter house wall.
Retrofit of Filtration System includes the following initiatives:
• Using two stages of Pre-Filters instead of inertial Pre-Filters
Inertial vane type Pre-Filters have been being used in the original design of the intake system. They have good performance for dense particles like sand. But tiny particle can easily pass through this type of filters. By replacing inertial Pre-Filters with two separate filtration stage, the ability to catch tiny particles will be substantially enhanced. (See Figure 1)
Inertial Pre-Filter Metallic Pre-Filter Static Pre-FilterOriginal Design New Design
Figure 1 - Changing type of Pre-Filters and adding one Pre-Filter stage

MAPNA Turbine • October 20154
The first stage Pre-Filter is made up of metallic washable media inside a rectangular frame. The second stage is made up of glass fiber pads which are replaced with new ones after loading. Static Pre-Filters have shown better performance in filtration, meanwhile, they incur less initial pressure drop. Both first and second filtration stages can be easily assembled or disassembled using several bolts and clamps.
The special benefit of using these two types of Pre-Filter is that, the GT can operate properly at base load during replacing Pre-Filters (both first and second stages)
• Changingsizeofthefiltercartridges
Filter cartridges are installed horizontally in the filter house (See Figure 2). In the new design, arrangement of filters has been changed from double cylindrical elements to conical cylindrical elements. Through this modification, a considerable portion of the pressure drop will be restored. (See Figure 3)
To introduce this change, some modifications are required in the structure of Air Intake System.
Figure 2 - Cartridge filters are installed horizontally

MAPNA Turbine • October 2015 5
ConclusionThe above-mentioned changes in filtration stages will bring upon the following advantages:
Reducing initial pressure drop of Pre-Filters by about 180Pa.
Reducing initial pressure drop of fine-filter by about 250Pa.
Enhancing filtration quality and the ability to trap tiny particles
Enabling filter change-out without stopping GT (improving the availability
of the machine).
Washable metallic Pre-Filters to enable restoring the initial pressure drop.
Economic Fiberglass pads which could be supplied locally upon demand.
Considerable saving in life time of filter cartridges
Reducing power consumption (static Pre-Filters don’t have dust exhaust
fan and electromotor)
Reducing total pressure drop of the intake system about 430Pa that will
result in an increase of about 0.6% in power output!
Original Design New design
Figure 3 - Using conical-cylindrical arrangement instead of double cylindrical

MAPNA Turbine • October 20156
developing lEd Pulsing illumination system to implement Backlight PiV 2 technique
introductionMicroscopic study of the fuel spray produced by injectors is a substantial factor in developing and analyzing injectors. Droplet size and velocity distribution at different distances from the injector outlet, are known as the most significant microscopic characteristics of the spray.
This article presents the application of pulsed LED lighting for digital imaging technique to characterize size and velocity distribution of droplets in dense spray of pressure swirl nozzles which are mostly used in gas turbine combustion systems. Although, many mature and available optical techniques such as PDA, LDV and PIV work well using pulsed laser as lighting system, the laser system makes them expensive and brings about some risks to health/safety and technical problems (As laser is not monochromatic wavelength). So, a high-resolution CCD camera and a pulsing LED light source, together, with image processing technique result in the new technique, digital particle shadow velocimetry (PSV) or might be recognized as backlight PIV.
Microscopic Measurement on spray Generally speaking, the obstacles in measuring size and velocity in flows like that in a spray are categorized into the following:
1- High number density of the particles inside the spray
2- High velocity of particles
3- Wide range of size and velocity
4- Time variability of the particle size and velocity due to the turbulent nature of spray flows
Depending on the intensity of the above-mentioned problems, an ideal technique to measure particle size in a spray should fulfill the following conditions:
1- The measuring technique should not interfere with the spray pattern. With any variation in the velocity field, the pattern of the streamlines undergoes a change. As small particles travel on streamlines and bigger particles deviate from them, the resulting particle size distribution will vary. The techniques not impacting the spray flow are known as non-intrusive techniques.
2- An appropriate measuring technique needs to be able to cover a wide range of particle sizes (on a scale from 1 to 10); it is even more desirable to get this spectrum to widen to 1 to 30. In high speed photography technique small particles are detectable depending on the sensitivity of the camera and the optical accessories.
3- The technique should enable simultaneous time & number based distribution measurement.
4- The measurement should contain considerable number of particles.
5- The technique should not be affected by physical and chemical conditions of the measuring environment and those of the working fluid inside the injector.
Given the above, optical measurement techniques are widely used nowadays to study atomization and spraying phenomenon due to their non-intrusive characteristic.
Two common optical measurement techniques in identifying spray characteristics are PDA and PIV.
Adopting PDA technique, one can measure velocity and diameter of the particles at the same time. The technique enjoys high sampling rate and measuring inaccuracy of very close to zero, and plenty of particles can be analyzed at rates as high as 10,000 particles per second. The downside of this technique is its being highly sensitive to the particle shape: When the particles are not spherical, the measurement accuracy decreases drastically. Also, the spot

MAPNA Turbine • October 2015 7
measurement nature of PDA technique restricts the measurement coverage to the very few points under investigation. Other drawbacks of PDA are the sensitivity of the technique accuracy to the equipment positioning, high price, and last, but not the least, unavailability of the parts and services in the local market. PDA measures spray characteristics based upon Doppler frequency difference phenomenon. The machine uses a laser generator, two receivers detecting the reflected beams from the particles and a processor. It is able to measure parameters such as average size and velocity of particles in two directions, turbulence level of particle flow, number of particles and their sphericality.
PIV technique measures the velocity field of particles using two photos - the second taken shortly after the first – and calculating the distance travelled by the particles in the short time interval. This technique enables one to measure size of particles at the same time as their velocity. As the velocity components are extremely high inside the spray, to avoid incurring any error while capturing diameter and velocity of particles, illumination pulsing intervals as short as a few hundred Nano-seconds should be used in the photography. This technique makes use of scattering illumination system (shedding light onto the observation area, both vertically and from the side) to detect the particles inside the vision field, which makes deploying high-power laser beams inevitable.
As well as PIV technique, PSV (Particle Shadow Velocimetry) is also another economical technique to investigate the spray flows. The measurement principle of digital particle shadow velocimetry (PSV) also relies on the finite observation time used to detect particle motion. The particles need to be illuminated and observed twice with a time lag between the observations. It uses FFT technique to identify the presence and location of droplet oscillation patterns, and an optimized frequency-based algorithm is used to extract the droplet characteristics. The light is shed from behind and if there is any obstruction between the light source and the destination plane (camera), the shadow will be captured by the plane. Generally speaking, PSV technique works well for media with a high diffraction coefficient (e.g. air and water). PSV usually
makes use of a light source of lower power than laser like flash lamp, sparkle or LED lights.
All in all, both PIV and PSV techniques use the same phenomena and the difference lies only in illumination source and software implementation. In Photographical Velocimetry (PIV and PSV), unlike Optical Velocimetry (PDA and LDV), the velocity field is measured in the vision field and not at one point. In PIV and PSV techniques the velocity field is in fact specified in an Eulerian viewpoint.
Taking the above into account and to pave the way for implementing PSV technique at MAPNATURBINE research lab. steps were taken towards development and manufacturing of an appropriate light source to produce high-quality images, a control system to adjust the light and a high-speed camera. This technique can be applied to both homogenous and inhomogeneous droplets. It can be used to measure the size of droplets with non-uniform and/or varying refractive index, even in regions of high particle number density.
SpecificationsofthetechniqueFrom the specifications of the light source used to implement PSV technique, its emitting pulsating beams with a bandwidth of about 200 ns with a high power and repeatability rate can be highlighted. Today, LEDs are alternatives to laser sources. Solid state LEDs produce a medium radiative power in the power range higher than 10W while one can get them produce far higher powers when pulsating in extremely short time intervals relative to when they are used to produce a continuous light. This energy is thus sufficient to illuminate micron size particles for the subsequent photography through PSV and even PIV techniques.
High power LEDs operated in pulsed mode are attractive alternatives to costly, pulsed laser systems. The pulsed mode allows driving the LED beyond its specifications and generates enough light for PIV experiments, for instance. In addition to low price and long life compared with laser sources, LEDs enjoy light intensity uniformity and stability in their consecutive light pulses. Furthermore, due to their wider

MAPNA Turbine • October 20158
wave spectrum (10-30 nm), the dark spots existing in laser light are not observed in LED light. In the pulsating mode of LEDs, the emitted signal is stable both in intensity and in local distribution.
The noteworthy fact about LEDs is that while they can undergo electrical currents far higher than their nominal capacity in short pulsating intervals, the temperature of the board underneath them still remains well under the failure temperature, despite their having emitted light with a higher intensity. This makes LEDs appropriate options as pulsating light sources.
To implement PSV technique, we also need to make use of a synchronizer between photography time by the camera and the lighting system. Figure 1 shows the
pulsating synchronization of the camera and the lighting system. Due to the strict need to high precision in camera/lighting system synchronization, two algorithms have been made use of in the developed control system to get the system to function appropriately. Depending on conditions and user preferences, command to take each pair of photos can be issued by the camera to the control system or the other way round: from the control system to the camera. Using LED rather than laser in the current lighting system necessitates deploying a high power and high frequency lighting system which in turn, incurs some degree of complication in design of the electronic-power system of the machine.
Figure 1 - How camera and lighting system are synchronized
To develop such an electronic circuit, high-frequency switches of a high power (50 A, 50 V) were used and a 16 MHz
microcontroller was selected to take control of the circuit. The specifications of the developed machine are given in table 1.
descriptionspecs.Depending on LED TypeLED Color300 WPower Consumption220 VInput Voltage1 MHzMaximum Frequency125 nsMinimum BandwidthTrig In & Trig OutStart-up Technique20 x 20 x 10 cm3Dimensions
Table 1- Lighting System Specifications

MAPNA Turbine • October 2015 9
Figure 2 - Prototype of the developed control system
Figure 2 shows the control system circuit and the manufactured prototype. In the current design, effort was made to create
sharp pulses and the output signals were verified by an oscilloscope.
results Figure 3 shows the breakup of liquid jet from a pressure-swirl injector (MGT-70 Gas Turbine). As shown in the figure, exposure time of the camera was adjusted to 5 ms and the resulting photos by a continuous light and those by the pulsating light produced by the developed light source
were compared. It is observed that due to the adjusting adopted in pulsating light, if the camera shutter is excessively open (as in commonly used cameras), it will be practically possible to take high quality photos.
a) With the existing lighting system b) With continuous lightFigure 3 - Injector jet plane photo with a shutter exposure time of 1/250 s
Figure 4 shows the particle size distribution in a pressurizing-swirling injector (MGT-70 machine) for both continuous light and pulsating one with a camera exposure time of 125 µs.
Comparison between the two photos, clearly shows the higher quality of the one taken using the developed pulsating light.

MAPNA Turbine • October 201510
a) With the existing lighting system b) With continuous light
Figure 5 - Size distribution for the droplets resulting from the photo analysis
Figure 6 - Tracking the particles in one photo using two light
pulses
Figure 4 - Particle size distribution in the spray of a pressurizing-swirling injector with a camera exposure (shutter open time) of 1/8000 s
Figure 5, depicts a sample of the results derived out of analyzing the photos taken from the MGT-70 machine injector including the distribution of particle size.
And finally in figure 6 a photo has been
shown of a few particles, taken by two light pulses emitted in one camera exposure time. As shown, given this feature of the optical control system, it is possible to calculate the particle velocity in the vision field.
Conclusion A PSV technique was introduced as a variant of laser based PIV. This technique allows light sources with significantly lower power than lasers to be used. The technique employs a non-scattering approach that relies on direct inline illumination by a pulsed source such as a LED onto the camera imaging system. Based on taken data, it is understood that this technique will work well for industrial application and can be extended for further application such as flow field measurement in combustion chamber and compressor blades.
00
5
10
15
20
25
30
35
100 200 300 400
Droplet Diameter (um)
Prob
abilit
y (%
)
500 600 700 800
MAPNA Turbine • October 2015 11
Get the Performance Characteristics3 of the Machine, in no time Flat!
MGtPC(MAPNA GAS TURBINE PERFORMANCE CALCULATOR)
introductionIn line with manufacturing a portfolio of gas turbines at MAPNATURBINE, development of their thermodynamic analysis packages is already underway. The usages intended for such packages include, but are not limited to:
• Machine and plant simulators
• Initial calculations for GT upgrading
• Power plant cycle design
• Investigating various processes in power plants, e.g. compressed air injection and water spray
• Training
So far, thermodynamic simulators for single-spool and triple-spool gas turbines have been developed in-house. In addition to calculating flow details in various sections of the machine, these packages enjoy an ultrahigh calculation speed that has made them suitable to be used in real-time simulators of the GT and plants. Furthermore, different control logics (e.g. the ones based upon fuel mass flow, power output, turbine outlet temperature, etc.) were deployed in developing the simulator’s algorithms to make them user-friendly and easy to adopt to serve different purposes. A comparison made between the produced results and available data for the heavy-duty machine MGT-70 and the industrial machine MGT-30, proved the reliability of the developed packages to accurately produce performance characteristics of the machines.
a review on thermodynamic analysisAlgorithms of thermodynamic analysis are structured based upon component matching principles of gas turbines.The principles include:
• Equality of the consumed power by low pressure compressor, to that produced by low pressure turbine
• Equality of the consumed power by high pressure compressor, to that produced by high pressure turbine
• Equality of the turbine outlet pressure to that of the atmosphere
All three consistency principles are used when conducting the thermodynamic analysis for triple-spool machines, while only the last one is used to do so for a single-spool machine. Inputs to and outputs from such algorithms are as follows:
inputs:• Performance curves for different
components of GT machine, i.e. compressors, turbines, air intake/exhaust systems and combustion chambers
• Ambient conditions (pressure, temperature, humidity)
• Fuel characteristics (temperature, pressure, mass composition)
• Shaft speed for single spool machines or power turbine shaft speed for multi-spool machines
• Control logic
• Cooling and bleeding air pattern
• Variable guide vane position
• Equivalent operating hours
• Operation limits of the gas turbine machine

MAPNA Turbine • October 201512
outputs:• GT power output and efficiency
• Performance characteristics of each component (pressure ratio, efficiency)
• High/low pressure turbine rotational speeds (for multi-spool machines)
• Temperature and pressure in any section of machine
• Mass flow, temperature and pressure of cooling and bleeding air
• An estimation of gas composition in different sections of machine
Steady state operation characteristics of gas turbine are derived based upon an independent variable. This variable can be fuel mass flow, turbine outlet temperature, and power outputs and inlet or outlet temperature of low pressure and high pressure turbines. This independent variable has been called control logic in the inputs of the algorithm. The present gas turbine thermodynamic cycle analysis was developed based upon fuel mass flow variable. To cover any other control logic, a subroutine is made use of, to produce the fuel mass flow fulfilling the requirements of that specific control logic.
Outlet temperatures of different components of machine are calculated using enthalpy and entropy quantities. Air and gas flow enthalpy and entropy are in turn calculated using enthalpy and entropy of their components. In the developed algorithm, air composition includes Nitrogen, water vapor, Oxygen, Carbone dioxide and Argon. Their mass content is specified out of their mass
content in dry air and relative humidity of the ambient air. The composition of the hot gas at the outlet of combustion chamber is calculated assuming a complete combustion of fuel-air inside the chamber and the mass content changes with the addition of cooling air flows.
Heat value of the injected fuel is calculated based upon its composition using the customary methodology. The fuel mass composition is specified through analyzing the fuel pumped to the power plant; common fuels like diesel oil and natural gas (methane) have been already incorporated into the thermodynamic simulator though.
Among the noteworthy points in developing thermodynamic simulators are the operational constraints of gas turbines. They can include rotational speed, power output, turbine inlet temperature, turbine outlet temperature, stability margin and other parameters that can be separately taken into account. In a thermodynamic analysis, the operation point of machine is determined and then, all operational constraints are investigated. In case any of the constraints is violated, the user will be notified of that.
Performance curves of different machine components are given regardless of their life cycle degradation; so, the primary variables of the machine (power output and efficiency) need to be readjusted based upon the equivalent operating hours. To do so, the values of these parameters are produced and they are subsequently modified using the curves provided by the manufacturer (degradation based upon equivalent operating hours of the machine).
Figure 1 - Schematic view of MGT-70 machine

MAPNA Turbine • October 2015 13
SimulatorverificationbyMGT-70In figure 1, schematic view of the single-spool heavy-duty gas turbine MGT-70 has been shown. The performance characteristics for this machine in standard conditions are as follows:
• Output power: 162 MW
• Pressure ratio: 12
• Mass flow: 525 kg/s
• Outlet temperature: 815 K
This machine makes use of inlet guide vanes and the performance curves of the axial compressor have been provided for different positions of these vanes. Calculations of the simulation were carried out deploying ISO 2314 methodology.
The developed algorithm was verified for various ambient temperature and pressure, inlet guide vane (IGV) position, and fuel composition. In figure 2, a comparison has been made for fuel consumption versus turbine outlet temperature at sea level, between the simulator results and power plant data. In figure 3, quantities of the maximum difference between simulated and empirically produced data are shown for various parameters in various ambient conditions. The widest gap is between compressor outlet pressures at ±1.6%. The calculation time elapsed for the thermodynamic analysis of MGT-70 machine was shorter than 20 µs. High precision and short calculation time have led to suitability of the package for use in real-time power station simulators.
Figure 2 - Comparison between thermodynamic analysis and power plant data(natural gas fuel and sea level ambient)
Exhaust Tempreture (K)
Code
Test DataNc=1.05
Nc=0.935
Pow
er (M
W)
60060
80
100
120
140
160
180
650 700 750 800 850
Figure 3 - Parameter error percentage between results derived from simulation and power plant data
(natural gas and sea level ambient)
Para
met
er E
rror (
%)
CDT CDP TET Power0.0
0.4
0.8
1.2
1.6
2.0
MAPNA Turbine • October 201514
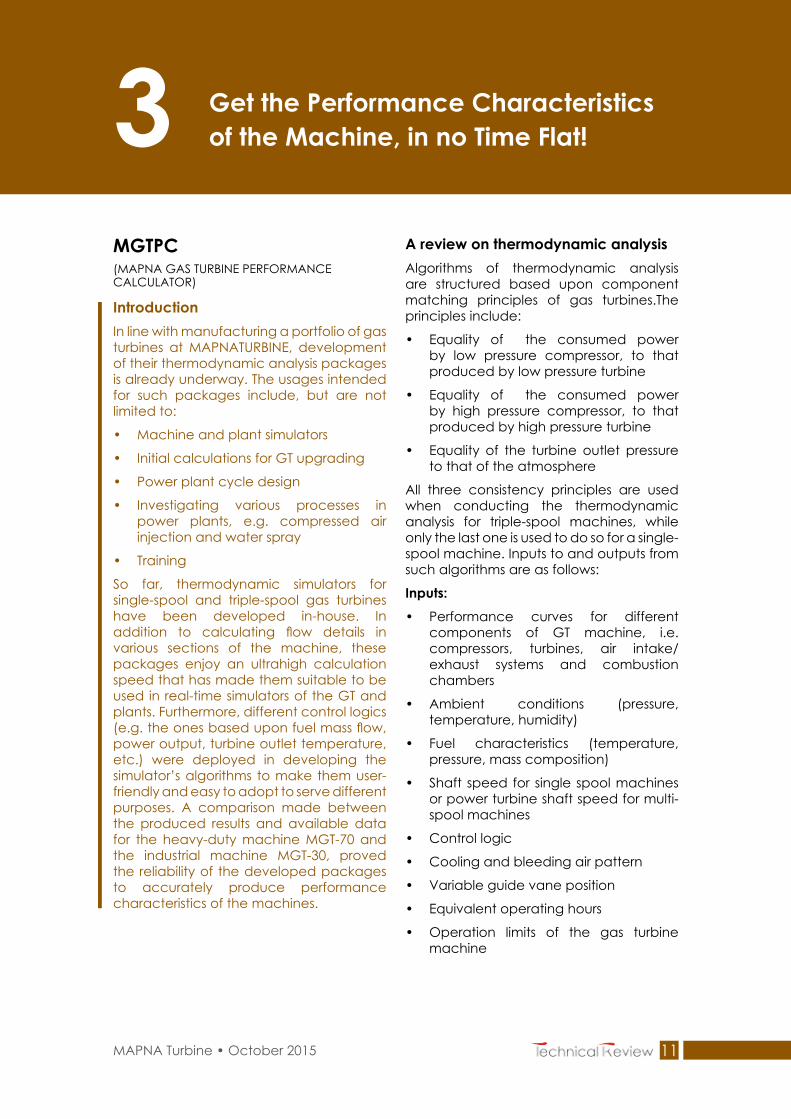
SimulatorverificationbyMGT-30Performance characteristics of MGT-30 triple-spool industrial machine at standard conditions are as follows:
• Output power: 25.7 MW
• Efficiency: 35.2 %
• Pressure ratio: 22
• Mass flow: 88.5 kg/s
In figure 4, schematic view of this machine including cooling and bled air flows is shown. This machine makes use of inlet guide vanes (IGV) and two rows of variable guide vanes (VGV) to control the machine during start-up. There are furthermore, two bled air flows from low pressure and high pressure compressors consumed in auxiliary equipment and start-up process control.
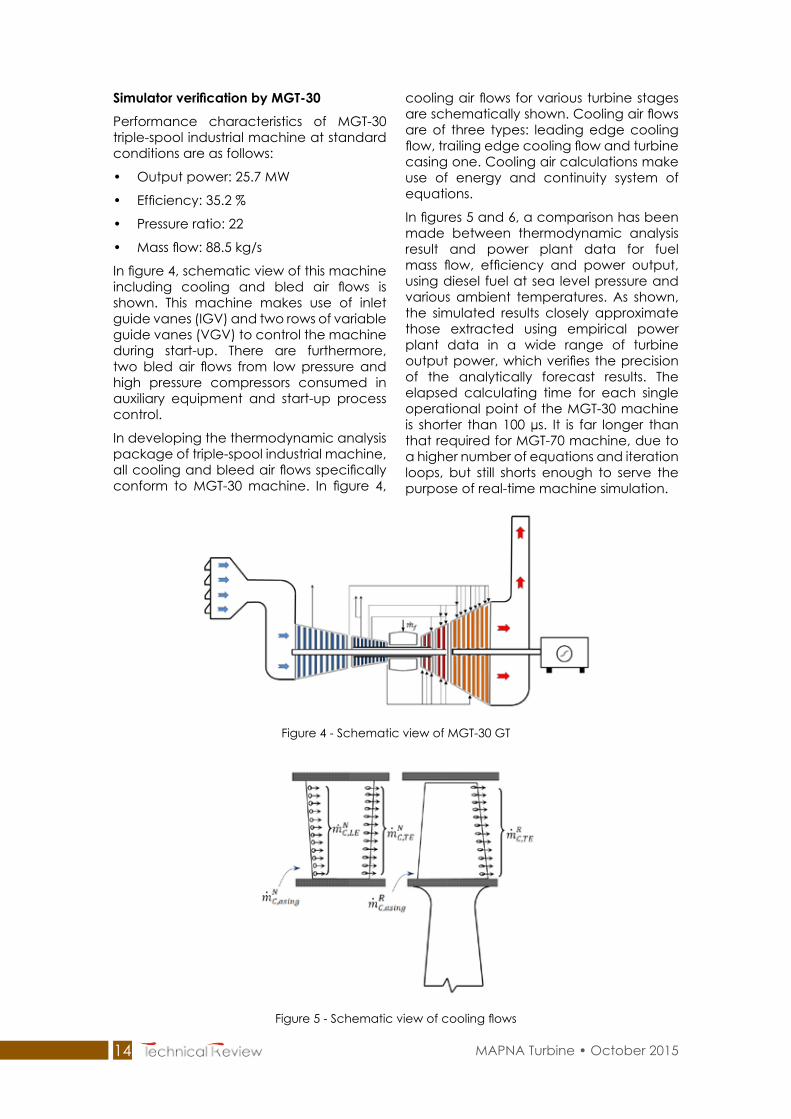
In developing the thermodynamic analysis package of triple-spool industrial machine, all cooling and bleed air flows specifically conform to MGT-30 machine. In figure 4,
cooling air flows for various turbine stages are schematically shown. Cooling air flows are of three types: leading edge cooling flow, trailing edge cooling flow and turbine casing one. Cooling air calculations make use of energy and continuity system of equations.
In figures 5 and 6, a comparison has been made between thermodynamic analysis result and power plant data for fuel mass flow, efficiency and power output, using diesel fuel at sea level pressure and various ambient temperatures. As shown, the simulated results closely approximate those extracted using empirical power plant data in a wide range of turbine output power, which verifies the precision of the analytically forecast results. The elapsed calculating time for each single operational point of the MGT-30 machine is shorter than 100 µs. It is far longer than that required for MGT-70 machine, due to a higher number of equations and iteration loops, but still shorts enough to serve the purpose of real-time machine simulation.
Figure 4 - Schematic view of MGT-30 GT
Figure 5 - Schematic view of cooling flows

MAPNA Turbine • October 2015 15
Figure 6 - Fuel consumption versus power output in MGT-30 machine(Diesel fuel, sea level pressure)
Power (MW)
Tatm=15(C),CodeTatm=15(C),Test DataTatm=-30(C),CodeTatm=-30(C),Test DataTatm=50(C),CodeTatm=50(C),Test Data
Mf (
kg/h
r)
2000
3000
4000
5000
6000
7000
302826242220181614121086
Figure 7 - Efficiency versus power output in MGT-30 machine(Diesel fuel, sea level pressure)
Power (MW)
Tatm=15(C),CodeTatm=15(C),Test DataTatm=-30(C),CodeTatm=-30(C),Test DataTatm=50(C),CodeTatm=50(C),Test Data
η (%
)
40
35
30
25
20
15
1030272421181512963
ConclusionIn this essay, thermodynamic simulators developed for single-spool and multi-spool gas turbines were presented and the produced results were reported for the heavy-duty MGT-70 and industrial MGT-30 machines. It was also shown that short elapsed time for calculation and high precision in producing performance characteristics have made them suitable to be used as core computing module of real-time simulators in relevant power plants. Air and fuel compositions were used in the relevant calculations and all the cooling and bleed air flows were taken into account. Among other features of the developed thermodynamic analysis package, the ability to deal with different control logics to improve user friendliness, and incorporating gas turbine life cycle degradation and operational constraints were pointed out in the essay.

MAPNA Turbine • October 201516
MAPNARealTimeGasTurbine4 SimulatorMGTS-30.1
introduction MGTS-30.1 is a product of MAPNA Turbine Company that is capable to simulate MGT-30 machine in thermal power plants. This simulator is a strong tool for monitoring a wide range of data and also for data acquisition as well as data storage. High accuracy models have been used to simulate the turbine itself and its auxiliary systems. Turbine governor system and automatic control system (ACS) are designed in an environment which enables the operator to follow the turbine logic system in start-up and normal operation conditions online. Plant startup would cover both a cold startup and hot restarts on the unit. Shutdown training would cover all types of unit shutdowns including; partial unit shutdowns, unit trip conditions.
Having a simulator is deemed to be essential to serve several reasons including but not limited to the following:
1. It enables the companies that are active
in power plant projects to test the turbine new logic and see the results before implementing it on turbine governor or ACS system. This would increase the reliability and prevents undesirable costs resulting from practical trial and error process.
2. As a valuable educational tool, it can help turbine experts have a better understanding of the turbine logic and use it for fault diagnosis purposes.
3. It could be used to train the turbine operators in an interactive virtual environment that closely ap-proximates the real conditions and can serve to improve the required skills to make the best decisions responsively enough at the times of need.
4. Enables simulating the extremely dangerous operating conditions, even those which might take place few and far between during the turbine life cycle and get an idea of what turbine response would be like in those conditions.
MAPNA Turbine • October 2015 17
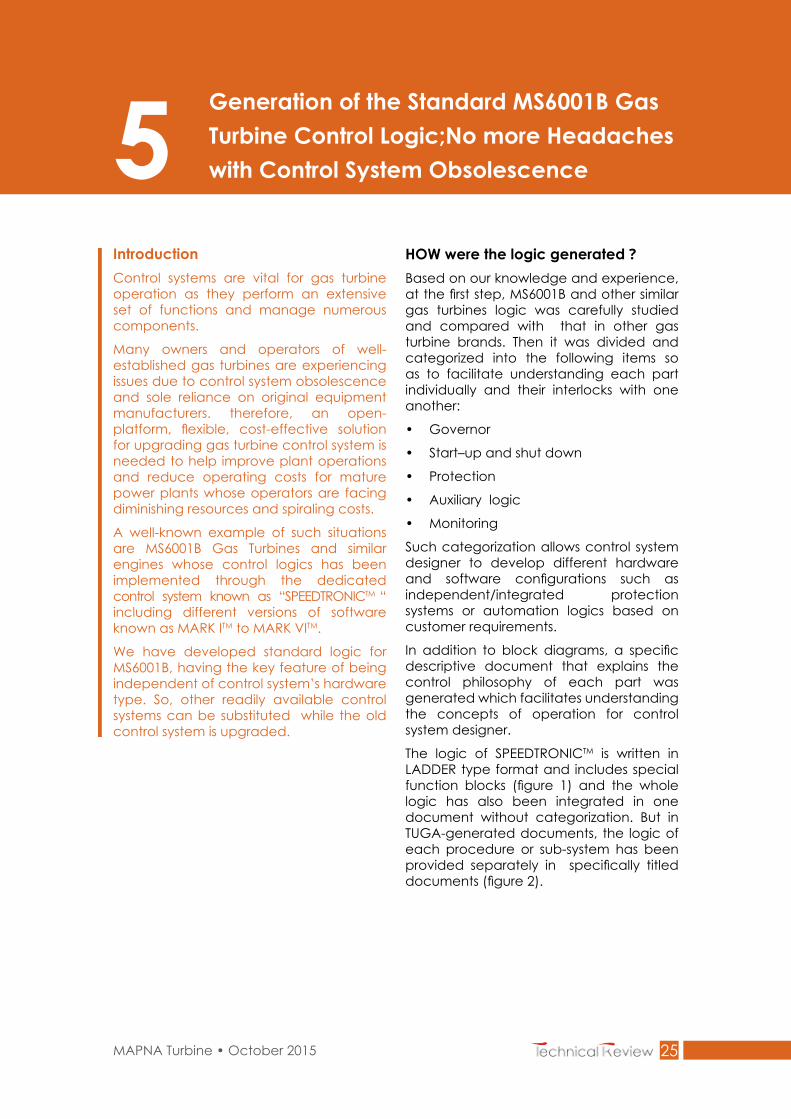
Graphical software For monitoring, data storage, and data acquisition, WINCCTM software has been used. Graphical features in WINCCTM have
been designed to accurately duplicate the HMI system deployed in real-world plants. Figure 2 shows HMI overview.
Figure 1 - Overview of simulator interactions
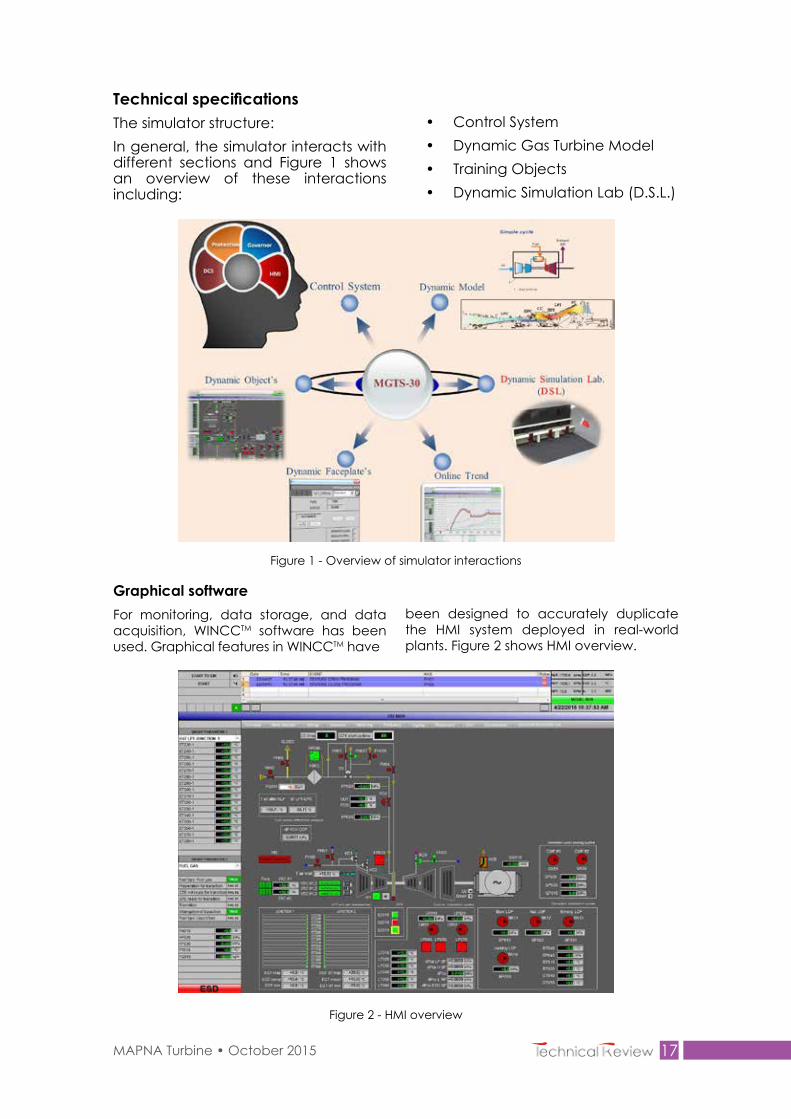
TechnicalspecificationsThe simulator structure:In general, the simulator interacts with different sections and Figure 1 shows an overview of these interactions including:
• Control System • Dynamic Gas Turbine Model • Training Objects • Dynamic Simulation Lab (D.S.L.)
Figure 2 - HMI overview

MAPNA Turbine • October 201518
aGs logicThe Governor Logic is designed based on MGT-30 Control philosophy. The main structure of the governor and the interlock
between different controllers and also received signals form ACS are presented in Figure 4.
Figure 4 - Main Governor Structure
Figure 3 - Implemented ACS Logic
Hardware package This simulator can operate on PCs and portable computers. No specific hardware is necessary.
aCs logic:In order to implement the ACS LOGIC, S7TM software package has been used that enables the user to have access to the logic at the same time as they operate the simulator, just like a real power plant system. Implemented ACS Logic in the Simulator Software is shown in Figure 3.

MAPNA Turbine • October 2015 19
Figure 5 - Simulator overview
Figure 6 - MGTS-30.1 interactions with MGTPC
running time This simulator is capable of running in “real -time” mode. For instance, the time necessary to start a gas turbine up in a real
power plant is equal to that in MGTS-30.1 simulator.
Modeling MGTS-30.1 uses MGTPC code (MAPNA GAS TURBINE PERFORMANCE CALCULATOR) as the processor for modelling the thermodynamic parameters of gas turbines which is able to calculate core
engine characteristics accurately. The code is explained in the third article of this Technical Review. MGTS-30.1 interactions with the MGTPC are illustrated in Figure 6.

MAPNA Turbine • October 201520
Validation and evaluation of simulator functions:MGTS-30.1 is capable of simulating gas turbine behavior in a wide range of operating conditions:
loading, unloading, startup and shut down, in different environmental conditions.
Functional validation test of the governor for different modes of operation and different status of operation was successfully performed. These modes and conditions are shown in Figures 7 and 8 respectively.
Figure 7 - Control System Modes
Figure 8 - Different Control System status

MAPNA Turbine • October 2015 21
Figure 11 - Comparison of measured and simulated responses during load rejection
Figure 10 - Comparison of measured and simulated responses during unloading
Figure 9 - Comparison of measured and simulated responses during loading
Dynamic results of the MGTS-30.1 were validated with real data from MAPNA Qeshm Power & Desalination Plant. The following figures show conformity of the
simulated results with the measured data from the Plant during loading, unloading and load rejection.


MAPNA Turbine • October 201524
summary of advantages:Online monitoring of the turbine operating point shown on turbine characteristic curve
Access to the turbine ACS logic
Ability to change, test, and download the turbine logic
Ability to change parameters of the turbine governor
Simulation of gas turbine operation in real time and customized time step modes
Alarm Logging system
Event Logging system
Ability to plot, log, and print all analog signals
Possibility to test artificial errors in all instrumentation and devices
Responding to 16 users simultaneously for each server
Ability to connect several servers (e.g. combined cycle simulation)
Ability to save and re-use all signals without any restriction
Ability to set initial conditions
Customizing ability to meet customer needs
Ability to connect to online monitoring system in D.S.L.
Possibility of connection to control system hardware (used for control system hardware/software tests)
Possibility of Connection to test stand of auxiliary systems
MAPNA Turbine • October 2015 25
GenerationoftheStandardMS6001BGas TurbineControlLogic;NomoreHeadaches5 withControlSystemObsolescence
introductionControl systems are vital for gas turbine operation as they perform an extensive set of functions and manage numerous components.
Many owners and operators of well-established gas turbines are experiencing issues due to control system obsolescence and sole reliance on original equipment manufacturers. therefore, an open-platform, flexible, cost-effective solution for upgrading gas turbine control system is needed to help improve plant operations and reduce operating costs for mature power plants whose operators are facing diminishing resources and spiraling costs.
A well-known example of such situations are MS6001B Gas Turbines and similar engines whose control logics has been implemented through the dedicated control system known as “SPEEDTRONICTM “ including different versions of software known as MARK ITM to MARK VITM.
We have developed standard logic for MS6001B, having the key feature of being independent of control system’s hardware type. So, other readily available control systems can be substituted while the old control system is upgraded.
HoW were the logic generated ?Based on our knowledge and experience, at the first step, MS6001B and other similar gas turbines logic was carefully studied and compared with that in other gas turbine brands. Then it was divided and categorized into the following items so as to facilitate understanding each part individually and their interlocks with one another:
• Governor
• Start–up and shut down
• Protection
• Auxiliary logic
• Monitoring
Such categorization allows control system designer to develop different hardware and software configurations such as independent/integrated protection systems or automation logics based on customer requirements.
In addition to block diagrams, a specific descriptive document that explains the control philosophy of each part was generated which facilitates understanding the concepts of operation for control system designer.
The logic of SPEEDTRONICTM is written in LADDER type format and includes special function blocks (figure 1) and the whole logic has also been integrated in one document without categorization. But in TUGA-generated documents, the logic of each procedure or sub-system has been provided separately in specifically titled documents (figure 2).

MAPNA Turbine • October 201526
Figure 1 - Original speed set point
Figure 2 - Developed speed set point
SignificantfeatureIn contrary to some common governors, in MS6001B original control system, the output of governor as an indication of fuel flow demand is connected to a specific hardware card known as TCQA, then position control and command to the servo valve is performed in this hardware. But due to our approach which is hardware independent, this controller has been converted to a software-based concept incorporated in the governor logic (figure 4).
The great achievement gained by these control documents is that control systems could be developed on any hardware with abovementioned upgrades for these gas turbines instead of replacing the control system with another SPEEDTRONICTM that may cost much more than available control system hardware.

MAPNA Turbine • October 2015 27
Figure 3 -Original SRV hardware controller TCQA
Figure 4 - Developed SRV software controller
ConclusionWe have developed a basis for control system modernization of MS6001B gas turbine with available control system hardware according to customer requirements. Also design and development of a hardware control system based on PCS7TM is under progress based on this package in our sister company MECO. The developed control system will be used in retrofit projects for old gas turbines.
MAPNA Turbine • October 201528
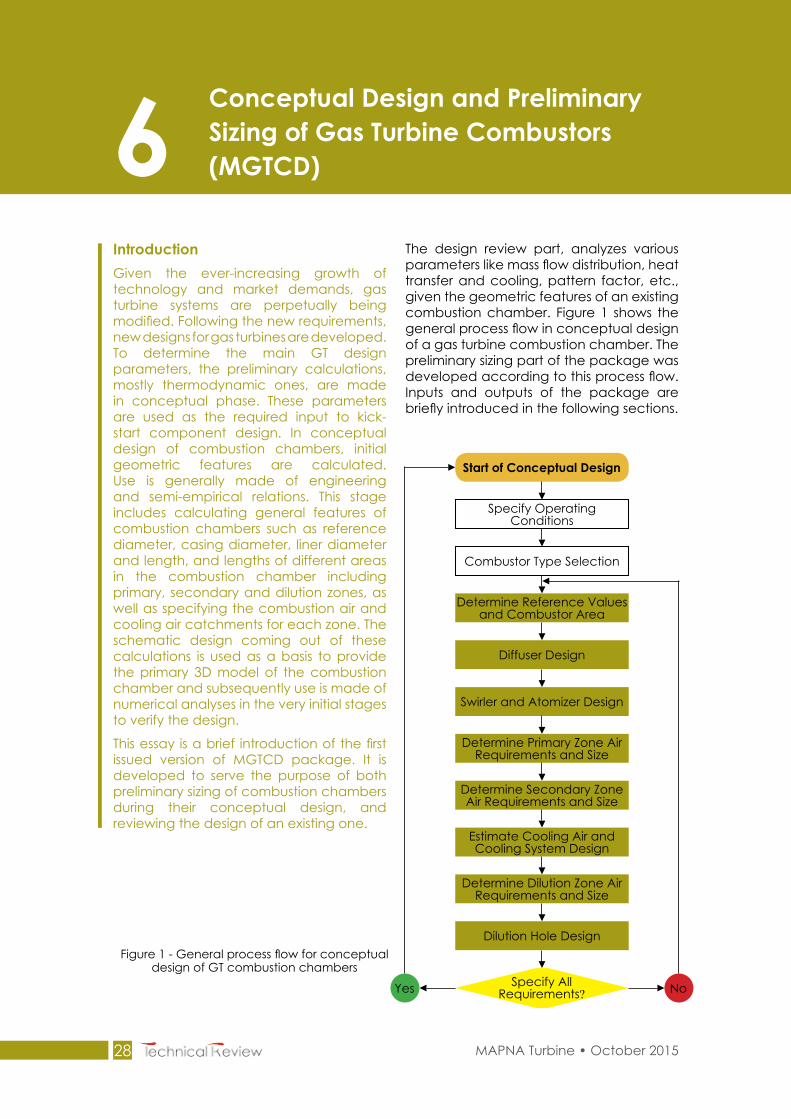
Figure 1 - General process flow for conceptual design of GT combustion chambers
Conceptual design and Preliminary SizingofGasTurbineCombustors6 (MGtCd)
introductionGiven the ever-increasing growth of technology and market demands, gas turbine systems are perpetually being modified. Following the new requirements, new designs for gas turbines are developed. To determine the main GT design parameters, the preliminary calculations, mostly thermodynamic ones, are made in conceptual phase. These parameters are used as the required input to kick-start component design. In conceptual design of combustion chambers, initial geometric features are calculated. Use is generally made of engineering and semi-empirical relations. This stage includes calculating general features of combustion chambers such as reference diameter, casing diameter, liner diameter and length, and lengths of different areas in the combustion chamber including primary, secondary and dilution zones, as well as specifying the combustion air and cooling air catchments for each zone. The schematic design coming out of these calculations is used as a basis to provide the primary 3D model of the combustion chamber and subsequently use is made of numerical analyses in the very initial stages to verify the design.
This essay is a brief introduction of the first issued version of MGTCD package. It is developed to serve the purpose of both preliminary sizing of combustion chambers during their conceptual design, and reviewing the design of an existing one.
The design review part, analyzes various parameters like mass flow distribution, heat transfer and cooling, pattern factor, etc., given the geometric features of an existing combustion chamber. Figure 1 shows the general process flow in conceptual design of a gas turbine combustion chamber. The preliminary sizing part of the package was developed according to this process flow. Inputs and outputs of the package are briefly introduced in the following sections.
start of Conceptual design
Specify Operating Conditions
Combustor Type Selection
Determine Reference Values and Combustor Area
Diffuser Design
Swirler and Atomizer Design
Determine Primary Zone Air Requirements and Size
Determine Secondary Zone Air Requirements and Size
Estimate Cooling Air and Cooling System Design
Determine Dilution Zone Air Requirements and Size
Dilution Hole Design
Specify All Requirements? NoYes

MAPNA Turbine • October 2015 29
inputs Inputs to the package, shown in figure 2, include the following:
• Choice of design algorithm
• Choice of the combustion chamber type
• GT thermodynamic cycle parameters
• Fuel composition
• Deign constraints e.g. allowable pressure loss …
Figure 2 - Input window in the developed package
Figure 3 - Demonstration of reference diameter and liner diameter invarious types of combustion chambers
Combustionchambersizingandflowpartitioning One preliminary item at conceptual design stage of a combustion chamber is calculation of the reference diameter
(Dref). Figure 3 depicts the way reference diameter and liner diameter are defined in various types of combustion chambers.
Can-annular type Annular type Can type

MAPNA Turbine • October 201530
Figure 4 -Showing general dimensions of a combustion chamber
Calculation of geometric dimensions is carried out through 6 methods: Aerodynamic, Chemical, Bragg, Odgers-Carrier, Walsh, and Mattingly, and the user receives the geometric information in a table. It is subsequently possible to choose
the best suited option among different scenarios through the package manual. In figure 4 the window giving general dimensions of a combustion chamber is shown.
Walsh and Mattingly methods make use of the calculated dimensions, fuel specifications and design constraints to calculate flow partitioning (cooling mass flow percentage and flow in different combustion zones). In figures 5 through 7, windows showing the lengths of different
combustion zones: Primary, Secondary and Dilution, and relevant flow partitioning are depicted. If the user opts for DLE (Dilute Low Emission) at this stage, provisions are built in the package to enable calculations to be made specific to low emission combustion chambers.
Figure 5 -Primary zone general sizing and characteristics

MAPNA Turbine • October 2015 31
Figure 6 -Secondary zone general sizing and characteristics
Figure 7 -Dilution zone general sizing and characteristics
preliminary design of diffuserAfter calculating reference diameter, flame tube diameter, diameter of annular section and air flow partitioning, other geometrical features of combustion chamber are calculated. One item of intrest in combustion chamber design is diffuser.
Diffuser is intended to decrease compressor outlet velocity enough to adjust the pressure loss occurring in the combustion chamber. Two different types of diffusers used in the products of MAPNATURBINE are shown in figure 8.

MAPNA Turbine • October 201532
Figure 8 -Two types of diffusers: (a) MGT-70, (b) MGT-30
Compared with common diffusers there are a few additional geometric parameters to be considered in the ones used in combustion chambers. These features impact diffuser performance. The additional features include liner’s shape and size and its location relative to the
diffuser outlet. In the conceptual design, however, liner-diffuser interactions are normally disregarded and general features of the combustion chamber diffusers are calculated based upon empirical relations (figure. 9).
Figure 9 -Diffuser shape and size and flow data in its inlet and outlet
swirler designAnother component to be considered during combustion chamber design, is its swirler. The role is creating a re-swirling
zone for the flow using vortex breakdown mechanism. In general, swirlers are either axial or radial, shown in the figure, below.

MAPNA Turbine • October 2015 33
Figure 10 - Axial and diagonal swirler (MGT-70)
Figure 11 -Swirler characteristics, atomizer and recirculation zone
In MGTCD package general characteristics of swirler, including swirler flow, atomizer and recirculation zone are produced.
Figure 11 shows the swirler design dialogue window in the package.
design reviewUsing 1D approach, MGTCD can be deployed to analyze different types of combustion chamber. Design review is implemented through calculation and assessment implemented on a few different parameters in a combustion chamber including the following:
• Combustion efficiency under different loads
• Average outlet temperature
• Pattern factor
• Wall temperature and wall heat flux
• Air intake in different combustion zones
• Identifying flow characteristics and mixing mechanism in the burner
• Specifying burner performance conditions under various loads
• Pressure loss in each zone
• Identifying the transitional regime in the combustion chamber during unsteady fluctuations in the inlet air

MAPNA Turbine • October 201534
Figure 12 -The initial window of the design review using 1D approach
This program includes Flowsplits, Combustion, Element, Heat Transfer and Efficiency functions. The purpose served by
these functions and the intended actions are demonstrated in the following table:
Table 1- Description of design review functions
Function name Purposes and actions
Flowsplits Specifying mass distribution along the liner using empirical and analytical relations
Combustion Determining the combustion efficiency taking inlet air characteristics and combustion conditions into account
Element Identifying the characteristics of each node to enable heat transfer calculations
HeatTransfer Calculating different heat transfer mechanisms in the combustion chamber: Conduction, Convection and Radiation
EfficiencyCalculating the thermal efficiency of combustion chamber in different sections (intended to determine the fluid temperature in different areas)

MAPNA Turbine • October 2015 35
Figure 14 -The window for entering general inputs in 1-D calculations
Figure 13 -General 1-D flow process used in MGTCD package
specify inputs
End
Determine Geometry for Flow and Heat Transfer
Calculation
Determine Thermophysical Properties
Flow Split Calculation
Combustion Calculation
Heat Transfer Calculation
Converged?No
Yes
The window containing general inputs is shown in figure 14.
The general 1-D process flow used in developing MGTCD package is shown in figure 13.

MAPNA Turbine • October 201536
This 1-D program is able to predict flow fields inside annular, can-annular, tubular and silo-type combustion chambers. Geometrical parameters of combustion chamber and number of holes on liners can be changed in the package.
Heat transfer analysis is enabled in the package, taking into account different mechanisms: conduction, convection, radiation and film cooling. These features can be used to identify optimized parameters and number of liner holes in different combustion chambers.
ConclusionIn this essay, release 1 of the MGTCD package was introduced. This package can be used in conceptual design stage of various types of combustion chambers in gas turbine engines as well as in design review of a certain combustion chamber. In the conceptual design module of the package, geometrical parameters of combustion chamber are calculated and in the design review module, with a given geometry the combustion performance is assessed.


Factory: Fardis, Karaj - I.R.Iran.Post code: 31676-43594 Tel: +98 (26) 36630010 Fax: +98 (26) 36612734
HeadOffice:231 Mirdamad Ave. Tehran - I.R.Iran.P.O.Box: 15875-5643Tel: +98 (21) 22908581Fax: +98 (21) 22908654
GR031-0
© MAPNA Group 2015 The technical and other data contained in this Technical Review is provided for information only and may not apply in all cases. `