ebtjv project overview riparian planting tool brook trout habitat patch layer
TRANSCRIPT
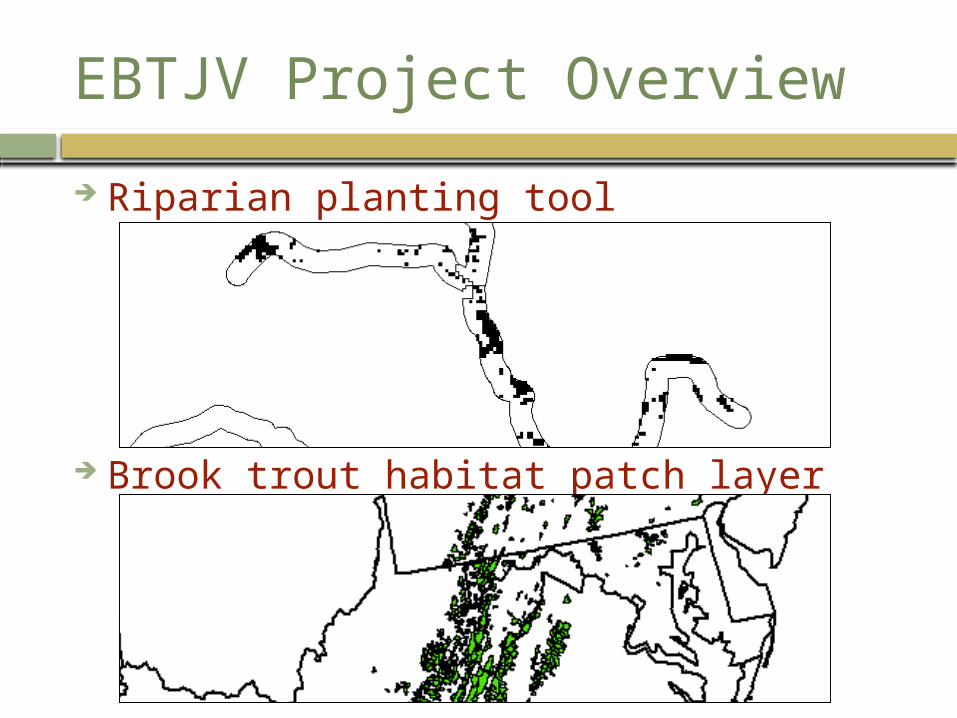
EBTJV Project Overview
Riparian planting tool
Brook trout habitat patch layer
Riparian Planting Tool
Purpose To help locate & prioritize locations where tree
plantings would be most beneficial Data
Canopy cover layer (30 M raster) Solar radiation layer (30 M raster) NHD+ Stream layer w/ 100 M buffer
End Product Web-based GIS tool
Riparian Planting Tool
Web-tool features User-specified threshold values
% Canopy cover <= 70%
% Rank of solar radiation >= 75%
User-specified spatial extent Select based on various geographic & hydrologic layers
Maryland Brook trout habitat patch
Makes ranking of solar radiation values more relevant
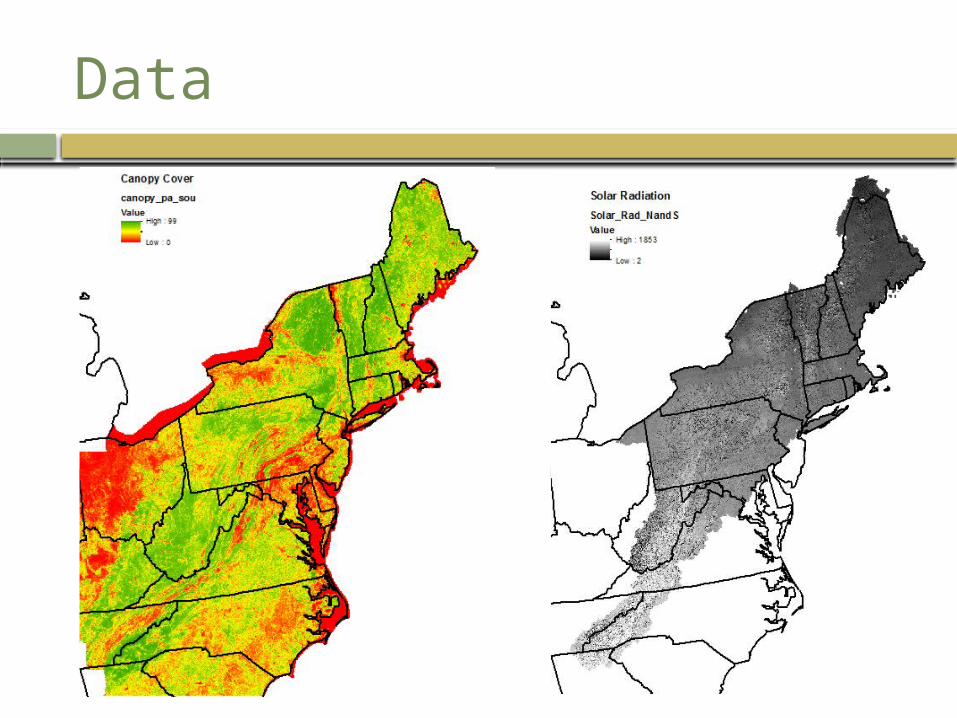
Data
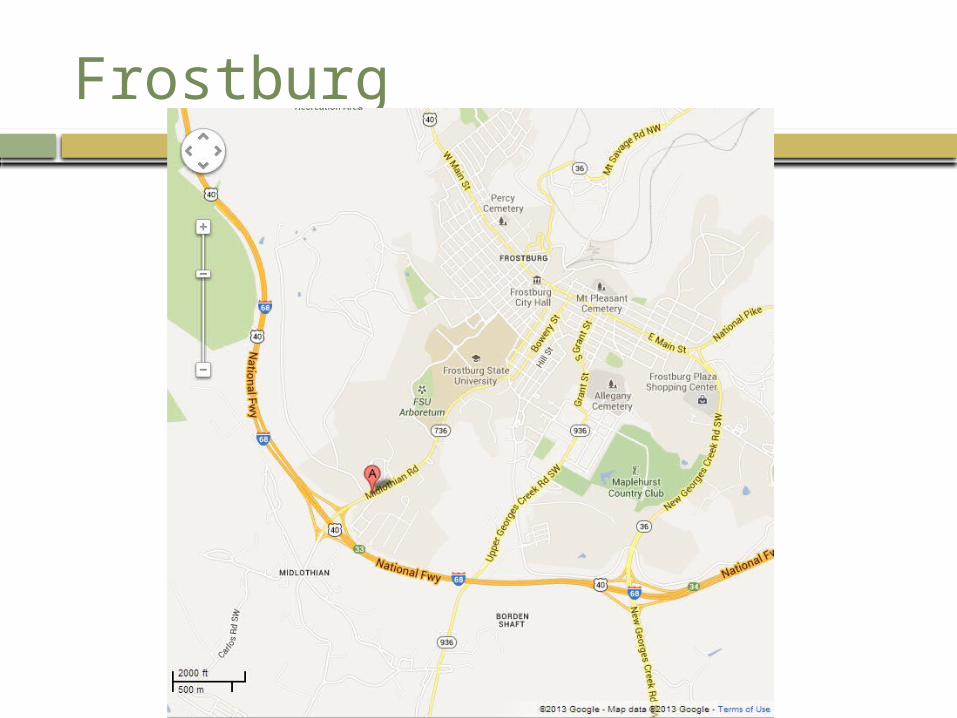
Frostburg
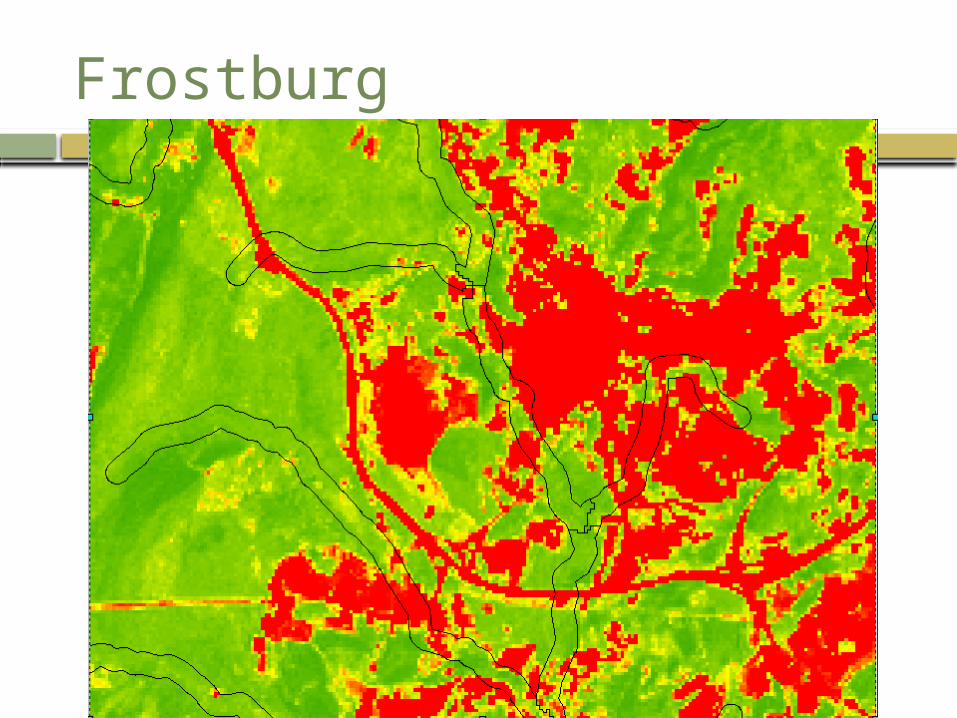
Frostburg
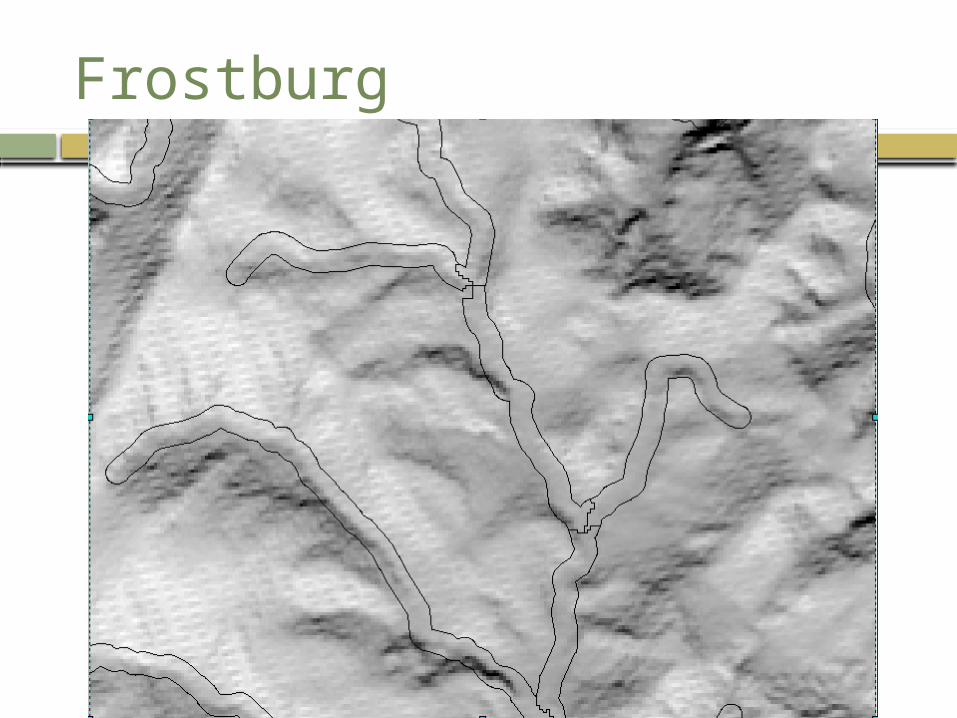
Frostburg
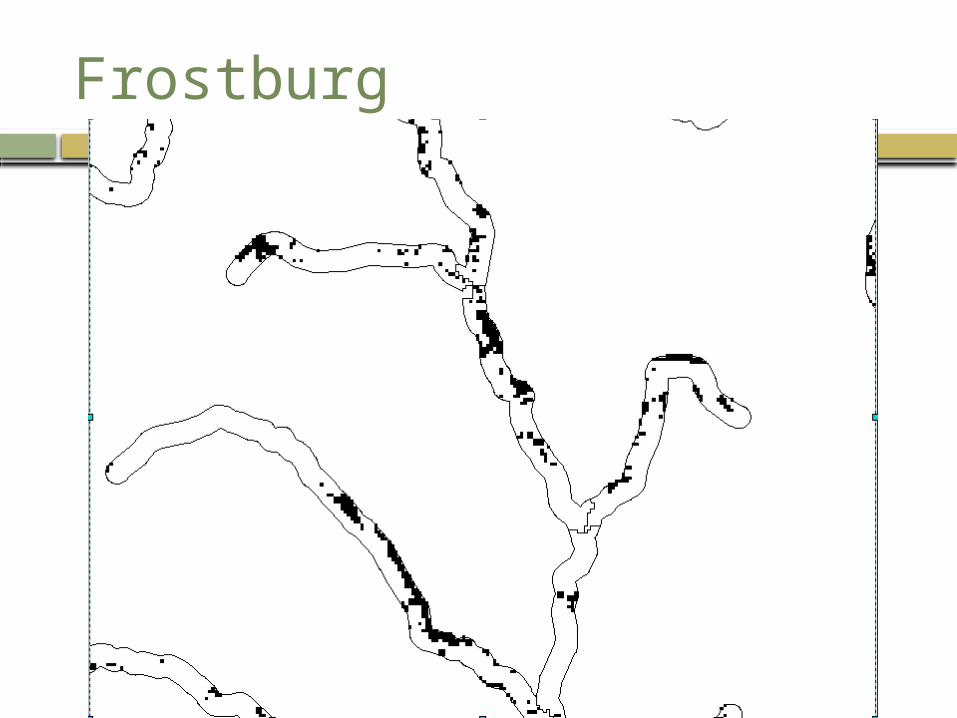
Frostburg
Riparian Planting Tool
Currently developing web-tool Will be housed on Appalachian LCC website
Suggestions for new/improved features
Habitat Patch Layer
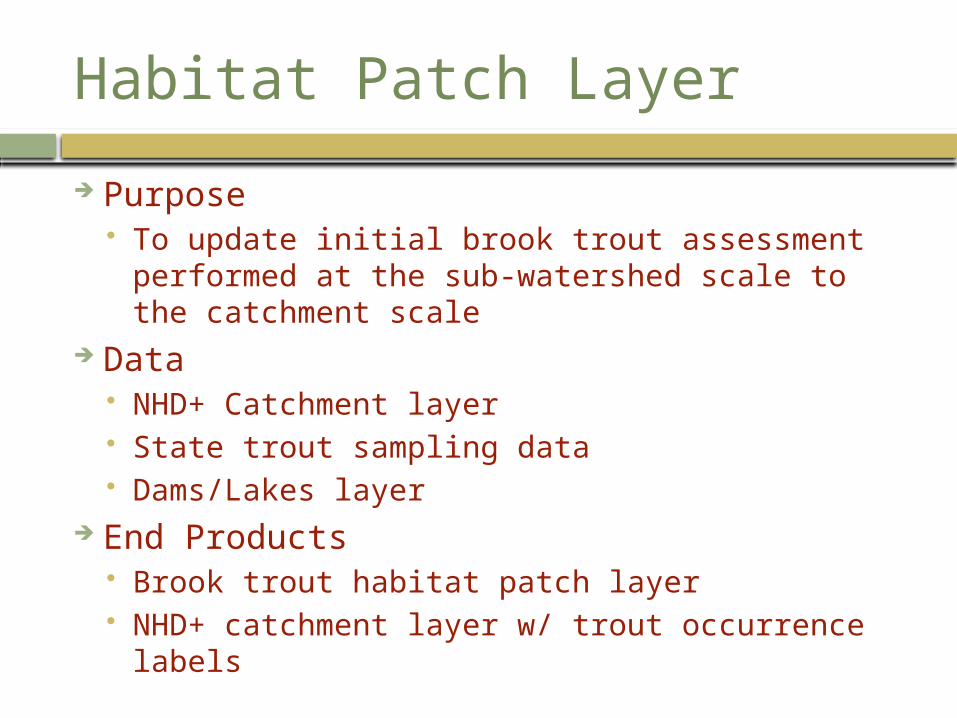
Purpose To update initial brook trout assessment performed at
the sub-watershed scale to the catchment scale Data
NHD+ Catchment layer State trout sampling data Dams/Lakes layer
End Products Brook trout habitat patch layer NHD+ catchment layer w/ trout occurrence labels
Current Patch Layer
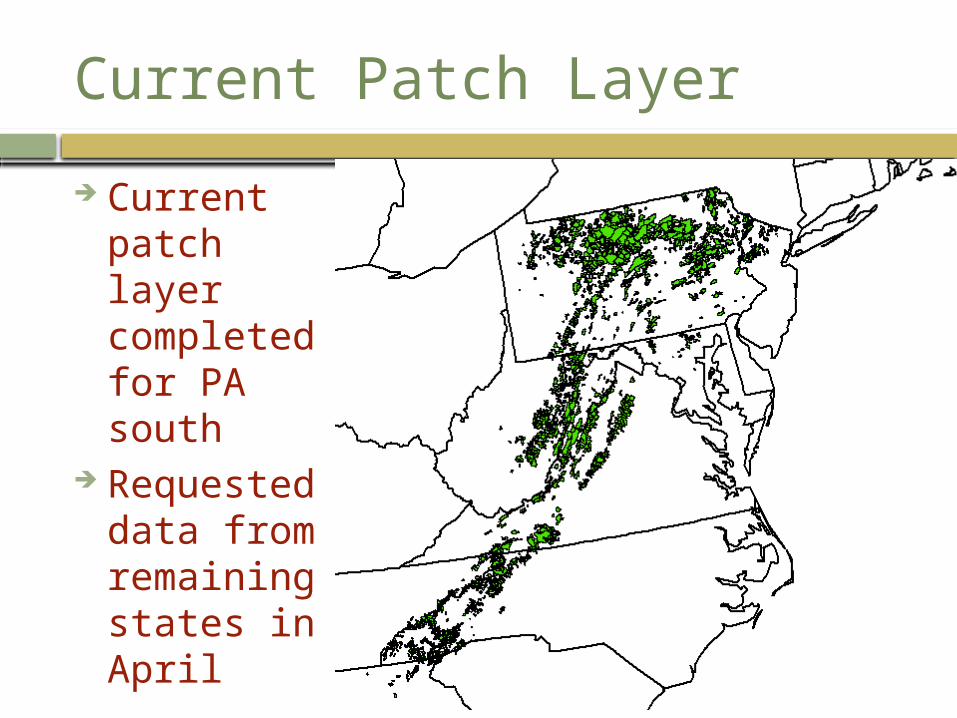
Current patch layer completed for PA south
Requested data from remaining states in April
State Data
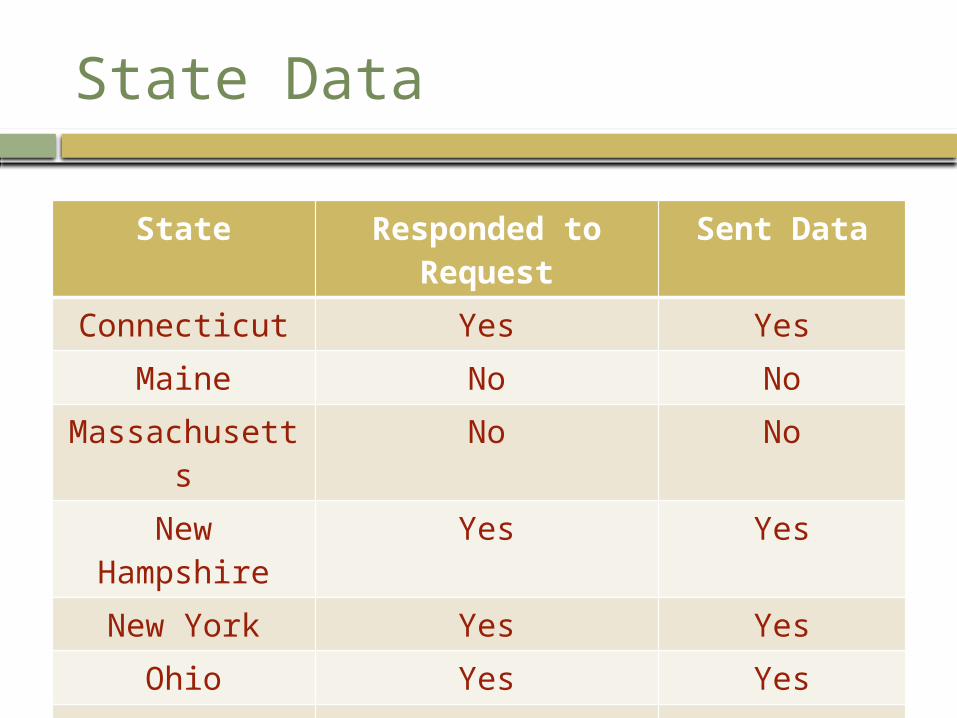
State Responded to Request Sent DataConnecticut Yes Yes
Maine No NoMassachusetts No No
New Hampshire Yes YesNew York Yes Yes
Ohio Yes YesRhode Island No No
Vermont No No
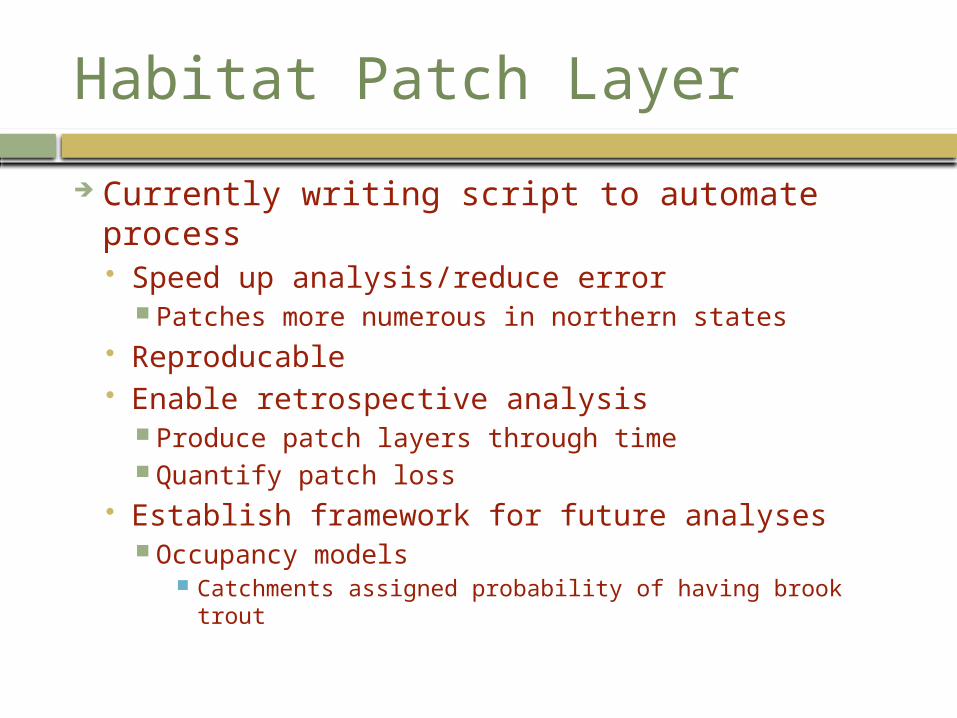
Habitat Patch Layer
Currently writing script to automate process Speed up analysis/reduce error
Patches more numerous in northern states Reproducable Enable retrospective analysis
Produce patch layers through time Quantify patch loss
Establish framework for future analyses Occupancy models
Catchments assigned probability of having brook trout
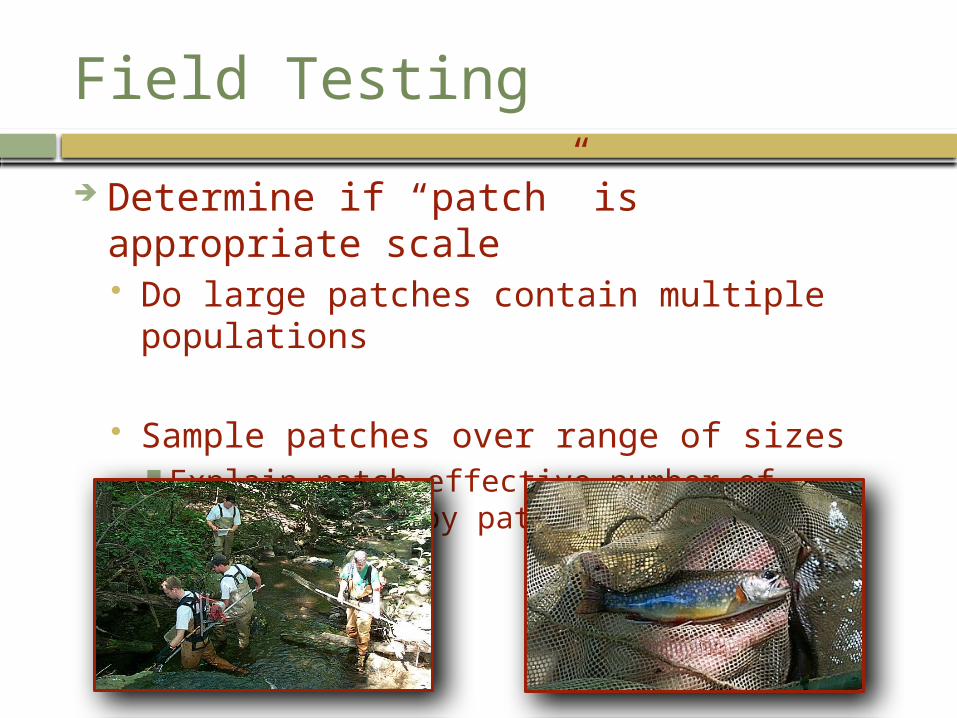
Field Testing
Determine if “patch” is appropriate scale Do large patches contain multiple populations
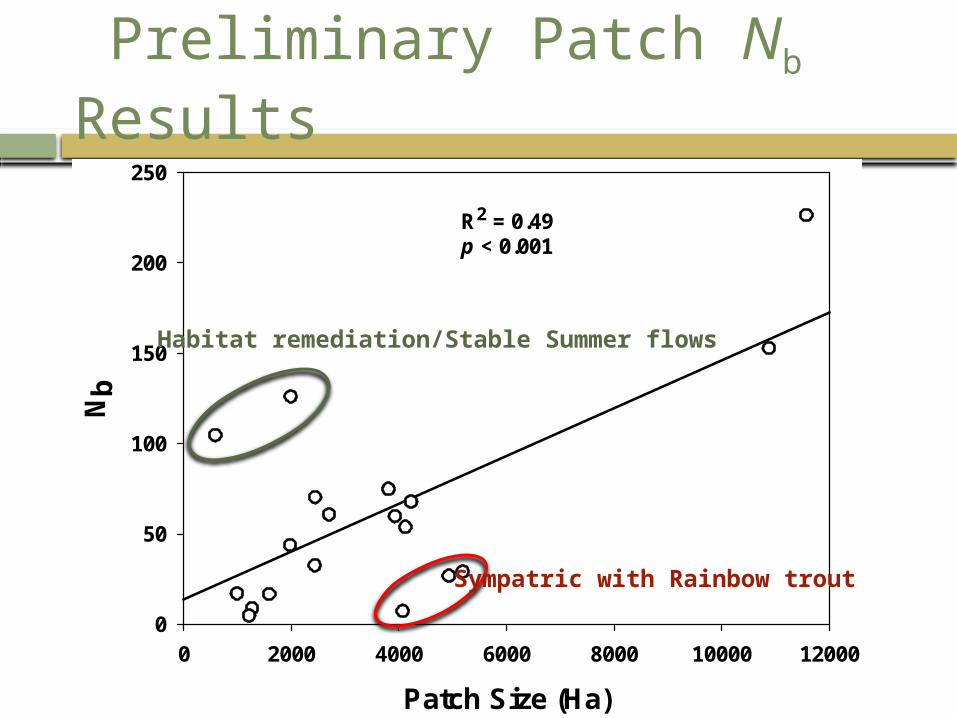
Sample patches over range of sizes Explain patch effective number of breeders (Nb) by patch
size
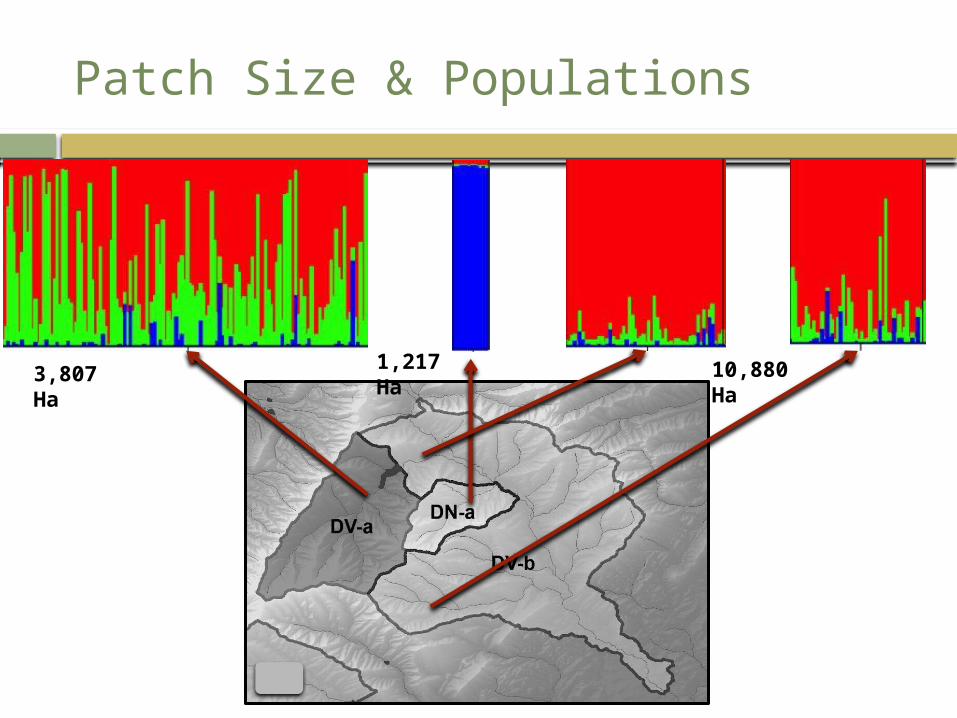
Patch Size & Populations
10,880 Ha1,217 Ha3,807 Ha
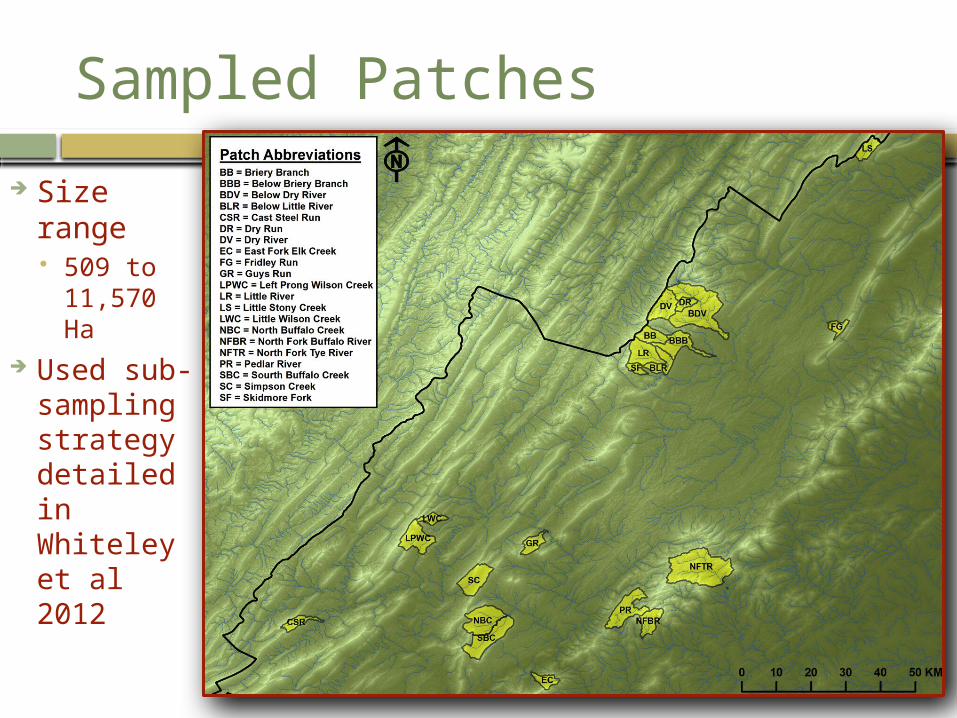
Sampled Patches
Size range 509 to
11,570 Ha
Used sub-sampling strategy detailed in Whiteley et al 2012
Patch Size (Ha)
0 2000 4000 6000 8000 10000 12000
Nb
0
50
100
150
200
250
R2 = 0.49p < 0.001
R
Preliminary Patch Nb Results
Habitat remediation/Stable Summer flows
Sympatric with Rainbow trout
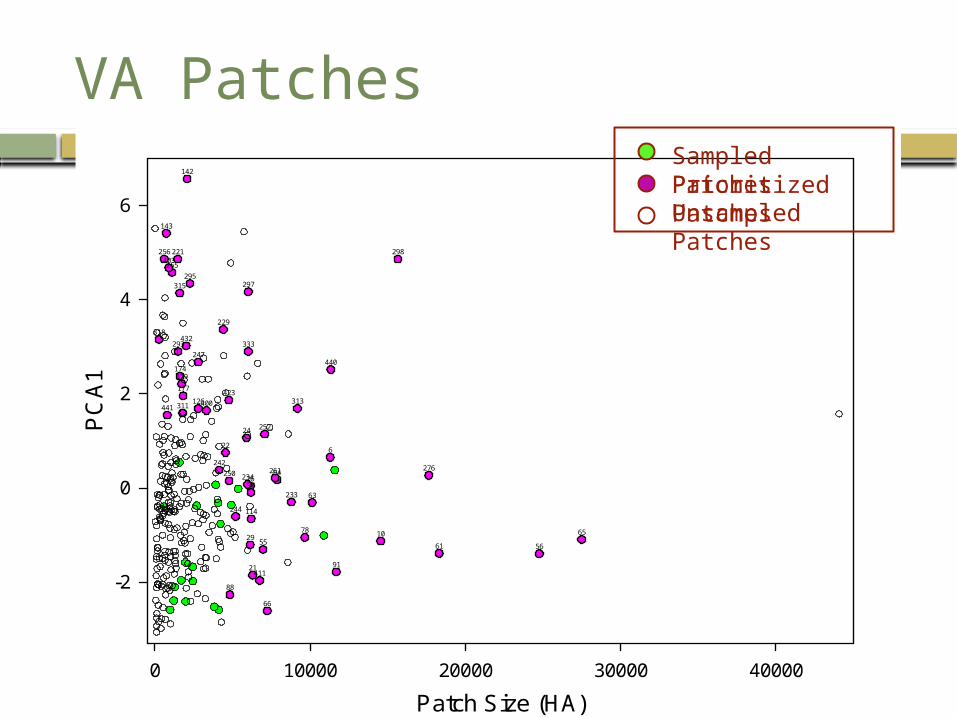
VA Patches
Patch Size (HA)
0 10000 20000 30000 40000
PC
A1
-2
0
2
4
6
6
10
21
22
24
26
2955
5661
63
64
65
66
78
88
90
91
114
126
142
143
174
177
179
221
229
233
234
242
244
247
250
252
256
261
265
276
293
295297
298
311313
315
318
333
400
403
411
423
432
440
441
Sampled PatchesPrioritized PatchesUnsampled Patches
Field Testing Conclusions
Patch proper scale for brook trout management Layer for entire brook trout range in development
Nb predictive model appears feasible Outliers have reasonable explanations Continue to add patches & develop model

Acknowledgements
Matt Burak, Maili Page & Gonzalo Mendez conducted genetic analyses
The following organizations provided financial assistance or volunteer support:
James Madison UniversityGeorge Washington and Jefferson National ForestVirginia Department of Game and Inland Fisheries U.S. Forest Service, Northern Research Station University of Massachusetts Amherst U.S. Geological Survey, Leetown Science CenterConte Anadromous Fish Research Laboratory
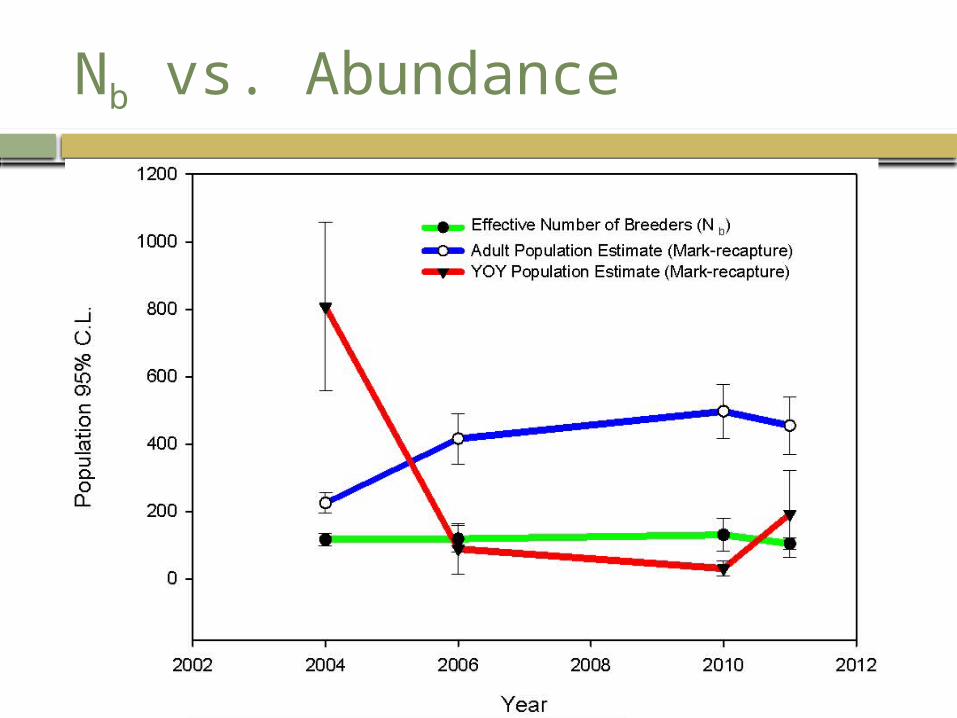
Nb vs. Abundance
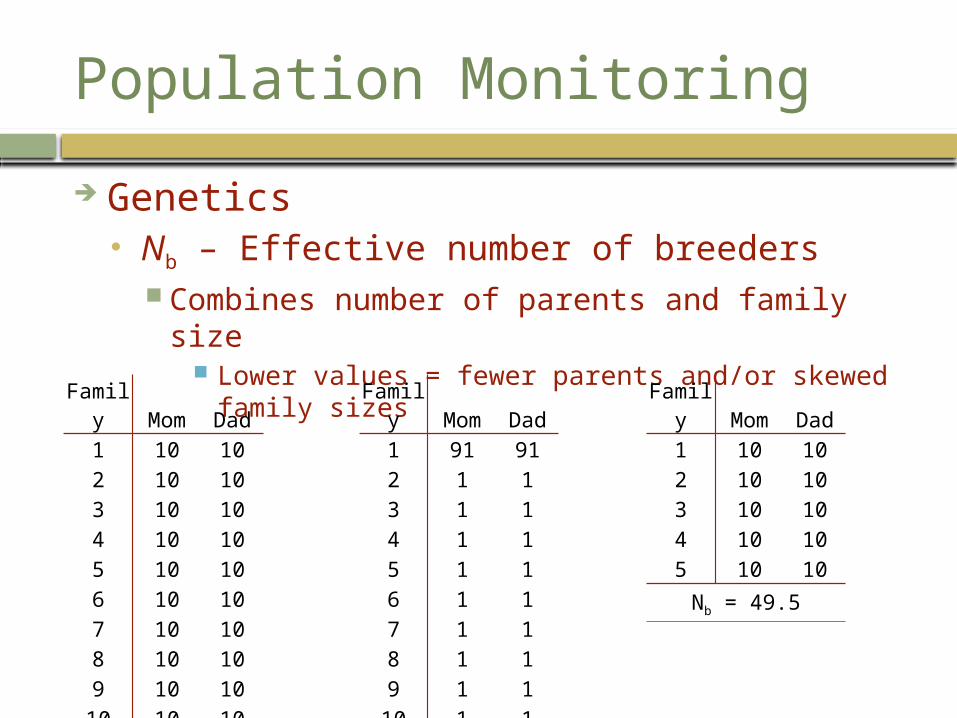
Population Monitoring
Genetics Nb – Effective number of breeders
Combines number of parents and family size Lower values = fewer parents and/or skewed family sizes
Family Mom Dad1 91 912 1 13 1 14 1 15 1 16 1 17 1 18 1 19 1 1
10 1 1Nb = 9.8
Family Mom Dad1 10 102 10 103 10 104 10 105 10 106 10 107 10 108 10 109 10 10
10 10 10Nb = 99.5
Family Mom Dad1 10 102 10 103 10 104 10 105 10 10
Nb = 49.5
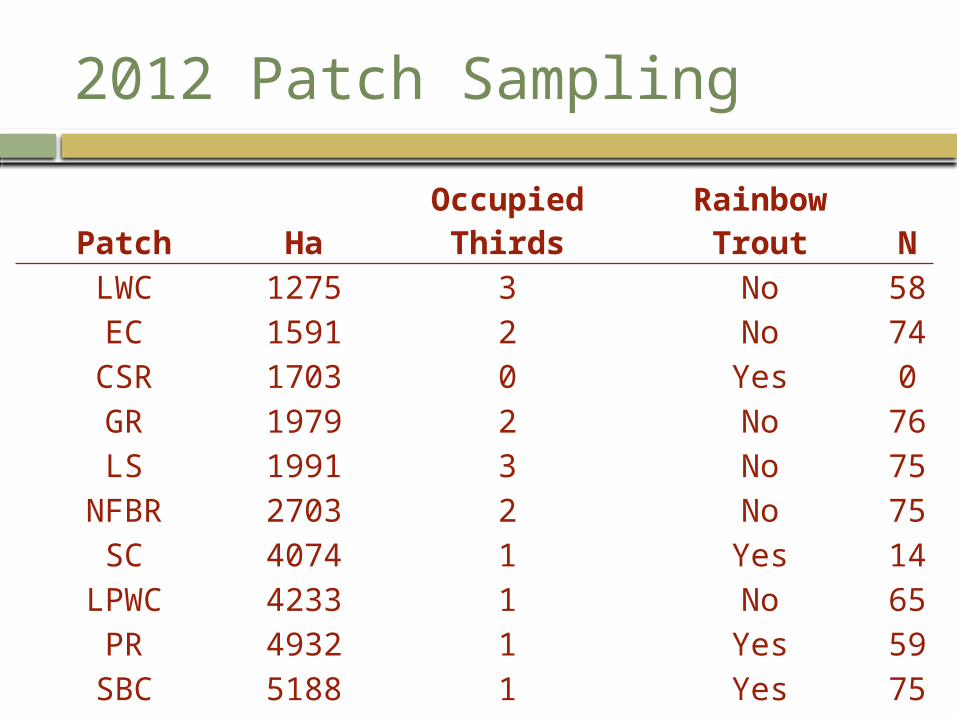
2012 Patch Sampling
Patch Ha Occupied Thirds Rainbow Trout NLWC 1275 3 No 58EC 1591 2 No 74
CSR 1703 0 Yes 0GR 1979 2 No 76LS 1991 3 No 75
NFBR 2703 2 No 75SC 4074 1 Yes 14
LPWC 4233 1 No 65PR 4932 1 Yes 59
SBC 5188 1 Yes 75NBC 5368 0 Yes 0NFTR 11577 3 No 73
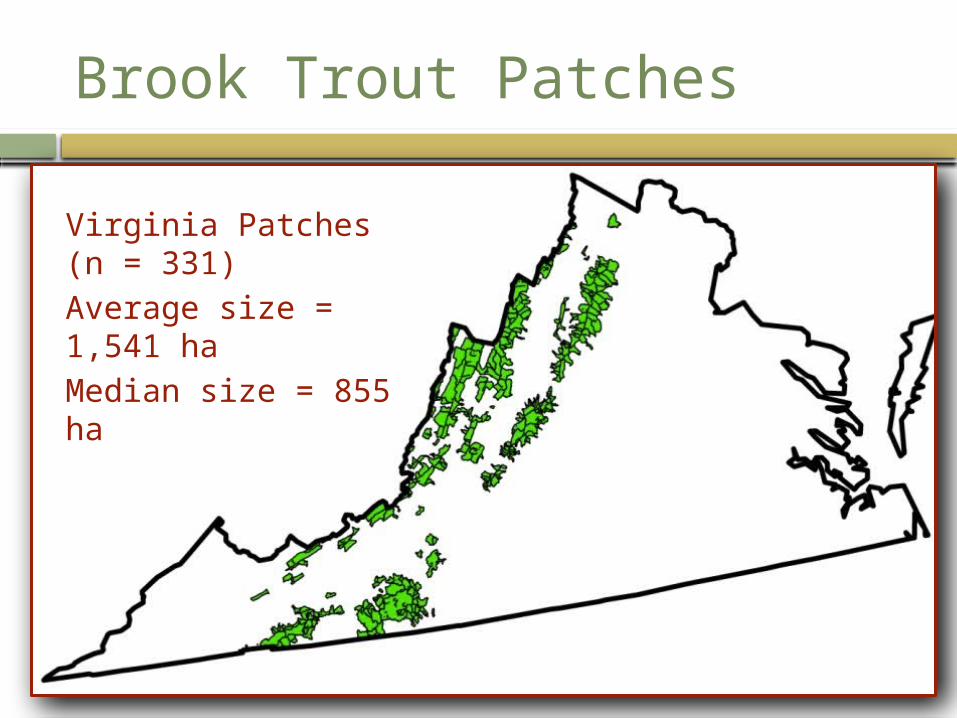
Brook Trout Patches
Virginia Patches (n = 331)Average size = 1,541 haMedian size = 855 ha
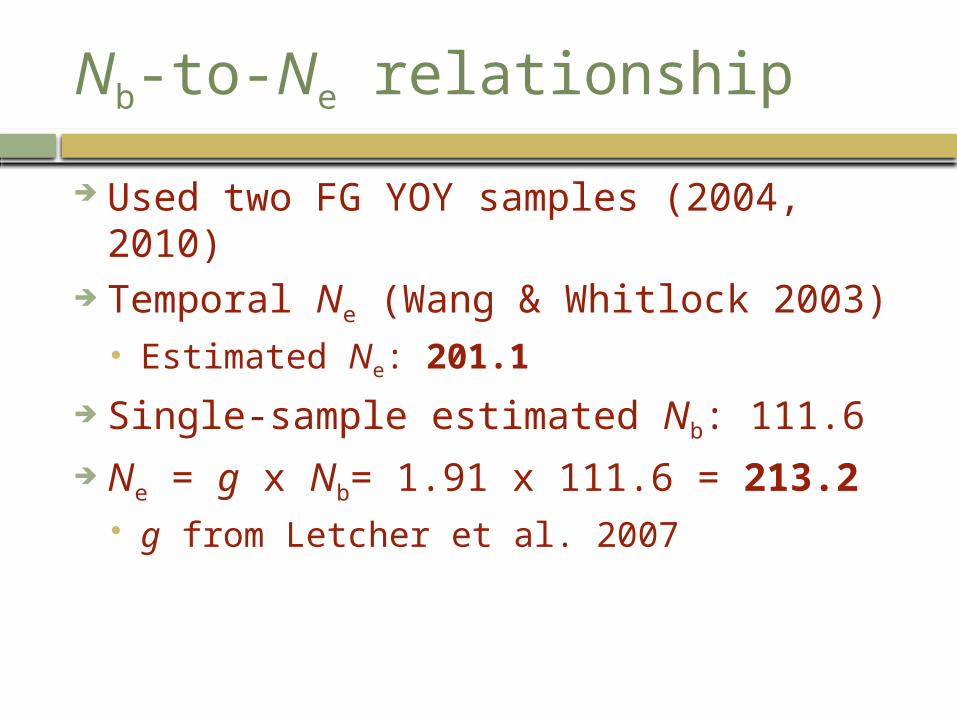
Nb-to-Ne relationship
Used two FG YOY samples (2004, 2010) Temporal Ne (Wang & Whitlock 2003)
Estimated Ne: 201.1
Single-sample estimated Nb: 111.6 Ne = g x Nb= 1.91 x 111.6 = 213.2
g from Letcher et al. 2007
Sampling Strategies for Estimating Brook Trout Effective Population SizeJason Coombs – University of Massachusetts
Andrew Whiteley – University of Massachusetts
Mark Hudy – U.S. Geological Survey
Zachary Robinson – University of Massachusetts
Amanda Colton – U.S. Forest Service
Ben Letcher – U.S. Geological Survey
Keith Nislow – U.S. Forest Service