ebb-tidal delta development where before there … · ebb-tidal delta development where before...
TRANSCRIPT
458
EBB-TIDAL DELTA DEVELOPMENT WHERE BEFORE THERE
WAS NONE, SHARK RIVER INLET, NEW JERSEY
TANYA M. BECK1, NICHOLAS C. KRAUS1
1. U.S. Army Engineer Research and Development Center, Coastal and Hydraulics
Laboratory, 3909 Halls Ferry Road, Vicksburg, MS 39180-6199, USA.
Abstract: The navigation channel at Shark River Inlet, NJ, is the responsibility of
the U.S. Army Corps of Engineers, New York District. Until about the year 2000, the
ocean entrance to Shark River Inlet required minor, infrequent maintenance dredging
(every 7 to 10 years). Following large-scale beach nourishment to this stretch of coast
in the late 1990s, the hydraulically efficient inlet began to experience rapid shoaling at
the entrance. Subsequent to year 2000, surveys by the New York District indicated
increased shoaling at the inlet entrance, first from the south and then from the north,
necessitating unplanned dredging to maintain the navigation channel. To maintain the
authorized entrance channel navigable depth of 5.5 m below MLW, dredging must now
be done semi-annually in addition to the planned operational 2-3 year dredging cycle.
A study was performed to understand and quantify the reasons for change in the inlet
morphology and increased channel shoaling, and to predict the consequences of future
engineering actions for reducing or controlling the shoaling. Formation and growth of
an ebb-tidal delta at the entrance subsequent to the beach nourishment is documented,
before which there was none.
Introduction
As part of the Sea Bright to Manasquan Inlet Beach Erosion Control Project, in
1997 the U.S. Army Corps of Engineers (USACE), New York District, placed
approximately 4.1 million m3 of fine to medium sand to the south of Shark River
Inlet, NJ. Thirteen long groins in Belmar and the Borough of Spring Lake, located
south of the inlet, were notched (lowered in elevation) in 1997 and 1998 near the
shore to promote sand movement into a local erosion hot spot. During 1999-2000,
another 2.4 million m3 of sand was placed to the north of the inlet, and, in the
autumn of 2002, another 172,000 m3of was placed north of the inlet (Bocamazo et
al. 2003; Donohue et al. 2004).
Until about the year 2000, the ocean entrance to Shark River Inlet required minor,
infrequent maintenance dredging (every 7 to 10 years). The General Design
Memoranda for the Erosion Control Project (USACE 1989, 1994) anticipated
increased shoaling and a shorter time interval between dredging at the Shark River
Inlet entrance to approximately every 2 to 3 years owing to increased availability of
sand. Following the large-scale beach nourishments, however, the formerly
Report Documentation Page Form ApprovedOMB No. 0704-0188
Public reporting burden for the collection of information is estimated to average 1 hour per response, including the time for reviewing instructions, searching existing data sources, gathering andmaintaining the data needed, and completing and reviewing the collection of information. Send comments regarding this burden estimate or any other aspect of this collection of information,including suggestions for reducing this burden, to Washington Headquarters Services, Directorate for Information Operations and Reports, 1215 Jefferson Davis Highway, Suite 1204, ArlingtonVA 22202-4302. Respondents should be aware that notwithstanding any other provision of law, no person shall be subject to a penalty for failing to comply with a collection of information if itdoes not display a currently valid OMB control number.
1. REPORT DATE MAY 2011 2. REPORT TYPE
3. DATES COVERED 00-00-2011 to 00-00-2011
4. TITLE AND SUBTITLE Ebb-Tidal Delta Development Where Before There was None, SharkRiver Inlet, New Jersey
5a. CONTRACT NUMBER
5b. GRANT NUMBER
5c. PROGRAM ELEMENT NUMBER
6. AUTHOR(S) 5d. PROJECT NUMBER
5e. TASK NUMBER
5f. WORK UNIT NUMBER
7. PERFORMING ORGANIZATION NAME(S) AND ADDRESS(ES) U.S. Army Engineer Research and Development Center,Coastal andHydraulics Laboratory,3909 Halls Ferry Road,Vicksburg,MS,39180
8. PERFORMING ORGANIZATIONREPORT NUMBER
9. SPONSORING/MONITORING AGENCY NAME(S) AND ADDRESS(ES) 10. SPONSOR/MONITOR’S ACRONYM(S)
11. SPONSOR/MONITOR’S REPORT NUMBER(S)
12. DISTRIBUTION/AVAILABILITY STATEMENT Approved for public release; distribution unlimited
13. SUPPLEMENTARY NOTES in Proceedings of the Coastal Sediments ’11 Specialty Conference, 2-6 May 2011, Miami, FL
14. ABSTRACT The navigation channel at Shark River Inlet, NJ, is the responsibility of the U.S. Army Corps of Engineers,New York District. Until about the year 2000, the ocean entrance to Shark River Inlet required minor,infrequent maintenance dredging (every 7 to 10 years). Following large-scale beach nourishment to thisstretch of coast in the late 1990s, the hydraulically efficient inlet began to experience rapid shoaling at theentrance. Subsequent to year 2000, surveys by the New York District indicated increased shoaling at theinlet entrance, first from the south and then from the north necessitating unplanned dredging to maintainthe navigation channel. To maintain the authorized entrance channel navigable depth of 5.5 m belowMLW, dredging must now be done semi-annually in addition to the planned operational 2-3 year dredgingcycle. A study was performed to understand and quantify the reasons for change in the inlet morphologyand increased channel shoaling, and to predict the consequences of future engineering actions for reducingor controlling the shoaling. Formation and growth of an ebb-tidal delta at the entrance subsequent to thebeach nourishment is documented before which there was none.
15. SUBJECT TERMS
16. SECURITY CLASSIFICATION OF: 17. LIMITATION OF ABSTRACT Same as
Report (SAR)
18. NUMBEROF PAGES
14
19a. NAME OFRESPONSIBLE PERSON
a. REPORT unclassified
b. ABSTRACT unclassified
c. THIS PAGE unclassified
Standard Form 298 (Rev. 8-98) Prescribed by ANSI Std Z39-18
459
hydraulically efficient inlet began to experience rapid shoaling at the entrance.
Subsequent to year 2000, surveys indicated increased shoaling at the inlet entrance,
first from the south and then from the north, necessitating unplanned dredging. To
maintain the authorized entrance channel navigable depth of 5.5 m below MLW,
dredging must now be done semi-annually in addition to the planned operational 2-3
year dredging cycle. A study was performed to understand and quantify the reasons
for change in the inlet morphology and the increased channel shoaling, and to
predict the consequences of future engineering actions for reducing the shoaling.
Background
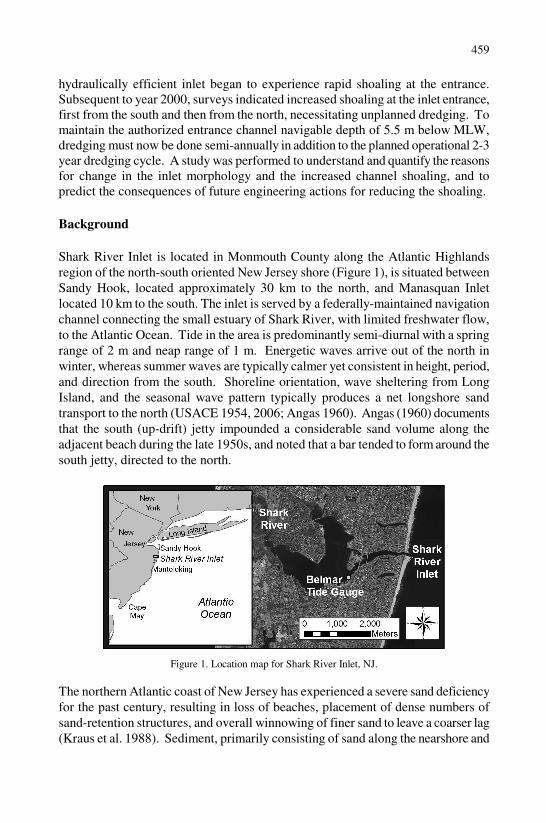
Shark River Inlet is located in Monmouth County along the Atlantic Highlands
region of the north-south oriented New Jersey shore (Figure 1), is situated between
Sandy Hook, located approximately 30 km to the north, and Manasquan Inlet
located 10 km to the south. The inlet is served by a federally-maintained navigation
channel connecting the small estuary of Shark River, with limited freshwater flow,
to the Atlantic Ocean. Tide in the area is predominantly semi-diurnal with a spring
range of 2 m and neap range of 1 m. Energetic waves arrive out of the north in
winter, whereas summer waves are typically calmer yet consistent in height, period,
and direction from the south. Shoreline orientation, wave sheltering from Long
Island, and the seasonal wave pattern typically produces a net longshore sand
transport to the north (USACE 1954, 2006; Angas 1960). Angas (1960) documents
that the south (up-drift) jetty impounded a considerable sand volume along the
adjacent beach during the late 1950s, and noted that a bar tended to form around the
south jetty, directed to the north.
Figure 1. Location map for Shark River Inlet, NJ.
The northern Atlantic coast of New Jersey has experienced a severe sand deficiency
for the past century, resulting in loss of beaches, placement of dense numbers of
sand-retention structures, and overall winnowing of finer sand to leave a coarser lag
(Kraus et al. 1988). Sediment, primarily consisting of sand along the nearshore and
460
beach face, originates from reworked glacial material and has an average grain size
ranging between 0.2 and 0.35 mm with a median grain size diameter of 0.26 mm for
the average nearshore profile (Kraus et al. 1988). The beach profile has tended to
steepen in approach to equilibrium with the coarser sand. Based on a regional sand
budget, the long-term net potential longshore sand transport rate has most recently
been estimated at 153,000 m3/year to the north, with the gross transport rate at
696,000 m3/year (USACE 2006). The gross transport rate at the site, the sum of the
north- and south-directed rates, contributes to shoaling of littoral material into the
navigation channel. Long-term net and gross sand transport rates correspond to
potential longshore transport and can be realized only if sand is fully available to be
transported in the littoral zone. Littoral material will bypass the channel as well as
deposit in it, because shallow channels are not complete traps to littoral transport,
especially during storms.
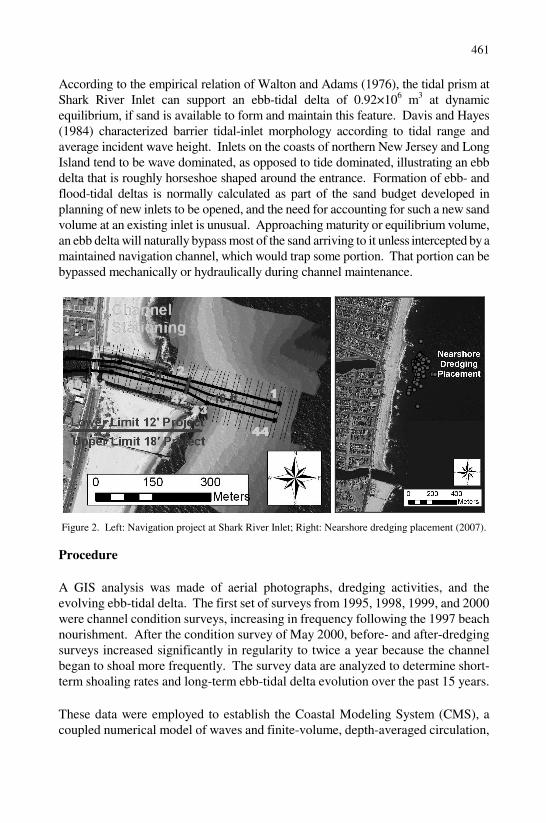
Shark River Inlet is stabilized by two parallel rubble stone jetties owned and
maintained by the State of New Jersey. Two curved jetties were constructed in
1915, and between 1948 and 1951 the State rebuilt and realigned the jetties to
extend straight to the ocean (Angas 1960), adding a 152 m-long shore-parallel
external spur of the north jetty (Figure 2). The federal navigation project consists of
the entrance channel, which is 5.5 m deep (MLW) and 45 – 60 m wide from the
Atlantic Ocean to the inlet throat (Figure 2). The inlet, connecting the estuary of
Shark River to the ocean, is 60 m wide at the narrowest section where one bridge
crosses, held up by two pilings, and decreases to 40 m in the north flood channel
and 100 m in the south flood channel. Several shallow and intertidal, oyster-
encrusted shoals increase the flow resistance in addition to two bridges spanning
this section (each with five to ten small piers spanning the channels). Material
dredged from the inlet entrance, consisting of beach-suitable sand, is bypassed to an
open-water disposal site located offshore between the second and third groins
located 0.6 and 1.0 km to the north of the inlet. The upper right-hand corner of
Figure 2 depicts the placement locations from a December 2007 dredging and
disposal.
The entrance to Shark River Inlet serves a relatively small estuary complex with a
tidal prism of 4.19 × 10⁶ m
3 (Jarrett 1976), channel cross-sectional area of 2.79 ×
103 m
2, and inlet entrance width to depth (hydraulic radius) ratio of 17, one of
smallest of 108 U.S. inlets and the smallest among 35 Atlantic coast inlets tabulated
by Jarrett (1976). Beck and Kraus (2010) performed a harmonic analysis for the
month of August 2009 at the nearby ocean tide gauge at Sandy Hook, NJ, and a
bay-side tide gauge at Belmar, and found small tidal attenuation and phase
difference. This hydraulic efficiency owes both to its small width to depth ratio and
to negligible impedance from bottom features such as sand waves in the channel
entrance.
461
According to the empirical relation of Walton and Adams (1976), the tidal prism at
Shark River Inlet can support an ebb-tidal delta of 0.92×10⁶ m
3 at dynamic
equilibrium, if sand is available to form and maintain this feature. Davis and Hayes
(1984) characterized barrier tidal-inlet morphology according to tidal range and
average incident wave height. Inlets on the coasts of northern New Jersey and Long
Island tend to be wave dominated, as opposed to tide dominated, illustrating an ebb
delta that is roughly horseshoe shaped around the entrance. Formation of ebb- and
flood-tidal deltas is normally calculated as part of the sand budget developed in
planning of new inlets to be opened, and the need for accounting for such a new sand
volume at an existing inlet is unusual. Approaching maturity or equilibrium volume,
an ebb delta will naturally bypass most of the sand arriving to it unless intercepted by a
maintained navigation channel, which would trap some portion. That portion can be
bypassed mechanically or hydraulically during channel maintenance.
Figure 2. Left: Navigation project at Shark River Inlet; Right: Nearshore dredging placement (2007).
Procedure
A GIS analysis was made of aerial photographs, dredging activities, and the
evolving ebb-tidal delta. The first set of surveys from 1995, 1998, 1999, and 2000
were channel condition surveys, increasing in frequency following the 1997 beach
nourishment. After the condition survey of May 2000, before- and after-dredging
surveys increased significantly in regularity to twice a year because the channel
began to shoal more frequently. The survey data are analyzed to determine short-
term shoaling rates and long-term ebb-tidal delta evolution over the past 15 years.
These data were employed to establish the Coastal Modeling System (CMS), a
coupled numerical model of waves and finite-volume, depth-averaged circulation,
462
sediment transport, and morphology change (http://cirp.usace.army.mil/). The CMS
was driven by tide and hindcast waves. The Non-equilibrium Transport model,
based on a total load advection-diffusion approach, was selected to calculate
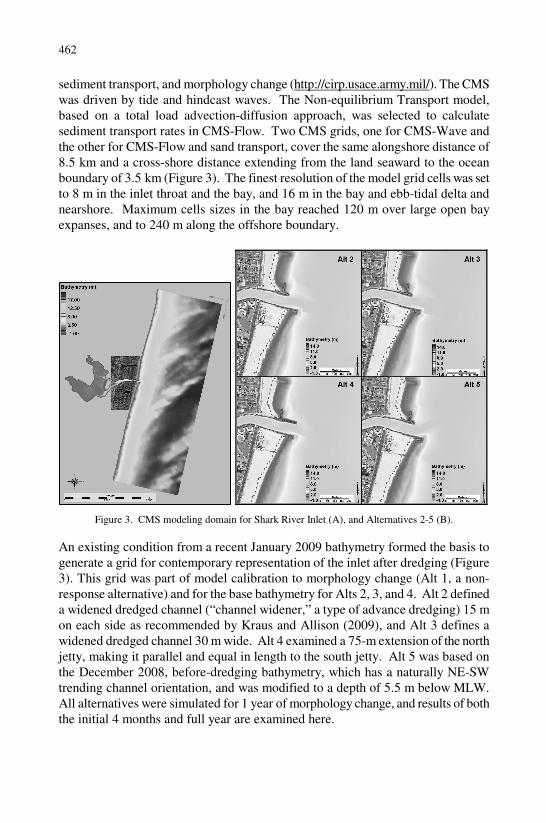
sediment transport rates in CMS-Flow. Two CMS grids, one for CMS-Wave and
the other for CMS-Flow and sand transport, cover the same alongshore distance of
8.5 km and a cross-shore distance extending from the land seaward to the ocean
boundary of 3.5 km (Figure 3). The finest resolution of the model grid cells was set
to 8 m in the inlet throat and the bay, and 16 m in the bay and ebb-tidal delta and
nearshore. Maximum cells sizes in the bay reached 120 m over large open bay
expanses, and to 240 m along the offshore boundary.
Figure 3. CMS modeling domain for Shark River Inlet (A), and Alternatives 2-5 (B).
An existing condition from a recent January 2009 bathymetry formed the basis to
generate a grid for contemporary representation of the inlet after dredging (Figure
3). This grid was part of model calibration to morphology change (Alt 1, a non-
response alternative) and for the base bathymetry for Alts 2, 3, and 4. Alt 2 defined
a widened dredged channel (“channel widener,” a type of advance dredging) 15 m
on each side as recommended by Kraus and Allison (2009), and Alt 3 defines a
widened dredged channel 30 m wide. Alt 4 examined a 75-m extension of the north
jetty, making it parallel and equal in length to the south jetty. Alt 5 was based on
the December 2008, before-dredging bathymetry, which has a naturally NE-SW
trending channel orientation, and was modified to a depth of 5.5 m below MLW.
All alternatives were simulated for 1 year of morphology change, and results of both
the initial 4 months and full year are examined here.
463
Results
Observed Geomorphology
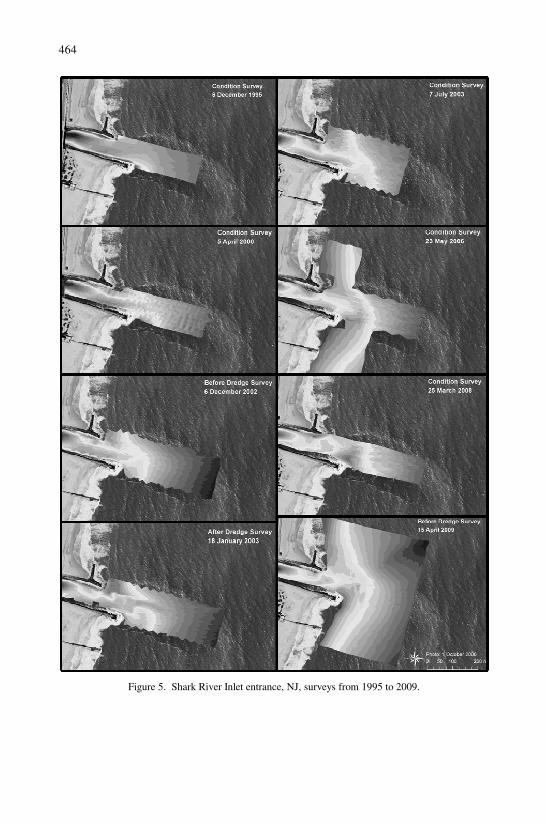
The bathymetric dataset analyzed covers 27 USACE surveys available from January
1995 to January 2010. Inlet shoaling rates are given in Figure 4, and Figure 5
includes several examples from the dataset, illustrating depth contour maps set to
MLW and with the same horizontal scale. Surveys from the late 1990s indicate that
the entrance channel was devoid of notable shoals and that the maintained
navigation channel extended to deep water without evidence of a shallow deltaic
platform (1995 survey in Figure 5). Surveys subsequent to the 2000 survey indicate
a large shoal on either the north or south jetty tip. Such morphologic variation is
attributable to seasonal changes in wave direction, where high waves incident from
either the north or south, and their associated current, would transport sand along
these shoals and into the channel, as seen in the July 2003 Condition Survey.
Figure 5 shows before- and after-dredging surveys of December 2002 and January
2003, and indicates the extent to which the channel is now dredged, on the order of
10,000-20,000 m3 of sand. The 7 July 2003 survey demonstrates the quick
reformation of the entrance bar, part of the horseshoe-shaped ebb delta morphology
characteristic of wave-dominated inlets. As the nourishment material rebuilt both
the up-drift (south) and down-drift (north) nearshore profiles alongside the inlet, the
growing ebb-delta became more symmetric as seen in the May 2006 survey.
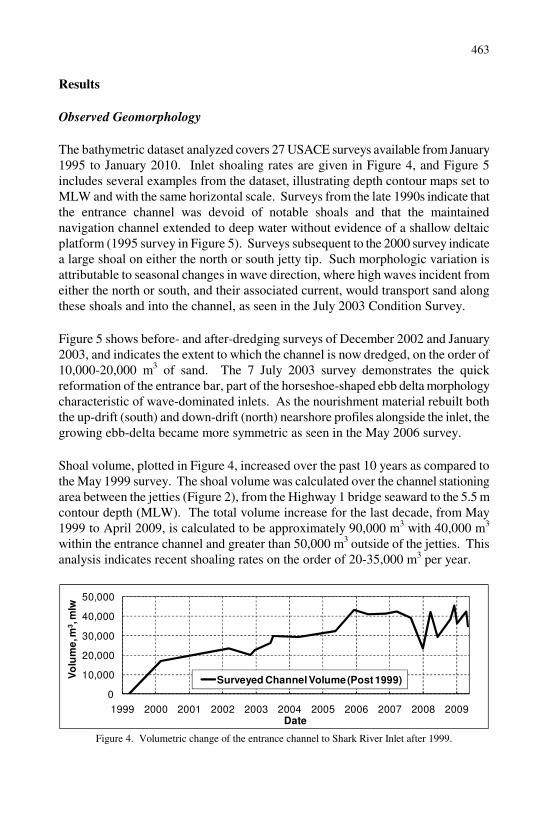
Shoal volume, plotted in Figure 4, increased over the past 10 years as compared to
the May 1999 survey. The shoal volume was calculated over the channel stationing
area between the jetties (Figure 2), from the Highway 1 bridge seaward to the 5.5 m
contour depth (MLW). The total volume increase for the last decade, from May
1999 to April 2009, is calculated to be approximately 90,000 m3 with 40,000 m
3
within the entrance channel and greater than 50,000 m3 outside of the jetties. This
analysis indicates recent shoaling rates on the order of 20-35,000 m3 per year.
0
10,000
20,000
30,000
40,000
50,000
1999 2000 2001 2002 2003 2004 2005 2006 2007 2008 2009
Vo
lum
e, m
3, m
lw
Date
Surveyed Channel Volume (Post 1999)
Figure 4. Volumetric change of the entrance channel to Shark River Inlet after 1999.
464
Figure 5. Shark River Inlet entrance, NJ, surveys from 1995 to 2009.

465
CMS Morphologic Modeling
Calibration of the CMS for was completed in two parts: first, through comparison of
measured and calculated hydrodynamics, and second through comparison of
morphologic end-states through validating channel infilling rates and morphologic
patterns. Observed water levels and measured current velocity in the Shark River
estuary and inlet, collected on 20 August 2009, were used in the hydrodynamic
calibration by Beck and Kraus (2010). Beck and Kraus (2010) also compared
measured and calculated current velocity at the centrally-located peak velocity in
the three main channels (Figure 6). Measurements and calculations show close
correspondence for the main channel (CS 1) and south channel (CS 3) with a Root
Mean Absolute Error (RMAE) value of 3-5%, and an RMAE of 9 % for the north
channel (CS2).
CS3
CS2
CS1
Figure 6. Measured and calculated current velocities at centrally-located points along surveyed cross
sections (CS) shown in figure background (Beck and Kraus, 2010).
Morphologic response was calibrated to the measured change from January 2009 to
April 2009, a typical recent dredging interval, and served to verify channel cross-
sections and infilling rates (Figure 28). Based on the surveys, channel infilling
volume expected for the 4-month simulation is 8,900 m3 for the entrance channel
alone. The 4-month simulation produced a similar channel infilling volume of
9,200 m3 (RMAE of 3.4%) and morphologic patterns, as illustrated in Figure 7. A
comparison of measured and calculated change along the transects in Figure 7
showed a high correlation with RMAE values of 7%, 11%, 2%, 4%, and 6% for
Transects 1-5 respectively.

466
Figure 7. Measured (top) and calculated (bottom) morphology change at the entrance channel. Transects
(arcs) 1-5 are illustrated on the calculated morphology with two examples graphs.
Under the two channel widening alternatives, Alts 2 and 3, there is a significant
change in morphologic response by extending the dredging north and south of the
authorized channel (Figure 8). Channel infilling volume for the 4-month simulation
of Alt 2 and Alt 3 is greater by 5,000 m3; however, the limiting depth of the shoal in
Alt 2 is only 5.3 m as opposed to 5.0 m. The proximal side of the channel is
scoured greater (-7.0 to -9.0 m MSL) than the authorized depth. There is a large
offset of channel orientation toward the north as a result of the greater volume of
shoaling around the south jetty tip. In conjunction with the south shoaling, currents
are no longer directed parallel through the channel, but meander under the influence

467
of both morphology and jetty configuration. A decrease in shoaling response for
Alt 3 as opposed to Alt 2 was found after four to six months (Figure 8); however
morphologic response essentially converged in both modeled alternatives.
Figure 8. Calculated morphology change of 4 months at the entrance channel. The red Jetty Tip Transect
(lower-right corner) gives cross-sectional depths.
Morphology change calculated for Alt 4 indicates a stronger along-channel current
in the inlet, resulting in a clear and perpendicular-oriented channel (illustrated in
Figure 8), scouring beyond the direct influence of the adjacent, shallow nearshore.
The most dominant process controlling this morphology is the current pattern
resulting from the confluence of ebbing and flooding currents over a longer extent
of channel with parallel or straight boundaries. The extended straight boundaries
decrease the potential for a meandering pattern, which was exacerbated in Alts 2
and 3, and produces stronger along-inlet current velocity, which maintains a deep
and symmetric channel morphology. Finally, the channel slopes approach
equilibrium under the new centrally-located stable and deeper channel and, as a
result, a large volume of sand is deposited along the sides of the channel.
Alternative 5 was the least effective at maintaining navigable channel depths for a
longer period of time as opposed to the present dredging practice (Figure 8).
Although the initial channel morphology directed NE-SW for this alternative
represents the present condition, volume of sand removed (under the dredging) is
relatively small and, therefore, there is little accommodation space for the sand
transported around the distal part of the ebb-tidal delta. The calculated result of this
alternative is most similar to Alt 1, where no changes were made to the post-
dredged bathymetry from January 2009.
468
Discussion
CMS modeling reproduced a known seasonal dependence to shoaling in the area
near the north and south jetty at Shark River Inlet, as well as the general trend of
growth of the ebb-tidal delta and encroaching (jetty-tip) shoals. Here, we compare
results of the 1-year simulations for four of the alternatives (Figure 9). Under the
two channel widening alternatives, Alts 2 and 3, there is a significant morphologic
response by extending the dredging outside of the channel. Under present dredged
conditions, ebb current velocity is strongest through the maintained portion of the
channel until deflected with the onset of channel shoaling. Because the location of
shoaling is seasonal, advance dredging in the form of channel wideners affords the
channel more time to remain clear of limiting shoaling from either north or south, of
which begins outside of the tidal current influence and is evidently associated with
wave-induced longshore transport. These alternatives are an effective solution with
little additional cost as part of ongoing channel maintenance in lengthening the
required time between dredging (reducing mobilization cost).
Channel wideners may also be considered as an interim solution that can be
adaptively managed while further examining extension of the north jetty (Alt 4).
Presently, the bypassing bar (or platform) is located close to the jetty tips and,
because of the unequal lengths of the jetties, jetty-tip shoaling occurs in an
asymmetric morphologic pattern of the entrance bar. The morphologic pattern is
further modified by the orientation of the channel, where the direction of current in
the form of the ebb jet acts in combination with the longshore current (Figure 9).
Morphology change calculated for Alt 4 resulted in a self-scouring, perpendicular-
oriented channel. Alternative 5 was the least effective at maintaining navigable
channel depths for a longer period of time as opposed to the present dredging
practice.
Nourishment placed on the adjacent beaches supplied the necessary volume of sand
to establish a shallow sand platform as the base to initiate an ebb-tidal delta at Shark
River Inlet. The platform formed in the early 2000s and serves as a pathway for
sand to be transported around the jetty tips. Surveys from the past decade indicate a
seaward expansion of the platform and further development of the ebb-tidal delta as
the inlet evolves to dynamic equilibrium under a larger rate of sand transport.
Dredging interrupts development of natural sand bypassing, reorients the channel,
and resets the morphology to a condition that responds quickly to the increased sand
transport. CMS alternatives discussed here provide quantitative information for
evaluation of the efficiencies of potential engineering actions.

469
Figure 9. Calculated morphology change for 1 year at the entrance channel.
Conclusions
For many decades, the entrance navigation channel to Shark River Inlet remained
clear of significant sand infiltration with only minor sand shoaling in the entrance,
so it was not a sink for beach sand. Natural sand bypassing must have occurred, but
the limited supply did not allow formation of an ebb-tidal delta. Following the first
beach nourishment on the south side of the inlet in 1997, sand began to build a
platform for the entrance bar to develop off the tip of the longer jetty. It was not
until 2000 that the northern nourishment was completed, after which notable
channel shoaling began. In the context of the new morphodynamics at Shark River
Inlet, planning with respect to long-term operation of the inlet must be carried out
with concern for regional management. In particular, about one-fifth of the volume
of material placed on the beach for the erosion-control project is expected to
contribute to forming the ebb-tidal delta and must be accounted for in the sand
budget. Considerably smaller-than-expected ebb volume (about 90,000 m3) suggests
that the delta is competing with the existing over-steep beach profile for sand in the
region. Also, dredging of the channel and bypassing the material to the north limits
ebb delta growth.
The CMS, driven by tide and hindcast waves, was capable of reproducing observed
trends in ebb-tidal delta development and changes in volume of notable
morphologic features. The modeling system was verified by reproducing observed
water levels in the Shark River estuary and current velocity in the inlet, and further
470
calibrated to morphology change for a 4-month simulation. The CMS was then
applied as an example of evaluating selected alternatives for reducing dredging
frequency in maintaining the inlet navigation channel. Channel wideners were
found to be an effective interim solution with little additional cost as part of
ongoing channel maintenance in lengthening the required time between required
dredging events (reducing mobilization cost). Alt 4 (extended north jetty) predicts a
stronger along-channel current in the inlet, resulting in a clear and perpendicular-
oriented channel, scouring beyond the direct influence of the adjacent, shallow
nearshore. This alternative provided the greatest overall change to the inlet system
and was recommended as a long-term solution because of the benefit to navigation.
Acknowledgements
This study was funded by the U.S. Army Engineer District, NY, and the Coastal
Inlets Research Program (CIRP) at the U.S Army Engineer Research and
Development Center. Discussions with and information provided by New York
District staff Lynn M. Bocamazo, Adam B. Devenyi, Jessica Fischer, Gerlyn T.
Perlas, John F. Tavolaro, and Edward Wrocenski are greatly appreciated.
Permission was granted by Headquarters, U.S. Army Corps of Engineers, to publish
this information.
References
Angas, W.M. (1960). “Shark River Inlet sand by-passing project”, Journal
Waterways and Harbors Division WW3:29-47.
Beck, T.B., and Kraus, N.C. (2010). “Shark River Inlet, New Jersey, Entrance
Shoaling: Report 2, Analysis with Coastal Modeling System”, Tech. Report
ERDC/CHL-TR-10-4, USAE Research and Development Center, Coastal and
Hydraulics Laboratory, Vicksburg, MS.
Bocamazo, L.M., Donohue, K.A., Williams, B., and Awad, G. (2003). “Groin
notching in Spring Lake, New Jersey”, Proc, Coastal Structures 2003, ASCE.
935-948.
Davis, Jr., R.A., and Hayes, M.O. (1984). “What is a wave dominated coast?”,
Marine Geology 60, 313-329.
Donohue, K.A., Bocamazo, L.M., and Dvorak, D. (2004). “Experience with groin
notching along the northern New Jersey coast”, In: Kraus, N.C, and Rankin

471
K.L (eds.) Functioning and Design of Coastal Groins: The Interaction of
Groins and the Beach –Process and Planning. Journal of Coastal Research, SI
No. 33, 198-214.
Jarrett, J. T. (1976). ”Tidal prism-inlet area relationships”, GITI Report 3, US Army
Engineer Research and Development Center, Coastal and Hydraulics
Laboratory, Vicksburg, MS.
Kraus, N.C., and Allison, M. C. (2009). “Shark River Inlet, New Jersey, Entrance
Shoaling: Report 1, Desk Study”, Tech. Report ERDC/CHL-TR-09-7, USAE
Research and Development Center, Coastal and Hydraulics Laboratory,
Vicksburg, MS.
Kraus, N.C., Scheffner, N.W., Chou, L.W., Cialone, M.A., Smith, J.M., and Hardy,
T.A. (1988). “Coastal processes at sea bright to Ocean Township, New Jersey,
Volume 1: Main text and Appendix A”, Miscellaneous Paper CERC-88-12,
USAE Waterways Experiment Station, Coastal Engineering Research Center,
Vicksburg, MS.
U.S. Army Corps of Engineers. (1954). “Atlantic Coast of New Jersey, Sandy Hook
to Barnegat Inlet”, Beach Erosion Control Report on Cooperative Study
(Survey). U.S. Army Engineer District, NY, 59 pp. plus appendices.
U.S. Army Corps of Engineers. (1989, rev. 1990). “Atlantic Coast of New Jersey,
Sandy Hook to Barnegat, Beach Erosion Control Project, Section I – Sea
Bright to Ocean Township, New Jersey”, General Design Memorandum, U.S.
Army Engineer District, NY.
U.S. Army Corps of Engineers. (1994, rev. 1995). “Atlantic Coast of New Jersey,
Sandy Hook to Barnegat, Beach Erosion Control Project, Section II - Asbury
Park to Manasquan, New Jersey”, General Design Memorandum, U.S. Army
Engineer District, NY.
U.S. Army Corps of Engineers. (2006). “The Atlantic Coast of New Jersey
Regional Sediment Budget 1986-2003 Manasquan Inlet to Sea Bright”, Report,
U.S. Army Engineer District, NY, Draft Report, April, 2006.
Walton, T. L., and W. D. Adams. (1976). “Capacity of inlet outer bars to store
sand”, Proc. 15th
Coastal Engineering Conference, ASCE, 1,919-1,937.