eastspring investments cash management fund, as at 30 june 2019. past performance of the fund is not...
TRANSCRIPT

FOR THE SIX MONTHS FINANCIAL PERIOD ENDED 30 JUNE 2019
INTERIM REPORT
EASTSPRING INVESTMENTSCASH MANAGEMENT FUND
Eastspring Investments Berhad (531241-U)
Level 22, Menara Prudential, Persiaran TRX Barat55188 Tun Razak Exchange, Kuala LumpurT: (603) 2778 3888 F: (603) 2789 7220eastspring.com/my
Client ServicesT: (603) 2778 [email protected]

Dear Valued Investor,
Greetings from Eastspring Investments Berhad!
First and foremost, we would like to take this opportunity to thank you for choosing to invest with Eastspring Investments Berhad.
We are pleased to enclose a copy of the Annual/Interim/Quarterly Fund Reports of Eastspring Investments Berhad’s fund(s) for the reporting period ended 30 June 2019.
You may also download these reports from our website at www.eastspring.com/my
Should you require any assistance, please do not hesitate to contact our Client Services at 03-2778 1000.
Yours sincerely,
Raymond Tang Chee Kin Non-Independent, Executive Director and Chief Executive Officer

TABLE OF CONTENTS
Fund Information 1
Key Performance Data 3
Manager’s Report 5
Market Review 9
Rebates and Soft Commissions 11
Statement by the Manager 13
Trustee’s Report to the Unit Holders of
Eastspring Investments Cash Management Fund 14
Unaudited Statement of Comprehensive Income 15
Unaudited Statement of Financial Position 16
Unaudited Statement of Changes in Equity 17
Unaudited Statement of Cash Flows 18
Summary of Significant Accounting Policies 19
Notes to the Unaudited Financial Statements 27
Corporate Directory 51

FUND INFORMATION
Name of Fund Eastspring Investments Cash Management Fund (the “Fund”)
Fund Category/ Type
Money market/income
Fund Objective The Fund seeks to provide a high level of liquidity with reasonable returns by investing in a portfolio of money market and other short-term debt instruments.
ANY MATERIAL CHANGES TO THE FUND’S OBJECTIVE WOULD REQUIRE UNIT HOLDERS’ APPROVAL.
Performance Benchmark
The performance benchmark of the Fund is Maybank overnight deposit rate.
Source: www.maybank2u.com.my
Note: The risk profile of the Fund is different from the risk profile of the performance benchmark.
Fund Income Distribution Policy
At least once a month, subject to the availability of income.
1Client Services : 03-2778 1000
Interim Report

FUND INFORMATION (CONTINUED)
Breakdown of Unit Holdings by Size
As at 30 June 2019, the size of Eastspring Investments Cash Management Fund stood at 109.991 million units.
Fund Size
Breakdown of Unit Holdings
Unit Holdings
No. of Unit
Holders %
No of Units* (‘000) %
5,000 units and below 28 25.45 34 0.03
5,001 to 10,000 units 5 4.55 38 0.03
10,001 to 50,000 units 25 22.73 706 0.64
50,001 to 500,000 units 35 31.82 7,347 6.68
500,001 units and above 17 15.45 101,865 92.62
Total 110 100.00 109,990 100.00
* excludes units held by the Manager.
Un
its
(Mill
ion
)
0
20
40
60
80
100
120
140
Jan2019
Feb2019
Mar2019
Apr2019
May2019
Jun2019
Client Services : 03-2778 10002
Eastspring Investments Cash Management Fund

KEY PERFORMANCE DATAFOR THE FINANCIAL PERIOD ENDED
Category 30.6.2019 30.6.2018 30.6.2017
(%) (%) (%)
Unquoted fixed income securities 17.04 31.40 40.29
Cash and other assets 82.96 68.60 59.71
Total 100.00 100.00 100.00
Net Asset Value (NAV) (RM'000) 59,447 61,169 159,924
Units In Circulation (Units '000) 109,991 113,131 295,777
Net Asset Value Per Unit (RM) 0.5405 0.5407 0.5407
Highest Net Asset Value Per Unit (RM)# 0.5404 0.5406 0.5407
Lowest Net Asset Value Per Unit (RM)# 0.5394 0.5394 0.5400
Total Return (%)
- Capital Growth (0.04) 0.06 (0.09)
- Income Distribution 1.66 1.62 1.87
Total Return (%) 1.62 1.68 1.77
Gross Distribution Per Unit (RM) 0.0089 0.0087 0.0100
Net Distribution Per Unit (RM) 0.0089 0.0087 0.0100
Management Expense Ratio (MER) (%)* 0.21 0.23 0.30
Portfolio Turnover Ratio (PTR) (times)^ 0.07 0.06 0.09
# Figures shown as ex-distribution.
* There were no significant changes to the MER during the period under review.
^ There were no significant changes to the PTR during the period under review.
3Client Services : 03-2778 1000
Interim Report

KEY PERFORMANCE DATA (CONTINUED)
1 year 1.7.2018 to
30.6.2019
3 years 1.7.2016 to
30.6.2019
5 years 1.7.2014 to
30.6.2019
(%) (%) (%)
Average total return 3.43 3.36 3.40
Year ended1.1.2018 to31.12.2018
1.1.2017 to31.12.2017
1.1.2016 to31.12.2016
1.1.2015 to31.12.2015
1.1.2014 to31.12.2014
(%) (%) (%) (%) (%)
Annual total return 3.48 3.37 3.36 3.50 3.13
Source: The above total return of the Fund was sourced from Lipper for Investment Management.
Bases of calculation and assumptions made in calculating returns:
Percentage growth =
NAVt = NAV at the end of the period
NAV0 = NAV at the beginning of the period Performance annualised = (1 + Percentage Growth)1/n - 1
Adjusted for unit split and distribution paid out for the period
n = Number of years
Past performance is not necessarily indicative of future performance and unit prices and investment returns may go down, as well as up.
NAVt -1NAV0
Client Services : 03-2778 10004
Eastspring Investments Cash Management Fund

Fund Performance Over the 5-year period, the Fund recorded a return of 18.19%, outperforming the benchmark return of 9.80% by 8.39%.
During the period under review, the Fund registered a return of 1.62%, outperforming the benchmark return of 0.91% by 0.71%.
Investments in short term corporate bonds and commercial papers have contributed to the outperformance of the Fund.
The performance is calculated on NAV-to-NAV basis with gross income or dividend reinvested.
Benchmark: Maybank overnight deposit rate
Source: Lipper for Investment Management and www.maybank2u.com.my, as at 30 June 2019.
Past performance of the Fund is not necessarily indicative of its future performance.
MANAGER’S REPORT
Eastspring Investments Cash Management Fund Benchmark
Eastspring Investments Cash Management Fund- 5 Years Return Vs Benchmark
5 ye
ars
% C
han
ge
Jun2014
Oct2014
Jan2015
Apr2015
Jul2015
Oct2015
Jan2016
May2016
Aug2016
Nov2016
Feb2017
May2017
Aug2017
Nov2017
Mar2018
Jun2018
Sep2018
Dec2018
Mar2019
Jun2019
20%
18%
16%
14%
12%
10%
8%
6%
4%
2%
0%
20%
18%
16%
14%
12%
10%
8%
6%
4%
2%
0%
5Client Services : 03-2778 1000
Interim Report

MANAGER’S REPORT (CONTINUED)
Analysis of Fund Performance
For the financial period ended 30 June 2019:
Income Return
Capital Return*
Total Return
Total Return of Benchmark
(%) (%) (%) (%)
1.66 (0.04) 1.62 0.91
* Capital return components (NAV per unit to NAV per unit).
Distribution/ Unit Split
Ex-date 07-Jan-19 07-Feb-19 06-Mar-19
Distribution Per Unit (RM) (RM) (RM)
Gross 0.0015 0.0015 0.0017Net 0.0015 0.0015 0.0017
Ex-date 08-Apr-19 06-May-19 07-Jun-19
Distribution Per Unit (RM) (RM) (RM)
Gross 0.0014 0.0015 0.0013Net 0.0014 0.0015 0.0013
Impact on NAV arising from distribution for the financial period ended 30 June 2019.
Client Services : 03-2778 10006
Eastspring Investments Cash Management Fund

MANAGER’S REPORT (CONTINUED)
Distribution/ Unit Split (continued)
Ex-date 07-Jan-19 07-Feb-19 06-Mar-19
(RM per Unit) (RM per Unit) (RM per Unit)
Net Asset Value before distribution 0.5409 0.5410 0.5409Less: distribution (0.0015) (0.0015) (0.0017)
Net Asset Value after distribution 0.5394 0.5395 0.5392
Ex-date 08-Apr-19 06-May-19 07-Jun-19
(RM per Unit) (RM per Unit) (RM per Unit)
Net Asset Value before distribution 0.5409 0.5408 0.5407Less: distribution (0.0014) (0.0015) (0.0013)
Net Asset Value after distribution 0.5395 0.5393 0.5394
No unit split were declared for the financial period ended 30 June 2019.
Investment Strategy During the Period Under Review
The Fund participated in fixed deposits, selective quality short-term debt securities for yield pick-up and short-term money market instruments for liquidity purposes.
7Client Services : 03-2778 1000
Interim Report

Asset Allocation
Asset Allocation30-Jun
201931-Dec
2018 Changes
(%) (%) (%)
Unquoted fixed income securities 17.04 58.07 (41.03)Cash and other assets 82.96 41.93 41.03
Asset Allocation as at 30 June 2019
There were no significant changes in asset allocation of the Fund for the period under review.
State of Affairs ofthe Fund
There have been neither significant change to the state of affairs of the Fund nor any circumstances that materially affect any interests of the unit holders during the period under review.
Effective from 1 January 2019, the auditor of the Fund has been changed to PricewaterhouseCoopers.
MANAGER’S REPORT (CONTINUED)
Cash and other assets 82.96%
Unquoted fixed income securities 17.04%
Client Services : 03-2778 10008
Eastspring Investments Cash Management Fund

MARKET REVIEW
Bank Negara Malaysia (“BNM”) cut the Overnight Policy Rate (“OPR”) by 25bps to 3.00% from 3.25% on 7 May 2019 after holding the policy rate unchanged since 25 January 2018. BNM commented that the adjustment in the OPR was intended to preserve the degree of monetary accommodativeness due to the downside risks in the global and Malaysian economy. Prior to the Monetary Policy Meeting (“MPC”) in May, BNM has continuously caution on the uncertainties in the global environment with trade tensions continuing to be a key source of downside risk. Bank Negara commented that any materialization of downside risk from unresolved trade tension could weigh on domestic growth. Going forward, BNM will continue to monitor the impact of the recent rate cut and will continue to be data-dependent before making any changes in its monetary policies.
In May 2019, Bank Negara announced several initiatives to deepen and broaden onshore foreign exchange and bond market liquidity. These new measures are expected to improve Malaysia’s market accessibility to the world and may help address the liquidity concerns which was highlighted by FTSE Russell recently. The new initiatives include (1) enhancements to repo market liquidity and flexibility, (2) physical delivery for MGS futures, (3) measures to enhance FX market accessibility and liquidity, (4) increased flexibility for dynamic hedging programme, (5) FX transaction & documentation process and, (6) Ringgit liquidity beyond local trading hours.
On the economic front, Malaysia’s economy continued to grow in the first quarter of 2019 as the Malaysian economy registered marginally lower growth of +4.5% year-on-year (“y-o-y”), slightly lower than +4.7% y-o-y registered in 4Q2018. During the first quarter of 2019, Services (1Q2019: +6.4% y-o-y, 4Q2018: +6.9%), Manufacturing (1Q2019: +4.2% y-o-y, 4Q2018: +4.7%) and Agriculture (1Q2019: +5.6% y-o-y, 4Q2018: -0.1%) sectors anchored the Malaysia’s economy. On the expenditure side, Exports declined to +0.1% y-o-y in 1Q2019 from +3.1% y-o-y in 4Q2018 while Gross Fixed Capital Formation recorded negative growth of -3.5% y-o-y in 1Q2019 from +0.6% y-o-y in 4Q2018. Going forward, Malaysia’s economic growth is expected to be broadly sustained, supported mainly by domestic demand while gradual recovery in commodity production will also help to provide support to growth. According to Bank Negara’s Annual Report 2018, Bank Negara expects the economy to grow between 4.3% to 4.8% in 2019, while World Bank expects Malaysia’s economy to grow around 4.6% in 2019.
During the period under review, headline inflation remained at +0.2% y-o-y in May 2019 compared with +0.2% y-o-y in December 2018. Despite the rise in Food & Non-Alcoholic Beverages (May 2019: +1.2%, Dec 2018: +0.7% y-o-y), slowdown in transportation cost (May 2019: -2.5%, Dec 2018: -2.0% y-o-y) continue to remain a drag in inflation. The decrease in transportation costs was due to lower global fuel prices coupled with the change to weekly pricing fuel subsidy model. Similarly, core inflation remained at +0.4% y-o-y in May 2019, same at +0.4% in December 2018. Going forward, BNM expects inflation to be
9Client Services : 03-2778 1000
Interim Report

in a range of between 0.7%-1.7% in 2019 on the back of its expectation of lower global oil prices as well as recent implementation on the cap on prices of RON95 and diesel until the middle of 2019.
In 2019, the Fed maintained the Fed Fund Rate in the first half of the year citing that it will be patient as it determines the future adjustments for the federal funds rate. However, the recent FOMC statement in June showed that the Fed made several changes to its policy statement – removing the word ‘patient’ in favour of language promising to ‘act as appropriate’ and ‘to sustain current economic expansion’. The Fed further said that it still sees a sustained expansion of economic activity, strong labour market conditions, and inflation near the committee’s 2% target, but added that uncertainties about this outlook have increased.
Trade tensions between the US and China have deteriorated sharply since they failed to sign an anticipated trade deal in early May 2019. Subsequently, the United States announced that it would increase tariffs from 10% to 25% on USD200billion of Chinese goods while China is said to be considering limiting rare earth exports to United Sates. Global investors remain wary of the instability as this trade dispute continue to weigh on global growth and may trigger huge financial repercussions.
For the period under review, the 3-, 5-, 10- and 15-year Malaysian Government Securities (“MGS”) yields decreased by 33bps, 34bps, 44bps and 53bps to close at 3.29%, 3.42%, 3.63% and 3.91% respectively1. MGS yields moved lower throughout the period on the back of (1) global uncertainties from trade tension which could outweigh growth, (2) dovish Fed stance with no interest rate hikes for 2019 compared to two hikes in 2019 as earlier projected, (3) Bank Negara cut the Overnight Policy Rate by 25bps in May and (4) strong buying interest from local investors. Meanwhile, corporate bond yields generally moved in tandem with sovereign bond yields, albeit at a lag. Activities in the corporate bond market were supported by ample liquidity and a stable credit environment.
On the supply front, Corporate bond issuances continued to remain healthy in 1H2019 with total new issuances stood around RM41billion. Major primary issuances during the first half of 2019 were mainly government guaranteed bonds and corporates bonds. Notable issuances include RM6.8billion from Danainfra National Berhad (GG), RM4.6billion from Pengurusan Air SPV Berhad (GG & AAA), RM3.7billion from Malayan Banking Berhad (AA1), RM3.5billion from Danum Capital Berhad (AAA), RM3.0billion Lembaga Pembiayaan Perumahan Sektor Awam (GG), RM3.0bilion from PTPTN and RM2.0billion from CIMB Group Holdings (AA1).
1 Source: Bloomberg
Client Services : 03-2778 100010
Eastspring Investments Cash Management Fund

REBATES AND SOFT COMMISSIONS
During the period under review, the Manager and its delegates (if any) did not receive any soft commissions from stockbrokers.
11Client Services : 03-2778 1000
Interim Report

EASTSPRING INVESTMENTS CASH MANAGEMENT FUNDUNAUDITED FINANCIAL STATEMENTS FOR THE SIX MONTHS FINANCIAL PERIOD ENDED 30 JUNE 2019
Client Services : 03-2778 100012
Eastspring Investments Cash Management Fund

We, Tang Chee Kin and Iskander Bin Ismail Mohamed Ali, being two of the Directors of Eastspring Investments Berhad, do hereby state that, in the opinion of the Manager, the accompanying unaudited financial statements set out on pages 15 to 50 are drawn up in accordance with the provisions of the Deed and give a true and fair view of the financial position of the Fund as at 30 June 2019 and of its financial performance, changes in equity and cash flows for the six months financial period ended on that date in accordance with the Malaysian Financial Reporting Standards and International Financial Reporting Standards.
For and on behalf of the Manager,EASTSPRING INVESTMENTS BERHAD
TANG CHEE KINExecutive Director/Chief Executive Officer
ISKANDER BIN ISMAIL MOHAMED ALI Independent, Non-Executive Director
Kuala LumpurDate: 15 August 2019
STATEMENT BY THE MANAGER
13Client Services : 03-2778 1000
Interim Report

TRUSTEE’S REPORT TO THE UNIT HOLDERS OF EASTSPRING INVESTMENTS CASH MANAGEMENT FUND
We have acted as Trustee for Eastspring Investments Cash Management Fund (the “Fund”) for financial period ended 30 June 2019. To the best of our knowledge, for the financial period under review, Eastspring Investments Berhad (the “Manager”) has operated and managed the Fund in accordance with the following:-
a. limitations imposed on the investment powers of the Manager under the Deed(s), the Securities Commission’s Guidelines on Unit Trust Funds, the Capital Markets and Services Act 2007 and other applicable laws;
b. valuation and pricing for the Fund is carried out in accordance with the Deed(s) of the Fund and any regulatory requirements; and
c. creation and cancellation of units for the Fund are carried out in accordance with the Deed(s) of the Fund and any regulatory requirements.
We are of the view that the distributions made during this financial period ended 30 June 2019 by the Manager are not inconsistent with the objectives of the Fund.
For Deutsche Trustees Malaysia Berhad
Ng Hon Leong Richard Lim Hock Seng Head, Trustee Operations Chief Executive Officer
Kuala LumpurDate: 15 August 2019
Client Services : 03-2778 100014
Eastspring Investments Cash Management Fund

UNAUDITED STATEMENT OF COMPREHENSIVE INCOMEFOR THE SIX MONTHS FINANCIAL PERIOD ENDED 30 JUNE 2019
Note
6-months financial
period ended 30.6.2019
6-months financial
period ended 30.6.2018
RM RM
INVESTMENT INCOMEInterest income from deposits with licensed financial institutions 549,825 1,448,764Interest income from unquoted fixed income securities 585,296 422,157Net loss on financial assets at fair value through profit or loss 6 (10,805) (57,605)
1,124,316 1,813,316
EXPENSESManagement fee 3 (90,684) (165,400) Trustee fee 4 (15,114) (23,851) Audit fee (3,968) (4,959) Tax agent fee (1,687) (3,487) Other expenses (16,011) (27,031)
(127,464) (224,728)
PROFIT BEFORE TAXATION 996,852 1,588,588
TAXATION 5 - -
PROFIT AFTER TAXATION AND TOTAL COMPREHENSIVE INCOME 996,852 1,588,588
Profit after taxation is made up of the following: Realised amount 1,007,657 1,594,914 Unrealised amount (10,805) (6,326)
996,852 1,588,588
The accompanying summary of significant accounting policies and notes to the unaudited financial statements form an integral part of these unaudited financial statements.
15Client Services : 03-2778 1000
Interim Report

UNAUDITED STATEMENT OF FINANCIAL POSITIONAS AT 30 JUNE 2019
Note 2019 2018
RM RM
ASSETSCash and cash equivalents 8 49,495,393 41,995,689Financial assets at fair value through profit or loss 6 10,133,030 19,211,868TOTAL ASSETS 59,628,423 61,207,557
LIABILITIESAmount due to Manager 141,364 -Accrued management fee 14,624 15,464Amount due to Trustee 2,437 2,577Other payables and accruals 22,621 20,193TOTAL LIABILITIES 181,046 38,234
NET ASSET VALUE OF THE FUND 59,447,377 61,169,323
EQUITYUnit holders’ capital 34,556,465 36,248,766Retained earnings 24,890,912 24,920,557
NET ASSET ATTRIBUTABLE TO UNIT HOLDERS 59,447,377 61,169,323
NUMBER OF UNITS IN CIRCULATION 9 109,990,521 113,131,149
NET ASSET VALUE PER UNIT (EX-DISTRIBUTION) (RM) 0.5405 0.5407
The accompanying summary of significant accounting policies and notes to the unaudited financial statements form an integral part of these unaudited financial statements.
Client Services : 03-2778 100016
Eastspring Investments Cash Management Fund

UNAUDITED STATEMENT OF CHANGES IN EQUITYFOR THE SIX MONTHS FINANCIAL PERIOD ENDED 30 JUNE 2019
NoteUnit holders’
capitalRetainedearnings Total
RM RM RM
Balance as at 1 January 2019 38,776,746 24,899,806 63,676,552
Movement in unit holders’ contribution:Creation of units from applications 2,312,365 - 2,312,365Creation of units from distributions 1,004,709 - 1,004,709Cancellation of units (7,537,355) - (7,537,355)Total comprehensive income for the financial period - 996,852 996,852Distributions (Gross:0.89 sen/Net: 0.89 sen) 7 - (1,005,746) (1,005,746)Balance as at 30 June 2019 34,556,465 24,890,912 59,447,377
Balance as at 1 January 2018 132,545,828 24,928,611 157,474,439
Movement in unit holders’ contribution:Creation of units from applications 36,616,006 - 36,616,006Creation of units from distributions 1,596,642 - 1,596,642Cancellation of units (134,509,710) - (134,509,710)Total comprehensive income for the financial period - 1,588,588 1,588,588Distributions (Gross: 0.87 sen/Net: 0.87sen) 7 - (1,596,642) (1,596,642)
Balance as at 30 June 2018 36,248,766 24,920,557 61,169,323
The accompanying summary of significant accounting policies and notes to the unaudited financial statements form an integral part of these unaudited financial statements.
17Client Services : 03-2778 1000
Interim Report

UNAUDITED STATEMENT OF CASH FLOWSFOR THE SIX MONTHS FINANCIAL PERIOD ENDED 30 JUNE 2019
Note
6-months financial
period ended 30.6.2019
6-months financial
period ended 30.6.2018
RM RM
CASH FLOWS FROM OPERATING ACTIVITIESProceeds from sale of investments 34,600,000 3,200,000Purchase of investments (7,991,600) (10,741,274)Interest received 1,364,542 1,807,378Management fee paid (92,330) (220,628)Trustee fee paid (15,388) (28,344)Payment for other fees and expenses (20,924) (41,111)Net cash generated from/(used in) operating activities 27,844,300 (6,023,979)
CASH FLOWS FROM FINANCING ACTIVITIESCash proceeds from units created 2,312,365 36,616,005Payments for cancellation of units (7,395,991) (134,509,710)Distribution paid (1,037) -Net cash used in financing activities (5,084,663) (97,893,705)
NET INCREASE/(DECREASE) IN CASH AND CASH EQUIVALENTS 22,759,637 (103,917,684)
CASH AND CASH EQUIVALENTS AT THE BEGINNING OF THE FINANCIAL PERIOD 26,735,756 145,913,373
CASH AND CASH EQUIVALENTS AT THE END OF THE FINANCIAL PERIOD 8 49,495,393 41,995,689
The accompanying summary of significant accounting policies and notes to the unaudited financial statements form an integral part of these unaudited financial statements.
Client Services : 03-2778 100018
Eastspring Investments Cash Management Fund

SUMMARY OF SIGNIFICANT ACCOUNTING POLICIESFOR THE SIX MONTHS FINANCIAL PERIOD ENDED 30 JUNE 2019
The following accounting policies have been used in dealing with items which are considered material in relation to the financial statements.
A. BASIS OF PREPARATION OF THE FINANCIAL STATEMENTS
The financial statements have been prepared under the historical cost convention in accordance with the Malaysian Financial Reporting Standards (“MFRS”) and International Financial Reporting Standards (“IFRS”), as modified by financial assets at fair value through profit or loss.
The preparation of financial statements in conformity with the MFRS and IFRS requires the use of certain critical accounting estimates and assumptions that affect the reported amounts of assets and liabilities and disclosure of contingent assets and liabilities at the date of the financial statements, and the reported amounts of revenues and expenses during the reported period. It also requires the Manager to exercise their judgment in the process of applying the Fund’s accounting policies. Although these estimates and judgment are based on the Manager’s best knowledge of current events and actions, actual results may differ.
The areas involving a higher degree of judgment or complexity, or areas where assumptions and estimates are significant to the financial statements are disclosed in Note J to the financial statements.
a. Standards, amendments to published standards and interpretations that are effective:
The Fund has applied the following amendments for the first time for the financial year beginning on 1 January 2019:
• Amendments to MFRS 112 ‘Income Taxes’ (effective from 1 January 2019)
clarify that where income tax consequences of dividends on financial instruments classified as equity is recognised (either in profit or loss, other comprehensive income or equity) depends on where the past transactions that generated distributable profits were recognised.
Accordingly, the tax consequences are recognised in profit or loss when an entity determines payments on such instruments are distribution of profits (that is, dividends). Tax on dividend should not be recognised in equity merely on the basis that it is related to a distribution to owners.
This standard is not expected to have a significant impact on the Fund’s financial statements.
19Client Services : 03-2778 1000
Interim Report

B. INCOME RECOGNITION
Interest income from short term deposits with licensed financial institutions is recognised on an accrual basis using the effective interest rate method.
Interest income from unquoted fixed income securities including amortisation of premium and accretion of discount are recognised using the effective interest method.
Realised gain or loss on disposal of unquoted fixed income securities is accounted for as the difference between the net disposal proceeds and the carrying amount of the investments, determined on cost adjusted for accretion of discount or amortisation of premium.
Up till 31 December 2018, when a loans and receivables is impaired, the Fund reduces the carrying amount to its recoverable amount, being the estimated future cash flow discounted at the original effective interest rate of the instrument, and continue unwinding the discount as interest income. Interest income on impaired loans and receivables are recognised using the original effective interest rate.
From 1 January 2019, interest income is calculated by applying the effective interest rate to the gross carrying amount of a financial asset except for financial assets that subsequently become credit-impaired. For credit-impaired financial assets the effective interest rate is applied to the net carrying amount of the financial asset (after deduction of the loss allowance).
C. TAXATION
Current tax expense is determined according to the Malaysian tax laws at the current rate based upon the taxable profit earned during the financial period.
D. PRESENTATION AND FUNCTIONAL CURRENCY
Items included in the financial statements of the Fund are measured using the currency of the primary economic environment in which the Fund operates (the “functional currency”). The financial statements are presented in Ringgit Malaysia (“RM”), which is the Fund’s presentation and functional currency.
Client Services : 03-2778 100020
Eastspring Investments Cash Management Fund

E. FINANCIAL ASSETS AND FINANCIAL LIABILITIES
i. Classification
Up till 31 December 2018, the Fund designates its investment in unquoted fixed income securities as financial assets at fair value through profit or loss at inception.
Financial assets are designated as fair value through profit or loss when they are managed and their performance evaluated on a fair value basis.
Loans and receivables are non-derivative financial assets with fixed or determinable payments that are not quoted in an active market and have been included in current assets.
The Fund’s loans and receivables comprise cash and cash equivalents.
Financial liabilities are classified according to the substance of the contractual arrangements entered into and the definitions of a financial liability.
The Fund classifies accrued management fee, amount due to Trustee and other payables and accruals as other financial liabilities.
From 1 January 2019, the Fund classifies its financial assets in the following measurement categories:
• those to be measured subsequently at fair value (either through other comprehensive income (“OCI”) or through profit or loss), and
• those to be measured at amortised cost
The Fund classifies its investments based on both the Fund’s business model for managing those financial assets and the contractual cash flow characteristics of the financial assets. The portfolio of financial assets is managed and performance is evaluated on a fair value basis. The Fund is primarily focused on fair value information and uses that information to assess the assets’ performance and to make decisions. The contractual cash flows of the Fund’s debt securities are solely principal and interest, however, these securities are neither held for the purpose of collecting contractual cash flows nor held both for collecting contractual cash flows and for sale. The collection of contractual cash flows is only incidental to achieving the Fund’s business model’s objective. Consequently, all investments are measured at fair value through profit or loss.
21Client Services : 03-2778 1000
Interim Report

The Fund classifies cash and cash equivalents as financial assets at amortised cost as these financial assets are held to collect contractual cash flows consisting of the amount outstanding.
The Fund classifies amount due to Manager, accrued management fee, amount due to Trustee and other payables and accruals as financial liabilities measured at amortised cost.
ii. Recognition and measurement
Regular purchases and sales of financial assets are recognised on the trade date, the date on which the Fund commits to purchase or sell the asset and investments are initially recognised at fair value.
Financial liabilities, within the scope of MFRS 139 up to 31 December 2018 and MFRS 9 from 1 January 2019, are recognised in the statement of financial position when, and only when, the Fund becomes a party to the contractual provisions of the financial instrument.
Financial assets are derecognised when the rights to receive cash flows from the investments have expired or have been transferred and the Fund has transferred substantially all risks and rewards of ownership.
Financial liabilities are derecognised when it is extinguished; i.e when the obligation specified in the contract is discharged or cancelled or expired.
Gains or losses arising from changes in the fair value of the “financial assets at fair value through profit or loss” category are presented in the statement of comprehensive income within “net gain/(loss) on financial assets at fair value through profit or loss” in the financial period in which they arise. Any unrealised gains however are not distributable.
Deposits with licensed financial institutions are stated at cost plus accrued interest calculated on the effective interest method over the period from the date of placement to the date of maturity of the respective deposits.
Unquoted fixed income securities are carried at cost and adjusted for any amortisation of premium or accretion of discount from acquisition date to maturity date. The carrying cost is revalued to reflect its fair value on a daily basis using the net present value method based on fair value prices quoted by a bond pricing
Client Services : 03-2778 100022
Eastspring Investments Cash Management Fund

agency (“BPA”) registered with the Securities Commission. Where such quotations are not available or where the Manager is of the view that the price quoted by the BPA for a specific sukuk differs from the market price by more than 20 basis points, the Manager may use the market price, provided that the Manager:
(i) Records its basis for using a non-BPA price;(ii) Obtains necessary internal approvals to use the non-BPA price; and(iii) Keeps an audit trail of all decisions and basis for adopting the market yield.
Loans and receivables and other financial liabilities are subsequently carried at amortised cost using the effective interest method.
iii. Impairment
Up till 31 December 2018, for assets carried at amortised cost, the Fund assesses at the end of the reporting period whether there is objective evidence that a financial asset or group of financial assets is impaired. A financial asset is or a group of financial assets are impaired and impairment losses are incurred only if there is objective evidence of impairment as a result of one or more events that occurred after the initial recognition of the asset (a “loss event”) and that loss event (or events) has an impact on the estimated future cash flows of the financial asset or group of financial assets that can be reliably estimated.
The amount of the loss is measured as the difference between the asset’s carrying amount and the present value of estimated future cash flows (excluding future credit losses that have not been incurred) discounted at the financial asset’s original effective interest rate.
The asset’s carrying amount of the asset is reduced and the amount of the loss is recognised in the statement of comprehensive income. If “loans and receivables” have a variable profit rate, the discount rate for measuring any impairment loss is the current effective interest rate determined under the contract.
As a practical expedient, the Fund may measure impairment on the basis of an instrument’s fair value using an observable market price.
23Client Services : 03-2778 1000
Interim Report

If, in a subsequent period, the amount of the impairment loss decreases and the decrease can be related objectively to an event occurring after the impairment was recognised (such as an improvement in the debtor’s credit rating), the reversal of the previously recognised impairment loss is recognised in the statement of comprehensive income.
When an asset is uncollectible, it is written off against the related allowance account. Such assets are written off after all the necessary procedures have been completed and the amount of the loss has been determined.
From 1 January 2019 onwards, the Fund measures credit risk and expected credit losses using probability of default, exposure at default and loss given default. Management considers both historical analysis and forward looking information in determining any expected credit loss. Management consider the probability of default to be close to zero as these instruments have a low risk of default and the counterparties have a strong capacity to meet their contractual obligations in the near term. As a result, no loss allowance has been recognised based on 12 months expected credit losses as any such impairment would be wholly insignificant to the Fund.
Significant increase in credit risk A significant increase in credit risk is defined by management as any contractual
payment which is more than 30 days past due.
Definition of default and credit-impaired financial assets Any contractual payment which is more than 90 days past due is considered credit
impaired. Write-off The Fund writes off financial assets, in whole or in part, when it has exhausted all
practical recovery efforts and has concluded that there is no reasonable expectation of recovery. The assessment of no reasonable expectation of recovery is based on unavailability of debtor’s sources of income or assets to generate sufficient future cash flows to repay the amount. The Fund may write-off financial assets that are still subject to enforcement activity. Subsequent recoveries of amounts previously written off will result in impairment gains. There are no write-offs/recoveries during the financial year.
Client Services : 03-2778 100024
Eastspring Investments Cash Management Fund

F. CASH AND CASH EQUIVALENTS
For the purpose of the statement of cash flows, cash and cash equivalents comprise bank balance and deposit with a licensed financial institution that are readily convertible to known amounts of cash and which are subject to an insignificant risk of changes in value.
G. UNIT HOLDERS’ CAPITAL
The unit holders’ contributions to the Fund meet the criteria to be classified as equity instruments under MFRS 132 “Financial Instruments: Presentation”. Those criteria include:
• the units entitle the holder to a proportionate share of the Fund’s net assets value;• the units are the most subordinated class and class features are identical;• there is no contractual obligations to deliver cash or another financial asset other
than the obligation on the Fund to repurchase; and• the total expected cash flows from the units over its life are based substantially on
the profit or loss of the Fund.
The outstanding units are carried at the redemption amount that is payable at each financial period if unit holder exercises the right to put the unit back to the Fund.
Units are created and cancelled at prices based on the Fund’s net asset value per unit at the time of creation or cancellation. The Fund’s net asset value per unit is calculated by dividing the net assets attributable to unit holders with the total number of outstanding units.
H. DISTRIBUTIONS
A distribution to the Fund’s unit holders is accounted for as a deduction from realised reserve. A proposed distribution is recognised as a liability in the period in which it is approved by the Trustee of the Fund.
25Client Services : 03-2778 1000
Interim Report

I. SEGMENTAL INFORMATION
Operating segments are reported in a manner consistent with the internal reporting used by chief operating decision-maker. The chief operating decision-maker, who is responsible for allocating resources and assessing performance of the operating segments, has been identified as the Investment Committee of the Fund’s Manager that undertakes strategic decisions for the Fund.
J. CRITICAL ACCOUNTING ESTIMATES AND JUDGMENTS IN APPLYING ACCOUNTING POLICIES
The Fund makes estimates and assumptions concerning the future. The resulting accounting estimates will, by definition, rarely equal the related actual results. To enhance the information contents on the estimates, certain key variables that are anticipated to have material impacts to the Fund’s results and financial position are tested for sensitivity to changes in the underlying parameters.
Estimates and judgments are continually evaluated by the Manager and the Trustee and are based on historical experience and other factors, including expectations of future events that are believed to be reasonable under the circumstances.
In undertaking any of the Fund’s investment, the Manager will ensure that all assets of the Fund under management will be valued appropriately, that is at fair value and in compliance with the SC’s Guidelines on Unit Trust Funds.
Client Services : 03-2778 100026
Eastspring Investments Cash Management Fund

NOTES TO THE UNAUDITED FINANCIAL STATEMENTSFOR THE SIX MONTHS FINANCIAL PERIOD ENDED 30 JUNE 2019
1. INFORMATION ON THE FUND
Eastspring Investments Cash Management Fund (the “Fund”) was constituted
pursuant to the execution of a Master Deed dated 4 May 2001, a Supplemental Deed dated 26 May 2003, a Supplemental Master Deed dated 15 February 2006, a Master Supplemental Deed dated 25 July 2007, and a Second Supplemental Master Deed dated 30 November 2009 between BHLB Trustee Berhad (“BHLB Trustee”) and Eastspring Investments Berhad (the “Manager”). The Fund replaced BHLB Trustee with Deutsche Trustees Malaysia Berhad (the “Trustee”) effective 1 October 2010. A Supplemental Master Deed was entered into between the Manager and the Trustee on 30 July 2010 to effect the change of trustee from BHLB Trustee to the Trustee, followed by a Second Supplemental Master Deed dated 28 January 2011, a Third Supplemental Master Deed dated 9 March 2011, a Fourth Supplemental Master Deed dated 20 January 2012, a Fifth Supplemental Master Deed dated 26 March 2014, a Sixth Supplemental Master Deed dated 2 January 2015, a Seventh Supplemental Master Deed dated 11 July 2016, an Eighth Supplemental Master Deed dated 25 January 2017, a Ninth Supplemental Master Deed dated 11 December 2017 and a Tenth Supplemental Master Deed dated 4 June 2018 (collectively referred to as the “Deed”).
The Fund was launched on 29 May 2003 and will continue its operations until terminated as provided under Part 12 of the Deed.
The main objective of the Fund seeks to provide investors with a high level of liquidity with reasonable returns by investing in a portfolio of money market and other short-term debt securities.
The Manager is a company incorporated in Malaysia and is related to Prudential Plc., a public listed company in the United Kingdom. The principal activity of the Manager is the establishment and management of unit trust funds and asset management.
27Client Services : 03-2778 1000
Interim Report

2. FINANCIAL RISK MANAGEMENT OBJECTIVES AND POLICIES
The Fund is exposed to a variety of risks, which include market risk (inclusive of price risk and interest rate risk), liquidity risk, credit/default risk, fund management risk, non-compliance risk and capital risk.
Financial risk management is carried out through internal control processes adopted by the Manager and adherence to the investment restrictions as stipulated in the Deed.
Financial instruments of the Fund are as follows:
Note
Financial assets at
amortised cost
Financial assets at fair
value through profit or loss Total
RM RM RM
2019
Unquoted fixed income securities 6 - 10,133,030 10,133,030Cash and cash equivalents 8 49,495,393 - 49,495,393
49,495,393 10,133,030 59,628,423
NoteLoans and receivables
Financial assets at fair
value through profit or loss Total
RM RM RM
2018
Unquoted fixed income securities 6 - 19,211,868 19,211,868Cash and cash equivalents 8 41,995,689 - 41,995,689
41,995,689 19,211,868 61,207,557
All liabilities are financial liabilities which are carried at amortised cost.
Client Services : 03-2778 100028
Eastspring Investments Cash Management Fund

Market risk
i. Price risk
Price risk is the risk that the fair value of the investment in unquoted fixed income securities will fluctuate because of changes in market prices (other than those arising from interest rate risk). The value of investments may fluctuate according to the activities of individual companies, sector and overall political and economic conditions. Such fluctuation may cause the Fund’s net asset value and prices of units to fall as well as rise, and income produced by the Fund may also fluctuate.
The price risk is managed through diversification and asset allocation whereby the fixed income securities exposure will be reduced in the event of anticipated market weakness.
The table below shows assets of the Fund as at 30 June which are exposed to price risk:
2019 2018
RM RM
Unquoted fixed income securities designated at fair value through profit or loss* 10,133,030 19,211,868
* Includes interest receivables of RM128,830 (2018: RM178,161).
29Client Services : 03-2778 1000
Interim Report

The table below summarises the sensitivity of the Fund’s profit after tax and net asset value to movements in valuation of securities at the end of each reporting period. The analysis is based on the assumptions that the valuation of the securities increased and decreased by 5% with all other variables held constant. This represents management’s best estimate of a reasonable possible shift in the securities, having regard to the historical volatility of the prices.
% Change in priceMarket
value
Increase/(decrease) in profit after tax and
net asset value
RM RM
2019
+5% 10,504,410 500,210
-5% 9,503,990 (500,210)
2018
+5% 19,985,392 951,685
-5% 18,082,022 (951,685)
ii. Interest rate risk
In general, when interest rates rise, unquoted fixed income securities prices will tend to fall and vice versa. Therefore, the net asset value of the Fund may also tend to fall when interest rates rise or are expected to rise. However, investors should be aware that should the Fund hold an unquoted fixed income securities till maturity, such price fluctuations would dissipate as it approaches maturity, and thus the growth of the net asset value shall not be affected at maturity. In order to mitigate interest rates exposure of the Fund, the Manager will manage the duration of the portfolio via shorter or longer tenured assets depending on the view of the future interest rate trend of the Manager, which is based on its continuous fundamental research and analysis. Investors should note that movement in prices of unquoted fixed income securities and money market instruments are benchmarked against interest rates. As such, the investments are exposed to the movement of the interest rates. It does not in any way suggest that the Fund will invest in conventional financial instruments. All investments carried out for the Fund including placements and deposits are in accordance.
Client Services : 03-2778 100030
Eastspring Investments Cash Management Fund

This risk is crucial in an unquoted securities fund as unquoted fixed income securities portfolio management depends on forecasting interest rate movements. Prices of unquoted fixed income securities move inversely to interest rate movements, therefore as interest rate rise, the prices of unquoted fixed income securities decrease and vice versa. Furthermore, unquoted fixed income securities with longer maturity and lower yield coupon rates are more susceptible to interest rate movements.
Such investments may be subject to unanticipated rise in interest rates which may impair the ability of the issuers to meet obligation under the instrument, especially if the issuers are highly leveraged. An increase in interest rates may therefore increase the potential default by an issuer. The table below summarises the sensitivity of the Fund’s profit after tax and net asset value to movements in interest rate for investments at the end of each reporting period as a result of movement in interest rate. The analysis is based on the assumptions that the interest rate changed by 1% (2018: 1%) with all other variables held constant. This represents management’s best estimate of a reasonable possible shift in the interest rate, having regard to the historical volatility of the interest rate.
2019 2018
% Change in interest rate
Impact on profit after tax/change
in net asset value
Impact on profit after tax/change
in net asset value
RM RM
+1% (2018:+1%) (1,780) (5,635)
-1% (2018:-1%) 1,781 5,638
31Client Services : 03-2778 1000
Interim Report

Liquidity risk
Liquidity risk is the risk that the Fund will encounter difficulty in meeting its financial obligations. Generally, all investments are subject to a certain degree of liquidity risk depending on the nature of the investment instruments, market, sector and other factors.
For the purpose of the Fund, the Manager will attempt to balance the entire portfolio by investing in a mix of assets with satisfactory trading volume and those that occasionally could encounter poor liquidity. This is expected to reduce the risks for the entire portfolio without limiting the Fund’s growth potentials.
The Fund maintains sufficient level of liquid assets, after consultation with the Trustee, to meet anticipated payments and cancellations of units by unit holders. Liquid assets comprise bank balance, deposit with a licensed financial institution and other instruments which are capable of being converted into cash within 7 days.
Client Services : 03-2778 100032
Eastspring Investments Cash Management Fund

The table below summarises the Fund’s financial liabilities into relevant maturity groupings based on the remaining period as at the statement of financial position date to the contractual maturity date. The amounts in the table are the contractual undiscounted cash flows.
Less than 1 month
Between 1 month to 1 year Total
RM RM RM
2019
Amount due to Manager 141,364 - 141,364Accrued management fee 14,624 - 14,624Amount due to Trustee 2,437 - 2,437Other payables and accruals - 22,621 22,621Contractual cash outflows 158,425 22,621 181,046
2018
Accrued management fee 15,464 - 15,464Amount due to Trustee 2,577 - 2,577Other payables and accruals - 20,193 20,193Contractual cash outflows 18,041 20,193 38,234
Credit/Default risk
Credit risk refers to the ability of an issuer or a counter party to make timely payments of profit income, principals and proceeds from realisation of investments. In the case of the Fund, the Manager regularly reviews the ratings assigned to the Issuer so that the necessary steps can be taken if the ratings fall below those prescribed by the Deed.
The credit risk arising from placements of deposits with licensed financial institutions is managed by ensuring that the Fund will only place deposits with reputable licensed financial institutions. The settlement terms of the proceeds from the creation of units receivable from the Manager are governed by the SC’s Guidelines on Unit Trust Funds.
33Client Services : 03-2778 1000
Interim Report

The following table sets out the credit risk concentration and counterparties of the Fund.
Unquoted fixed
income securities
Cash and cash
equivalents TotalRM RM RM
2019
Finance-AAA - 39,404,618 39,404,618-AA1 - 49,131 49,131-AA2 - 5,040,082 5,040,082-AA3 - 5,001,562 5,001,562Unquoted fixed income securities-AA1 5,012,990 - 5,012,990 -AA3 5,120,040 - 5,120,040
10,133,030 49,495,393 59,628,423
2018Finance- AAA - 5,961,078 5,961,078- AA2 - 10,001,836 10,001,836- AA1 - 55,515 55,515- A1 - 25,977,260 25,977,260Unquoted fixed income securities- AA3 9,317,455 - 9,317,455 - AA-IS 5,059,516 - 5,059,516- P1 4,834,897 - 4,834,897
19,211,868 41,995,689 61,207,557
None of these assets are past due or impaired.
Client Services : 03-2778 100034
Eastspring Investments Cash Management Fund

Fund management risk
There is the risk that the management company may not adhere to the investment mandate of the respective Fund. With close monitoring by the investment committee, back office system being incorporated with limits and controls, and regular reporting to the senior management team, the management company is able to manage such risk. The Trustee have an oversight function over management of the Fund by the management company to safeguard the interests of unit holders.
Non-compliance risk
Non-compliance risk arises when the Manager and others associated with the Fund do not comply to the rules set out in the Fund’s constitution or the law that governs the Fund or applicable internal control procedures, or act fraudulently or dishonestly.
The non-compliance may expose the Fund to higher risks which may result in a fall in the value of the Fund which in turn may affect its investment goals. However, the risk can be mitigated by the internal controls and compliance monitoring undertaken by the Manager.
Capital risk
The capital of the Fund is represented by equity consisting of unit holders’ capital of RM34,556,465 (2018: RM36,248,766) and retained earnings of RM24,890,912 (2018: RM24,920,557). The amount of equity can change significantly on a daily basis as the Fund is subject to daily subscriptions and redemptions at the discretion of unit holders. The Fund’s objective when managing capital is to safeguard the Fund’s ability to continue as a going concern in order to provide returns for unit holders and benefits for other stakeholders and to maintain a strong capital base to support the development of the investment activities of the Fund.
35Client Services : 03-2778 1000
Interim Report

Fair value estimation
Fair value is defined as the price that would be received to sell an asset or paid to transfer a liability in an orderly transaction between market participants at the measurement date (i.e. an exit price).
The fair value of financial assets traded in active market (such as trading securities) are based on quoted market prices at the close of trading on the period end date. The Fund utilises the last traded market price for financial assets where the last traded price falls within the bid-ask spread. In circumstances where the last traded price is not within the bid-ask spread, the Manager will determine the point within the bid-ask spread that is representative of the fair value.
An active market is a market in which transactions for the asset or liability take place with sufficient frequency and volume to provide pricing information on an ongoing basis.
The fair value of financial assets that are not traded in an active market is determined by using valuation techniques.
Client Services : 03-2778 100036
Eastspring Investments Cash Management Fund

Fair value hierarchy
i. The table below analyses financial instruments carried at fair value by valuation method. The different levels have been defined as follows:
• Level 1: Quoted prices (unadjusted) in active market for identical assets or liabilities.
• Level 2: Inputs other than quoted prices included within Level 1 that are observable for the asset or liability, either directly (that is, as prices) or indirectly (that is, derived from prices).
• Level 3: Inputs for the asset and liability that are not based on observable market data (that is, unobservable inputs).
The level in the fair value hierarchy within which the fair value measurement is categorised in its entirety is determined on the basis of the lowest level input that is significant to the fair value measurement in its entirety. For this purpose, the significance of an input is assessed against the fair value measurement in its entirety. If a fair value measurement uses observable inputs that require significant adjustment based on unobservable inputs, that measurement is a Level 3 measurement.
Assessing the significance of a particular input to the fair value measurement in its entirety requires judgment, considering factors specific to the asset or liability. The determination of what constitutes “observable” requires significant judgement by the Fund. The Fund considers observable data to be that market data that is readily available, regularly distributed or updated, reliable and verifiable, not proprietary, and provided by independent sources that are actively involved in the relevant market.
37Client Services : 03-2778 1000
Interim Report
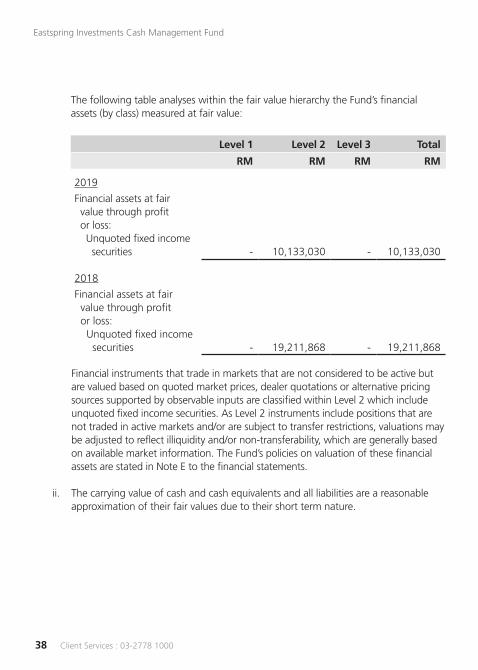
The following table analyses within the fair value hierarchy the Fund’s financial assets (by class) measured at fair value:
Level 1 Level 2 Level 3 Total
RM RM RM RM
2019
Financial assets at fair value through profit or loss: Unquoted fixed income securities - 10,133,030 - 10,133,030
2018
Financial assets at fair value through profit or loss: Unquoted fixed income securities - 19,211,868 - 19,211,868
Financial instruments that trade in markets that are not considered to be active but are valued based on quoted market prices, dealer quotations or alternative pricing sources supported by observable inputs are classified within Level 2 which include unquoted fixed income securities. As Level 2 instruments include positions that are not traded in active markets and/or are subject to transfer restrictions, valuations may be adjusted to reflect illiquidity and/or non-transferability, which are generally based on available market information. The Fund’s policies on valuation of these financial assets are stated in Note E to the financial statements.
ii. The carrying value of cash and cash equivalents and all liabilities are a reasonable approximation of their fair values due to their short term nature.
Client Services : 03-2778 100038
Eastspring Investments Cash Management Fund

3. MANAGEMENT FEE
In accordance with the Deed, the Manager is entitled to a management fee at a rate not exceeding 2.00% per annum on the net asset value of the Fund calculated on daily basis.
For the financial period ended 30 June 2019, the management fee is recognised at a rate of 0.30% (2018: 0.50%) per annum on the net asset value of the Fund, calculated on daily basis.
There will be no further liability to the Manager in respect of the management fee other than the amounts recognised above.
4. TRUSTEE FEE
In accordance with the Deed, the Trustee is entitled to an annual fee, inclusive of custodian fee, at a rate not exceeding 0.20% per annum on the net asset value of the Fund, subject to a minimum fee of RM18,000 per annum.
For the financial period ended 30 June 2019, the Trustee fee is recognised at a rate of 0.05% (2018: 0.05%) per annum on the net asset value of the Fund, inclusive of local custodian fee, calculated on daily basis.
There will be no further liability to the Trustee in respect of the Trustee fee other than the amounts recognised above.
39Client Services : 03-2778 1000
Interim Report

5. TAXATION
6-months financial
period ended 30.6.2019
6-months financial
period ended 30.6.2018
RM RM
Tax charged for the financial period: Current taxation - local - -
The numerical reconciliation between profit before taxation multiplied by the Malaysian statutory tax rate and tax expense of the Fund is as follows:
6-months financial
period ended 30.6.2019
6-months financial
period ended 30.6.2018
RM RM
Profit before taxation 996,852 1,588,588
Tax at Malaysian statutory rate of 24% 239,244 381,261
Tax effects of: Investment income exempt from tax (269,835) (435,196) Expenses not deductible for tax purposes 7,875 13,049 Restriction on tax deductible expenses for Unit Trust Funds 22,716 40,886
Taxation - -
Client Services : 03-2778 100040
Eastspring Investments Cash Management Fund

6. FINANCIAL ASSETS AT FAIR VALUE THROUGH PROFIT OR LOSS
2019 2018
RM RM
Designated at fair value through profit or loss: Unquoted fixed income securities 10,133,030 19,211,868
Net loss on financial assets at fair value through profit or loss: Realised loss on disposals - (51,279) Change in unrealised fair value loss (10,805) (6,326)
(10,805) (57,605)
Name of counterNominal
valueAggregate
cost
Fair value as at
30.6.2019
Percentage of net asset
value of the Fund
RM RM RM %
4.99% RHB Bank Berhad 08.07.2024 (AA3) 5,000,000 5,119,607 5,120,040 8.61
3.80% CIMB Group Holdings Berhad 12.06.2020 (AA1) 5,000,000 5,009,890 5,012,990 8.43
TOTAL UNQUOTED FIXED INCOME SECURITIES 10,000,000 10,129,497 10,133,030 17.04
ACCUMULATED UNREALISED GAIN ON FINANCIAL ASSETS AT FAIR VALUE THROUGH PROFIT OR LOSS 3,533
FAIR VALUE OF FINANCIAL ASSETS AT FAIR VALUE THROUGH PROFIT OR LOSS 10,133,030
41Client Services : 03-2778 1000
Interim Report

Name of counterNominal
valueAggregate
cost
Fair value as at
30.6.2018
Percentage of net asset
value of the Fund
RM RM RM %
5.25% Bumitama Agri Ltd 18.03.2019 (AA3) 5,000,000 5,101,993 5,100,195 8.349.05% Jimah Energy Ventures Sdn Berhad 10.05.2019 (AA3) 300,000 315,732 315,536 0.528.85% Jimah Energy Ventures Sdn Berhad 12.11.2018 (AA3) 3,500,000 3,598,851 3,599,366 5.880% Perbadanan Kemajuan Negeri Selangor 01.04.2019 (P1) 5,000,000 4,834,897 4,834,897 7.904.45% Perbadanan Kemajuan Negeri Selangor 26.10.2018 (AA3) 300,000 302,406 302,358 0.494.81% Quantum Solar Park (Semenanjung) Sdn Berhad 05.04.2019 (AA-IS) 5,000,000 5,062,600 5,059,516 8.27
TOTAL UNQUOTED FIXED INCOME SECURITIES 19,100,000
19,216,479
19,211,868 31.40
ACCUMULATED UNREALISED LOSS ON FINANCIAL ASSETS AT FAIR VALUE THROUGH PROFIT OR LOSS
(4,611)
FAIR VALUE OF FINANCIAL ASSETS AT FAIR VALUE THROUGH PROFIT OR LOSS 19,211,868
Client Services : 03-2778 100042
Eastspring Investments Cash Management Fund

The effective weighted average interest rate of unquoted fixed income securities per annum as at the date of the statement of financial position are as follows:
2019 2018
% %
Unquoted fixed income securities 3.74 4.53
7. DISTRIBUTIONS
Distributions to unit holders are from the following sources:
2019 2018
RM RM
Interest income earned 12,739 24,061Amortisation of premiums net of accretion of discounts (344) (846)Previous years realised income 1,037,069 2,650,640Distribution equalisation (42,381) (1,074,125)Gross realised income 1,007,083 1,599,730
Less: Expenses (1,337) (3,088)1,005,746 1,596,642
43Client Services : 03-2778 1000
Interim Report

During the financial period, distributions were made as follows:
Gross/net distribution
Ex-date 2019 2018
RM/Units RM/Units
7January/8 January 0.0015 0.00147 February/6 February 0.0015 0.00156 March 0.0017 0.00148 April/6 April 0.0014 0.00156 May/7 May 0.0015 0.00157 June/6 June 0.0013 0.0014
0.0089 0.0087
Gross distribution is derived using total income less total expenses. The distribution is made from prior year’s realised income.
Gross distribution per unit is derived from gross realised income less expenses divided by the number of units in circulation, while net distribution per unit is derived from gross realised income less expenses and taxation divided by the number of units in circulation.
Client Services : 03-2778 100044
Eastspring Investments Cash Management Fund
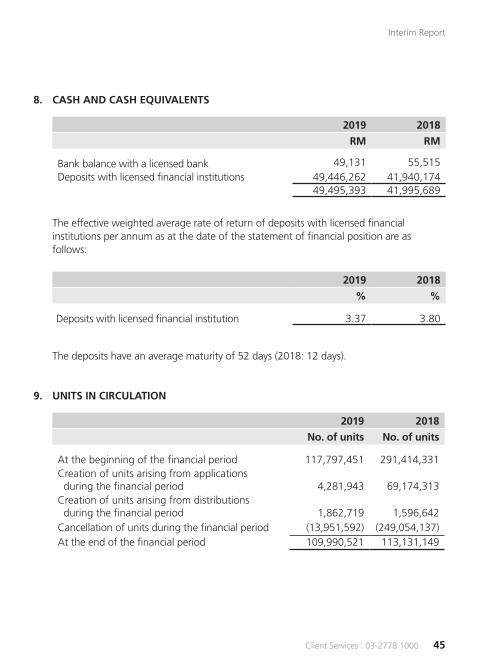
8. CASH AND CASH EQUIVALENTS
2019 2018
RM RM
Bank balance with a licensed bank 49,131 55,515Deposits with licensed financial institutions 49,446,262 41,940,174
49,495,393 41,995,689
The effective weighted average rate of return of deposits with licensed financial institutions per annum as at the date of the statement of financial position are as follows:
2019 2018
% %
Deposits with licensed financial institution 3.37 3.80
The deposits have an average maturity of 52 days (2018: 12 days).
9. UNITS IN CIRCULATION
2019 2018
No. of units No. of units
At the beginning of the financial period 117,797,451 291,414,331Creation of units arising from applications during the financial period 4,281,943 69,174,313Creation of units arising from distributions during the financial period 1,862,719 1,596,642Cancellation of units during the financial period (13,951,592) (249,054,137)At the end of the financial period 109,990,521 113,131,149
45Client Services : 03-2778 1000
Interim Report

10. TRANSACTIONS WITH DEALERS
Details of transactions with the dealers are as follows:
Name of dealersValue of
trades
Percentage of total
tradesBrokerage
fees
Percentage of total
brokerage fees
RM % RM %
2019
Alliance Bank Malaysia Berhad 2,991,600 37.43 - -CIMB Bank Berhad 5,000,000 62.57 - - 7,991,600 100.00 - -
2018Ambank (M) Berhad 5,040,000 46.92 - -Ambank Islamic Berhad 4,785,479 44.55 - -RHB Investment Bank Berhad 915,795 8.53 - -
10,741,274 100.00 - -
All dealers highlighted above are not related to the Manager. There are no brokerage fees charged by the dealers for the financial period ended 30 June 2019 and 30 June 2018.
Client Services : 03-2778 100046
Eastspring Investments Cash Management Fund

11. MANAGEMENT EXPENSE RATIO (“MER”)
2019 2018
% %
MER 0.21 0.23
MER is derived from the following calculation:
MER = (A + B + C + D + E)X 100
F
A = Management fee
B = Trustee fee
C = Audit fee
D = Tax agent fee
E = Other expenses
F = Average net asset value of the Fund calculated on a daily basis
The average net asset value of the Fund for the financial period calculated on a daily basis is RM60,956,741 (2018: RM96,192,634).
12. PORTFOLIO TURNOVER RATIO (“PTR”)
2019 2018
PTR (times) 0.07 0.06
PTR is derived from the following calculation:
(Total acquisitions for the financial period + total disposals for the financial period) ÷ 2
Average net asset value of the Fund for the financial period calculated on a daily basis
where:total acquisitions for the financial period = RM7,991,600 (2018: RM10,741,274)total disposals for the financial period = RM Nil (2018: Nil)
47Client Services : 03-2778 1000
Interim Report

13. UNITS HELD BY THE MANAGER
The related party of and its relationship with the Fund is as follows:
Related party Relationship
Eastspring Investments Berhad The Manager
2019 2018
No. of units RM No. of units RM
Eastspring Investments Berhad 1,292 698 1,249 675
The above units were transacted at the prevailing market price.
The units are held legally by the Manager and are within the prescribed limit allowed by SC’s Guidelines on Unit Trust Funds. Other than the above, there were no units held by the Directors or parties related to the Manager.
14. SEGMENTAL INFORMATION
The internal reporting provided to the chief operating decision-maker for the Fund’s assets, liabilities and performance is prepared on a consistent basis with the measurement and recognition principles of MFRS and IFRS. The chief operating decision-maker is responsible for the performance of the Fund and considers the business to have a single operating segment located in Malaysia. Asset allocation decisions are based on a single, integrated investment strategy and the Fund’s performance is evaluated on an overall basis.
The reportable operating segments derive their income by seeking investments to achieve targeted returns with an acceptable level of risk within each portfolio. These returns consist of interest and gains on the appreciation in the value of investments.
The Fund has a diversified unit holder population As at 30 June 2019, there were 2 unit
holders (2018: 2 unit holders) who held more than 10% of the Fund’s NAV. The unit holders’ holdings were 41.94% and 17.67% (2018: 39.10% and 16.74%).
There were no changes in the reportable operating segments during the financial period.
Client Services : 03-2778 100048
Eastspring Investments Cash Management Fund

15. MFRS 9 FINANCIAL INSTRUMENTS
As disclosed in Note A, the Fund has adopted MFRS 9, which resulted in changes to the accounting policies and adjustments to the financial position. The main changes are as follows.
i. Classification and measurement of financial assets
Up to 31 December 2018, financial assets were classified in the following categories: financial assets at fair value through profit or loss (“FVTPL”) and loans and receivables. Note E sets out the details of accounting policies for classification and measurement of financial instruments under MFRS 139.
From 1 January 2019, the Fund has applied the following MFRS 9’s classification approach to all types of financial assets:
• Investments in debt instruments: There are 3 subsequent measurement categories: amortised cost, fair value with changes either recognised through other comprehensive income (“FVOCI”) or through profit or loss (“FVTPL”).
ii. Impairment
From 1 January 2019 onwards, the Fund measures credit risk and expected credit losses using probability of default, exposure at default and loss given default. Management considers both historical analysis and forward looking information in determining any expected credit loss. Management consider the probability of default to be close to zero as these instruments have a low risk of default and the counterparties have a strong capacity to meet their contractual obligations in the near term. As a result, no loss allowance has been recognised based on 12 months expected credit losses as any such impairment would be wholly insignificant to the Fund.
Significant increase in credit risk A significant increase in credit risk is defined by management as any contractual
payment which is more than 30 days past due.
49Client Services : 03-2778 1000
Interim Report
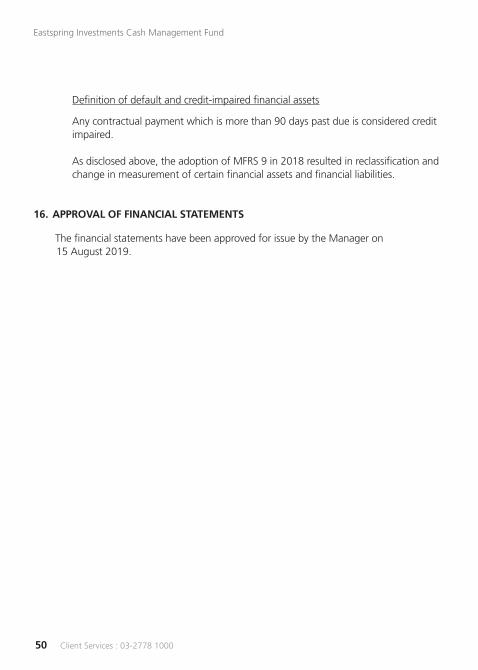
Definition of default and credit-impaired financial assets Any contractual payment which is more than 90 days past due is considered credit
impaired. As disclosed above, the adoption of MFRS 9 in 2018 resulted in reclassification and
change in measurement of certain financial assets and financial liabilities.
16. APPROVAL OF FINANCIAL STATEMENTS
The financial statements have been approved for issue by the Manager on 15 August 2019.
Client Services : 03-2778 100050
Eastspring Investments Cash Management Fund

51Client Services : 03-2778 1000
Interim Report
CORPORATE DIRECTORY
THE MANAGERNAME
EASTSPRING INVESTMENTS BERHAD
COMPANY NO.
531241-U
REGISTERED OFFICE
Level 25, Menara Hong Leong
No. 6, Jalan Damanlela
Bukit Damansara
50490 Kuala Lumpur
BUSINESS OFFICE
Level 22, Menara Prudential
Persiaran TRX Barat
55188 Tun Razak Exchange
Kuala Lumpur
TELEPHONE NO.
603-2778 3888
FAX NO.
603-2789 7220
WEBSITE
www.eastspring.com/my
TRUSTEENAME
DEUTSCHE TRUSTEES MALAYSIA BERHAD
COMPANY NO.
763590-H
REGISTERED OFFICE & BUSINESS OFFICE
Level 20, Menara IMC
No. 8, Jalan Sultan Ismail
50250 Kuala Lumpur
TELEPHONE NO.
603-2053 7522
FAX NO.
603-2053 7526
SALE & PURCHASE OF UNITSEastspring Investments BerhadLevel 22, Menara Prudential
Persiaran TRX Barat
55188 Tun Razak Exchange
Kuala Lumpur
TELEPHONE NO.
603-2778 1000
FAX NO.
603-2789 7225

Client Services : 03-2778 100052
Eastspring Investments Cash Management Fund
BRANCHESPetaling JayaEastspring Investments Berhad
A-17-P1 & M
Block A, Jaya One
72A, Jalan Universiti
46200 Petaling Jaya, Selangor
TELEPHONE NO.
603-7948 1288
Kota KinabaluEastspring Investments Berhad
Suite E3, 9th Floor
CPS Tower, Centre Point Sabah
No. 1, Jalan Centre Point
88000 Kota Kinabalu, Sabah
TELEPHONE NO.
6088-238 613
ENQUIRIESCLIENT SERVICES
603-2778 1000

FOR THE SIX MONTHS FINANCIAL PERIOD ENDED 30 JUNE 2019
INTERIM REPORT
EASTSPRING INVESTMENTSCASH MANAGEMENT FUND
Eastspring Investments Berhad (531241-U)
Level 22, Menara Prudential, Persiaran TRX Barat55188 Tun Razak Exchange, Kuala LumpurT: (603) 2778 3888 F: (603) 2789 7220eastspring.com/my
Client ServicesT: (603) 2778 [email protected]