east contra costa county habitat conservation … repo… · hcp/nccp habitat conservation plan/...
TRANSCRIPT

East Contra Costa County Habitat Conservation Plan/Natural Community Conservation Plan
Annual Report 2010
March 2011

(This page intentionally left blank.)

East Contra Costa County Habitat Conservancy Page i
TABLE OF CONTENTS Page
East Contra Costa County HCP/NCCP 2010 Annual Report
Table of Contents ..................................................................................................................... i
List of Tables ....................................................................................................................................ii
List of Figures ..................................................................................................................................iii
Acronyms and Abbreviations..........................................................................................................iv
Executive Summary .............................................................................................................ES‐1
I. Introduction ..................................................................................................................... 1
East Contra Costa County HCP/NCCP Background ......................................................................... 1
Annual Report ................................................................................................................................. 2
II. Covered Activities and Impacts......................................................................................... 5
Covered Activities Receiving Take Coverage .................................................................................. 5
Conditions on Covered Activities.................................................................................................... 5
Impacts on Land‐Cover Types and Covered Plants......................................................................... 6
III. Land Acquisition............................................................................................................... 7
Preserve System.............................................................................................................................. 7
New Preserve System Acquisitions................................................................................................. 9
IV. Habitat Restoration and Creation....................................................................................15
Wetlands and Streams.................................................................................................................. 15
Alkali Wetlands ............................................................................................................................. 15
Mitigation and Contribution to Recovery…………………... .............................................................. 15
Irish Canyon Riparian Restoration Project .................................................................................. 16
Lentzner Springs Wetland Restoration Project ............................................................................ 17
Vasco Caves Souza I Pond Project................................................................................................. 18
Souza II Wetland Restoration Project (Phase I) ............................................................................ 19
V. Preserve Management ....................................................................................................22
VI. Monitoring, Research, and Adaptive Management .........................................................24
Monitoring .................................................................................................................................... 24
Directed Research......................................................................................................................... 26
Adaptive Management ................................................................................................................. 26
VII. Stay‐Ahead Provision ......................................................................................................27
VIII. Changed Circumstances and Remedial Measures ............................................................28
IX. Finances ..........................................................................................................................29
Budget........................................................................................................................................... 29

East Contra Costa County HCP/NCCP 2010 Annual Report
East Contra Costa County Habitat Conservancy Page ii
X. Program Administration ..................................................................................................31
Minor and Major Amendments .................................................................................................... 31
Implementation Policies ............................................................................................................... 31
List of Preparers .....................................................................................................................32
East Contra Costa County Habitat Conservancy........................................................................... 32
ICF International ........................................................................................................................... 32
Appendix A: Glossary...........................................................................................................A‐1
Definitions of Key Terms and Concepts .......................................................................................A‐1
List of Tables Follows Page
1. Reporting Period Summary of Covered Activities ...................................................................... 6
2. Reporting Period Summary of Natural Community and Landscape‐level Conditions on Covered Activities by Project .............................................................................................. 6
3. Reporting Period Summary of Species‐level Conditions on Covered Activities by Project ................................................................................................................................. 6
4. Reporting Period and Cumulative Impacts on Land‐Cover Types from Covered Activities and Conservation Measure Implementation...................................................... 6
5. Reporting Period and Cumulative Impacts on Covered Plants................................................... 6
6. Impacts on Aquatic and Stream Land‐Cover Types by Watershed: Reporting Period and Cumulative ................................................................................................................... 6
8. Summary of Natural Community Protection, Restoration and Creation by Land‐Cover Type..................................................................................................................................... 8
9. Cumulative Summary of Progress towards Fulfilling Jurisdictional Wetland and Waters Requirements..................................................................................................................... 8
10. Reporting Period and Cumulative Conservation of Covered Plants......................................... 8
11. Achievement of Zone‐Specific Land Acquisition Requirements: Reporting Period and Cumulative Summary.......................................................................................................... 8
12. Aquatic and Stream Land‐Cover Restoration and Creation by Watershed............................ 21
13. Success Criteria for Restoration and Creation Projects.......................................................... 21
14. Stay‐Ahead Assessment: Land Cover...................................................................................... 27
15. Stay‐Ahead Assessment: Plants .............................................................................................. 27

East Contra Costa County HCP/NCCP 2010 Annual Report
East Contra Costa County Habitat Conservancy Page iii
16. Approved 2010 Conservancy Budget...................................................................................... 30
17. 2010 Year‐End Budget Status ................................................................................................. 30
18. Grants Awarded for ECCC HCP/NCCP Implementation .......................................................... 30
19. HCP/NCCP Fees, Contributions to Recovery and Administrative Costs Reimbursement Received in 2010 .................................................................................... 30
List of Figures Follows Page
ES‐1. Stay Ahead Compliance .................................................................................................... ES‐4
ES‐2. Detailed Comparison of Conservation, Conservation Requirements, Impacts and Impact Limits (Terrestrial).............................................................................................. ES‐4
ES‐3. Detailed Comparison of Conservation, Conservation Requirements, Impacts and Impact Limits (Aquatic) .................................................................................................. ES‐4
ES‐4. Progress Toward Assembling the Preserve System.......................................................... ES‐4
1. East Contra Costa County Habitat Conservation Plan Inventory Area ....................................... 4
2. Initial Urban Development Area and Location of Covered Rural Infrastructure Projects.......... 6
3. Location of Covered Activities .................................................................................................... 6
4. Acquisition Zones and Subzones................................................................................................. 8
5. Acquisition Priorities with Initial Urban Development Area ...................................................... 8
6. Acquisition Priorities with Maximum Urban Development Area ............................................... 8
7. Preserve System to Date ............................................................................................................ 8
8. Vaquero Farms North: Land Cover Map................................................................................... 11
9. Vaquero Farms North: Representative Photographs ............................................................... 11
10. Ang: Land Cover Map.............................................................................................................. 11
11. Ang: Representative Photographs .......................................................................................... 11
12. Martin: Land Cover Map......................................................................................................... 12
13. Martin: Representative Photographs ..................................................................................... 12
14. Grandma’s Quarter: Land Cover Map..................................................................................... 13
15. Grandma’s Quarter: Representative Photographs................................................................. 13
16. Souza III: Land Cover Map....................................................................................................... 13
17. Souza III: Representative Photographs................................................................................... 13
18. Irish Canyon: Land Cover Map ................................................................................................ 14

East Contra Costa County HCP/NCCP 2010 Annual Report
East Contra Costa County Habitat Conservancy Page iv
19. Irish Canyon: Representative Photographs ............................................................................ 14
20. Habitat Restoration and Creation to Date.............................................................................. 21
Acronyms and Abbreviations CDFG California Department of Fish and Game
CNDDB California Natural Diversity Database
Conservancy East Contra Costa County Habitat Conservancy
EBRPD East Bay Regional Park District
ESA Endangered Species Act
HCP/NCCP Habitat Conservation Plan/ Natural Community Conservation Plan
NCCPA Natural Community Conservation Planning Act
Permittees Contra Costa County, Contra Costa County Flood Control and Water Conservation District, City of Brentwood, City of Clayton, City of Oakley, City of Pittsburg, East Bay Regional Park District, and East Contra Costa County Habitat Conservancy
Plan East Contra Costa County Habitat Conservation Plan/Natural Community Conservation Plan
USFWS U.S. Fish and Wildlife Service

East Contra Costa County Habitat Conservancy Page ES‐1
EXECUTIVE SUMMARY Eastern Contra Costa County is a unique region where the San Francisco Bay Area, Sacramento–San Joaquin River Delta, and Central Valley meet. It features a rich landscape that is home to a number of rare plants and animals. Located east of San Francisco, the area’s convenient location, natural beauty, and mild climate have led to rapid population growth. Contra Costa County’s population is predicted to grow by 127,000 people by 2025, and a significant portion of this growth will occur in Eastern Contra Costa County which supports suitable habitat for many state and federally listed endangered species.
Between 2001 and 2006, the East Contra Costa County Habitat Conservation Plan Association developed the East Contra Costa County Habitat Conservation Plan/Natural Community Conservation Plan (HCP/NCCP; or Plan) in cooperation with the U.S. Fish and Wildlife Service (USFWS) and the California Department of Fish and Game (CDFG). The Plan was developed to comply with the federal Endangered Species Act (ESA) and California’s Natural Community Conservation Planning Act (NCCPA). The Plan provides regional conservation and development guidelines that protect natural resources while improving and streamlining the permit process for state and federally listed species and impacts to regulated wetlands. The Plan was approved by participating local jurisdictions in 2006 and permits were issued by the USFWS and the CDFG in 2007 (permit numbers 1‐1‐07‐F‐2007 and 2835‐2007‐001‐01, respectively). The Plan allows the Permittees, Contra Costa County (County), the Cities of Brentwood, Clayton, Oakley, and Pittsburg, the East Contra Costa County Habitat Conservancy (Conservancy), the Contra Costa County Flood Control and Water Conservation District (County Flood Control District) and the East Bay Regional Park District (EBRPD), to control endangered species permitting for activities and projects in the region1 while providing comprehensive species, wetlands, and ecosystem conservation and contributing to the recovery of endangered species in northern California.
1 The participating cities and the County control endangered species permitting for projects they perform as well as projects by other entities that they approve. The Conservancy, County Flood Control District and EBRPD control endangered species permitting for projects they perform. The Conservancy also controls endangered species permitting for projects not subject to the land use authority of the Cities or the County (e.g. utility projects).

East Contra Costa County HCP/NCCP 2010 Annual Report
East Contra Costa County Habitat Conservancy Page ES‐2
Within the 174,018‐acre inventory area, the permits issued provide take authorization under the federal ESA and state NCCPA for between 8,670 acres and 11,853 acres of urban development and 1,126 acres of rural infrastructure projects. The primary means to offset these impacts is to conserve lands in a Preserve System. The Preserve System will encompass 23,800 acres to 30,300 acres of land that will be managed for the benefit of 28 covered species as well as the natural communities that they, and hundreds of other species, depend on for habitat. The Plan proactively addresses the long‐term conservation needs in the region by ‐strengthening local control over land use and providing greater flexibility in meeting other needs such as housing, transportation, and economic growth.
The Conservancy was created to serve as the “Implementing Entity” for the Plan and is responsible for ensuring preserve assembly, habitat restoration and for coordinating overall Plan implementation. This is the second Annual Report prepared by the Conservancy. This Annual Report summarizes implementation activities undertaken between January 1, 2010 to December 31, 2010 per the conditions of the Plan and Implementing Agreement.
Covered Activities Nine projects received take coverage under the Plan in 2010, including three urban development projects and six rural infrastructure projects, totaling approximately 13.5 acres of permanent impacts and 48.9 acres of temporary impacts.
As required by the HCP/NCCP, impacts resulting from covered activities were tracked by land‐cover type and covered plant occurrences. Impacts to aquatic and stream land‐cover types were tracked by watershed. Impacts on aquatic land‐cover types during the reporting period were limited to the Kellogg watershed and the Brushy watershed.
Land Acquisition and Stay-Ahead The first three years of Plan implementation resulted in significant progress toward acquisition goals (see Figures ES‐1 through ES‐4). To date, 13 properties have been acquired for the Preserve System totaling over 6,000 acres. This includes six properties in 2010 and three properties acquired by EBRPD without initial Conservancy involvement. All acquisitions to date have been completed in partnership with EBRPD (i.e. EBRPD will own and manage these Preserve System lands). Highlights of the acquisitions include the following achievements:
• More than 3,600 acres of annual grassland preserved.

East Contra Costa County HCP/NCCP 2010 Annual Report
East Contra Costa County Habitat Conservancy Page ES‐3
• Oak woodland preservation requirement exceeded by 5%.
• 34% of the oak savanna preservation requirements achieved.
• 31% of pond and 17% of alkali wetland preservation requirements achieved.
• 50% of covered plant occurrence preservation requirements achieved.
• intermittent and ephemeral stream preservation requirements achieved.
• Occupied or suitable habitat provided for at least 20 of the 28 covered species.
The Conservancy is in compliance with the Plan’s Stay‐Ahead Provision. As shown in Table ES‐1, the Conservancy has made substantial progress in the first three years of implementation toward many of the Plan’s Year‐30 conservation requirements. For example, all of the oak woodland required to be conserved during the Plan has already been conserved. There have been no impacts to oak woodland, so each acre of oak woodland conserved to date is in excess of the Stay Ahead requirement. Conservation of other land cover types is less ahead (see Tables ES‐2 and ES‐3 for details). Likewise, the Stay Ahead Provision only reflects land cover requirements and does not reflect geographical requirements intended to ensure Preserve System connectivity. As shown in Table ES‐4, the Conservancy is ahead of the average pace necessary to assemble the 30,300‐acre Preserve System estimated to be required by Year 30, but it still has a long way to go.
Habitat Restoration and Creation The Plan requires stream and wetland restoration and pond creation to compensate for impacts on streams, wetlands, and ponds covered by the Plan. Over the 30‐year life of the Plan, the Conservancy anticipates restoring or creating as much as 500 acres of wetlands and ponds, and 6 miles of streams (this figure assumes a worst case scenario for impacts; the
ultimate requirement may be much less). The Conservancy has been aggressively pursuing the wetlands and pond restoration requirements. During the reporting period, the Conservancy completed one restoration project at Irish Canyon. This project was performed by Save Mount Diablo staff and volunteers and involved planting more than 400 valley oak acorns and buckeye nuts in a denuded stream corridor. To date, four restoration projects have been initiated.

East Contra Costa County HCP/NCCP 2010 Annual Report
East Contra Costa County Habitat Conservancy Page ES‐4
The Conservancy anticipates that when mature, these four restoration projects will successfully have restored or created:
• 0.4 acre of alkali grassland.
• 0.4 acre of native grassland.
• 0.1 acre of alkali wetlands.
• 7.7 acres of seasonal wetland.
• 0.2 acres of perennial wetlands.
• 0.9 acres of riparian woodland.
• 0.3 acres of ponds.
• 3,318 feet of intermittent ephemeral stream.
These restoration projects provide a range of benefits to covered species. Components of the restoration projects have been specifically designed to benefit California red‐legged frog, vernal pool fairy shrimp (and other covered branchiopods), and alkali plant species such as brittlescale and spearscale.
Coordinated Wetland Permitting The HCP/NCCP was designed to facilitate not only endangered species permitting but also to one day support regional permitting under state and federal laws for impacts on jurisdictional wetlands and waters. The interest in integrating federal and state wetland permitting into the HCP/NCCP process is the same as the articulated purpose of the Plan—to benefit stream and wetland resources by conserving these resources in a more coordinated and comprehensive fashion on a regional scale and to provide an integrated, coordinated approach to permitting in lieu of the often inefficient and costly project‐by‐project approach.
Discussion with U.S. Army Corps of Engineers, U.S. Environmental Protection Agency, State Water Resources Control Board, the Regional Water Quality Control Boards, CA Department of Fish and Game and the U.S. Fish and Wildlife Service is ongoing regarding this parallel approach to compliance with wetlands regulations and reliance on the avoidance, minimization, and mitigation measures in the HCP/NCCP as the basis for regional wetlands permitting programs. In 2010, the U.S. Army Corps of Engineers assumed a critical leadership role, developing a potential Regional General Permit related to the HCP/NCCP and reaching out to other wetland regulatory agencies to pursue means for coordinating such a permit with other laws and regulations. In 2010, the Conservancy also prepared and submitted a Prospectus for an In Lieu Fee Program to be considered for approval by the Corps. Such approval would sanction payment of HCP/NCCP fees as suitable mitigation under Corps permits and with the proposed Regional General Permit would achieve significant integration of wetland and species regulations.
Funding The Conservancy has successfully pursued grants. Various federal, state and private funding sources have generously approved or awarded a total of $39,952,685 in grant funding since Plan inception, of which $11,726,928 was spent during the reporting period for Conservancy activities. Most grant funding awarded will be spent in future years. Fees, contributions to recovery and administrative cost reimbursements received in 2010 totaled $837,587. In addition, EBRPD contributions toward joint acquisitions totaled $4,679,876 in 2010.

Thi
s is
a g
raph
ical
rep
rese
ntat
ion
of d
ata
in T
able
14.
The
cha
rt c
ompa
res
the
pace
of
cons
erva
tion
to th
e pa
ce o
f im
pact
s ac
cord
ing
to th
e sp
ecif
ic g
uide
lines
set
for
th in
the
Stay
Ahe
ad P
rovi
sion
.T
he g
reen
bar
s sh
ow th
e pe
rcen
t of
the
acqu
isiti
on r
equi
rem
ents
for
the
vari
ous
land
cov
er ty
pes
that
hav
e be
en a
chie
ved
to d
ate.
The
yel
low
bar
s sh
ow th
e pe
rcen
t of
impa
ct li
mits
that
hav
e be
en u
sed
up.
To
com
ply
with
the
Stay
Ahe
ad P
rovi
sion
, for
terr
estr
ial h
abita
ts th
e gr
een
bars
nee
d to
be
not m
ore
that
5%
bel
ow th
e ye
llow
bar
s.W
ith th
e ex
tens
ive
cons
erva
tion
effo
rt to
dat
e, p
rogr
ess
tow
ard
cons
erva
tion
goal
s ha
s m
et, e
xcee
ded
or v
astly
exc
eede
d St
ay A
head
Req
uire
men
ts. O
ak W
oodl
and
has
exce
eded
the
cons
erva
tion
requ
irem
ent:
it is
105
% o
f th
e to
tal.
Inte
rmitt
ent S
trea
m h
asex
ceed
ed th
e co
nser
vatio
nre
quir
emen
t: it
is 1
141%
of
the
tota
l.
Eph
emer
al S
trea
m h
asex
ceed
ed th
e co
nser
vatio
nre
quir
emen
t: it
is 3
47%
of
the
tota
l.
100.
0
34.0
1.0
0.0
33.0
17.0
21.0
0.0
100.
010
0.0
7.0
21.0
1.0
21.0
0.0
0.0
1.0
0.0
0.0
0.0
3.0
0.0
0.0
0.0
0.0
1.0
0.0
0.0
Oak
woo
dlan
dO
aksa
vann
aSe
ason
alw
etla
ndSl
ough
/C
hann
elPo
ndA
lkal
iw
etla
ndPe
renn
ial
stre
amR
eser
voir
(ope
nw
ater
)
Eph
emer
alst
ream
Inte
rmitt
ent
stre
amC
hapa
rral
and
scru
b
Rip
aria
nw
oodl
and/
scru
b
Pere
nnia
lw
etla
ndA
llgr
assl
and
and
irri
gate
dag
ricu
lture
020406080100
Figu
re E
S-1.
Stay
Ahe
ad C
ompl
ianc
e
Tot
alC
onse
rvat
ion
Req
uire
men
tA
chie
ved
Tot
alIm
pact
sIn
curr
ed
Lan
dCov
er T
ype
Percent Conservation
E
ast C
ontr
a C
osta
Cou
nty
HC
P/N
CC
P 2
010
Ann
ual R
epor
t

Page
1 o
f 2
Prot
ectio
nR
equi
red
Prot
ectio
nT
o D
ate
Impa
ctC
apIm
pact
sT
o D
ate
1815
0.0
3810
.9
1214
8.0
61.4
All
gras
slan
d an
d ir
riga
ted
agri
cultu
re0
5000
1000
0
1500
0
Figu
re E
S-2.
Det
aile
d C
ompa
riso
n of
Con
serv
atio
n, C
onse
rvat
ion
Req
uire
men
ts, I
mpa
cts
and
Impa
ct L
imits
for
Ter
rest
rial
Lan
d C
over
Typ
esAcres
E
ast C
ontr
a C
osta
Cou
nty
HC
P/N
CC
P 2
010
Ann
ual R
epor
t

Page
2 o
f 2
Prot
ectio
nR
equi
red
Prot
ectio
nT
o D
ate
Impa
ctC
apIm
pact
sT
o D
ate
550.
0
500.
0
400.
0
37.1
168.
8
419.
3
2.0
165.
0
73.0
0.0
0.0
0.0
Cha
parr
al a
nd s
crub
Oak
sav
anna
Oak
woo
dlan
d0
100
200
300
400
500
Figu
re E
S-2.
Det
aile
d C
ompa
riso
n of
Con
serv
atio
n, C
onse
rvat
ion
Req
uire
men
ts, I
mpa
cts
and
Impa
ct L
imits
for
Ter
rest
rial
Lan
d C
over
Typ
esAcres
E
ast C
ontr
a C
osta
Cou
nty
HC
P/N
CC
P 2
010
Ann
ual R
epor
t

Not
e: A
quat
ic la
nd c
over
req
uire
men
ts a
re li
nked
to m
itiga
tion
ratio
s ra
ther
than
abs
olut
e ac
reag
e fi
gure
s. T
he c
aps
and
requ
irem
ents
sho
wn
here
are
bas
ed o
n th
e m
axim
um e
stim
ated
impa
cts.
Page
1 o
f 2
Prot
ectio
nR
equi
red
Prot
ectio
nT
o D
ate
Impa
ctC
apIm
pact
sT
o D
ate
70.0
75.0
768.
0
93.0
14.8
0.8
9.4
15.8
35.0
75.0
56.0
31.0
0.2
0.0
0.3
0.0
Rip
aria
n w
oodl
and/
scru
bPe
renn
ial w
etla
ndSe
ason
al w
etla
ndA
lkal
i wet
land
0
200
400
600
Figu
re E
S-3.
Det
aile
d C
ompa
riso
n of
Con
serv
atio
n, C
onse
rvat
ion
Req
uire
men
ts, I
mpa
cts
and
Impa
ct L
imits
for
Aqu
atic
Lan
d C
over
Typ
esAcres
E
ast C
ontr
a C
osta
Cou
nty
HC
P/N
CC
P 2
010
Ann
ual R
epor
t

Not
e: A
quat
ic la
nd c
over
req
uire
men
ts a
re li
nked
to m
itiga
tion
ratio
s ra
ther
than
abs
olut
e ac
reag
e fi
gure
s. T
he c
aps
and
requ
irem
ents
sho
wn
here
are
bas
ed o
n th
e m
axim
um e
stim
ated
impa
cts.
Page
2 o
f 2
Prot
ectio
nR
equi
red
Prot
ectio
nT
o D
ate
Impa
ctC
apIm
pact
sT
o D
ate
4224
.021
12.0
2640
0.0
219.
4
2408
7.7
9159
5.1
2112
.021
12.0
2640
0.0
56.3
6.0
76.0
Pere
nnia
l str
eam
Inte
rmitt
ent s
trea
mE
phem
eral
str
eam
0
2000
0
4000
0
6000
0
8000
0
Acres
E
ast C
ontr
a C
osta
Cou
nty
HC
P/N
CC
P 2
010
Ann
ual R
epor
t

Acq
uisi
tions
to d
ate
Prog
ress
tow
ard
estim
ated
pre
serv
e sy
stem
Yea
r: 3
0G
oal:
30,3
00 a
cres
Acres
The
HC
P/N
CC
P es
timat
es a
max
imum
of
appr
oxim
atel
y 30
,300
acr
es w
ill b
e ne
cess
ary
by 2
037
(Yea
r 30
) to
ach
ieve
all
cons
erva
tion
requ
irem
ents
.
Figu
re E
S-4.
Pro
gres
s T
owar
d A
ssem
blin
g th
e Pr
eser
ve S
yste
m
Yea
r20
0920
1120
1320
1520
1720
1920
2120
2320
2520
2720
2920
3120
3320
3520
370
5000
1000
0
1500
0
2000
0
2500
0
3000
0
3500
0
E
ast C
ontr
a C
osta
Cou
nty
HC
P/N
CC
P 2
010
Ann
ual R
epor
t

East Contra Costa County Habitat Conservancy Page 1
I. INTRODUCTION
East Contra Costa County HCP/NCCP Background Eastern Contra Costa County is a unique region where the San Francisco Bay Area, Sacramento–San Joaquin River Delta, and Central Valley meet (Figure 1). Much of the area retains a rural lifestyle supporting housing, farms, and ranches. It features a rich landscape that is home to a number of rare plants and animals. More than 150 rare species occur in the East County area, including the San Joaquin kit fox (Vulpes macrotus mutica), California red‐legged frog (Rana aurora draytonii), California tiger salamander (Ambystoma californiense), Alameda whipsnake (Masticophis lateralis euryxanthus), Western burrowing owl (Athene cunicularia hypugea), Vernal pool fairy shrimp (Brachinecta lunchi), and Diablo helianthella (Helianthella castanea). Located east of San Francisco, the area’s convenient location, natural beauty, and mild climate have led to rapid population growth. Contra Costa County’s population is predicted to grow by 127,000 people by 2025, providing important new housing for the San Francisco Bay Area’s growing workforce. A significant portion of this growth will occur in the East County in habitat that supports state and federally listed species, resulting in a conflict between conservation and development.
Between 2001 and 2006, the East Contra Costa County Habitat Conservation Plan Association (HCPA) developed the East Contra Costa County Habitat Conservation Plan/Natural Community Conservation Plan (HCP/NCCP; or Plan) that provides regional conservation and development guidelines to protect natural resources while improving and streamlining the permit process for state and federally listed species and wetland regulations. The Plan was approved at the local level in 2006 and permits were issued by the CDFG and the USFWS in 2007. The Plan will allow Contra Costa County (County), the Contra Costa County Flood Control and Water Conservation District (County Flood Control District), the East Bay Regional Park District (EBRPD), the Cities of Brentwood, Clayton, Oakley, and Pittsburg, and the East Contra Costa County Habitat Conservancy (Conservancy) (collectively, the Permittees) to control endangered species permitting for activities and projects in the region, performed or approved by the Permittees, while providing comprehensive species, wetlands, and ecosystem conservation and contributing to the recovery of endangered species in northern California. The Plan will help to avoid project‐by‐project permitting, which is generally costly and time consuming for applicants and often results in uncoordinated and biologically ineffective mitigation.
The Plan was developed by a team of scientists and planners led by the HCPA and ICF International (formerly known as Jones & Stokes) with input from independent science reviewers, stakeholders, and regulators. Within the 174,018‐acre inventory area, the permits issued provide take authorization under the state and federal Endangered Species Acts for between 8,670 and 11,853 acres of urban development and 1,126 acres of rural infrastructure projects. The primary means to offset these impacts is to conserve and restore lands in a Preserve System. The Preserve System will encompass 23,800 acres to 30,300 acres of land that

East Contra Costa County HCP/NCCP 2010 Annual Report
East Contra Costa County Habitat Conservancy Page 2
will be managed to benefit the 28 species covered by the Plan as well as the natural communities that they, and hundreds of other species, depend on for habitat.
The East Contra Costa County Habitat Conservancy (Conservancy) is the Implementing Entity tasked with implementation of the HCP/NCCP. The Conservancy is a joint exercise of powers authority formed by the participating cities and the County. The Conservancy Governing Board consists of elected officials from participating city councils and the County Board of Supervisors. The Executive Director manages day to day activities of the Conservancy under the direction of the Governing Board. The Executive Director, in partnership with two dedicated staff members, performs a wide range of tasks necessary to implement the Plan. Responsibilities include coordinating real estate activities, reviewing and tracking applications for take authorization, coordinating wetland restoration, overseeing monitoring and adaptive management, preparing and administering the budget, managing consultants, applying for outside funding and administering approved grants, coordination with external agencies, compilation of annual reports to the CDFG and the USFWS and supporting the Governing Board and advisory committees.
The EBRPD is expected to be a primary landowner and land manager for the Preserve System, and so far all land acquisitions have been performed by the EBRPD. The EBRPD has more than 75 years of experience managing public open space lands and now owns more than 100,000 acres. All HCP/NCCP Preserve System lands acquired by EBRPD will ultimately be available for public access.
Annual Report The primary purpose of this Annual Report is to provide the Governing Board, the USFWS, the CDFG, and the general public the opportunity to review the Conservancy’s actions and progress made toward implementing the Plan. These entities will use the Annual Report to assess the success of the Plan and provide recommendations to the Plan’s Governing Board and the Conservancy staff for Plan implementation in subsequent years. The goals of the Annual Report are:
• Providing the information and data necessary for the Permittees to demonstrate to the CDFG and the USFWS that the Plan is being implemented according to the Plan, the Implementing Agreement, and the permits.
• Disclosing and documenting issues with Plan implementation that require consultation and resolution with the CDFG, the USFWS, and/or the Permittees.
• Identifying administrative or minor changes to Plan components implemented in the last calendar year that were adopted to increase the success of the Plan.
This is the second Annual Report prepared by the Conservancy to document the progress of the Plan. This Annual Report summarizes the Plan implementation activities undertaken from the

East Contra Costa County HCP/NCCP 2010 Annual Report
East Contra Costa County Habitat Conservancy Page 3
full start of Plan Implementation on January 18, 2008 (when the last set of local ordinances took effect2) to December 31, 2010. The required elements of the Annual Report as defined by the Plan are:
• Covered Activities and Impacts.
• Land Acquisition.
• Habitat Restoration and Creation.
• Preserve Management.
• Monitoring, Research, and Adaptive Management.
• Stay‐Ahead Provision.
• Changed Circumstances and Remedial Measures.
• Finances.
• Program Administration.
Except where noted, data is provided only for the current reporting period of January 1 to December 31, 2010.
Covered Activities and Impacts Section II describes all projects and activities for which incidental take authorization was approved (covered activities) during the reporting period, including an accounting of the acreage of impact by project, activity type, and land‐cover type. Conditions on covered activities applied to each project are identified, and impacts on riparian and wetland land‐cover types are reported by watershed.
Land Acquisition Section III describes the land acquisitions that occurred during the reporting period, including a summary of land acquisition funding from local, state, and federal sources. Each land acquisition conservation measure implemented is identified and a summary of natural community protection during the reporting period and permit term is provided. In addition, progress toward all acquisition requirements, including land‐cover types, habitat connectivity, covered plant populations, and wetland protection is assessed.
Habitat Restoration and Creation Section IV describes natural community creation and restoration conservation measures implemented during the reporting period and permit term, including riparian and wetland restoration by watershed. Each restoration and creation conservation measure implemented is also identified.
2 The HCP/NCCP implementing ordinances for the cities of Brentwood and Clayton and Contra Costa County took effect on January 15, 2008. The ordinances for the cities of Oakley and Pittsburg took effect on January 18, 2008.

East Contra Costa County HCP/NCCP 2010 Annual Report
East Contra Costa County Habitat Conservancy Page 4
Preserve Management Section V describes all land management activities undertaken on Plan preserves and discusses the management issues facing the Conservancy at each preserve unit. Habitat enhancement measures implemented are identified.
Monitoring, Research, and Adaptive Management Section VI summarizes the monitoring, research, and adaptive management that was conducted by the Conservancy and partners during the reporting period. These actions are summarized at the landscape level, natural community level, and species level.
Stay-Ahead Provision Section VII assesses compliance with the stay‐ahead provision, a set of requirements to ensure that progress toward acquisition of Preserve System lands precedes impacts associated with covered activities. This assessment includes a cumulative summary of impacts and conservation for all land‐cover types.
Changed Circumstances and Remedial Measures Section VIII describes actions taken or anticipated regarding changed circumstances, including remedial actions.
Finances Section IX includes accounting of all revenues received by type (e.g., development fees, wetland fees, grants) and an overview of the Conservancy’s Budget and expenditures during the reporting period.
Program Administration Section X summarizes administrative changes, minor modifications, or major amendments proposed or approved during the reporting year. Policy clarifications and early implementation tasks that occurred during the reporting period are described in subsections.

Ant
ioch
Con
cord
Oak
ley
Dan
ville
San
Ram
on
Bre
ntw
ood
Cla
yton
02/2
2/20
10
¥§ ¦680
456J4
·|}þ4
¥§ ¦580
·|}þ4
·|}þ160
·|}þ4
O2
02
1
Mile
s
Lege
nd
Inve
ntor
y A
rea
Non
-urb
an P
arks
, P
ublic
Wat
ersh
ed
Land
s, a
nd D
eed
Res
trict
ed O
pen
Spa
ce in
the
Inve
ntor
y A
rea
City
Lim
its
Wal
nut
Cre
ek
Pitt
sbur
g
Figu
re 1
.
Eas
t Con
tra C
osta
Cou
nty
Hab
itat C
onse
rvat
ion
Pla
n In
vent
ory
Are
a

East Contra Costa County HCP/NCCP 2010 Annual Report
East Contra Costa County Habitat Conservancy Page 5
II. COVERED ACTIVITIES AND IMPACTS This section describes the activities and projects within the inventory area that were approved for take authorization pursuant to the Plan (covered activities) during the reporting period. The Plan requires covered activities to compensate, avoid, and minimize impacts to covered species through a variety of conservation measures. The Plan allows incidental take coverage for the following four activities (Figures 2):
• Urban Development Area Projects. All activities and projects associated with urban growth within the Urban Development Area (UDA) as defined by the Plan.
• Rural Infrastructure Projects. Transportation projects, flood protection projects, and utility projects occurring outside the urban limit line that support urban development within the UDA.
• Rural Infrastructure Operation and Maintenance Activities. Road, flood protection facility, and utility line or facility operation and maintenance projects that occur outside the UDA.
• Preserve System Activities. Management and recreational facilities; habitat enhancement, restoration, and creation; species surveys, monitoring, and research; emergency activities; utility construction and maintenance; and neighboring landowner activities that occur within the Preserve System.
Covered Activities Receiving Take Coverage A total of nine projects received take coverage under the Plan during the reporting period (Table 1 and Figure 3). Covered activities include the following:
• Three Urban Development Area Projects
• Six Rural Infrastructure Projects
Of the nine covered activities, three received coverage from City of Pittsburg, two received coverage from Contra Costa County, and four received coverage from the East Contra Costa County Habitat Conservancy. All covered activities mitigated for impacts through the payment of HCP/NCCP fees. Covered projects paid a total of $837,587 in HCP/NCCP fees, contributions to recovery and administrative charges in 2010. See Table 19 at the end of Section IX for more details.
Conditions on Covered Activities The purpose of conditions on covered activities is to meet regulatory standards to avoid and minimize potential impacts on the covered species (payment of fees or provision of land in lieu of fees satisfies mitigation requirements). Conditions also reduce and minimize impacts on

East Contra Costa County HCP/NCCP 2010 Annual Report
East Contra Costa County Habitat Conservancy Page 6
important natural communities. Conditions on covered activities include preconstruction surveys, construction monitoring, minimization of development footprints that are adjacent to preserves, establishment of stream setbacks and fuel management buffers, management of the urban‐wildland interface, maintenance of hydrologic conditions, avoidance of direct impacts on extremely rare plants, best management practices for flood control, and design requirements for roads outside the urban development area. Each condition is described in detail in Chapter 6 of the Plan under Section 6.4, Specific Conditions on Covered Activities.
Specific project circumstances determine which conditions apply to each project. For example, Condition 1.12 Implement Best Management Practices for Rural Road Maintenance, only applies to rural road maintenance projects. Compliance with the conditions on covered activities is an important part of the conservation strategy.
Numerous landscape‐, natural community‐, and species‐level conditions on covered activities were applied during the reporting period as shown in Tables 2 and 3.
Impacts to Land-Cover Types and Covered Plants Impacts of covered activities were tracked by land‐cover type (Table 4), covered plant occurrences (Table 5), and aquatic and stream by watershed (Table 6). During the reporting period there were a total of 13.5 acres of permanent impact and 48.9 acres of temporary impact (Table 4). There were 0.08 acres of impacts to uncommon vegetation3, uncommon features, or habitat elements.4 No covered plant occurrences were removed by covered activities (Table 5).
Impacts to aquatic land‐cover types during the reporting period were limited to two watersheds (Table 6). In the Brushy watershed there were 0.01 acres of permanent impacts to permanent and seasonal wetlands and 0.12 acres of temporary impacts to permanent, seasonal and alcali wetlands. In addition, 132 feet of permanent impacts and 349 feet of temporary impacts occurred to ephemeral and perennial streams. In the Kellogg watershed, there were 0.41 acres of permanent impacts and 0.40 acres of temporary impacts to riparian woodland scrub, seasonal wetlands, and slough/channel. Six feet of intermittent streams were permanently impacted.
3 Uncommon vegetation types are subtypes of land‐cover types. They include specific native grasses, alkali grasses, and other uncommon vegetation types. 4 Uncommon features or habitat elements include rock outcrops, caves, springs/seeps, sand deposits, mines, buildings (bat roosts), and potential nest sites (trees or cliffs).

Table 1. Rep
orting
Sum
mary of Covered
Activities
Page 1 of 1
Activity Type
Covered By
Project Nam
eLocation
Description
Activities with
in
Urban
Develop
men
t Area
City of
Pittsburg
Use of 2
515 Antioch‐
Pittsburg Hwy Site
2515
Antioch‐Pittsburg Hwy,
Pittsburg Ca
Using
of a
portio
n of th
e site as a yard fo
r eq
uipm
ent a
nd storage of con
struction materials
Activities with
in
Urban
Develop
men
t Area
City of
Pittsburg
USS Posco Site
L‐A
Material Stockpile
900 Loveridge Ro
ad, A
ntioch
Pittsburg Hwy, Pittsburg Ca
94
565
Impo
rt app
roximately 70
,000
cub
ic yards of clean
fill soils and
stockpile th
e en
tire qu
antity on
a
limite
d 7.81
‐acre po
rtion of Site
L‐A. This fill m
aterial is be
ing im
ported
to provide
material for
future grading
and
develop
men
t activities on the 13
5‐acre site
. The
impo
rted
fill material w
ill be
prim
arily from
the Highw
ay 4 expansion
project.
Activities with
in
Urban
Develop
men
t Area
City of
Pittsburg
California Avenu
e Widen
ing Tempo
rary
Contractor Storage Site
680 California Ave, Pittsburg
CaTempo
rary use of the
eastern portio
n (300
feet by 18
0 feet) o
f an un
develope
d parcel fo
r a
contractor storage yard associated
with
the California Avenu
e Widen
ing Project.
Utility
Con
struction
ECCC
Habita
t Co
nservancy
Cono
coPh
illips Line
200
Pipe
line Re
pair Project
Vasco Sub‐Area and Ro
und
Valley Sub‐Area
Ope
ratio
nal and
safety repairs to 5 site
s alon
g the existin
g Co
nocoPh
illips Line
200
Mainline trun
k and crud
e oil pipeline.
Utility
Con
struction
ECCC
Habita
t Co
nservancy
Coalinga‐Avon Pipe
line
Repair Project
Northeast and
northwest o
f the Shell O
il Prod
ucts US
Safety rep
airs to
13 damaged
areas along
the Co
alinga‐Avon pipe
line.
Transportatio
nEC
CC Habita
t Co
nservancy
eBART
Phase 1 Project
City of P
ittsburg: APN
09
7160
045 is 3.5 acres,
0881
7103
7 is 2.0 acres,
0881
7103
2 po
rtion is 0.4
acres, th
e Canal Road site is
0.3 acres.
eBART
Phase 1 will req
uire th
e constructio
n of an ancillary building with
in th
e Canal Road site.
Alth
ough
eBA
RT will be do
ing additio
nal project con
struction, all of th
ose activ
ities will be
localized
to th
e existin
g Caltrans right‐of‐w
ay. The
add
ition
al lots will be used
as laydow
n (staging
areas) and
con
struction parking areas.
Transportatio
nEC
CC Habita
t Co
nservancy
Caltrans State Ro
ute 4
Med
ian Bu
ffer and
Shou
lder W
iden
ing
Project
Marsh Creek Road at post m
ile
(PM) 4
3.9 to th
e Co
ntra
Costa/San Joaquin coun
ty line
at PM 48.3.
Safety im
provem
ent p
roject to
install stand
ard shou
lders and a med
ian bu
ffer zon
e on
State
Route 4 from
Marsh Creek Road to th
e San Joaquin coun
ty line
.
Transportatio
nCo
ntra Costa
Coun
ty Pub
lic
Works
Dep
artm
ent
Vasco Ro
ad Safety
Improvem
ent P
roject
Vasco Ro
ad, Con
tra Co
sta
Coun
tyThe Va
sco Ro
ad Safety Im
provem
ent P
roject was designe
d to im
prove safety along
Vasco Road in
East CCC
C by
installing a concrete m
edian, widen
ing a bridge, con
necting tw
o truck clim
bing
lane
s to delete a merge, and
installing turn lane
s. The
project covers Va
sco Ro
ad from
engineering
station 30
0 in th
e no
rth, to
statio
n 24
4, app
roximately tw
o miles no
rth of th
e bo
rder between
Contra Costa and
Alamed
a Co
untie
s.
Utility
Con
struction ‐
Celluar Telep
hone
Stations
Contra Costa
Coun
tyHorizon
Tow
er
Telecommun
ications
Facility
1760
1 Marsh Creek Road,
Bren
twoo
d, Con
tra Co
sta
Coun
ty
Installatio
n of new
mon
opine de
ll tower and
associated eq
uipm
ent w
ithin a 50x50
lease area.
Activities within Urban
Develop
men
t Area
Rural Infrastructure Projects
East Con
tra Co
sta Co
unty HCP
/NCC
P 20
10 Ann
ual Rep
ort

Table 2. Rep
orting
Period Summary of Natural Com
mun
ity an
d Land
scap
e‐level Con
dition
s on
Covered
Activities by
Project
Page 1 of 1
Natural Com
mun
ity
Project Nam
e2.12 Wetland, Pond, and Stream Avoidance and Minimization Measures
1.6 Minimize Development Footprint Adjacent to Open Space
1.7 Establish Stream Setbacks
1.8 Establish Fuel Management Buffer to Protect Preserves and Property
1.9 Urban‐Wildland Interface Design Elements
1.10 Maintain and Improve Hydrologic Conditions and Minimize Erosion
1.11 Avoid Direct Impacts on Extremely Rare Plants or Fully Protected Wildlife Species
1.12 Implement Best Management Practices for Rural Road Maintenance
1.13 Implement Best Management Practices for Flood Control Facility Operations and Maintenance
1.14 Design Requirements for Covered Roads outside UDA
USS Posco Site
L‐A M
aterial
Stockpile
Vasco Ro
ad Safety
Improvem
ent P
roject
Caltrans State Ro
ute 4 Med
ian
Buffer and
Sho
ulde
r Widen
ing
Project
Coalinga‐Avon Pipe
line Re
pair
Project
Cono
coPh
illips Line
200
Pipe
line Re
pair Project
Land
scap
e
East Con
tra Co
sta Co
unty HCP
/NCC
P201
0 Ann
ual Rep
ort

Table 3. Reporting Period Summary of Species‐Level Conditions on Covered Activities by Project Page 1 of 2
Species‐Level Measures[1]
Townsend’s Big‐Eared Bat San Joaquin Kit Fox Golden Eagle
Western Burrowing Owl Swainson’s Hawk
USS Posco Site L‐A Material Stockpile
Construction
Mon
itoring
Plan
ning
Surveys
Precon
struction
Surveys
AMM
Construction
Mon
itoring
Precon
struction
Surveys
AMM
Construction
Mon
itoring
Plan
ning
Surveys
Precon
struction
Surveys
AMM
Project Name Plan
ning
Surveys
Precon
struction
Surveys
AMM
Plan
ning
Surveys
Precon
struction
Surveys
AMM
Construction
Mon
itoring
Plan
ning
Surveys
Eared Bat San Joaquin Kit Fox Golden Eagle Owl Swainson s Hawk
Material Stockpile
Horizon Tower Telecommunications FacilityVasco Road Safety Improvement ProjectCaltrans State Route 4 Median Buffer and Shoulder Widening Project
eBART Phase 1 Project
lCoalinga‐Avon Pipeline Repair ProjectConocoPhillips Line 200 Pipeline Repair Project
[1] The implementation of these conditions and their results can be found in the planning survey reports and il bl f h Care available upon request from the Conservancy.
[2] Vasco Road Safety Improvement Project conducted planning surveys for alkali milkvetch, big tarplant, Brewer’s dwarf flax, Contra Costa goldfields, diamond‐petaled poppy, large‐flowered fiddleneck, Mount Diablo buckwheat, Mount Diablo fairy‐latern, round‐leaved filaree, showy madia, adobe navarretia, brittlescale, caper fruited tropicocardum, recurved larkspur, and San Joaquin spearscale. AMMs were applied to avoid impacts to San Joaquinspearscale.
Caltrans State Route 4 Median Buffer and Shoulder Widening Project conducted planning surveys for alkali milkvetch, Contra Costa goldfields, and adobe navarretia
Coalinga‐Avon Pipeline Repair Project conducted planning surveys for alkali milkvetch, big tarplant, Brewer's dwarf flax, Contra Costa goldfields, diamond‐petaled poppy, large‐necked fiddleneck, Mount Diablo buckwheat, Mount Diablo fairy‐lantern, round‐leaved filaree, and showy madia. AMMs were applied to avoid impacts to big tarplant.ConocoPhillips Line 200 Pipeline Repair Project planning surveys for alkali milkvetch, big tarplant, Brewer's dwarf flax, Contra Costa goldfields, diamond‐petaled poppy, large‐necked fiddleneck, Mount Diablo buckwheat, Mount Diablo fairy‐lantern, round‐leaved filaree, showy madia, and diablo helianthella. AMMs were applied to y , , y , ppavoid impacts to alkali milkvetch, Brewer's dwarf flax, Contra Costa goldfields, diamond‐petaled poppy, large‐flowered fiddleneck, Mount Diablo fairy‐lantern, round‐leaved filaree, showy madia.
East Contra Costa County HCP/NCCP 2010 Annual Report

Table 3. Reporting Period Summary of Species‐Level Conditions on Covered Activities by Project Page 2 of 2
Species‐Level Measures[1]
Covered Plants [2]Giant Garter Snake
CA Tiger Salamander
CA Red‐Legged Frog Covered Shrimp
USS Posco Site L‐A Material Stockpile
Project Name AMM
Minim
ization
Plan
ning
Surveys
Precon
struction
Surveys
AMM
Construction
Mon
itoring
Plan
ning
Surveys
Precon
struction
Surveys
AMM
Construction
Mon
itoring
Plan
ning
Surveys
Minim
ization
Plan
ning
Surveys
Plan
ning
Surveys
Plants [2]Giant Garter Snake Salamander Legged Frog Covered Shrimp
Material Stockpile
Horizon Tower Telecommunications FacilityVasco Road Safety Improvement ProjectCaltrans State Route 4 Median Buffer and Shoulder Widening Project
eBART Phase 1 Project
lCoalinga‐Avon Pipeline Repair ProjectConocoPhillips Line 200 Pipeline Repair Project
East Contra Costa County HCP/NCCP 2010 Annual Report

Table 4. Reporting Period Cumulative Impacts on Land Cover Types from Covered Activities and Conservation Measure Implementation (includes projected impacts from activities not yet performed)
Page 1 of 2
Land Cover Type Permanent Temporary Permanent Temporary
Annual grassland 2.6 6.8 26.0 23.1
Alkali grassland 0.6 1.2 0.6 1.2
Ruderal 8.0 34.3 21.8 57.0
Chaparral and scrub 0.0 0.0 0.0 0.0
Oak savanna 0.0 0.0 0.0 0.6
Oak woodland 0.0 0.0 0.0 0.0
Subtotal terrestrial 11.2 42.2 48.4 82.0
Riparian woodland/scrub 0.05 0.25 0.24 0.29
Perennial wetland1 0.01 0.12 0.01 0.12
Seasonal wetland 0.29 0.01 0.29 0.01
Alkali wetland 0.00 0.00 0.00 0.00
Pond 0.00 0.00 0.00 0.00
Reservoir (open water)2 0.00 0.00 0.00 0.00
Slough/Channel (includes stream) 0.07 0.14 0.07 0.14
Subtotal aquatic 0.42 0.52 0.61 0.56
Total stream length 138.0 348.5 138.3 387.2
Stream length by width category ‐‐ ‐‐ ‐‐ ‐‐
< 25 feet wide 110.0 230.5 110.0 230.5
> 25 feet wide 28.0 118.0 28.3 156.7
Stream length by type and order ‐‐ ‐‐ ‐‐ ‐‐
Perennial 56.0 282.5 56.3 321.2
Intermittent 6.0 0.0 6.0 0.0
Ephemeral, 3rd or higher order 0.0 0.0 0.0 0.0
Ephemeral, 1st or 2nd order 76.0 66.0 76.0 66.0
Subtotal stream length 138.0 348.5 138.3 387.2
Cropland 1.8 6.1 11.3 6.6
Pasture 0.0 0.0 0.0 0.0
Orchard 0.0 0.0 1.7 0.0
Vineyard 0.0 0.0 0.0 0.4
Subtotal irrigated agricultural 1.8 6.1 13.0 6.9
Nonnative woodland 0.0 0.0 0.0 0.0
Wind turbines 0.0 0.0 0.0 0.6
Subtotal other 0.0 0.0 0.0 0.6
Purple needlegrass grassland 0.02 0.00 0.02 0.00
Wildrye grassland 0.01 0.03 0.01 0.00
Wildflower fields 0.00 0.00 0.00 0.00
Reporting Period CumulativeImpacts
(acres, unless otherwise noted)Impacts
(acres, unless otherwise noted)
Terrestrial
Aquatic
Stream (length in linear feet)
Irrigated agriculture
Other
Uncommon Vegetation Types (subtypes of above land cover types)
East Contra Costa County HCP/NCCP 2010 Annual Report

Table 4. Reporting Period Cumulative Impacts on Land Cover Types from Covered Activities and Conservation Measure Implementation (includes projected impacts from activities not yet performed)
Page 2 of 2
Land Cover Type Permanent Temporary Permanent Temporary
Reporting Period CumulativeImpacts
(acres, unless otherwise noted)Impacts
(acres, unless otherwise noted)
Squirreltail grassland 0.00 0.00 0.00 0.00
One‐sided bluegrass grassland 0.00 0.00 0.00 0.00
Serpentine grassland 0.00 0.00 0.00 0.00
Saltgrass grassland (alkali grassland) 0.00 0.00 0.00 0.00
Alkali sacaton bunchgrass grassland 0.00 0.00 0.00 0.00
Other uncommon vegetation types 0.00 0.00 0.00 0.00
Subtotal uncommon vegetation types 0.03 0.03 0.03 0.00
Rock outcrop 0.05 0.03 0.05 0.03
Cave 0.00 0.00 0.00 0.00
Springs/seeps 0.00 0.00 0.00 0.00
Scalds 0.00 0.00 0.00 0.00
Sand deposits 0.00 0.00 0.00 0.00
Mines (number) 0.00 0.00 0.00 0.00
Buildings (number) 0.00 0.00 0.00 0.00
Potential nest sites (number) 0.00 0.00 0.00 0.00
Subtotal uncommon landscape features (acres)
0.05 0.03 0.05 0.03
Subtotal uncommon landscape features (number)
0.0 0.0 0.0 0.0
Acres 13.5 48.9 62.0 90.0
Linear feet 138.0 348.5 138.3 387.21Perrienal wetlands are equivalent permanent wetlands2 Reservoir (open water) is equivalent to aquatic
Uncommon Landscape Features or Habitat Elements
Totals (excludes subtypes)
East Contra Costa County HCP/NCCP 2010 Annual Report

Table 5. Rep
orting
Period an
d Cu
mulative Im
pacts to Covered
Plants
Page 1 of 1
Common
Nam
eScientific Nam
eRe
porting Pe
riod
Cumulative
Mou
nt Diablo manzanita
Arctostap
hylos au
riculata
0‐‐
‐‐Brittlescale
Atriplex depressa
1‐‐
‐‐San Joaquin spearscale
Atriplex joan
quiniana
0‐‐
‐‐Big tarplant
Blepha
rizon
ia plumosa
1‐‐
‐‐Mou
nt Diablo fairy lantern
Calochortus pu
lchellus
0‐‐
‐‐Re
curved
larkspur
Delph
inium re
curvatum
1‐‐
‐‐Ro
und‐leaved
filaree
Erod
ium m
acroph
yllum
2‐‐
[see
note1]
Diablo he
lianthe
llaHelianthella castanea
0‐‐
‐‐Brew
er’s dwarf flax
Hesperolinon
breweri
0‐‐
‐‐Show
y madia
Mad
ia ra
diata
0‐‐
‐‐Ado
be navarretia
Navarretia
nigelliformis ssp.nigelliformis
1‐‐
‐‐To
tal
60
0
Know
n Occurrences th
at
May Be Re
moved
by
Covered Activities
Impa
cts (occurrences)
1 Tem
porary im
pacts occurred
to rou
nd‐le
aved
filaree as part o
f the
PG&E Co
ntra Costa Las Posita
s Project. The
soil w
as protected
from
disturbance,
the site was returne
d to pre‐project con
nections, and
seeds collected
on site were prop
agated
.
East Con
tra Co
sta Co
unty HCP
/NCC
P 20
10 Ann
ual Rep
ort

Table 6. Impacts to Aquatic and Stream Land Cover Types by Watershed: Reporting Period and Cumulative
Page 1 of 3
Land Cover Type Permanent Temporary Permanent TemporaryBrushy Aquatic (acres)
Riparian woodland/scrub 0.00 0.00 0.00 0.00
Perennial wetland1 0.01 0.12 0.01 0.12
Seasonal wetland 0.00 0.00 0.00 0.00
Alkali wetland 0.00 0.00 0.00 0.00
Pond 0.00 0.00 0.00 0.00
Reservoir (open water)2 0.00 0.00 0.00 0.00
Slough/Channel3 (includes stream) 0.00 0.00 0.00 0.00
Subtotal aquatic 0.01 0.12 0.01 0.12
Stream (linear feet)
Total stream length 132.00 348.50 132.00 348.50
Stream length by width category
< 25 feet wide 110.00 230.50 110.00 230.50
> 25 feet wide 22.00 118.00 22.00 118.00
Stream length by type and order
Perennial 56.00 282.50 56.00 282.50
Intermittent 0.00 0.00 0.00 0.00
Ephemeral, 3rd or higher order 0.00 0.00 0.00 0.00
Ephemeral, 1st or 2nd order 76.00 66.00 76.00 66.00
Watershed/ Basin
Impacts
Reporting Period Cumulative
Ephemeral, 1 or 2 order 76.00 66.00 76.00 66.00
Subtotal stream length 132.00 348.50 132.00 348.50
Kellogg Aquatic (acres)
Riparian woodland/scrub 0.05 0.25 0.05 0.25
Perennial wetland1 0.00 0.00 0.00 0.00
Seasonal wetland 0.29 0.01 0.29 0.01
Alkali wetland 0.00 0.00 0.00 0.00
Pond 0.00 0.00 0.00 0.00
Reservoir (open water)2 0.00 0.00 0.00 0.00
Slough/Channel3 (includes stream) 0.07 0.14 0.07 0.14
Subtotal aquatic 0.41 0.40 0.41 0.40
Stream (linear feet)
Total stream length 6.00 0.00 6.00 0.00
Stream length by width category
< 25 feet wide 0.00 0.00 0.00 0.00
> 25 feet wide 6.00 0.00 6.00 0.00
Stream length by type and order
Perennial 0.00 0.00 0.00 0.00
Intermittent 6.00 0.00 6.00 0.00
Ephemeral, 3rd or higher order 0.00 0.00 0.00 0.00
Ephemeral, 1st or 2nd order 0.00 0.00 0.00 0.00
Subtotal stream length 6.00 0.00 6.00 0.00
East Contra Costa County HCP/NCCP 2010 Annual Report

Table 6. Impacts to Aquatic and Stream Land Cover Types by Watershed: Reporting Period and Cumulative
Page 2 of 3
Land Cover Type Permanent Temporary Permanent TemporaryWatershed/ Basin
Impacts
Reporting Period Cumulative
Lower Marsh Aquatic (acres)
Riparian woodland/scrub 0.00 0.00 0.00 0.04
Perennial wetland1 0.00 0.00 0.00 0.00
Seasonal wetland 0.00 0.00 0.00 0.00
Alkali wetland 0.00 0.00 0.00 0.00
Pond 0.00 0.00 0.00 0.00
Reservoir (open water)2 0.00 0.00 0.00 0.00
Slough/Channel3 (includes stream) 0.00 0.00 0.00 0.00
Subtotal aquatic 0.00 0.00 0.00 0.04
Stream (linear feet)
Total stream length 0.00 0.00 0.31 38.70
Stream length by width category ‐‐ ‐‐ ‐‐ ‐‐
< 25 feet wide 0.00 0.00 0.00 0.00
> 25 feet wide 0.00 0.00 0.31 38.70
Stream length by type and order ‐‐ ‐‐ ‐‐ ‐‐
Perennial 0.00 0.00 0.31 38.70
Intermittent 0.00 0.00 0.00 0.00
Ephemeral, 3rd or higher order 0.00 0.00 0.00 0.00
Ephemeral, 1st or 2nd order 0.00 0.00 0.00 0.00Ephemeral, 1 or 2 order 0.00 0.00 0.00 0.00
Subtotal stream length 0.00 0.00 0.31 38.70
Sand Aquatic (acres)
Riparian woodland/scrub 0.00 0.00 0.19 0.00
Perennial wetland1 0.00 0.00 0.00 0.00
Seasonal wetland 0.00 0.00 0.00 0.00
Alkali wetland 0.00 0.00 0.00 0.00
Pond 0.00 0.00 0.00 0.00
Reservoir (open water)2 0.00 0.00 0.00 0.00
Slough/Channel3 (includes stream) 0.00 0.00 0.00 0.00
Subtotal aquatic 0.00 0.00 0.19 0.00
Stream (linear feet)
Total stream length 0.00 0.00 0.00 0.00
Stream length by width category ‐‐ ‐‐ ‐‐ ‐‐
< 25 feet wide 0.00 0.00 0.00 0.00
> 25 feet wide 0.00 0.00 0.00 0.00
Stream length by type and order ‐‐ ‐‐ ‐‐ ‐‐
Perennial 0.00 0.00 0.00 0.00
Intermittent 0.00 0.00 0.00 0.00
Ephemeral, 3rd or higher order 0.00 0.00 0.00 0.00
Ephemeral, 1st or 2nd order 0.00 0.00 0.00 0.00
Subtotal stream length 0.00 0.00 0.00 0.00
East Contra Costa County HCP/NCCP 2010 Annual Report

Table 6. Impacts to Aquatic and Stream Land Cover Types by Watershed: Reporting Period and Cumulative
Page 3 of 3
Land Cover Type Permanent Temporary Permanent TemporaryWatershed/ Basin
Impacts
Reporting Period Cumulative
Total Aquatic (acres)
Riparian woodland/scrub 0.05 0.25 0.24 0.29
Perennial wetland1 0.01 0.12 0.01 0.12
Seasonal wetland 0.29 0.01 0.29 0.01
Alkali wetland 0.00 0.00 0.00 0.00
Pond 0.00 0.00 0.00 0.00
Reservoir (open water)2 0.00 0.00 0.00 0.00
Slough/Channel3 (includes stream) 0.07 0.14 0.07 0.14
Total aquatic 0.42 0.52 0.61 0.56
Stream (linear feet)
Total stream length 138.00 348.50 138.31 387.20
Stream length by width category ‐‐ ‐‐ ‐‐ ‐‐
< 25 feet wide 110.00 230.50 110.00 230.50
> 25 feet wide 28.00 118.00 28.31 156.70
Stream length by type and order ‐‐ ‐‐ ‐‐ ‐‐
Perennial 56.00 282.50 56.31 321.20
Intermittent 6.00 0.00 6.00 0.00
Ephemeral, 3rd or higher order 0.00 0.00 0.00 0.00
Ephemeral, 1st or 2nd order 76.00 66.00 76.00 66.00Ephemeral, 1 or 2 order 76.00 66.00 76.00 66.00
Total stream length 138.00 348.50 138.31 387.20
East Contra Costa County HCP/NCCP 2010 Annual Report

05/0
4/20
10
¥§ ¦680
456J4
·|}þ4
¥§ ¦580
·|}þ4
·|}þ160
·|}þ4
O2
02
1
Mile
s
Figu
re 2
. In
itial
Urb
an D
evel
opm
ent A
rea
and
Spe
cific
Rur
al In
frast
ruct
ure
Proj
ects
that
may
be
Cov
ered
Inve
ntor
y A
rea
Det
entio
n Ba
sins
Lege
nd
Tran
spor
tatio
nPr
ojec
ts
Byro
n A
irpor
t
Mar
shC
reek
Basi
n
Vasc
o R
dW
iden
ing
Byro
n H
wy
Wid
enin
g
Byro
n Ai
rpor
tEx
pans
ion
Stat
e R
oute
4W
iden
ing
Kello
ggC
reek
Basi
n
Byro
n H
wy
Exte
nsio
n
Bren
twoo
dBa
sin
Mar
sh C
reek
Rd
Rea
lignm
ent
At S
elec
ted
Cur
ves
Upp
er
Sand
Cre
ekBa
sin
Low
erSa
nd C
reek
Basi
n
Lind
sey
Basi
nO
akle
yBa
sin
Trem
bath
Basi
n
Buc
hana
nBy
pass
Kirk
er P
ass
Rd
Wid
enin
g
Prec
ise
loca
tion
tobe
det
erm
ined
.Pl
ease
see
Cha
pter
2fo
r a d
escr
iptio
n of
alig
nmen
t lim
itatio
nsun
der H
CP
/NC
CP
perm
it.
k
Sand
Cre
ek R
dEx
tens
ion
Syca
mor
e A
veEx
tens
ion
Balfo
ur R
dW
iden
ing
Mar
sh C
reek
Rd
Wid
enin
g
Wal
nut B
lvd
Wid
enin
g
San
Mar
co R
dEx
tens
ion
Initi
al U
rban
Dev
elop
men
t Are
a(tr
ansp
orta
tion
& ot
her I
nfra
stru
ctur
epr
ojec
ts in
this
are
aar
e al
so c
over
ed.)
Cou
nty
Urb
an
Lim
it Li
ne
·|}þ4
Rur
al In
frast
ruct
ure
Proj
ects
EBA
RT
Stat
ion
(Ple
ase
see
Cha
pter
2 fo
r det
ails
)
Brentwood-Tracy
Expressway
State Route 239
k
Vasc
o R
dBy
ron
Hw
yC
onne
ctork

Cal
trans
CC
4Sh
ould
er W
iden
ing
(15.
28 a
c)
Con
ocoP
hillip
sLi
ne 2
00Pi
pelin
e R
epai
rSi
tes
2, 3
& 4
(0.2
ac)
eBAR
T C
anal
Rd
Anci
llary
Bui
ldin
g S
ite(0
.3 a
c)
Hor
izon
Tow
erTe
leco
mm
unic
atio
nsTr
ench
ing
(0.9
ac)
Vasc
o R
oad
Saf
ety
Impr
ovem
ent P
roje
ct(5
.82
ac)
Vasc
o R
oad
Saf
ety
Impr
ovem
ent P
roje
ct(5
.26
ac)
USS
Pos
co S
ite L
-AM
ater
ial S
tock
pile
Pro
ject
(7.8
1 ac
)
Cal
trans
CC
4Sh
ould
er W
iden
ing
(7.3
4 ac
)
Shel
l Coa
linga
-Avo
nPi
pelin
e R
epai
r Pro
ject
Lo
catio
ns 1
, 2 &
3(0
.267
ac)
2515
Pitt
sbur
g-A
ntio
ch H
wy,
Con
stru
ctio
n S
tagi
ng(1
2.5
ac)
Cal
iforn
ia A
venu
e W
iden
ing
Tem
pora
ry C
ontra
ctor
St
orag
e A
rea
(1.9
6 ac
)
Hor
izon
Tow
erTe
leco
mm
unic
atio
nsFa
cilit
y P
roje
ct(0
.5 a
c)
eBA
RT
Baily
Rd
Layd
own
Site
(3.5
ac)
Con
ocoP
hilli
psLi
ne 2
00Pi
pelin
e R
epai
rSi
tes
10 &
12
(0.2
6 ac
)
02/2
2 /2
011
¥§ ¦680
456J4
·|}þ4
¥§ ¦580
·|}þ4
·|}þ160
·|}þ4
O2
02
1
Mile
s
Figu
re 3
. Lo
catio
n of
Pro
ject
s C
over
ed in
201
0
Inve
ntor
y A
rea
Lege
nd
Cov
ered
Proj
ects
(Per
man
ant)
Initi
al U
rban
Dev
elop
men
t Are
a(tr
ansp
orta
tion
& ot
her I
nfra
stru
ctur
epr
ojec
ts in
this
are
aar
e al
so c
over
ed.)
Cou
nty
Urb
an
Lim
it Li
ne
·|}þ4C
over
edPr
ojec
ts(T
empo
rary
)

East Contra Costa County HCP/NCCP 2010 Annual Report
East Contra Costa County Habitat Conservancy Page 7
III. LAND ACQUISITION
Preserve System The Conservancy is required to establish a Preserve System through acquisition of land in fee title, conservation easement, mitigation banking, or land dedication. Land acquired as part of the Preserve System will be for the benefit of covered species, natural communities, biological diversity, and to contribute to the overall ecosystem function. The following principles guide the development of the Preserve System:
• Maximize Size.
• Preserve the Highest‐Quality Communities.
• Link Acquisitions.
• Buffer Urban Impacts.
• Minimize Edge.
• Fully Represent Environmental Gradients.
• Consider Watersheds.
• Consider Full Ecological Diversity within Communities.
• Consider Management Needs.
Acquisition Analysis Zones To develop priorities and identify potential locations for acquisition, the inventory area was subdivided geographically into six Acquisition Analysis Zones (Zones; Figure 4). These Zones were further divided into Subzones to distinguish between important landscape features. Acquisition priorities for each Zone were developed primarily on the basis of the ecological opportunities and constraints for collectively achieving the biological goals and objectives for covered species, natural communities, and landscapes.
Land Acquisition Requirements by Acquisition Zone To ensure that acquisition occurs in locations that will maximize the benefits to natural communities and covered species, acquisition requirements are defined by Zone and, in some cases, by Subzone. The priorities for land acquisition within the Zones under the Initial Urban Development area are shown in Figure 5. Land acquisition priorities under the Maximum Urban Development Area are shown in Figure 6. The differences between the acquisition priorities for the two urban development areas are in Zones 4, 5, and 6. There are no differences between the acquisition priorities for the two urban development areas in Zones 1, 2, and 3.
In addition to numeric land acquisition requirements by land‐cover type and Zone, qualitative land acquisition requirements are also provided for some Zones. For instance, connection to

East Contra Costa County HCP/NCCP 2010 Annual Report
East Contra Costa County Habitat Conservancy Page 8
existing public lands or preservation of a certain number of ponds or covered plant populations could be required.
Land Acquisition This section summarizes the progress toward land acquisition requirements during this reporting period. Working with EBRPD, the Conservancy acquired six properties for the Preserve System totaling 2,769 acres: Vaquero Farms North (575 acres), Ang (462 acres), Martin (234 acres), Grandma’s Quarter (157 acres), Souza 3 (1,026 acres), and Irish Canyon (314 acres (Table 7 and Table 8b). As with earlier acquisitions, enrollment of these properties into the Preserve System is pending recording of deed restrictions (the Conservancy, EBRPD, CDFG and USFWS are currently finalizing the form of deed restriction; for additional background see Plan Section 8.6 Land Acquisition). All acquisitions during the reporting period are shown in Figure 7 and summarized in the following section.
Tables 8a, 8b, and 9 show the land‐cover types protected by the six acquisitions. Key highlights from the tables are listed below:
• More than 2,300 acres of annual grassland acquired during reporting period with more than 3,600 acres acquired to date (22% of the annual grassland preservation requirement achieved).
• More than 119 and 89 acres of oak savanna and oak woodland acquired during the reporting period with more than 168 and 419 acres acquired to date (34% and 105% of the oak savanna and oak woodland preservation requirements achieved)
• Nearly 14 acres of riparian woodland/scrub acquired during reporting period (20% of the riparian woodland/scrub preservation requirement achieved).
• More than 3 acres of ponds acquired during reporting period with nearly 5 acres acquired to date (31% of the pond preservation requirement).
• Exceeded preservation requirements for intermittent and ephemeral streams.
• Almost 4 acres of rock outcrops acquired during reporting period, with over 9 acres acquired to date.
Table 10 summarizes progress toward preservation requirements of covered plant populations. During the reporting period, 2 occurrences of San Joaquin spearscale were acquired. To date, eight known occurrences of covered plant populations have been preserved of the total 16 required by the Plan. This includes one occurrence each of Mount Diablo fairy lantern, Mount Diablo manzanita, brittlescale, big tarplant and Diablo helianthella, and three occurrences of San Joaquin Spearscale.

6a
6b
6e
5a
4c
6d
2i
1e
6c 5c 5d
4f
1c
4a
5b
2d
2a2b 4b
2f
1d
4d
2h
2e
2c3b
4h
6f
3a
4g4e
2i
2f3c
1d
1b
2g
4d 4e
1a
02/2
2/20
10
O2
02
1
Mile
s
Figu
re 4
. Acq
uisi
tion
Ana
lysi
s Zo
nes
and
Sub
-Zon
es
Lege
nd
Cou
nty
Urb
an
Lim
it Li
ne
Inve
ntor
y A
rea
¥§ ¦680
456J4
·|}þ4
¥§ ¦580
·|}þ4
·|}þ160
·|}þ4
1 2 3 4 5 6
Acqu
isiti
on A
naly
sis
Zone
s
Par
ks, U
rban
Par
ks,
Pub
lic W
ater
shed
La
nds
and
Ope
n S
pace
(inc
lude
sde
ed re
stric
ted
open
spac
e an
d op
en
spac
e fro
m G
ener
al
Pla
ns.)


156 ac
234 ac
Irish
Cany
on320
ac
Souz
a 3102
1 ac
Schw
artz
153 ac
1644
ac
617 ac
577 a
c
461 a
c 333 ac
320 ac
222 ac
191 a
c
Ang
Souz
a 1
Lentz
ner
Vaqu
eroFa
rms
North
Vaqu
eroFa
rms
South
Fox
Ridg
eMa
rtin
Chap
arral
Sprin
gs
Gran
dma's
Quart
er
Souz
a 2
·|} þ4
Figu
re 7
. EB
RPD
Acq
uisi
tions
Com
plet
ed a
nd in
Pro
gres
s un
der H
CP
as o
f Dec
embe
r 31,
201
0
456J4
·|} þ4
·|} þ160
·|} þ4
Pittsb
urgAn
tioch
Oakle
y
Brentw
ood
Bay
Poin
t
Knigh
tsen
ByronDis
covery
Bay
Conco
rd
Walnu
tCre
ek
Clayto
n
Bethe
lIsla
nd
San
Ramo
nBlackh
awk
O0
24
Mile
s
Cou
nty
Urb
an
Lim
it Li
nePr
eser
ved
Land
s
HC
P A
cqui
red
2010
HC
P A
cqui
red
pre-
2010
Pre
HC
P
Alamo
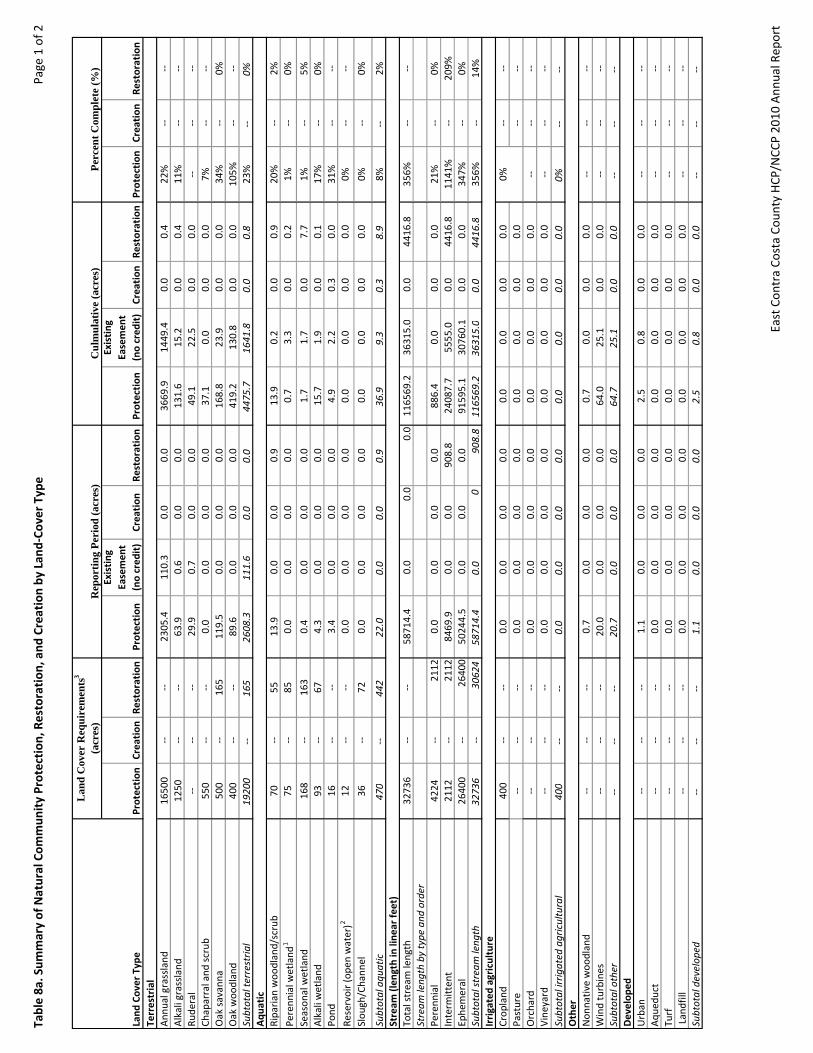
Table 8a. Sum
mary of Natural Com
mun
ity Protection
, Restoration
, and
Creation by
Lan
d‐Co
ver Type
Page 1 of 2
Land
Cover Type
Protection
Creation
Restoration
Protection
Existing
Easemen
t (no cred
it)
Creation
Restoration
Protection
Existing
Easemen
t (no cred
it)
Creation
Restoration
Protection
Creation
Restoration
Ann
ual grassland
1650
0‐‐
‐‐23
05. 4
110.3
0.0
0.0
3669
.914
49.4
0.0
0.4
22%
‐‐‐‐
Alkali grassland
1250
‐‐‐‐
63.9
0.6
0.0
0.0
131.6
15.2
0.0
0.4
11%
‐‐‐‐
Rude
ral
‐‐‐‐
‐‐29
.90.7
0.0
0.0
49.1
22.5
0.0
0.0
‐‐‐‐
‐‐Ch
aparral and
scrub
550
‐‐‐‐
0.0
0.0
0.0
0.0
37.1
0.0
0.0
0.0
7%‐‐
‐‐Oak savanna
500
‐‐16
511
9.5
0.0
0.0
0.0
168.8
23.9
0.0
0.0
34%
‐‐0%
Oak woo
dland
400
‐‐‐‐
89.6
0.0
0.0
0.0
419.2
130.8
0.0
0.0
105%
‐‐‐‐
Subtotal te
rrestrial
19200
‐‐16
526
08.3
111.6
0.0
0.0
4475
.716
41.8
0.0
0.8
23%
‐‐0%
Riparian
woo
dland/scrub
70‐‐
5513
.90.0
0.0
0.9
13.9
0.2
0.0
0.9
20%
‐‐2%
Perenn
ial w
etland
1
75‐‐
850.0
0.0
0.0
0.0
0.7
3.3
0.0
0.2
1%‐‐
0%
Season
al wetland
168
‐‐16
30.4
0.0
0.0
0.0
1.7
1.7
0.0
7.7
1%‐‐
5%Alkali w
etland
93‐‐
674.3
0.0
0.0
0.0
15.7
1.9
0.0
0.1
17%
‐‐0%
Pond
16‐‐
‐‐3.4
0.0
0.0
0.0
4.9
2.2
0.3
0.0
31%
‐‐‐‐
Reservoir (ope
n water)2
12
‐‐‐‐
0.0
0.0
0.0
0.0
0.0
0.0
0.0
0.0
0%‐‐
‐‐
Slou
gh/Chann
el36
‐‐72
0.0
0.0
0.0
0.0
0.0
0.0
0.0
0.0
0%‐‐
0%
Subtotal aqu
atic
470
‐‐44
222
.00.0
0.0
0.9
36.9
9.3
0.3
8.9
8%‐‐
2%
Total stream length
3273
6‐‐
‐‐58
714.4
0.0
0.0
0.0
1165
69.2
3631
5.0
0.0
4416
.835
6%‐‐
‐‐Stream
leng
th by type
and
order
Perenn
ial
4224
‐‐21
120.0
0.0
0.0
0.0
886.4
0.0
0.0
0.0
21%
‐‐0%
Interm
itten
t21
12‐‐
2112
8469
.90.0
0.0
908.8
2408
7.7
5555
.00.0
4416
.811
41%
‐‐20
9%Ephe
meral
2640
0‐‐
2640
050
244.5
0.0
0.0
0.0
9159
5.1
3076
0.1
0.0
0.0
347%
‐‐0%
Subtotal stream leng
th
32736
‐‐30
624
5871
4.4
0.0
090
8.8
1165
69.2
3631
5.0
0.0
4416
.835
6%‐‐
14%
Crop
land
400
‐‐‐‐
0.0
0.0
0.0
0.0
0.0
0.0
0.0
0.0
‐‐‐‐
Pasture
‐‐‐‐
‐‐0.0
0.0
0.0
0.0
0.0
0.0
0.0
0.0
‐‐‐‐
Orchard
‐‐‐‐
‐‐0.0
0.0
0.0
0.0
0.0
0.0
0.0
0.0
‐‐‐‐
‐‐Vine
yard
‐‐‐‐
‐‐0.0
0.0
0.0
0.0
0.0
0.0
0.0
0.0
‐‐‐‐
‐‐Subtotal irrig
ated
agricultural
400
‐‐‐‐
0.0
0.0
0.0
0.0
0.0
0.0
0.0
0.0
0%‐‐
‐‐
Non
nativ
e woo
dland
‐‐‐‐
‐‐0.7
0.0
0.0
0.0
0.7
0.0
0.0
0.0
‐‐‐‐
‐‐Wind turbines
‐‐‐‐
‐‐20
.00.0
0.0
0.0
64.0
25.1
0.0
0.0
‐‐‐‐
‐‐Subtotal other
‐‐‐‐
‐‐20
.70.0
0.0
0.0
64.7
25.1
0.0
0.0
‐‐‐‐
‐‐
Urban
‐‐‐‐
‐‐1.1
0.0
0.0
0.0
2.5
0.8
0.0
0.0
‐‐‐‐
‐‐Aqu
educt
‐‐‐‐
‐‐0.0
0.0
0.0
0.0
0.0
0.0
0.0
0.0
‐‐‐‐
‐‐Turf
‐‐‐‐
‐‐0.0
0.0
0.0
0.0
0.0
0.0
0.0
0.0
‐‐‐‐
‐‐ Landfill
‐‐‐‐
‐‐0.0
0.0
0.0
0.0
0.0
0.0
0.0
0.0
‐‐‐‐
‐‐Subtotal develop
ed‐‐
‐‐‐‐
1.1
0.0
0.0
0.0
2.5
0.8
0.0
0.0
‐‐‐‐
‐‐
Lan
d C
over
Req
uire
men
ts3
(acr
es)
Rep
ortin
g Pe
riod
(acr
es)
Cul
mul
ativ
e (a
cres
)Pe
rcen
t Com
plet
e (%
)
Terrestrial
Aqu
atic
Irrigated agriculture
Stream
(len
gth in line
ar fe
et)
0%
Other
Develop
ed
East Con
tra Co
sta Co
unty HCP
/NCC
P 20
10 Ann
ual Rep
ort
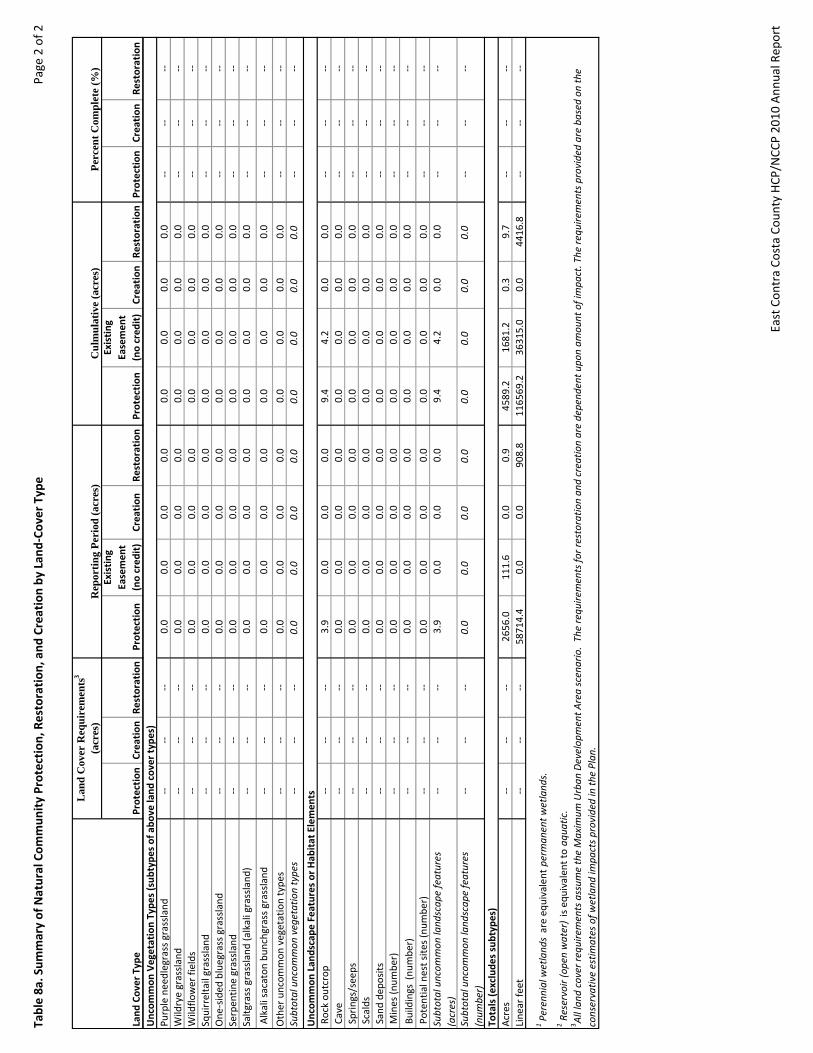
Table 8a. Sum
mary of Natural Com
mun
ity Protection
, Restoration
, and
Creation by
Lan
d‐Co
ver Type
Page 2 of 2
Land
Cover Type
Protection
Creation
Restoration
Protection
Existing
Easemen
t (no cred
it)
Creation
Restoration
Protection
Existing
Easemen
t (no cred
it)
Creation
Restoration
Protection
Creation
Restoration
Lan
d C
over
Req
uire
men
ts3
(acr
es)
Rep
ortin
g Pe
riod
(acr
es)
Cul
mul
ativ
e (a
cres
)Pe
rcen
t Com
plet
e (%
)
Purple needlegrass grassland
‐‐‐‐
‐‐0.0
0.0
0.0
0.0
0.0
0.0
0.0
0.0
‐‐‐‐
‐‐Wildrye grassland
‐‐‐‐
‐‐0.0
0.0
0.0
0.0
0.0
0.0
0.0
0.0
‐‐‐‐
‐‐Wildflo
wer fields
‐‐‐‐
‐‐0.0
0.0
0.0
0.0
0.0
0.0
0.0
0.0
‐‐‐‐
‐‐Squirreltail grassland
‐‐‐‐
‐‐0.0
0.0
0.0
0.0
0.0
0.0
0.0
0.0
‐‐‐‐
‐‐One
‐sided
bluegrass grassland
‐‐‐‐
‐‐0.0
0.0
0.0
0.0
0.0
0.0
0.0
0.0
‐‐‐‐
‐‐Serpen
tine grassland
‐‐‐‐
‐‐0.0
0.0
0.0
0.0
0.0
0.0
0.0
0.0
‐‐‐‐
‐‐Saltg
rass grassland
(alkali grassland
)‐‐
‐‐‐‐
0.0
0.0
0.0
0.0
0.0
0.0
0.0
0.0
‐‐‐‐
‐‐
Alkali sacaton
bun
chgrass grassland
‐‐‐‐
‐‐0.0
0.0
0.0
0.0
0.0
0.0
0.0
0.0
‐‐‐‐
‐‐
Other uncom
mon
vegetation type
s ‐‐
‐‐‐‐
0.0
0.0
0.0
0.0
0.0
0.0
0.0
0.0
‐‐‐‐
‐‐Subtotal uncom
mon
vegetation types
‐‐‐‐
‐‐0.0
0.0
0.0
0.0
0.0
0.0
0.0
0.0
‐‐‐‐
‐‐
Rock ou
tcrop
‐‐‐‐
‐‐3.9
0.0
0.0
0.0
9.4
4.2
0.0
0.0
‐‐‐‐
‐‐ Cave
‐‐‐‐
‐‐0.0
0.0
0.0
0.0
0.0
0.0
0.0
0.0
‐‐‐‐
‐‐ Springs/seeps
‐‐‐‐
‐‐0.0
0.0
0.0
0.0
0.0
0.0
0.0
0.0
‐‐‐‐
‐‐ Scalds
‐‐‐‐
‐‐0.0
0.0
0.0
0.0
0.0
0.0
0.0
0.0
‐‐‐‐
‐‐ Sand de
posits
‐‐‐‐
‐‐0.0
0.0
0.0
0.0
0.0
0.0
0.0
0.0
‐‐‐‐
‐‐ M
ines (n
umbe
r)‐‐
‐‐‐‐
0.0
0.0
0.0
0.0
0.0
0.0
0.0
0.0
‐‐‐‐
‐‐
Buildings (nu
mbe
r)‐‐
‐‐‐‐
0.0
0.0
0.0
0.0
0.0
0.0
0.0
0.0
‐‐‐‐
‐‐
Poten
tial nest site
s (num
ber)
‐‐‐‐
‐‐0.0
0.0
0.0
0.0
0.0
0.0
0.0
0.0
‐‐‐‐
‐‐Subtotal uncom
mon
land
scap
e features
(acres)
‐‐‐‐
‐‐3.9
0.0
0.0
0.0
9.4
4.2
0.0
0.0
‐‐‐‐
‐‐
Subtotal uncom
mon
land
scap
e features
(num
ber)
‐‐‐‐
‐‐0.0
0.0
0.0
0.0
0.0
0.0
0.0
0.0
‐‐‐‐
‐‐
Acres
‐‐‐‐
‐‐26
56. 0
111.6
0.0
0.9
4589
.216
81.2
0.3
9.7
‐‐‐‐
‐‐Line
ar fe
et‐‐
‐‐‐‐
5871
4.4
0.0
0.0
908.8
1165
69.2
3631
5.0
0.0
4416
.8‐‐
‐‐‐‐
1Perenn
ial w
etland
s are eq
uivalent perman
ent w
etland
s.2 R
eservoir (open water) is equ
ivalen
t to aq
uatic.
3 All land
cover re
quire
ments assum
e the Maxim
um Urban
Develop
ment A
rea scenario. The requ
irements fo
r restoratio
n an
d creatio
n are depend
ent u
pon am
ount of impa
ct. The
requ
irements provided are ba
sed on
the
conservative estim
ates of w
etland
impa
cts provided
in th
e Plan
.
Uncom
mon
Vegetation Type
s (sub
type
s of abo
ve land
cover types)
Uncom
mon
Lan
dscape
Features or Hab
itat Elemen
ts
Totals (e
xclude
s subtypes)
East Con
tra Co
sta Co
unty HCP
/NCC
P 20
10 Ann
ual Rep
ort

Table 8b
. Rep
ortin
g Pe
riod
Sum
mary of Natural Com
mun
ity Protection, Restoratio
n, and
Creation by
Land Acquisitio
nPage 1 of 4
Land
Cover Type
Protection
Existing
Easemen
t (No cred
it)
Creation
Restoration
Protection
Existing
Easemen
t (No cred
it)
Creation
Restoration
Protection
Existing
Easemen
t (No cred
it)
Creation
Restoration
Terrestrial
Ann
ual grassland
531.7
‐‐‐‐
‐‐34
9.1
‐‐‐‐
‐‐23
0.4
‐‐‐‐
‐‐Alkali grassland
33.4
‐‐‐‐
‐‐‐‐
‐‐‐‐
‐‐0.9
‐‐‐‐
‐‐Ru
deral
4.0
‐‐‐‐
‐‐‐‐
‐‐‐‐
‐‐2.3
‐‐‐‐
‐‐Ch
aparral and
scrub
‐‐‐‐
‐‐‐‐
‐‐‐‐
‐‐‐‐
‐‐‐‐
‐‐‐‐
Oak savanna
‐‐‐‐
‐‐‐‐
61.7
‐‐‐‐
‐‐‐‐
‐‐‐‐
‐‐Oak woo
dland
‐‐‐‐
‐‐‐‐
49.6
‐‐‐‐
‐‐‐‐
‐‐‐‐
‐‐Subtotal te
rrestrial
569.1
0.0
0.0
0.0
460.4
0.0
0.0
0.0
233.5
0.0
0.0
0.0
Aqu
atic
Riparian
woo
dland/scrub
‐‐‐‐
‐‐‐‐
0.01
‐‐‐‐
‐‐0.0
0.0
0.0
0.0
Perenn
ial w
etland
1
‐‐‐‐
‐‐‐‐
‐‐‐‐
‐‐‐‐
0.0
0.0
0.0
0.0
Season
al wetland
‐‐‐‐
‐‐‐‐
0.4
‐‐‐‐
‐‐0.0
0.0
0.0
0.0
Alkali w
etland
1.0
‐‐‐‐
‐‐0.3
‐‐‐‐
‐‐0.0
0.0
0.0
0.0
Pond
0.9
‐‐‐‐
‐‐0.5
‐‐‐‐
‐‐0.1
0.0
0.0
0.0
Reservoir (ope
n water)2
‐‐
‐‐‐‐
‐‐‐‐
‐‐‐‐
‐‐0.0
0.0
0.0
0.0
Slou
gh/Chann
el
‐‐‐‐
‐‐‐‐
‐‐‐‐
‐‐‐‐
0.0
0.0
0.0
0.0
Subtotal aqu
atic
1.9
0.0
0.0
0.0
1.2
0.0
0.0
0.0
0.1
0.0
0.0
0.0
Stream
(len
gth in line
ar fe
et)
Total stream length
3646
.7‐‐
‐‐‐‐
1967
8.1
‐‐‐‐
‐‐68
1.7
‐‐‐‐
‐‐Stream
leng
th by type
and
order
Perenn
ial
0.0
‐‐‐‐
‐‐0.0
‐‐‐‐
‐‐0.0
‐‐‐‐
‐‐Interm
itten
t23
73.1
‐‐‐‐
‐‐22
27.4
‐‐‐‐
‐‐0.0
‐‐‐‐
‐‐Ephe
meral
1273
.6‐‐
‐‐‐‐
1745
0.7
‐‐‐‐
‐‐68
1.7
‐‐‐‐
‐‐Subtotal stream leng
th
3646
.7‐‐
‐‐‐‐
1967
8.1
0.0
0.0
0.0
681.7
‐‐‐‐
‐‐Irrigated agriculture
Crop
land
‐‐‐‐
‐‐‐‐
‐‐‐‐
‐‐‐‐
‐‐‐‐
‐‐‐‐
Pasture
‐‐‐‐
‐‐‐‐
‐‐‐‐
‐‐‐‐
‐‐‐‐
Orchard
‐‐‐‐
‐‐‐‐
‐‐‐‐
‐‐‐‐
‐‐‐‐
‐‐‐‐
Vine
yard
‐‐‐‐
‐‐‐‐
‐‐‐‐
‐‐‐‐
‐‐‐‐
‐‐‐‐
Subtotal irrig
ated
agricultural
0.0
0.0
0.0
0.0
0.0
0.0
0.0
0.0
0.0
0.0
0.0
0.0
Other
Non
nativ
e woo
dland
‐‐‐‐
‐‐‐‐
‐‐‐‐
‐‐‐‐
‐‐‐‐
‐‐‐‐
Wind turbines
‐‐‐‐
‐‐‐‐
‐‐‐‐
‐‐‐‐
‐‐‐‐
‐‐‐‐
Subtotal other
0.0
0.0
0.0
0.0
0.0
0.0
0.0
0.0
0.0
0.0
0.0
0.0
Develop
edUrban
‐‐‐‐
‐‐‐‐
0.3
‐‐‐‐
‐‐0.8
‐‐‐‐
‐‐Aqu
educt
‐‐‐‐
‐‐‐‐
‐‐‐‐
‐‐‐‐
‐‐‐‐
‐‐‐‐
Turf
‐‐‐‐
‐‐‐‐
‐‐‐‐
‐‐‐‐
‐‐‐‐
‐‐‐‐
Landfill
‐‐‐‐
‐‐‐‐
‐‐‐‐
‐‐‐‐
‐‐‐‐
‐‐‐‐
Subtotal develop
ed0.0
0.0
0.0
0.0
0.3
0.0
0.0
0.0
0.8
0.0
0.0
0.0
Repo
rting Pe
riod
Lan
d Acqusitions (a
cres)
Vacqu
ero Farm
s North
Ang
Martin
East Con
tra Co
sta Co
unty HCP
/NCC
P 20
10 Ann
ual Rep
ort

Table 8b
. Rep
ortin
g Pe
riod
Sum
mary of Natural Com
mun
ity Protection, Restoratio
n, and
Creation by
Land Acquisitio
nPage 2 of 4
Land
Cover Type
Protection
Existing
Easemen
t (No cred
it)
Creation
Restoration
Protection
Existing
Easemen
t (No cred
it)
Creation
Restoration
Protection
Existing
Easemen
t (No cred
it)
Creation
Restoration
Repo
rting Pe
riod
Lan
d Acqusitions (a
cres)
Vacqu
ero Farm
s North
Ang
Martin
Uncom
mon
Vegetation Type
s (sub
type
s of
above land
cover ty
pes)
Purple needlegrass grassland
‐‐‐‐
‐‐‐‐
‐‐‐‐
‐‐‐‐
‐‐‐‐
‐‐‐‐
Wildrye grassland
‐‐‐‐
‐‐‐‐
‐‐‐‐
‐‐‐‐
‐‐‐‐
‐‐‐‐
Wildflo
wer fields
‐‐‐‐
‐‐‐‐
‐‐‐‐
‐‐‐‐
‐‐‐‐
‐‐‐‐
Squirreltail grassland
‐‐‐‐
‐‐‐‐
‐‐‐‐
‐‐‐‐
‐‐‐‐
‐‐‐‐
One
‐sided
bluegrass grassland
‐‐‐‐
‐‐‐‐
‐‐‐‐
‐‐‐‐
‐‐‐‐
‐‐‐‐
Serpen
tine grassland
‐‐‐‐
‐‐‐‐
‐‐‐‐
‐‐‐‐
‐‐‐‐
‐‐‐‐
Saltg
rass grassland
(alkali grassland
)‐‐
‐‐‐‐
‐‐‐‐
‐‐‐‐
‐‐‐‐
‐‐‐‐
‐‐
Alkali sacaton
bun
chgrass grassland
‐‐‐‐
‐‐‐‐
‐‐‐‐
‐‐‐‐
‐‐‐‐
‐‐‐‐
Other uncom
mon
vegetation type
s ‐‐
‐‐‐‐
‐‐‐‐
‐‐‐‐
‐‐‐‐
‐‐‐‐
‐‐Subtotal uncom
mon
vegetation types
0.0
0.0
0.0
0.0
0.0
0.0
0.0
0.0
0.0
0.0
0.0
0.0
Uncom
mon
Lan
dscape
Features or Hab
itat
Elem
ents
Rock ou
tcrop
3.9
‐‐‐‐
‐‐‐‐
‐‐‐‐
‐‐‐‐
‐‐‐‐
‐‐ Cave
‐‐‐‐
‐‐‐‐
‐‐‐‐
‐‐‐‐
‐‐‐‐
‐‐‐‐
Springs/seeps
‐‐‐‐
‐‐‐‐
‐‐‐‐
‐‐‐‐
‐‐‐‐
‐‐‐‐
Scalds
‐‐‐‐
‐‐‐‐
‐‐‐‐
‐‐‐‐
‐‐‐‐
‐‐‐‐
Sand de
posits
‐‐‐‐
‐‐‐‐
‐‐‐‐
‐‐‐‐
‐‐‐‐
‐‐‐‐
Mines (n
umbe
r)‐‐
‐‐‐‐
‐‐‐‐
‐‐‐‐
‐‐‐‐
‐‐‐‐
‐‐
Buildings (nu
mbe
r)‐‐
‐‐‐‐
‐‐‐‐
‐‐‐‐
‐‐‐‐
‐‐‐‐
‐‐
Poten
tial nest site
s (num
ber)
‐‐‐‐
‐‐‐‐
‐‐‐‐
‐‐‐‐
‐‐‐‐
‐‐‐‐
Subtotal uncom
mon
land
scap
e features
(acres)
3.9
0.0
0.0
0.0
0.0
0.0
0.0
0.0
0.0
0.0
0.0
0.0
Subtotal uncom
mon
land
scap
e features
(num
ber)
0.0
0.0
0.0
0.0
0.0
0.0
0.0
0.0
0.0
0.0
0.0
0.0
Totals (e
xclude
s subtypes)
Acres
574.9
0.0
0.0
0.0
461.9
0.0
0.0
0.0
234.3
0.0
0.0
0.0
Line
ar fe
et36
46.7
‐‐‐‐
‐‐19
678.1
0.0
0.0
0.0
681.7
‐‐‐‐
‐‐1Perenn
ial w
etland
s are eq
uivalent
perm
anent w
etland
s.
2 Reservoir (open water) is equ
ivalen
t to
aqua
tic.
3 All land
cover re
quire
ments assum
e the
Maxim
um Urban
Develop
ment A
rea scenario.
The requ
irements fo
r restoratio
n an
d creatio
n are depend
ent u
pon am
ount of impa
ct. The
requ
irements provided are ba
sed on
the
conservative estim
ates of w
etland
impa
cts
provided
in th
e Plan
.
East Con
tra Co
sta Co
unty HCP
/NCC
P 20
10 Ann
ual Rep
ort

Table 8b
. Rep
ortin
g Pe
riod
Sum
mary of Natural Com
mun
ity Protection, Restoratio
n, and
Creation by
Land Acquisitio
nPage 3 of 4
Land
Cover Type
Terrestrial
Ann
ual grassland
Alkali grassland
Rude
ral
Chaparral and
scrub
Oak savanna
Oak woo
dland
Subtotal te
rrestrial
Aqu
atic
Riparian
woo
dland/scrub
Perenn
ial w
etland
1
Season
al wetland
Alkali w
etland
Pond
Reservoir (ope
n water)2
Slou
gh/Chann
el
Subtotal aqu
atic
Stream
(len
gth in line
ar fe
et)
Total stream length
Stream
leng
th by type
and
order
Perenn
ial
Interm
itten
tEphe
meral
Subtotal stream leng
th
Irrigated agriculture
Crop
land
Pasture
Orchard
Vine
yard
Subtotal irrig
ated
agricultural
Other
Non
nativ
e woo
dland
Wind turbines
Subtotal other
Develop
edUrban
Aqu
educt
Turf
Landfill
Subtotal develop
ed
Protection
Existing
Easemen
t (No cred
it)
Creation
Restoration
Protection
Existing
Easemen
t (No cred
it)
Creation
Restoration
Protection
Existing
Easemen
t (No cred
it)
Creation
Restoration
154.8
‐‐‐‐
‐‐83
6.7
110.3
‐‐‐‐
202.8
‐‐‐‐
‐‐0.4
‐‐‐‐
‐‐29
.20.6
‐‐‐‐
‐‐‐‐
‐‐‐‐
1.7
‐‐‐‐
‐‐21
.80.7
‐‐‐‐
‐‐‐‐
‐‐‐‐
‐‐‐‐
‐‐‐‐
‐‐‐‐
‐‐‐‐
‐‐‐‐
‐‐‐‐
‐‐‐‐
‐‐‐‐
‐‐‐‐
‐‐‐‐
57.8
‐‐‐‐
‐‐‐‐
‐‐‐‐
‐‐‐‐
‐‐‐‐
‐‐40
.0‐‐
‐‐‐‐
157.0
0.0
0.0
0.0
887.7
111.6
0.0
0.0
300.6
0.0
0.0
0.0
‐‐‐‐
‐‐‐‐
1.2
‐‐‐‐
‐‐12
.6‐‐
‐‐0.9
‐‐‐‐
‐‐‐‐
‐‐‐‐
‐‐‐‐
‐‐‐‐
‐‐‐‐
‐‐‐‐
‐‐‐‐
‐‐‐‐
‐‐‐‐
‐‐‐‐
‐‐‐‐
‐‐‐‐
‐‐‐‐
3.0
‐‐‐‐
‐‐‐‐
‐‐‐‐
‐‐‐‐
‐‐‐‐
‐‐1.6
‐‐‐‐
‐‐0.3
‐‐‐‐
‐‐‐‐
‐‐‐‐
‐‐‐‐
‐‐‐‐
‐‐‐‐
‐‐‐‐
‐‐
‐‐‐‐
‐‐‐‐
‐‐‐‐
‐‐‐‐
‐‐‐‐
‐‐‐‐
0.0
0.0
0.0
0.0
5.9
0.0
0.0
0.0
12.9
0.0
0.0
0.9
5850
.8‐‐
‐‐‐‐
1591
2.6
‐‐‐‐
‐‐12
944.5
‐‐‐‐
908.8
0.0
‐‐‐‐
‐‐0.0
‐‐‐‐
‐‐0.0
‐‐‐‐
‐‐0.0
‐‐‐‐
‐‐38
69. 4
‐‐‐‐
‐‐0.0
‐‐‐‐
908.8
5850
.8‐‐
‐‐‐‐
1204
3.2
‐‐‐‐
‐‐12
944.5
‐‐‐‐
‐‐58
50.8
0.0
0.0
0.0
1591
2.6
‐‐0.0
0.0
1294
4.5
0.0
908.8
908.8
‐‐‐‐
‐‐‐‐
‐‐‐‐
‐‐‐‐
‐‐‐‐
‐‐‐‐
‐‐‐‐
‐‐‐‐
‐‐‐‐
‐‐‐‐
‐‐‐‐
‐‐‐‐
‐‐‐‐
‐‐‐‐
‐‐‐‐
‐‐‐‐
‐‐‐‐
‐‐‐‐
‐‐‐‐
‐‐‐‐
‐‐‐‐
‐‐‐‐
‐‐‐‐
0.0
0.0
0.0
0.0
0.0
0.0
0.0
0.0
0.0
0.0
0.0
0.0
‐‐‐‐
‐‐‐‐
0.7
‐‐‐‐
‐‐‐‐
‐‐‐‐
‐‐‐‐
‐‐‐‐
‐‐20
.0‐‐
‐‐‐‐
‐‐‐‐
‐‐‐‐
0.0
0.0
0.0
0.0
20.7
0.0
0.0
0.0
0.0
0.0
0.0
0.0
‐‐‐‐
‐‐‐‐
‐‐‐‐
‐‐‐‐
‐‐‐‐
‐‐‐‐
‐‐‐‐
‐‐‐‐
‐‐‐‐
‐‐‐‐
‐‐‐‐
‐‐‐‐
‐‐‐‐
‐‐‐‐
‐‐‐‐
‐‐‐‐
‐‐‐‐
‐‐‐‐
‐‐‐‐
‐‐‐‐
‐‐‐‐
‐‐‐‐
‐‐‐‐
‐‐‐‐
0.0
0.0
0.0
0.0
0.0
0.0
0.0
0.0
0.0
0.0
0.0
0.0
Repo
rting Pe
riod
Lan
d Acqusitions (a
cres)
Grand
ma's Qua
rter
Souza 3
Irish Ca
nyon Ea
st Con
tra Co
sta Co
unty HCP
/NCC
P 20
10 Ann
ual Rep
ort

Table 8b
. Rep
ortin
g Pe
riod
Sum
mary of Natural Com
mun
ity Protection, Restoratio
n, and
Creation by
Land Acquisitio
nPage 4 of 4
Land
Cover Type
Uncom
mon
Vegetation Type
s (sub
type
s of
above land
cover ty
pes)
Purple needlegrass grassland
Wildrye grassland
Wildflo
wer fields
Squirreltail grassland
One
‐sided
bluegrass grassland
Serpen
tine grassland
Saltg
rass grassland
(alkali grassland
)
Alkali sacaton
bun
chgrass grassland
Other uncom
mon
vegetation type
s Subtotal uncom
mon
vegetation types
Uncom
mon
Lan
dscape
Features or Hab
itat
Elem
ents
Rock ou
tcrop
Cave
Springs/seeps
Scalds
Sand de
posits
Mines (n
umbe
r)
Buildings (nu
mbe
r) Poten
tial nest site
s (num
ber)
Subtotal uncom
mon
land
scap
e features
(acres)
Subtotal uncom
mon
land
scap
e features
(num
ber)
Totals (e
xclude
s subtypes)
Acres
Line
ar fe
et1Perenn
ial w
etland
s are eq
uivalent
perm
anent w
etland
s.
2 Reservoir (open water) is equ
ivalen
t to
aqua
tic.
3 All land
cover re
quire
ments assum
e the
Maxim
um Urban
Develop
ment A
rea scenario.
The requ
irements fo
r restoratio
n an
d creatio
n are depend
ent u
pon am
ount of impa
ct. The
requ
irements provided are ba
sed on
the
conservative estim
ates of w
etland
impa
cts
provided
in th
e Plan
.
Protection
Existing
Easemen
t (No cred
it)
Creation
Restoration
Protection
Existing
Easemen
t (No cred
it)
Creation
Restoration
Protection
Existing
Easemen
t (No cred
it)
Creation
Restoration
Repo
rting Pe
riod
Lan
d Acqusitions (a
cres)
Grand
ma's Qua
rter
Souza 3
Irish Ca
nyon
‐‐‐‐
‐‐‐‐
‐‐‐‐
‐‐‐‐
‐‐‐‐
‐‐‐‐
‐‐‐‐
‐‐‐‐
‐‐‐‐
‐‐‐‐
‐‐‐‐
‐‐‐‐
‐‐‐‐
‐‐‐‐
‐‐‐‐
‐‐‐‐
‐‐‐‐
‐‐‐‐
‐‐‐‐
‐‐‐‐
‐‐‐‐
‐‐‐‐
‐‐‐‐
‐‐‐‐
‐‐‐‐
‐‐‐‐
‐‐‐‐
‐‐‐‐
‐‐‐‐
‐‐‐‐
‐‐‐‐
‐‐‐‐
‐‐‐‐
‐‐‐‐
‐‐‐‐
‐‐‐‐
‐‐‐‐
‐‐‐‐
‐‐‐‐
‐‐‐‐
‐‐‐‐
‐‐‐‐
‐‐‐‐
‐‐‐‐
‐‐‐‐
‐‐‐‐
‐‐‐‐
‐‐‐‐
‐‐‐‐
‐‐‐‐
‐‐‐‐
‐‐‐‐
‐‐‐‐
‐‐‐‐
0.0
0.0
0.0
0.0
0.0
0.0
0.0
0.0
0.0
0.0
0.0
0.0
‐‐‐‐
‐‐‐‐
‐‐‐‐
‐‐‐‐
‐‐‐‐
‐‐‐‐
‐‐‐‐
‐‐‐‐
‐‐‐‐
‐‐‐‐
‐‐‐‐
‐‐‐‐
‐‐‐‐
‐‐‐‐
‐‐‐‐
‐‐‐‐
‐‐‐‐
‐‐‐‐
‐‐‐‐
‐‐‐‐
‐‐‐‐
‐‐‐‐
‐‐‐‐
‐‐‐‐
‐‐‐‐
‐‐‐‐
‐‐‐‐
‐‐‐‐
‐‐‐‐
‐‐‐‐
‐‐‐‐
‐‐‐‐
‐‐‐‐
‐‐‐‐
‐‐‐‐
‐‐‐‐
‐‐‐‐
‐‐‐‐
‐‐‐‐
‐‐‐‐
‐‐‐‐
‐‐‐‐
‐‐‐‐
‐‐‐‐
‐‐‐‐
‐‐‐‐
‐‐‐‐
‐‐‐‐
0.0
0.0
0.0
0.0
0.0
0.0
0.0
0.0
0.0
0.0
0.0
0.0
0.0
0.0
0.0
0.0
0.0
0.0
0.0
0.0
0.0
0.0
0.0
0.0
157.0
0.0
0.0
0.0
914.3
111.6
0.0
0.0
313.5
0.0
0.0
0.9
5850
.80.0
0.0
0.0
1591
2.6
‐‐0.0
0.0
1294
4.5
0.0
908.8
908.8
East Con
tra Co
sta Co
unty HCP
/NCC
P 20
10 Ann
ual Rep
ort

Table 9. Cum
ulative Summary of Progress towards
Fulfilling
Preservation Re
quirem
ents fo
r Jurisdiction
al W
etland
and
Waters Re
quirem
ents
Page 1 of 1
Jurisdiction
al W
etland
s an
d Waters Re
quirem
ent
Total R
equiremen
t Re
porting Pe
riod
Area Acquired
Cumulative
Area Acquired
Percen
tage
of R
equiremen
t Met by Acquisition
(%)
Preserve‐w
ide Riparian
woo
dland/scrub (acres)
70.0
13.9
13.9
20%
Preserve‐w
ide Pe
renn
ial w
etland
(acres)
75.0
0.0
0.7
1%Preserve‐w
ide Season
al wetland
(acres)
168.0
0.4
1.7
1%Preserve‐w
ide Alkali w
etland
(acres)
93.0
4.3
15.7
17%
Preserve‐w
ide Po
nd (acres)
16.0
3.4
4.9
31%
Preserve‐w
ide Re
servoir (ope
n water) (acres)
12.0
0.0
0.0
0%Preserve‐w
ide Slou
gh/Chann
el (acres)
36.0
0.0
0.0
0%Preserve‐w
ide stream length (feet)
32,736
.058
,714
.411
6,56
9.2
356%
Stream
leng
th by type
and
order
Perenn
ial (feet)
4,22
4.0
0.0
886.4
21%
Interm
itten
t (feet)
2,11
2.0
8,46
9.9
24,087
.711
41%
Ephe
meral (feet)
26,400
.050
,244
.591
,595
.134
7%
East Con
tra Co
sta Co
unty HCP
/NCC
P 20
10 Ann
ual Rep
ort

Table 10
. Rep
orting
Period an
d Cu
mulative Co
nservation
of Co
vered Plan
tsPage 1 of 1
Common
Nam
eScientific Nam
eRe
quired
Repo
rting Pe
riod
Cumulative
% Com
plete
Mou
nt Diablo manzanita
Arctostap
hylos au
riculata
20
150
%
Brittlescale
Atriplex depressa
2 (4)1
01
50% (2
5%)
San Joaquin spearscale
Atriplex joan
quiniana
02
3‐‐
Big tarplant
Blepha
rizon
ia plumosa
30
133
%Mou
nt Diablo fairy lantern
Calochortus pu
lchellus
10
110
0%Re
curved
larkspur
Delph
inium re
curvatum
20
00%
Roun
d‐leaved
filaree
Erod
ium m
acroph
yllum
20
00%
Diablo he
lianthe
llaHelianthella castanea
20
150
%Brew
er’s dwarf flax
Hesperolinon
breweri
10
00%
Show
y madia
Mad
ia ra
diata
00
0‐‐
Ado
be navarretia
Navarretia
nigelliformis ssp.
nigelliform
is1
00
0%
Total
16 (1
8)8
Num
ber of Occurrences Protected
by HCP
/NCC
P
1 With
the initial urban
develop
men
t area, at least tw
o occurren
ces of brittlescale will be preserved. As soon
as
perm
itted
urban
develop
men
t exceeds th
is, fou
r occurren
ces of brittlescale must b
e preserved.
East Con
tra Co
sta Co
unty HCP
/NCC
P 20
10 Ann
ual Rep
ort

Table 11
. Achievemen
t of Zon
e‐Specific Land
Acquisition
Req
uiremen
ts: R
eporting
Period an
d Cu
mulative Summary
Page 1 of 4
Zone
/ Subzon
eRe
quirem
ents
1acres
Min. A
cres (M
UDA)
Aqu
ired
Rep
orting
Pe
riod
To date
Percen
t Achieved
Zone
11a
Ann
ual grassland
8585
0.0
0.0
0%1b
Ann
ual grassland
(1,450
acres com
bine
d w/ 1c)
TBD
0.0
0.0
0%
1cAnn
ual grassland
(1,450
acres com
bine
d w/ 1c)
TBD
0.0
0.0
0%
1d25
% of total area
478
478
0.0
0.0
0%1e
No specific requ
irem
ents
00
0.0
0.0
‐‐All
Estim
ated
minim
um req
uiremen
t2,10
02,25
00.0
0.0
0%All
Estim
ated
maxim
um req
uiremen
t2,85
03,15
00.0
0.0
0%Zo
ne 2
2aAt least 60%
of sub
zone
1,10
41,10
443
1.3
444.1
40%
2aAnn
ual grassland
(850
acres)
‐‐85
032
7.1
327.1
38%
2a90
% of chaparral in
2a, 2b, and
2c (122
acres to
tal)
‐‐see be
low
0.0
0.0
‐‐
2aLand
to protect M
ount Diablo manzanita
‐‐‐‐
0.0
0.0
‐‐
2bAnn
ual grassland
(450
acres)
450
450
0.0
0.0
0%
2bCo
nnectio
n b/w Black Diamon
d R.P. and
Clayton
Ra
nch (w
/ 2c)
see be
low
0.0
183.8
‐‐
2b90
% of chaparral in
2a, 2b, and
2c (122
acres to
tal)
see be
low
0.0
0.0
‐‐
2cAnn
ual grassland
(400
acres)
400
400
0.0
10.3
3%
2c0.5‐mile wide conn
ect b
/w Black Diamon
d and
Clayton Ra
nch (w
/2b)
0.0
13.0
‐‐
2c90
% of chaparral in
2a, 2b, and
2c (122
acres to
tal)
see be
low
0.0
0.0
‐‐
2cSeven (7) o
f thirteen (13) pon
ds fo
r TC
B, CTS, W
PT, or
CRLF
70.0
0.0
0%
2dAnn
ual grassland
(800
acres)
800
800
0.0
126.7
16%
2dKn
own occurren
ce of rou
nd‐le
aved
filaree (num
ber)
11
0.0
1.0
100%
2eAnn
ual grassland
(800
acres)
800
800
0.0
79.5
10%
2eSee 2e/2f/2h
below
see be
low
0.0
0.0
‐‐
1,45
0
East Con
tra Co
sta Co
unty HCP
/NCC
P 20
10 Ann
ual Rep
ort
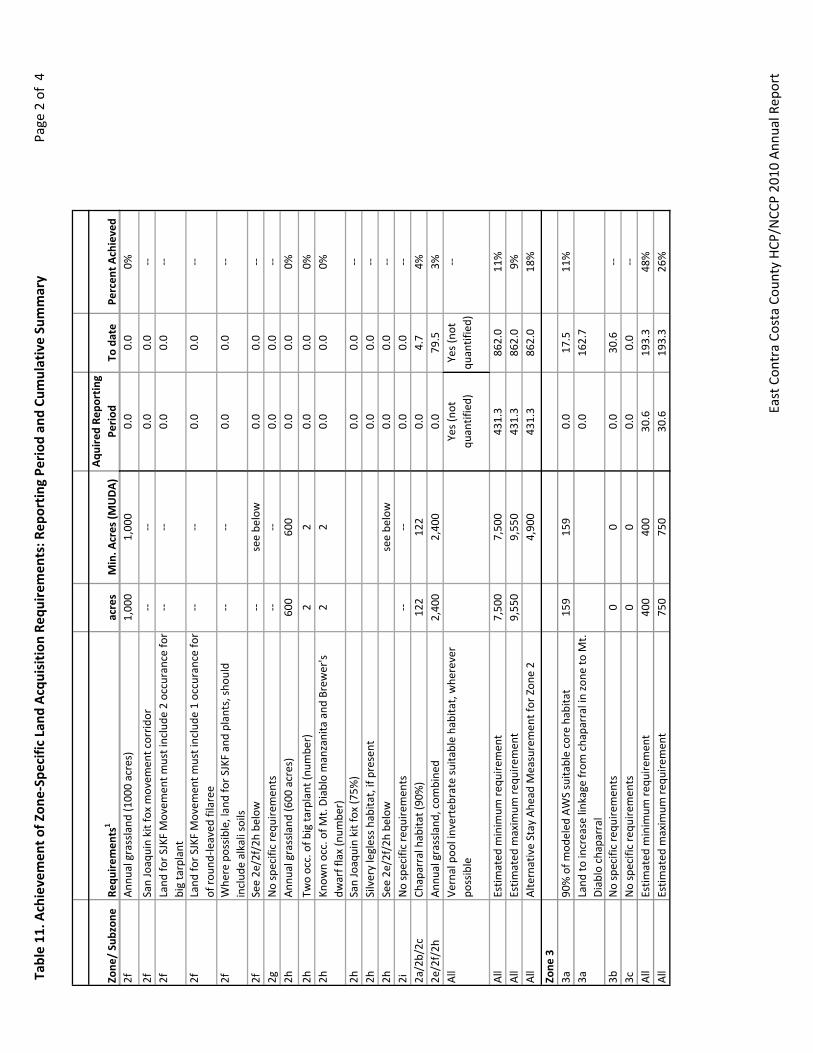
Table 11
. Achievemen
t of Zon
e‐Specific Land
Acquisition
Req
uiremen
ts: R
eporting
Period an
d Cu
mulative Summary
Page 2 of 4
Zone
/ Subzon
eRe
quirem
ents
1acres
Min. A
cres (M
UDA)
Aqu
ired
Rep
orting
Pe
riod
To date
Percen
t Achieved
2fAnn
ual grassland
(100
0 acres)
1,00
01,00
00.0
0.0
0%
2fSan Joaquin kit fox m
ovem
ent corrido
r‐‐
‐‐0.0
0.0
‐‐2f
Land
for SJKF
Movem
ent m
ust include
2 occurance fo
r big tarplant
‐‐‐‐
0.0
0.0
‐‐
2fLand
for SJKF
Movem
ent m
ust include
1 occurance fo
r of rou
nd‐le
aved
filaree
‐‐‐‐
0.0
0.0
‐‐
2fWhe
re possible, land
for SJKF
and
plants, sho
uld
includ
e alkali soils
‐‐‐‐
0.0
0.0
‐‐
2fSee 2e/2f/2h
below
‐‐see be
low
0.0
0.0
‐‐2g
No specific requ
irem
ents
‐‐‐‐
0.0
0.0
‐‐2h
Ann
ual grassland
(600
acres)
600
600
0.0
0.0
0%
2hTw
o occ. of b
ig ta
rplant (n
umbe
r)2
20.0
0.0
0%2h
Know
n occ. of M
t. Diablo manzanita and
Brewer's
dwarf flax (num
ber)
22
0.0
0.0
0%
2hSan Joaquin kit fox (7
5%)
0.0
0.0
‐‐2h
Silvery legless habitat, if present
0.0
0.0
‐‐2h
See 2e/2f/2h
below
see be
low
0.0
0.0
‐‐2i
No specific requ
irem
ents
‐‐‐‐
0.0
0.0
‐‐2a/2b/2c
Chaparral habita
t (90
%)
122
122
0.0
4.7
4%2e/2f/2h
Ann
ual grassland
, com
bine
d2,40
02,40
00.0
79.5
3%All
Vernal poo
l invertebrate suita
ble habitat, whe
rever
possible
Yes (not
quantified)
Yes (not
quantified)
‐‐
All
Estim
ated
minim
um req
uiremen
t7,50
07,50
043
1.3
862.0
11%
All
Estim
ated
maxim
um req
uiremen
t9,55
09,55
043
1.3
862.0
9%All
Alte
rnative Stay Ahe
ad M
easuremen
t for Zon
e 2
4,90
043
1.3
862.0
18%
Zone
3
3a90
% of m
odeled
AWS suita
ble core habita
t 15
915
90.0
17.5
11%
3aLand
to increase linkage from
chaparral in
zon
e to M
t.
Diablo chaparral
0.0
162.7
3bNo specific requ
irem
ents
00
0.0
30.6
‐‐3c
No specific requ
irem
ents
00
0.0
0.0
‐‐All
Estim
ated
minim
um req
uiremen
t40
040
030
.619
3.3
48%
All
Estim
ated
maxim
um req
uiremen
t75
075
030
.619
3.3
26%
East Con
tra Co
sta Co
unty HCP
/NCC
P 20
10 Ann
ual Rep
ort

Table 11
. Achievemen
t of Zon
e‐Specific Land
Acquisition
Req
uiremen
ts: R
eporting
Period an
d Cu
mulative Summary
Page 3 of 4
Zone
/ Subzon
eRe
quirem
ents
1acres
Min. A
cres (M
UDA)
Aqu
ired
Rep
orting
Pe
riod
To date
Percen
t Achieved
Zone
4
4a75
% of n
atural land
cover ty
pes
1,70
01,70
00.0
0.0
0%
4aKn
own occ. of D
iablo he
lianthe
lla and
Brewer's dwarf
flax
0.0
0.0
4aSee 4a/4h be
low
see be
low
0.0
0.0
‐‐4b
Know
n occ. fo
r Mt. Diablo fairy lantern if extant.
00
0.0
0.0
4cSee 4c/4e/4f/4g be
low
‐‐see be
low
0.0
0.0
‐‐4d
60% of n
atural land
cover ty
pes
953
953
0.0
0.0
0%4e
See 4c/4e/4f/4g be
low
‐‐see be
low
0.0
0.0
4fKn
own occ. fo
r Brew
er's dwarf flax (num
ber)
TBD
TBD
0.0
0.0
4fSee 4c/4e/4f/4g be
low
‐‐see be
low
0.0
0.0
4gSee 4c/4e/4f/4g be
low
‐‐see be
low
0.0
0.0
4h75
% of n
atural land
cover ty
pes
791
791
0.0
152.2
19%
4hLinkage be
tween Morgan Territo
ry Ranch, M
organ
Territo
ry RP and Mt. Diablo
‐‐‐‐
0.0
152.2
4hSee 4a/4h be
low
‐‐see be
low
0.0
0.0
4a/4h
90% of m
odeled
AWS suita
ble core habita
t20
020
00.0
15.5
8%4c/4e/4f/4g
18%/IDA or 39
%MDA of n
atural land
cover ty
pes in
4c, 4e, 4f, 4g
1,40
03,00
00.0
0.0
0%
All
Chaparral/Scrub
270
270
0.0
15.0
6%All
Estim
ated
minim
um req
uiremen
t4,90
06,05
00.0
152.2
3%All
Estim
ated
maxim
um req
uiremen
t6,15
08,35
00.0
152.2
2%Zo
ne 5
5aSee 5a/5d and 5a/5b/5d
below
‐‐see be
low
‐‐‐‐
‐‐5b
See 5a/5b/5d
below
‐‐see be
low
‐‐‐‐
5cAnn
ual G
rassland
/Suitable foraging
habita
t for
Swainson
's haw
k/ SJKF core and
movem
ent h
abita
t 1,00
01,00
01.0
1.0
0%
5cMod
eled
silvery legless lizard habitat, if fe
asible (for
MUDA)
0.0
0.0
5dSee 5a/5d and 5a/5b/5d
below
‐‐see be
low
‐‐‐‐
‐‐
East Con
tra Co
sta Co
unty HCP
/NCC
P 20
10 Ann
ual Rep
ort

Table 11
. Achievemen
t of Zon
e‐Specific Land
Acquisition
Req
uiremen
ts: R
eporting
Period an
d Cu
mulative Summary
Page 4 of 4
Zone
/ Subzon
eRe
quirem
ents
1acres
Min. A
cres (M
UDA)
Aqu
ired
Rep
orting
Pe
riod
To date
Percen
t Achieved
5a/5d
2 (IU
DA) o
r 4 (M
UDA) o
f the
occ. of b
rittlescale
4,30
0‐‐
2.0
5a/5d
At least 2 occurrences of recurved larkspur
20.0
1.0
50%
5a/5d
170 acres conn
ected to Byron
Airpo
rt preserved
areas
170
0.0
191.5
113%
5a/5b/5d
Ann
ual grassland
7,10
053
0.7
1,54
1.2
22%
All
Grassland
5,30
08,10
053
1.7
1,54
2.2
19%
All
Alkali grassland
750
900
33.4
90.8
10%
All
Alkali w
etland
4040
1.0
12.0
30%
All
Vernal poo
l invertebrate suita
ble habitat, whe
rever
possible
Yes (not
quantified)
8.8
All
Estim
ated
minim
um req
uiremen
t6,10
09,05
057
4.9
1,73
4.3
19%
All
Estim
ated
maxim
um req
uiremen
t7,20
011
,450
574.9
1,73
4.3
15%
Zone
66a
See 6a/6b/6c/6f b
elow
‐‐see be
low
0.0
0.0
‐‐6b
See 6a/6b/6c/6f b
elow
‐‐see be
low
0.0
0.0
‐‐6c
See 6a/6b/6c/6f b
elow
‐‐see be
low
0.0
0.0
‐‐6d
See 6d
/6e be
low
‐‐see be
low
0.0
0.0
‐‐6e
See 6d
/6e be
low
‐‐see be
low
0.0
0.0
‐‐6f
See 6a/6b/6c/6f b
elow
‐‐see be
low
0.0
0.0
‐‐6d
/6e
Alkali grassland
100
300
0.0
0.0
0%6d
/6e
Alkali w
etland
2040
0.0
0.0
0%6a/6b/6c/6f
Crop
land
or Pasture
250
400
0.0
0.0
0%All
Estim
ated
minim
um req
uiremen
t45
080
00.0
0.0
0%All
Estim
ated
maxim
um req
uiremen
t55
01,10
00.0
0.0
0%All Zo
nes
All
Estim
ated
minim
um req
uiremen
t21
,450
26,050
2,65
6.0
4,58
9.2
18%
All
Estim
ated
maxim
um req
uiremen
t27
,050
34,350
2,65
6.0
4,58
9.2
13%
Footno
te 1: The requ
irem
ents in
this ta
ble are a summary of th
e land
acquisitio
n requ
irem
ents in
Chapter 5 of the
HCP
/NCC
P; con
sult that
chapter for a complete de
scription of all land
acquisitio
n requ
irem
ents
East Con
tra Co
sta Co
unty HCP
/NCC
P 20
10 Ann
ual Rep
ort

East Contra Costa County HCP/NCCP 2010 Annual Report
East Contra Costa County Habitat Conservancy Page 9
Table 11 describes land acquisition, species habitat, and covered plant preservation requirements by Zone and/or Subzone. The table demonstrates significant progress toward land acquisition requirements within Zone 3 and Subzones 2a, 5a, and 5d.
New Preserve System Acquisitions Vaquero Farms North, Martin, Grandma’s Quarter, and Souza 3 are all located in what will be called, for management planning purposes, the Byron Hills what will be called, for management planning purposes, the Management Area (Acquisition Zone 5). This is where the eastern edge of the Diablo Range transitions to the San Joaquin Valley. Martin, Grandma’s Quarter, and Souza 3 contain headwaters and tributaries of Brushy Creek, a stream channel that provides a key linkage between the Mount Diablo foothills to the west and the Delta lowlands to east. Together with Souza 1, Souza 2, and Vaquero Farms South, the 2010 Byron Hills Management Area acquisitions build a contiguous block of protected lands in southeastern Contra Costa County, linking the Byron Airport Habitat Management Lands to Vasco Caves Regional Preserve and the Los Vaqueros Reservoir Watershed lands. They also form part of a broader regional block of protected lands across Alameda and San Joaquin Counties to preserve important habitat corridors for the San Joaquin kit fox. In addition to providing suitable movement and breeding habitat for the San Joaquin kit fox, these properties also contain important habitat for Western burrowing owl, golden eagle, Swainson’s hawk, among others. There is also potential habitat for covered plant species restricted to alkali soils, including Subzone 5a target species brittlescale and recurved larkspur. On the western edge of the Plan Area, the Ang and Irish Canyon acquisitions protect a different but equally important set of resources. These properties support a mosaic of habitat types, including oak woodland and savanna, grasslands and wetlands. They encompass part of the headwaters of Irish Canyon Creek and provide excellent habitat for California red‐legged frog and other species. The properties are located adjacent to Clayton, include spectacular views and one day will be an outstanding location for public access. The 2010 acquisitions are known to support or have the potential to support several covered species. This includes:
• Alameda whipsnake
• California tiger salamander
• California red‐legged frog
• western pond turtle
• tricolored blackbird
• Swainson’s hawk
• western burrowing owl
• Golden Eagle

East Contra Costa County HCP/NCCP 2010 Annual Report
East Contra Costa County Habitat Conservancy Page 10
• vernal pool fairy shrimp
• San Joaquin spearscale (2 ‐ known)
• recurved larkspur
• alkali milk‐vetch
• brittlescale
• big tarplant
• Brewer’s dwarf flax
• Diablo helianthella
• Mount Diablo fairy lantern
Each property acquired during the reporting period is briefly described below.
A Note on Property Acreages All acreage figures provided in this section were derived from the Conservancy’s geographic information system (GIS). GIS measurements typically do not match the acreage reported in deeds and legal descriptions. Because the pre‐existing parcel GIS is not necessarily accurate in rural areas, the Conservancy used a variety of techniques to better map the boundaries of the acquired properties. These techniques included aerial photography and descriptions of meets and bounds. Following these refinements, the GIS measure of acreage and the measure reported in deeds differ by no more than 1% for each property. Remaining discrepancies probably relate to discrepancies in GIS township and range maps, inaccurate fence line placement, and errors made in original and sometimes very old surveys. GIS acreages are used in this section because the GIS is the only practical means for measuring the amount of certain land cover and the other features within each property.
Wetland Preservation Acres Undercounted Though the Conservancy’s land cover map has been improved during Plan implementation and does include some field verification, the map is still largely based on aerial photo interpretation. Wetlands are small, isolated and difficult to see in aerial photos. A comprehensive field assessment of wetlands in Preserve System lands has not yet been performed (it will be performed as part of the inventory phase of management planning in 2011). Therefore, the wetland acres shown in the tables probably under estimate their actual extent.
Pre-Existing Conservation Easements The Plan provides the Conservancy the choice of counting or not counting toward conservation requirements the areas within pre‐existing conservation easements. If they are counted, the impacts associated with the development projects mitigated by these conservation easements must be counted toward impact allocations. A number of conservation easements were proposed or recorded on acquisition properties prior to the Conservancy’s involvement (see below for details). The proposed but as yet unrecorded easements are awaiting legal review by

East Contra Costa County HCP/NCCP 2010 Annual Report
East Contra Costa County Habitat Conservancy Page 11
the CDFG. In this report, areas within easements are not counted toward preservation requirements.
Vaquero Farms North Vaquero Farms North is a 575‐acre property adjacent to the Los Vaqueros Reservoir Watershed lands (Figures 8 and 9). It is situated entirely west of Vasco Road, with primary access from Vasco Road. The property was acquired for $2,770,000 by the California Wildlife Foundation (CWF) in 2009 using pre‐HCP/NCCP development fees secured by CDFG and USFWS and held by CWF in trust for the Conservancy. EBRPD, in partnership with the Conservancy, then purchased the property using a grant from the USFWS Cooperative Endangered Species Conservation Fund.
Topography consists of moderately sloping, rolling hills. Elevation ranges from approximately 100 to 485 feet above sea level. The property is subject to leases for wind‐energy access and support facilities; however, the leases are not in use and no wind turbines or support facilities exist on the property.
This acquisition protects key natural communities and suitable covered species habitat. It contributes to the protection of key habitat linkages in Acquisition Zone 5, Subzone 5a and 5c (Tables 8 and 11). Annual grassland is the dominant land‐cover type with alkali grasslands, alkali wetlands, rock outcrops, ponds, and ruderal also present. A number of drainage features, including springs, seeps, and ravines are interspersed throughout the property, including nearly 1 mile of intermittent and ephemeral streams. Freshwater marshes and seeps are present, consisting of areas with permanently or seasonally saturated soils supporting few to several perennial and annual herbaceous hydrophytic plant species. A number of wildlife species are known to be present near or on the site, including San Joaquin kit fox, California tiger salamander, California red‐legged frog, and western burrowing owl. Golden eagles breed and forage within the adjacent 20,000‐acre Los Vaqueros Reservoir and Watershed lands and are known to forage on the site. Suitable habitat exists for tricolored blackbird, Swainson’s hawk, and vernal pool fairy shrimp. The alkali grasslands, scalds, and wetlands along the valley bottom provide suitable habitat for recurved larkspur, San Joaquin spearscale, alkali milk‐vetch, and brittlescale.
Ang Ang is a 462‐acre property located just east of Clayton and adjacent to Black Diamond Mines Regional Preserve (Figures 10 and 11). It borders the Oakhurst subdivision and City of Clayton open space on the east. The property was purchased in partnership with the EBRPD for $2,763,840 (Table 7). A grant to the Conservancy from the USFWS Cooperative Endangered Species Conservation Fund provided significant funding.
Springs and seeps dot the property on the western slopes of Kreiger Peak, supporting wetland habitats. The property is generally moderately to steeply sloping, with an area of lesser slopes comprising the southwest quarter of the property. The site topography is dominated by northwest‐trending ridgelines, with rounded northeast‐trending secondary ridges.

O
Lege
nd
Figu
re 8
. V
aque
ro F
arm
s N
orth
Pro
perty
- La
ndco
ver M
ap
Prop
erty
Boun
dary
02/0
9/20
11
075
01,
500
Feet
Land
cove
rGr
asslan
d
Wetl
and
Aqua
tic
Irriga
ted A
gricu
lture
Deve
lopedcrop
land
past
ure
vine
yard
alka
li gr
assl
and
(33.
41 a
cres
)
rude
ral (
4.03
acr
es)
alka
li w
etla
nd (0
.96
acre
s)
perm
anen
t w
etla
nd
aqua
tic/o
pen
wat
er
rock
out
crop
s (3
.87
acre
s)
aque
duct
win
d tu
rbin
es
oak
sava
nna
chap
arra
l
gras
slan
d(5
31.6
9 ac
res)
seas
onal
wet
land
(364
6.72
feet
)st
ream
pond
(0.8
9 ac
res)
oak
woo
dlan
d
urba
n
ripar
ian

Figure 9. Vaquero Farms North - Representative Photographs
Oaks on Sandy Soil
Ponds
Wetlands
Large rock outcrops

Irish Canyon
Trib o
f Irish
Cany
on
Trib o
f Irish
Can
yon
Trib o
f Irish
Can
yon
Trib o
f Irish
Can
yon
Trib of
Irish C
anyon
Trib of Irish Canyon
Trib o
f Irish
Cany
on
O
Lege
nd
Figu
re 1
0.
Ang
Pro
perty
- La
ndco
ver M
ap
Prop
erty
Boun
dary
02/0
9/20
11
075
01,
500
Feet
Land
cove
rGr
asslan
d
Wetl
and
Aqua
tic
Irriga
ted A
gricu
lture
Deve
lopedcrop
land
past
ure
vine
yard
alka
li w
etla
nd (0
.31
acre
s)
perm
anen
t w
etla
nd (0.3
5 ac
res)
seas
onal
wet
land
aqua
tic/o
pen
wat
er
alka
li gr
assl
and
rude
ral
aque
duct
win
d tu
rbin
es
rock
out
crop
s
oak
sava
nna
(61.
72 a
cres
)
pond
(0.5
4 ac
res)
chap
arra
l(18
.01
acre
s)
(196
78.0
5 fe
et)
stre
am
gras
slan
d(3
49.0
6 ac
res)
urba
n(0
.32
acre
s)
oak
woo
dlan
d(4
9.57
acr
es)
ripar
ian
(0.0
1 ac
res)

Figure 11. Ang - Representative Photographs
Ponds
Old Structures at Homestead
Bettencourt Homestead on the edge of Clayton Creek
Wetlands
Sweeping Views

East Contra Costa County HCP/NCCP 2010 Annual Report
East Contra Costa County Habitat Conservancy Page 12
Development is limited to a small ranch house. The current land use is grazing, and the site has been grazed heavily.
The property provides an important buffering function to existing residential development in the Oakhurst subdivision. The Black Diamond Way public trail passes through it, connecting a staging area at Clayton Road to Black Diamond Mines Regional Preserve. Mount Diablo State Park is situated to the south of the property, south of Marsh Creek Road. Acquisition of the property enables pro‐active management for urban interface issues such as water quality and will buffer other parts of the property and neighboring portions of the Preserve System from urban influences.
This acquisition protects key natural communities and suitable covered species habitat in Acquisition Zones 2 and 3, Subzones 2a and 3b (Tables 8 and 11). Annual grassland is the dominant land‐cover type. Oak savanna, oak woodlands, seasonal wetlands, riparian, alkali wetlands, wetlands, and pond land‐cover types are also present. The site contains nearly 4 miles of streams, including a portion of the headwaters for Irish Canyon Creek. The property provides suitable habitat for Alameda whipsnake, California red‐legged frog, California tiger salamander, western pond turtle, western burrowing owl, golden eagle, big tarplant, Brewer’s dwarf flax, Diablo helianthella, and Mount Diablo fairy lantern.
Martin Martin is a 234‐acre property located along the east and west frontages of Vasco Road, south of Camino Diablo (Figures 12 and 13). The property was purchased in partnership with the EBRPD for $2,745,395 with federal and non‐federal funds (Table 7). The Conservancy contributed 41% ($1,115,579) from federal grants, and EBRPD contributed 59% ($1,629,816) with eligible non‐federal funds.
The property has slightly to moderately sloping terrain, with elevations ranging from about 100 feet in the northerly section of the property to a maximum of 240 feet on the hilltops in the central and southerly section of the property. The westerly area of the property has the same terrain, but with a greater percentage of slightly sloping lands. The property drains to the North Fork of Brushy Creek. Annual grassland is the dominant natural community on the property. Ruderal land cover and a perennial wetland are also present. The property contains support facilities for most of the grazing activity in this portion of the Preserve System and includes several barns and a ranch house. Four cellular communication facilities exist on the property and lease revenues now support land management and other HCP/NCCP implementation tasks.
This acquisition protects key natural communities and suitable covered species habitat in Acquisition Zone 5, Subzone 5a (Tables 8 and 11). The 230.37 acres of grassland within the parcel contributes to Subzone 5a land cover acquisition targets, as well as the preserve‐wide grassland acquisition requirement. Alkali grasslands, perennial wetlands, and the North Fork of Brushy Creek also contribute to preserve‐wide acquisition targets. Important breeding and foraging habitat for Western burrowing owl and golden eagle, as well as limited habitat for

Trib of Brushy
O
Lege
nd
Figu
re 1
2.
Mar
tin P
rope
rty -
Land
cove
r Map
Prop
erty
Boun
dary
02/0
9/20
11
060
01,
200
Feet
Land
cove
rGr
asslan
d
Wetl
and
Aqua
tic
Irriga
ted A
gricu
lture
Deve
lopedcrop
land
past
ure
vine
yard
alka
li gr
assl
and
(0.8
5 ac
res)
rude
ral (
2.29
acr
es)
alka
li w
etla
nd
perm
anen
t w
etla
nd
aqua
tic/o
pen
wat
er
rock
out
crop
s
aque
duct
win
d tu
rbin
es
oak
sava
nna
chap
arra
l
gras
slan
d(2
30.3
6 ac
res)
seas
onal
wet
land
(681
.69
feet
)st
ream
pond
(0.0
6 ac
res)
oak
woo
dlan
d
urba
n(0
.77
acre
s)
ripar
ian
(0.0
1 ac
res)

Figure 13. Martin - Representative Photographs
California red legged frog on Martin Wetland monitoring
View looking to the west across Vasco Road
American flag barn by the ponds on Martin

East Contra Costa County HCP/NCCP 2010 Annual Report
East Contra Costa County Habitat Conservancy Page 13
Swainson’s hawk is also present. Finally, the property contains known occurrences of California red‐legged frog and California tiger salamander.
Grandma’s Quarter Grandma’s Quarter is a 157‐acre property located approximately 0.5 miles south of Armstrong Road, southwest of the unincorporated community of Byron (Figures 13 and 15). The property was purchased in partnership with the EBRPD for $1,036,200 with a combination of EBRPD funds and the Conservancy’s federal grants.
Elevations range from 190 feet along the north property line to 520 feet in the far southwest corner across a variety of environmental gradients. Topography ranges from rolling to moderately sloping hills, with two areas of steeper gradient in the southwest and northeast portions of the property. The property contains a Brushy Creek tributary
The current land use on the property is grazing and development is limited. There is a spring box‐fed water trough. An all weather gravel road extends to the middle of the property to connect with an east‐west gravel paved road in the southerly area maintained by the wind power lessee to the west (on an adjacent property). Four sets of electrical transmission line towers traverse the central part of the property within a PG&E easement. Although the property is located within a Wind Energy Resource Area, as defined in the 2005 County General Plan, there are no longer any wind turbines on the property, the prior turbines having been removed in 2007. A wind lease is still extant and royalties are paid. There is no major subdivision activity in this area. Adjacent to the property, there are several large wind turbines and one rural home site (approximately 0.1 miles from the property).
This acquisition protects key natural communities and suitable covered species habitat in Acquisition Zone 5, Subzone 5a (Tables 8 and 11). The property also provides suitable breeding and foraging habitat for Western burrowing owl, golden eagle, California tiger salamander and California red‐legged frog. There is a known occurrence of San Joaquin spearscale.
Souza 3 Souza 3 is 1,026‐acre property (Figures 16 and 17). It is located east of Vasco Road, south of Armstrong Road, and southwest of the unincorporated community of Byron. The property was purchased in partnership with the EBRPD for $5,300,400, with a combination of funding from the Gordon and Betty Moore Foundation, EBRPD and the Federal Cooperative Endangered Species Conservation Fund.
The property has a varied topography and is located in an agricultural area. A series of ridgelines dominate the westerly, north‐central, and easterly areas. Elevations range from 640 to 850 feet. The terrestrial land cover types include annual grassland, alkali grassland, riparian, non‐native woodland, and ruderal. Aquatic land cover types include perennial wetland, alkali wetlands, and a pond. The length of the stream (Brushy Creek headwater) that traverses the property is approximately 12,913 linear feet. The current land use is grazing. Development includes a bunk house, weighing shed and scales, hay shed, two small storage sheds, cattle chute, and corral fencing. There are also 31 wind turbines and 3 leased cellular communication antenna sites and lease revenue from these facilities now fund management and other
Trib of Brushy
Trib of Brushy
Trib of Brushy
Trib of Brushy
Trib o
f Bru
shy
O
Lege
nd
Figu
re 1
4.
Gra
ndm
a's
Qua
rter P
rope
rty -
Land
cove
r Map
Prop
erty
Boun
dary
02/0
9/20
11
030
060
0
Feet
Land
cove
rGr
asslan
d
Wetl
and
Aqua
tic
Irriga
ted A
gricu
lture
Deve
lopedcrop
land
past
ure
vine
yard
alka
li gr
assl
and
(0.4
1 ac
res)
rude
ral (
1.72
acr
es)
alka
li w
etla
nd
perm
anen
t w
etla
nd
aqua
tic/o
pen
wat
er
rock
out
crop
s
aque
duct
win
d tu
rbin
es
oak
sava
nna
chap
arra
l
gras
slan
d(1
54.8
4 ac
res)
seas
onal
wet
land
(585
0.84
feet
)st
ream
pond oa
k w
oodl
and
urba
n
ripar
ian
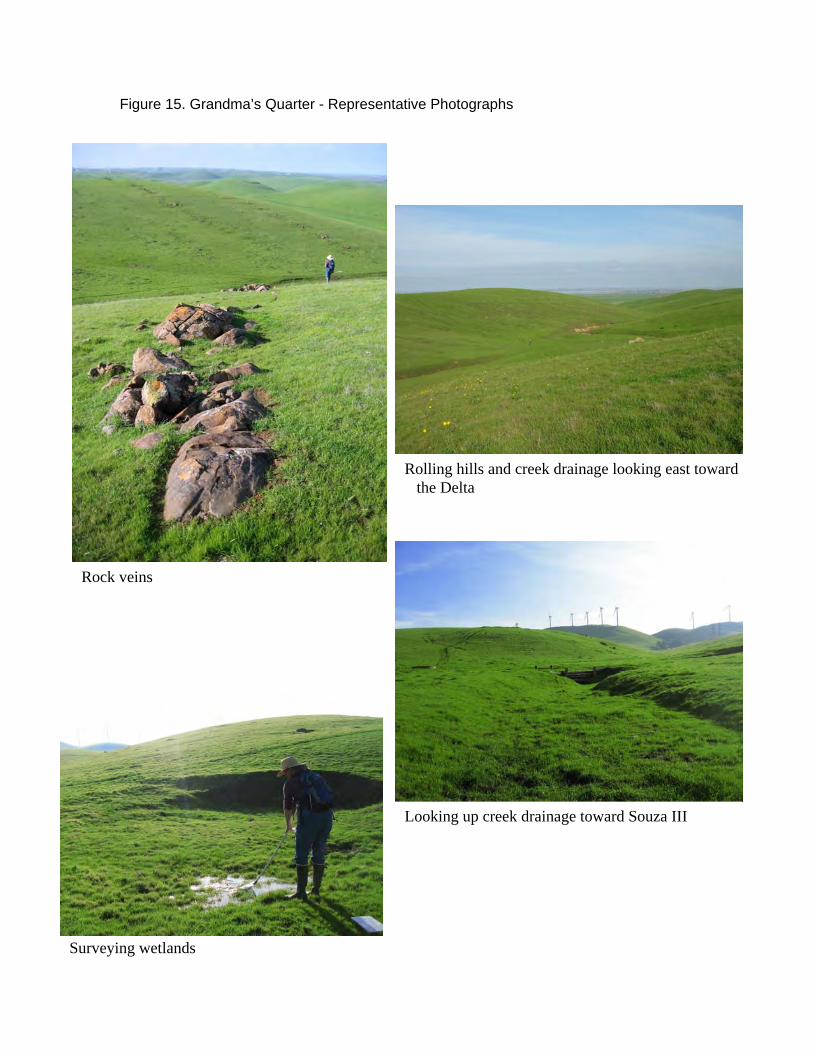
Figure 15. Grandma’s Quarter - Representative Photographs
Rolling hills and creek drainage looking east toward the Delta
Rock veins
Looking up creek drainage toward Souza III
Surveying wetlands

Vasc
o Rd
Brushy Creek
Trib o
f Bru
shy
Trib of Brushy
Trib of B
rushy
Trib o
f Bru
shy
O
Lege
nd
Figu
re 1
6.
Sou
za II
I Pro
perty
- La
ndco
ver M
ap
Prop
erty
Boun
dary
02/0
9/20
11
075
01,
500
Feet
Land
cove
rGr
asslan
d
Wetl
and
Aqua
tic
Irriga
ted A
gricu
lture
Deve
lopedcrop
land
past
ure
vine
yard
alka
li gr
assl
and
(29.
87 a
cres
)
rude
ral (
22.4
7 ac
res)
alka
li w
etla
nd (3
.02
acre
s)
perm
anen
t w
etla
nd
aqua
tic/o
pen
wat
er
rock
out
crop
s
aque
duct
win
d tu
rbin
es (1
9.95
acr
es)
oak
sava
nna
chap
arra
l
gras
slan
d(9
46.9
5 ac
res)
(0.0
2 ac
res)
seas
onal
wet
land
(159
12.5
8 fe
et)
stre
am
pond
(1.6
0 ac
res)
oak
woo
dlan
d
urba
n
ripar
ian
(1.2
4 ac
res)
non-
nativ
e w
oodl
and
(0.7
3 ac
res)

Figure 17. Souza III - Representative Photographs
A pond on Souza III
Creek corridor adjacent to Vasco Road
Looking up large drainage above main ponds
California tiger salamander larva
Wetland survey near barn

Irish C
anyo
n
Trib o
f Irish
Can
yon
Trib o
f Irish
Can
yon
Trib of Iri
sh Canyon
O
Lege
nd
Figu
re 1
8.
Irish
Can
yon
Pro
perty
- La
ndco
ver M
ap
Prop
erty
Boun
dary
02/0
9/20
11
050
01,
000
Feet
Land
cove
rGr
asslan
d
Wetl
and
Aqua
tic
Irriga
ted A
gricu
lture
Deve
lopedcrop
land
past
ure
vine
yard
alka
li gr
assl
and
rude
ral
alka
li w
etla
nd
perm
anen
t w
etla
nd
aqua
tic/o
pen
wat
er
rock
out
crop
s
aque
duct
win
d tu
rbin
es
oak
sava
nna
(57.
82 a
cres
)
chap
arra
l
gras
slan
d(2
01.0
0 ac
res)
(0.4
2 ac
res)
sea
sona
l wet
land
(129
44.4
8 fe
et)
stre
am oak
woo
dlan
d(3
9.99
acr
es)
urba
n
ripar
ian
(13.
50 a
cres
)
pond
(0.3
1 ac
res)

Figure 19. Irish Canyon - Representative Photographs
Upper pond
View of Irish Canyon property from the pond berm
Lower drainage on property
Spring

East Contra Costa County HCP/NCCP 2010 Annual Report
East Contra Costa County Habitat Conservancy Page 14
HCP/NCCP implementation tasks. A line of high voltage transmission towers is located within an easement that bisects the easterly portion of the property. There are well maintained gravel access roads across the site. There is no major subdivision activity in this area
The property is located within Acquisition Zone 5, subzones 5a, 5b, and 5d. There are 935.7 acres of grassland land cover that contributes to targets for subzones 5a, 5b, and 5d, as well as, the overall grassland acquisition requirement. Alkali grasslands, alkali wetlands, perennial wetlands and tributaries from the main stem of Brushy Creek contribute to preserve‐wide acquisition targets.
There are known occurrences of California tiger salamander, California red‐legged frog, and San Joaquin spearscale. Purple needlegrass, an uncommon vegetation type, is also known to occur on the property.
Irish Canyon Irish Canyon is a 314‐acre property located north of Marsh Creek Road and approximately one mile east of the City of Clayton. The property is near the Black Diamond Way public trail that connects a trailhead at Clayton Road to Black Diamond Mines Regional Preserve. The property was purchased in partnership with the EBRPD for $842,000. The property had been valued at $1,760,000. The seller, Save Mount Diablo, agreed to a more than 50% reduction from the purchase price, reflecting a pass‐through of a grant Save Mount Diablo received from the Gordon and Betty Moore Foundation that covered a portion of their initial purchase price as well as a donation of Save Mount Diablo funds.
The property contains modest variations in elevation and highly varied topography. Irish Canyon Creek and various tributaries traverse the property. Springs and seeps dot the property on the southern slopes of Kreiger Peak supporting wetland habitats as well as the perennial pond. The small tributaries on the northern half of the property support healthy riparian communities in some areas. There are no constructed facilities on the property. Save Mount Diablo originally purchased the property in 2007 and has agreed to continue to perform restoration and management activities for the next three years.
The property serves a critical connectivity between open space and other acquired lands for wildlife species in the area. Natural communities found on the property include annual grassland, oak savanna, oak woodland, seasonal wetlands, ephemeral streams, and a pond. Annual grassland is the dominant community on the property.
This acquisition protects key natural communities and suitable covered species habitat in Acquisition Zone 2, Subzone 2a. The parcel contains 196 acres of grassland land cover which contribute to land cover acquisition targets for Subzones 2a and to the overall acquisition requirement for grassland. The presence of oak savanna and oak woodland, a pond and wetland contribute to preserve‐wide acquisition targets. California red‐legged frogs breed in the large pond in the northeast corner of the property and golden eagles forage on the property. The property provides suitable habitat for numerous other covered species, including California tiger salamander, Western burrowing owl, Alameda whipsnake, and various plant species.

East Contra Costa County HCP/NCCP 2010 Annual Report
East Contra Costa County Habitat Conservancy Page 15
IV. HABITAT RESTORATION AND CREATION Habitat restoration and creation is a critical component of the Plan’s conservation strategy. Restoration and creation of specific habitats and land‐cover types is required in addition to protection of land within the Preserve System. Together, land preservation and restoration/creation provide benefits to covered species, natural communities, biological diversity, hydrologic function, and ecosystem function to compensate for impacts and to contribute to recovery of covered species. Habitat restoration and creation includes several focus areas.
Wetlands and Streams Wetlands and streams exhibit a high degree of biological, physical, and hydrologic diversity in the inventory area. Consequently, it is important to preserve, enhance, restore, or create the full diversity of these land‐cover types. Restoration of wetlands ensures no net loss of wetlands in the Plan inventory area and replaces the functions of land‐cover types lost to covered activities.
Alkali Wetlands Alkali wetlands are particularly rare in the Plan inventory area, mainly occurring on a 380‐acre wetland complex in the southeastern portion of the inventory area south and east of Byron. Land‐cover mapping indicates that less than 1% of the Plan inventory area contains alkali wetlands (see page 3‐18 of the Plan).
Mitigation and Contribution to Recovery Conservation Measures 2.1, 2.3 and 2.10 in the Plan require wetland and stream restoration and creation to compensate for future impacts on these land‐cover types caused by development activities. Likewise, the Plan requires wetland restoration and creation actions over and above mitigation requirements to contribute to recovery of covered species. Restoration or creation activities must stay ahead of impacts, as required by the NCCP Act.
Over the 30‐year life of the Plan, the Conservancy may be required to restore or create a large number of acres of various types of wetlands and waters. If impacts on wetlands and waters are substantial during those 30 years, the cumulative total restoration/creation acreage could exceed 500 acres. A more likely but still‐conservative projection is 300 acres, which amounts to 10 acres of restoration/creation per year. However, in the first three years of Plan implementation, less than an acre of permanent impacts to wetlands has occurred, requiring less than one acre of restoration to mitigate. The pace is expected to fluctuate in the future.
During the reporting period, the Conservancy constructed one restoration project and continues to monitor three restoration projects that have not yet met success criteria. The projects are as follows:
• Irish Canyon Riparian Restoration Project (constructed 2010).

East Contra Costa County HCP/NCCP 2010 Annual Report
East Contra Costa County Habitat Conservancy Page 16
• Lentzner Springs Restoration Project (constructed 2008)
• Souza I Restoration Project (constructed 2008)
• Souza II Restoration Project (constructed 2009)
For each project, a discussion of goals and objectives, contribution to restoration and creation requirements, and performance criteria and monitoring is provided below. Table 8b provides natural community‐level and property specific restoration and creation summaries. Table 12 provides a summary of aquatic and stream land‐cover restoration and creation by watershed. During the reporting period, the one restoration project initiated (Irish Canyon Riparian Restoration) resulted in:
• 0.9 acre riparian habitat restored
• 688.5 linear feet stream restored
The four restoration projects constructed provide a range of benefits to covered species. The Irish Canyon Riparian Restoration Project is expected to benefit covered amphibian species. Wetland restoration on the Lentzner, Souza I, and Souza II properties increase habitat value for California red‐legged frog and California tiger salamander, and for covered vernal pool crustaceans. Restoration on Lentzner and Souza II also increases habitat value for covered alkali grassland and alkali wetland plant species.
Irish Canyon Riparian Restoration Project Project Overview The Irish Canyon Riparian Restoration Project is located on the 314‐acre Irish Canyon property in the Mt. Diablo Creek watershed (Figure 20). The goal of the restoration project is to fill in gaps in riparian woodland habitat.
The restoration was initiated in late 2009 and completed in March 2010. This project was performed by Save Mount Diablo staff and volunteers. The project involved the planting of more than 400 locally collected valley oaks acorns and buckeye nuts in three denuded stream reaches. Planting sites were caged and watering took place every three weeks after the rains stopped at the end of May 2010.
The project is expected to result in the restoration of 0.91 acres of riparian habitat and 688.5 linear feet of stream.
Performance Criteria and Monitoring The Irish Canyon Restoration Project will be monitored for three years, and all failed plantings will be replaced during this period. After three years, the site will be adaptively managed by the Conservancy and EBRPD consistent with the long‐term management plan to be developed for the site.

East Contra Costa County HCP/NCCP 2010 Annual Report
East Contra Costa County Habitat Conservancy Page 17
Monitoring and Adaptive Management to Date As of June 10th, 2010, 92 of the 150 sites planted were occupied by one or more saplings. Additional mortality was observed after June, as several sites were permanently lost on a south facing slope presumably due to poor soils and lack of water. Of surviving sites, as of August 2010, 90% looked robust. All vacant sites were replanted in December 2010/January 2011.
Recommendations/Future Actions The site will continue to be monitored for two more years and all plantings will be watered for two more summers. Weeding will continue as needed around the plantings.
Lentzner Springs Wetland Restoration Project Project Overview The Lentzner Springs Wetland Restoration Project, constructed in 2008, is located at the northeastern edge of the Lentzner property in the upper part of a valley that drains to Oil Canyon Creek within the Sand Creek sub‐basin of the Marsh Creek Watershed (Figure 20).5 The project was the first wetland restoration project implemented under the Plan. The restoration area was 0.5 acre and included restoration of a seasonal alkali wetland and native grassland (Table 8b).
Performance Criteria and Monitoring The restored seasonal alkali wetlands are being monitored using a number of performance criteria (Table 13a). These criteria are based on survivorship and health of individual plants during the three years following construction. If performance criteria for survivorship are not met during this time, adaptive management actions will be triggered and annual monitoring of survivorship of planted plants will continue until performance criteria are met.
After survivorship performance criteria are met, absolute cover of native wetland vegetative cover will be monitored and evaluated annually for two additional years. After two years, if vegetative cover performance criteria have been met each year, monitoring will cease and the project will be considered successful. If performance criteria have not been met each year, adaptive management actions will be taken to supplement existing plantings and/or to modify the site grading. In this case, monitoring will continue until the criteria are met for two consecutive years.
Monitoring and Adaptive Management to Date Year 2 monitoring for the Lentzner Springs restoration project was conducted on June 1, 2010 (Nomad Ecology 2010a). Monitoring results found that the restoration site is meeting its performance criteria of at least 75% survival of the planted species. Three of the planted species, saltgrass (Distichlis spicata), alkali heath (Frankenia salina), and Great Valley gumweed
5 Project is located within the Oil Canyon Creek sub‐basin of the Sand Creek sub‐basin within the Marsh Creek Watershed.

East Contra Costa County HCP/NCCP 2010 Annual Report
East Contra Costa County Habitat Conservancy Page 18
(Grindelia camporum var. camporum) are surviving and spreading. One of the species planted, bulrush (Scirpus sp.) has entirely died off. Although the performance criteria are being met, observations of the restoration site suggest it may initially be functioning more like an alkali grassland than an alkali wetland.
Recommendations/Future Actions Recommendations provided in the 2010 monitoring report (Nomad Ecology 2010a) include sampling protocol modifications, performance standard revisions, mapping of wetland features on site, additional plantings, and weed control. Additionally, continued weeding and herbicide spraying will be conducted by Thunder Mountain on the Lentzner restoration site in 2011.
Vasco Caves Souza I Pond Creation Project Project Overview The Vasco Caves Souza I Pond Creation Project, constructed in 2008, is located in the northwestern corner of the Souza 1 property, about 1 mile north of the Alameda/Contra Costa County border (Figure 20). The project area totaled 2.6 acres and included creation of a 0.2‐acre seasonal pond habitat and 0.99 acres of seasonal wetland (Table 8). The project was designed to provide breeding habitat for California tiger salamander and to support seasonal wetland vegetation. The pond was designed to collect precipitation and storm water sheet flow from an approximately 15‐acre sub‐watershed of the Brushy Creek Watershed and a swale into the pond. Pond design elements included an approximately 1‐acre, 1‐foot deep portion (the seasonal wetland portion) and a smaller 2‐ to 3‐foot deep portion (the pond habitat portion). The pond was designed with three depths because the project area is subject to high evaporation rates and minimal rainfall. The 2‐ to 3‐foot portion of the pond was created with the intent to hold water longer into spring. The 3‐foot‐deep area of the pond fills and spills into the 2‐ and 1‐foot areas of the pond. The 2‐ to 3‐foot area of the pond provides breeding habitat for the California tiger salamander. It is expected that the pond will dry annually by June and start retaining water with the first rain (usually late October). The pond and wetland were seeded with a wetland seed mix. The surrounding uplands were seeded with a native grassland mix.
Performance Criteria and Monitoring The seasonal pond and native wetland plant species are being monitored using a number of performance criteria (Table 13b). The performance criteria for the created seasonal pond and wetland species are based on the number of days the pond is inundated and on survivorship of the hydrophytic species over the 5‐year monitoring period. Progress of the restoration plantings will be considered satisfactory if the performance criteria are met or exceeded. After the performance criteria are met, the restoration project will be considered successful. Failure to meet the performance criteria may result in further improvements to the pond, including grade adjustments, planting and seeding.

East Contra Costa County HCP/NCCP 2010 Annual Report
East Contra Costa County Habitat Conservancy Page 19
Monitoring and Adaptive Management to Date The pond restoration was monitored in 2010 by Monk and Associates. The created pond met the hydrology and overall vegetation performance criteria for Year 2, although the pond was found to be overgrown with non‐native Italian ryegrass, and so it was re‐seeded with a native seed mix consisting of various native grasses, toad rush (Juncus bufonius), and coyote thistle (Eryngium vaseyi) in September of 2010. Monk and Associates reported that the pond has attracted a minimum of seven bird species, three mammal species, and three amphibian species, including California tiger salamander which successfully breeds in the pond.
Recommendations/Future Actions Monk and Associates recommended that the pond be fenced off from sheep grazing through the remainder of the five‐year establishment period of the pond. They also recommended against rodent control in the pond vicinity, to allow for establishment of burrows that would benefit California tiger salamander, California red‐legged frog and western burrowing owl.
In 2011 the site will be spot treated with herbicide to control Italian ryegrass, and the site will continue to be weeded and monitored.
Souza II Wetland Restoration Project Project Overview The Souza II Wetland Restoration Project, constructed in fall/winter of 2009, is located within the Brushy Creek Watershed along the North Fork of Brushy Creek as it traverses the Souza II property (Figure 20). The entire project area was about 60 acres and included restoration of 3,508 feet of an intermittent stream tributary, creation of 0.2 acre pond, and restoration of 8.9 acres of seasonal wetland.
The 2009 restoration project restored the natural hydraulic function of the eastern third of the North Fork of Brushy Creek on the Souza II property by reconnecting it to its floodplain. To do this, the project removed the berms north and south of the tributary and graded the flood plain to better retain water. Vernal pools were created south of the creek. Incised stream banks were laid back in some places and a pond and swale were created. As a result, suitable in‐stream and pond habitat was created for covered species such as the California red‐legged frog and California tiger salamander, pools suitable for fairy shrimp species were restored and degraded grassland areas of the site were restored with native grasses and rare plants. Restoration of the seasonal wetland included retiring a dirt road and a culvert installed on the tributary. More than 15,000 plant plugs were planted at the project, grown from locally‐collected seeds at the Watershed Nursery in Richmond. A native upland and wetland seed mix was also applied.
Performance Criteria and Monitoring The restored wetland and pond are being be monitored using a number of performance criteria (Table 13c). Vegetation monitoring is occurring during the first three years early to mid‐spring,

East Contra Costa County HCP/NCCP 2010 Annual Report
East Contra Costa County Habitat Conservancy Page 20
after or during the end of the rainy season. During this time vegetation will be monitored for plant survival and health. Throughout the 5‐year monitoring period, the percent cover of nonnative invasive plant species will be considered satisfactory if less than 5% of the project site is covered with nonnative invasive plants. Progress of the restoration plantings will be considered satisfactory if the criteria are met or exceeded.
Adaptive management measures will be implemented if the restoration project fails to meet the performance criteria. Measures that may be implemented include additional plantings or installation of erosion control structures/devices. Failure of the adaptive management measures to meet the performance criteria, may result in the reduction of restoration acreages counted toward the Plan requirements.
Monitoring and Adaptive Management to Date The restoration project was completed in 2009, and Year One monitoring was conducted in late spring 2010. Overall plants survival and average absolute cover of native plants are well below the performance standards. Areas that appeared to pond water well had the highest percent survival of planted plants, and the lowest cover of non‐native vegetation that outcompeted plantings. Areas with strongly alkaline soils had low survival of native wetland species and low cover of non‐native species; these areas are better characterized as alkaline seasonal wetlands and scalds rather than emergent wetlands. Erosion was observed in areas where work had been performed and vegetation had not become re‐established.
All the locations marked as seeded with brittlescale (Atriplex depressa) were visited and no brittlescale was observed but the common native species, valley saltbush (Atriplex fruticulosa), was observed at all these locations. It was determined that this species had originally been misidentified as brittlescale. Thus, seed of valley saltbush rather than brittlescale had been collected and seeded on the restoration site. Valley saltbush was doing well where it was seeded and will likely reseed and vegetate the surrounding areas.
Wetland and pond acreage monitoring did not occur during the late spring 2010 monitoring because it was not possible to tell the extent of wetlands and ponds so soon after the restoration was completed. Hydrologic connectivity monitoring, depth and duration monitoring, and in‐stream pool monitoring had not yet been completed for Year One in the late spring 2010 monitoring “and will occur after a major storm event in winter 2010/2011”
Remedial measures were implemented in late 2010 in response to the observation of erosion problems. The BMPS were reinforced, saltgrass was planted in the BMP areas, and additional salt grass plugs were planted along the banks to armor these areas and protect against further erosion.
Additionally, fairy shrimp inoculum was translocated to restored seasonal wetlands on the Souza II property from a site on Deer Valley Road, where impacts to a wetland occupied by this species are anticipated. The top 2 inches of soil were collected from the salvage site, transported to the Souza II site, and spread in a thin layer in the deepest part of the restored seasonal wetland during its dry period.

East Contra Costa County HCP/NCCP 2010 Annual Report
East Contra Costa County Habitat Conservancy Page 21
Recommendations/Future Actions Recommendations provided by Nomad Ecology (2010b) include re‐mapping and re‐characterizing of vegetation communities; modifying the plant palette based on an assessment of location hydrology and reference sites, and re‐planting areas as appropriate based on modified plant palettes; introducing special status plants; revising monitoring protocol and performance standards; use of more aggressive hand weeding and grazing to control Italian ryegrass and thatch; repairing eroded areas; and armoring banks and controlling flows with vegetation, straw wattles, etc., to protect against future erosion. As described above, measures were implemented in late 2010 to repair eroded areas, armor banks, control flows and protect against future erosion, consistent with recommendations in the monitoring report. The remaining recommendations will be implemented in 2011.

·|} þ4
Figu
re 2
0. L
ocat
ion
of H
abita
t Res
tora
tion
and
Cre
atio
n P
roje
cts
456J4
·|} þ4
·|} þ160
·|} þ4
Pittsb
urgAn
tioch
Oakle
y
Brentw
ood
Bay
Poin
t
Knigh
tsen
ByronDis
covery
Bay
Conco
rd
Walnu
tCre
ek
Clayto
n
Bethe
lIsla
nd
San
Ramo
nBlackh
awk
O0
24
Mile
s
Cou
nty
Urb
an L
imit
Line
Pres
erve
d La
nds
HC
P A
cqui
red
2010
HC
P A
cqui
red
pre-
2010
Pre
HC
P
Alamo
Souz
a 2 W
etlan
dRe
storat
ionPr
oject
Vasc
o Cav
esSo
uza 1
Pond
Crea
tion P
rojec
t
Lentz
er Sp
rings
Wetla
nd R
estor
ation
Pr
oject
Irish C
anyo
nRi
paria
n Res
torati
on
Proje
ct
2010
Pro
ject
spr
e-20
10 P
roje
cts

Table 12
. Aqu
atic and
Stream Lan
d Co
ver Re
storation an
d Creation
by Watershed
Page 1 of 1
Basin/Watershed
Riparian woodland/ scrub
Perennial
wetlands1
Seasonal wetlands
Alkali wetlands
Ponds
Reservoir (open
water)2
Slough/ channel
Aquatic Land Cover Total
Perennial
Intermittent
Ephemeral
Stream Land Cover Total
Brushy
Restoration
‐‐0.2
7.7
‐‐‐‐
‐‐‐‐
7.9
‐‐2,40
9.4
‐‐2,40
9.4
Creatio
n‐‐
‐‐‐‐
‐‐0.3
‐‐‐‐
0.3
‐‐‐‐
‐‐‐‐
subtotal
0.0
0.2
7.7
0.0
0.3
0.0
0.0
8.2
0.0
2,40
9.4
0.0
2,40
9.4
Sand
Restoration
‐‐‐‐
‐‐0.1
‐‐‐‐
‐‐0.1
‐‐‐‐
‐‐0.0
Creatio
n‐‐
‐‐‐‐
‐‐‐‐
‐‐‐‐
‐‐‐‐
‐‐‐‐
‐‐subtotal
0.0
0.0
0.0
0.1
0.0
0.0
0.0
0.1
0.0
0.0
0.0
0.0
Upp
er M
t. Diablo
Restoration
0.9
‐‐‐‐
‐‐‐‐
‐‐‐‐
0.9
‐‐90
8.8
‐‐90
8.8
Creatio
n‐‐
‐‐‐‐
‐‐‐‐
‐‐‐‐
‐‐‐‐
‐‐‐‐
‐‐subtotal
0.9
0.0
0.0
0.0
0.0
0.0
0.0
0.9
0.0
908.8
0.0
908.8
Total for In
ventory
Area
0.9
0.2
7.7
0.1
0.3
0.0
0.0
9.2
0.0
3,31
8.2
0.0
3,31
8.2
Aqu
atic Lan
d Co
ver (acres)
Stream
Lan
d Co
ver (line
ar fe
et)
1 Perennial wetland
s includ
e wetland
s of inde
term
inate hydrology. In
App
endix J, pe
renn
ial w
etland
s are classifie
d as wetland
s2 The
term
aqu
atic used in App
endix J refers to reservoirs and op
en water. R
eservoir (open water) is used to in
place of a
quatic in
this ta
ble to rem
ain
consistent with
the othe
r tables in
this rep
ort.
East Con
tra Co
sta Co
unty HCP
/NCC
P 20
10 Ann
ual Rep
ort

Page 1 of 1
Year Criterion Satisfactory Progress Threshold1 75% survival in Good or Fair condition
2 70% survival in Good or Fair condition
3(and subsequent years if necessary)
4–5(and subsequent years if necessary)
Year Criterion Satisfactory Progress Threshold1 # of wetland species 3 wetland species established3 Absolute cover of native
vegetation50‐60% cover with dominance by hydrophytic plants
1 and 3 Duration of saturationSaturation for 60 days annually (in addition to inundation)
1 and 3
Absence of plant species on the California Exotic Pest Plant Council's List A‐1: MostInvasive and Damaging Wildland Pest Plants
Species absence
1, 3 and 5 Duration of inundation Inundation for 30 days annually5
Absolute cover of native vegetation
Pond edges and margin will be dominated by wetland vegetation (FAC, FACW and/or OBLspecies).
Year Criterion Satisfactory Progress Threshold1 75% survival in Good or Fair condition
2 70% survival in Good or Fair condition
3‐5 Cover of native wetland 60% native cover1‐5 Cover of non‐native invasive Less than 5% non‐native cover
Table 13c. Souza II Wetland Restoration Project (Phase I) Performance Standards for Restoration Plantings
% of plants surviving
Table 13a. Lentzner Springs Wetland Restoration Project Performance Standards for Restoration Plantings
% of plants surviving65% survival in Good or Fair condition
Absolute cover of native wetland vegetation
60% cover
Table 13b. Vasco Caves Souza I Pond Project Performance Standards
East Contra Costa County HCP/NCCP 2010 Annual Report

East Contra Costa County HCP/NCCP 2010 Annual Report
East Contra Costa County Habitat Conservancy Page 22
V. PRESERVE MANAGEMENT The Plan requires that preserve management plans be developed for each preserve to identify management actions necessary for maintaining ecosystem characteristics and functions, and for maintaining or improving existing habitat conditions for covered species. Preserve management plans also describe allowed uses such as recreation. This approach ensures that preserve management is consistent with the Plan’s goals and objectives.
Preserve management plans are prepared within one year of land being added to the Preserve System. However, preserve management plans are working documents and may be modified based on the evaluation of management methods in achieving objectives as well as on results of other outside research. The Conservancy will formally review and systematically revise preserve management plans at least every 10 years, but management measures may be modified prior to plan updates in cases where adaptive management or new research identifies more effective techniques.
The Byron Hills Management Plan is currently under development. The Byron Hills Management Area is the southeastern portion of the inventory area, covering lands acquired to date in Acquisition Analysis Zone 5. This management plan covers five properties that have been acquired for the Preserve System: Vaquero Farms North, Vaquero Farms South, Souza I, Souza II, Souza III, and Martin. This Byron Hills Management Plan is the first preserve management plan prepared by the Conservancy and can be expanded to include future acquisitions. As such, it will likely become a template for future preserve management plans prepared for other parts of the Preserve System.
As of December 2010, the Byron Hills Management Plan was not finalized, although implementation of limited management activities had commenced, as described below.
Natural Community Enhancement This section describes the HCP/NCCP natural community enhancement conservation measures implemented during the 2010 reporting period, and provides an effort‐to‐date summary of the extent of land cover types enhanced.
2010 Reporting Period • Milk thistle eradication on Souza II and Martin properties: A large (40+‐acre) area
infested with milk thistle was aerially sprayed via helicopter in 2010 (similar spraying had been performed in 2009). Infestations on the Martin property were also sprayed at that time. In October 2010, the 40+‐acre area on the Souza II property was mowed and reseeded with a native seed mix. Prior to cattle starting to graze in this area, a 3 string electric fence with a solar generator was installed (late November 2010). Cattle have responded well to the new fencing and have not grazed the newly seeded area inside the fence.

East Contra Costa County HCP/NCCP 2010 Annual Report
East Contra Costa County Habitat Conservancy Page 23
• Morning glory planting on Vaquero Farms North: Seed of the small‐flowered morning glory (Convolvulus simulans) were collected from an impact site near Deer Valley Road and three plots were seeded on the Vaquero Farms North property in December 2010. Seed was planted in 1 meter by 0.5 meter plots, an inch deep and approximately five inches apart.
Land Management This section summarizes all land management activities undertaken on the HCP/NCCP Preserves during the 2010 reporting period, and discusses management issues facing the Conservancy.
For the 2010 reporting period, management consisted of the enhancement actions described above (weed control and planting small‐flowered morning glory). Currently the primary management issue facing the Conservancy is the pervasiveness of non‐native invasive plants. The Conservancy will continue its aggressive approach to controlling invasive plants in the Preserve System. Additionally, management activities in the Preserve System to meet the ECCC HCP/NCCP management related biological goals and objectives will increase once the Byron Hills Preserve Management Plan has been finalized.
Conceptual Ecological Models The HCP/NCCP requires annual reports to describe any conceptual ecological models developed to date and any changes to them that have taken place. No conceptual ecological models have been developed or modified during the 2010 reporting period.

East Contra Costa County HCP/NCCP 2010 Annual Report
East Contra Costa County Habitat Conservancy Page 24
VI. MONITORING, RESEARCH, AND ADAPTIVE MANAGEMENT
The Plan provides a framework, guidelines, and specific suggestions to help the Conservancy develop a detailed monitoring program during the initial years of Plan implementation. The purpose of the monitoring and adaptive management program is to inform and improve conservation actions in the Preserve System and to ensure that the Plan achieves its biological goals and objectives. The scope of the monitoring and adaptive management program is limited to habitat restoration and creation, and the assembly, management, and monitoring of the Preserve System.
Monitoring The Plan requires two broad types of monitoring: effectiveness monitoring and compliance monitoring.
Effectiveness Monitoring Effectiveness monitoring is the measurement of variables that allow the Conservancy to assess the success of the Plan in meeting its stated biological objectives. The Plan divides the effectiveness monitoring program into three main phases: (1) the initial monitoring design phase, to lay the foundation of the overarching monitoring program; (2) the inventory phase, which focuses on the collection of basic information as the Preserve System is assembled; and (3) the long‐term monitoring phase, which will use the framework developed during the planning and inventory phases to carry out effectiveness monitoring. Each of these three phases, and progress toward completing each phase, is discussed below.
Restoration monitoring is a type of effectiveness monitoring that is specific to restoration projects. Restoration monitoring is discussed above in the Habitat Restoration and Creation section.
Monitoring Design Phase The monitoring design phase must occur within the first 5 years of Plan implementation. It involves the development of a comprehensive monitoring strategy that will provide a framework for the inventory and long‐term monitoring. This phase includes the development of species conceptual models and monitoring protocols.
As of December 2010, the monitoring design is underway. Protocols are being developed for the Byron Hills Management area for monitoring the effectiveness of monitoring actions and the status and trend of focal species. Once these protocols are developed, they will be standardized for implementation throughout the Preserve System.

East Contra Costa County HCP/NCCP 2010 Annual Report
East Contra Costa County Habitat Conservancy Page 25
Inventory Phase The inventory phase is intended to provide baseline data for monitoring the success of habitat restoration, creation, enhancement, and management actions to meet the Plan’s biological goals and objectives. The monitoring design will include standardized protocols necessary for implementing the inventory phase so that meaningful and consistent baseline data are collected.
The inventory phase was initiated in early‐ to mid‐2008 in the form of pre‐acquisition surveys when the first lands were being considered for acquisition and incorporation into the Preserve System. This phase will continue for acquired lands once the monitoring protocols have been developed during the monitoring design phase. Prior to finalization of standardized survey protocols, limited inventory is being implemented in the Preserve System. The only surveys conducted during the 2010 monitoring period were for vernal pool crustaceans, as described below.
Vernal Pool Crustacean Surveys: In February 2010, surveys for covered vernal pool crustacean were conducted on the Souza I, Souza II, Vaquero Farms North, and Vaquero Farms South properties (Condor Country Consulting 2010). These surveys detected vernal pool fairy shrimp (Branchinecta lynchii) on the Souza I, Souza II, and Vaquero Farms South properties, and versatile fairy shrimp (Branchinecta lindahli) on the Souza II, Martin, and Vaquero Farms South properties. Additionally, observations of California red‐legged frog and California tiger salamander were documented during the crustacean surveys. Adult California red‐legged frogs were observed on Souza II and Vaquero Farms South, juveniles were observed on Martin and Vaquero Farms south, and eggs were observed on Vaquero Farms south. California tiger salamander eggs were observed on Souza I, Souza II, Martin, and Vaquero Farms North, and larvae were observed on Vaquero Farms South.
Long‐Term Monitoring Phase The long‐term monitoring phase will occur as soon as a comprehensive strategy has been developed (monitoring design phase) and baseline studies are complete (inventory phase), or before then, if appropriate. Long‐term monitoring will use the framework developed during the planning and inventory phases to carry out effectiveness monitoring and to implement adaptive management.
As of December 2010, long‐term monitoring has not yet commenced.
Compliance Monitoring Compliance monitoring is the process of evaluating Plan implementation and documenting that all requirements of the Plan are being met (i.e., permit compliance). This Annual Report, which describes progress toward Plan implementation, is the documentation for Plan compliance.
To support the development of the Annual Report, the Conservancy developed a project tracking database. This database is capable of tracking covered activities, impacts on land‐cover types and species habitat, and conditions on covered activities.

East Contra Costa County HCP/NCCP 2010 Annual Report
East Contra Costa County Habitat Conservancy Page 26
Directed Research Directed research is research that provides new information or direction regarding management actions. The purpose of directed research is to inform management in cases where species and natural community response to management is uncertain. The Plan’s Table 7‐2 contains a list of potential directed research projects. This list is unchanged from the Plan.
In August 2010, the Conservancy received a grant from the Gordon and Betty Moore Foundation which will fund research related to raptors and wind turbine mortality. A specific research project has not yet been designed, but the funds will be used for research that fills existing data gaps related to raptor behavior in relation to wind turbines, weather and seasonal effects on mortality, and/or effectiveness of various mortality reduction measures.
Adaptive Management Based on the best scientific information currently available, it is expected that the Plan’s conservation measures will effectively achieve the biological goals and objectives. However, there is uncertainty associated with management techniques, conditions within the inventory area and region, and the status of covered species and natural communities. It is also possible that new and different management measures not identified in the Plan will be identified and proven to be more effective in achieving biological goals and objectives than those currently proposed. Finally, results of effectiveness monitoring may indicate that some management measures are less effective than anticipated.
Adaptive management is a method for examining current or alternative strategies for meeting measurable biological goals and objectives and, if necessary, adjusting future management actions according to what is learned. Adaptive management follows initial implementation of effectiveness monitoring and research, but is an ongoing process utilized throughout Plan implementation.

East Contra Costa County HCP/NCCP 2010 Annual Report
East Contra Costa County Habitat Conservancy Page 27
VII. STAY-AHEAD PROVISION
Stay-Ahead Provision The Plan’s Stay‐Ahead provision requires that the Conservancy “stay ahead” by acquiring land for the Preserve System in advance of impacts. The Plan defines two compliance methods: Stay‐Ahead Measurement Method 1 and Stay‐Ahead Measurement Method 2. Stay‐Ahead Measurement Method 1 states that the amount of each land‐cover type conserved to date as a proportion of the total requirement for each land‐cover type must be equal to or greater than the impact to date on the land‐cover type as a proportion of the total anticipated impact under the Maximum Urban Development Area scenario by all covered activities. This option aggregates the following land‐cover types: cultivated agriculture, annual grassland, alkali grassland, and ruderal. The sum of the acres of these land cover types actually acquired is measured against the sum of the respective acquisition requirements. Other terrestrial land cover types are not aggregated.
Under Stay‐Ahead Measurement Method 2, the amount of annual grassland conserved by the Conservancy in Zone 2 as a proportion of the total requirement for annual grassland acquisition in Zone 2 must be equal to or greater than the impact on annual grassland and all cultivated agriculture land‐cover types (cropland, irrigated pasture, vineyard, orchard) as a proportion of the total impact expected under the Maximum Urban Development Area scenario on these land‐cover types by all covered activities. This option provides an incentive for the Conservancy to acquire land in Zone 2 early in Plan implementation because land in this zone is likely to be more expensive and at higher risk than land in other zones. The Conservancy must comply with at least one of these methods during the first 10 years. After Year 10, the Conservancy may use only Measurement Method 1.
Stay-Ahead Assessment Using Stay‐Ahead Measurement Method 1, the Conservancy is currently in compliance with the Stay‐Ahead provision (Table 14 and Figure ES‐1 and ES‐2). For all land‐cover types, the percent ahead ranges from 0% to over 100%. The Conservancy is 3,759 acres ahead of the stay‐ahead requirement for grassland and irrigated agriculture land‐cover types (the requirement is 92 acres). For plant occurrences, the Conservancy is at least 100% of all impacts (Table 15).
Jump-Start Guidelines To support the Plan’s Stay‐Ahead provision, the Plan provides Jump‐Start Guidelines recommending that approximately 2% of the expected preservation requirement be acquired prior to ESA and NCCPA permit issuance. The Conservancy complied with the Jump‐Start Guidelines prior to the reporting period.

Table 14
. Stay‐Ahe
ad Assessm
ent: Lan
d Co
ver
Page 1 of 1
Protection
Re
quired
(acres)
Protection
to date
(acres)
% of
Requ
ired
Impa
ct
Impa
cts
to date
(acres)
% of
Impa
cts
Terrestrial
All grassland & irrigated agricultu
re 18,15
0 3,85
0.6
21.2%
12,14
8 61
.40.5%
91.7
3,758
.9
21%
Chaparral and
scrub
550
37
.17%
2
0.0
0.0%
0.0
37.1
7%Oak savanna
500
16
8.8
34%
16
5 0.0
0.0%
0.0
16
8.8
34%
Oak woo
dland
400
41
9.2
105%
73
0.0
0.0%
0.0
41
9.2
105%
Subtotal te
rrestrial
37
,750
4,47
5.7
12%
24,53
6 61
.40%
94.4
4,38
1.3
12%
Aqu
atic
Riparian
woo
dland/scrub
7013
.90
20%
35
0.24
1%0.5
13.4
19%
Perenn
ial w
etland
1
750.70
1% 75
0.01
0%0.0
0.7
1%
Season
al wetland
768
1.70
0% 56
0.29
1%4.0
(2.3)
0%Alkali w
etland
9315
.70
17%
31
0.00
0%0.0
15.7
17%
Pond
164.90
31%
8
0.00
0%0.0
4.9
31%
Reservoir (ope
n water)2
120.00
0% 12
0.00
0%0.0
‐
0%
Slou
gh/Chann
el36
0.00
0% 72
0.07
0%0.0
(0
.0)
0%
Subtotal aqu
atic
1070
36.9
3% 28
9 0.61
0%2.3
34.6
3%Stream
(len
gth in line
ar fe
et)
Perenn
ial stream
4,22
4 88
6.4
21%
2,112
56
.33%
112.6
77
3.8
21%
Interm
itten
t stream
2,11
2 24
,087
.711
41%
2,112
6.0
0%6.0
24,08
1.7
1141
%Ephe
meral stream
26,40
0 91
,595
.134
7% 26
,400
76
.00%
76.0
91,51
9.1
347%
Subtotal stream leng
th
32
,736
11
6,56
9.2
356%
30,62
4 13
8.3
0%14
7.8
116
,421
.3
356%
Totals
Acres
38,820
4,51
2.6
12%
24
,825
62
.00%
96.9
4,41
5.7
11%
Line
ar fe
et32
,736
116,56
9.2
356%
30
,624
13
8.3
0%14
7.8
116
,421
.3
356%
1Perenn
ial w
etland
s are eq
uivalent perman
ent w
etland
s.2 R
eservoir (open water) is equ
ivalen
t to aq
uatic.
3 The
Plan allows a 5%
deviatio
n from
Stay Ahead
requ
irements. For terrestria
l lan
d cover, th
e Plan
provides that Stay Ahead
be measured ag
ainst the
following catego
ries: cha
parral, oak savan
na, oak woo
dlan
d an
d the sum of a
ll grasslan
d an
d irrigigated
agricultural lan
d cover types
Land
Cover Type
Conservation
Im
pact
Acres
Requ
ired
to be
Ahe
adAcres
Ahe
ad
% Ahe
ad3
(Con
servation % ‐
Impa
cts %)
East Con
tra Co
sta Co
unty HCP
/NCC
P 20
10 Ann
ual Rep
ort

Table 15
. Stay‐Ahe
ad Assessm
ent: Plants
Page 1 of 1
Common
Nam
eScientific Nam
eCo
nservation
Impa
cts
Differen
ce% Ahe
adMou
ntDiablomanzanita
Arctostap
hylosau
riculata
11
100%
Mou
nt Diablo manzanita
Arctostap
hylos au
riculata
1‐‐
110
0%Brittlescale
Atriplex depressa
1‐‐
110
0%San Joaquin spearscale
Atriplex joan
quiniana
3‐‐
310
0%Big tarplant
Blepha
rizon
ia plumosa
1‐‐
110
0%Mou
nt Diablo fairy lantern
Calochortus pu
lchellus
1‐‐
110
0%Re
curved
larkspur
Delph
inium re
curvatum
0‐‐
0‐‐
Rdl
dfil
Edi
hll
01
0Ro
und‐leaved
filaree
Erod
ium m
acroph
yllum
0[see note1]
0‐‐
Diablo he
lianthe
llaHelianthella castanea
1‐‐
110
0%Brew
er’s dwarf flax
Hesperolinon
breweri
0‐‐
0‐‐
Show
y madia
Mad
ia ra
diata
0‐‐
0‐‐
Ado
be navarretia
Navarretia
nigelliformis ssp. nigelliformis
0‐‐
0‐‐
Total
80
8‐‐
Total
80
8‐‐
1 Tem
porary im
pacts occurred
to rou
nd‐le
aved
filaree as part o
f the
PG&E Co
ntra Costa Las Posita
s Project. The
soil w
as protected
from
disturbance, th
e site was returne
d to pre‐project con
nections, and
seeds collected
on site were prop
agated
. East Con
tra Co
sta Co
unty HCP
/NCC
P 20
10 Ann
ual Rep
ort
East Contra Costa County HCP/NCCP 2010 Annual Report
East Contra Costa County Habitat Conservancy Page 28
VIII. CHANGED CIRCUMSTANCES AND REMEDIAL MEASURES
The No Surprise Regulation established by the USFWS defines changed circumstances as those circumstances affecting a species or geographic area covered by an HCP that can be reasonably anticipated by the applicant or the USFWS and to which the parties preparing the HCP can plan a response. The changed circumstances identified by the Plan include non‐covered species in the inventory area becoming listed, wildfires that result in the large‐scale loss of natural communities, pond or wetland control structure failure, destruction of riparian plantings from flooding, prolonged drought, and vandalism of preserves. Occurrence of a changed circumstance requires the Conservancy to notify the USFWS and the CDFG to determine the necessity for additional conservation or mitigation measures. If the mitigation or conservation measure has already been identified in the Plan, the Conservancy must comply with the measure. However, if the measure is not currently included in the Plan, the USFWS and the CDFG will not require additional mitigation or conservation measures.
In the event that an anticipated changed circumstance prohibits or damages a conservation action that meets the goals of the HCP, a remedial measure must be undertaken. Remedial measures are funded by the Plan and must be undertaken by the Conservancy.
No changed circumstances occurred during the reporting period. No remedial measures were implemented.

East Contra Costa County HCP/NCCP 2010 Annual Report
East Contra Costa County Habitat Conservancy Page 29
IX. FINANCES
Budget The Conservancy’s Approved 2010 Budget is presented in Table 16. During the reporting period, expenditures focused on land acquisition, management and restoration planning and design, program administration and environmental compliance. This focus partly reflects the necessary emphasis when starting a new conservation program and partly reflects the abundance of grant funding for land acquisition. Funding for preserve management, maintenance and monitoring, and research and adaptive management were under‐spent relative to Plan projections because the first pieces of the Preserve System were just acquired. Table 17 compares actual expenditures to budgeted expenditures. Of the Conservancy’s total approved Budget in 2010 of $15,834,433, the amount actually spent in 2010 was $11,788,315. Revenues totaled $12,564,515. The difference between revenues and expenditures was $776,200. As noted in Table 17, all year‐end figures are preliminary.
Revenue Sources Three main revenue sources are used to fund the Plan.
• Fee collection: Development, wetland, rural road, and temporary impact fees are utilized to mitigate impacts on special‐status species and natural communities.
• Local funding: Acquisition and management of land by local agencies, including park districts, cities, and the county, using local tax revenues. The Conservancy has also required Participating Special Entities to contribute funds over and above fee requirements in order to contribute to the recovery of species in the inventory area.
• State, federal and private grants: Funding from the state and federal government to assemble, manage, and monitor Preserve System lands.
Of the total of $12,564,515 in revenue that was received in the reporting period, funding from grants was by far the largest source. Various federal, state and private funding sources have generously approved or awarded a total of $39,952,685 in grant funding since Plan inception, of which $11,726,928 was spent during the reporting period for Conservancy activities. Most grant funding awarded will be spent in future years, with approximately $22 million unspent at the end of 2010. More detailed information on approved grants is provided in Table 18. In addition to grant funds, EBRPD contributions toward joint acquisitions totaled $4,679,876 in 2010.
Fees, contributions to recovery and administrative cost reimbursements received in 2010 totaled $837,587. These revenues were generated from ten projects, nine covered in 2010 and

East Contra Costa County HCP/NCCP 2010 Annual Report
East Contra Costa County Habitat Conservancy Page 30
one project for 2011 that paid some administrative costs in 2010. Table 19 provides additional detail on fee revenues.
Funding in Perpetuity Annual costs to operate and maintain the Preserve System in perpetuity are estimated to be slightly less than the annual cost for program administration, preserve management, and monitoring estimated during the final funding period of the Plan, or approximately $3.0 million or $3.3 million6 annually under the initial or Maximum Urban Development Area, respectively. Actual long‐term costs may be lower if the Conservancy can develop streamlined procedures for management and monitoring during the permit term, or if the Conservancy can reduce administrative costs. Responsibility for funding long‐term management and monitoring rests solely with the Permittees.
The Conservancy is required to develop a detailed plan for the long‐term funding of operation and maintenance and to secure all necessary commitments to implement this Plan before using 50% of all authorized take under the Maximum Urban Development Area (= 50% of 12,704 acres, or 6,352 acres) or at the end of year 15 of implementation, whichever occurs first. The Conservancy has initiated planning for this requirement and expects to make more progress on planning in 2011. In addition the Conservancy has begun to secure potential sources for long term funding. Properties acquired in 2010 will provide approximately $375,000 per year in lease revenue from existing cellular communications facilities and wind turbines with long term leases. The Conservancy and EBRPD have agreed to dedicate a portion of the revenue from the existing leases to long term management of the Preserve System.
6 This is equivalent to approximately $125 per acre per year or $110 per acre per year in operational and capital costs for Preserve System operation under the initial or Maximum Urban Development Areas, respectively.

Develop
men
t Fee Accou
nt
Dev. Fee
Re
venu
es
Accrued
in
2010
1
Wetland
Mitigation Fee
Accou
nt2
Wetland
Mitigation Fee
Revenu
es
Accrued
in
2010
2
CDFG
's
California
Wild
life
Foun
dation
Accou
nt3
Grant
Fund
ing
4TO
TAL
(201
0)% of
Total
%
Chan
ge
from
20
09
Program Adm
inistration
$257
,094
0%$0
0%$2
57,094
$0$5
14,189
3%4%
Land
Acquisitio
n$0
20%
$00%
$100
,000
$13,94
6,30
3$1
4,04
6,30
389
%0%
Managem
ent, Restoratio
n & Recreation Planning
& Design
$52,85
60%
$020
%$7
9,28
3$1
00,000
$232
,139
1%‐29%
Habita
t Restoratio
n/Creatio
n$0
0%$4
0,96
020
%$4
0,96
0$2
50,000
$331
,920
2%‐66%
Environm
ental Com
pliance
$75,00
00%
$10,00
00%
$10,00
0$5
6,30
3$1
51,303
1%‐9%
HCP
/NCC
P Preserve M
anagem
ent a
nd M
ainten
ance
$99,38
420
%$0
0%$1
98,768
$0$2
98,151
2%2%
Mon
itoring, R
esearch, and
Adaptive Managem
ent
$20,00
00%
$20,00
00%
$129
,565
$0$1
69,565
1%80
%
Remed
ial M
easures
$6,000
0%$0
0%$0
$0$6
,000
0%0%
Contingency Fund
(5% of n
on‐la
nd acquisitio
n costs)
$84,86
30%
$00%
$0$0
$84,86
31%
‐28%
TOTA
L 20
10 EXP
ENDITURE
S$5
95,197
40%
$70,96
040
%$8
15,670
$14,35
2,60
6$1
5,83
4,43
310
0%‐4%
$940
,000
$280
,000
$850
,000
$20,24
7,05
4$2
2,31
7,05
4
$344
,803
60%
$209
,040
60%
$34,33
0$5
,894
,448
$6,482
,621
Notes:
(3) T
his accoun
t was set up specifically fo
r the HCP
. Wildlife agen
cies m
ust a
pprove disbu
rsem
ents. Projected
balance reflects pe
nding $5
49k transfer to
Wetland
accou
nt. Upo
n anticpated closing
of Vaque
ro Farms North in
early 201
0, available fund
s in th
e CW
F accoun
t will increase by $2
,770
,000
. See Table II for more inform
ation.
App
roved 20
10 Con
servan
cy Bud
get
(2) P
rojected
Wetland
Mitigatio
n Fee balance on
1‐1‐08 refle
cts projected expe
nditu
res for remaind
er of 2
009 as well as pe
nding $5
49K transfer from
CWF Accou
nt.
(4)Grant fu
nding total refelcts fund
ing that rem
ains from
app
roved grants. Doe
s no
t include
$5M
grant th
at has been offered by
WCB
staff. See Table III fo
r grant fun
ding
details.
PROJECT
ED BALA
NCE
ON JA
NUARY
1, 201
0
Amou
nt of P
rojected
Janu
ary 1, 201
0 Ba
lance To
Be Re
served
For Future
(1) P
ercentages reflect th
e recommen
ded po
rportio
n of new
reven
ues accrue
d in 201
0 to be spen
t on each cost category.
Cost Categ
ory
Prop
osed
201
0 Expe
nditures
Table 16

AB
E= A m
inus D
F= E/A
*100
App
roved 20
10
Conservancy
Budg
et1
Actua
l Expe
nditures as
of 12/31
/10
2Bu
dget Not Spe
ntPe
rcen
t Re
maining
% o f o
Program Adm
inistration
$514
,189
$560
,165
‐$45
,976
‐9%
Land
Acquisitio
n$1
4,04
6,30
3$1
0,87
5,61
6$3
,170
,686
23%
Managem
ent, Restoratio
n and Re
creatio
n Planning
and
Design
$232
,139
$46,67
4$1
85,465
80%
Habita
t Restoratio
n/Creatio
n$3
31,920
$54,57
1$2
77,349
84%
Environm
ental Com
pliance
$151
,303
$91,98
8$5
9,31
539
%
HCP
/NCC
P Preserve M
anagem
ent a
nd M
ainten
ance
$298
,151
$12,73
0$2
85,422
96%
Mon
itoring, R
esearch, and
Adaptive Managem
ent
$169
,565
$146
,572
$22,99
214
%
Remed
ial M
easures
$6,000
$0$6
,000
100%
Contingency Fund
(5% of n
on‐la
nd acquisitio
n costs)
$84,86
3$0
$84,86
310
0%
TOTA
L EX
PENDITURE
S$1
5,83
4,43
3$1
1,78
8,31
5$4
,046
,117
26%
$837
,587
$11,72
6,92
8
$12,56
4,51
5
$776
,200
(surplus)
Notes:
Table 17
: 201
0 Ye
ar‐End
Bud
get S
tatus: A
ctua
l Expen
ditures Co
mpa
red to Con
servan
cy's App
roved 20
10 Bud
get
FEE RE
VEN
UES IN
201
02 (include
s fees, con
tributions to
recovery & adm
in cha
rges)
(expen
ditures and revenu
es includ
e Co
nservancy's ow
n fund
s as well as grant fun
ds disbu
rsed
on be
half of th
e Co
nservancy)
DIFFERE
NCE
BETWEEN 201
0 RE
VEN
UES & EXP
ENDITURE
S2
(2) P
relim
inary accoun
ting on
ly. Year‐end
accou
nt recon
ciliatio
n still in
progress.
Expe
nditures
TOTA
L RE
VEN
UE IN
201
02
GRA
NT RE
VEN
UE IN
201
02
(1) B
udget a
mou
nts do
not reflect augmen
tatio
n form
ulas. The approved
Bud
get a
llowed
the expe
nditu
re limits fo
r certain categories to
increase
in propo
rtion to reven
ues. The
se augmen
tatio
ns are not includ
ed here in order to
keep the comparison of expen
ditures to bud
get sim
ple and
conservativ
e.

Table 18
Grants Awarde
d for EC
CC HCP
/NCC
P Im
plem
entation
Fund
ing Source
Age
ncy
Purpose
Amou
ntRe
quired
Match
Amou
nt
Expe
nded
(12/31
/10)
Remain
(12/31
/10)
Match non
‐fede
ral?
Need to be used
by…
Complete?
Section 6 (200
6)USFW
Acquisitio
n$6
,531
,054
$7,982
,399
$6,531
,054
$0yes
June
30 20
10√
Section 6 (200
7)USFW
Acquisitio
n$7
,000
,000
$8,555
,600
$4,975
,905
$2,024
,095
yes
June
30, 201
1Section 6 (200
8)USFW
Acquisitio
n$6
,000
,000
$7,333
,333
$1,372
,500
$4,627
,500
yes
May 14, 201
1Section 6 (200
9)USFW
Acquisitio
n$2
,500
,000
$3,055
,556
$0$2
,500
,000
yes
August 1
, 201
2Section 6 (201
0)USFW
Acquisitio
n$6
,000
,000
$7,333
,333
$0$6
,000
,000
yes
July 31, 201
3CV
PIA ‐ HRP
USBR
Acquisitio
n$1
,241
,631
$500
,000
$1,241
,631
$0yes
Septem
ber 2
010
√
IRWMP ‐ P
rop 50
DWR
Acquisitio
n or restoratio
n$7
50,000
$500
,000
$750
,000
$0no
June
201
2√
IRWMP ‐ P
rop 50
(rep
rogram
med
)DWR
Acquisitio
n or restoratio
n$1
,400
,000
$500
,000
$0$1
,400
,000
noMarch 201
2
NCC
P Local A
ssistance
Fund
s (200
6)CD
FGStart‐up
staffing
$40,00
0'====
$40,00
0$0
noJune
200
8√
NCC
P Local A
ssistance
Fund
s (200
7)CD
FGStart‐up
wetland
s restoration
$60,00
0$1
20,000
$60,00
0$0
noDec 200
8√
NCC
P Local A
ssistance
Fund
s (200
8)CD
FGWetland
s restoration at
Souza 2
$150
,000
====
$139
,000
$11,00
0no
April 20
11
NCC
P Local A
ssistance
Fund
s (200
9)CD
FGRiparian
restoraion
$150
,000
$111
,000
$0$1
50,000
noMarch 201
2
Moo
re Fou
ndation
Acquisitio
n Fox Ridge
$880
,000
50% m
atch
desired
$880
,000
$0no
12/31/09
√
Moo
re Fou
ndation
Acquisitio
n and research
Souza 3
$2,250
,000
50% m
atch
desired
$2,000
,000
$250
,000
noSep 20
12
Prop
84 NCC
P accoun
t1WCB
Acquisitio
n$5
,000
,000
====
$0$5
,000
,000
no====
$39,95
2,68
5$3
5,99
1,22
1$1
7,99
0,09
0$2
1,96
2,59
5TO
TAL
Note 1: The
Prop 84
item
related
to W
CB is an initial allocatio
n for future projects agreed
to by WCB
staff. Individu
al grants must b
e approved
by the WCB
Board.

Table 19 Date
Project
Covered Th
roug
hAmou
nt4/19
/201
0 Vasco Road Safety Im
provem
ent P
roject
Contra Costa Cou
nty
$332
,471
6/25
/201
0State of Califo
rnia, Cal Trans (H
wy 4 shou
lder widen
ing)
Conservancy
$387
,636
7/26
/201
0B A R T (eB
ART
Phase 1)
Conservancy
$18,95
08/4/20
10Shell Pipeline Co
., LP, Coalinga‐Avon Pipe
line repair
Conservancy
$16,40
39/9/20
10Ra
dback Energy Inc/Oakley gene
ratin
g Station (in
itial adm
in costs)
Conservancy
$10,00
09/9/20
10Tempo
rray use of 2
515 Pittsburg‐Antioch Highw
ayCity of P
ittsburg
$4,412
9/14
/201
0USS‐POSCO Site
L‐A Soil Stockpile
City of P
ittsburg
$8,269
10/1/201
0Co
nocoPh
illips Pipe
Line Co
mpany, Line 20
0 Pipe
line Re
pair Project
Conservancy
$38,82
910
/7/201
0Horizon
Tow
er, LLC
Contra Costa Cou
nty
$19,92
712
/30/20
10California Avenu
e Widen
ing Tempo
rary Con
tractor Storage Site
City of P
ittsburg
$690
$837
,587
TOTA
L
Note 1: Prelim
inary accoun
ting on
ly. Year‐end
accou
nt recon
ciliatio
n still in
progress.
HCP
/NCC
P Fees, C
ontributions to Re
covery and
Adm
inistrative Co
sts Re
imbu
rsem
ent Re
ceived
in 201
0 1

East Contra Costa County HCP/NCCP 2010 Annual Report
East Contra Costa County Habitat Conservancy Page 31
X. PROGRAM ADMINISTRATION
Minor and Major Amendments The Conservancy made no minor or major amendments to the Plan during the reporting period.
Implementation Policies The Conservancy and the Wildlife Agencies clarified the protocols for acquiring land in Wind Turbine Areas. The implementation policy clarifies the process by which land preservation is credited to the Preserve System on lands that also support wind turbines. This policy also identifies avoidance and minimization measures for management of wind farms in the Preserve System. Clarifications included, but were not limited to:
• Lands credited to the Preserve System must include all wind rights, other than Vaquero Farms South and Vaquero Farms North, or implementation of measures to reduce biological impacts of wind turbines. Measures to reduce biological impacts include preparing and implementing an Avian Protection Plan, siting of turbines to minimize impacts, reducing the number of turbines, not increasing the current energy output during repowering, road removal and reduction, restoration of past effects from wind activity. For those properties that the Conservancy does not own the wind rights, those rights will be acquired when they become available.
• Rationale for wind lease renewal on Preserve System lands must be provided to the Wildlife Agencies in a letter from the Conservancy Board.
• Applications to modify, extend, including repowering, or renew existing wind generation activities will be reviewed by the Conservancy and Wildlife Agencies. Measures to reduce biological effects will be recommended. If recommended measures do not reduce biological effects of wind turbine operation, supplementary measures will be developed in cooperation with the Conservancy, Wildlife Agencies, land owner, and wind turbine company. The ability for the Conservancy and Wildlife Agencies to enforce recommendations will be agreed on prior to land acquisition.
• Properties acquired with Section 6 funds will incorporate measures to retire existing wind leases at the end of their terms.
• Accounting for wind turbine infrastructure (i.e., area excluded from preservation credit) will be adjusted for the wind turbine size and extent of supporting infrastructure. This includes mapping roads and supporting infrastructure to a minimum mapping unit of 0.1‐acre to exclude infrastructure from land acquisition credits. Wind turbine infrastructure removal and reclamation will result in preservation credits.

East Contra Costa County HCP/NCCP 2010 Annual Report
East Contra Costa County Habitat Conservancy Page 32
LIST OF PREPARERS
East Contra Costa County Habitat Conservancy John Kopchik
Krystal Hinojosa
Abigail Fateman
Chris Howard
ICF International Ellen Berryman
Terah Donovan
Jasmin Mejia
Silas Toms
East Contra Costa County Habitat Conservancy Page A‐1
APPENDIX A: GLOSSARY
Definitions of Key Terms and Concepts Adaptive management. A method for examining alternative strategies for meeting measurable biological goals and objectives and, if necessary, adjusting future conservation management actions according to what is learned (65 Federal Register 106; June 1, 2000). (See also Chapter for alternative but similar definitions of adaptive management.)
Anthropogenic. Caused or produced through human agency.
Baseline. The existing environmental state, which includes past and present impacts as well as the anticipated impacts of all permitted projects in the inventory area.
Biological opinion. The document stating the opinion of the U.S. Fish and Wildlife Service and/or the National Oceanic and Atmospheric Administration’s National Marine Fisheries Service regarding whether a federal action is likely to jeopardize the continued existence of listed species or result in the destruction or adverse modification of critical habitat (50 Code of Federal Regulations [CFR] 402.02). A biological opinion is one of the decision documents of a consultation under Section 7 of the federal Endangered Species Act (ESA).
Biodiversity. The variety of organisms considered at all levels, from genetic variants of a single species through arrays of species to arrays of genera, families, and higher taxonomic levels; includes the variety of ecosystems.
Buffer areas. Designated zones of agricultural lands, grassland, or other habitat types adjacent to preserves that are intended to prevent or reduce the undesired intrusion of biota, harmful materials, or disturbances into the preserve, as well as the movement of covered wildlife species from preserve areas into adjoining areas.
Conservation. According to the federal ESA (Section 3[3]), the terms conserve, conserving, and conservation are defined as the methods and procedures necessary to bring any endangered or threatened species to the point at which the measures provided under the Act are no longer necessary. Such methods and procedures include, but are not limited to, activities associated with resource management such as research, census, law enforcement, habitat acquisition and maintenance, propagation, live trapping, and transportation. The Natural Community Conservation Planning Act defines conserve, conserving, and conservation as the use of methods and procedures within the plan area that are necessary to bring any covered species to the point at which the measures provided pursuant to Chapter 1.5 are not necessary, and for covered species that are not listed pursuant to Chapter 1.5 to maintain or enhance the condition of a species so that listing pursuant to Chapter 1.5 will not become necessary.

East Contra Costa County HCP/NCCP 2010 Annual Report
East Contra Costa County Habitat Conservancy Page A‐2
Conservation measure. A management action that, when implemented, will partially or wholly achieve Plan objectives for covered species, natural communities, biodiversity, or ecosystem function.
Conserved habitat. Species habitat that is protected, enhanced, and/or restored under the Plan.
Construction monitoring. Monitoring by biologists of construction activities to ensure that conservation measures are implemented and impacts on biological resources are avoided or minimized in accordance with Plan requirements.
Contribute to recovery. Actions that measurably increase the baseline conditions necessary to support covered species and contribute to the eventual de‐listing of a listed species or prevention of listing of an unlisted species. A contribution to recovery does not include actions necessary to avoid, minimize, or mitigate impacts of covered activities.
Cover (e.g., canopy cover, areal cover). The area of ground covered by vegetation of particular species or vegetation type, generally expressed as a percentage.
Covered species. Those species addressed in the Plan for which conservation measures will be implemented and for which the permittee seeks authorization for take under Section 10 of the federal Endangered Species Act and Section 2081 of the California Endangered Species Act.
Critical habitat. An area designated as critical habitat by the U.S. Fish and Wildlife Service pursuant to the federal Endangered Species Act. Critical habitat areas are specific geographic areas, whether occupied by listed species or not, that are determined to be essential for the conservation and management of listed species, and that have been formally described and designated in the Federal Register.
Dominance. The extent to which a given species predominates a community by virtue of its size, abundance, or coverage.
Ecosystem. A community of organisms and their physical environment interacting as an ecological unit.
Ecosystem function. The sum total of processes operating at the ecosystem level, such as the cycling of matter, energy, and nutrients.
Ecosystem restoration. The reestablishment of ecological functions within an area that historically supported those functions.
Environmental gradient. A shift in physical and ecological parameters, as characterized by transition zones between land‐cover types and natural communities or topographic gradients across a landscape.
Ephemeral stream. A stream that flows only in response to rain events and receives no groundwater input.
East Contra Costa County HCP/NCCP 2010 Annual Report
East Contra Costa County Habitat Conservancy Page A‐3
Executive Director. The Executive Director leads the Implementing Entity, and is responsible for Plan implementation, staff management, funding acquisition, and other managerial duties.
Extinct species. A species no longer in existence.
Extirpated species. A species no longer surviving in regions that were once part of its range.
Fossorial. Adapted for digging or burrowing into the ground.
Geographic Information System (GIS). Computer‐based mapping technology that manipulates geographic data in digital layers and enables one to conduct a wide array of environmental analyses.
Goal. A broad, guiding principle that identifies an expected outcome of the Plan. Conservation strategy goals describe the desired future condition for each covered species with full implementation of the Plan.
Habitat. The environmental conditions that support occupancy of a given organism in a specified area (Hall et al. 1997). In scientific and lay publications, habitat is defined in many different ways and for many different purposes. For the purpose of the Plan, habitat is defined as the specific places where the environmental conditions (i.e., physical and biological conditions) required to support occupancy by individuals or populations of a given species are present. Habitat may be occupied (individuals or population of the species are, or have recently been, present) or unoccupied (see unoccupied habitat below).
Habitat creation. The establishment of a vegetation community in an area that did not previously support it. For example, stock ponds can be created in areas that previously did not support them by grading and installing a check dam.
Habitat enhancement. The improvement of an existing degraded vegetation community. Enhancement involves improving one or more ecological factors, such as species richness, species diversity, overall vegetative cover, or wildlife value. Enhancement activities typically occur on substrates that are largely intact.
Habitat‐limited. A habitat‐limited species is one whose abundance, distribution, or reproduction is limited by the availability or quality of suitable habitat. See suitable habitat.
Habitat quality. The ability of the environment to provide conditions that support the persistence of individuals and populations. The precise meaning of quality varies by species and depends on the subject species’ specific needs in the context of a particular area. High‐quality habitat for some species comprises only foraging and resting elements; for others it comprises foraging, resting, and nesting elements; for still others it may encompass all elements needed for the species to complete its lifecycle. Low‐quality habitat would include only the minimal elements that support occurrence of the species. High‐quality habitat tends to support larger numbers of species than low‐quality habitat.

East Contra Costa County HCP/NCCP 2010 Annual Report
East Contra Costa County Habitat Conservancy Page A‐4
Habitat quantity. The area of the environment that supports or could support occupancy of a given organism.
Habitat replacement. To replace habitat is to mitigate habitat loss by enhancing or restoring habitat equivalent to or greater than the habitat lost.
Habitat restoration. The establishment of a vegetation community in an area that historically supported it, but no longer supports it because of the loss of one or more required ecological factors. Restoration may involve altering the substrate to improve a site’s ability to support the historic vegetation community.
Harass. An intentional or negligent act or omission that creates the likelihood of injury to wildlife by annoying it to such an extent as to significantly disrupt normal behavioral patterns which include, but are not limited to, breeding, feeding, or sheltering (50 CFR 17.3).
Harm. An act that actually kills or injures wildlife. Such an act may include significant habitat modification or degradation where it kills or injures wildlife by significantly impairing essential behavioral patterns, including breeding, feeding, or sheltering (50 CFR 17.3).
Hydrology. The movement of surface and subsurface water flows in a given area. The hydrology of an area is intimately connected with its precipitation, soils, and topography.
Incidental take. Any taking otherwise prohibited, if such taking is incidental to, and not the purpose of, the carrying out of an otherwise lawful activity (50 CFR 17.3).
In‐kind/like‐value creation. Establishing the same vegetative community that would provide the same ecological values over time as the vegetation community affected. For example, creating an artificial vernal pool that supports species similar to those found in an affected vernal pool would be in‐kind/like‐value creation.
Intermittent stream. A stream that is supplied by both rainfall runoff and groundwater. Intermittent streams tend to be seasonal, flowing during the rainy season and into the late spring or early summer.
Jurisdictional wetlands and waters. State and federally regulated wetlands and other water bodies that cannot be filled or altered without permits from either the U.S. Army Corps of Engineers under Section 404 of the Clean Water Act, the State Water Resources Board, or the Regional Water Quality Control Boards under either Section 401 of the CWA or the Porter‐Cologne Water Quality Control Act, or the CDFG under Fish and Game Code Section 1602, as of the date the Plan takes effect.
Land‐cover type. The dominant feature of the land surface discernible from aerial photographs and defined by vegetation, water, or human uses.
Land‐use designation. The designation, by parcel, in an adopted city or county General Plan of the allowable uses.

East Contra Costa County HCP/NCCP 2010 Annual Report
East Contra Costa County Habitat Conservancy Page A‐5
Loss of habitat. A reduction in habitat quality or quantity that results from an adverse change in an environmental condition. Environmental conditions may include cover, substrate, channel type, interacting species, river area, reservoir area, water quality, and groundwater depth.
Metapopulation. A group of partially isolated populations belonging to the same species that are connected by pathways of immigration and emigration. Exchange of individuals occurs between such populations, enabling recolonization of sites from which the species has recently become extirpated.
No‐take species. Species for which take is not authorized under this Plan. In order to comply with the terms of the Plan, applicants for coverage under the Plan must avoid all direct and indirect impacts on no‐take species. See Table 5‐3 of the HCP/NCCP for a list of no‐take species.
Out‐of‐kind/like‐value. Establishing a similar, but not identical, vegetative community with some of the same ecological functions and values as the affected vegetative community over time.
Ordinary high water mark (OHWM). A line on the shore established by the fluctuations of water and indicated by physical characteristics, such as a clear, natural line impressed on the bank; shelving; changes in the character of soil; destruction of terrestrial vegetation; or the presence of litter and debris.
Perennial stream. A year‐round stream that is supplied by both rainfall runoff and groundwater, as well as by substantial dry‐season inputs.
Performance indicator. The environmental variables that are quantitatively measured over time to determine if enhanced/created/restored natural communities have successfully met Plan biological goals and objectives.
Performance objective. In monitoring, the optimal desired value for each performance indicator. Performance objectives establish a higher threshold for each indicator than that established for performance standards. Funding, design, and management objectives for enhanced/created/restored natural communities are established at levels that are designed to ensure that the performance objectives are achieved. Failure to meet a performance objective would not constitute a changed circumstance or require remedial measures.
Performance period. In monitoring, the time over which performance standards must be met.
Performance standard. In monitoring, a minimum requirement necessary to achieve biological goals and objectives. Failure to achieve a performance standard could constitute a changed circumstance and require that remedial measures be implemented.
Permittees. Those entities requesting a Section 10(a)(1)(B) incidental take permit from the USFWS and a take permit under the NCCPA from the CDFG for the species and activities covered in the accompanying HCP/NCCP.

East Contra Costa County HCP/NCCP 2010 Annual Report
East Contra Costa County Habitat Conservancy Page A‐6
Planning surveys. Surveys conducted by applicants for Plan coverage and used in the project‐planning process to identify constraints and determine which Plan conservation measures are applicable. Planning surveys also include surveys conducted by the Implementing Entity on potential preserve lands to evaluate whether these lands will meet Plan requirements.
Population. A group of individuals of the same species inhabiting a given geographic area, among which mature individuals reproduce or are likely to reproduce. Ecological interactions and genetic exchange are more likely among individuals within a population than among individuals of separate populations of the same species.
Range. The geographic area a species is known to occupy or believed to occupy.
Practicable. Practicable means available and capable of being done after taking into consideration cost, existing technology, and logistics in light of overall project purpose (45 FR 85344, December 24, 1980: U.S. Environmental Protection Agency, 40 CFR 230.3, Definitions).
Preconstruction surveys. Surveys conducted by applicants for Plan coverage for certain biological resources immediately prior to construction to ensure that species and habitat avoidance and minimization measures can be effectively implemented during construction of covered projects or implementation of covered activities.
Preserves. Discrete areas of conserved habitats managed as single units under the Plan.
Preserve System. All Plan preserves considered collectively.
Protect habitat. To maintain the existing or enhanced extent of species habitat through acquisition, easements, or other practicable processes for bringing unprotected sites under protected status.
Recovery. The process by which the decline of an endangered or threatened species is arrested or reversed or threats to its survival neutralized so that its long‐term survival in nature can be ensured. Recovery entails actions to achieve the conservation and survival of a species (U.S. Fish and Wildlife Service and National Marine Fisheries Service 1998), including actions to prevent any further erosion of a population’s viability and genetic integrity, as well as actions to restore or establish environmental conditions that enable a species to persist (i.e., the long‐term occurrence of a species through the full range of environmental variation).
Recovery Plan. A document published by the USFWS that lists the status of a listed species and the actions necessary to remove the species from the endangered species list.
Riparian habitat. Vegetation associated with rivers, streams, lake banks, and floodplains.
Ruderal. A species or plant community that occurs on a highly disturbed site.
Signature. Characteristic value, color, or texture on an aerial photograph that correlates to a particular land‐cover type.
Stream, perennial. A stream that flows throughout the year.

East Contra Costa County HCP/NCCP 2010 Annual Report
East Contra Costa County Habitat Conservancy Page A‐7
Stream, intermittent. A stream that flows only at certain times of the year, generally in response to precipitation runoff or groundwater input.
Stream, ephemeral. A stream that flows only briefly in direct response to precipitation in the immediate vicinity, and that does not receive groundwater input.
Succession. The change in the composition and structure of a biological community over time. Successional patterns often shift dramatically following a major disturbance (e.g., fire, flood, anthropogenic clearing of land).
Suitable habitat. Habitat that exhibits the characteristics necessary to support a given species.
Take. According to the federal Endangered Species Act (Section 3[18]), to harass, harm, pursue, hunt, shoot, wound, kill, trap, capture, or collect, or to attempt to engage in any such conduct. According to the California Endangered Species Act (Section 86 of the California Fish and Game Code), take means to hunt, pursue, catch, capture, or kill.
Take Coverage. Is defined in the HCP/NCCP in terms of land cover types lost as a result of covered activities. See HCP/NCCP Chapter 3 of for definition of land cover types and Chapter 4 for an estimate of loss of these land‐cover types.
Umbrella species. A species whose range and habitat requirements are large and broad enough to encompass the range and habitat requirements of other species.
Unoccupied habitat. Habitat that exhibits all the constituent elements necessary for a species, but where surveys have determined that the species is not currently present. The lack of individuals or populations in the habitat is assumed to be the result of reduced numbers or distribution of the species such that some habitat areas are unused. It is expected that these areas would be used if species numbers or distribution were greater. See also definition of suitable habitat.
Urban‐wildland interface. The narrow zone (<100 feet) between dense urban development and natural land cover in which structures can be built to minimize the damaging indirect effects on covered species or habitats of activities within urban areas.
Vegetation community. A natural or artificial terrestrial community defined by the dominant vegetation and the vegetation structure. This term is used synonymously with the regulatory term natural community under the Natural Community Conservation Planning Act of 2002.