east asian monsoon climate during the late pleistocene...
TRANSCRIPT

ELSEVIER Marine Geology 156 (1999) 245–284
East Asian monsoon climate during the Late Pleistocene:high-resolution sediment records from the South China Sea
L. Wang a,Ł, M. Sarnthein a, H. Erlenkeuser b, J. Grimalt c, P. Grootes b, S. Heilig a,1,E. Ivanova a,2, M. Kienast a,1, C. Pelejero c, U. Pflaumann a
a Institute of Geosciences, Kiel University, Kiel, Germanyb Leibniz Labor, Kiel Universitat, Kiel, Germany
c Departament de Quimica Ambiental, Centre D’Investigacio i Desenvolupament,Barcelona, Catalonia, Spain
Received 21 March 1998; accepted 20 August 1998
Abstract
Based on the study of 10 sediment cores and 40 core-top samples from the South China Sea (SCS) we obtained proxyrecords of past changes in East Asian monsoon climate on millennial to bidecadal time scales over the last 220,000 years.Climate proxies such as global sea level, estimates of paleotemperature, salinity, and nutrients in surface water, ventilationof deep water, paleowind strength, freshwater lids, fluvial and=or eolian sediment supply, and sediment winnowing onthe sea floor were derived from planktonic and benthic stable-isotope records, the distribution of siliciclastic grain sizes,planktonic foraminifera species, and the UK
37 biomarker index. Four cores were AMS-14C-dated. Two different regimesof monsoon circulation dominated the SCS over the last two glacial cycles, being linked to the minima and maxima ofNorthern Hemisphere solar insolation. (1) Glacial stages led to a stable estuarine circulation and a strong O2-minimumlayer via a closure of the Borneo sea strait. Strong northeast monsoon and cool surface water occurred during winter, inpart fed by an inflow from the north tip of Luzon. In contrast, summer temperatures were as high as during interglacials,hence the seasonality was strong. Low wetness in subtropical South China was opposed to large river input from theemerged Sunda shelf, serving as glacial refuge for tropical forest. (2) Interglacials were marked by a strong inflow ofwarm water via the Borneo sea strait, intense upwelling southeast of Vietnam and continental wetness in China duringsummer, weaker northeast monsoon and high sea-surface temperatures during winter, i.e. low seasonality. On top of thelong-term variations we found millennial- to centennial-scale cold and dry, warm and humid spells during the Holocene,glacial Terminations I and II, and Stage 3. The spells were coeval with published variations in the Indian monsoon andprobably, with the cold Heinrich and warm Dansgaard–Oeschger events recorded in Greenland ice cores, thus suggestingglobal climatic teleconnections. Holocene oscillations in the runoff from South China centered around periodicities of775 years, ascribed to subharmonics of the 1500-year cycle in oceanic thermohaline circulation. 102=84-year cyclesare tentatively assigned to the Gleissberg period of solar activity. Phase relationships among various monsoon proxiesnear the onset of Termination IA suggest that summer-monsoon rains and fluvial runoff from South China had al-ready intensified right after the last glacial maximum (LGM) insolation minimum, coeval with the start of Antarctic ice melt
Ł Corresponding author. Present address: Graduate School of Environmental Earth Science, Hokkaido University, Kita Ku, Sapporo W5N10, Japan. Fax: C81-11-736-3290; E-mail: [email protected] Earth and Ocean Sciences, University of British Columbia, Vancouver, Canada.2 Institute of Oceanology, Russian Academy of Science, Moscow, Russia.
0025-3227/99/$ – see front matter 1999 Elsevier Science B.V. All rights reserved.PII: S 0 0 2 5 - 3 2 2 7 ( 9 8 ) 0 0 1 8 2 - 0

246 L. Wang et al. / Marine Geology 156 (1999) 245–284
prior to the δ18O signals of global sea-level rise. Vice versa, the strength of winter-monsoon winds decreased in shortcentennial steps only 3000–4000 years later, along with the melt of glacial ice sheets in the Northern Hemisphere. 1999Elsevier Science B.V. All rights reserved.
Keywords: Late Pleistocene; variability of East Asian monsoon; paleoceanography South China Sea; global climateteleconnections; marine loess deposits; sub-millennial climate periodicities
1. Introduction
The Asian monsoon system is a thermodynamicatmospheric circulation induced by the seasonalchange in heating the Central Asian highlands withtheir extreme lapse rate and the resulting CentralAsian heat low during summer. The strong seasonal-ity of wind directions, temperature, and precipitationforms the basis of a process that involves an exten-sive transport of moisture from low to high latitudes,between sea and land during summer. Similar tothe global salinity conveyer belt in the ocean, themonsoon system in the atmosphere represents oneof the basic elements of the global circulation. Themonsoon controls the atmospheric heat budget in theNorthern Hemisphere and hence, changes in mon-soon have a great potential in controlling globalclimatic change.
The climate of the South China Sea (SCS) andthe ambient land masses is dominated by the EastAsian monsoon (Tchernia, 1980). Seasonal changesin winds play an important role for the short- andlong-term hydrological, chemical, and sedimentolog-ical cycles in this region, and last but not least, thesea-surface circulation in the SCS. As the monsoonclimate affects the most densely populated regions onour planet, both present and past changes in monsooncirculation will strongly influence the development offlora, fauna, that includes the variations of continentalbiomass, and finally, the evolution of mankind.
Many previous land-based studies had unraveledthe long-term history of monsoon moisture as docu-mented in the loess profiles of North China (Kukla etal., 1988; Liu and Ding, 1993; Banerjee, 1995; Porterand An, 1995). Dry phases with enhanced dischargeof dust by the winter monsoon were mainly linkedto glacial and cold stages, to short-term Heinrichevents, and to the Younger Dryas, which was alsoobserved in the marine sediment record of the SuluSea (Kudrass et al., 1991). In contrast, interglacials
led to wet climate and soil formation in China (Kuklaet al., 1988; Banerjee, 1995; Porter and An, 1995).An early Holocene maximum in monsoon moisturewas documented in both the Arabian Sea at 11,600–8600 calibrated yr BP (Sirocko et al., 1993, 1996)and China (Pye and Zhou, 1989; Shi et al., 1993;poorly dated in Winkler and Wang, 1993; Porterand An, 1995), and also in a methane maximumof the GRIP ice core (Blunier et al., 1995). Basedon a marine sediment record from the Arabian Sea,the Indian monsoon varied in intra-Holocene cyclesof about 1050, 1500, and 3000 years (Sirocko etal., 1996), i.e. periods similar to the climate cy-cles found in ice cores from Greenland (Stuiver etal., 1995; Grootes and Stuiver, 1997). One may,therefore, expect that analogous events of enhancedprecipitation and fluvial runoff in South China maylead to an enlarged plume of low sea-surface salinity(SSS) offshore Hongkong (Fig. 1) and thus can bereconstructed from sediments in the northern SCS.The same principles will hold true for enhancedprecipitation in Borneo, Indonesia, and Indo-China,documented in the southwestern SCS.
In this paper, we summarize various lines ofisotopic, sedimentologic, and geochemical evidencefrom some ten deep-sea cores, obtained from re-gions with high sedimentation rates (reaching 7–85 cm=ka) along the northern, western, and south-western margins of the SCS. These proxy recordshelp us deciphering past seasonal monsoon signalsin both subtropical and tropical parts of the SCS.Especially, we are tracing the variations in (1) mois-ture transport and hence, the intensity of monsoonprecipitation during summer, (2) the dust transportand fluxes, i.e. wind strength and aridity during win-ter, moreover, (3) the signals of climatic change andvegetation cover on the dried-up Sunda subcontinentduring glacial times.
Our paleomonsoon records extend over the lasttwo glacial cycles and the subsequent deglacia-
L. Wang et al. / Marine Geology 156 (1999) 245–284 247
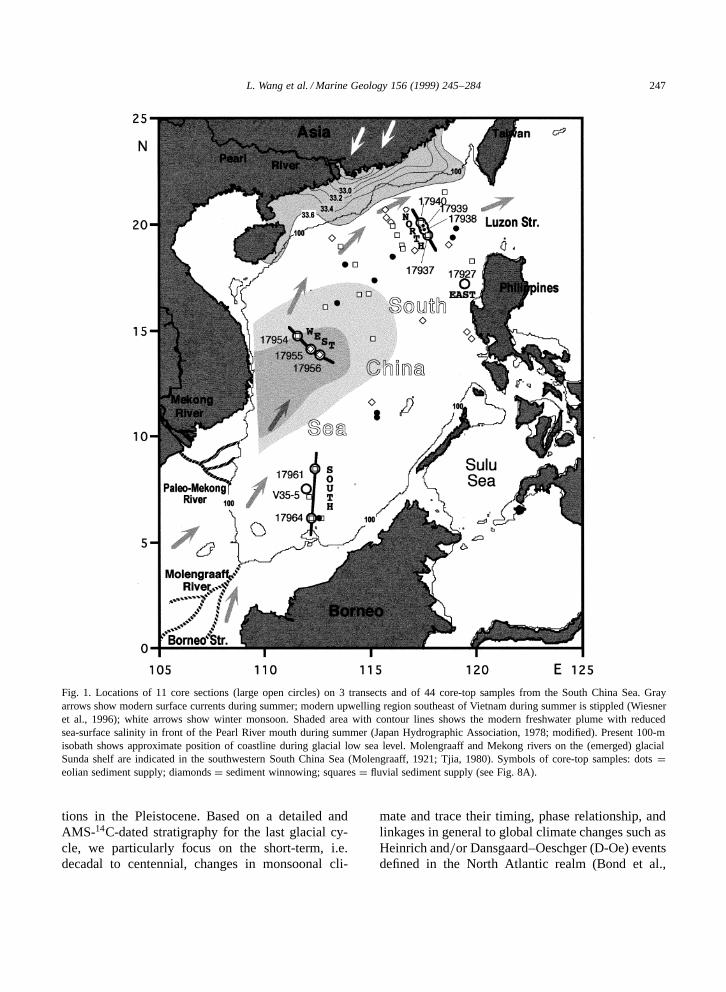
Fig. 1. Locations of 11 core sections (large open circles) on 3 transects and of 44 core-top samples from the South China Sea. Grayarrows show modern surface currents during summer; modern upwelling region southeast of Vietnam during summer is stippled (Wiesneret al., 1996); white arrows show winter monsoon. Shaded area with contour lines shows the modern freshwater plume with reducedsea-surface salinity in front of the Pearl River mouth during summer (Japan Hydrographic Association, 1978; modified). Present 100-misobath shows approximate position of coastline during glacial low sea level. Molengraaff and Mekong rivers on the (emerged) glacialSunda shelf are indicated in the southwestern South China Sea (Molengraaff, 1921; Tjia, 1980). Symbols of core-top samples: dots Deolian sediment supply; diamonds D sediment winnowing; squares D fluvial sediment supply (see Fig. 8A).
tions in the Pleistocene. Based on a detailed andAMS-14C-dated stratigraphy for the last glacial cy-cle, we particularly focus on the short-term, i.e.decadal to centennial, changes in monsoonal cli-
mate and trace their timing, phase relationship, andlinkages in general to global climate changes such asHeinrich and=or Dansgaard–Oeschger (D-Oe) eventsdefined in the North Atlantic realm (Bond et al.,

248 L. Wang et al. / Marine Geology 156 (1999) 245–284
1992, 1997; Cortijo et al., 1995) and the associ-ated changes in the global thermohaline circula-tion (Broecker et al., 1988; Sarnthein et al., 1994b;Seidov et al., 1996). Similar teleconnections wererecently found and=or postulated by Kennett and In-gram (1995) and Kotilainen and Shackleton (1995)by studying paleoclimatic sediment records from theeastern and northwestern Pacific margins.
2. Materials and methods
2.1. Selection of core transects and sediment samples
All samples used in this study are selected fromthe core collection obtained by the ‘Monitor Mon-soon’ Project during the FS Sonne cruise 95 inApril–June 1994 (Sarnthein et al., 1994a) (Tables 1and 2; Fig. 1). Nine gravity and=or piston coresform three major transects in the north, west, andsouthwest of the SCS. All cores were obtained fromisolated sea-floor elevations at intermediate waterdepths on the continental slope and rise (Tables 1and 2) and only contain undisturbed hemipelagicsediments with high and ultrahigh sedimentation
Table 1Location, water depth (W.d.), and core recovery of Sonne-95 cores used in this paper
Site Latitude Longitude W.d Recov. Corer type Sedirate Sample interval (cm)(N) (E) (m) (m) (cm=ka)
Stable isot. Grain size UK37–PF-SST
North transect17937-2 117º39.90 19º30.00 3428 12.92 SL 11 (35) 1017938-2 117º32.30 19º47.20 2840 11.78 SL 15 (35) 1017939-2 117º27.30 19º58.20 2474 12.74 SL 28 (34) 10 1017940-1 117º23.00 20º07.00 1728 0.56 GKG 50–70 517940-2 117º23.00 20º07.00 1727 13.30 SL 45–85 (19) 1–2 2 4–10
West transect17954.2 111º31.50 14º47.80 1520 11.52 SL 6–7 (5–9) 2.5–10 4–1017955-2 112º10.60 14º07.30 2393 11.66 SL 4–5 (3–6) 2.5–1017956-2 112º35.30 13º50.90 3388 13.56 SL 4–5 (3–5) 10
South transect17961-2 112º19.90 08º30.40 1968 10.30 SL 3–8 (10) 10 10 1017964-2 112º12.80 06º09.50 1556 13.04 KL ¾30 (>55) 20 2017964.3 112º12.80 06º09.50 1556 9.12 SL ¾30 (>55) 8–20 20
East17927-2 119º27.20 17º15.10 2804 5.58 SL 8 (2–13) 10 10
SL D gravity core; CKG D giant spade-box core; KL D piston core. Sedimentation rates (Sedirate) are presented separately forinterglacial=Holocene and last glacial times (in brackets).
rates. On the three core transects, the ‘key’ sites17940, 17954, and 17961 have provided ultrahigh-resolution (bidecadal to centennial) records basedon multi-proxy studies and thus form the backboneevidence of our study.
The northern transect (cores 17937-2, 17938-2,17939-2, and 17940-1=2) extends over 400–500 kmsoutheast of Hong Kong. This transect is locatednear the freshwater plume in front of the Pearl Rivermouth and may hence serve for monitoring past vari-ations in fluvial discharge and monsoonal precipita-tion in subtropical South China. The western transectlies off South Vietnam (cores 17954-2, 17955-2 and17956-2). The distal part of this transect extendsinto the area of upwelling driven by the southwestmonsoon during summer (modeled by Wiesner etal., 1996; Fig. 1). Cores 17961-2 and 17964-2=3(supplemented by VEMA core 35-5; Broecker et al.,1988, and Duplessy et al., 1991) are from the tropicalsouthwesternmost SCS, in front of the mouth of theformer ‘Molengraaff’ River which debouched fromthe Sunda shelf during times when it was dried upalong with glacial low sea level (Molengraaff, 1921;Fig. 1). A further, tenth core (17927), documents theSST=SSS regime to the west of Luzon.

L. Wang et al. / Marine Geology 156 (1999) 245–284 249
Table 2Location, water depth, clay content and silt-mode values of thesurface sediment samples from Sonne-95 giant spade-box cores
Site Latitude Longitude Water Clay content, Silt-(N) (E) depth <6.3 µm mode
(m) (%) (µm)
17920-1 119º45.10 14º35.10 2507 35.0 817921-1 119º32.30 14º54.70 2507 41.7 717922-1 117º27.50 15º25.00 4221 26.3 1017924-1 118º50.80 19º24.70 3438 73.5 2017925-2 119º02.80 19º51.10 2980 70.9 1917926-2 118º44.00 19º00.00 3761 45.0 1317928-2 119º44.70 18º16.30 2486 55.5 5317929-1 115º42.00 20º40.90 371 25.2 3717930-1 115º46.90 20º20.00 629 19.7 2817931-1 115º57.80 20º06.00 1005 43.6 1817932-1 116º02.30 19º57.00 1365 61.4 3617933-2 116º13.60 19º32.00 1972 67.5 3517934-1 116º27.70 19º01.90 2665 71.6 3417935-2 116º31.60 18º52.70 3143 78.4 5717936-1 117º07.20 18º46.00 3809 69.6 1117937-1 117º40.00 19º30.10 3428 73.1 3517938-1 117º32.30 19º47.20 2835 64.3 1717939-1 117º27.30 19º58.20 2473 63.3 2217940-1 117º23.00 20º07.00 1728 54.3 5017941-1 118º28.90 21º30.90 2201 65.9 5017942-1 113º12.10 19º20.00 329 20.3 3017943-1 113º33.20 18º57.00 917 59.1 3817945-1 113º46.60 18º07.60 2404 73.0 1617946-1 114º15.00 18º07.50 3465 68.5 3517947-2 116º01.70 18º28.00 3765 58.4 3017948-1 114º53.80 18º42.50 2841 82.2 3117949.1 115º10.00 17º20.90 2195 68.0 2617950-1 112º53.90 16º05.60 1868 66.7 3417951-1 113º24.60 16º17.30 2340 77.5 1717952-2 114º28.40 16º40.00 2882 81.0 4517953-3 115º08.60 14º33.00 4307 73.6 2617954-1 111º31.60 14º45.50 1517 60.4 5217955-1 112º10.60 14º07.30 2404 44.0 1817956-1 112º35.30 13º50.90 3387 52.8 1817957-1 115º18.30 10º53.90 2197 89.8 1417958-1 115º04.90 11º37.30 2581 62.4 1317959-1 115º17.20 11º08.30 1957 73.9 1317961-1 112º19.90 08º30.40 1795 85.6 2817962-1 112º04.90 07º10.90 1970 79.9 4517963-2 112º40.00 06º10.00 1233 68.2 5517964-1 112º12.80 06º09.50 1556 67.3 5817965-1 112º33.10 06º09.40 889 63.2 25
2.2. Methods and paleoclimatic proxy data
Major unknowns of monsoonal paleoclimate are(1) continental aridity and moisture, wind strength,
Fig. 2. Schematic summary of isotopic, micropaleontological,sedimentological, and geochemical sediment records used forcalculating paleoceanographic and paleoclimatic proxy data.
and (2) temperature, salinity, nutrients, and produc-tivity near the sea surface. These proxies are recon-structed from a broad inventory of isotopic, sedi-mentological, and geochemical data, summarized inFig. 2.
Stable oxygen and carbon isotopes were mea-sured on samples composed of 15–20 specimens ofGlobigerinoides ruber s.s. (white) in the 315–400µm size fraction, which provides a record of theisotopic composition of the top 30 m in the sur-face water (Fairbanks et al., 1980, 1982; Grothmann,1996; Mulitza et al., 1997; Wang et al., in prep.).All tests were crushed, repeatedly washed in ethanol(99.8%) and an ultrasonic bath, and dried at 40ºC.Samples for accelerator mass spectrometry (AMS)14C dating were obtained from either G. ruber or G.sacculifer specimens, each sample amounting to 7–12 mg. The samples were cleaned (without crushingthe tests) in an ultrasonic bath with 99.8% ethanoland=or with distilled water. Based on eight paralleltests, these two different treatments did not result insystematic age deviations (Table 3). Stable isotopesand AMS-14C ages were measured at the LeibnizLaboratory of the Kiel University following standardprocedures (Ganssen and Sarnthein, 1983; Nadeau etal., 1997; Schleicher et al., 1998). The external er-rors of stable-isotope analyses are š0.08‰ PDB andš0.06‰ PDB for δ18O and δ13C, respectively. Theaverage background of AMS-14C dating is 0.3% 14C(equal to about 46,000 yr BP). Standard errors in-

250 L. Wang et al. / Marine Geology 156 (1999) 245–284
Table 3AMS-14C ages measured in cores 17940-2, 17939-2, 17961, 19764 a
Sample depth AMS 14C age b Error 1¦ Planktonic foraminifera Sample treatment Calibrated age Notes(cm c.d.) (yr BP) š (yr) species (yr BP)
Core 17940-222.5 700 C65=�60 G. sacculifer alc. 670–570 1, 247.5 1,010 C25=�25 G. sacculifer alc. 930 1
100.5 2,350 C75=�70 G. sacculifer alc. 2,350 1101.5 2,010 C40=�40 G. sacculifer dist. 1,940 1
(101.0) 2,145 š 55 8112.5 2,470 C80=�75 G. sacculifer alc. 2,730–2,360 1, 2114.5 2,190 C30=�30 G. sacculifer dist. 2,300–2,130 1, 2
(113.5) 2,380 š 205 8158.5 2,820 C30=�30 G. sacculifer alc. 2,950–2,862 1, 2174.5 3,160 C30=�30 G. sacculifer alc. 3,370 1232.5a 4,050 C55=�30 G. sacculifer alc. 4,570–4,420 1, 2232.5b c 3,970 C30=�30 G. sacculifer alc. 4,420 1
(232.5) 4,460 š 74 8252.5 4,660 C65=�60 G. ruber dist. 5,460–5,310 1, 2260.5a 4,310 C40=�40 G. sacculifer dist. 4,860 1260.5b 4,390 C30=�30 G. sacculifer dist. 5,030 1262.5 4,670 C60=�60 G. sacculifer alc. 5,560–5,310 1, 2
(258.5) 5,220 š 150 8332.5 5,830 C75=�70 G. sacculifer alc. 6,660 1334.5a 5,710 C50=�30 G. sacculifer dist. 6,490 1334.5b 5,700 C40=�40 G. sacculifer dist. 6,480 1
(233.5) 6,560 š 120 8372.5 5,930 C65=�60 G. ruber dist. 6,750 1430.5 7,510 C60=�60 G. sacculifer dist. 8,320 3432.5 7,810 C60=�60 G. sacculifer alc. 8,550 3436.5 7,620 C50=�50 G. sacculifer dist. 8,370 3
(433.5) 8,380 š 130 8502.5 8,650 C80=�80 G. sacculifer alc. 9,540 3506.5 8,590 C90=�90 G. sacculifer dist. 9,640–9,450 2, 3
(504.5) 9,600 š 190 8620.5 9,540 C65=�60 G. sacculifer dist. 10,890–10,430 4, 5622.5 9,810 C110=�110 G. sacculifer alc. 11,010–10,950 4, 5
(621.5) 10,730 š 310 8650.5 10,030 C60=�60 G. sacculifer dist. 11,730–11,040 4, 5652.5 9,870 C110=�110 G. ruber alc. 11,200–10,970 4, 5
(651.5) 11,240 š 360 8(656.5) 11,600 6722.5 11,280 C110=�110 G. ruber alc. 13,280 7792.5 13,090 C140=�140 G. ruber alc. 15,090 7842.5 13,960 C154=�152 G. ruber alc. 17,460 7852.5 14,160 C161=�157 G. ruber alc. 17,660 7892.5 15,510 C190=�186 G. ruber alc. 19,010 7912.5 16,490 C220=�210 G. ruber alc. 19,990 7922.5 17,260 C220=�220 G. ruber alc. 20,760 7932.5 18,050 C140=�140 G. sacculifer dist. 21,550 7
1032.5 24,510 C590=�550 G. ruber alc. 28,010 71102.5a 26,150 C330=�320 G. sacculifer dist. 29,650 71102.5b 26,840 C660=�610 G. ruber dist. 30,340 7
(1102.5) 30,000 š 710 81212.5 30,800 C1100=�1000 G. ruber dist. 34,300 71272.5 35,500 C2400=�1900 G. ruber alc. 39,000 7

L. Wang et al. / Marine Geology 156 (1999) 245–284 251
Table 3 (continued)
Sample depth AMS 14C age b Error 1¦ Planktonic foraminifera species Sample treatment Calibrated age Notes(cm c.d.) (yr BP) š (yr) (yr BP)
Core 1793920 1,120 C30=�30 G. sacculifer alc. 1,060–974 1, 298a 4,490 C50=�30 G. sacculifer alc. 5,280–5,000 1, 298b 4,550 C40=�40 G. sacculifer dist. 5,300–5,060 1, 298c c 4,440 C40=�40 G. sacculifer alc. 5,210–4,880 1, 2
250 9,580 C60=�60 G. sacculifer alc. 10,910–10,480 4440a 13,530 C90=�90 G. sacculifer alc. 17,030 7440b 13,370 C90=�90 G. sacculifer dist. 16,870 7490 13,210 C120=�120 G. sacculifer alc. 16,710 7570 14,640 C90=�90 G. sacc. C ruber alc. 18,140 7630 15,200 C110=�110 G. sacc. C ruber alc. 18,700 7680 15,910 C110=�110 G. sacculifer alc. 19,410 7880 18,950 C120=�120 G. sacculifer alc. 22,450 7
Core 17961290 24,540 C290=�280 G. sacculifer dist. 28,040 7310 25,480 C340=�330 G. sacculifer dist. 28,980 7440 34,200 C940=�840 G. sacculifer dist. 37,700 7490 39,700 C2100=�1700 G. sacculifer dist. 43,200 7
Core 179648 950 C35=�35 G. ruber dist. 910
108 4,230 C60=�59 G. ruber dist. 4,830168 6,120 C66=�65 G. ruber dist. 7,020208 7,350 C74=�73 G. ruber dist. 8,120308 9,690 C93=�92 G. ruber dist. 10,960368 11,100 C120=�120 G. ruber dist. 13,100 7
Notes. 1: converted calendar age (Stuiver and Becker, 1993; Stuiver and Pearson, 1993); 2: age range at minor 14C plateau; 3: convertedcalendar age (Pearson et al., 1993); 4: converted calendar age (Kromer and Becker, 1993); 5: age range at major 14C plateau (Bard et al.,1990a,b); 6: calendar age of the top of the Younger Dryas (Alley et al., 1993); 7: converted calendar age (Bard et al., 1990a,b; Winn etal., 1991); 8: averaged calendar ages used in smooth-spline fit (see text for discussion).a Average ages in core 17940 are used in Fig. 4 and Fig. 5; alc. D alcohol; dist. D distilled water.b A 400-yr correction is applied for the reservoir age of sea water, although its precise age range is unknown in the South China Sea(Stuiver and Braziunas, 1993).c Foraminiferal tests with 80% of size fraction 150–315 µm.
cluding the background radioactivity were calculatedper sample batch.
Based on both the δ18O and δ13C records of twocore sections from giant spade-box core 17940-1with 45 cm and neighbor gravity core 17940-2 with1315 cm length, we spliced a composite-depth (c.d.)section at site 17940, where 0 cm in 17940-2 is equalto 2.5 cm depth in 17940-1. This core fit ensuresthe recovery of the genuine sediment surface for thereconstruction of our paleoclimatic records.
Siliciclastic grain sizes and clay contents weremeasured on a SediGraph 5100D made by Mi-cromeritics according to procedures described byStein (1985). Samples for SediGraph analyses were
obtained from the <63 µm sediment fraction af-ter washing the bulk sample over a 63 µm sieveand completely dissolving the carbonate and organiccarbon fractions in acetic acid and hydrogen perox-ide solutions. The clay content was defined as thepercentage of the acid insoluble grain-size fractionsmaller than 6.3 µm, a boundary that is crucial inaerosol transport (Parkin and Shackleton, 1973). Thegrain-size mode was derived from both the bulk andsilt fractions. Based on 157 replicate measurementsthe mean analytical errors of modal grain sizes andclay contents are 0:77š 1:13 µm and 0:22š 0:46%,respectively. Wind-supplied (dust) and river-borne(mud) sediments, i.e. crucial signals of aridity and

252 L. Wang et al. / Marine Geology 156 (1999) 245–284
humidity, were finally identified by means of the‘Koopmann Index’ (Koopmann, 1981; Stein, 1985),an empirical relationship between the percentage ofsilt >6.3 µm (abscissa) and the modal grain size ofsilt >6.3 µm (explained in detail in the caption ofFig. 6 and, especially, Fig. 8).
Sea-surface temperature (SST) estimates arebased on the biomarker UK
37 index (annual mean SSTat 0–30 m: UK
37 D 0:36T � 0:056; Kirch, 1997;Pelejero and Grimalt, 1997; Pelejero et al., 1999).Based on five replicate extractions of alkenones fromsediment samples, the error of these estimates isabout š0.15ºC. We also used CLIMAP-style plank-tonic foraminiferal (PF) census data, which wereconverted into SST of the ‘sea surface’ using theFP-12E transfer function of Thompson (1981) (core17940: Pflaumann and Jian, 1999; core 17954: com-bined counts of Ivanova, Pflaumann, Heilig). Forequation FP-12E the error is š1.46ºC for summerand š2.48ºC for winter. Pflaumann and Jian (1999)are assessing the differences between PF-based SSTrecords derived from (1) a new Modern Analog(SIMMAX 28) equation, (2) the FP-12E transferfunction, and (3) from UK
37 data. The UK37-based an-
nual mean SST values for 0–30 m also served forcalculating paleosalinity data.
Local paleosalinities of surface water (SSS) wereestimated by subtracting the past variations in SSTand global ice-volume from the planktonic δ18O sig-nal of G. ruber (white), using the transfer equationof L. Wang et al. (1995). Thus the SSS values applyto water depths that depend (1) on the depth range ofthe SST estimates employed, and (2) on the habitatdepth of G. ruber forming its δ18O signal within0–50 m water depth (Tolderlund and Be, 1971; Fair-banks et al., 1980; Williams et al., 1981; Hemlebenet al., 1989). Approximately in harmony with thishabitat depth, we used our UK
37-based annual-meanSST estimates for 0–30 m for calculating the SSSvalues, although summer SST at 0–50 m originallyserved as basis for defining the transfer function ofL. Wang et al. (1995).
We employed annual mean UK37 SST instead of
summer UK37 SST for various reasons. (1) Different
from the northeastern subtropical Atlantic the mod-ern SST range in the SCS provides optimum habitatconditions for a perennial formation of G. ruber andits δ18O signal (Hemleben et al., 1989). (2) Accord-
ingly, sediment traps in the northern and central SCSrecovered maximum fluxes of G. ruber in both latesummer and early winter (Wiesner et al., 1996). (3)UK
37-based annual mean SST largely equate to bothannual mean PF-SST data (see below) and mod-ern average temperatures (Levitus and Boyer, 1994).Moreover, annual mean UK
37 SSTs were preferred toPF-SSTs to avoid (1) a potential bias in PF-SSTsignals linked to the impact of local changes in sub-surface oceanography on certain foraminifera species(e.g. possibly causing some late Holocene SST min-ima), and (2) the artificial high-amplitude noise inPF-SST estimates of single samples. This noise mayresult from both errors in PF census data and thestandard error of the transfer function (Thompson,1981) and hence may strongly bias the SSS val-ues in ultrahigh-resolution records, especially duringphases of rapid climate change. To establish the samesampling resolution for both the high-resolution (1–2 cm) δ18O curve and the medium high-resolution(5 cm) SST records of core 17940, the UK
37 SSTdata were interpolated by a smooth-spline to avoidartificial variability.
The global δ18O ice effect was calculated using ourplanktonic δ18O stratigraphy (Fig. 3a) and the perti-nent δ18O records of Labeyrie et al. (1987), Fairbanks(1989), and Vogelsang (1990). In core 17961, weused the benthic δ18O stratigraphy (Fig. 3c) for cal-culating the δ18O ice effect, since the planktonicδ18O record appears strongly affected by local salinitychanges at this site during Termination IA (Fig. 3a).
A tentative calculation of SSS using the equationsof Rostek et al. (1993) produces almost identicalresults within the standard error of 0.68‰ resultingfrom the equation of L. Wang et al. (1995).
The complete proxy data sets (‘Monitor Mon-soon’) are available on request from the Ger-man ‘Past Global Changes’ (PAGES) marine datarepository PANGAEA (http:==www.pangaea.de [email protected]).
3. Results
3.1. High-resolution Ž18O=Ž13C stratigraphy
Based on the stage definitions by Prell et al.(1986) and Martinson et al. (1987), the δ18O records

L.W
anget
al./Marine
Geology
156(1999)
245–284253
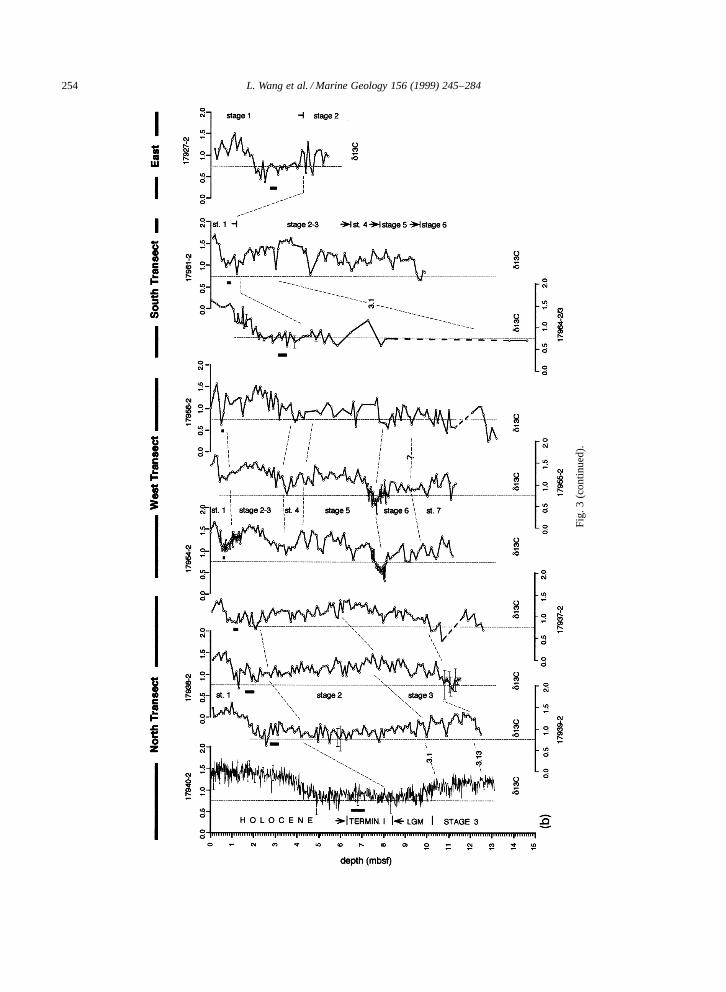
Fig. 3. (a) Oxygen and (b) carbon isotope records measured on planktonic Globigerinoides ruber s.s. (white) and on (c) epibenthic Cibicidoides wuellerstorfi and C. kullenbergiin sediment cores from the SCS (Fig. 1). Crosses show AMS-14C-dated levels (Table 2). Marine isotope stages are labeled and stage boundaries are connected by dashed linesbetween the different records for each transect. Event 3.1 in 17964 is inferred from the benthic δ18O record (Fig. 3c). Vertical dotted lines for each core were added to facilitatecomparison of absolute values. Thick dashed lines in isotope records indicate data gaps that result from a lack of foraminifera specimens. Error bars in 17940 records showstandard error of multiple measurements. Broad vertical bars indicate Younger Dryas (YD) event. B=A D Bølling–Allerød. LGM D Last Glacial Maximum. Note the extremebenthic δ13C minima linked to organic fluff layers and an oxygen-minimum layer, strongly developed along the continental margins. At site 17940 off Hong Kong the benthic δ13Cminimum (�1.4‰) in the earliest Holocene is coeval with maximum runoff of the Pearl River (540 cm c.d.; about 9000 14C years BP). The benthic δ13C minimum (�1.3=�1.6‰)in core 17964 from the southern margin of the SCS accompanies the runoff of the Molengraaff River during Stage 2. Data of core 17927 are from Kirch (1997).
254 L. Wang et al. / Marine Geology 156 (1999) 245–284
Fig.
3(c
ontin
ued)
.

L. Wang et al. / Marine Geology 156 (1999) 245–284 255
Fig.
3(c
ontin
ued)
.

256 L. Wang et al. / Marine Geology 156 (1999) 245–284
from our ten core sections (Fig. 3) comprise theglobal standard variations of the last (cores 17927and 17937–40, northeastern SCS, and cores 17961and 17964, southern SCS), or last two glacial cyclesback to early Stage 7 (cores 17954–56, westernSCS). In the western transect the details of the glacialterminations are not as well resolved as in the coresof the northern transect. In the west, the δ18O shiftsof the last two glacial-to-interglacial cycles reach thesame order of magnitude, with only slightly lighterδ18O values (0.1–0.2‰) in the Eemian than in theHolocene. In the south, especially the benthic δ18Ocurve of core 17961 reveals a clear record of Stages1–5 back to substage 6.2. The benthic δ18O values incore 17964 reach back to the upper part of Stage 3(Fig. 3c). The precise age range, however, cannot bedetermined in core 17964 because of the rareness offoraminifera tests, probably due to extreme sedimentdilution.
The planktonic glacial-to-interglacial δ18O varia-tions amount to about 1.7‰ and are superimposedby a few short-term extreme δ18O minima in theHolocene, reaching less than �3.0‰ (cores 17939and 17937; Fig. 3a). In core 17956, oxygen iso-tope variations amount to about 2.0‰ due to theextremely light δ18O values in the earliest Stage 1and in Stage 5.1, moreover in substage 3.3. Theδ18O values of the western and southern transectsare generally lighter (by ½0.5‰) than those of thenorthern transect. This difference is largely ascribedto different SSTs which are higher in the tropicalwaters of the southern and western transects than inthe northern, subtropical SCS (Japan HydrographicAssociation, 1978).
Besides the major glacial and interglacial δ18Ostages, a number of small-scale, but equally im-portant δ18O excursions characterize early Stage 1and Stage 3 in most records (Fig. 3), especially incore sections with high sedimentation rates. Here adetailed Holocene and deglaciation history is doc-umented in the northern SCS, starting with a dis-tinct Bølling–Allerød (B=A) warm phase. The intra-Holocene ultrarapid climatic changes are reflectedby major δ18O oscillations reaching 0.7–1.0‰. Inthe northern transect the Younger Dryas (YD) eventis clearly recorded as a major δ18O increase by 0.5–
0.7‰. This excursion even contains the character-istic double-peak structure found in the Greenlandice-core records (Alley et al., 1993; Stuiver et al.,1995) (Figs. 3 and 4). In cores from the western andsouthern transects — further away from the north-ern freshwater sources — the YD-style signals arealso recorded either as δ18O plateau and=or slightδ18O increase on top of the general deglacial trend atboth Termination I (cores 17954 and 17961) and II(high-resolution records of cores 17954 and 17955).
The end of the last glacial maximum (LGM) iswell defined by a major δ18O shift of about 0.5–0.7‰toward the Bølling–Allerød level. Prior to this shift,core 17940 shows a minor overall δ18O decreaseby about 0.4‰ at about 850–810 cm core depth, adecrease superimposed by two spikes of light δ18Ovalues beyond the analytical noise level (Fig. 3a andFig. 4). The spikes possibly mark the actual onsetof glacial Termination Ia, which subsequently wasinterrupted by the Oldest Dryas stadial. As comparedto the fairly stable LGM (890–1030 cm depth in core17940) δ18O Stage 3 is characterized by ultrarapidδ18O oscillations. They reach 0.7‰ in the northernand western cores 17940, 17954 and 17955 andexceed 1.5‰ in the southwestern cores 17956 and(especially) 17961. These short-term δ18O signalsare ascribed to freshwater pulses (see Section 4).
The benthic δ18O records (cores 17940, -61, -64;Fig. 3c) largely parallel the planktonic δ18O records,except for the salient Pacific-style minimum of Stage5.5 in core 17961. Special features of the benthicδ13C records are discussed below.
Planktonic δ13C records from the SCS (Fig. 3b)show glacial-to-interglacial variations of 0.5 to 1.0‰over the past 250,000 years. In all cores, the extremesin low δ13C are linked to the onset and end of glacialterminations, such as after glacial Stages 2, 4, and 6.For example, in cores 17954, -56 and -61 the δ13Cminima across the Stage 6–Stage 5 boundary exceedthe minima across the Stage 2–Stage 1 boundary byabout 0.5‰, a trend observed in many planktonicand benthic records worldwide (e.g. Sarnthein andTiedemann, 1990). Within Stage 3, major short-termplanktonic δ13C lows parallel lows in δ18O, mostobviously in core 17961 (near 300, 450, and 650 cmdepth).

L. Wang et al. / Marine Geology 156 (1999) 245–284 257
Fig. 4. (A) Age model of ice-core GISP2 (Grootes and Stuiver, 1997) and (B) of core 17940, based on AMS-14C ages (Table 2)labeled below the planktonic δ18O curve. Composite depth (c.d.) values are based on core-fit between giant spade-box core 17940-1and gravity core 17940-2 (see text for details). The age–depth curve (C) is based on a smooth-spline fit across the age–depth controlpoints, where 14C ages are converted into calendar ages. Duplicate=multiple 14C datings are averaged (after conversion into calendaryears; Table 2); age errors are calculated via a Gaussian error-propagation equation. Below the Preboreal (>11,600 calendar yr BP) thechronostratigraphy in core 17940 is established via tuning the light δ18O peaks in Stages 2–3 to warm Dansgaard–Oeschger (D-Oe)events 2–10 in the δ18O record of the annual-layer counted ice-core GISP2 (thin lines between (A) and (B)). This correlation is made peranalogy to the fit of δ18O excursions at the YD and B=A events. Sedimentation rates in Stages 2–3 are derived from linear interpolationbetween age-control points deduced from tuning to D-Oe events (dashed line in (D)). For comparison, sedimentation rates are calculatedfrom the first derivative of the smooth-spline (solid line in (D)).

258 L. Wang et al. / Marine Geology 156 (1999) 245–284
3.2. AMS-14C dates and age control
AMS radiocarbon ages provided an (apparentlydirect) age control in cores 17940, 17939, 17961, and17964 back to 40 ka (Table 3). Based on these dateswe set up a first age model for the last glacial cycle,especially for confining the events and periodicitiesof monsoon climate over the last deglaciation and theHolocene. The most detailed age model for the lastglacial cycle was established in core 17940, where40 AMS-14C dates were measured (Fig. 4; Table 3).
For the calculation of accumulation rates weconverted the 14C ages into calendar ages, whichimplied two major unknowns: (1) changes in the14C-reservoir effect of the surface water in the SCS;and (2) the differential 14C-production rates in theatmosphere during the last glacial cycle (Duplessyet al., 1989; Stuiver and Braziunas, 1993; Laj et al.,1996; Volker et al., 1998). The 14C ages of dis-solved CO2 in surface-water samples from the SCS(unpublished data) show a post-bomb age of �750years. Fairly conventional reservoir ages of C400and C730 years occur at 250 and 400 m depth, re-spectively. In the glacial SCS the 14C-reservoir effectwas possibly much larger than today (Duplessy etal., 1989; Adkins and Boyle, 1997), since the glacialSCS probably had an estuarine circulation which wasfed by old West Pacific intermediate- to deep-watermasses that mark the end of the global thermohalinecirculation in the ocean (Gordon, 1986; L. Wang,1992; P. Wang, 1992). The estuarine system resultedfrom a perfect isolation of the SCS to the southwestas soon as the sea level was lowered by more than40 m and the straits of Borneo were closed, differentfrom today, when abundant young surface water isentering from the Indian Ocean.
Based on dates of Shackleton et al. (1988) thesynglacial Pacific intermediate water reached an ageof about 2400 years. If this age also holds true forthe (upwelled) estuarine surface water of the glacialSCS, the resulting 14C anomaly was just opposedto the age difference resulting from an increasedcosmogenic 14C production in the atmosphere duringthat time, that led to a reduction of 14C ages by3000 to 4000 years versus calendar ages (Bard et al.,1990a; Volker et al., 1998).
In our approach, 14C dates of the last 11,000 yearswere converted into calendar ages, based on the cali-
bration technique of Stuiver and Braziunas (1993) andtaking into account a minor additional reservoir agefor the western Pacific (140š45 yr; i.e. a total of 540yr). Beyond the calibration range of dendrochronol-ogy, 14C years were corrected by 2000–3500 years(Table 3), using calibration schemes based on rare U–Th ages (Bard et al., 1990a; Winn et al., 1991) andvarves (Hughen et al., 1998). In this first simple con-version no higher 14C-reservoir ages are considered.
In the Holocene section, any age model of core17940, which is based on a simple linear interpo-lation of the numerous, closely packed 14C dates,would suffer from various severe artifacts. Theywould result in strongly fluctuating sedimentationrates with highly questionable extremes. To copewith this problem, we built our age model on theassumption of more uniform sedimentation rates by(1) averaging the (calibrated) calendar ages obtainedfrom any core section less than 10 cm thick (Ta-ble 3), and (2) applying a smooth-spline (Reinsch,1967) through the dated depth levels (Fig. 4).
In δ18O Stage 3 the conversion of 14C dates intocalendar ages is more complicated than in Stages 1–2 because of (1) poorly quantified but strong varia-tions in cosmogenic 14C production (Laj et al., 1996;Volker et al., 1998), which result in (2) various14C rises and plateaus that lack any U=Th-calibratedage-control points (Bard et al., 1990a), and finally,(3) because of unknown but probably considerablevariations in the local 14C-reservoir effect. There-fore, we adopted a different, ‘direct’ approach tochronostratigraphy: we tied the δ18O minima of core17940 in Stages 2 and 3 to ice-varve ages of thewarm D-Oe events recorded in the δ18O curve of theGISP2 ice core (Grootes and Stuiver, 1997). Thisapproach is based on the assumption that the δ18Ominima equate to monsoonal precipitation maximanear site 17940, which, in turn, directly parallel thehighs in air temperature (and snow accumulation)on the Greenland summit (Fig. 4). Indeed, the pro-nounced δ18O minima in both the Bølling–Allerødand the Preboreal to early Holocene of core 17940are readily explained by maxima in summer-mon-soon precipitation, as the local SST do not show anycomparable increase during these times (see belowand Fig. 9). The δ18O record between the age-controlpoints that were tied to Dansgaard–Oeschger events1–10 was simply telescoped in core 17940 (Fig. 4).

L. Wang et al. / Marine Geology 156 (1999) 245–284 259
The switch point between the calibrated calendarages of the Holocene and the ages derived as directequivalents of ice-core stratigraphy occurs at the endof the YD event, 11,600 yr BP (D equivalent ageaccording to Alley et al., 1993 and Stuiver et al.,1995), at 656.5 cm composite depth (c.d.). The lowerend of the YD is constrained by a calendar age of13; 280 š 110 yr BP obtained for the Allerød δ18Ominimum at 722.5 cm c.d. in core 17940 (Table 3).
In Stages 2 and 3 the difference between the cor-related ice-core equivalent ages and the foraminiferal14C ages amounts to 3000–5100 years (Fig. 5). Theseanomalies differ from the ‘constant’ age shift of 3500years, originally inferred from three first coral 14Cdates calibrated by U–Th ages (Winn et al., 1991;Bard et al., 1998). 14C-age shifts that exceed 3500years, despite a potentially high 14C-reservoir effect,imply a substantially increased rate of radiocarbonproduction during that time, similar to rates found inthe Nordic Seas (Volker et al., 1998).
In our cores we generally employed the GISP2-equivalent ages for Stages 2 and 3, for example, forassessing the global climatic correlations of short-term climate events. Prior to Stage 3, the astronomi-
Fig. 5. Deviation of AMS-14C ages in core 17940 (corrected fora 14C-reservoir age of 400 years; Table 2) from GISP2 calendarages (broad line) as deduced from tuning the two paleoclimaticrecords (Fig. 4A,B). Error bars show 1¦ standard error of 14Cdates. Thin lines depict global 14C-age shift (visual-fit trendline and envelope) estimated from 14C values measured in twoNordic Sea cores and tuned to the GISP2 ice record (Volker etal., 1998). Differences in 14C shifts between records from SCSand Nordic Seas are assigned to differential 14C-reservoir effectof SCS surface water.
cally tuned SPECMAP-δ18O stratigraphy (Martinsonet al., 1987) was employed for cores 17954–56 and17961. In Figs. 3–10a, however, we display thevarious stratigraphic records and proxy data fromdifferent cores on the simple depth scale (cm belowsea floor) to provide direct information of originaldata (Fig. 10b and Fig. 11 show the SSS recordsagainst calendar years).
3.3. Sedimentation rates
The four δ18O records of the northern core tran-sect (17937–40; Fig. 1) document a region with thehighest hemipelagic sedimentation rates ever foundin the SCS (25–85 cm=ka; Fig. 4). Accordingly, a1-cm sampling resolution results in a time resolutionof 20–30 years in the Holocene and about 40 yearsin Stages 2 and 3. The sedimentation rates on thecontinental slope vary with increasing distance fromthe shelf break. The shallowmost site 17940 showsa maximum thickness of 6.5 m for the Holocene.More distally, on the deeper continental slope, theHolocene sediment thickness decreases to about 2.7,1.5 and 1.1 m in cores 17939, 17938 and 17937,respectively (Fig. 3a). The glacial sections show theopposite trend, with sedimentation rates increasingoffshore from 19 cm=ka in core 17940 to 34–35cm=ka in cores 17939–17937. We assign this trendto a capture of Holocene river-borne terrigenous sed-iments on the upper continental slope, in contrastto an increased sediment transport across the upperslope during glacial low sea level, when the rivermouths had shifted across the shelf, in part wereprobably deeply incised (Fig. 1), and larger portionsof the sediment load bypassed our core transect.
East of Vietnam, the fairly similar δ18O recordsof cores 17954, 17955, and 17956 indicate strongerchanges in sedimentation rates, ranging from 2 to9 cm=ka (Fig. 3a). In the southern SCS the benthicδ18O stratigraphy (Fig. 3c) results in sedimentationrates that vary from interglacial 7 cm=ka to glacial15 cm=ka in core 17961 and reach up to 30–60cm=ka in (paleo-) nearshore core 17964, rates whichare mainly produced by (hemipelagic) terrigenoussediment input. It is derived from the Indo-ChinaPeninsula and the Indonesian Archipelago, espe-cially, from the emerged Sunda shelf during Stage-2and Stage-3 times of low sea level.

260 L. Wang et al. / Marine Geology 156 (1999) 245–284

L. Wang et al. / Marine Geology 156 (1999) 245–284 261
Fig. 7. Close-up of variations in terrigenic sediment input across the last deglaciation (600–1000 cm c.d.) in core 17940 as compared tothe planktonic δ18O record. Siliciclastic modal grain sizes (>6 µm) of dust stand for paleowind strength during winter, clay contentsreflect intensity of fluvial sediment input. Thin lines mark levels with AMS-14C dates, broad bars display major abrupt changes inthe terrigenic sediment input and their linkage to δ18O stratigraphy (LGM D Last Glacial Maximum; OD D Oldest Dryas; B=A DBølling–Allerød; YD D Younger Dryas. Preboreal–early Holocene maximum in summer monsoon). Horizontal bars near to the rightmargin show winnowed (W), eolian dust (E), and fluvial mud (F) deposits (based on Koopmann index; see Fig. 8B).
3.4. Grain sizes of the siliciclastic sediment fraction
Similar to the δ18O records, the grain-size curvesof core 17940 are based on sample spacings of 2cm equal to a time resolution of 20–50 years inthe Holocene and about 80–100 years in the LGMand δ18O Stage 3. Sample intervals are 10 cm incores 17939 and 17961 and 10–20 cm in core 17964,resulting in an average time resolution of 500–1500years over glacial and interglacial stages of the last140,000 years (Fig. 6).
Fig. 6. (a) and (b). Percent clay (<6.3 µm) and silt modal grain sizes (6.3–63 µm) in the siliciclastic, carbonate-free fraction (<63 µm)of hemipelagic sediments in core 17940, supplemented by % clay (<6.3 µm) curves of cores 17939 (northern SCS), 17961, and 17964(southern SCS), where the silt fraction of many samples is partly too small for deducing an unequivocal silt grain-size mode. Horizontalbars along % clay curves of cores 17940 and 17964 indicate dominance of eolian dust (E), fluvial mud (F), or winnowed deposits (W),based on the Koopmann grain-size index (Fig. 8; see Section 4.1). The only volcanic ash layer in core 17940 occurs at 1098.5 cm c.d.δ18O curves are shown for stratigraphic reference (LGM D Last Glacial Maximum; YD D Younger Drays event; * D Preboreal–earlyHolocene maximum in summer-monsoon humidity).
Grain sizes (% clay <6 µm and the modal grainsize of silt >6 µm) were measured on the silici-clastic sediment fraction, i.e. on the carbonate-freefraction, still including a small but negligible portionof marine biogenic opal. In general, the clay fractionis dominating the hemipelagic sediment sections ofthe SCS (Fig. 6a). In core 17940, less pronouncedin core 17939, the clay content varies significantly,with high values of 70–75% in the Holocene, a clearextreme of 75 to >80% in the earliest Holocene,low values of 50–55% in the LGM, and striking

262 L. Wang et al. / Marine Geology 156 (1999) 245–284
Fig. 8. Correlation of % clay plus fine silt (<6.3 µm) versus silt modal grain sizes (6.3–63 µm) in the siliciclastic, carbonate-freefraction (<63 µm) of modern hemipelagic surface sediments in the SCS (A) (Grothmann, 1996) and cores 17940 (B) and 17964 (C). ID group of samples from sea-floor elevations far from continental river discharge with a well sorted grain-size spectrum characteristic ofeolian-dust input. II D group of samples with an excess in fine fraction relative to silt modal grain sizes characteristic of fluvial sedimentdischarge. III D group of samples with a deficit in fine fraction relative to silt modal grain sizes, ascribed to volcanic ashes (samples20–22) and sediment winnowing on the sea floor (‘Koopmann index’; Koopmann, 1981). Numbers in (A) are sample numbers (Table 1).
short-term oscillations of <50 to >60% in late Stage3. These changes generally parallel the δ18O record,except for the end of the LGM (Stage 2). Here themarked increase in clay content from <50 to >60%begins prior to the onset of glacial Termination Iain the δ18O record. The time lag amounts to almost4000 14C years (926 vs. 850 cm c.d. D 18.0–17.26ka vs. 14.16 ka; Figs. 6 and 7).
In core 17940 the primary modal grain sizes of silt>6 µm are fairly stable in Stage-3 and -2 samples(about 16 µm at 950–1300 cm c.d.). The modesreach maxima of 20–30 µm near the end of the LGM(near 910 cm c.d.) and decrease to about 10 µm at800 cm c.d. (near the start of the Bølling). Furtherupcore, they are highly variable over deglacial andHolocene times (in the top 800 cm c.d.) withoutrevealing a significant trend. In part, this variabilityis an artifact, linked to problems in identifying theprimary silt grain-size modes, once the silt fractionis very small. The grain-size curve of the more distalcore 17939 runs largely parallel to those of core17940 over glacial and interglacial times. However,
increasing offshore distance and water depth resultin a systematic loss of coarser, silt-sized grains anda rise in the clay content by 2–20% between sites17940 and 17939 (Fig. 6a).
The siliciclastic silt fractions exceed 60% at 1098cm c.d. in core 17940 (about 30,000 calendar years)and at 780 cm c.d. in core 17961 (about 75,000calendar years). These silt layers were identifiedunder the microscope as volcanic ash deposits.
In the southern SCS, the percentages of clay incores 17961 an 17964 just reveal a reversed trend(Fig. 6b). Here the Holocene (and warm Stages5.1–5.5) clay contents <6 µm only amount to 88–91% at (paleo-nearshore) site 17964 and 96% at themore distal site 17961. In contrast to the northernSCS, they increase to 93–95% in core 17964 andto 97–98% in core 17961 during peak glacial andsemiglacial Stages 2–4 (Fig. 6b; no silt modes wereidentified at site 17961). Note that the YD event incore 17964 from the southernmost SCS is reflectedby a short-lasting, almost LGM-style, clay maximum(not resolved in core 17961).

L. Wang et al. / Marine Geology 156 (1999) 245–284 263
3.5. Sea-surface temperature records
The SST records of cores 17940 and 17954 arebased on both planktonic foraminifera (PF) censuscounts (PF-SST) and UK
37 data (UK37 SST). The SST
records of cores 17927 and 17961 are derived fromUK
37 data only (Kirch, 1997; Pelejero et al., 1999).The UK
37 SST records in Fig. 9 are calibrated to an-nual mean SST in 0–30 m water depth (Pelejero andGrimalt, 1997); the PF-based SST estimates are cali-brated separately to winter and summer temperaturevalues at ‘the sea surface’ (Thompson, 1981), theaverage of which is compared to the UK
37 SST data.Previous studies using planktonic foraminifera
records (Wang and Wang, 1990; Thunell et al.,1994) already noted that the glacial-to-interglacial
Fig. 9. Sea-surface temperature (SST) records from the northern (17940), western (17954), southern (17961), and eastern (17927) SouthChina Sea. Circles and dots are SST estimates at 0 m depth for summer and winter, based on planktonic foraminifera counts (PF)(FP-12E transfer function of Thompson, 1981). Gray thick lines in cores 17940 and 17954 are annual mean SST based on the average ofwinter and summer PF-SST. Diamonds are annual mean SST values for 0–30 m depth, based on the UK
37-index (UK37 D 0:36T � 0:056;
Pelejero et al., 1999). δ18O curves serve for stratigraphic reference; bold numbers refer to δ18O stages; YD D Younger Dryas; B=A DBølling–Allerød. UK
37-SST record of core 17927 from Kirch (1997). Arrows mark modern annual mean SST values at 0–30 m.
variations of winter SST were much higher in theSCS than those found in the open West Pacific atsimilar latitudes. This difference implies a stronglyincreased local seasonality in the SCS during glacialperiods.
Core 17940 provides the most detailed UK37 SST
and PF-SST records over the last 40,000 years to es-timate the climatic changes off South China (Fig. 9).Summer SST remained almost constant over the en-tire time span of the last glacial cycle. In contrast,the winter temperatures show a number of short-term negative oscillations by about 12ºC duringδ18O Stage 3. They just parallel the ‘warm’ δ18Ominima. The SST minima during Stage 2 matchhigh δ18O values and culminate near the end of theLGM. Later, the winter SST indicate a long-term

264L
.Wang
etal./M
arineG
eology156
(1999)245–284
Fig. 10. (a) Sea-surface salinity (SSS) records covering up to 220,000 years in the South China Sea. Using the transfer equation of L. Wang et al. (1995), SSS values arecalculated from (1) δ18O of Globigerinoides ruber after subtracting the global ice effect (Labeyrie et al., 1987; Vogelsang, 1990), and (2) UK
37-based estimates of annual meanSST for 0–30 m (Fig. 9). δ18O curves serve for stratigraphic reference; bold numbers refer to δ18O stages; YD D Younger Dryas; B=A D Bølling–Allerød. SSS record of core17927 based on Kirch (1997). Vertical arrows mark modern mean SSS (0–30 m).

L. Wang et al. / Marine Geology 156 (1999) 245–284 265
Fig. 10 (continued). (b) Close-up of SSS variations at site 17940, which are generally reversed to the δ18O-temperature oscillations in theGISP2 ice record (Grootes and Stuiver, 1997). Numbers are Dansgaard–Oeschger events.
gradual warming until the middle Holocene, about6000 calendar years (at 360 cm c.d.). This long-termtrend was interrupted several times by short coolingepisodes, an unexpected one in the Bølling, one lessspectacular in the YD, and an especially markedepisode in the early Holocene, about 8200 calendaryears (480 cm c.d.). Prominent depressions of winterSST also occur in the late Holocene (240–180 cmc.d. and 95–55 cm c.d.), about 5.2–3.4 and 2.0–1.0thousand calendar years ago. As predicted, the ma-jor and minor minima in winter SST indeed involvemaxima in seasonality.
The temperature variations off South Vietnam(core 17954; Fig. 9) closely resemble the variabilityfound off Hong Kong. Most salient minima in win-ter temperature (shifts reaching 3–6ºC) and maximain seasonality occurred during Stage 2, several timesduring Stage 3, earliest Stage 4, Stages 5.2 (!), 5.4,and 6.2–6.4, and particularly strong at the onset ofStage 6.6. During warm Stage 5.5 the UK
37 SST esti-mates exceeded the Holocene values by about 1.0ºC.
West of Luzon (core 17927; Fig. 9) the UK37 SST
estimates show a gradual increase by about 4ºCfrom glacial Stage 2 to the middle Holocene, witha short-term but pronounced cooling by 4ºC in theearliest Holocene (at 200–230 cm core depth).
In the southern SCS (core 17961; Fig. 9) the long-term annual UK
37 SST variations did not exceed 3ºC.Note that the SST values of the warm Eemian Stage5.5 were about 1ºC higher than during the Holocene,similar to the UK
37 SST record off Vietnam. Hencethis feature may be of general climatic significancein the SCS.
3.6. Sea-surface salinity records
Past SSS variations in the northern, western,southern, and eastern SCS (Fig. 10) range fromabout 30 to 36‰ over interglacial-to-glacial times.Especially, SSS changes mark some extremely short-lasting, millennial-scale events that form a sensitiverecord of changes in monsoon moisture along themargins of the SCS.
4. Discussion: past variations in East Asianmonsoon
4.1. Records of continental wetness and aridity
Variations in the intensity of wet summer anddry winter monsoon are deduced from the history of

266 L. Wang et al. / Marine Geology 156 (1999) 245–284
Fig. 11. Holocene changes in δ18O-based temperature record of Greenland ice-core GISP2 (Grootes and Stuiver, 1997) versus sea-surfacesalinity (SSS) changes at site 17940 off Hong Kong over the last 10,000 years. Origin of SSS record as in Fig. 10. Data are presented inthe time (upper panel) and frequency domain (lower panel). Major temperature lows (δ18O minima) on Greenland summit were coevalwith SSS maxima, equal to lows and subsequent highs in monsoon precipitation in subtropical South China (e.g. at the end of thePreboreal maximum in summer monsoon, about 8250 yr BP). During the last 400 years, since the onset of the Little Ice Age, a dropin monsoon precipitation parallels growing amplitudes of δ18O fluctuations in the ice record. For spectral analysis (Blackman–Tukeymethod; AnalySerie program of Paillard et al., 1996) the SSS record was detrended by a third-polynomial fit (upper panel) and splineinterpolated on equidistant steps of 30 years with 25% lag. Horizontal bar shows band-width. Numbers in the SSS power spectrum aresignificant periods in years, which exceed the upper limit of red noise at 80% confidence level (dotted line).

L. Wang et al. / Marine Geology 156 (1999) 245–284 267
continental aridity in South China, which in turn iscontrolling the fluvial and=or eolian sediment sup-ply to the continental margin in front of the PearlRiver mouth, southeast of Hong Kong. Here thehemipelagic sediments in cores 17939 and 17940contain a detailed record of past changes in theeolian and fluvial sediment input. In a first approxi-mation, we distinguish the two different sources by asimple empirical relationship between the percentageof siliciclastic fine fraction (<6 µm) and the primarymodal grain size of siliciclastic silt (>6 µm), asshown in the diagrams of Fig. 8. This approachwas successfully defined and employed by Koop-mann (1981; modified by Stein, 1985) for depositsalong the West African continental margin and sofar presents the only semiquantitative, hence crucialmeasure for separating dominantly eolo- from flu-viomarine samples in a hemipelagic sediment record.Our records of past changes in aridity and wetnesson the mainland next to the SCS are supported by in-dependent evidence from pollen (Sun and Li, 1999)and paleosalinity (SSS) data. Silt modal grain sizesform also a measure of past wind strengths (Sarn-thein et al., 1981), in our case, of the winter monsoonthat carries the eolian loess to the SCS.
In the Koopmann diagram of modern surface sed-iments in the SCS (Figs. 1 and 8A; Grothmann,1996) only few samples occupy Field I. They largelystem from elevated sea-floor positions distal to rivermouths, such as the central reef platform, or fromlocations that are secluded from fluvial supply in thenepheloid layer by (small-scale) ridges and trenches.In Field I the grain-size modes of silt increasewith decreasing clay contents, hence are well sortedand typical of eolian-dust transport. However, morehemipelagic sediment samples from the northern andsouthern SCS show an excess in clay fraction <6µm relative to silt-modal grain sizes and occupyField II in Fig. 8A. As defined by Koopmann (1981),this excess is characteristic of fluvial sediment input.Off Hong Kong, the abundant clay deposits on theupper continental margin may largely originate fromthe Pearl River which ranks as the second largestriver of China in water discharge (320 km3=yr; nextto the Yangtze River) and has a modern catchmentarea of about 442,600 km2. It is subject to intensivemonsoon precipitation during summer, resulting inan annual sediment load of 11 billion tons (Zhang
et al., 1994). Finally, grain-size Field III (Fig. 8A)groups sediment samples with a relative deficit inclay, indicative of both volcanic ashes (samples 20,21, 22) and a loss of fine sediments due to winnow-ing near the sea floor (samples 26, 31,36, 55, 56,58).
Both the distribution of these three grain-sizegroups in core 17940 and the prominent rise in %clay in cores 17940 (<630 cm) and 17939 (<270cm; Figs. 6–8) show that the supply of fluvial sed-iments in the northern SCS was largely confined tothe Holocene and a short precursor signal in theBølling (at 755 cm depth). The sediment recordsimply (1) a sudden increase in summer-monsoonrains right after the YD, which developed over lessthan few decades, (2) maximum rains during thePreboreal and earliest Holocene, and (3) a mod-est decrease in precipitation subsequent to the earlyHolocene clay maximum. A very first postglacialincrease in clay content in cores 17939 (<425 cm)and 17940 (<920 cm) already occurred as early as18,000 14C years, which implies that modest fluvialinput and monsoon rains began much earlier than theBølling.
The broad Preboreal–early Holocene maximum inrunoff and precipitation in China goes along with amarked minimum in sea-surface salinity (SSS) inthe western and northern SCS, most pronounced atsite 17940 in front of the Pearl River (Fig. 10). TheSSS minimum clearly derives from a δ18O mini-mum (Figs. 3 and 4) and conjugate low UK
37 SSTvalues during that time (Fig. 9). Off Hong Kongthe salinity reduction reached down to 32.6‰ andthus can hardly stem from an inflow of West Pa-cific water but was necessarily linked to enhancedlocal precipitation during summer. These rains implya strongly intensified summer monsoon that carriedmore marine moisture into subtropical South China.The timing of this event is coeval with an earlyHolocene maximum in monsoon precipitation whichoccurred in the countries encompassing the ArabianSea (Sirocko et al., 1993). This synchroneity sug-gests a hemisphere-wide joint forcing of long-term(and short-term) changes in the hydrological cycleof the Asian monsoon. In the western and southernSCS also cores 17954, -56, and -61 show a distinctδ18O-freshwater signal during the earliest Holocene,possibly linked to an enhanced runoff of the Mekong

268 L. Wang et al. / Marine Geology 156 (1999) 245–284
River (Fig. 1). In other cores (Fig. 3a and Fig. 10)the signal is less significant, partly because of lowersampling resolution, partly because of core locationsthat are too distant from the major river mouths.
In contrast to the last 14,600 calendar years, earlyTermination IA and δ18O Stages 2 and 3 in core17940 are free of (hemipelagic) fluvial deposits butdominated by eolian-dust discharge and sedimentwinnowing (Fig. 6a and Fig. 7; Field-I and -III sam-ples only in Fig. 8B). Downslope winnowing is alsoreflected by an increased lateral supply of shallow-water ostracods (Zhou and Zhao, 1999) and possibly,by the extremely low clay content. In part, the ab-sence of riverine sediments off Hong Kong duringthe LGM may result from the local morphology ofthe continental slope (Fig. 1). Here the glacial lowsea level has led to a significant downcutting of thePearl River mouth. Accordingly, any potential flu-vial sediment discharge may have bypassed our coretransect via canyons across the slope farther to thewest and may be better encountered in the cores nearthe base of the slope.
Nevertheless, the joint lack of fluvial sedimentsand massive eolian-dust supply at core site 17940during the LGM together form a substantial record ofcontinental aridity in South China. This conclusionis corroborated by further evidence.
(1) During Stages 2 and 3 the grain-size modesof silt amounted to 15–20 µm (Fig. 7; core 17940),values that are characteristic of loess deposits inCentral China (Xiao et al., 1995; Porter and An,1995). Near 18,000 14C years (940–890 cm c.d.),coeval with the solar insolation minimum and peakLGM about 21,000 calendar years, the grain-sizemodes reach 25–30 µm and depict a clear maximumin the strength of winter monsoon.
(2) The dominance of pollen from semiarid andAlpine regions at site 17940 (Sun and Li, 1999)demonstrates that the LGM pollen were dust-borne,originating from regions in (South) China that weredry and cold.
(3) During the LGM the SSS values at site 17940were indeed 1.0–1.5‰ lower than today, pretendingmore wetness. However, they were >1‰ higher thanduring Termination I, 14.6–9.5 thousand calendaryears ago (Fig. 10b). Since the glacial Pearl Rivermouth moved very close to site 17940 across theemerged broad shelf with the low sea level (Fig. 1),
this sums up to a major drop in fluvial runoff fromSouth China.
In summary, the great contrasts between glacialand interglacial sediment records imply a fundamen-tal change in the climate of China, a switch fromthe glacial dominance of winter monsoon to a dom-inance of summer monsoon. Its close ties to theBølling and Holocene climate may also involve thattyphoon storms in South China are a feature charac-teristic of interglacials and rare during glacials.
During Stage 3 short-term and coherent oscilla-tions of SSS and the clay fraction in core 17940(below 1050 cm c.d.) record a monsoon climate overSouth China, that was highly variable on short timescales, per analogy to the loess record of Porterand An (1995). At 1260–1300 cm c.d. the strongconcentration of eolian dust, coarsened modal grainsizes, and a salient clay minimum match a markedSSS maximum (Fig. 6a and Fig. 10b), hence docu-ment a peak in aridity. It was dated to about 35,00014C years and tentatively assigned to (cold) Heinrichevent 4 (Bond and Lotti, 1995) (Fig. 4). Directly sub-sequent (at 1260–1230 cm c.d.), a lack of eolian-dustsamples, increased clay, and markedly reduced SSSvalues record a phase of humid climate linked to the(warm) Dansgaard–Oeschger event 8. Similar butless conspicuous oscillations of climate occur in core17940 near 1110 cm c.d. (Figs. 4 and 6a) and may belinked to Heinrich event 3 and Dansgaard–Oeschgerevent 4 (about 25,000 14C years). Per analogy withthe Bølling–YD–Preboreal oscillation we concludethat also the short events of continental aridity inChina were tied to events of global cooling andvice versa, phases of continental humidity to globalwarmings on millennial and shorter time scales, i.e.to the Dansgaard–Oeschger events.
In the tropical southern SCS (cores V35-5, 17961,and 17964) the interglacial-to-glacial changes in ter-rigenic sediment supply and paleoceanography wereequally affected by changes in sea level and climate.The glacial lowering of the sea level down to about�120 m led to (1) an emerged Sunda shelf, (2) a shiftof its shoreline to the vicinity of site 17964 (Fig. 1),and (3) the creation of two major, Amazone-styletropical river deltas at the shelf margin, linked to theMekong and Molengraaff rivers (Evans et al., 1995;Stattegger et al., 1997). These great shifts in shore-line and fluvial discharge may readily explain (1)

L. Wang et al. / Marine Geology 156 (1999) 245–284 269
an abrupt, but long-lasting increase in sedimentationrates and % siliciclastic clay at the Stage 5–Stage 4boundary, and (2) the abrupt decrease in % clay andsedimentation rates (by a factor of 2) at both glacialTermination II and the end of the YD (Fig. 6b; cores17961 and 17964).
The siliciclastic sediment fraction hardly containsany short-term signals of climatic change duringStages 2–4. Short-term variations in clay content(<6 µm) did not exceed 1% at site 17961 (at alevel of 97%) and 2% at site 17964 (at a level of74%; Fig. 6b) which occurred close to the shorelineat low sea level. In a Koopmann diagram (Fig. 8C)the Stages 1–2 grain-size data of core 19764 occupyField I only, with a relative excess in clay (except foran eolian origin of the core-top sample). It implies apersisting riverine origin of the terrigenous sedimentfraction near the Equator (5ºN) during glacial andinterglacial times.
This uniformity entails that fluvial runoff and pos-sibly, tropical conditions continued on the emergedSunda subcontinent during glacial times, an impor-tant contribution to the current debate, where to find— on a global scale — the major glacial refuges oftropical forest (Prentice and Sarnthein, 1993). Themodel of a tropical rainforest on the glacial Sundashelf is strongly supported by the pollen assemblagefrom the glacial section of core 17964 (X. Sun, pers.commun., 1997).
However, the simple model of purely sea-level-induced changes in freshwater discharge canhardly explain many long-term changes in pale-osalinity found in core 17961 from the southernSCS (Figs. 1 and 10a). At this more distal site, SSSvalues have decreased by up to 2‰ only during andsubsequent to the LGM. This SSS low documentsa freshwater lid that culminated during TerminationI and the earliest Holocene, just in contrast to thecoeval sea-level rise and flooding of the Sunda shelf.Likewise, the great sea-level fall during early glacialStage 4 did not induce the expected salinity reductionwhich occurred only later in Stages 4 and 3.3. On theother hand, the SSS values indeed increased duringTermination II and reached the expected maximumalong with the high sea-level stand of Stage 5.5, suchas in the late Holocene. In conclusion, the long-termglacial-to-interglacial variations in tropical moistureare not yet fully understood.
The same problem applies to some prominent butvery short-lasting changes in the tropical freshwaterbalance, which result from the paleosalinity recordof core 17961. Here the δ18O record defines twomajor salinity reductions by almost 4‰ near 25 and34–40 thousand 14C years (Fig. 3a and Fig. 10). Un-fortunately, the dating precision is still insufficientbecause of the unknown local 14C-reservoir effect inthe glacial SCS. Hence the major question remainsunsolved, whether these events were linked to (cold)Heinrich events 3 and 4 or, more likely, rather tothe subsequent warm Dansgaard–Oeschger events 4and 8. The answer will be crucial for assessing thetropical moisture budget in the Asian monsoon re-gion, also for extending or limiting the early findingsof Duplessy et al. (1981), which suggested a con-centration of the LGM monsoon precipitation to theequatorial Indian Ocean.
4.2. Six premises on glacial-to-interglacial changesand short-term variability of the South China Sea
Published data (e.g. CLIMAP project members,1981; Wang and Wang, 1990; P. Wang et al., 1995;Metzger and Hurlbert, 1996) suggest a number offeatures in SCS paleoceanography during cool andglacial stages, that may be tested by means of ourproxy data.
(1) At any sea-level drop exceeding 40 m, as fromthe base of Stage 4 until the end of the YD (Chappellet al., 1996), the Borneo sea strait was closed andthe presently important inflow of warm surface waterfrom the equatorial West Pacific cut off; hence theSCS basin turned into a semiclosed ‘sack system’(Fig. 1).
(2) By its potentially estuarine circulation the iso-lated inner SCS may have been highly sensitive tooxygen depletion, enhanced by any minor increasein freshwater input. The sensitivity was increased bythe specific back-arc setting of the emerged broadSunda shelf, which directed an immense continen-tal runoff to the east, into the SCS, including theMekong River from the eastern Himalayas.
(3) During glacial winter a stronger northerlymonsoon may result in intensified anti-clockwisesurface circulation along with an enhanced inflow ofcooler water through the Luzon strait and a strongSST drop off South China. Here no upwelling is

270 L. Wang et al. / Marine Geology 156 (1999) 245–284
conceivable, definitely however, near the northern tipof Luzon (Ekman pumping).
(4) Wind-driven variations in the inflow ofsurface=subsurface water from the W. Pacific mayalso control intra-Holocene shifts in the oceanogra-phy of the SCS.
(5) The decreased glacial summer monsoon pos-sibly was still sufficient for driving a weak clockwisecirculation, which implies warm tropical summerSST off South China such as today, a strong season-ality, and a persisting but reduced upwelling intensitysoutheast of Vietnam (Fig. 1).
(6) Off South China the nutrients in glacial sur-face water were probably enriched by both eolian-dust discharge and an enhanced inflow of upwellednutrient-rich water through the Luzon strait duringwinter. In the central SCS we may expect a de-crease in nutrients during glacial summer because ofreduced monsoon and upwelling intensity. In con-trast, plenty of nutrients may derive from the tropicalMekong and Molengraaff rivers near the southwest-ern margin of the SCS.
4.3. Changes in monsoon-driven deep- andsurface-water oceanography
Premises 1 and 2. As soon as the sea level droppedby more than 40 m, the SCS turned into a largelyseparate estuarine basin that indeed was highly sus-ceptible to oxygen depletion below the mixed surfacelayer. An estuarine circulation also characterizes themodern and early Holocene SCS, as shown by lowepibenthic δ13C values near 0‰ in the southern SCSat 1550 m water depth (core 17964; Fig. 3c). Thesevalues are similar to the δ13C signature of lowerintermediate water (Sarnthein et al., 1988) that de-bouches from the West Pacific into the SCS. DuringStage 2 the epibenthic δ13C values dropped to �0.5to �1.6‰ directly in front of the emerged Sundashelf (core 17964; Fig. 3c). This δ13C range waslower than almost everywhere else in the glacialocean (Sarnthein et al., 1988, 1994b), including thewell-known glacial δ13C minima in the deep south-ern Indian Ocean (down to �1.0‰; Rosenthal et al.,1997) and along the northern margin of the SCSat 1700–3800 m depth (0 to �0.8‰ in core 17940in Fig. 3c; more data in Winn et al., 1992). Fromthese benthic δ13C values we infer an extreme oxy-
gen-minimum layer that developed near the southernmargin of the SCS during glacial and cold Stages2–4 and 6 and conclude on a stable estuarine strat-ification of the surface water in conjunction withhigh fluxes of organic carbon (Kienast, 1996). Thismodel is in line with the coeval extensive tropicalrunoff deduced from both the ongoing depositionof hemipelagic fluvial sediments at sites 17961 and17964 and, especially, from the extreme low-salinityspikes at site 17961 during late Stage 2 and Stage 3,discussed above (Fig. 6b and Fig. 10).
Premises 3 and 5. Glacial-to-interglacial changesin sea-surface temperatures of the SCS (Fig. 9)basically confirm the changes predicted from thestrengthened seasonality of glacial monsoon windsand vice versa, from the interglacial drop in windseasonality. The SST estimates based on PF countsindeed were almost constant during glacial and inter-glacial summer near the northern and western marginof the SCS, likewise in the southeastern sector (Miaoand Thunell, 1994). In contrast, winter SST droppedall over the SCS by 4–7ºC during glacial times.
By contrast to PF-based SST values, theUK
37-based estimates of annual mean SST (at 0–30 m) only depict the general interglacial-to-glacialdecrease in SST, from 27.5ºC to ¾24ºC in the north,from 27.5º–28.5ºC to ¾24ºC in the west, from 28º–29ºC to ¾26ºC in the south, and from 27.5–29ºC to¾24ºC in the east (Figs. 1 and 9). Altogether, theglacial-to-Holocene anomalies of annual mean SSTdecrease from ¾4–5ºC in the north, east, and west to<3ºC in the south.
A closer inspection of the differences betweenthe records of annual mean SST deduced from PFcounts and from UK
37 provide some important in-sights into the variable relative importance of pastSST seasons for the formation of the UK
37 signal incoccolithophores. In the northern SCS (core 17940;Fig. 9), UK
37-based SST simply match the annualmeans calculated from PF-based SST values forsummer and winter during the Holocene and LatePleistocene (but exceed the actual modern SST valueby almost 1ºC). In core 17954 (Fig. 9) just the lateHolocene UK
37-based SST values match the PF-basedestimates of annual SST. However, the UK
37-basedSST come near to the PF-based winter SST duringthe last glacial and near to PF-based estimates forsummer SST during the Eemian warm Stage 5.5.

L. Wang et al. / Marine Geology 156 (1999) 245–284 271
The differential affinity of UK37-based annual mean
SST to summer, winter, or mean PF-SST may havedifferent reasons. On the one hand, the variationsmay reflect strongly different accentuated bloomseasons of coccolithophores, linked to strongly dif-ferential nutrient fluxes (see premise 6). On the otherhand, the differential affinity of the UK
37 signal mayresult from large-scale changes in the wind-drivenlateral inflow of warm or cold water masses fromoutside the SCS.
Based on a recent calibration approach using 370sediment and trap sites in the global ocean from60ºS to 60ºN (Muller et al., 1997, 1998), the UK
37paleotemperature index revealed a generally excel-lent correlation with annual mean SST from 0 to 10m water depth, but no discernible influence of theseasonality of primary production. Likewise, sedi-ment-trap data from the SCS depict roughly equalfluxes of coccolithophores during both winter andsummer monsoon, but no significant seasonal dif-ference (Wiesner et al., 1996). Accordingly, we canhardly assign the past shifts in the seasonal affin-ity of our UK
37-SST data to potential changes in theseasonal nutrient level of surface water. This resultespecially affects the SST record of core 17954 fromthe outmost northern margin of the upwelling zonesoutheast of Vietnam (Figs. 1 and 9), where anyinterglacial strengthening of the summer monsoonand upwelling might indeed lead to a higher nutrientlevel than during winter and thus bias the UK
37-basedSST signal toward the summer season. However,the wind-induced upwelling will primarily result ina cooling of surface water, similar to that in thenorthern Arabian Sea, an effect just opposed to theovershoot in interglacial warming of UK
37-based SSTvalues (Fig. 9).
A comparison with the benthic δ18O record ofglobal sea-level change (Labeyrie et al., 1987; sim-ilar to the δ18O record of core 17961, Fig. 3c)may help to constrain the actual changes in pale-oceanography that finally controlled the enigmaticovershoots in warm and cold UK
37-based annual meanSST at site 17954 (and 17961). Note that the warm‘overshoot’ is strictly confined to the sea-level highstand of Stage 5.5 (C6 m), but does not match anyparticular maxima in PF-based mean SST (Fig. 9).During this time the summer inflow of warm sur-face water from the tropical West Pacific reached a
maximum via the sea strait of Borneo such as today(Wyrtki, 1961). At site 17954 it probably suppressedany cooler SST signals entering from the West Pa-cific via the strait of Luzon during winter, possiblyalso at site 17961. Vice versa, the UK
37-based SSTaverages closely match the PF-based SST averagesduring Stages 5.4–5.1, when the sea level droppedand the diameter of the Borneo strait was reduced.Finally, the UK
37-based SST averages shifted close tothe PF-based winter values as soon as the strait wasshut over Stages 4–2. During this time much coolersurface water prevailed in the whole SCS, in partprobably advected from the upwelling cell near thenorthern tip of Luzon (Metzger and Hurlbert, 1996;Pflaumann and Jian, 1999; P. Wang et al., 1995), amechanism also suggested by the increased nutrientcontent (see below).
In summary, the long-term interglacial-to-glacialvariations in UK
37-based annual mean SST in theSCS were also controlled by the major changesin sea level. They led to the closure and openingof the Borneo strait, thereby turning off and onthe lateral inflow of warm surface water from thetropical Pacific (!). This advection competed with theincursion of cool surface water across the strait ofLuzon along with the strengthened winter monsoon.
In contrast, the short-term, millennial-scale vari-ations of PF-based and UK
37-based SST show con-troversial trends, only little understood: winter SSTin core 17940 (Figs. 4 and 9) just decreased dur-ing warm Dansgaard–Oeschger events 6–8 and thewarm Bølling. Moreover, the warm Preboreal did notlead to the expected strong SST increase. In con-trast, the SST values increased during cold Heinrichevent 4, but also along with the warm Dansgaard–Oeschger events 3–4 and the Allerød. Three majorcoolings during the early and late Holocene (see be-low) occur in the PF-based SST records only. In part,these contradictions may be linked to the limits ofthe PF-12E transfer function employed (Pflaumannand Jian, 1999).
4.4. Variations in the fertility of the South China Sea(premise 6)
In modern sediments of the SCS the nutrient con-tent of surface water is reflected in the planktonicδ13C record of G. ruber s.s. (white), while the nu-

272 L. Wang et al. / Marine Geology 156 (1999) 245–284
Fig. 12. Modern δ13C-distribution patterns of G. ruber s.s. (white) (A) and P. obliquiloculata (B) (modified from Grothmann, 1996). Lowδ13C values reflect high nutrient contents in surface (G. ruber) and subsurface water (P. obliquiloculata).
trient level of subsurface water is mirrored in theδ13C record of the subsurface dweller Pulleniatinaobliquiloculata (Fig. 12A,B; Broecker and Peng,1982; Sarnthein and Winn, 1990; Grothmann, 1996;Pflaumann and Jian, 1999). A tongue of low δ13Cvalues of G. ruber (<0.9‰) and P. obliquiloculata(<0.4‰) traces the inflow of nutrient-enriched sur-face and subsurface water from the Luzon strait intothe SCS. Today the flow advances along the conti-nental margin of South China up to a position southof Hong Kong (Fig. 12A) and is linked to the win-ter monsoon (Metzger and Hurlbert, 1996). The richnutrients of the flow originate from an upwelling cellnear the north tip of Luzon, whereas the Kuroshiocurrent is nutrient depleted.
A second δ13C low of G. ruber (<1.2–<0.9‰)occurs south of Vietnam and depicts the nutrient-enriched surface water in the upwelling belt, inducedby the summer monsoon (Fig. 1; Wiesner et al.,1996). The δ13C minimum in the far southwest maybe also linked to the prominent nutrient discharge ofthe Mekong and other tropical rivers. On the other
hand, high δ13C values of >1.3 to >1.5‰ classifythe surface water (but not the subsurface water) inthe remaining parts of the SCS as largely nutri-ent depleted. Our coarse grid of modern δ13C datacannot detect any narrow-sized nearshore nutrientsources linked to rivers (during summer) and eoliandust (during winter) entering from the north andnorthwest.
However, as soon as the sea level dropped andthe shoreline of China moved closer to shelf break,the variable local input of fluvial and eolian nutri-ents probably played a more important role in thenutrient budget of surface water at the proximalsite 17940 (Fig. 3b and Fig. 12C). For example, lowplanktonic δ13C values depict extremely enriched nu-trients during Termination I and the early Holocene.This fertility has triggered also a short-lasting ex-treme, organic-fluff-induced benthic δ13C minimumof �1.4‰ (Fig. 3c). Based on the siliciclastic grain-size data (Fig. 6) we can ascribe this Preboreal eventto outstanding runoff from the Pearl River.
Different from our expectation, the planktonic

L. Wang et al. / Marine Geology 156 (1999) 245–284 273
Fig. 12 (continued). (C) δ13C-distribution pattern of G. ruber(white, s.s.) during the LGM (15–20 thousand 14C years).
δ13C level at sites 17939=40 was low also duringglacial Stage 2. In part, this high nutrient level maystem from the massive input of glacial loess. Onthe other hand, the rich nutrients may reflect theintensified glacial inflow of nutrient-rich surface andsub-surface water from the Luzon strait during win-ter (Fig. 12C). However, this glacial nutrient inflowappears stronger diverted to the south along Lu-zon (Thunell et al., 1992), away from the transectoff Hong Kong. This finding is in line with theglacial SSS distribution (Fig. 10a), showing gener-ally higher, i.e. ‘Pacific’, values near Luzon (core17927: 34–35‰) than off Hongkong (core 17940:33.5–34.2‰). Thus the glacial nutrients at sites17939 and 17940 may rather originate from ter-rigenous input than from the inflow.
During the middle to late Holocene and Stage3, low nutrients (¾1.3–1.6‰ and 1.25‰ δ13C) pre-vailed in cores 17939 and 17940. Here some short-term excursions to higher nutrients may be linkedto (warm) Dansgaard–Oeschger events 3=4 and 8(Fig. 3b and Fig. 4).
Southeast of Vietnam the δ13C values of coretransect 17954–17956 (Fig. 3b) record past changesin the nutrient content of surface water across the(summer) monsoon-driven upwelling belt (Fig. 1;Wiesner et al., 1996). Over the last 230,000 yearsthe δ13C values in the southernmost core 17956 weregenerally somewhat lower than further north (thoughless well resolved). Thus, the fertility was continu-ously lower in the north than in the south, whereupwelling is strongest, such as today (Fig. 12A).Based on high δ13C values in all three cores (1.0–1.7‰) the nutrients were low during glacial and coldStages 2, 3, 5.2, 5.4, 6, etc., which indicates weakupwelling intensity. In contrast, extremely low δ13Cvalues of 0.4–0.6‰ document an outstanding abun-dance of nutrients and strong upwelling and summermonsoon during Termination I and early Stage 1,more salient during Termination II and early Stage5.5, and less prominent across the Stage 4–Stage 3boundary (Fig. 3b and Fig. 13a).
In addition to monsoon-driven upwelling, the nu-trients in the southwest SCS may also reflect maximain the fluvial nutrient input, linked to increased mon-soon rains and=or snow melt in the Himalayas (viathe Mekong River) along with glacial terminations.In these periods the sea level was still low and theMekong and Molengraaff rivers discharged near tothe break of the Sunda shelf (Fig. 1). This conceptis indeed supported by short-lasting and significantdrops in SSS (11.5‰) found at site 17954 duringTerminations I and II, during Stage 5.3 and, less clear,at Stage 5.1 (Fig. 10a). The high nutrient discharge ofrivers from the glacial ‘Sunda Land’ is documentedmore directly by extremely low glacial and earlydeglacial planktonic and (organic-fluff-induced) ben-thic δ13C values at sites 17961 and 17964 (Fig. 3b,c),then lying proximal to the Sunda coastline.
Our results on monsoon-driven maxima in fluvialnutrient supply and summer upwelling during glacialTerminations I and II match the common expecta-tions on the variability of the monsoon, expectationswhich are based on (1) the orbital periodicities inthe intensity of the Indian monsoon, deduced fromsediment records from the Arabian Sea (Clemenset al., 1991; Sirocko et al., 1996), and (2) on at-mospheric climate modeling (Prell and Kutzbach,1987; Kutzbach and Gallimore, 1988; Kutzbach etal., 1996).

274 L. Wang et al. / Marine Geology 156 (1999) 245–284

L. Wang et al. / Marine Geology 156 (1999) 245–284 275
4.5. Intra-Holocene variations and periodicities ofthe monsoon regime (premise 4)
Prominent minima in winter and less, in summerPF-SST form striking signals of Holocene climaticchange in the northern SCS about 8.2, 5.2–3.4, and2–1 thousand calendar years ago, i.e. roughly ev-ery 3000 years (core 17940; Figs. 4 and 9). Theminimum near 4500 calendar years ago is widelyobserved in Holocene sediments of West Pacificmarginal seas (Oda and Takemoto, 1992; Jian et al.,1996; Wei et al., 1998), but not in the Kuroshiointensity (Sawada and Handa, 1998). The three coolevents also match a reduction or disappearance ofP. obliquiloculata, a deep-dwelling tropical warm-water species (Pflaumann and Jian, 1999). Based onboth the spatial distribution pattern (Pflaumann andJian, 1999) and δ13C composition of this speciesin modern sediments (Fig. 12B; Grothmann, 1996)P. obliquiloculata can trace the outlined nutrient-rich inflow of upwelled water from the Luzon straitinto the SCS during winter. Accordingly, the intra-Holocene phases with an apparent PF-based tem-perature drop at site 17940, which are paralleledby a disappearance of P. obliquiloculata, may justreflect a short-lasting southward deflection of the in-flow from the east, probably linked to an increase inwinter monsoon.
More far-reaching informations on the extent andfrequency of short-term changes in the Holoceneclimate of South China were obtained from the ul-trahigh-resolution paleosalinity record of core 17940adjacent to the freshwater plume of the Pearl River(Figs. 1 and 11; 20–40 yr sample spacings). Herethe match of the early Holocene coastline at 20 mwater depth with the modern coastline of China (Hy-
Fig. 13. Summary schemes of variations in the East Asian monsoon over the last glacial cycle versus changes in solar insolation at 60ºNand 30ºN (Berger and Loutre, 1991). These latitudes represent the two end-member regions of the Asian winter and summer monsoon onland and on sea, characterized by totally different surface conditions. Arrows on top and bottom of the panel with the monsoon schemepoint at increasing monsoon intensity. (a) Monsoon cycles over the last 220,000 years as inferred from a smoothed nutrient=upwellingrecord of planktonic δ13C minima (G. ruber) and the SST-seasonality record of planktonic foraminifera counts in core 17954 (data inFig. 3b and Fig. 8). Peak glacial seasonality and winter monsoon largely correspond to minimum insolation during summer and a reducedinsolation anomaly between land and sea. Vice versa, interglacial culminations in summer monsoon, such as about 10,000–11,000 yrBP, parallel maximum insolation and maximum insolation anomalies between land and sea during summer (shaded bands). (b) Blow-upof monsoon variations over the last 40,000 years, based on variations in the differential input of siliciclastic sediments and SSS at site17940 (Figs. 7 and 10a). Termination Ia and Ib (T Ia and T Ib), the Younger Dryas (YD), Bølling–Allerød (B=A), and Heinrich events 1,3, and 4 (H1, H3, H4) are labeled.
drographer of the Navy, 1985) precludes any lateralshift of the coastline along with 20 m of sea-levelrise over the last 10,000 years (Fairbanks, 1989), dif-ferent from the great glacial-to-interglacial changes.Thus, any Holocene SSS oscillations at site 17940do not reflect a differential proximity to the PearlRiver mouth but directly document the changes inmonsoon rain in South China and the resulting fresh-water discharge. This monsoon record is comparedwith the δ18O record of the ice-core GISP2 in Fig. 11(Grootes and Stuiver, 1997).
Only after the marked early Holocene maximumin freshwater supply our SSS estimates reach grad-ually the general Holocene level of about 34.5‰.About 8300–8100 calendar years ago the SSS val-ues arrive at a short-lasting double peak of 35.5‰and a subsequent, very short drop to 34.4‰, indi-cating a centennial oscillation from extreme aridityto extreme humidity. The SSS maxima are coevalwith a major Holocene climatic cooling in Green-land (Fig. 11) and Antarctica (Ciais et al., 1992).Further upcore, the SSS record shows uniform varia-tions of š0.7‰ around the Holocene mean. Over thelast 600 years the SSS values increased from a short-term average near 34.5‰ to the present average of35.2‰. This increase may result from a recent reduc-tion in monsoon rain since the early Little Ice Age,in parallel with a temperature rise in South China(and the Northern Hemisphere in general; Bradleyand Jones, 1993). Based on the cyclic structure ofthe SSS record a fast return to a stronger freshwaterinput may be impending soon.
The fluctuations in SST and SSS over the last10,000 years reflect submillennial periods of 775years and 102=84 years in the East Asian monsoonregime, periodicities that each exceed the upper limit

276 L. Wang et al. / Marine Geology 156 (1999) 245–284
of red noise at 80% confidence level (Fig. 11) andlie far below the established range of Milankovitchorbital forcing. Similar periodicities also occur dur-ing Stages 2 and 3, but were not defined preciselybecause of insufficient time control in this section ofcore 17940. The 775-year period amounts to approx-imately one quarter of the 3000-year cycle identifiedin the local SST record and to half of the salient1500-year cyclicity, found in monsoon-controlledsediment records from the Arabian Sea (Sirocko etal., 1996), in North Atlantic sediments (Bond et al.,1997), and in particular, in the δ18O record of theGISP2 ice core from Greenland during Stages 2 and3 (Grootes and Stuiver, 1997). Hence the 775-yearperiodicity may be a harmonics of the 1500-year cy-cle. The 102=84-year periodicities may possibly re-flect the Gleissberg cycle of solar activity, frequentlydescribed in ultrahigh-resolution records such astree-ring 114C and the GISP2 ice core (Stuiver andBraziunas, 1993; Grootes and Stuiver, 1997).
However, compilations by Stocker and Mysack(1992) and Stocker (1996) show that a consistenttheory on climatic cycles on decadal to centennialtime scales still does not exist. Accordingly, thecentennial periodicities in the Holocene variation ofEast Asian monsoon can be ascribed only tentativelyto internal forcing mechanisms such as (1) harmonicsof secondary Milankovitch cycles, driven via theglobal thermohaline circulation in the ocean, and (2)short-term changes in solar activity (L. Wang et al.,unpubl. data).
4.6. Linkages of monsoon to global climatic change:leads and lags
The glacial-to-interglacial and millennial-scalechanges in East Asian monsoon climate involvedmajor changes in seasonal wind intensity, leading tothe highly variable dust and moisture fluxes just dis-cussed. These changes were basically controlled byvariations in the thermal and pressure contrasts be-tween (1) the (still-cool) tropical–subtropical Indo-Pacific, and (2) Tibet and other Central Asian landelevations serving as a strong heat source duringsummer because of their lapse-rate effects. Basedon the GCM sensitivity tests and climate reconstruc-tions of Prell and Kutzbach (1987), An et al. (1991),Kutzbach et al. (1996), and Morley and Heusser
(1997), the changing latitudinal anomalies of solarinsolation due to orbital forcing (Fig. 13) played acrucial role in driving the past changes of monsoon.Especially, they were tied to the totally differentsurface conditions that mark the two end-memberregions of Asian monsoon on sea at 30º and onland at 60ºN and lead to a differential absorption orreflection of the insolation budget.
Interactions among the three main spatial compo-nents of the Earth’s climate system form anothersource of forcings: the Pleistocene to Holocenechanges in low-latitude (East) Asian monsoon mayhave been primarily linked to southern or to north-ern high-latitude climate components, like circum-Antarctic sea ice and temperatures or the build-upand melting of ice-sheets on the Northern Hemi-sphere continents. It is difficult to precisely disentan-gle the cause and effect relationships among thesecomponents and to detect the ‘ultimate’ source offorcing, because the three appear to be highly inter-active (Ruddiman et al., 1989).
In our approach, we tried to constrain these prob-lems by defining the precise timing, leads, and lagsof past variations in summer and winter monsoonversus changes in the most prominent marine andice-core records of global climate and sea-levelchange, especially focusing on a few major turningpoints of monsoon evolution during the last 230,000and 40,000 calendar years. We used the GISP2 andVOSTOK δ18O-temperature records from the Green-land and Antarctic ice sheets (Sowers and Bender,1995; Grootes and Stuiver, 1997) as a measure forcomponents of polar and global climate change.They were tied to the monsoon records via the ben-thic and planktonic δ18O records from the SCS bytuning and AMS-14C-based age control (Fig. 4).
Test case one is the mid-Holocene decrease inSST and the inflow of West Pacific (?) subsurfacewater south of Hong Kong, starting about 5200–4400 calendar yr ago (core 17940; Figs. 4, 9 and13b). This event paralleled precisely a short-lastingand marked weakening of North Atlantic Deep Wa-ter (NADW) ventilation off northwest Africa 4800–4600 yr ago (Maslin et al., 1996; Knaack, 1997) andhence suggests a joint atmospheric and=or thermoha-line forcing of the ocean circulation.
Test case two concerns the major early Holocenefluctuations in SSS and monsoon at site 17940 off
L. Wang et al. / Marine Geology 156 (1999) 245–284 277
Hong Kong, lasting about 300 years near 8250 cal-endar yr BP. They coincided with the most promi-nent Holocene cooling in the GISP2 ice-core record(Fig. 11; Grootes and Stuiver, 1997), again witha short-lasting break-down in NADW ventilation(Maslin et al., 1996; Knaack, 1997), and with thestart of the mid-Holocene dust discharge from Arabiainto the Arabian Sea (Sirocko et al., 1993). However,any closer understanding of the actual linkages be-tween these climate signals requires a more precisedefinition of the decadal- to centennial-scale leadsand lags, which is limited by the precision of 14Cdates and their conversion into calendar years. Wecannot fully fix yet, whether (1) the SSS maximum8300 yr ago has indeed matched the salient temper-ature minimum on Greenland, and (2) whether thesubsequent extreme and short SSS minimum, i.e. themaximum in monsoon rain 8150 yr ago has reallysucceeded the cool episode, which would imply acoincidence of cold and arid and warm and humidphases.
Test case three is the <10-yr transition fromthe cold Younger Dryas to the warm Preboreal about11,600 calendar years ago, documented in the Green-land ice cores (Dansgaard et al., 1989; Grootes et al.,1993; Fig. 4). Off Hong Kong this climatic turningpoint went along with a massive rise in monsoon pre-cipitation over less than 50–100 yr, as reflected bythe decrease in salinity and onset of fluvial mud de-position in the ultrahigh-resolution sediment recordsof cores 17940 and -39 (Figs. 6 and 10). Moreover,a sudden coeval rise in winter and annual-mean SSToccurred in all parts of the SCS (Fig. 9), also in thesoutheast (Thunell and Miao, 1996). The subsequentPreboreal to early Holocene culmination in the EastAsian monsoon precisely paralleled a comparablemaximum of the Indian summer monsoon found inArabian Sea sediments (Sirocko et al., 1993), whensolar insolation and summer temperatures on Green-land (Koerner and Fisher, 1990) reached a maximum.
Test case four suffers from still-controversial dat-ing precision. The grain-size- and SSS-based short-term monsoon oscillations, which were identified atsite 17940 during Stage 3, are considered as coevalwith Heinrich events 4 and 3 (Figs. 4, 6, 9 and 10).However, the 14C age of 35,500 years BP, which wasmeasured on the δ18O maximum assigned to Hein-rich event 4, implies an abnormally high oceanic
14C-reservoir age of SCS-surface water, reaching 1.5ka in comparison to a 14C age of 34 ka measured inthe Norwegian Sea (Adkins and Boyle, 1997; Volkeret al., 1998). If this assumption is correct, the mon-soon oscillations near Heinrich events 4 and 3 mayindeed contribute to a better general understanding ofshort-term climatic change. Together with test cases2 and 3 for the Holocene and YD and a new record ofStage-3 variations of the Indian monsoon (Schulz etal., 1998), they suggest that any short-term changesin the Asian monsoon system were intimately tied tohigh-latitude climate forcing such as major icebergsurges in the North Atlantic (Broecker et al., 1990;Bond and Lotti, 1995). We guess that this may haveoccurred on decadal to 100-year time spans mainlyvia atmospheric climatic forcing. No leads and lagswere identified so far.
In contrast, significant leads and lags mark ourfinal test case, the onset of glacial Termination IA,where the ultrahigh-resolution sediment records ofmonsoon humidity and the planktonic and benthicδ18O signals of global climatic change indicate con-siderable age deviations (cores 17940 and -39 inFigs. 3, 4 and 6; close-up in Fig. 7). At site 17940the clay fraction, a rough tracer of fluvial runoff,started to rise from <50% up to an almost Holocenelevel of 60–70% as early as 17.0–14.7 thousand 14Cyears ago, i.e. right after the Milankovitch solar inso-lation minimum almost 18,000 14C years ago equalto 21,000 calendar years. The rise in clay supplypreceded the strongly fluctuating onset of postglacialδ18O signals of sea-level rise by 3000–4000 years,which slowly started at 14,000 and more pronouncedafter 13,200 14C years BP, near the base of theBølling. At this time the rise in fluvial clay input hadfinally reached the more distal site 17939. By con-trast, the dust modal grain sizes show a first, abruptpostglacial drop from 25 to 10 µm near 15,000 14Cyears BP and a subsequent, more gradual decreaseuntil 13,400 14C years BP (885–810 cm c.d. in core17940; Figs. 6 and 7).
The outlined phase relationships among differentpaleoclimatic signals near the start of glacial Ter-mination IA lead us to the following conclusions(Fig. 13b). (1) The initial rapid increase in clay sup-ply occurred independent of the postglacial sea-levelrise but was solely controlled by enhanced fluvialsediment supply from South China. (2) This early

278 L. Wang et al. / Marine Geology 156 (1999) 245–284
signal of intensified monsoon rains during summerparalleled the start of Antarctic ice melt (Sowers andBender, 1995) and thus was linked to climate compo-nents of southern high latitudes. (3) Vice versa, thedelayed decrease in loess-grain sizes and strengthof winter-monsoon winds went along with a ma-jor melt of northern high-latitude glaciation directlyprior to the Bølling=Dansgaard–Oeschger event 1(GISP2 record in Fig. 4). In harmony with theseconclusions, the maximum in winter-monsoon windsslightly lagged the minimum in northern insolation,whereas the peak in monsoon precipitation duringsummer was in phase with maximum northern inso-lation (Fig. 13b). This relation likewise applies to theEast Asian and Indian monsoon systems.
In most cores from the SCS the record on mon-soon variations is tied to global climatic change viawell defined events of planktonic δ18O stratigraphy(Fig. 4). However, our 14C datings in core 17940 alsosuggest millennial-scale phase lags of δ18O eventsin the SCS vs. δ18O events measured elsewhere.Termination IA only started near 14,000 14C yearsBP in both the planktonic and benthic δ18O records(840–845 cm c.d.; Fig. 3c and Fig. 4; Table 3). Thisage lags 600–1000 years behind the ages found indozens of benthic and planktonic δ18O records fromthe Atlantic (Winn et al., 1991; Sarnthein et al.,1995). The lag represents the time span needed foran ocean-wide spreading of the early deglacial δ18Osignal and confirms previous estimates (800–1000years; Duplessy et al., 1991). However, the actual lagmay be larger in view of the high 14C-reservoir ageswhich exceed 1500 years in the SCS during Heinrichevent 4 and are difficult to assess at Heinrich event 1(Fig. 5).
5. Conclusions
Past changes in the East Asian monsoon werededuced from ten well dated sediment records withmillennial to bidecadal time resolution from coretransects across the northern, western, and southernmargins of the subtropical and tropical South ChinaSea (SCS). Based on a broad multiproxy-data setwe drew the following conclusions on climate andocean variability over the last 220,000 years and inparticular, the last 40,000 years.
(1) Two extremes of monsoon circulation alter-nated with the glacial-to-interglacial cycles drivenby minima and maxima of Northern Hemispheresolar insolation (Fig. 13): a strongly intensified win-ter monsoon and weakened summer monsoon weretypical of glacial periods. They involved a stronglyreduced monsoon precipitation during summer, i.e.continental aridity in subtropical South China, a no-ticeable discharge of loess dust, markedly loweredSST during winter, and an enhanced seasonalityall over the SCS. In contrast, the Holocene andother interglacial regimes were characterized by astrengthened summer-monsoon circulation and weakwinter-monsoon winds. They led to extreme conti-nental wetness in South China, to high winter SSTand a low seasonality in the whole SCS, and tohigh upwelling productivity southeast of Vietnam,possibly also to an increased frequency of typhoonstorms.
(2) An excess in siliciclastic clay and extendedperiods of reduced SSS indicate an ongoing fluvialsediment supply along the southern margin of theSCS during Stages 2–4. Based on these findingsthe emerged Sunda shelf was humid and drained byAmazone-style tropical rivers, a region which servedas glacial refuge for tropical forests, in harmony withthe marine pollen record (X. Sun, pers. commun.,1997).
(3) Glacial-to-interglacial sea-level changes had asignificant impact on the paleoceanography of theSCS via the closure and opening of the strait ofBorneo at a threshold water depth of about 40 m.During interglacial periods with high sea level thelateral advection of warm surface water from thetropical West Pacific led to a significant general risein annual mean SST (based on UK
37 records). Viceversa, the glacial closure of the Borneo strait led toan intensified inflow of cool and nutrient-rich sur-face water from the northeast, which was upwellednear the northern tip of Luzon during winter. Itis traced in SST, SSS, and δ13C records of plank-tonic foraminifera, moreover, by the frequency of P.obliquiloculata.
(4) The glacial separation of the SCS in the south-west involved a strengthened estuarine circulationmode. Together with the massive discharge of tropi-cal rivers this mode led to extreme oxygen depletionnear 1500 m water depth along the southern margin

L. Wang et al. / Marine Geology 156 (1999) 245–284 279
of the sea and to epibenthic δ13C values as low as�0.5 to < �1.5‰.
(5) SST, SSS, and siliciclastic grain-size recordsfrom the northern SCS contain a history of sig-nificant centennial to millennial-scale events. Coldspells occurred roughly every 3000 years during theHolocene. The Younger Dryas did not induce a cool-ing but an arid episode. Heinrich event 4 probablycorresponded to an arid and cool phase in SouthChina. In the southern and western SCS short-lastingextreme SSS minima reflect major freshwater flood-ings by summer-monsoon rain near Termination IIand IA and in late Stage 3, presumably linked to thewarm Dansgaard–Oeschger events 8 and 4 to 3.
(6) The high-frequency oscillations of Holocenemonsoon wetness in South China center at peri-odicities of 775 and 102=84 years. The 775-yearcycle may form a subharmonics of the 1500-yearcycle, recently described in ice-core and marine-sed-iment records and assigned to changes in oceanicthermohaline circulation. The 102=84 cyclicity maycorrespond to the Gleissberg period of solar activity.
(7) During the last 600 years, approximately sincethe early Little Ice Age, the SSS values have in-creased southeast of Hong Kong. They imply arecent drop in monsoon precipitation over SouthChina, coeval with growing temperature amplitudesrecorded in the ice-core GISP2 from Greenland, andpossibly, an impending fast return to greater wetness.
(8) Both short-lasting and long-term variations inthe East Asian monsoon were coeval with variationsin the Indian monsoon regime, based on publishedevidence from Arabian Sea sediments, which in-volves a joint (atmospheric?) forcing.
(9) Phase relationships among various paleocli-matic proxy records off Hong Kong during the onsetof glacial Termination IA suggest that the summer-monsoon-driven fluvial runoff and sediment supplyintensified right after the LGM insolation minimum,parallel to the early start of Antarctic ice melt andabout 3500 yr prior to the δ18O signal of postglacialsea-level rise. Vice versa, the grain-size record ofdust suggests a delayed but abrupt decrease in thestrength of winter-monsoon winds only about 15,000calendar years ago, along with the melt of northernglacial ice sheets.
(10) Based on a precise age tuning of Hein-rich-4 and other climate oscillations the local oceanic
14C-reservoir effect may have reached 1500 yearsduring times of low sea level, when the emergedSunda shelf barred the advection of young surfacewater from the south and the enhanced estuarinecirculation in the SCS led to an upwelling of old Pa-cific intermediate and deep water. Here 14C datingsmay rather serve as sensitive tracers of past circula-tion changes than for estimating the precise age ofclimate oscillations.
Acknowledgements
We gratefully acknowledge the German Min-istry for Education and Research (BMBF) and theDeutsche Forschungsgemeinschaft in Bonn (DFG)for their generous support of the Sonne Cruise 95to the South China Sea and the subsequent scien-tific evaluation. We sincerely thank A. Berger, A.Grothmann, W. Kuhnt, H. Lin, T. Stocker, X. Sun,and M. Weinelt for supplementary data and valu-able discussions on various aspects of changes inmonsoon climate, moreover, F. Sirocko and P. Wangfor thorough reviews of the manuscript. We alsothank M. Schulz for providing the software on thesmooth-spline technique and important comments.We acknowledge M. Nadeau and M. Schleicherwho provided great expertise and care in measuringAMS-14C ages. Thanks also go to K. Kissling, H.Aeffner, W. Rehder, and numerous students for labo-ratory assistance, and captain Bruns and the crew ofR=V Sonne and especially, to Norbert Muhlhan fortechnical assistance in retrieving undisturbed, longsediment cores. One of the authors (LW) thanks theGraduate School of Environmental Earth Sciences ofHokkaido University, where parts of the manuscriptwere finished. C.P. thanks CIRIT, Generalitat deCatalunya, for a grant.
References
Adkins, J.F., Boyle, E.A., 1997. Changing atmospheric 114C andthe record of deep water paleoventilation ages. Paleoceanogra-phy 12, 337–344.
Alley, R.B., Meese, D.A., Shuman, C.A., Gow, A.J., Taylor,K.L., Grootes, P.M., White, J.W.C., Ram, M., Waddington,E.D., Mayewski, P.A., Zielinski, G.A., 1993. Abrupt increasein Greenland snow accumulation at the end of the Younger
280 L. Wang et al. / Marine Geology 156 (1999) 245–284
Dryas event. Nature 362, 527–529.An, Z., Kukla, G., Porter, S.C., Xiao, X., 1991. Paleomonsoons
of China over the last 130,000 years — paleomonsoon varia-tion. Sci. China (B) 34, 1016–1024.
Banerjee, S.K., 1995. Chasing the paleomonsoon over China: itsmagnetic record. GSA Today 5, 93–97.
Bard, E., Hamelin, B., Fairbanks, R.G., Zindler, A., 1990a.Calibration of the 14C timescale over the past 30,000 yearsusing mass spectrometric U–Th ages from Barbados corals.Nature 345, 405–410.
Bard, E., Hamelin, B., Fairbanks, R.G., 1990b. U-Th ages ob-tained by mass-spectrometry in corals from Barbados: sealevel during the past 130,000 years. Nature 346, 456–458.
Bard, E., Arnold, M., Hamelin, B., Tismerat-Iaborde, N., 1998.Comparison of U=Th and C14 ages measured on corals: an up-date based on new samples from Pacific islands. Radiocarbon40 (in press).
Berger, A., Loutre, M.F., 1991. Insolation values for the climateof the last 10 million of years. Quat. Sci. Rev. 10, 297–317.
Blunier, T., Chappellaz, J., Schwander, J., Stauffer, B., Raynaud,D., 1995. Variations in atmospheric methane concentrationduring the Holocene epoch. Nature 374, 46–49.
Bond, G., Lotti, R., 1995. Iceberg discharges into the NorthAtlantic on millennial time scales during the last glaciation.Science 267, 1005–1010.
Bond, G., Heinrich, H., Broecker, W., Labeyrie, L., McManus,J., Andrews, J., Huon, S., Jantschik, R., Clasen, S., Simet, C.,Tedesco, K., Klas, M., Bonani, G., Ivy, S., 1992. Evidence formassive discharges of icebergs into the North Atlantic oceanduring the last glacial period. Nature 360, 245–249.
Bond, G., Showers, W., Cheseby, M., Lotti, R., Almasi, P., deMenocal, P., Priore, P., Cullen, H., Hajdas, I., Bonani, G.,1997. A pervasive millennial-scale cycle in North AtlanticHolocene and glacial climates. Science 278, 1257–1266.
Bradley, R.S., Jones, P.D., 1993. ‘Little Ice Age’ summer tem-perature variations: their nature and relevance to recent globaltrends. Holocene 3, 367–376.
Broecker, W.S., Peng, F.H., 1982. Tracers in the sea. EldigioPress, 679 pp.
Broecker, W.S., Andree, M., Bonani, G., Wolfli, W., Mix, A.,Oeschger, H., 1988. Comparison between radiocarbon agesobtained on coexisting planktonic foraminifera. Paleoceanog-raphy 3, 647–657.
Broecker, W.S., Bond, G., Klas, M., 1990. A salt oscillator in theglacial Atlantic? 1. The concept. Paleoceanography 5, 469–477.
Chappell, J., Omura, A., Esat, T., McCulloch, M., Pandolfi, J.,Ota, T., Pilans, B., 1996. Reconciliation of late Quaternarysea levels derived from coral terraces at Huon Peninsula withdeep-sea oxygen isotope records. Earth Planet. Sci. Lett. 141,227–236.
Ciais, P., Jouzel, J., Lorius, C., Barkov, N.I., Lipenkov, V.,Nikolaiev, V., 1992. Evidence for an early Holocene climaticoptimum in the Antarctic deep ice-core record. Clim. Dyn. 6,169–177.
Clemens, S., Prell, W., Murray, D., Shimmield, G., Weedon,
G., 1991. Forcing mechanisms of the Indian Ocean monsoon.Nature 353, 720–725.
CLIMAP project members, 1981. Seasonal reconstructions of theEarth’s surface at the Last Glacial Maximum. Geol. Soc. Am.Map and Chart Ser. MC-36.
Cortijo, E., Yiou, P., Labeyrie, L., Cremer, M., 1995. Sedimen-tary record of rapid climatic variability in the North AtlanticOcean during the last glacial cycle. Paleoceanography 10,911–926.
Dansgaard, W., White, J.W.C., Johnsen, S., 1989. The abrupttermination of the Younger Dryas climate event. Nature 339,532–533.
Duplessy, J.C., Be, A.W.H., Blanc, P.L., 1981. Oxygen andcarbon isotopic composition and biogeographic distributionof planktonic foraminifera in the Indian Ocean. Palaeogeogr.,Palaeoclimatol., Palaeoecol. 33, 9–46.
Duplessy, J.-C., Arnold, M., Bard, E., Juillet-Leclerc, A., Kallel,N., Labeyrie, L., 1989. AMS 14C study of transient events andof the ventilation rate of the Pacific intermediate water duringthe last deglaciation. Radiocarbon 31, 493–502.
Duplessy, J.C., Bard, E., Arnold, M., Shackleton, N.J., Duprat,J., Labeyrie, L., 1991. How fast did the ocean–atmospheresystem run during the last deglaciation? Earth Planet. Sci.Lett. 103, 27–40.
Evans, C.D.R., Brett, C.P., James, J.W.C., Holmes, R., 1995.Shallow seismic reflection profiles from the waters of Eastand Southeast Asia: an interpretation manual and atlas. BritishGeological Survey, Tech. Rep. WC=94=60, Overseas GeologySeries, pp. 66–67.
Fairbanks, R.G., 1989. A 17,000-year glacio-eustatic sea levelrecord: influence of glacial melting rates on the YoungerDryas event and deep-ocean circulation. Nature 342, 637–642.
Fairbanks, R.G., Wiebe, P.H., Be, A.W.H., 1980. Verticaldistribution and isotopic composition of living planktonicforaminifera in the Western North Atlantic. Science 207, 61–63.
Fairbanks, R.G., Sverdlove, M., Free, R., Wiebe, P.H., Be,A.W.H., 1982. Vertical distribution and isotopic fractiona-tion of living planktonic foraminifera from the Panama Basin.Nature 298, 841–844.
Ganssen, G., Sarnthein, M., 1983. Stable isotope composition offoraminifers: the surface and bottom water record of coastalupwelling. In: Suess, E., Thiede, J. (Eds.), Coastal Upwelling:Its Sediment Record, Part A: Responses of the SedimentaryRegime to Present Coastal Upwelling. Plenum Press, NewYork, pp. 99–121.
Gordon, A.L., 1986. Interocean exchange of thermocline water.J. Geophys. Res. 91, 5037–5046.
Grootes, P.M., Stuiver, M., 1997. 18O=16O variability in Green-land snow and ice with 10�3 to 10�5 yr time resolution. J.Geophys. Res. 102 (C12), 26455–26470.
Grootes, P.M., Stuiver, M., White, J.W.C., Johnsen, S., Jouzel, J.,1993. Comparison of oxygen isotope records from the GISP2and GRIP Greenland ice cores. Nature 366, 552–554.
Grothmann, A., 1996. Rezente Verbreitungsmuster vulkanischer,terrigener und biogener Komponenten und stabiler Kohlen-

L. Wang et al. / Marine Geology 156 (1999) 245–284 281
stoff- und Sauerstoff-Isotope in Sedimenten der Sudchina-See.M.Sc. Thesis, Kiel University.
Hemleben, C., Spindler, M., Anderson, O.R., 1989. ModernPlanktonic Foraminifera. Springer, New York, 363 pp.
Hughen, K.A., Overpeck, J.T., Lehman, S.J., Kashgarian, M.,Southon, J., Peterson, L.C., Alley, R., Sigman, D.M., 1998.Deglacial changes in the ocean circulation from an extendedradiocarbon calibration. Nature 391, 65–68.
Hydrographer of the Navy and under the Superintendence ofRear Admiral R.O. Morris, 1985. Taiwan Strait, CrownCopyright, Taunton.
Japan Hydrographic Association, 1978. Marine EnvironmentalAtlas: Northwestern Pacific II, Japan Oceanographic DataCenter, Tokyo.
Jian, Z., Li, B., Pflaumann, U., Wang, P., 1996. Late Holocenecooling event in the western Pacific. Sci. China (D) 39, 552–560.
Kennett, J.P., Ingram, B.C., 1995. A 20,000-year record of oceancirculation and climate change from the Santa Barbara basin.Nature 377, 510–514.
Kienast, M., 1996. Geschichte des Fluvialeintrags vom Sunda-Schelf: Abbild in hemipelagischen Sedimenten aus dem Sud-chinesischen Meer. M.Sc. Thesis, Kiel University, 53 pp.
Kirch, A., 1997. Zur Palaoozeanographie westlich von Luzon(Philippinen). M.Sc. Thesis, Kiel University, 28 pp.
Knaack, J.J., 1997. A new transfer function to reconstruct pale-oproductivity from marine diatom assemblages (in German).Ber.-Rep., Geol.-Palaeontol. Inst. Univ. Kiel 83, 1–125.
Koerner, R.M., Fisher, D.A., 1990. A record of Holocene sum-mer climate from a Canadian high-Arctic ice core. Nature 343,630–631.
Koopmann, B., 1981. Saharan dust deposition in the subtropicalAtlantic during the last 25,000 years (in German) . ‘Meteor’Forschungsergeb. C 5, 23–54.
Kotilainen, A.T., Shackleton, N.J., 1995. Rapid climate variabil-ity in the North Pacific Ocean during the past 95,000 years.Nature 377, 323–326.
Kromer, B., Becker, B., 1993. German oak and pine 14C calibra-tion, 7200 BC–9400 BC. Radiocarbon 35, 125–136.
Kudrass, H.R., Erlenkeuser, H., Vollbrecht, R., Weiss, W., 1991.Global nature of the Younger Dryas cooling event inferredfrom oxygen isotope data from Sulu Sea cores. Nature 349,406–409.
Kukla, G., Heller, F., Ming X, L.-, Chun, X.-T., Liu, T.-S., An,Z.-S., 1988. Pleistocene climates in China dated by magneticsusceptibility. Geology 16, 811–814.
Kutzbach, J.E., Gallimore, R.G., 1988. Sensitivity of a coupledatmosphere=mixed layer ocean model to changes in orbitalforcing at 9,000 years B.P. J. Geophys. Res. 93 (D1), 803–821.
Kutzbach, J., Bonan, G., Foley, J., Harrison, S.P., 1996. Veg-etation and soil feedbacks on the response of the Africanmonsoon to Orbital forcing in the early to middle Holocene.Nature 384, 623–626.
Labeyrie, L.D., Duplessy, J.-C., Blanc, P.L., 1987. Variations inmode of formation and temperature of oceanic deep watersover the past 125,000 years. Nature 327, 477–482.
Laj, C., Mazaud, A., Duplessy, J.-C., 1996. Geomagnetic inten-sity and 14C abundance in the atmosphere and ocean duringthe past 50 ka. Geophys. Res. Lett. 23, 2045–2048.
Levitus, S., Boyer, T.P., 1994. World Ocean Atlas 1994, Vol. 4.Temperature. NOAA, U.S. Dep. Commerce, Washington, DC,117 pp.
Liu, T., Ding, Z., 1993. Stepwise coupling of monsoon circula-tions to global ice volume variations during the late Cenozoic.Global Planet. Sci. 7, 119–130.
Martinson, D.G., Pisias, W.G., Hays, J.D., Imbrie, J., Moore Jr.,T.C., Shackleton, N.J., 1987. Age and dating and the orbitaltheory of the ice age: development of a high resolution 0–300,000 year chronostratigraphy. Quat. Res. 27, 1–29.
Maslin, M., Sarnthein, M., Knaack, J.J., 1996. Subtropical east-ern Atlantic climate during the Eemian. Naturwissenschaften83, 122–126.
Metzger, E.J., Hurlbert, H.E., 1996. Coupled dynamics of theSouth China Sea, the Sulu Sea, and the Pacific Ocean. J.Geophys. Res. 101, 12331–12352.
Miao, Q., Thunell, R.C., 1994. Glacial–Holocene carbonate dis-solution and sea-surface temperatures in the South China andSulu Seas. Paleoceanography 9, 269–290.
Molengraaff, G.A.F., 1921. Modern deep-sea research in the EastIndian Archipelago. Geogr. J. 57, 95–121.
Morley, J.J., Heusser, L.E., 1997. Role of orbital forcing ineast Asian monsoon climates during the last 350 kyr: evi-dence from terrestrial and marine proxies from core RC14-99.Paleoceanography 12, 483–493.
Mulitza, S., Niebler, H.S., Duerkoop, A., Wefer, G., 1997. Plank-tonic foraminifera as recorders of past surface water stratifica-tion. Geology 25, 335–338.
Muller, P.J., Cepek, M., Ruhland, G., Schneider, R., 1997.Alkenone and coccolithophorid species changes in late Qua-ternary sediments from the Walvis Ridge: implications forthe alkenone paleotemperature method. Palaeogeogr., Palaeo-climatol., Palaeoecol. 135, 71–96.
Muller, P.J., Kirst, G., Ruhland, G., von Storch, I., Rosell-Mele,A., 1998. Calibration of the alkenone paleotemperature indexUk037 based on core-tops from the eastern South Atlantic andglobal ocean (60ºN–60ºS). Geochim. Cosmochim. Acta (inpress).
Nadeau, M.-J., Schleicher, M., Grootes, P.M., Erlenkeuser, E.,Gottdang, A., Mous, D.J.W., Sarnthein, M., Willkomm, H.,1997. The Leibniz-Labor AMS facility at the Christian-Albrechts-University, Kiel, Germany. Nucl. Instrum. MethodsPhys. Res. B 123, 22–30.
Oda, M., Takemoto, A., 1992. Planktonic foraminifera and pale-oceanography in the domain of Kuroshio current around Japanduring the last 20,000 years (in Japanese). Quat. Res. 31, 341–357.
Paillard, D., Labeyrie, L., Yiou, P., 1996. Macintosh programperforms time-series analysis. EOS 77, 379.
Parkin, D.W., Shackleton, N.J., 1973. Trade Wind and tempera-ture correlations down a deep-sea core off the Saharan Coast.Nature 245, 455–457.
Pearson, G.W., Becker, B., Qua, F., 1993. High-precision 14Cmeasurement of German and Irish oaks to show the natural
282 L. Wang et al. / Marine Geology 156 (1999) 245–284
14C variations from 7890 to 5000 BC. Radiocarbon 35, 93–104.
Pelejero, C., Grimalt, J.O., 1997. The correlation between theUK
37 index and sea surface temperature in the warm boundary:the South China Sea. Geochim. Cosmochim. Acta 61, 4789–4797.
Pelejero, C., Grimalt, J.O., Sarnthein, M., Wang, L., Flores, J.-A.,1999. Molecular biomarker record of sea surface temperatureand climatic change in the South China Sea during the last130,000 years. Mar. Geol. 156, 109–121.
Pflaumann, U., Jian, Z., 1999. Modern distribution patterns ofplanktonic foraminifera in the South China Sea and West Pa-cific: a new transfer technique to estimate regional sea-surfacetemperature. Mar. Geol. 156, 41–83.
Porter, S.C., An, Z., 1995. Correlation between climate events inthe North Atlantic and China during the last glaciation. Nature375, 305–308.
Prell, W.L., Kutzbach, J.E., 1987. Monsoon variability over thepast 150,000 years. J. Geophys. Res. 92, 8411–8425.
Prell, W.L., Imbrie, J., Martinson, D.G., Morley, J.J., Pisias,N.G., Shackleton, N.J., Streeter, H.F., 1986. Graphic corre-lation of oxygen isotope stratigraphy application to the LateQuaternary. Paleoceanography 1, 137–162.
Prentice, I.C., Sarnthein, M., 1993. Self-regulatory processes inthe biosphere in the face of climate change. In: Eddy, J.A.,Oeschger, H. (Eds.), Global Changes in the Perspective of thepast. (Dahlem Konferenzen), Wiley, New York, pp. 29–38.
Pye, K., Zhou, L., 1989. Late Pleistocene and Holocene aeo-lian dust deposition in north China and the northwest PacificOcean. Palaeogeogr., Palaeoclimatol., Palaeoecol. 73, 11–23.
Reinsch, C.H., 1967. Smoothing by spline functions. Numer.Math. 10, 177–183.
Rosenthal, Y., Boyle, E.A., Labeyrie, L., 1997. Last glacialmaximum paleochemistry and deepwater circulation in theSouthern Ocean: evidence from foraminiferal cadmium. Pale-oceanography 12, 787–796.
Rostek, F., Ruhland, G., Bassinot, F., Mueller, P.J., Labeyrie,L.D., Lancelot, Y., Bard, E., 1993. Reconstructing sea surfacetemperature and salinity using δ18O and alkenone records.Nature 364, 319–321.
Ruddiman, W.F., Sarnthein, M., Backman, J., et al., 1989. Plio-Pleistocene evolution of climate in Africa and the equatorialAtlantic: overview of Leg 108 results. In: Ruddiman, W.F.,Sarnthein, M., et al. (Eds.), Proceedings of Ocean DrillingProject Leg 108, Vol. B. U.S. Government Printing Office,Washington, DC, pp. 463–484.
Sarnthein, M., Tiedemann, R., 1990. Younger Dryas-style cool-ing events at glacial terminations I–VI: associated benthicδ13C anomalies at ODP Site 658 constrain meltwater hypothe-sis. Paleoceanography 6, 1041–1055.
Sarnthein, M., Winn, K., 1990. Reconstruction of low and mid-latitude export productivity, 30,000 y B.P. to Present: implica-tions for global carbon and nutrient reservoirs. In: Schlesinger,M. (Ed.), Climate and Ocean Interaction. Proc. NATO ARW,Oxford, Sep. 1988, pp. 319–342.
Sarnthein, M., Tetzlaff, G., Koopmann, B., Wolter, K., Pflau-mann, U., 1981. Glacial and interglacial wind regimes over
the eastern subtropical Atlantic and NW Africa. Nature 293,193–196.
Sarnthein, M., Winn, K., Duplessy, J.-C., Fontugne, M.R., 1988.Global variations in surface ocean productivity in low and midlatitudes: influence on CO2 reservoirs of the deep ocean andatmosphere during the last 21,000 years. Paleoceanography 3,361–399.
Sarnthein, M., Pflaumann, U., Wang, P.X., Wong, H.K.(Eds.), 1994a. Preliminary Report on SONNE-95 Cruise‘Monitor Monsoon’ to the South China Sea. Ber.-Rep.,Geol.-Palaeontol. Inst. Univ. Kiel 48, 225 pp.
Sarnthein, M., Winn, K., Jung, S.J.A., Duplessy, J.-C., Labeyrie,L., Erlenkeuser, H., Ganssen, G., 1994b. Changes in EastAtlantic deepwater circulation over the last 30,000 years: eighttime slice reconstructions. Paleoceanography 9, 209–267.
Sarnthein, M., Jansen, E., Weinelt, M., Arnold, M., Duplessy,J.C., Erlenkeuser, H., Flatoy, A., Johannessen, G., Johan-nessen, T., Jung, S., Koc, N., Labeyrie, L., Pflaumann, U.,Schulz, H., 1995. Variations in Atlantic surface ocean paleo-ceanography, 50º–85ºN: a time-slice record of the last 30,000years. Paleoceanography 10, 1063–1094.
Sawada, K., Handa, N., 1998. Variability of the Kuroshio oceancurrent over the past 25,000 years. Nature 392, 592–595.
Schleicher, M., Grootes, P.M., Nadeau, M.J., Schoon, A., 1998.14C backgrounds and their components at the Leibniz AMSfacility. Radiocarbon 40 (in press).
Schulz, H., von Rad, U., Erlenkeuser, H., 1998. Correlationbetween Arabian Sea and Greenland climate oscillations ofthe past 110,000 years. Nature 393, 54–57.
Seidov, D., Sarnthein, M., Stattegger, K., Prien, R., Weinelt, M.,1996. North Atlantic ocean circulation during the last glacialmaximum and subsequent meltwater event: a numerical model.J. Geophys. Res. 101, 16305–16332.
Shackleton, N.J., Duplessy, J.C., Arnold, M., Maurice, P., Hall,N.A., Cartlidge, J., 1988. Radiocarbon age of East glacialPacific deep water. Nature 335, 708–711.
Shi, Y., Kong, Z., Wang, S., Tang, L., Yao, T., Zhao, X., Zhang,P., Shi, S., 1993. Mid-Holocene climates and environments inChina. Global Planet. Change 7, 219–233.
Sirocko, F., Sarnthein, M., Erlenkeuser, H., Lange, H., Arnold,M., Duplessy, J.C., 1993. Century-scale events in monsoonalclimate over the past 24,000 years. Nature 364, 322–324.
Sirocko, F., Garbe-Schoenberg, D., McIntyre, A., Molfino, B.,1996. Teleconnection between the subtropical Monsoon andhigh-latitude climate during the last deglaciation. Science 272,526–529.
Sowers, T., Bender, M., 1995. Climate records covering the lastdeglaciation. Science, 210–214.
Stattegger, K., Kuhnt, W., Wong, H.K., et al., 1997.Cruise Report SONNE 115 SUNDAFLUT. Sequenzstrati-graphie, spatpleistozan–holozane Meeresspiegelschwankun-gen und hochauflosende Rekonstruktion der postpleistozanenTransgression am Sunda Schelf. Ber.-Rep., Geol.-Palaeontol.Inst. Univ. Kiel 86, 1–211.
Stein, R., 1985. Rapid grain-size analyses of clay and silt fractionby Sedigraph 5100D: comparison with Coulter Counter andAtterberg methods. J. Sediment Petrol. 55, 590–615.

L. Wang et al. / Marine Geology 156 (1999) 245–284 283
Stocker, T., 1996. An overview of century time-scale variabilityin the climate system: observations and models. In: Anderson,D.L.T., Willebrand, J. (Eds.), Decadal Climate Variability,Dynamics and Predictability. NATO ASI Series I, 44, Springer,Berlin, pp. 380–406.
Stocker, T., Mysack, A., 1992. Climatic fluctuations on thecentury time scale: A review of high-resolution proxy data andpossible mechanisms. Climatic Change 20, 227–250.
Stuiver, M., Becker, B., 1993. High-precision decadal calibrationof the radiocarbon time scale, AD 1950–6000 BC. Radiocar-bon 35, 35–65.
Stuiver, M., Braziunas, T.F., 1993. Modelling atmospheric 14Cinfluences and 14C ages of marine samples to 10,000 BC.Radiocarbon 35, 137–189.
Stuiver, M., Pearson, G.W., 1993. High precision calibration ofthe radiocarbon time scale AD 1950–500 BC and 2500–6000BC. Radiocarbon 35, 1–24.
Stuiver, M., Grootes, P.M., Braziunas, T.F., 1995. The GISP2δ18O climate record of the past 16,500 years and the role ofthe Sun, ocean, and volcanoes. Quat. Res. 44, 341–354.
Sun, X., Li, X., 1999. Pollen records of the last 37 ka in deep-seacore 17940 from the northern slope of the South China Sea.Mar. Geol. 156, 227–244.
Tchernia, P., 1980. Descriptive Regional Oceanography. MarineSeries 3, Pergamon Press, Oxford, 253 pp.
Thompson, P.R., 1981. Planktonic foraminifera in the WesternNorth Pacific during the past 150,000 years: comparison ofmodern and fossil assemblages. Palaeogeogr., Palaeoclimatol.,Palaeoecol. 35, 241–279.
Thunell, R.C., Miao, Q., 1996. Sea surface temperature of thewestern equatorial Pacific ocean during the Younger Dryas.Quat. Res. 46, 72–77.
Thunell, R.C., Miao, Q., Calvert, S.E., Pedersen, T.F., 1992.Glacial–Holocene biogenic sedimentation patterns in theSouth China Sea: productivity variations and surface waterpCO2. Paleoceanography 7, 143–162.
Thunell, R., Anderson, D., Gellar, D., Miao, Q., 1994. Sea-surface temperature estimates for the tropical western Pacificduring the last glaciation and their implications for the PacificWarm Pool. Quat. Res. 41, 255–264.
Tjia, H.D., 1980. The Sunda Shelf, southeast Asia. Z. Geomor-phol. 24, 405–427.
Tolderlund, D.S., Be, A.W.H., 1971. Seasonal distribution ofplanktonic foraminifera in the western North Atlantic. Mi-cropaleontology 17, 297–329.
Vogelsang, E., 1990. Palaeo-Ozeanographie des EuropaischenNordmeeres an Hand stabiler Kohlenstoff- und Sauerstoffiso-tope, Ph.D. Thesis, University of Kiel, 137 pp.
Volker, A., Sarnthein, M., Grootes, P.M., Erlenkeuser, H., Laj,C., Mazaud, A., Nadeau, M.J., Schleicher, M., 1998. Cor-relation of marine 14C ages from the Nordic Seas with theGISP2 isotope record: implications for radiocarbon calibrationbeyond 25 ka BP. Radiocarbon 40, 517–534.
Wang, L., 1992. The late Quaternary oxygen isotope record andits implications for the ventilation state of the South ChinaSea. (In Chinese, with English abstr.). In: Ye, Z., Wang, P.(Eds.), Contributions to Late Quaternary Paleoceanography
of the South China Sea, Qingdao Ocean. University Press,Qingdao, pp. 195–205.
Wang, L., Wang, P., 1990. Late Quaternary paleoceanographyof the South China Sea: glacial=interglacial contrasts in anenclosed basin. Paleoceanography 5, 77–90.
Wang, L., Sarnthein, M., Duplessy, J.-C., Erlenkeuser, H., Jung,S., Pflaumann, U., 1995. Paleo sea surface salinities in the lowlatitude Atlantic: the δ18O record of Globigerinoides ruber(white). Paleoceanography 10, 749–761.
Wang, L., Grothmann, A., Erlenkeuser, H., Sarnthein, M., inprep. Stable isotopes of morphotypes of Globigerinoides ruber(white) and its paleoceanographic implications. Geophys. Res.Lett. (submitted).
Wang, P., 1992. West Pacific marginal seas in the last glaciation:a paleoceanographic comparison. (In Chinese, with Englishabstr.). In: Ye, Z., Wang, P. (Eds.), Contributions to Late Qua-ternary Paleoceanography of the South China Sea, QingdaoOcean. University Press, Qingdao, pp. 308-321.
Wang, P., Wang, L., Bian, Y., Jian, Z., 1995. Late Quaternarypaleoceanography of the South China Sea: surface circulationand carbonate cycles. Mar. Geol. 127, 145–166.
Wei, K.-Y., Lee, M.-Y., Duan, W., Chen, C., Wang, C.H., 1998.Paleoceanographic change in the northeastern South China Seaduring the last 15000 years. J. Quat. Sci. 13, 55–64.
Wiesner, M.G., Zhen, L., Wong, H.K., Wang, Y., Chen, W.,1996. Fluxes of particulate matter in the South China Sea.In: Ittekkot, V., Schaefer, P., Honjo, S., Depetris, P.J. (Eds.),Particle Flux in the Ocean. Wiley, New York, pp. 293–312.
Williams, D.F., Be, A.W.H., Fairbanks, R.G., 1981. Seasonalstable isotopic variations in living planktonic foraminiferafrom Bermuda plankton tows. Palaeogeogr., Palaeoclimatol.,Palaeoecol. 33, 71–102.
Winkler, M.G., Wang, P.K., 1993. The late Quaternary vegetationand climate of China. In: Wright, H.E. et al. (Eds.), GlobalClimates Since the Last Glacial Maximum. Univ. of MinnesotaPress, Minneapolis, pp. 221–264.
Winn, K., Sarnthein, M., Erlenkeuser, H., 1991. δ18O stratig-raphy and chronology of Kiel sediment cores from the EastAtlantic. Ber.-Rep., Geol.-Palaeontol. Inst. Univ. Kiel 45, 1–99.
Winn, K., Zheng, L., Erlenkeuser, H., Stoffers, P., 1992.Oxygen=carbon isotopes and paleoproductivity in the SouthChina Sea during the past 110,000 years. In: Xianglong, J.,Kudrass, H.R., Pautot, G. (Eds.), Marine Geology and Geo-physics of the South China Sea. Proceedings of the Sympo-sium on the Recent Contributions to the Geological Historyof the South China Sea. China Ocean Press, Hangzhou, pp.154–166.
Wyrtki, K., 1961. Physical oceanography of the southeast Asianwaters. Scientific Results of Marine Investigations of the SouthChina Sea and the Gulf of Thailand 1959–1961. NAGA Rep.2, Scripps Institution of Oceanography, La Jolla.
Xiao, J., Porter, S.C., An, Z., Kumai, H., Yoshikawa, S., 1995.Grain size of quartz as an indicator of winter monsoon strengthon the loess plateau of Central China during the last 130,000yr. Quat. Res. 43, 22–29.
Zhang, J., Huang, W., Liu, M., 1994. Geochemistry of major

284 L. Wang et al. / Marine Geology 156 (1999) 245–284
Chinese river–estuary systems, In: Zhou, D., Liang, Y., Zeng,C. (Eds.), Oceanology of China Seas, Vol. 1. Kluwer, Dor-drecht, pp. 179–188.
Zhou, B., Zhao, Q., 1999. Allochthonous ostracods in the SouthChina Sea and their significance in indicating downslope sedi-ment contamination. Mar. Geol. 156, 187–195.