e shared services effort
TRANSCRIPT
Shared Services effort At XXb
June 13th, 2007
XXa = Parent Company Business Unit a XXb = Company XX Business Unit b OPS = Global Support Team NWT = XXb’s Network Facing Support Team
Shared Services Overview
• Make up of Shared Services @ XXb• Virtualization
• Farming
• Process/Procedure/People
• Technology of Shared Services By:• Vendor
• Concepts
• Experience Summary• Lessons Learned
• Future Direction
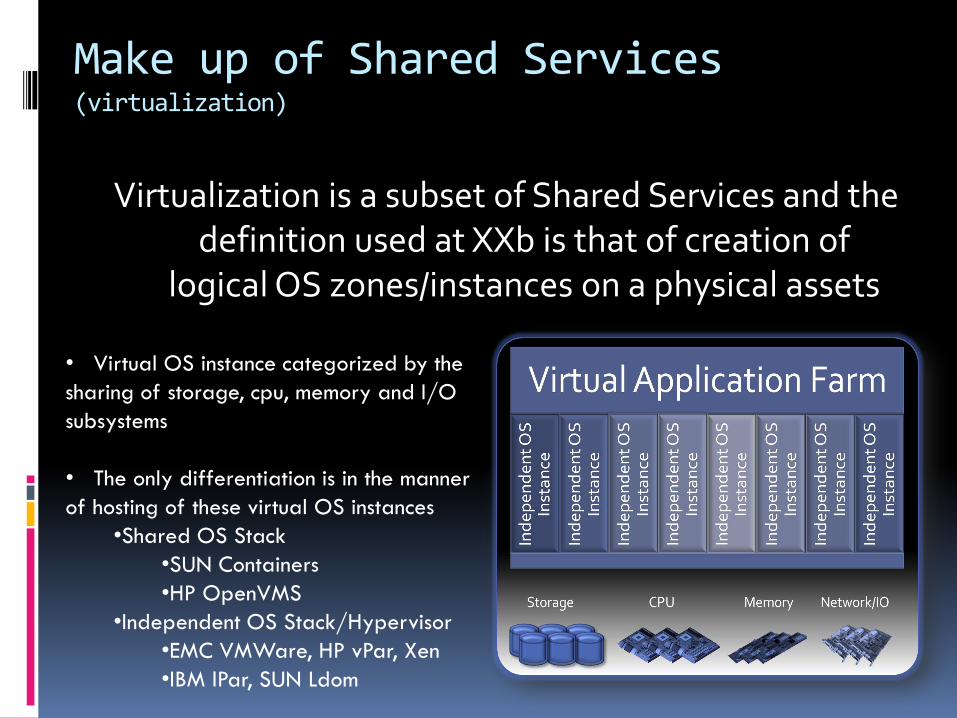
Make up of Shared Services (virtualization)
Virtualization is a subset of Shared Services and the definition used at XXb is that of creation of
logical OS zones/instances on a physical assets
• Virtual OS instance categorized by the
sharing of storage, cpu, memory and I/O
subsystems
• The only differentiation is in the manner
of hosting of these virtual OS instances
•Shared OS Stack
•SUN Containers
•HP OpenVMS
•Independent OS Stack/Hypervisor
•EMC VMWare, HP vPar, Xen
•IBM lPar, SUN Ldom
Make up of Shared Services (virtualization cont.)
• Reasons to Virtualization• Reduce Server Sprawl, Infrastructure Costs
• Reduction in Physical Footprint
• Optimization of Physical Server Utilization
• Ease of Compute Provisioning
• Dangers of Virtualization• OS Sprawl and Mgmt Cost Associated
• Unknown Licensing Practices by SW Vendors and Associated Costs
• Non Existent & Immature Chargeback, Reporting Practices
Make up of Shared Services (reasons and evolution at XXb)
• Reasons and Evolution of Shared Services Effort
• Cost Savings Effort Due to Bankruptcy
• Standardization and Centralization of Support and Infrastructure Organizations
• Evolution
• Identification of Low-Hanging Fruit
• SOA Approach to HW Infrastructure Identified as Correct Approach
• DB and Web Farming (Oracle, SQL, IIs, SharePoint, etc…)
• VMWare (Linux, Windows 2003 virtual instances)
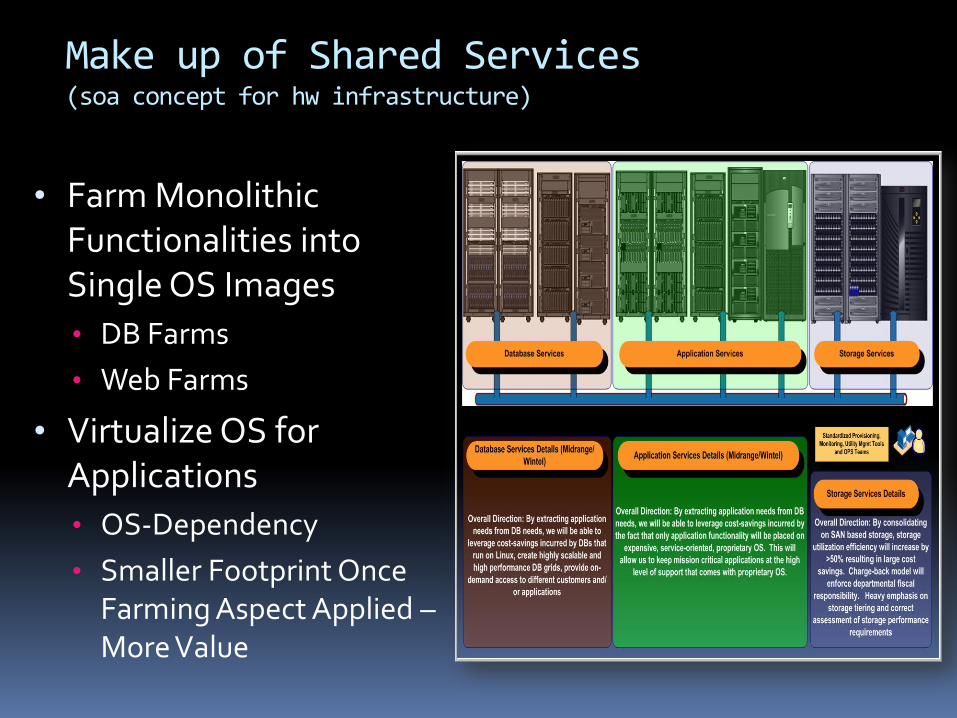
Make up of Shared Services (soa concept for hw infrastructure)
• Farm Monolithic Functionalities into Single OS Images
• DB Farms
• Web Farms
• Virtualize OS for Applications
• OS-Dependency
• Smaller Footprint Once Farming Aspect Applied –More Value
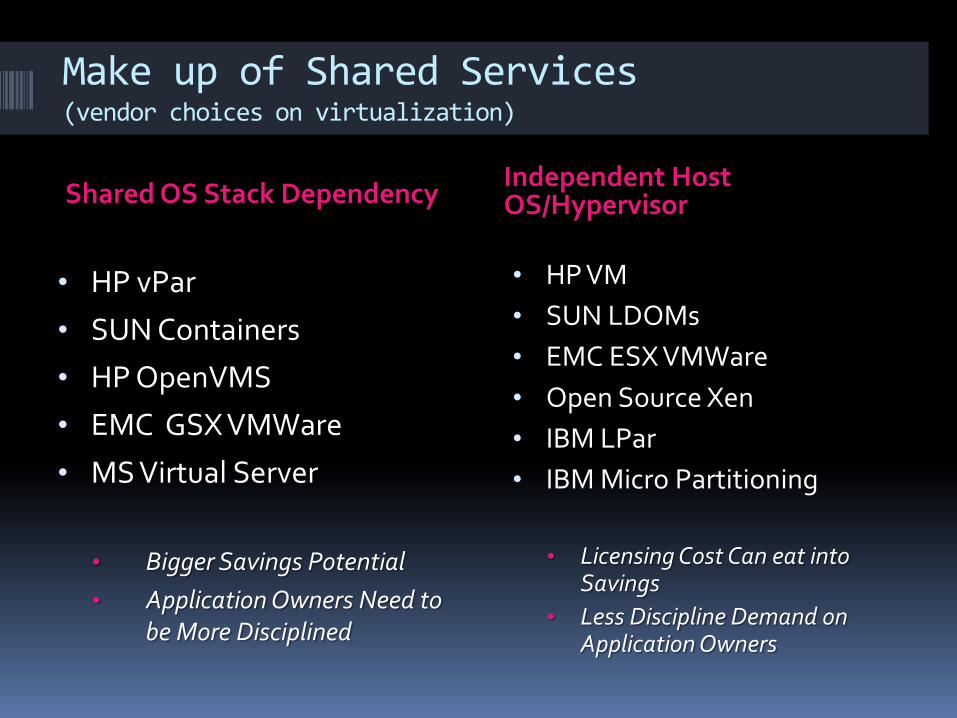
Make up of Shared Services (vendor choices on virtualization)
Shared OS Stack DependencyIndependent Host OS/Hypervisor
• HP vPar
• SUN Containers
• HP OpenVMS
• EMC GSX VMWare
• MS Virtual Server
• Bigger Savings Potential
• Application Owners Need to be More Disciplined
• HP VM
• SUN LDOMs
• EMC ESX VMWare
• Open Source Xen
• IBM LPar
• IBM Micro Partitioning
• Licensing Cost Can eat into Savings
• Less Discipline Demand on Application Owners
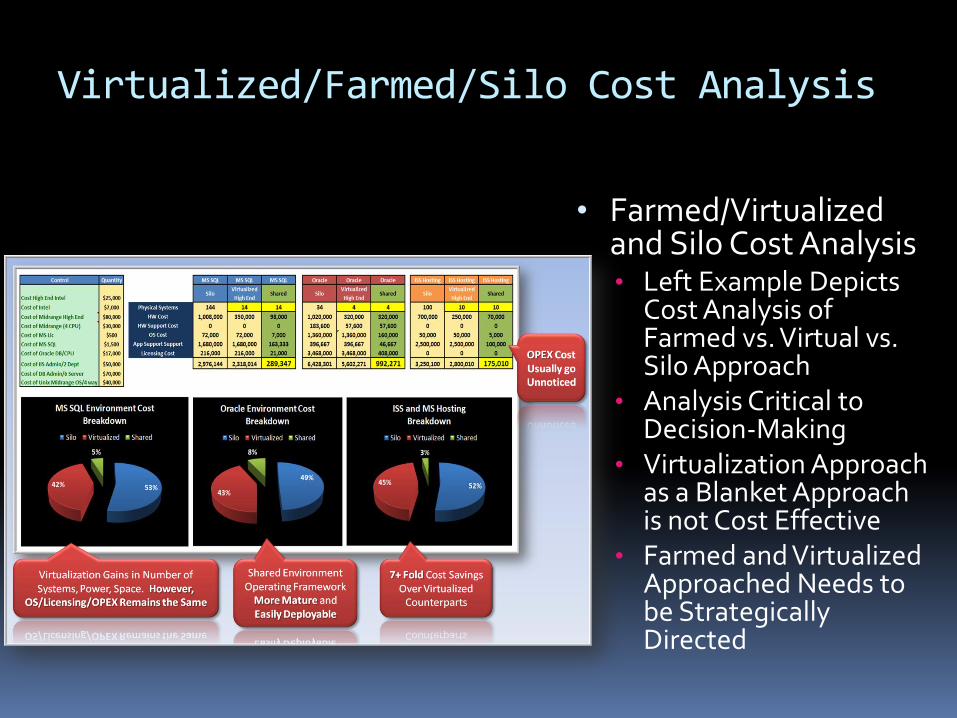
Virtualized/Farmed/Silo Cost Analysis
• Farmed/Virtualized and Silo Cost Analysis• Left Example Depicts
Cost Analysis of Farmed vs. Virtual vs. Silo Approach
• Analysis Critical to Decision-Making
• Virtualization Approach as a Blanket Approach is not Cost Effective
• Farmed and Virtualized Approached Needs to be Strategically Directed
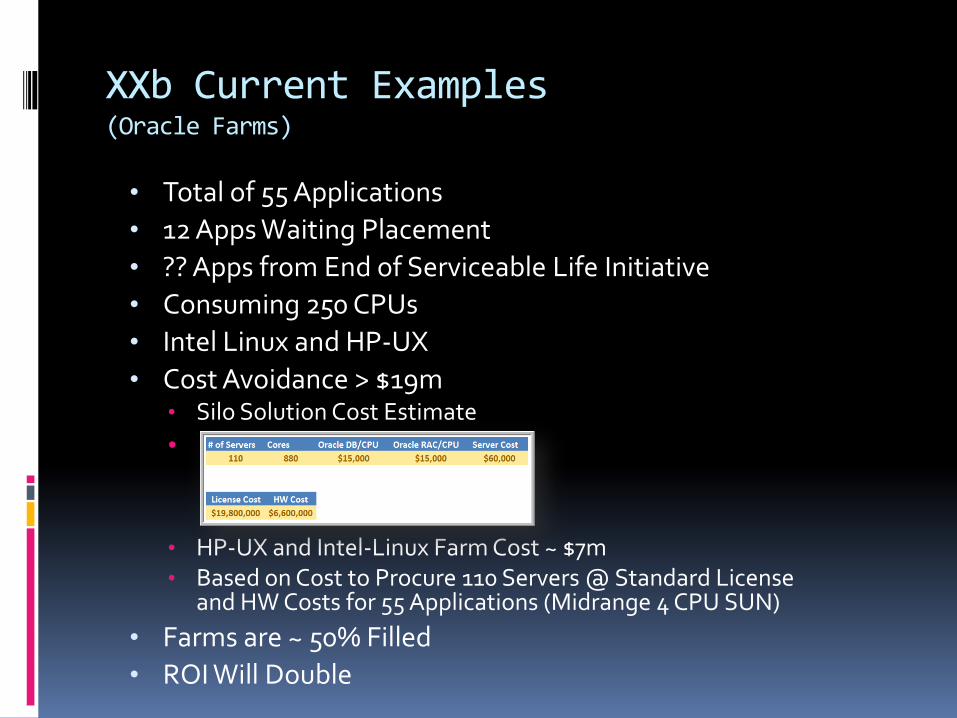
XXb Current Examples (Oracle Farms)
• Total of 55 Applications
• 12 Apps Waiting Placement
• ?? Apps from End of Serviceable Life Initiative
• Consuming 250 CPUs
• Intel Linux and HP-UX
• Cost Avoidance > $19m• Silo Solution Cost Estimate
•
• HP-UX and Intel-Linux Farm Cost ~ $7m• Based on Cost to Procure 110 Servers @ Standard License
and HW Costs for 55 Applications (Midrange 4 CPU SUN)
• Farms are ~ 50% Filled
• ROI Will Double
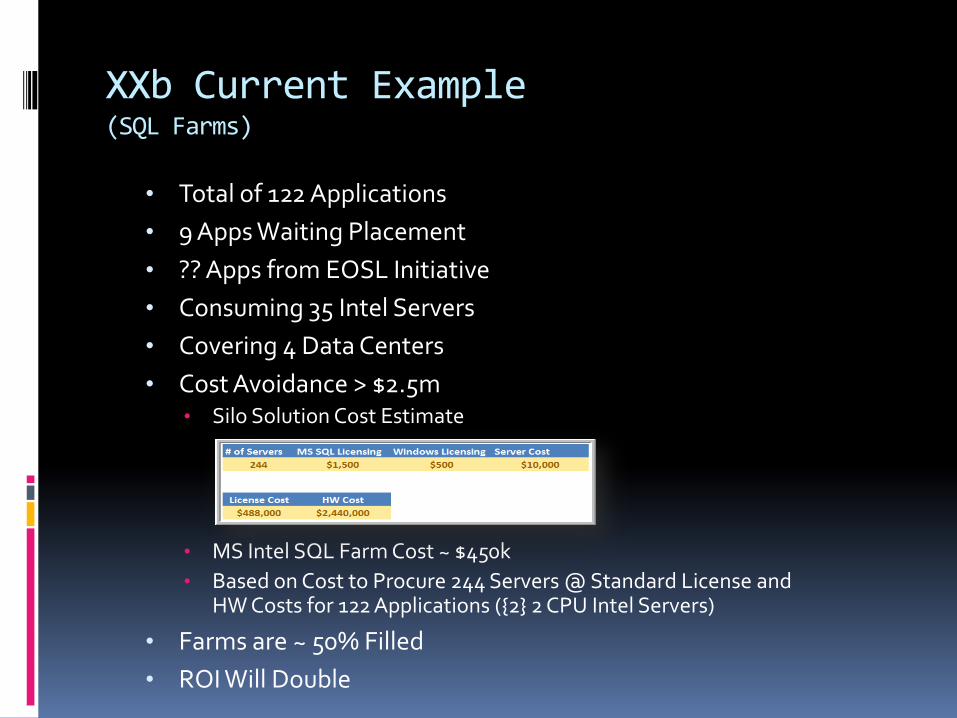
XXb Current Example (SQL Farms)
• Total of 122 Applications
• 9 Apps Waiting Placement
• ?? Apps from EOSL Initiative
• Consuming 35 Intel Servers
• Covering 4 Data Centers
• Cost Avoidance > $2.5m• Silo Solution Cost Estimate
• MS Intel SQL Farm Cost ~ $450k
• Based on Cost to Procure 244 Servers @ Standard License and HW Costs for 122 Applications ({2} 2 CPU Intel Servers)
• Farms are ~ 50% Filled
• ROI Will Double
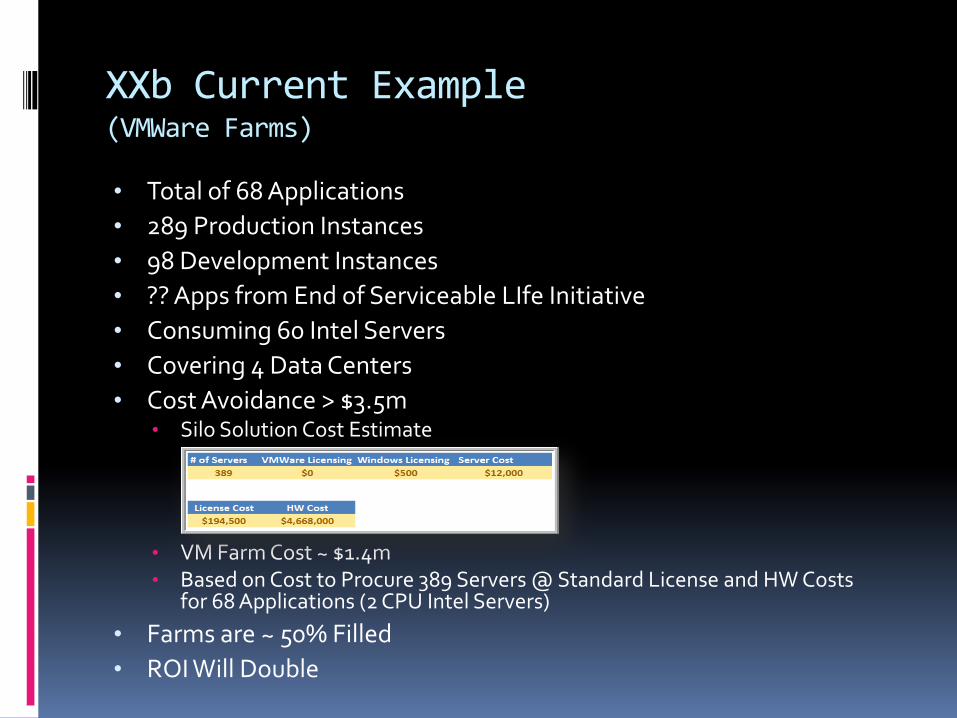
XXb Current Example (VMWare Farms)
• Total of 68 Applications
• 289 Production Instances
• 98 Development Instances
• ?? Apps from End of Serviceable LIfe Initiative
• Consuming 60 Intel Servers
• Covering 4 Data Centers
• Cost Avoidance > $3.5m• Silo Solution Cost Estimate
• VM Farm Cost ~ $1.4m• Based on Cost to Procure 389 Servers @ Standard License and HW Costs
for 68 Applications (2 CPU Intel Servers)
• Farms are ~ 50% Filled
• ROI Will Double
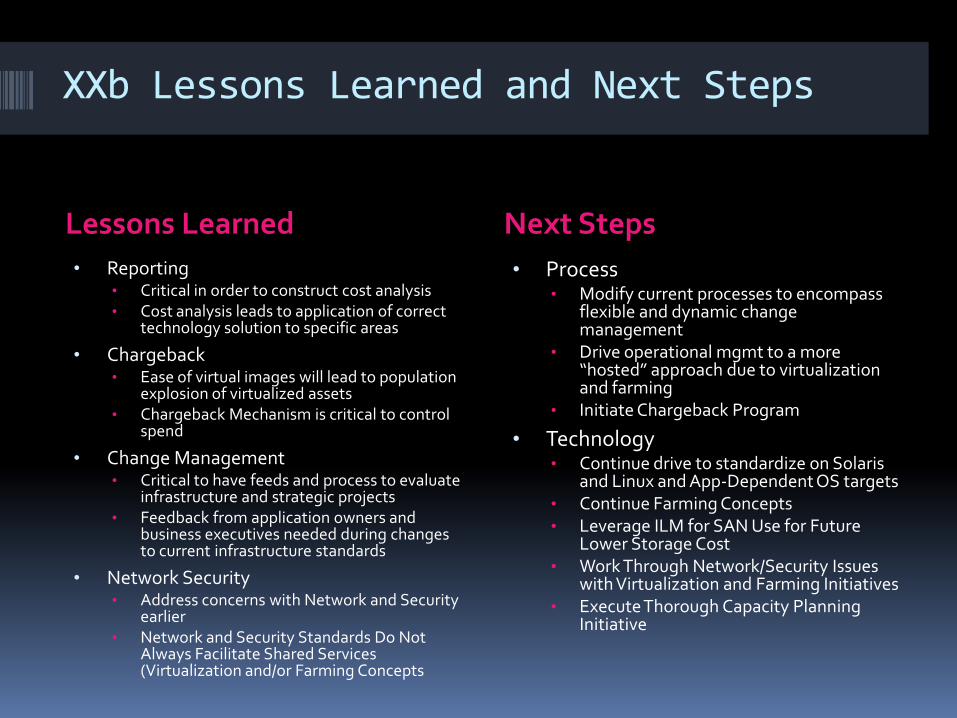
XXb Lessons Learned and Next Steps
Lessons Learned Next Steps
• Reporting• Critical in order to construct cost analysis• Cost analysis leads to application of correct
technology solution to specific areas
• Chargeback• Ease of virtual images will lead to population
explosion of virtualized assets• Chargeback Mechanism is critical to control
spend
• Change Management• Critical to have feeds and process to evaluate
infrastructure and strategic projects• Feedback from application owners and
business executives needed during changes to current infrastructure standards
• Network Security• Address concerns with Network and Security
earlier • Network and Security Standards Do Not
Always Facilitate Shared Services (Virtualization and/or Farming Concepts
• Process• Modify current processes to encompass
flexible and dynamic change management
• Drive operational mgmt to a more “hosted” approach due to virtualization and farming
• Initiate Chargeback Program
• Technology• Continue drive to standardize on Solaris
and Linux and App-Dependent OS targets• Continue Farming Concepts• Leverage ILM for SAN Use for Future
Lower Storage Cost• Work Through Network/Security Issues
with Virtualization and Farming Initiatives• Execute Thorough Capacity Planning
Initiative