dupont 5:year!accelerated! tyvek aging!industry · pdf filedupont ™! tyvek®!...
TRANSCRIPT
•
DuPont™ Tyvek® Medical Packaging Transition Project
5-‐Year Accelerated Aging Industry Summary Report July 2015
Bruce A. Yost, PhD Global MPTP Technical Director
Michael H. Scholla, PhD Global MP Regulatory Director
Jennifer H. Van Mullekom, PhD Senior Consulting Statistician
1
Report Contents
• Executive Summary • Medical Packaging Transition Project (“MPTP”) Overview Summary • Testing and Results Overview
o Seal Strength (ASTM F88) o Microbial Barrier (ASTM F2638) o Package Integrity Testing (ASTM F1929)
• Conclusions • Appendix A: Category Results
o Coated 1073B Pouches/Bags o Coated 1073B Form-‐Fill-‐Seal o Coated 1073B Lids/Rigid Trays o Uncoated 1073B Pouches/Bags o Coated 1059B Form-‐Fill-‐Seal o Uncoated 1059B Pouches/Bags o Uncoated 1059B Form-‐Fill-‐Seal
EXECUTIVE SUMMARY
5-‐Year Accelerated Aging package testing results for the 78 cells in the Medical Packaging Transition Project (“MPTP”) by third-‐party Nelson Laboratories indicate Functional Equivalence between current Tyvek® styles 1073B and 1059B and Transition Protocol material styles 1073B and 1059B. Specific test data to support this conclusion includes:
• Seal Strength (ASTM F88): 79 out of 79 instances of Functional Equivalence • Microbial Barrier (ASTM F2638): 78 out of 78 instances of Non-‐Inferiority • Package Integrity (ASTM F1929): 1,403 out of 1,404 instances of No Dye Penetration
Additional details are provided in the Tables and Figures that follow, including those in Appendix A, where results are presented by category.
MEDICAL PACKAGING TRANSITION PROJECT (“MPTP”) OVERVIEW SUMMARY
The Pre-‐Sterilization and Post-‐Sterilization Industry Summary Report (November 2014; Corrected April 2015) provides an extensive overview of MPTP. It can be found in the “Medical Packaging Transition Project Industry Reports” section of the www.areyouready.tyvek.com website. Important points to re-‐emphasize include:
• Functional Equivalence means that attributes of Transition Protocol material meet functional and performance requirements.
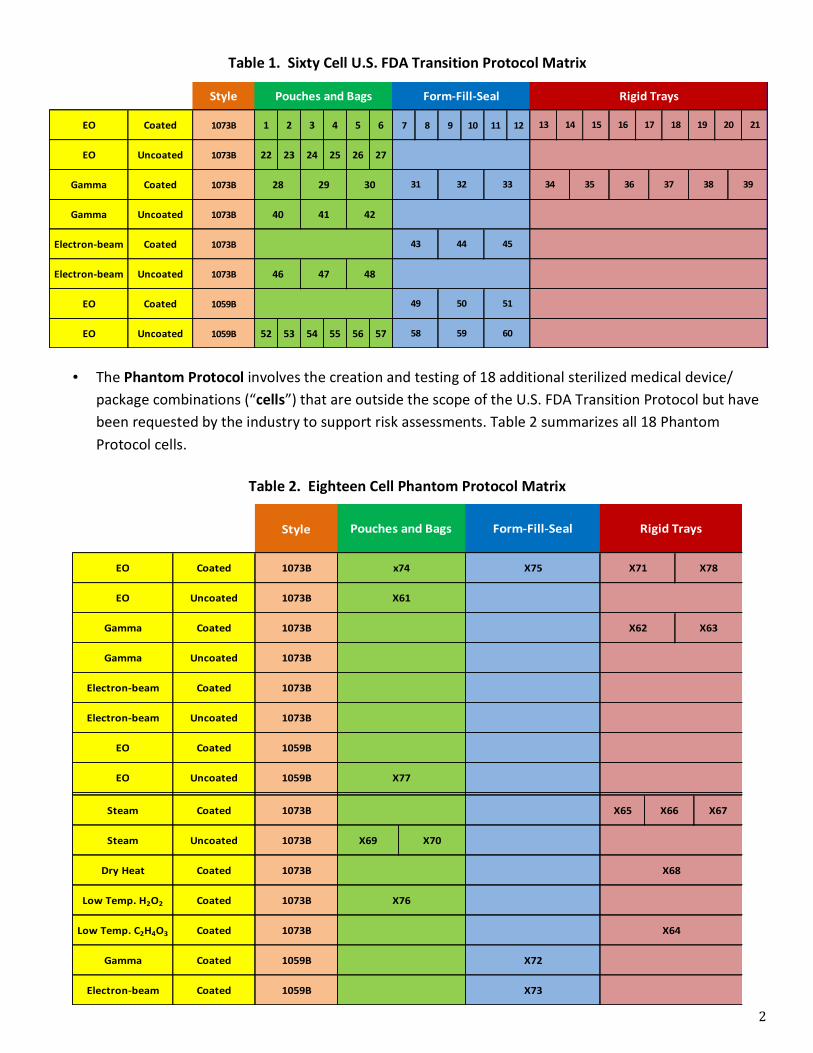
• The U.S. FDA Transition Protocol is a study plan based on sound principles of experimental design and statistical analysis for generating data to prove Functional Equivalence by comparing Transition Protocol material and Current Tyvek® using 60 different device/package combinations (“cells”) with a validated design and a validated forming, sealing and assembly process. Table 1 summarizes all 60 U.S. FDA Transition Protocol cells.
2
Table 1. Sixty Cell U.S. FDA Transition Protocol Matrix
Style
EO Coated 1073B 1 2 3 4 5 6 7 8 9 10 11 12
EO Uncoated 1073B 22 23 24 25 26 27
Gamma Coated 1073B
Gamma Uncoated 1073B
Electron-‐beam Coated 1073B
Electron-‐beam Uncoated 1073B
EO Coated 1059B
EO Uncoated 1059B 52 53 54 55 56 57
46 47 48
31 32
Pouches and Bags Form-‐Fill-‐Seal Rigid Trays
40 41 42
28 29 30
58 59 60
13 14
33
43 44 45
49 50 51
20 21
34 35 36 37 38 39
15 16 17 18 19
• The Phantom Protocol involves the creation and testing of 18 additional sterilized medical device/ package combinations (“cells”) that are outside the scope of the U.S. FDA Transition Protocol but have been requested by the industry to support risk assessments. Table 2 summarizes all 18 Phantom Protocol cells.
Style
EO Coated 1073B
EO Uncoated 1073B
Gamma Coated 1073B
Gamma Uncoated 1073B
Electron-‐beam Coated 1073B
Electron-‐beam Uncoated 1073B
EO Coated 1059B
EO Uncoated 1059B
Steam Coated 1073B X65 X67
Steam Uncoated 1073B X69 X70
Dry Heat Coated 1073B
Low Temp. H2O2 Coated 1073B
Low Temp. C2H4O3 Coated 1073B
Gamma Coated 1059B
Electron-‐beam Coated 1059B
Form-‐Fill-‐Seal
X75 X71
X76
X66
X68
X78
Pouches and Bags
x74
X61
X77
Rigid Trays
X63
X73
X72
X64
X62
Table 2. Eighteen Cell Phantom Protocol Matrix
3
• 5-‐Year Accelerated Aging conditions were nominally 50 °C and 23% RH; aging times were calculated based on an ambient temperature of 25 °C, which is the nominal temperature for real-‐time aging
• Paired data sets (Transition Protocol material vs. Current Tyvek®) for each cell were generated and analyzed from the following tests:
o Seal Strength: ASTM F88 o Microbial Barrier: ASTM F2638 o Package Integrity: ASTM F1929 o Visual Inspection: ASTM F1886M (Only reported for Pre-‐sterilization and Post-‐sterilization time
points; no aging visual inspection results will be reported)
This Industry Summary Report summarizes the 5-‐Year Accelerated Aging data for all 78 cells. Industry Summary Reports for other aging time points will be published as data generation and analysis are completed. More detailed and comprehensive reports than Industry Summary Reports will be prepared and submitted to the U.S. FDA and other regulatory bodies under Confidentiality Agreements. After submission of the 1-‐Year Real-‐time Aging Report to the U.S. FDA, a letter affirming Functional Equivalence is expected (~3Q2015).
TESTING and RESULTS OVERVIEW
Data were analyzed for the three different attributes detailed in the approved study design for 5-‐Year Accelerated Aging: seal strength, microbial barrier, and package integrity. In the following sections, a brief overview of the study design and associated statistical methods is provided, followed by a high-‐level summary of the results.
It should be noted that for the Pre-‐sterilization and Post-‐sterilization time points, three sealing conditions across the sealing window were tested for both the Test Material (also called Test or Transition Protocol material) and the Control Material (also called Control or Current Tyvek®). These three sealing conditions were denoted as Lower, Nominal, and Upper sealing conditions. However, for accelerated and real-‐time aging time points, only one sealing condition across the sealing window was tested. This sealing condition was specified by the Medical Device Manufacturers (“MDMs”) for each cell, and was based on the sealing condition used by the MDMs for their original stability testing during package qualification.
For the majority of cells, test packages for aging time points were manufactured with Nominal sealing conditions, while Lower sealing conditions were used for the remainder. No Upper sealing conditions were used for any aging time points.
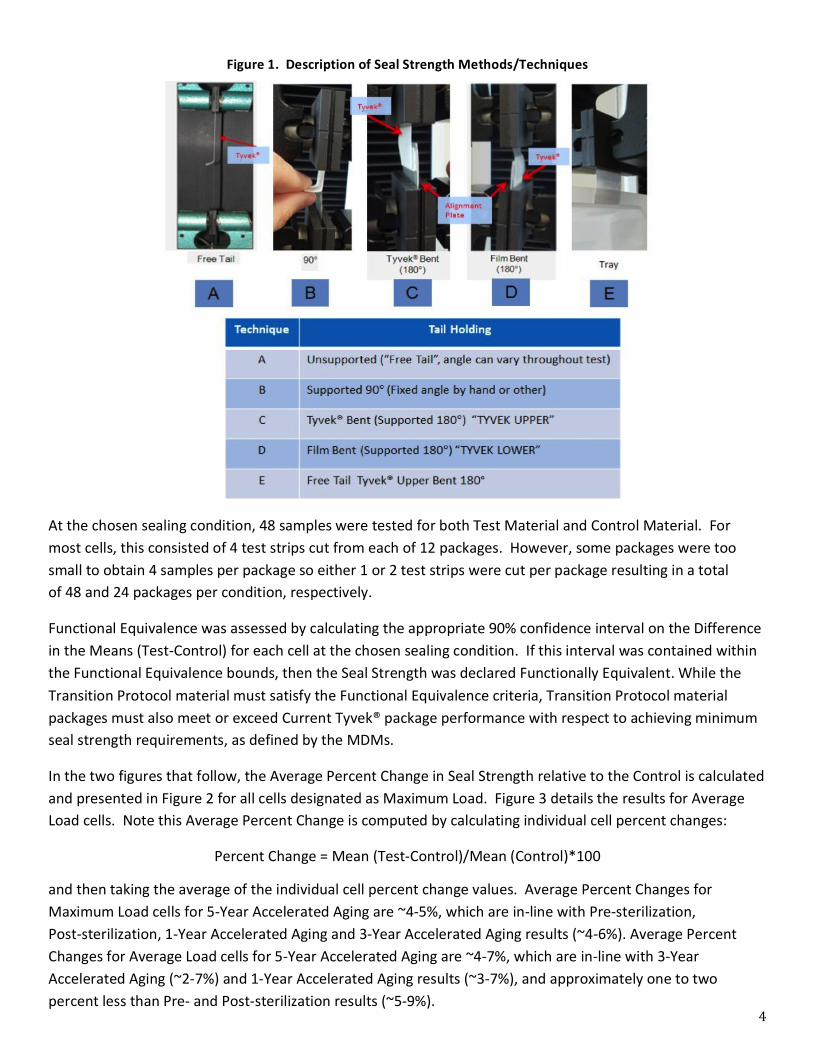
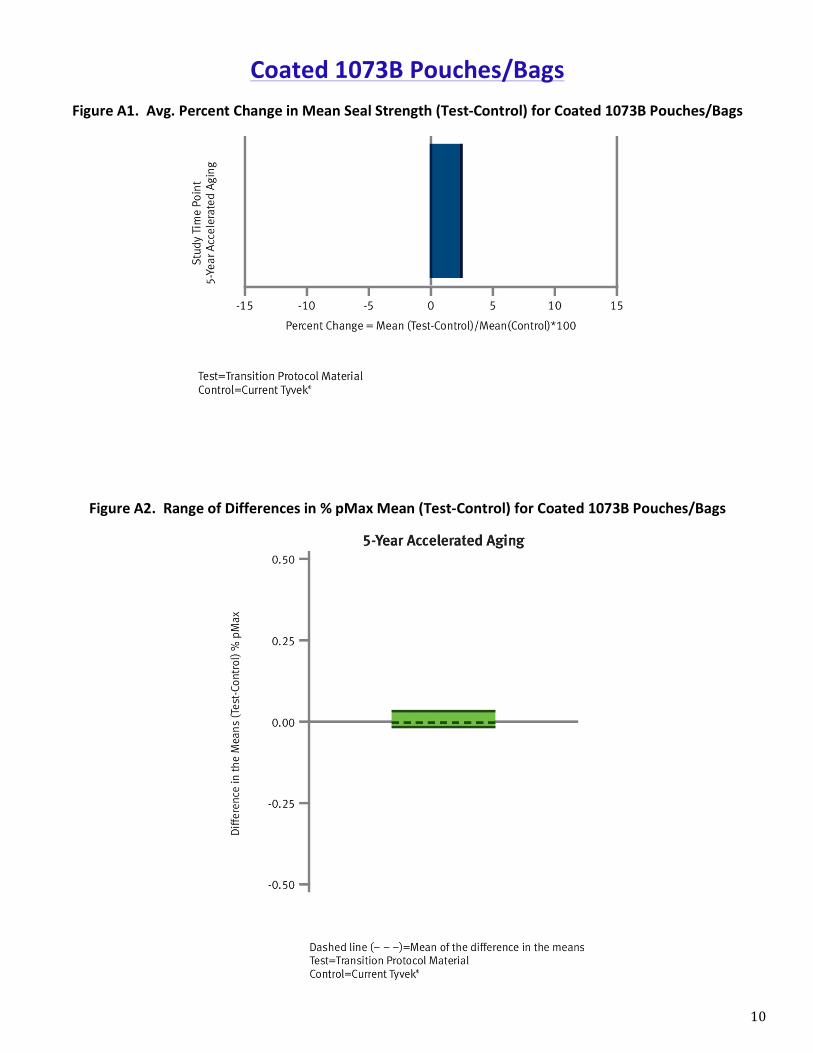
Seal Strength (ASTM F88) Seal strength was assessed via ASTM F88 in accordance with metric details specified by the MDMs. These metric details include a designation of either Maximum Load or Average Load as the response, as well as the testing apparatus/material orientation used. See Figure 1 for a visual description of the different seal strength methods/techniques employed in the study.
4
Figure 1. Description of Seal Strength Methods/Techniques
At the chosen sealing condition, 48 samples were tested for both Test Material and Control Material. For most cells, this consisted of 4 test strips cut from each of 12 packages. However, some packages were too small to obtain 4 samples per package so either 1 or 2 test strips were cut per package resulting in a total of 48 and 24 packages per condition, respectively.
Functional Equivalence was assessed by calculating the appropriate 90% confidence interval on the Difference in the Means (Test-‐Control) for each cell at the chosen sealing condition. If this interval was contained within the Functional Equivalence bounds, then the Seal Strength was declared Functionally Equivalent. While the Transition Protocol material must satisfy the Functional Equivalence criteria, Transition Protocol material packages must also meet or exceed Current Tyvek® package performance with respect to achieving minimum seal strength requirements, as defined by the MDMs.
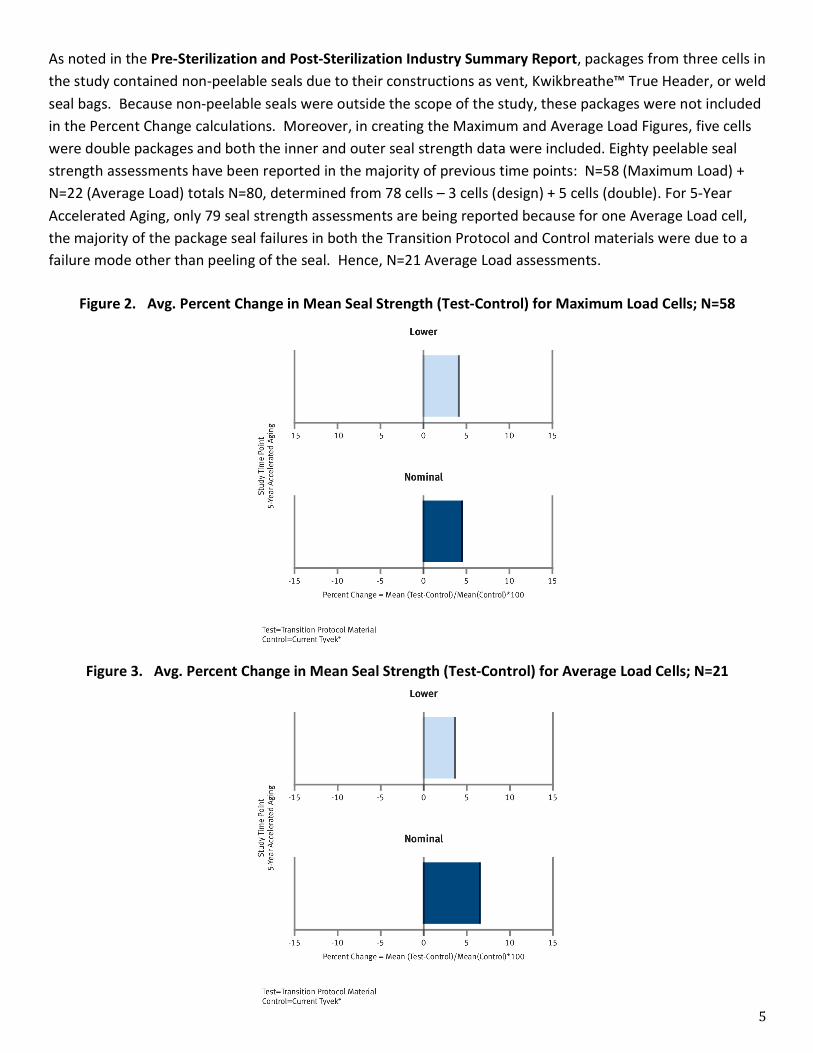
In the two figures that follow, the Average Percent Change in Seal Strength relative to the Control is calculated and presented in Figure 2 for all cells designated as Maximum Load. Figure 3 details the results for Average Load cells. Note this Average Percent Change is computed by calculating individual cell percent changes:
Percent Change = Mean (Test-‐Control)/Mean (Control)*100
and then taking the average of the individual cell percent change values. Average Percent Changes for Maximum Load cells for 5-‐Year Accelerated Aging are ~4-‐5%, which are in-‐line with Pre-‐sterilization, Post-‐sterilization, 1-‐Year Accelerated Aging and 3-‐Year Accelerated Aging results (~4-‐6%). Average Percent Changes for Average Load cells for 5-‐Year Accelerated Aging are ~4-‐7%, which are in-‐line with 3-‐Year Accelerated Aging (~2-‐7%) and 1-‐Year Accelerated Aging results (~3-‐7%), and approximately one to two percent less than Pre-‐ and Post-‐sterilization results (~5-‐9%).
5
As noted in the Pre-‐Sterilization and Post-‐Sterilization Industry Summary Report, packages from three cells in the study contained non-‐peelable seals due to their constructions as vent, Kwikbreathe™ True Header, or weld seal bags. Because non-‐peelable seals were outside the scope of the study, these packages were not included in the Percent Change calculations. Moreover, in creating the Maximum and Average Load Figures, five cells were double packages and both the inner and outer seal strength data were included. Eighty peelable seal strength assessments have been reported in the majority of previous time points: N=58 (Maximum Load) + N=22 (Average Load) totals N=80, determined from 78 cells – 3 cells (design) + 5 cells (double). For 5-‐Year Accelerated Aging, only 79 seal strength assessments are being reported because for one Average Load cell, the majority of the package seal failures in both the Transition Protocol and Control materials were due to a failure mode other than peeling of the seal. Hence, N=21 Average Load assessments.
Figure 2. Avg. Percent Change in Mean Seal Strength (Test-‐Control) for Maximum Load Cells; N=58
Figure 3. Avg. Percent Change in Mean Seal Strength (Test-‐Control) for Average Load Cells; N=21
6
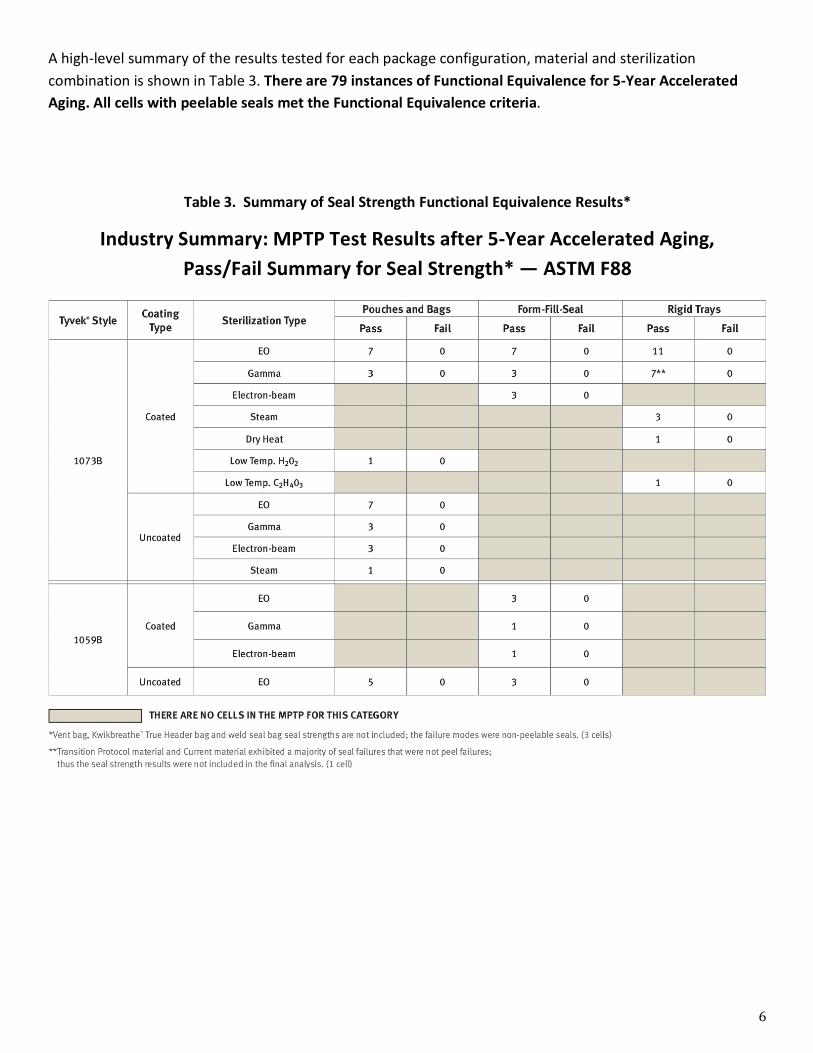
A high-‐level summary of the results tested for each package configuration, material and sterilization combination is shown in Table 3. There are 79 instances of Functional Equivalence for 5-‐Year Accelerated Aging. All cells with peelable seals met the Functional Equivalence criteria.
Table 3. Summary of Seal Strength Functional Equivalence Results*
Industry Summary: MPTP Test Results after 5-‐Year Accelerated Aging, Pass/Fail Summary for Seal Strength* — ASTM F88
7
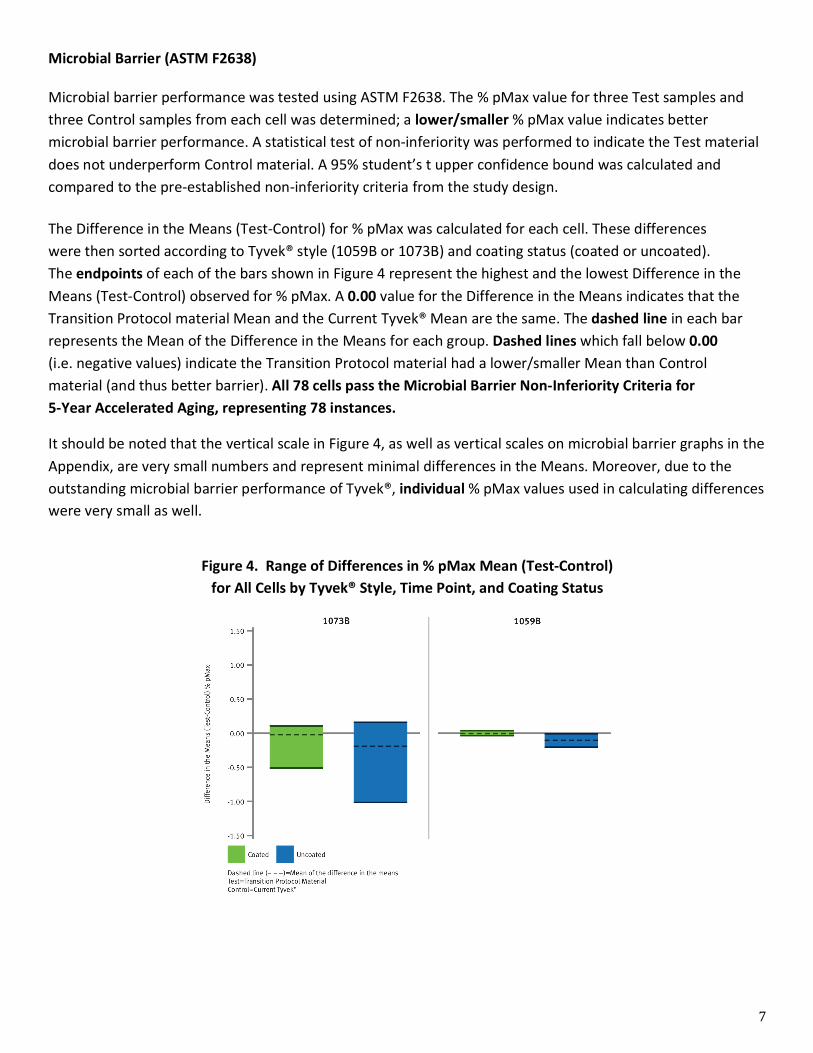
Microbial Barrier (ASTM F2638) Microbial barrier performance was tested using ASTM F2638. The % pMax value for three Test samples and three Control samples from each cell was determined; a lower/smaller % pMax value indicates better microbial barrier performance. A statistical test of non-‐inferiority was performed to indicate the Test material does not underperform Control material. A 95% student’s t upper confidence bound was calculated and compared to the pre-‐established non-‐inferiority criteria from the study design. The Difference in the Means (Test-‐Control) for % pMax was calculated for each cell. These differences were then sorted according to Tyvek® style (1059B or 1073B) and coating status (coated or uncoated). The endpoints of each of the bars shown in Figure 4 represent the highest and the lowest Difference in the Means (Test-‐Control) observed for % pMax. A 0.00 value for the Difference in the Means indicates that the Transition Protocol material Mean and the Current Tyvek® Mean are the same. The dashed line in each bar represents the Mean of the Difference in the Means for each group. Dashed lines which fall below 0.00 (i.e. negative values) indicate the Transition Protocol material had a lower/smaller Mean than Control material (and thus better barrier). All 78 cells pass the Microbial Barrier Non-‐Inferiority Criteria for 5-‐Year Accelerated Aging, representing 78 instances.
It should be noted that the vertical scale in Figure 4, as well as vertical scales on microbial barrier graphs in the Appendix, are very small numbers and represent minimal differences in the Means. Moreover, due to the outstanding microbial barrier performance of Tyvek®, individual % pMax values used in calculating differences were very small as well.
Figure 4. Range of Differences in % pMax Mean (Test-‐Control) for All Cells by Tyvek® Style, Time Point, and Coating Status
8
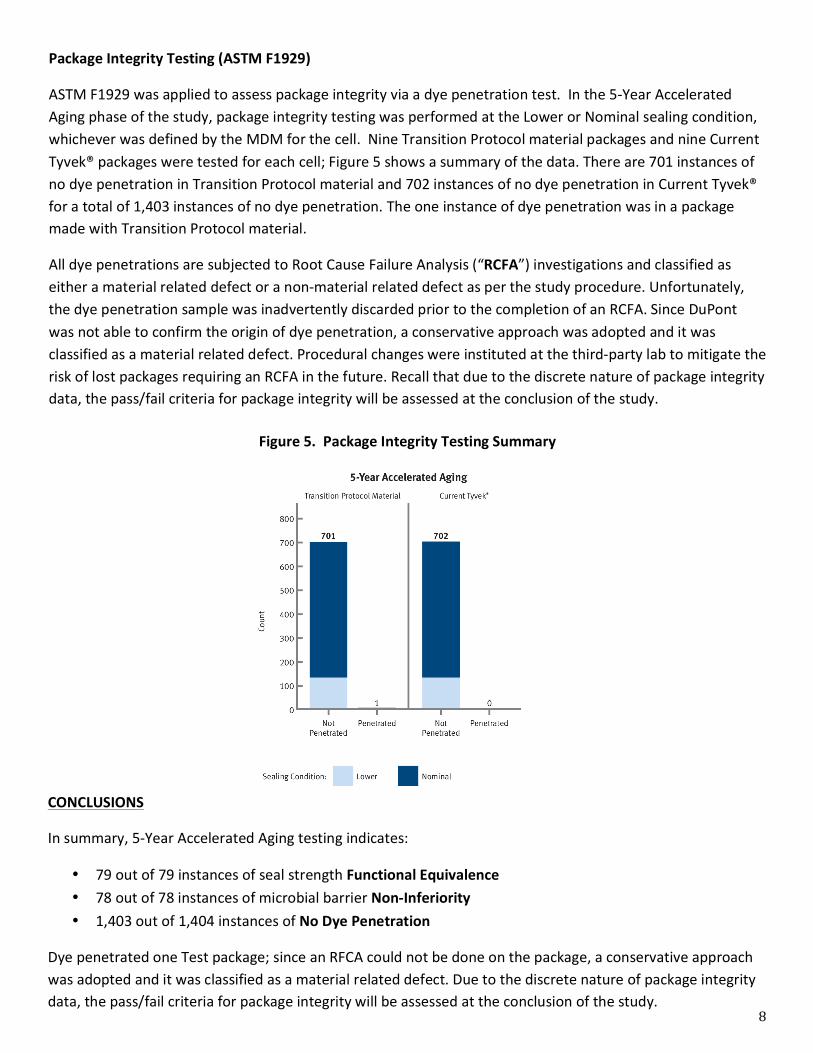
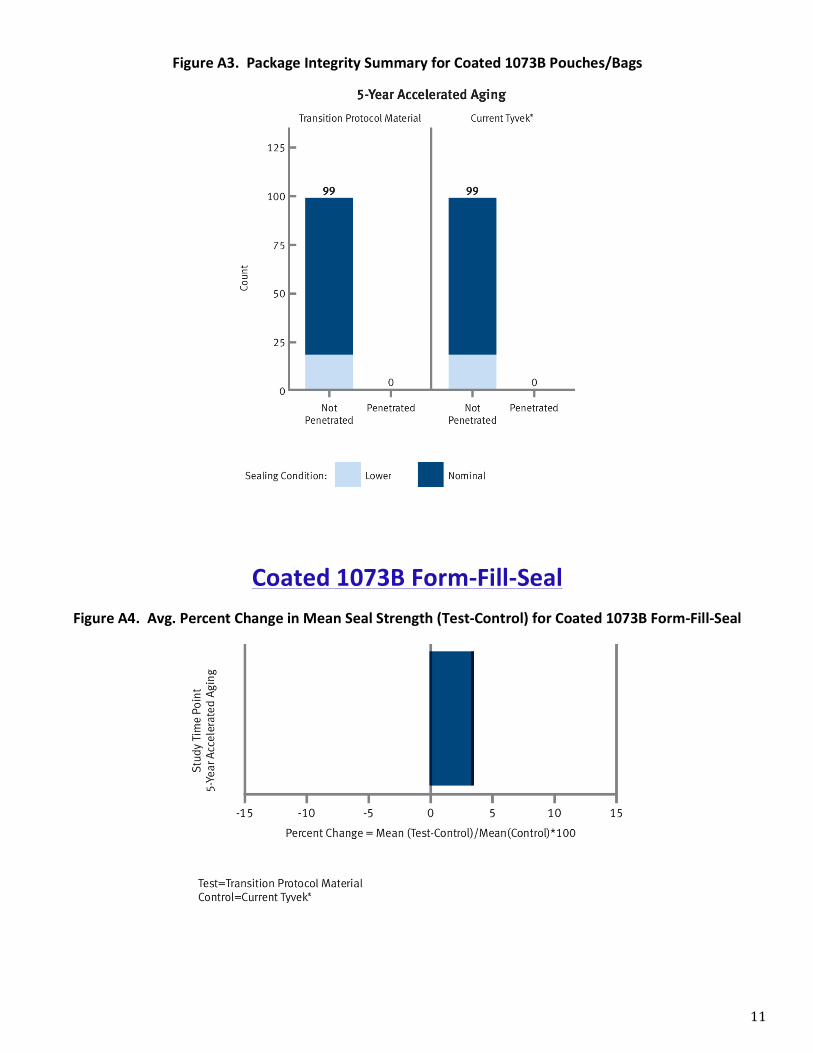
Package Integrity Testing (ASTM F1929)
ASTM F1929 was applied to assess package integrity via a dye penetration test. In the 5-‐Year Accelerated Aging phase of the study, package integrity testing was performed at the Lower or Nominal sealing condition, whichever was defined by the MDM for the cell. Nine Transition Protocol material packages and nine Current Tyvek® packages were tested for each cell; Figure 5 shows a summary of the data. There are 701 instances of no dye penetration in Transition Protocol material and 702 instances of no dye penetration in Current Tyvek® for a total of 1,403 instances of no dye penetration. The one instance of dye penetration was in a package made with Transition Protocol material.
All dye penetrations are subjected to Root Cause Failure Analysis (“RCFA”) investigations and classified as either a material related defect or a non-‐material related defect as per the study procedure. Unfortunately, the dye penetration sample was inadvertently discarded prior to the completion of an RCFA. Since DuPont was not able to confirm the origin of dye penetration, a conservative approach was adopted and it was classified as a material related defect. Procedural changes were instituted at the third-‐party lab to mitigate the risk of lost packages requiring an RCFA in the future. Recall that due to the discrete nature of package integrity data, the pass/fail criteria for package integrity will be assessed at the conclusion of the study.
Figure 5. Package Integrity Testing Summary
CONCLUSIONS
In summary, 5-‐Year Accelerated Aging testing indicates:
• 79 out of 79 instances of seal strength Functional Equivalence • 78 out of 78 instances of microbial barrier Non-‐Inferiority • 1,403 out of 1,404 instances of No Dye Penetration
Dye penetrated one Test package; since an RFCA could not be done on the package, a conservative approach was adopted and it was classified as a material related defect. Due to the discrete nature of package integrity data, the pass/fail criteria for package integrity will be assessed at the conclusion of the study.
9
APPENDIX A: CATEGORY RESULTS
5-‐Year Accelerated Aging overall testing results were presented in the previous section. Appendix A presents the data in a different format, i.e. by category, where it is broken down in further detail to help facilitate industry risk assessments. As evaluations are done, be cognizant of the number of cells represented by each Figure.
A set of 5-‐Year Accelerated Aging Seal Strength, Microbial Barrier and Package Integrity results are shown for each of the following categories:
• Coated 1073B Pouches/Bags • Coated 1073B Form-‐Fill-‐Seal • Coated 1073B Lids/Rigid Trays • Uncoated 1073B Pouches/Bags • Coated 1059B Form-‐Fill-‐Seal • Uncoated 1059B Pouches/Bags • Uncoated 1059B Form-‐Fill-‐Seal
10
Figure A1. Avg. Percent Change in Mean Seal Strength (Test-‐Control) for Coated 1073B Pouches/Bags
Coated 1073B Pouches/Bags
Figure A2. Range of Differences in % pMax Mean (Test-‐Control) for Coated 1073B Pouches/Bags
11
Figure A3. Package Integrity Summary for Coated 1073B Pouches/Bags
Coated 1073B Form-‐Fill-‐Seal Figure A4. Avg. Percent Change in Mean Seal Strength (Test-‐Control) for Coated 1073B Form-‐Fill-‐Seal
12
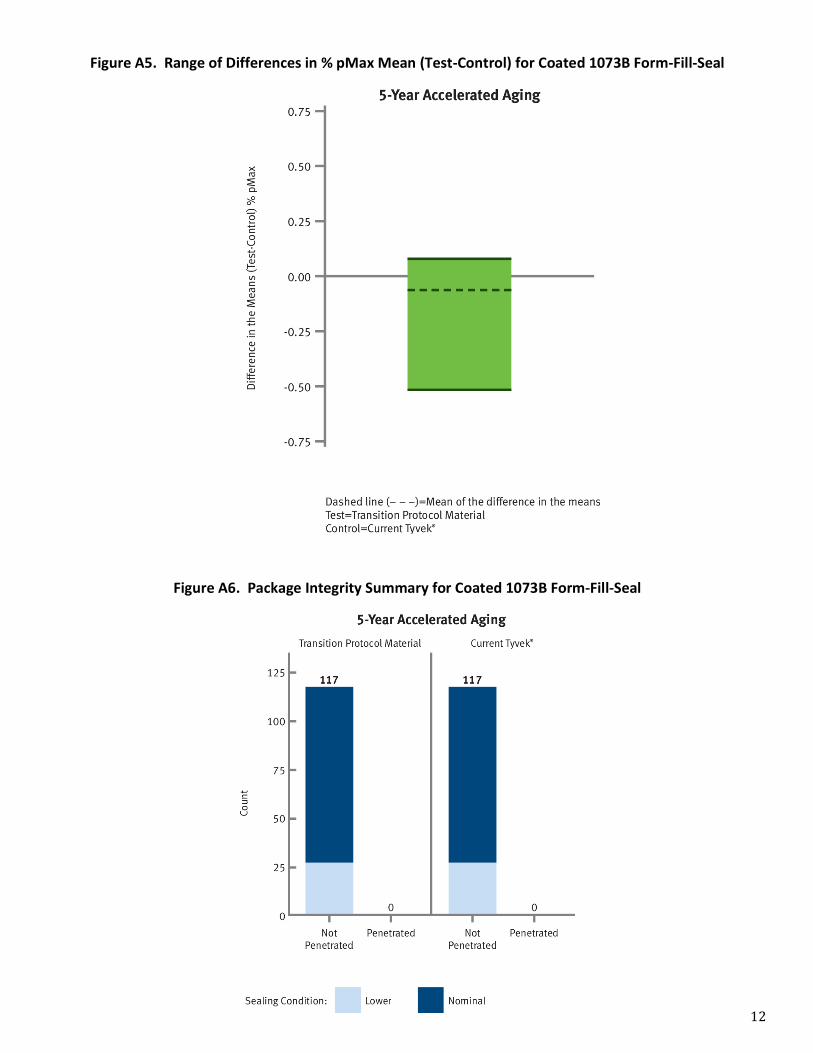
Figure A5. Range of Differences in % pMax Mean (Test-‐Control) for Coated 1073B Form-‐Fill-‐Seal
Figure A6. Package Integrity Summary for Coated 1073B Form-‐Fill-‐Seal
13
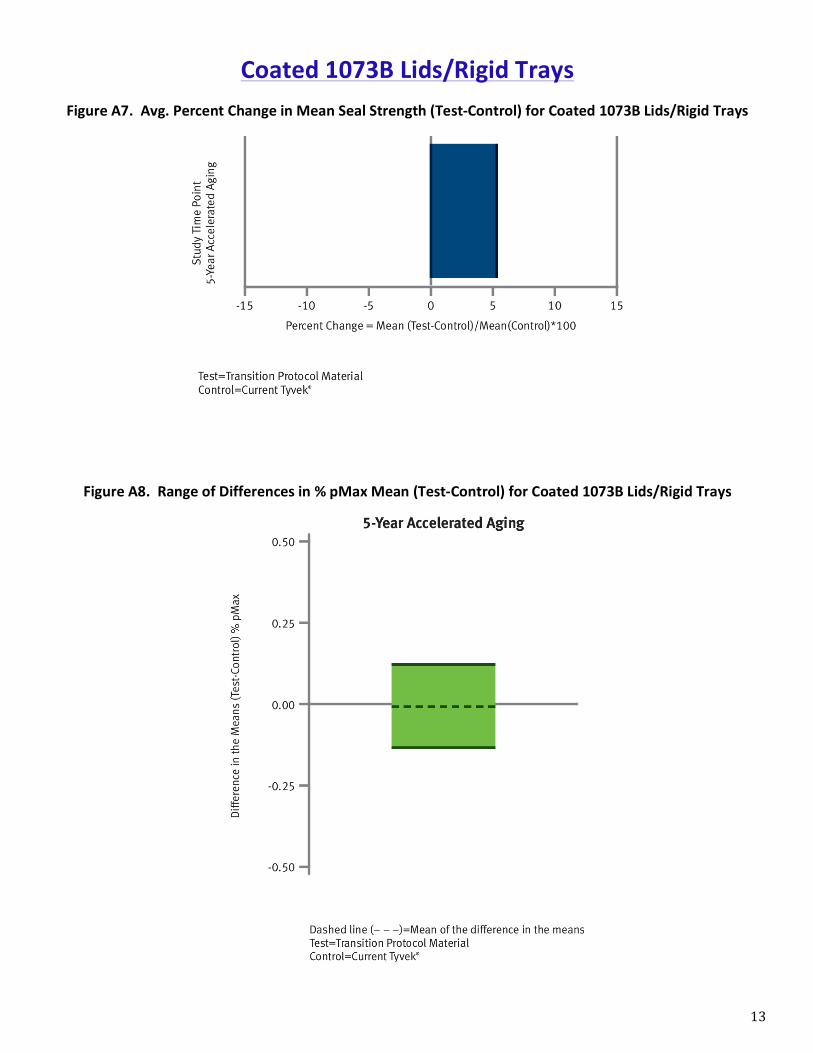
Coated 1073B Lids/Rigid Trays Figure A7. Avg. Percent Change in Mean Seal Strength (Test-‐Control) for Coated 1073B Lids/Rigid Trays
Figure A8. Range of Differences in % pMax Mean (Test-‐Control) for Coated 1073B Lids/Rigid Trays
14
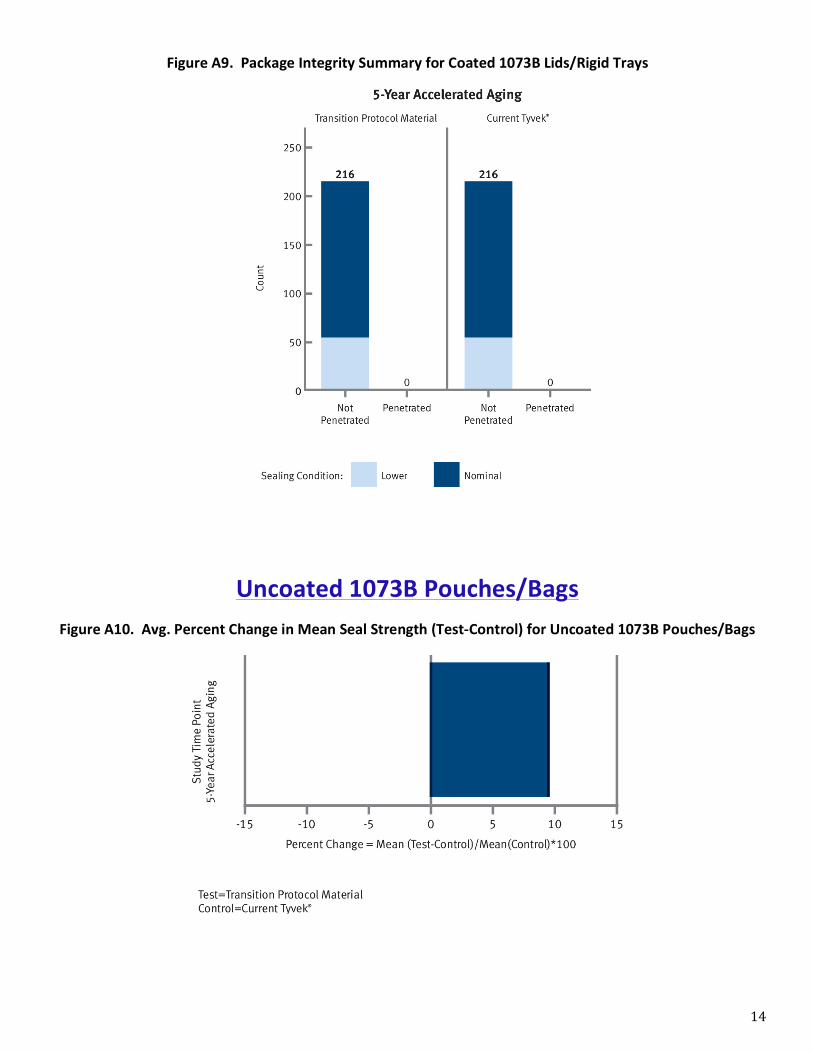
Figure A9. Package Integrity Summary for Coated 1073B Lids/Rigid Trays
Uncoated 1073B Pouches/Bags Figure A10. Avg. Percent Change in Mean Seal Strength (Test-‐Control) for Uncoated 1073B Pouches/Bags
15
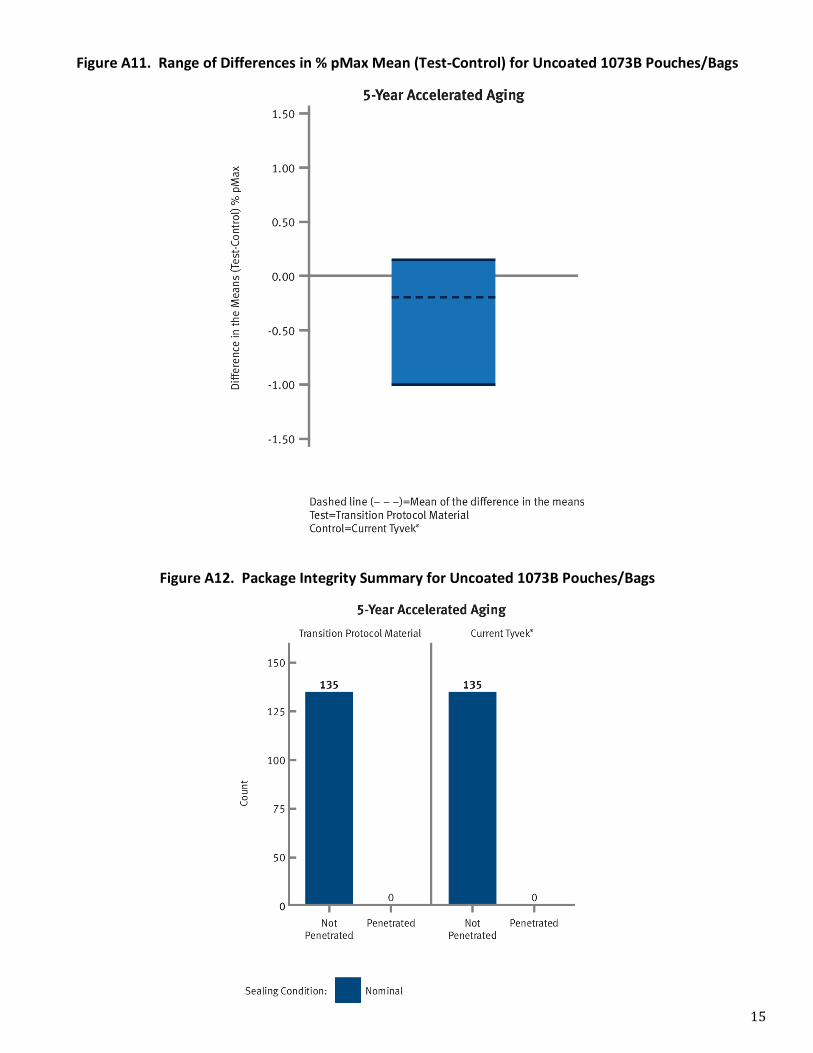
Figure A11. Range of Differences in % pMax Mean (Test-‐Control) for Uncoated 1073B Pouches/Bags
Figure A12. Package Integrity Summary for Uncoated 1073B Pouches/Bags
16
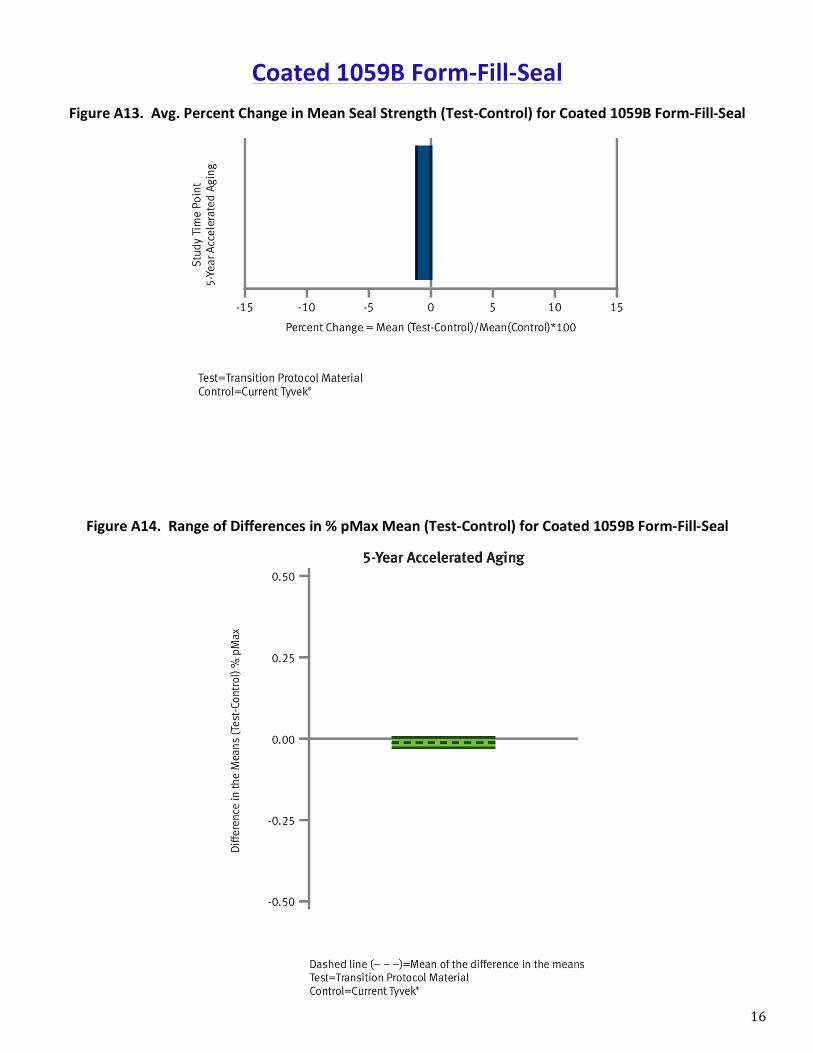
Coated 1059B Form-‐Fill-‐Seal Figure A13. Avg. Percent Change in Mean Seal Strength (Test-‐Control) for Coated 1059B Form-‐Fill-‐Seal
Figure A14. Range of Differences in % pMax Mean (Test-‐Control) for Coated 1059B Form-‐Fill-‐Seal
17
Uncoated 1059B Pouches/Bags
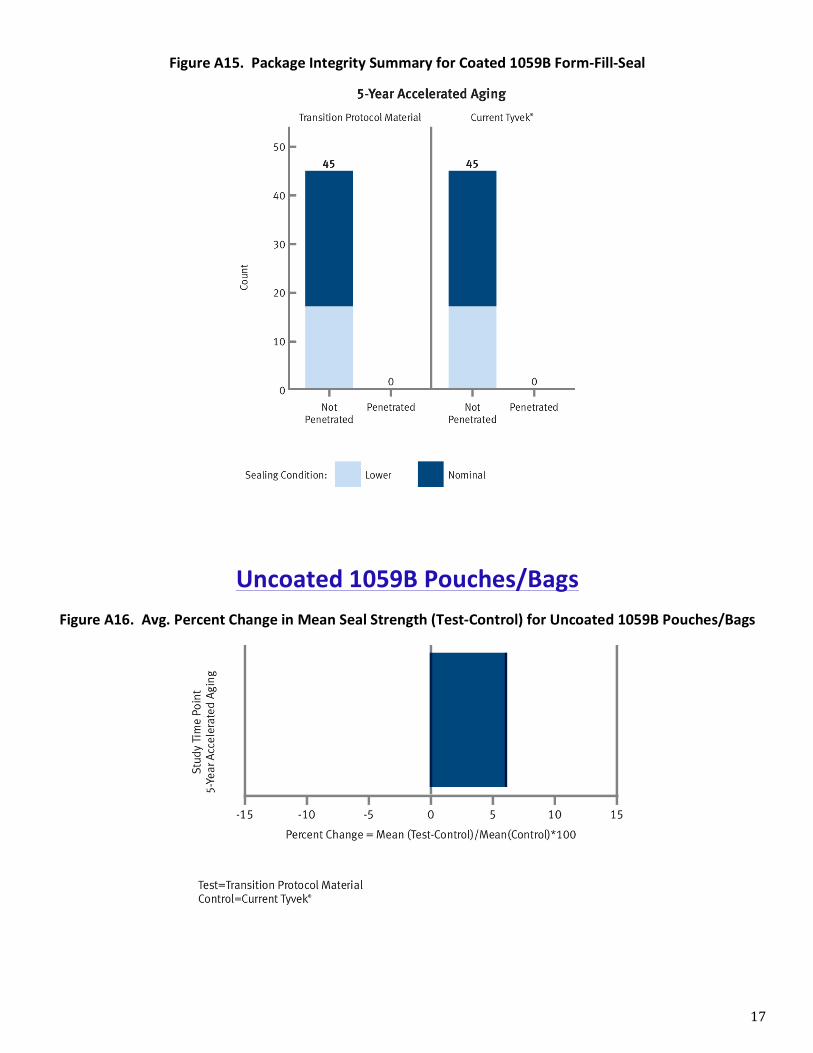
Figure A15. Package Integrity Summary for Coated 1059B Form-‐Fill-‐Seal
Figure A16. Avg. Percent Change in Mean Seal Strength (Test-‐Control) for Uncoated 1059B Pouches/Bags
18
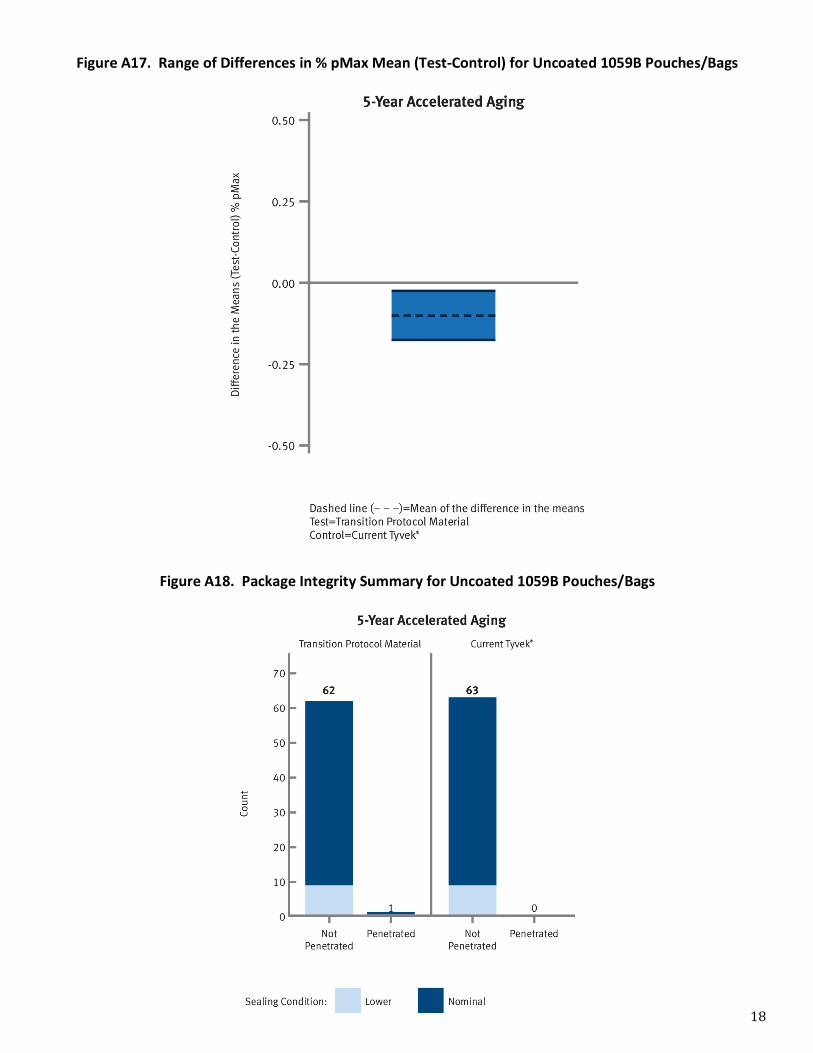
Figure A17. Range of Differences in % pMax Mean (Test-‐Control) for Uncoated 1059B Pouches/Bags
Figure A18. Package Integrity Summary for Uncoated 1059B Pouches/Bags
19
Uncoated 1059B Form-‐Fill-‐Seal
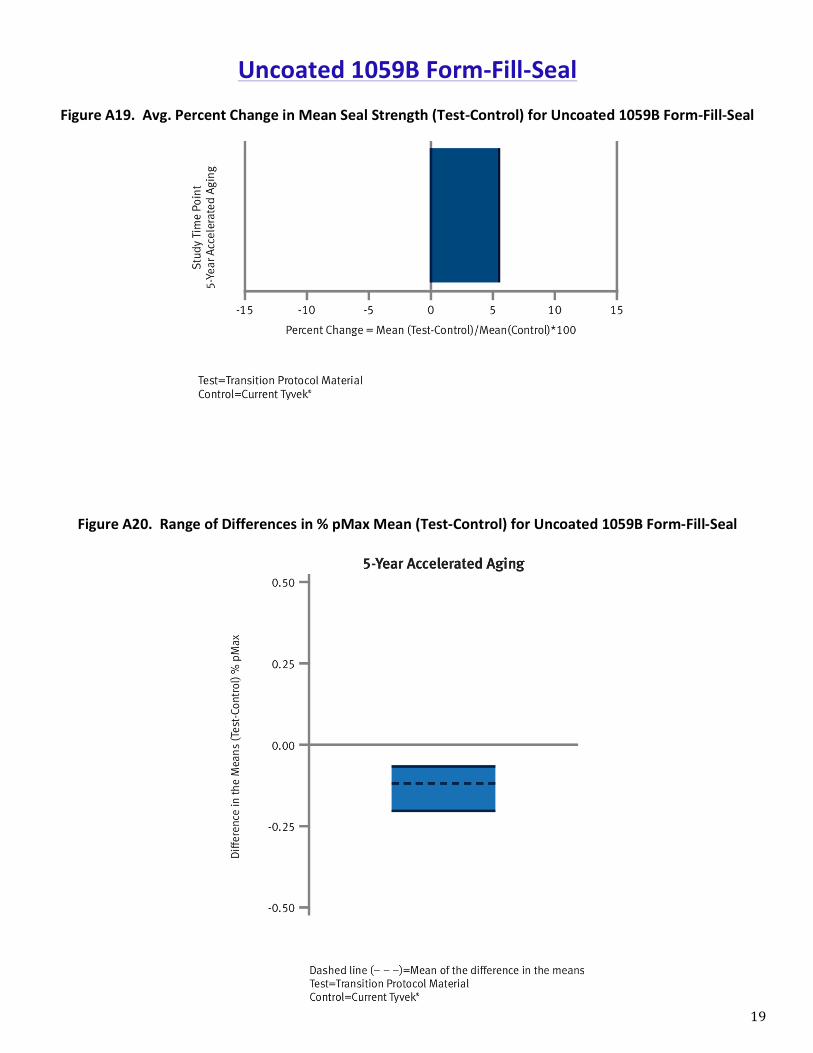
Figure A19. Avg. Percent Change in Mean Seal Strength (Test-‐Control) for Uncoated 1059B Form-‐Fill-‐Seal
Figure A20. Range of Differences in % pMax Mean (Test-‐Control) for Uncoated 1059B Form-‐Fill-‐Seal
20
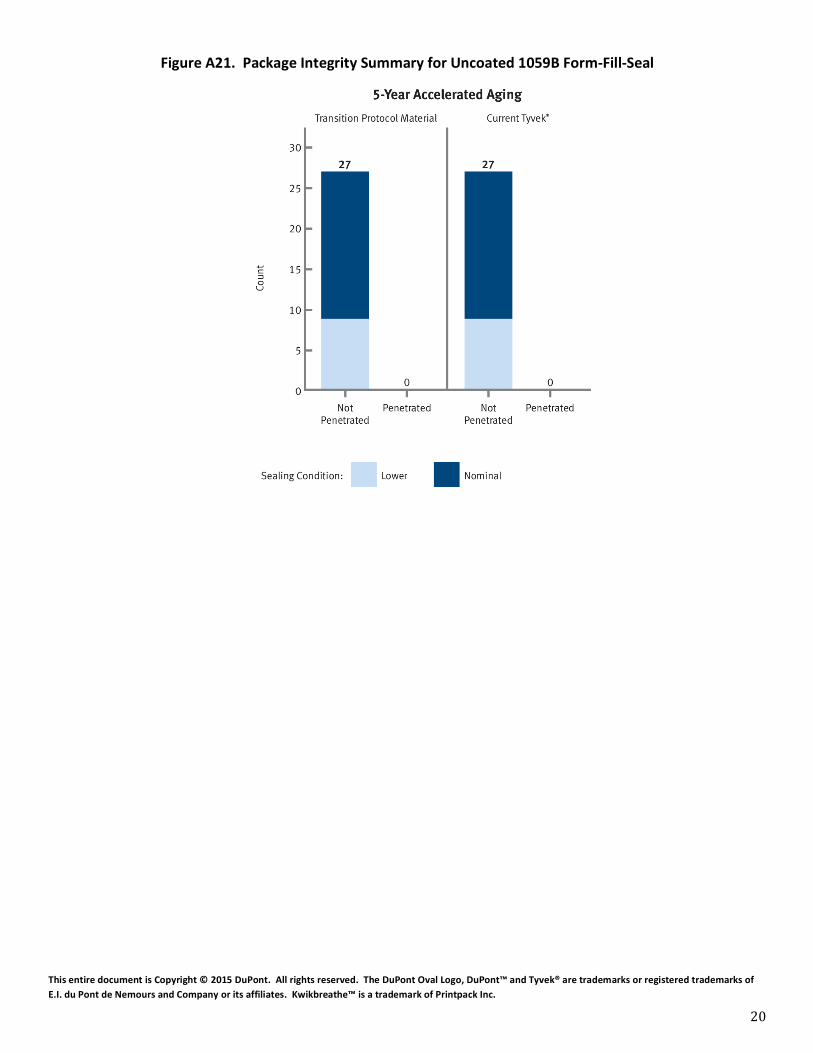
Figure A21. Package Integrity Summary for Uncoated 1059B Form-‐Fill-‐Seal
This entire document is Copyright © 2015 DuPont. All rights reserved. The DuPont Oval Logo, DuPont™ and Tyvek® are trademarks or registered trademarks of E.I. du Pont de Nemours and Company or its affiliates. Kwikbreathe™ is a trademark of Printpack Inc.