dunkirk lenton - nottingham and... · nch environmental total amount allocated this period £26,552...
TRANSCRIPT

Dunkirk
and
1
and
Lenton
Area Committee
Report
Unofficial December 2013
Data
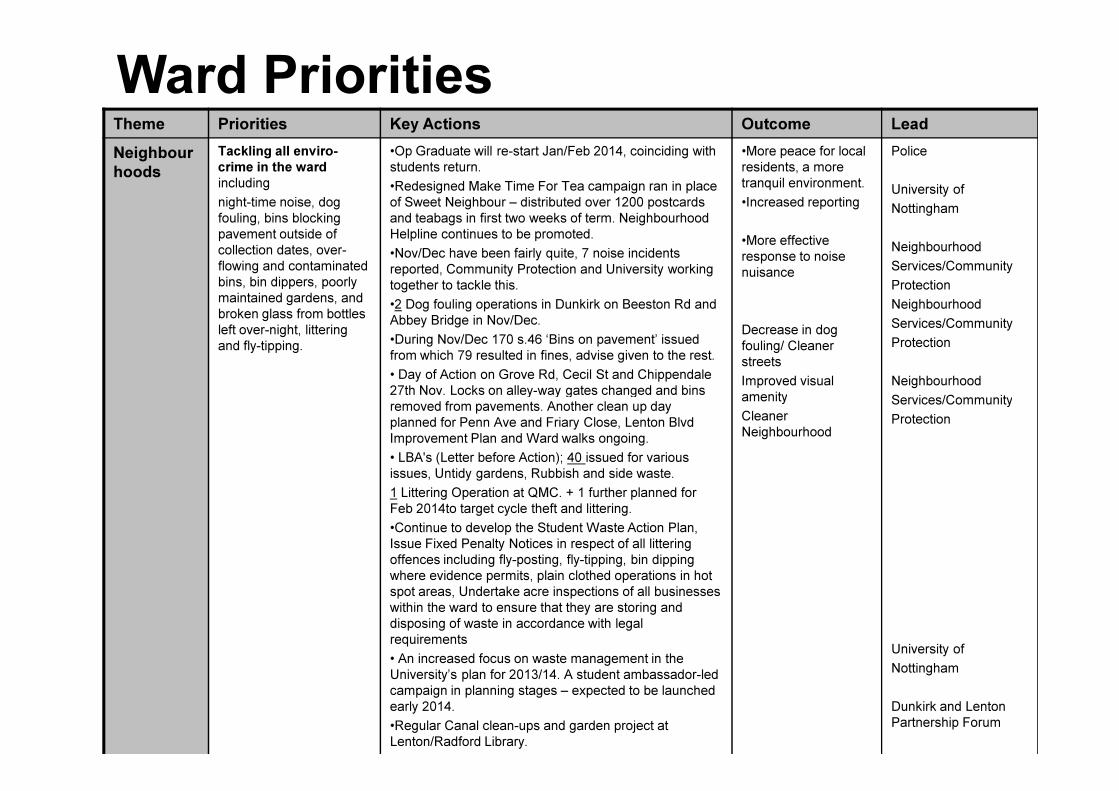
Ward PrioritiesTheme Priorities Key Actions Outcome Lead
Neighbour
hoods
Tackling all enviro-
crime in the ward
including
night-time noise, dog
fouling, bins blocking
pavement outside of
collection dates, over-
flowing and contaminated
bins, bin dippers, poorly
maintained gardens, and
broken glass from bottles
left over-night, littering
and fly-tipping.
•Op Graduate will re-start Jan/Feb 2014, coinciding with
students return.
•Redesigned Make Time For Tea campaign ran in place
of Sweet Neighbour – distributed over 1200 postcards
and teabags in first two weeks of term. Neighbourhood
Helpline continues to be promoted.
•Nov/Dec have been fairly quite, 7 noise incidents
reported, Community Protection and University working
together to tackle this.
•2 Dog fouling operations in Dunkirk on Beeston Rd and
Abbey Bridge in Nov/Dec.
•During Nov/Dec 170 s.46 ‘Bins on pavement’ issued
from which 79 resulted in fines, advise given to the rest.
• Day of Action on Grove Rd, Cecil St and Chippendale
27th Nov. Locks on alley-way gates changed and bins
•More peace for local
residents, a more
tranquil environment.
•Increased reporting
•More effective
response to noise
nuisance
Decrease in dog
fouling/ Cleaner
streets
Improved visual
amenity
Police
University of
Nottingham
Neighbourhood
Services/Community
Protection
Neighbourhood
Services/Community
Protection
Neighbourhood
Services/Community27th Nov. Locks on alley-way gates changed and bins
removed from pavements. Another clean up day
planned for Penn Ave and Friary Close, Lenton Blvd
Improvement Plan and Ward walks ongoing.
• LBA's (Letter before Action); 40 issued for various
issues, Untidy gardens, Rubbish and side waste.
1 Littering Operation at QMC. + 1 further planned for
Feb 2014to target cycle theft and littering.
•Continue to develop the Student Waste Action Plan,
Issue Fixed Penalty Notices in respect of all littering
offences including fly-posting, fly-tipping, bin dipping
where evidence permits, plain clothed operations in hot
spot areas, Undertake acre inspections of all businesses
within the ward to ensure that they are storing and
disposing of waste in accordance with legal
requirements
• An increased focus on waste management in the
University’s plan for 2013/14. A student ambassador-led
campaign in planning stages – expected to be launched
early 2014.
•Regular Canal clean-ups and garden project at
Lenton/Radford Library.
amenity
Cleaner
Neighbourhood
Services/Community
Protection
University of
Nottingham
Dunkirk and Lenton
Partnership Forum

Theme Priorities Key Actions Outcome Lead
Safer Reduce
burglaries
Cycling on
pavement
•In 2013/14 Op Country will be replaced by Op Graduate,
greater resource will be supplied by the division and micro-beat
patrolling system used
•Love Your Stuff to re-start end of Jan 2014, previously 356
properties engaged. Members of staff have gone out on patrol
with Police working Op Graduate.
•Awareness campaign of keeping properties safe, highlighting
necessity of locking UPVC doors.
•2 Cycling on Pavement Operations on Montpellier Rd and
Abbey Bridge.Outcome 5 Cycling Traffic Offence Notices given
and 9 warnings.
•Currently working on a student-led project on cycling, launch
possibly New Year.
•Cycling signs reviewed in Aug, exploring funding options
•Create links between new green spaces to making
cycling/walking a safer and pleasant experience- determining
route and exploring funding options
Higher profile operation
leading to decrease in
burglary and increase in
confidence.
Increased presence will
have positive effect on ASB
in New Lenton.
Reduction in incidents
Safer environment for
pedestrian
Improved
walking/cycling/cohesion
Creation of a green corridor
between Lenton flats
site /Sandfield across
to Radford and canal
Police
University of
Nottingham
Community Protection
Neighbourhood
Services
Community Protection
University of
Nottingham
Cycling Strategy Officer
DLPF
Health Lack of local •Changes in Health Promotion team, now have City-wide focus, Improved health Decade of better Health Lack of local
accessible
shops selling
fresh fruit and
vegetables
Promoting
positive mental
health
•Changes in Health Promotion team, now have City-wide focus,
not locality.Healthy eating and cooking taster session at Dunkirk
Community Centre, 15 residents participated in Nov.
•Ongoing, Ecoworks boxes available for collection from DLPF
•On-going, Student Services at the University offers a wide
range of support for the mental health of students
•On-going,Tommys, Crocus café/gallery
Improved health
Reduction in Obesity
Increased cookery skills
Reduction in CVD and
diabetics
Improved cohesion
Reducing isolation
Decade of better
Health
DLPF
University of
Nottingham
Voluntary Organisation
Work Communication
strategy for
employment
opportunities
•Weekly Job and Apprenticeships vacancies sent to DLPF
•Suggestions to support Dunkirk Comm Centre & Thomas
Always Baptist Church to provide employment support
Visited 40 businesses in the ward to give information on
incentives of Nottingham Jobs Fund and Apprentice Grant .
Increase of employment in
area
Employment & Skills
Team
DLPF
NDO
Family Better use of
local venues
•Parks events during summer hols of 2013. Attendance was
sporadic and dropped off from Sept ’13. Decision made in Dec
13 to cease sessions due to dark nights and bad weather.
• Penn Ave sessions have also ceased due to low attendance
•Options for delivering at DComm Centre not pursued due to low
numbers of children in the area. Instead supporting TLC on
Weds eves and are targeting local C&YP in the development of
sessions run from there. Activ8th continues regularly.
More access to activity.
Activity is more visible in
community
Family and Community
Activ8th

Area/Estate Date/Time Meeting Point
Penn Avenue area Tue 14th Jan 2014, 10.30am to 12pm Penn Ave Car park
Hillside and QMC Tue 11th Feb 2014,10.30am to 12pm Hillside shops
Lenton High-rise flats/Lenton Blvd Tue 11th March 2014, 10.30am to 12pm Church Square Lenton
Dunkirk and Abbey Bridge Tue 8th April 2014, 10.30am to 12pm Dunkirk Community Centre
Community EngagementWard Walks
Community Meetings
Group Date Venue
Lenton Community meeting 28th Feb 2014, 5.30pm to 7.00pm Thomas Helwys Baptist Church
NAG Meeting 26th Feb 2014, 6.30pm Rose and Crown Pub, Derby Rd
Dunkirk Community meeting Wednesday 26th March 2014 Dunkirk Community Centre
Community Meetings
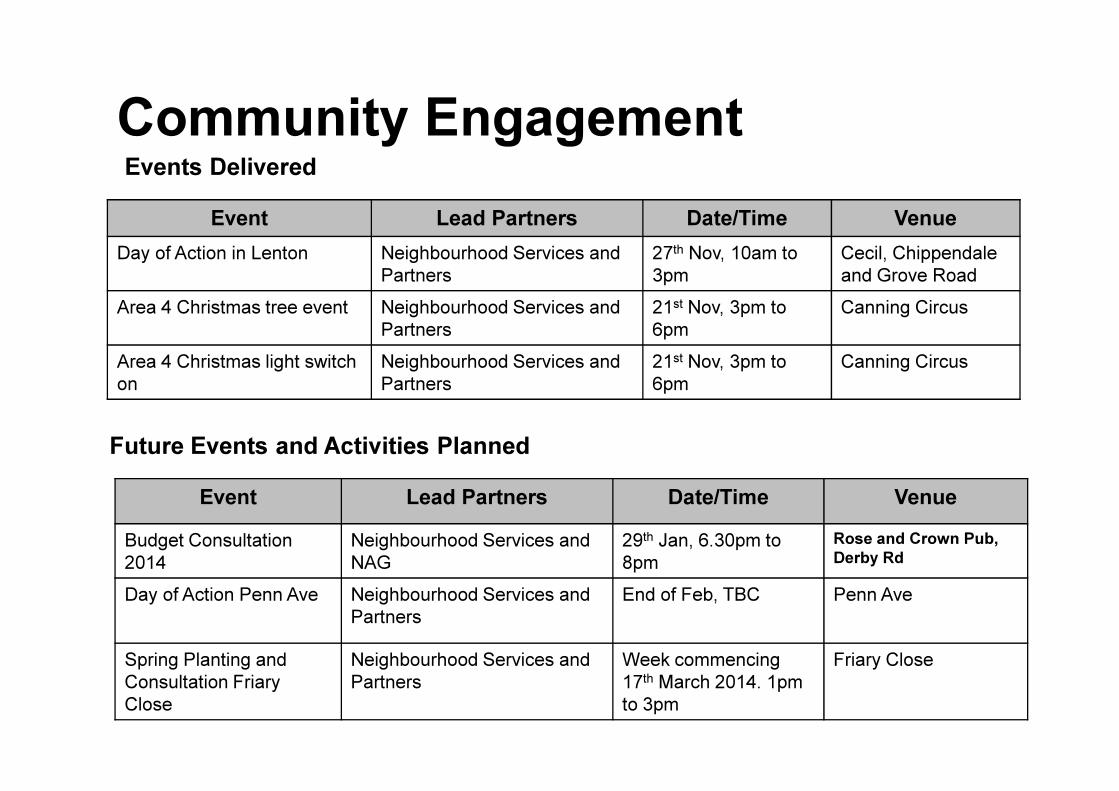
Event Lead Partners Date/Time Venue
Day of Action in Lenton Neighbourhood Services and
Partners
27th Nov, 10am to
3pm
Cecil, Chippendale
and Grove Road
Area 4 Christmas tree event Neighbourhood Services and
Partners
21st Nov, 3pm to
6pm
Canning Circus
Area 4 Christmas light switch
on
Neighbourhood Services and
Partners
21st Nov, 3pm to
6pm
Canning Circus
Community EngagementEvents Delivered
Event Lead Partners Date/Time Venue
Budget Consultation
2014
Neighbourhood Services and
NAG
29th Jan, 6.30pm to
8pm
Rose and Crown Pub,
Derby Rd
Day of Action Penn Ave Neighbourhood Services and
Partners
End of Feb, TBC Penn Ave
Spring Planting and
Consultation Friary
Close
Neighbourhood Services and
Partners
Week commencing
17th March 2014. 1pm
to 3pm
Friary Close
Future Events and Activities Planned
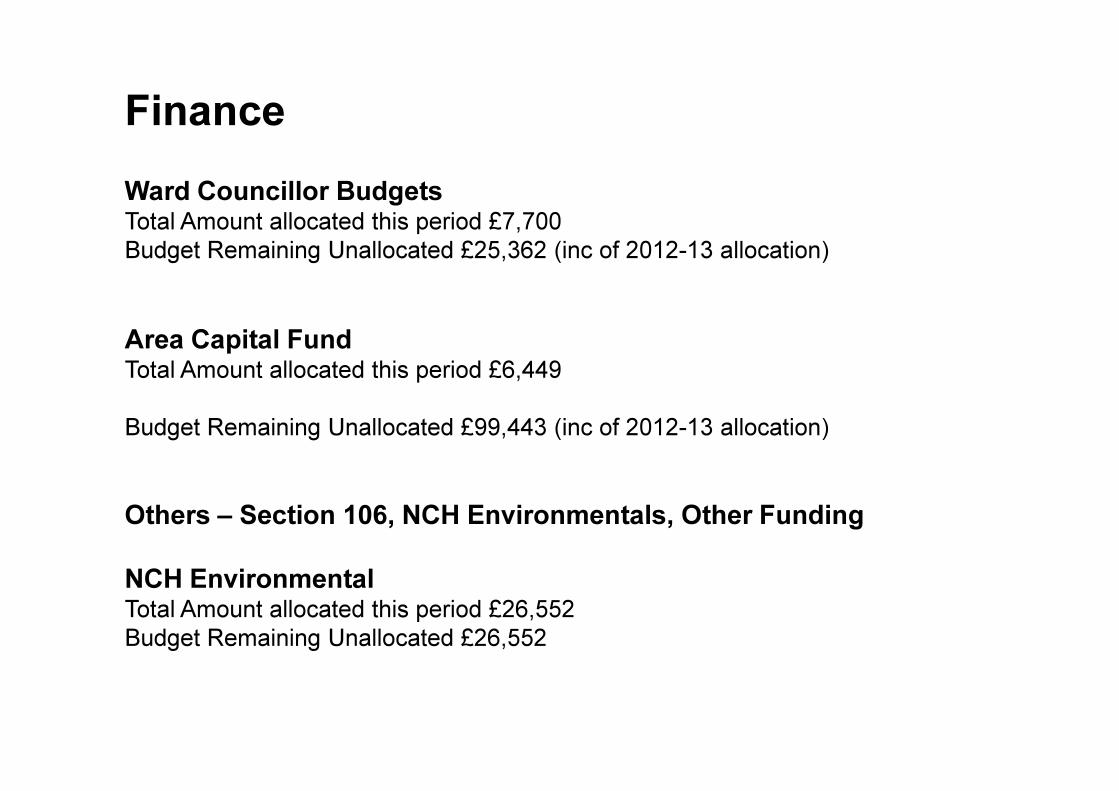
Finance
Ward Councillor BudgetsTotal Amount allocated this period £7,700
Budget Remaining Unallocated £25,362 (inc of 2012-13 allocation)
Area Capital FundTotal Amount allocated this period £6,449
Budget Remaining Unallocated £99,443 (inc of 2012-13 allocation)
Others – Section 106, NCH Environmentals, Other Funding
NCH EnvironmentalTotal Amount allocated this period £26,552
Budget Remaining Unallocated £26,552
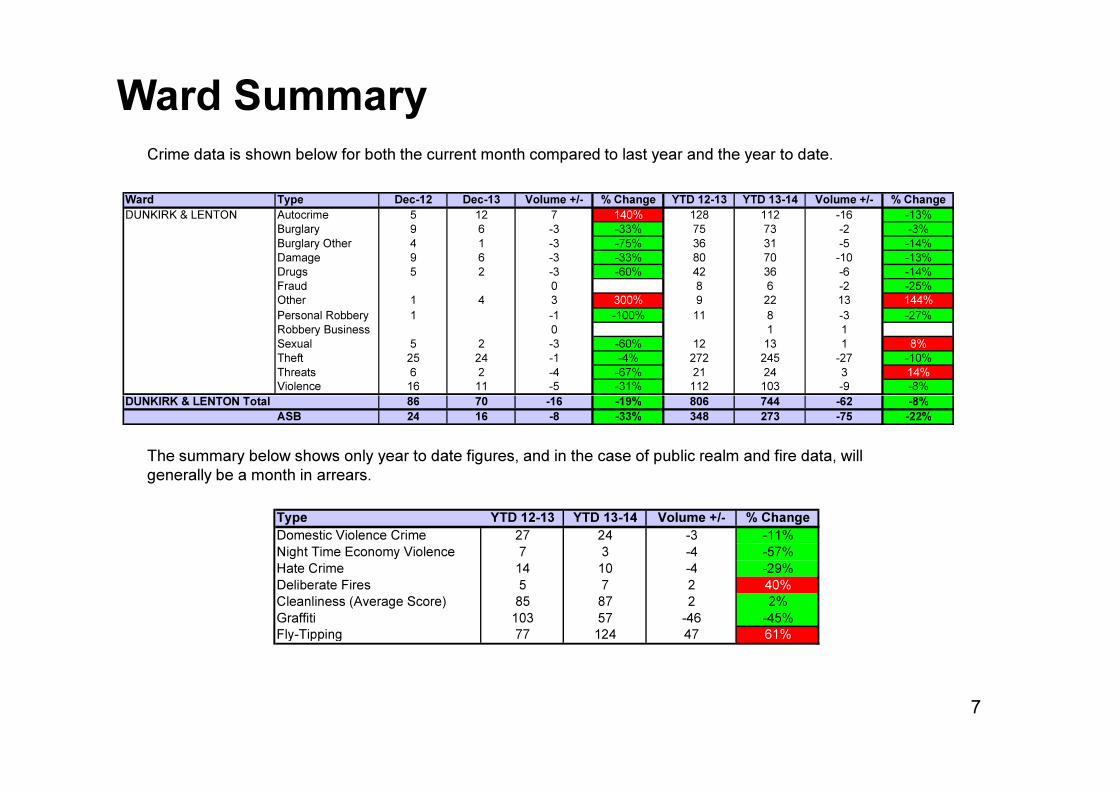
Ward SummaryCrime data is shown below for both the current month compared to last year and the year to date.
Ward Type Dec-12 Dec-13 Volume +/- % Change YTD 12-13 YTD 13-14 Volume +/- % Change
DUNKIRK & LENTON Autocrime 5 12 7 140% 128 112 -16 -13%
Burglary 9 6 -3 -33% 75 73 -2 -3%
Burglary Other 4 1 -3 -75% 36 31 -5 -14%
Damage 9 6 -3 -33% 80 70 -10 -13%
Drugs 5 2 -3 -60% 42 36 -6 -14%
Fraud 0 8 6 -2 -25%
Other 1 4 3 300% 9 22 13 144%
Personal Robbery 1 -1 -100% 11 8 -3 -27%
Robbery Business 0 1 1
Sexual 5 2 -3 -60% 12 13 1 8%
Theft 25 24 -1 -4% 272 245 -27 -10%
Threats 6 2 -4 -67% 21 24 3 14%
Violence 16 11 -5 -31% 112 103 -9 -8%
DUNKIRK & LENTON Total 86 70 -16 -19% 806 744 -62 -8%
7
The summary below shows only year to date figures, and in the case of public realm and fire data, will
generally be a month in arrears.
DUNKIRK & LENTON Total 86 70 -16 -19% 806 744 -62 -8%
ASB 24 16 -8 -33% 348 273 -75 -22%
Type YTD 12-13 YTD 13-14 Volume +/- % Change
Domestic Violence Crime 27 24 -3 -11%
Night Time Economy Violence 7 3 -4 -57%
Hate Crime 14 10 -4 -29%
Deliberate Fires 5 7 2 40%
Cleanliness (Average Score) 85 87 2 2%
Graffiti 103 57 -46 -45%
Fly-Tipping 77 124 47 61%

Priorities & TargetsThe Central Locality has targets to reduce Dwelling Burglary, Shop Theft and Violence. The Locality’s performance
against Targets is set out below. This shows that the target is being met for Dwelling Burglary, but not for Shop Theft
or Violent Crime.
Locality Crime Type Apr-13 May-13 Jun-13 Jul-13 Aug-13 Sep-13 Oct-13 Nov-13 Dec-13 Jan-14 Feb-14 Mar-14 YTD
Proposed
year end
Position
+/- Target
Position
Dwelling Burglary 96 77 71 65 56 59 55 79 69 75 75 75 627 890 -38
Shop Theft 88 71 96 55 54 27 54 52 57 40 40 40 554 644 30
Violence 96 114 115 130 130 110 145 109 113 84 84 84 1062 1173 141
Central
Locality Target Summary
8

Ward PerformanceThe table below shows how Dunkirk & Lenton is performing year to date for All Crime and ASB in comparison to the
other wards on the Division. High Impact wards are highlighted in blue.
Dunkirk & Lenton is one of the few wards to be showing a reduction in both All Crime and ASB.
Locality Ward YTD 12/13 YTD 13/14 Change % Change YTD 12/13 YTD13/14 Change % Change
Central ARBORETUM 968 1109 141 14.6% 712 757 45 6.3%
BERRIDGE 1149 1171 22 1.9% 821 737 -84 -10.2%
DUNKIRK & LENTON 807 744 -63 -7.8% 348 273 -75 -21.6%
RADFORD & PARK 1119 1150 31 2.8% 605 682 77 12.7%
SHERWOOD 780 985 205 26.3% 351 388 37 10.5%
WOLLATON EAST & LENTON ABBEY 330 354 24 7.3% 110 117 7 6.4%
WOLLATON WEST 377 430 53 14.1% 140 138 -2 -1.4%
Central Total 5530 5943 413 7.5% 3087 3092 5 0.2%
Dec 2013 All Crime ASB
9
Central Total 5530 5943 413 7.5% 3087 3092 5 0.2%
City CITY CENTRE 6138 5638 -500 -8.1% 2160 1872 -288 -13.3%
North ASPLEY 1326 1194 -132 -10.0% 755 704 -51 -6.8%
BASFORD 903 940 37 4.1% 542 511 -31 -5.7%
BESTWOOD 734 808 74 10.1% 491 643 152 31.0%
BILBOROUGH 968 956 -12 -1.2% 615 611 -4 -0.7%
BULWELL 1438 1428 -10 -0.7% 919 822 -97 -10.6%
BULWELL FOREST 689 735 46 6.7% 345 403 58 16.8%
LEEN VALLEY 547 583 36 6.6% 304 309 5 1.6%
North Total 6605 6644 39 0.6% 3971 4003 32 0.8%
South BRIDGE 763 648 -115 -15.1% 441 414 -27 -6.1%
CLIFTON NORTH 527 545 18 3.4% 296 313 17 5.7%
CLIFTON SOUTH 747 578 -169 -22.6% 458 454 -4 -0.9%
DALES 790 877 87 11.0% 529 613 84 15.9%
MAPPERLEY 837 901 64 7.6% 467 448 -19 -4.1%
ST ANNS 847 941 94 11.1% 822 801 -21 -2.6%
South Total 4511 4490 -21 -0.5% 3013 3043 30 1.0%
Division 22784 22715 -69 -0.3% 12231 12010 -221 -1.8%
Previous Month's Performance 1.0% -2.8%
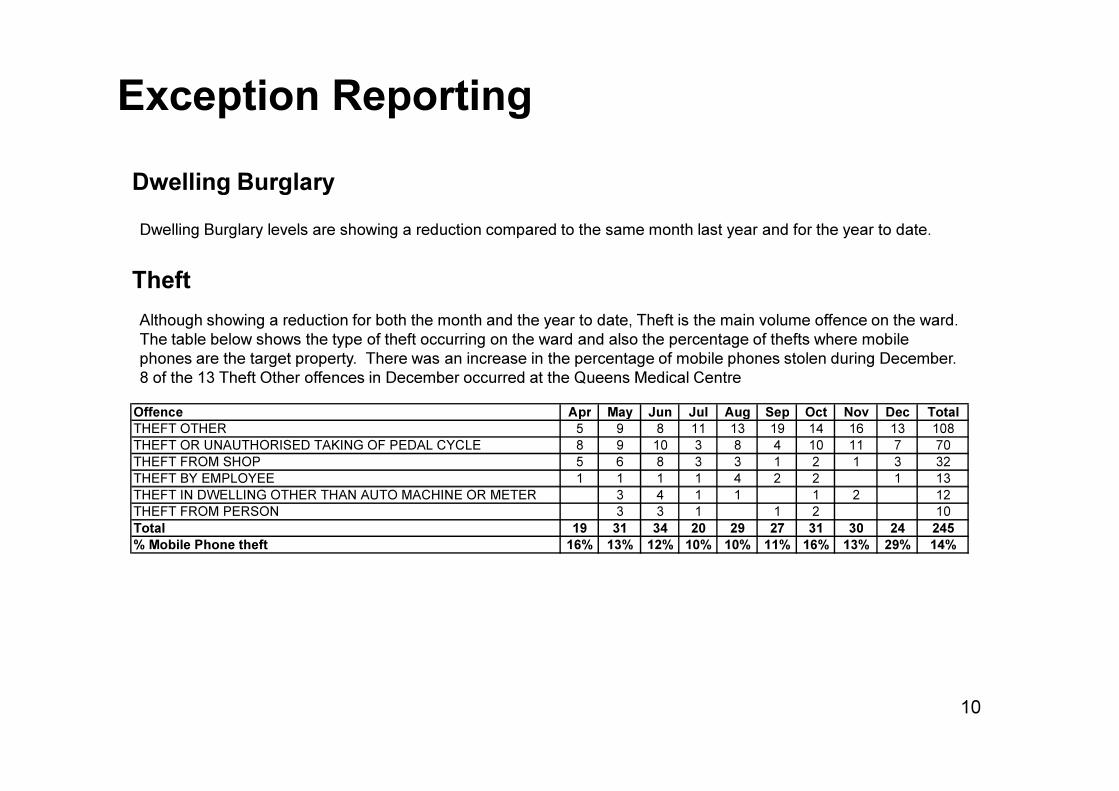
Exception Reporting
Dwelling Burglary levels are showing a reduction compared to the same month last year and for the year to date.
Dwelling Burglary
Theft
Although showing a reduction for both the month and the year to date, Theft is the main volume offence on the ward.
The table below shows the type of theft occurring on the ward and also the percentage of thefts where mobile
phones are the target property. There was an increase in the percentage of mobile phones stolen during December.
8 of the 13 Theft Other offences in December occurred at the Queens Medical Centre
10
Offence Apr May Jun Jul Aug Sep Oct Nov Dec Total
THEFT OTHER 5 9 8 11 13 19 14 16 13 108
THEFT OR UNAUTHORISED TAKING OF PEDAL CYCLE 8 9 10 3 8 4 10 11 7 70
THEFT FROM SHOP 5 6 8 3 3 1 2 1 3 32
THEFT BY EMPLOYEE 1 1 1 1 4 2 2 1 13
THEFT IN DWELLING OTHER THAN AUTO MACHINE OR METER 3 4 1 1 1 2 12
THEFT FROM PERSON 3 3 1 1 2 10
Total 19 31 34 20 29 27 31 30 24 245
% Mobile Phone theft 16% 13% 12% 10% 10% 11% 16% 13% 29% 14%
Exception Reporting (continued)
Violence
Dunkirk and Lenton is one of only two wards showing a reduction in Violent Crime for the year to date. The majority
of offences in December relate to both the QMC and a Childrens Home. Only 18% (2 offences) in December related
to Domestic Violence, which is a similar proportion to figures for the year to date.
Autocrime
The ward has seen an increase in Autocrime this month, compared to the same month last year and compared to
recent months. All offences were Theft from Vehicle and the majority occurred on Lenton Boulevard in the early part
11
All Crime
Dunkirk & Lenton has a higher than average crime rate across a number of crime categories, although this is likely to
be due to the makeup of the ward. A full breakdown can be found on Page 7. The levels of ASB however are below
the average rate, as shown on Page 8.
recent months. All offences were Theft from Vehicle and the majority occurred on Lenton Boulevard in the early part
of December. Items such as Sat Navs and a laptop were stolen.

Crime Figures
Crime Types by Rate (per 1000 of population) of the 20 Wards – Figures are Year to Date 2013/14
WARD ALL CRIME AUTOCRIME BURGLARY DAMAGE
PERSONAL
ROBBERY THEFT VIOLENCE
ARBORETUM 99.06 5.74 9.60 12.56 5.47 15.52 24.85
ASPLEY 67.76 5.96 5.45 11.80 0.91 10.55 17.25
BASFORD 57.44 7.10 5.43 9.87 1.23 10.43 13.39
BERRIDGE 62.46 7.24 5.84 9.17 1.07 14.21 12.49
BESTWOOD 48.23 3.46 5.19 9.91 1.07 6.21 11.58
BILBOROUGH 56.87 6.73 5.36 10.24 0.95 8.99 12.68
BRIDGE 64.90 3.59 1.64 8.31 1.23 26.04 11.69
BULWELL 88.38 5.69 5.08 18.51 1.92 21.97 17.21
12
BULWELL 88.38 5.69 5.08 18.51 1.92 21.97 17.21
BULWELL FOREST 53.84 3.53 4.04 10.06 1.47 14.25 10.65
CLIFTON NORTH 41.43 3.03 4.11 8.69 1.16 5.66 8.46
CLIFTON SOUTH 41.44 2.51 5.31 7.10 0.86 7.31 10.76
DALES 53.28 4.56 2.73 10.08 0.49 11.36 11.54
DUNKIRK AND LENTON 67.95 10.26 6.68 6.41 0.73 21.43 9.43
LEEN VALLEY 54.48 4.58 5.61 8.78 1.68 11.12 10.00
MAPPERLEY 56.42 7.64 4.48 7.83 0.57 10.73 10.67
RADFORD AND PARK 58.59 8.17 6.43 5.41 1.89 16.69 8.93
SHERWOOD 62.09 5.64 5.97 6.49 1.82 21.41 11.16
ST ANNS 66.80 4.65 3.79 12.10 3.79 7.30 18.61
WOLLATON EAST AND LENTON ABBEY 35.57 3.11 5.73 3.62 0.30 12.86 3.52
WOLLATON WEST 29.03 4.75 4.14 3.39 0.27 7.67 2.85
WARD AVERAGE 58.30 5.40 5.13 9.02 1.44 13.09 11.89
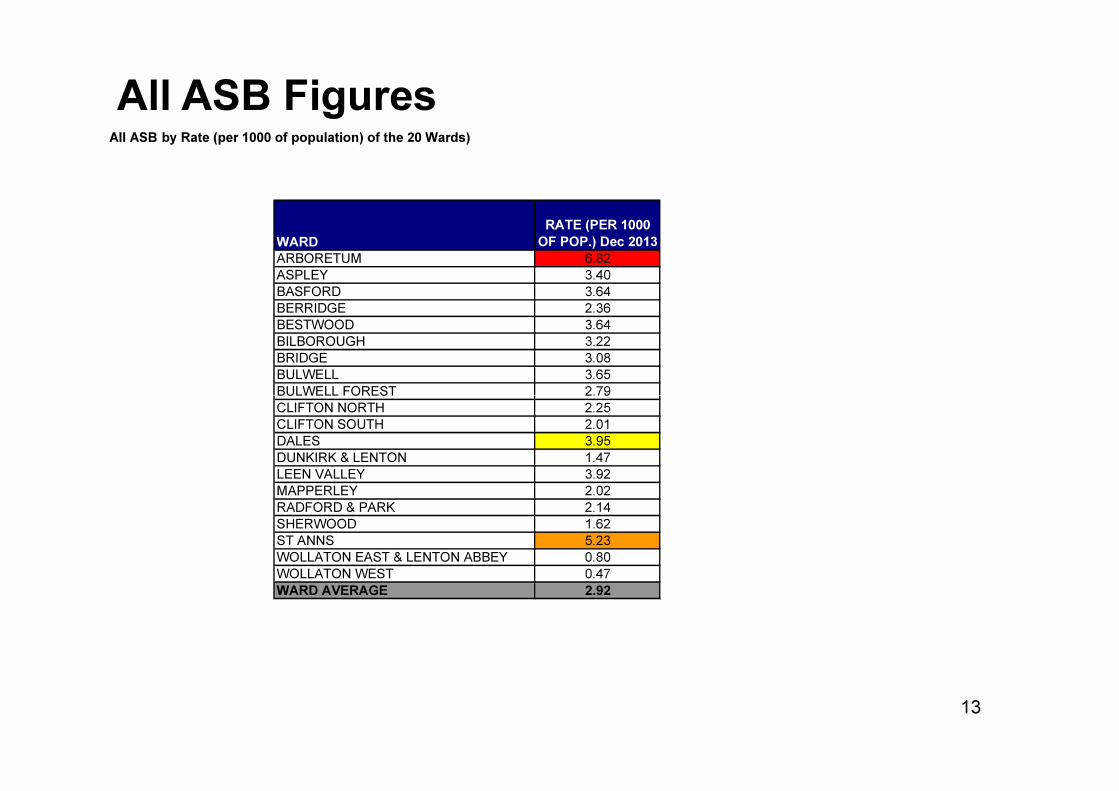
All ASB FiguresAll ASB by Rate (per 1000 of population) of the 20 Wards)
WARD
RATE (PER 1000
OF POP.) Dec 2013
ARBORETUM 6.82
ASPLEY 3.40
BASFORD 3.64
BERRIDGE 2.36
BESTWOOD 3.64
BILBOROUGH 3.22
BRIDGE 3.08
BULWELL 3.65
BULWELL FOREST 2.79
13
BULWELL FOREST 2.79
CLIFTON NORTH 2.25
CLIFTON SOUTH 2.01
DALES 3.95
DUNKIRK & LENTON 1.47
LEEN VALLEY 3.92
MAPPERLEY 2.02
RADFORD & PARK 2.14
SHERWOOD 1.62
ST ANNS 5.23
WOLLATON EAST & LENTON ABBEY 0.80
WOLLATON WEST 0.47
WARD AVERAGE 2.92

FireTable: Volume of Deliberate Primary and Secondary Fires by Ward
Locality Ward Nov-12 Nov-13 Volume +/- % Change Ytd 12-13 Ytd 13-14 Volume +/- % Change
Central Arboretum 2 0 -2 -100% 13 18 5 38%
Berridge 7 3 -4 -57% 35 29 -6 -17%
Dunkirk and Lenton 1 2 1 100% 5 7 2 40%
Radford and Park 1 1 0 0% 24 14 -10 -42%
Sherwood 0 3 3 29900% 9 15 6 67%
Wollaton East and Lenton Abbey 0 0 0 -100% 6 6 0 0%
Wollaton West 0 0 0 -100% 2 3 1 50%
Central Locality 11 9 -2 -18% 94 92 -2 -2%
North Aspley 1 0 -1 -100% 45 34 -11 -24%
Basford 4 2 -2 -50% 40 26 -14 -35%
Fire Data
14
Note: Where ward boundaries overlap with the City Centre fires that occurred in the City Centre have been included in the ward figures.
Basford 4 2 -2 -50% 40 26 -14 -35%
Bestwood 5 0 -5 -100% 31 37 6 19%
Bilborough 3 2 -1 -33% 34 19 -15 -44%
Bulwell 6 7 1 17% 60 56 -4 -7%
Bulwell Forest 0 1 1 9900% 28 12 -16 -57%
Leen Valley 3 2 -1 -33% 20 20 0 0%
North Locality 22 14 -8 -36% 258 204 -54 -21%
South Bridge 0 2 2 19900% 10 14 4 40%
Clifton North 1 2 1 100% 10 9 -1 -10%
Clifton South 2 1 -1 -50% 17 25 8 47%
Dales 1 1 0 0% 6 13 7 117%
Mapperley 2 0 -2 -100% 14 10 -4 -29%
St. Anns 2 1 -1 -50% 22 23 1 5%
South Locality 8 7 -1 -13% 79 94 15 19%
Division 41 30 -11 -27% 431 390 -41 -10%

Community Protection
Data has been received from Community Protection and where postcodes have been listed these have been geo-coded and mapped to determine
the Ward. All addresses relate to the address of the Perpetrator.
FPNs are not currently available at ward level.
In December 2013 the following orders were issued:
• 1 x Caution for the Environment
For enquiries regarding Community Protection court outcomes please contact the Operational Manager for the locality.
15
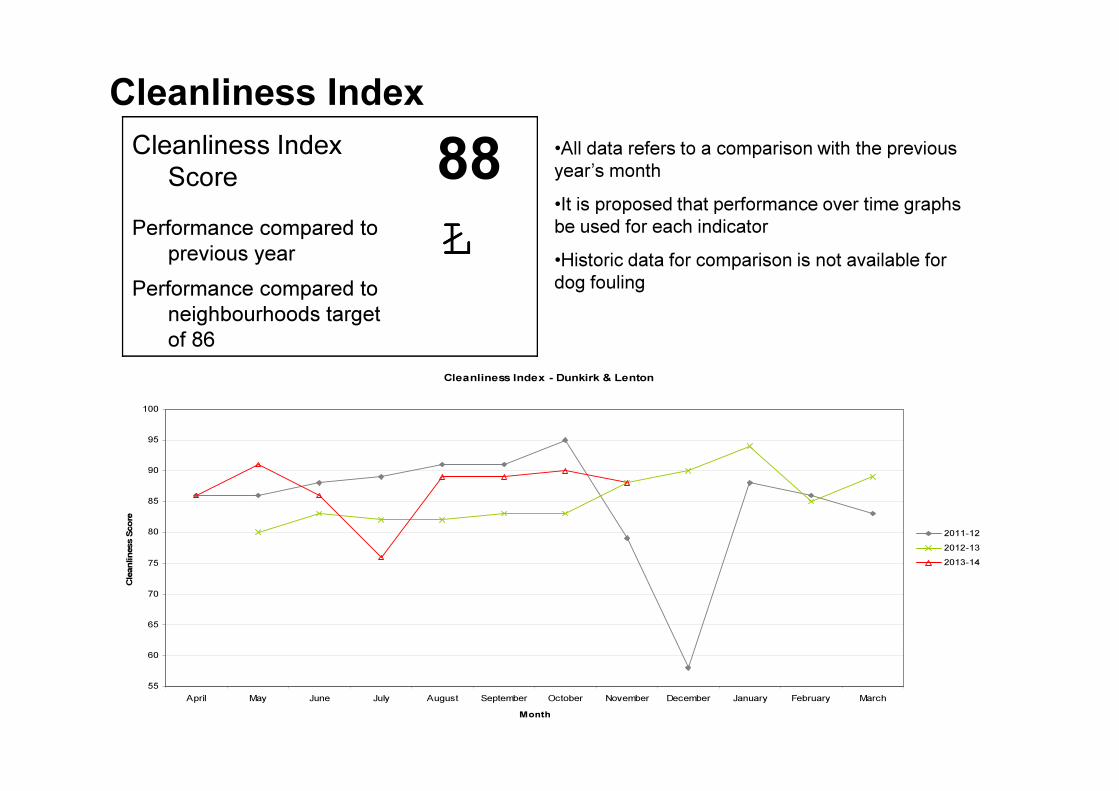
Cleanliness Index
•All data refers to a comparison with the previous
year’s month
•It is proposed that performance over time graphs
be used for each indicator
•Historic data for comparison is not available for
dog fouling
Cleanliness Index
Score 88
Performance compared to
previous year ŁŁŁŁ
Performance compared to
neighbourhoods target
of 86 ìììì
Cleanliness Index - Dunkirk & Lenton
55
60
65
70
75
80
85
90
95
100
April May June July August September October November December January February March
Month
Cle
an
lin
ess S
co
re
2011-12
2012-13
2013-14
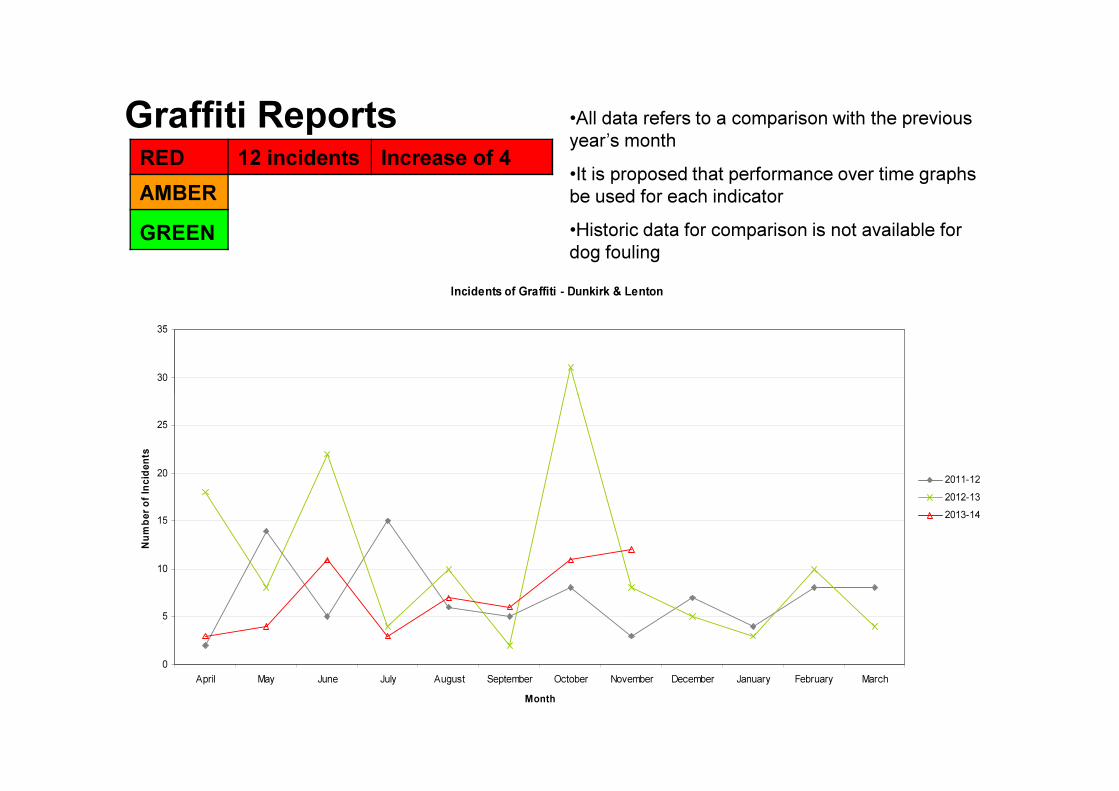
Graffiti Reports •All data refers to a comparison with the previous
year’s month
•It is proposed that performance over time graphs
be used for each indicator
•Historic data for comparison is not available for
dog fouling
RED 12 incidents Increase of 4
AMBER
GREEN
Incidents of Graffiti - Dunkirk & Lenton
30
35
0
5
10
15
20
25
April May June July August September October November December January February March
Month
Nu
mb
er o
f In
cid
en
ts
2011-12
2012-13
2013-14

Fly Tipping •All data refers to a comparison with the previous
year’s month
•It is proposed that performance over time graphs
be used for each indicator
•Historic data for comparison is not available for
dog fouling
RED 9 incidents Increase of 2
AMBER
GREEN
Incidents of Fly Tipping - Dunkirk & Lenton
25
30
0
5
10
15
20
25
April May June July August September October November December January February March
Month
Nu
mb
er o
f In
cid
en
ts
2011-12
2012-13
2013-14

Housing
Anti-social behaviour
Ward Report - Dunkirk & Lenton Generated on: 18 December 2013
2013/14 2012/13 2011/12
Performance indicator and definition Target Value Status
Long Trend
Value Value
% of ASB cases resolved by first intervention – Central region
19
Note: This PI monitors how many ASB cases NCH resolved on the first intervention e.g. written warning. Data for this indicator is not available by ward and is reported by Housing Office.
76% 84.55% 78.92%
% of ASB cases resolved – Central region Note: This PI measures the proportion of ASB cases NCH has successfully resolved. Data for this PI is not available by ward and is reported by Housing Office.
97.8% 100% 100% 97.53%
Number of new ASB cases – Central region Note: Data for this PI is only available by Housing Office.
104 144 229
Tenant satisfaction with the ASB service - Central region Note: Data for this PI is only available by Housing Office.
8 7.48 6.95 6
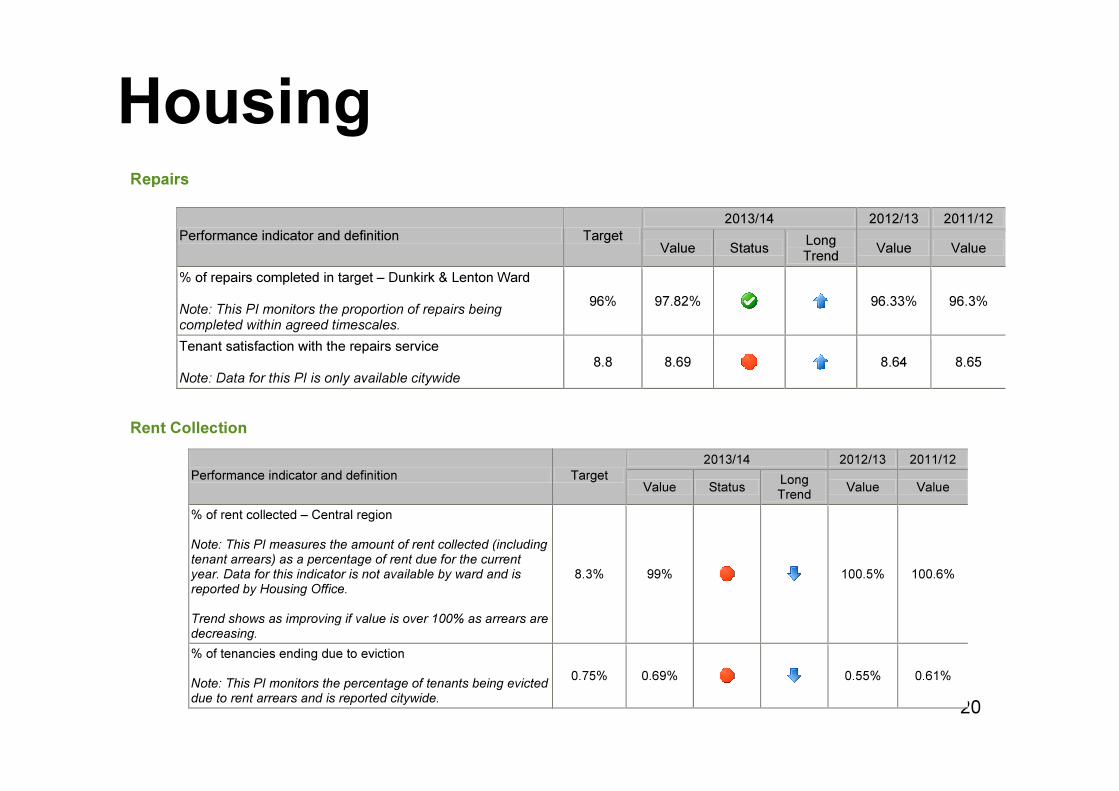
Housing Repairs
2013/14 2012/13 2011/12
Performance indicator and definition Target Value Status
Long Trend
Value Value
% of repairs completed in target – Dunkirk & Lenton Ward Note: This PI monitors the proportion of repairs being completed within agreed timescales.
96% 97.82% 96.33% 96.3%
Tenant satisfaction with the repairs service Note: Data for this PI is only available citywide
8.8 8.69 8.64 8.65
20
Rent Collection
2013/14 2012/13 2011/12
Performance indicator and definition Target Value Status
Long Trend
Value Value
% of rent collected – Central region Note: This PI measures the amount of rent collected (including tenant arrears) as a percentage of rent due for the current year. Data for this indicator is not available by ward and is reported by Housing Office. Trend shows as improving if value is over 100% as arrears are decreasing.
8.3% 99% 100.5% 100.6%
% of tenancies ending due to eviction Note: This PI monitors the percentage of tenants being evicted due to rent arrears and is reported citywide.
0.75% 0.69% 0.55% 0.61%
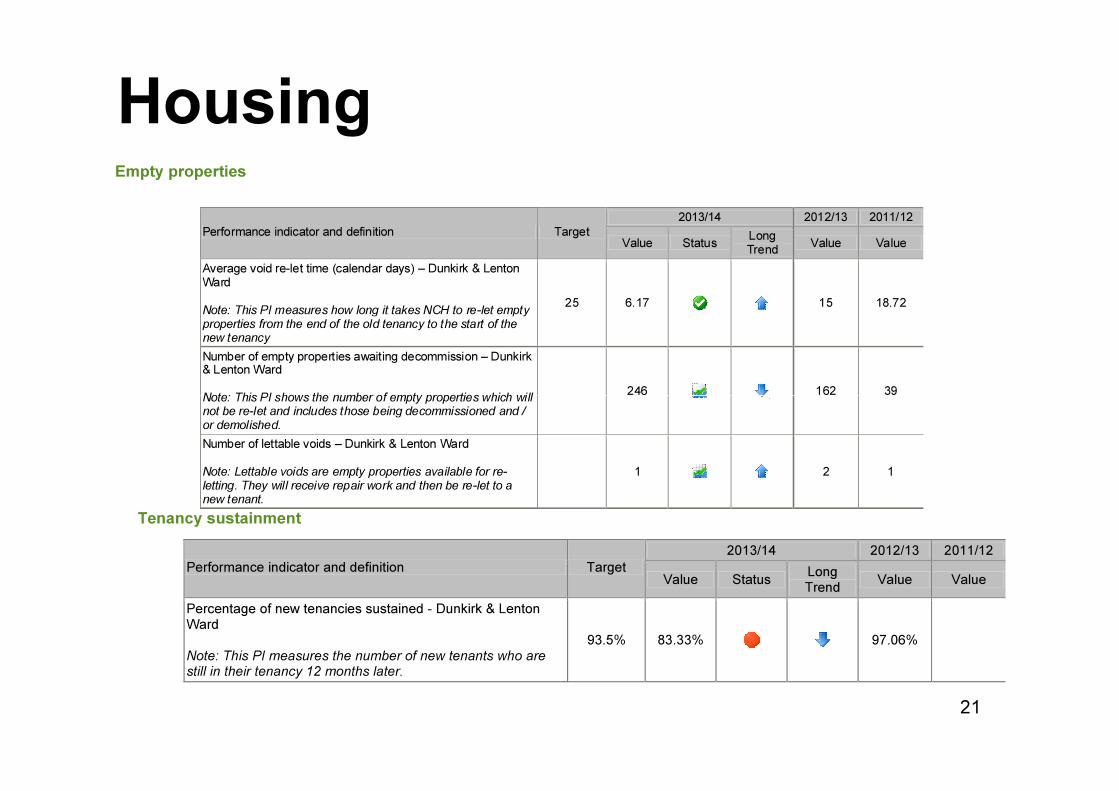
Housing Empty properties
2013/14 2012/13 2011/12
Performance indicator and definition Target Value Status
Long Trend
Value Value
Average void re-let time (calendar days) – Dunkirk & Lenton Ward Note: This PI measures how long it takes NCH to re-let empty properties from the end of the old tenancy to the start of the new tenancy
25 6.17 15 18.72
Number of empty properties awaiting decommission – Dunkirk & Lenton Ward Note: This PI shows the number of empty properties which will
246 162 39
21
Tenancy sustainment
Note: This PI shows the number of empty properties which will not be re-let and includes those being decommissioned and / or demolished.
246 162 39
Number of lettable voids – Dunkirk & Lenton Ward Note: Lettable voids are empty properties available for re-letting. They will receive repair work and then be re-let to a new tenant.
1 2 1
2013/14 2012/13 2011/12
Performance indicator and definition Target Value Status
Long Trend
Value Value
Percentage of new tenancies sustained - Dunkirk & Lenton Ward Note: This PI measures the number of new tenants who are still in their tenancy 12 months later.
93.5% 83.33% 97.06%
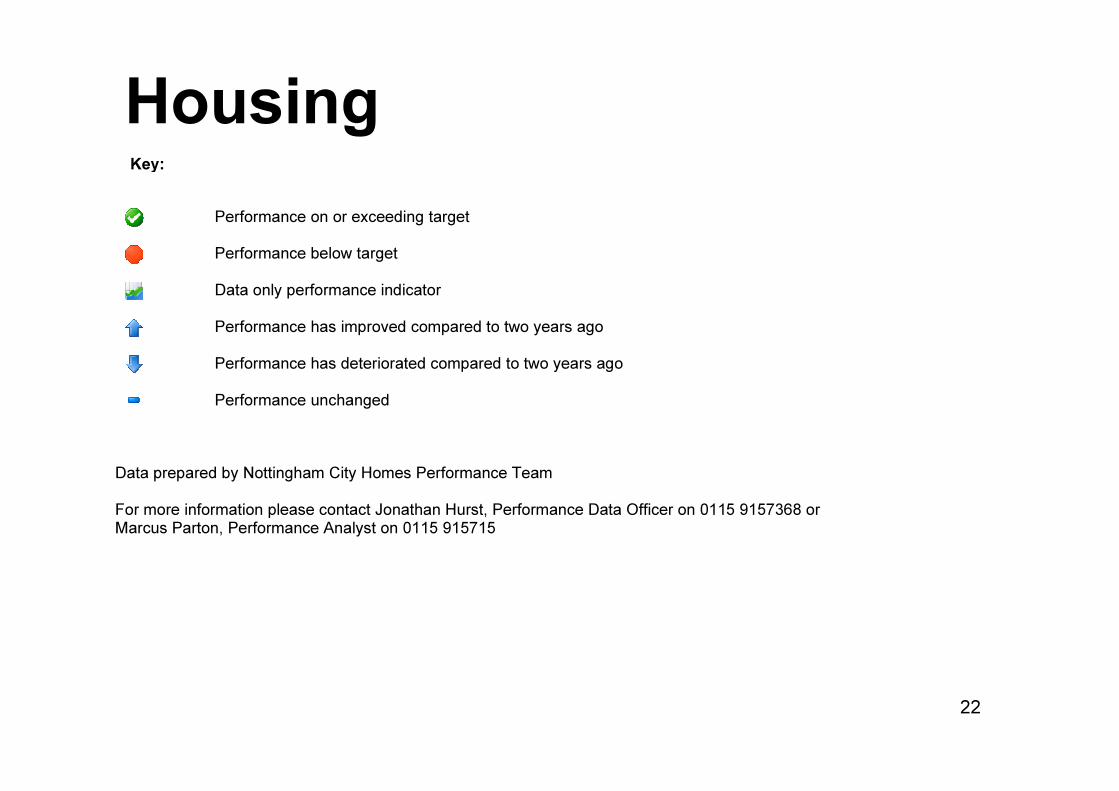
Housing Key:
Performance on or exceeding target
Performance below target
Data only performance indicator
Performance has improved compared to two years ago
Performance has deteriorated compared to two years ago Performance unchanged
22
Performance unchanged
Data prepared by Nottingham City Homes Performance Team For more information please contact Jonathan Hurst, Performance Data Officer on 0115 9157368 or Marcus Parton, Performance Analyst on 0115 915715

Methodology
Data has not been audited or verified and therefore must only be used as a
reflection of crime.
Crime data and ASB calls have been extracted from the Police systems and
mapped to ascertain which Ward they occurred in.
Where a ward boundary overlaps with the City Centre, crime data and ASB calls
23
Where a ward boundary overlaps with the City Centre, crime data and ASB calls
relating to the City Centre have been removed.
Where possible the most recent data is used, although for some areas this may be
a month further in arrears.
Discussions continue with other agencies regarding what further data can be
included.