draft technical support document missouri area ... · draft technical support document . missouri ....
TRANSCRIPT
Draft Technical Support Document
MISSOURI Area Designations For the
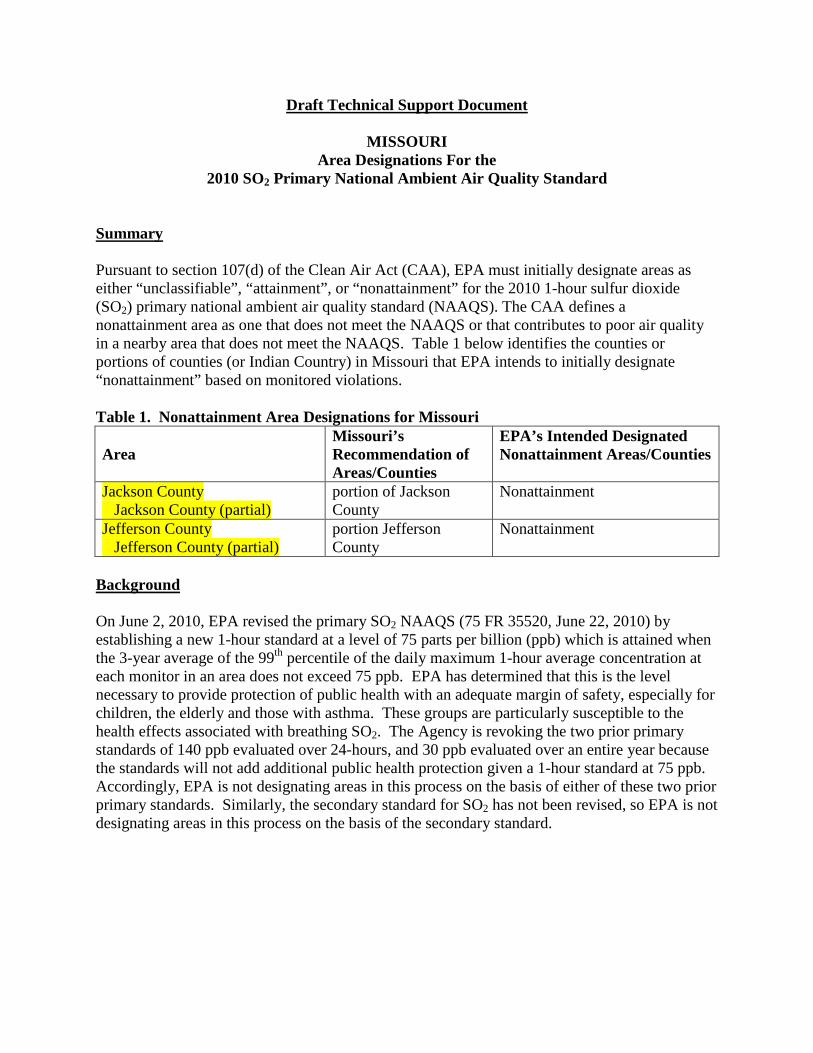
2010 SO2 Primary National Ambient Air Quality Standard Summary Pursuant to section 107(d) of the Clean Air Act (CAA), EPA must initially designate areas as either “unclassifiable”, “attainment”, or “nonattainment” for the 2010 1-hour sulfur dioxide (SO2) primary national ambient air quality standard (NAAQS). The CAA defines a nonattainment area as one that does not meet the NAAQS or that contributes to poor air quality in a nearby area that does not meet the NAAQS. Table 1 below identifies the counties or portions of counties (or Indian Country) in Missouri that EPA intends to initially designate “nonattainment” based on monitored violations. Table 1. Nonattainment Area Designations for Missouri Area
Missouri’s Recommendation of Areas/Counties
EPA’s Intended Designated Nonattainment Areas/Counties
Jackson County Jackson County (partial)
portion of Jackson County
Nonattainment
Jefferson County Jefferson County (partial)
portion Jefferson County
Nonattainment
Background On June 2, 2010, EPA revised the primary SO2 NAAQS (75 FR 35520, June 22, 2010) by establishing a new 1-hour standard at a level of 75 parts per billion (ppb) which is attained when the 3-year average of the 99th percentile of the daily maximum 1-hour average concentration at each monitor in an area does not exceed 75 ppb. EPA has determined that this is the level necessary to provide protection of public health with an adequate margin of safety, especially for children, the elderly and those with asthma. These groups are particularly susceptible to the health effects associated with breathing SO2. The Agency is revoking the two prior primary standards of 140 ppb evaluated over 24-hours, and 30 ppb evaluated over an entire year because the standards will not add additional public health protection given a 1-hour standard at 75 ppb. Accordingly, EPA is not designating areas in this process on the basis of either of these two prior primary standards. Similarly, the secondary standard for SO2 has not been revised, so EPA is not designating areas in this process on the basis of the secondary standard.
EPA’s SO2 Designation Approach Section 107(d) of the CAA requires that not later than 1 year after promulgation of a new or revised NAAQS, state Governors must submit their recommendations for designations and boundaries to EPA. This deadline was in June, 2011. Section 107(d) also requires EPA to provide a notification to states of no less than 120-days prior to promulgating an initial area designation that is a modification of a state’s recommendation. EPA has reviewed the State’s recommendations and has notified the State Commissioner through letter signed by the Regional Administrator of any intended modifications. [While language in section 107 specifically addresses states, we intend to follow the same process for tribes, pursuant to section 301(d) of the CAA and Tribal Authority Rule (40 CFR Part 49). Therefore, we intend to designate areas of Indian Country, in consultation with the tribes, on the same schedule as state designations.] If a State or Tribe did not submit designation recommendations, EPA will promulgate the designations that it deems appropriate. If a state or Tribe disagrees with EPA’s intended area designations, they have an opportunity to demonstrate why any proposed modification is inappropriate. Designations guidance was issued by EPA through a March 24, 2011, memorandum from Stephen D. Page, Director, U.S. EPA, Office of Air Quality Planning and Standards, to Air Division Directors, U.S. EPA Regions I-X. This memorandum identifies factors EPA intends to evaluate in determining boundaries for areas designated nonattainment. These 5 factors include: 1) Air quality data; 2) Emissions and emissions-related data (location of sources and potential contribution to ambient SO2 concentrations); 3) Meteorology (weather/transport patterns); 4) Geography/topography (mountain ranges or other air basin boundaries); and 5) Jurisdictional boundaries (e.g., counties, air districts, pre-existing nonattainment areas, reservations, metropolitan planning organization), among any other information deemed relevant to establishing appropriate area designations and boundaries for the 1-hour SO2 NAAQS. The March 24, 2011, memo recommended that area boundaries be defaulted to the county boundary unless additional provided information justifies a larger or smaller boundary than that of the county. EPA believes it is appropriate to evaluate each potential area on a case-by-case basis, and to recognize that area-specific analyses conducted by states, tribes and/or EPA may support a different boundary than a default county boundary. In this TSD, EPA discusses its review and technical analysis of the recommendations submitted by the states and/or tribes for designations of the 1-hour SO2 standard and any modifications from these recommendations. Definition of important terms used in this document: 1) Designated “nonattainment” area – an area which EPA has determined, based on a state recommendation and/or on the technical analysis included in this document, has violated the 2010 SO2 NAAQS, based on the most recent three years of air quality monitoring data, or contributes to a violation in a nearby area.
2) Recommended nonattainment area – an area a State or Tribe has recommended to EPA be designated as nonattainment. 3) Violating monitor – an ambient air monitor meeting all methods, quality assurance and citing criteria and requirements whose valid design value exceeds 75 ppb, as described in Appendix T of 40 CFR part 50. 4) 2010 SO2 NAAQS - 75 ppb, national ambient air quality standard for SO2 promulgated in 2010. Based on the 3-year average of the 99th percentile of the annual distribution of daily maximum 1-hour average concentrations 5) Design Value – a statistic that describes the air quality status of a given area relative to the level of the NAAQS.
Nonattainment Designations Introduction This technical analysis for the State of Missouri identifies the counties with a monitor(s) that violate the 2010 SO2 NAAQS based on 2009-2011 as well as 2008-2010 data, and evaluates nearby counties for contributions to SO2 concentrations in the area. In Missouri’s designation recommendation letter to EPA, dated July 11, 2011, Sara Parker Pauley, Director of the Missouri Department of Natural Resources (MDNR), recommended that portions of Greene, Jackson and Jefferson counties be designated as nonattainment for the 2010 SO2 NAAQS based on monitored air quality data from 2007-2009. Additionally, MDNR has recently certified the most recent data from the Greene County monitors for the year ending in 2012, and informed EPA Region 7 (in a letter dated January 11, 2013) that they intend to revise their nonattainment recommendations to not include Greene County, MO because the monitors in Greene County are no longer recording a violation of the 2010 1-hr SO2 NAAQS. EPA agrees that the most recent certified air quality monitoring data for Greene County indicate that the monitors are no longer recording violations of the 2010 1-hr SO2 NAAQS, and therefore is not including Greene County as part of the technical analysis for areas with violating monitors for this NAAQS. Based on EPA’s technical analysis, EPA intends to designate two areas as nonattainment (Table 1). The Jackson County, MO Nonattainment Area includes a part of Jackson County which consists of the area North of I-70/I-670, West of I-435, East of the state line with Kansas and South of the Missouri River. The Jefferson County, MO Nonattainment Area includes a part of Jefferson County which consists of both Herculaneum and Festus townships and those portions of Valmeyer and Selma townships directly to the East that separate Herculaneum and Festus townships from the Mississippi River. EPA has evaluated these counties and nearby counties based on the weight of evidence of the factors recommended in the March 24, 2011, issued EPA guidance. The 5 factors were used to analyze the nonattainment areas for 1-hour SO2 designations:
1. Air quality data. We reviewed SO2 air quality monitoring data from EPA’s Air Trends website (see http://www.epa.gov/airtrends/values.html), including the design value calculated for each monitor in the area for the most recent 3-year period. A monitor’s design value indicates whether that monitor attains a specified air quality standard. The 2010 SO2 NAAQS is met at a monitoring site when the identified design value is valid and less than or equal to 75 ppb as described in Appendix T of 40 CFR part 50. An ambient air monitor whose valid design value exceeds 75 ppb, as described in Appendix T of 40 CFR part 50 is deemed a violating monitor. A design value is only valid if minimum data completeness criteria are met. An SO2 design value that meets the NAAQS is generally considered valid if it encompasses 3 years of complete data. A year is complete when all 4 quarters are complete. A quarter is complete when 75% of the days are complete. A day is complete when it has 75% of its hours. Data substitution tests are described in Appendix T of 40 CFR part 50. Areas where monitoring data indicate a violation of the 1-hour, 75 ppb primary SO2 standard will be designated as nonattainment. Source-oriented modeling may also be used to assess air quality in a particular location. Attachment 3 of the March 24, 2011 EPA memo provides further guidance on using refined dispersion modeling for this type of assessment.
2. Emissions and emissions-related data (location of sources and potential contribution to ambient SO2 concentrations). We reviewed data from the 2008 National Emissions Inventory (NEI), version 2 (NEI08V2), which was the most current version of the national inventory available in 2011 when these data were compiled for the designations process, (see http://www.epa.gov/ttn/chief/net/2008inventory.html) or other relevant sources of data, such as state inventories or inventories from other federal sources. EPA recognizes that there might be no new information on any changes in emissions that may have occurred after 2008, but would consider more recent years if available. For example, certain large sources of emissions in or near an area may have installed emission controls or otherwise significantly reduced emissions since 2008. Two source categories from the 2008 NEI were examined: the point source inventory and the nonpoint source inventory. Generally, the point source inventory represents the bulk of the SO2 emissions in Region 7.
3. Meteorology (weather/transport patterns). We evaluated meteorological data to help
determine how weather conditions, including wind speed and direction, affect the plume of sources contributing to ambient SO2 concentrations. The National Weather Service maintains surface and upper air monitoring sites across the United States. Automated Surface Observing System (ASOS) (http://www.weather.gov/asos) sites collect hourly averaged wind measurements including wind direction and wind speed.
4. Geography/topography (mountain ranges or other air basin boundaries). We examined the physical features of the land that might affect the distribution of SO2 over an area. River Valleys, Escarpments, or other physical features may affect the distribution of emissions, and may help define boundaries. Satellite images depicting River Valleys and point sources were constructed and evaluated to determine the effects of the topography on point source emissions.

5. Jurisdictional boundaries (e.g., counties, air districts, pre-existing nonattainment areas, reservations, metropolitan planning organizations). Once the geographic area associated with the area violating the SO2 standard and the nearby area contributing to violations were determined, we considered existing jurisdictional boundaries for the purposes of providing a clearly defined legal boundary for carrying out the air quality planning and enforcement functions for the nonattainment area. If an existing jurisdictional boundary is used to help define the nonattainment area, it encompasses all of the area that has been identified as meeting the nonattainment definition. These existing boundaries may include an existing nonattainment or maintenance area boundary, a county or township boundary, a metropolitan area boundary, an air management district, or an urban planning boundary established for coordinating business development or transportation activities. Where existing jurisdictional boundaries are not adequate to describe the nonattainment area, other clearly defined and permanent landmarks or geographic coordinates are used.
MDNR recommended a partial county boundary for all their nonattainment area boundaries, which was not the default boundary as per EPA’s March 24, 2011 designations guidance. EPA evaluated MDNRs recommendations and analysis in assessing whether a partial county boundary was warranted considering the analysis supplied. We utilized the March 24, 2011 designation guidance and the five factor analysis described above to assess whether MDNRs nonattainment boundary recommendations met the criteria outlined in the March 2011 guidance.
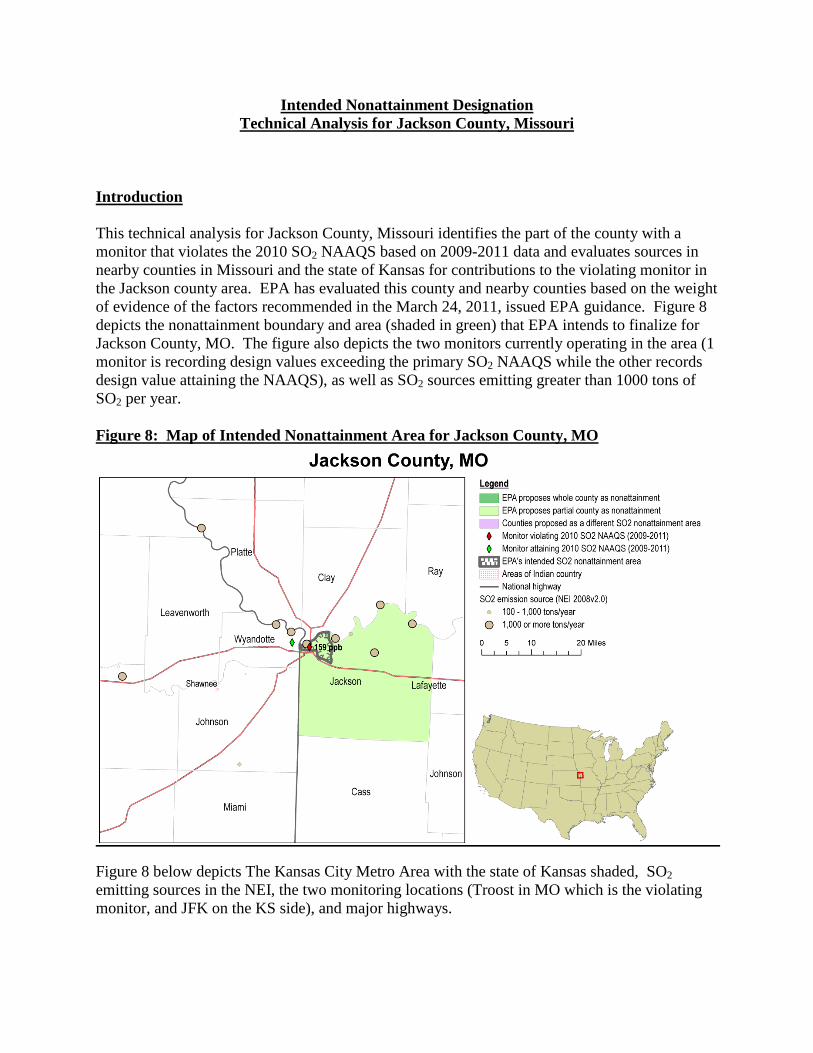
Intended Nonattainment Designation Technical Analysis for Jackson County, Missouri
Introduction This technical analysis for Jackson County, Missouri identifies the part of the county with a monitor that violates the 2010 SO2 NAAQS based on 2009-2011 data and evaluates sources in nearby counties in Missouri and the state of Kansas for contributions to the violating monitor in the Jackson county area. EPA has evaluated this county and nearby counties based on the weight of evidence of the factors recommended in the March 24, 2011, issued EPA guidance. Figure 8 depicts the nonattainment boundary and area (shaded in green) that EPA intends to finalize for Jackson County, MO. The figure also depicts the two monitors currently operating in the area (1 monitor is recording design values exceeding the primary SO2 NAAQS while the other records design value attaining the NAAQS), as well as SO2 sources emitting greater than 1000 tons of SO2 per year. Figure 8: Map of Intended Nonattainment Area for Jackson County, MO
Figure 8 below depicts The Kansas City Metro Area with the state of Kansas shaded, SO2 emitting sources in the NEI, the two monitoring locations (Troost in MO which is the violating monitor, and JFK on the KS side), and major highways.
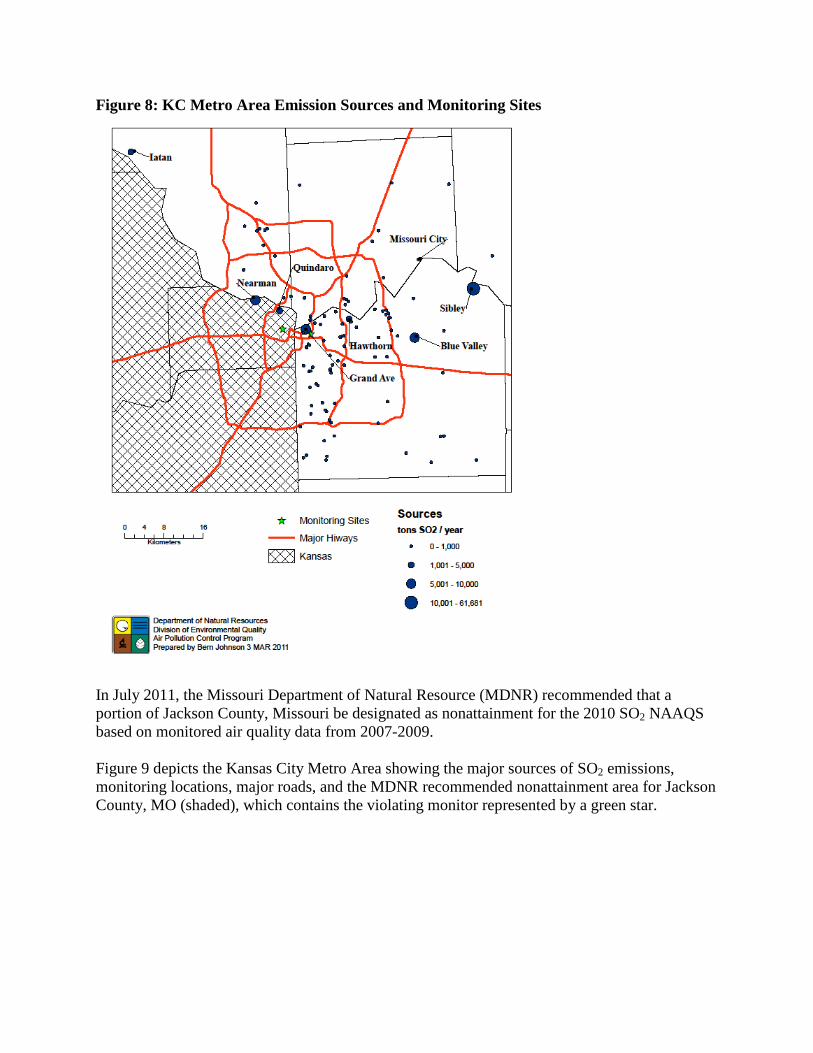
Figure 8: KC Metro Area Emission Sources and Monitoring Sites
In July 2011, the Missouri Department of Natural Resource (MDNR) recommended that a portion of Jackson County, Missouri be designated as nonattainment for the 2010 SO2 NAAQS based on monitored air quality data from 2007-2009. Figure 9 depicts the Kansas City Metro Area showing the major sources of SO2 emissions, monitoring locations, major roads, and the MDNR recommended nonattainment area for Jackson County, MO (shaded), which contains the violating monitor represented by a green star.
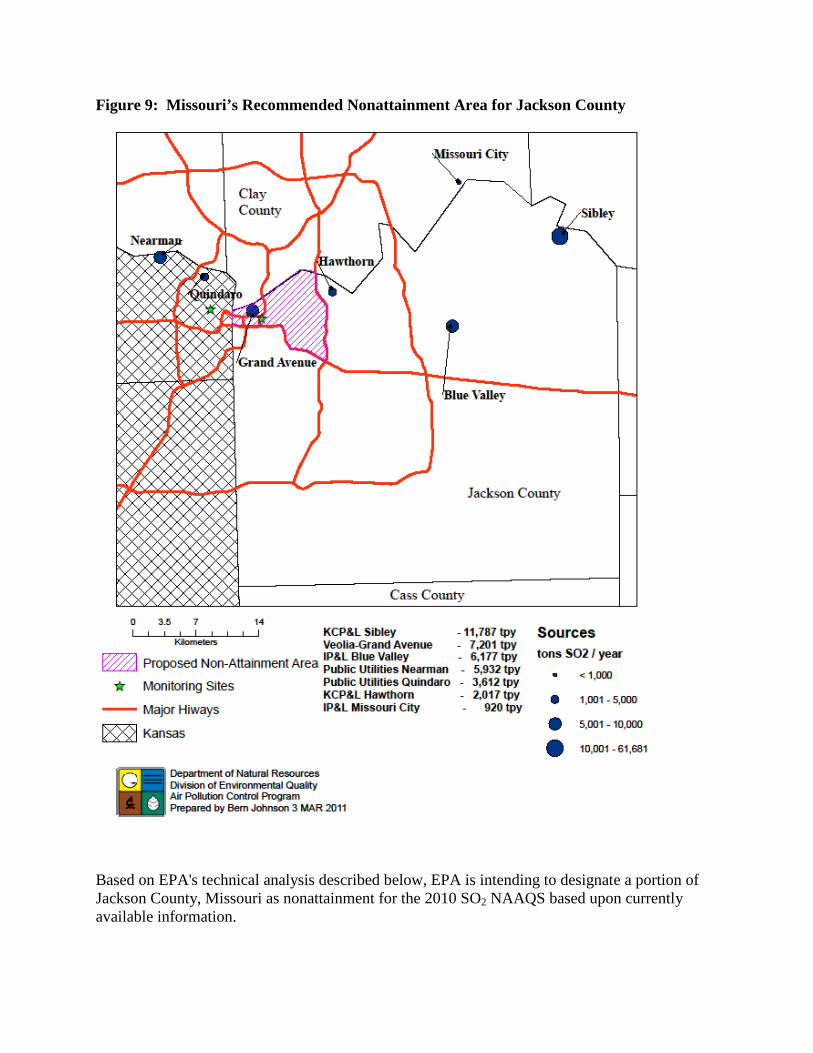
Figure 9: Missouri’s Recommended Nonattainment Area for Jackson County
Based on EPA's technical analysis described below, EPA is intending to designate a portion of Jackson County, Missouri as nonattainment for the 2010 SO2 NAAQS based upon currently available information.

Detailed Assessment Air Quality Data This factor considers the SO2 air quality monitoring data, including the design values (in ppb) calculated for all air quality monitors in both Jackson County, Missouri and Wyandotte County, Kansas (and the surrounding area) based on data for the 2009-2011 period. MDNR’s recommendation was based on data collected from monitor(s) located in the Kansas City, Missouri metropolitan area meeting the specifications of a Federal Reference Method (FRM) or Federal Equivalent Method (FEM) in accordance with 40 CFR Part 53 (see letter from Sara Parker Pauley Director of MDNR to Karl Brooks Region Administrator EPA Region 7 dated July 19, 2011) . The 3 year design values (’09-’11) for the monitors in Jackson County, MO and Wyandotte County, KS, are shown in Table 6. Table 6: Air Quality Data for Nonattainment Designation in Jackson County, Missouri
County State
Recommended Nonattainment?
Monitor Name Monitor Air Quality System ID Monitor Location
3 yr SO2 Design Value (ppb) ’09 thru ‘11
Jackson, MO Yes Troost 290950034 Jackson Co, MO 159 Wyandotte, KS No JFK Wyandotte Co,
KS 47
Jackson County, Missouri’s Troost monitor shows a violation of the 2010 SO2 primary NAAQS. Therefore, some area in Jackson County must be designated nonattainment. The absence of a violating monitor alone is not a sufficient reason to eliminate nearby counties as candidates for inclusion in a nonattainment area. Each area has been evaluated based on the weight of evidence of the five factors and other relevant information. Of the two monitors in Kansas City Metro Area, only the Troost monitor has a design value in excess of the 1-hr SO2 primary NAAQS. Due to the comparatively lower concentrations of ambient SO2 recorded at the JFK monitor in KS (and the proximity of the JFK monitor to the two highest emitting sources in Wyandotte Co, KS, as well as the alignment of these sources with the Veolia/Trigen source in MO, and the Troost monitor) it is believed that the source responsible for the monitored reading in excess of the NAAQS at the Troost monitor is the Veolia/Trigen source located in Jackson County, Missouri, and is encompassed by the nonattainment boundary recommended by MDNR. Veolia/Trigen provides steam and heat to the downtown area of Kansas City, Missouri, and currently operates with no pollution control equipment to capture or reduce its SO2 emissions. Based on the information submitted to EPA by MDNR, and a careful evaluation of: 1) the location of monitors recording exceedances in the area; 2) the weather conditions during the times the area monitor[s] recorded exceedances (and/or high recorded measurements); and, 3) the location and size of sources emitting SO2 in and around the Kansas City Metro Area monitors for the years 2007 thru 2011, EPA believes the boundary recommended by MDNR for Jackson County, MO properly bounds the area of the county (and the source primarily responsible for the area) not attaining the 2010 SO2 primary NAAQS.

Emissions and Emissions-Related Data
Evidence of SO2 emissions sources in the vicinity of a violating monitor is an important factor for determining whether a nearby area is contributing to a monitored violation. For this factor, EPA evaluated county level emissions data for SO2 and any growth in SO2 emitting activities since the date represented by those emissions data. Emissions The Kansas City Metropolitan Area (KC Metro Area) is composed of five counties in two states. The predominant counties of the metro area are Jackson County, MO and Wyandotte County, KS which lie in the heart of the area. In Jackson County, MO there are 66 NEI listed point sources of SO2. In Wyandotte County, KS there are 21 NEI listed point sources of SO2. The majority of the NEI listed sources in both counties emit much less than 100 tons of SO2 per year. The largest sources of SO2 in Wyandotte, KS are the Nearman and Quindaro Power Plants operated by the Board of Public Utilities. In the entire KC Metro Area there are 8 sources of SO2 that emit over 1000 tons of per year, and are the focus of the analysis of Jackson County, MO. Of all the sources in KC Metro Area emitting over 1000 tons per year all but one are located on the Missouri River, with the remaining facility being located on the Kansas River. It is important to note the location of the 2nd largest source of SO2 emissions in the KC Metro Area which is the Grand Avenue (Veolia/Trigen) steam plant located approximately 3.2 miles upwind from the violating Troost monitor in Jackson County, MO, and the two largest sources of SO2 emissions in Wyandotte County, KS, which are closer to the JFK monitor located in Wyandotte County, KS. BPU-Quindaro is approximately 1.3 miles from the non-violating Wyandotte County, KS monitor and 4.9 miles from the violating Jackson County, MO monitor. BPU-Nearman is approximately 4.8 miles from the non-violating Wyandotte County, KS monitor, and 8.2 miles from the violating Jackson County, MO monitor. Additionally, the two sources in Kansas and the Veolia/Trigen source in MO are fairly well aligned with the Troost monitor. This alignment of the KS sources, the Veolia/Trigen source in MO and Troost monitor obfuscates the limited contribution from the KS sources on the violating monitor in Jackson County, MO from the overwhelming contribution of the Trigen source on the monitor in MO. To assess the contribution of the KS sources on the violating monitor in MO, we prepared and analyzed back trajectories for the times in which both monitors (the MO Troost monitor and the KS JFK monitor) violated the standard or recorded high measurements. We found that both monitor’s design values are being driven by the emissions from the Veolia/Trigen source in Jackson County, MO. The trajectories for the JFK monitor in KS show that when the monitor recorded its highest readings the winds are out of the east carrying emissions from the Veolia/Trigen to the monitor. Similarly, when the Troost monitor in MO records violations, the winds are out of the northwest carrying emissions from the Veolia/Trigen source to the monitor driving the design value. Figure 10 shows the back trajectories analyzed for the 1-hr violations recorded at both the Troost and JFK monitors. The blue lines represent individual trajectories over an 8 hr period prior to the violation being recorded, and the red lines represent composites of all the blue lines for each monitor. These trajectories demonstrate that the Grand Avenue - Veolia/Trigen source is consistently the source most responsible for the 1-hr violations recorded
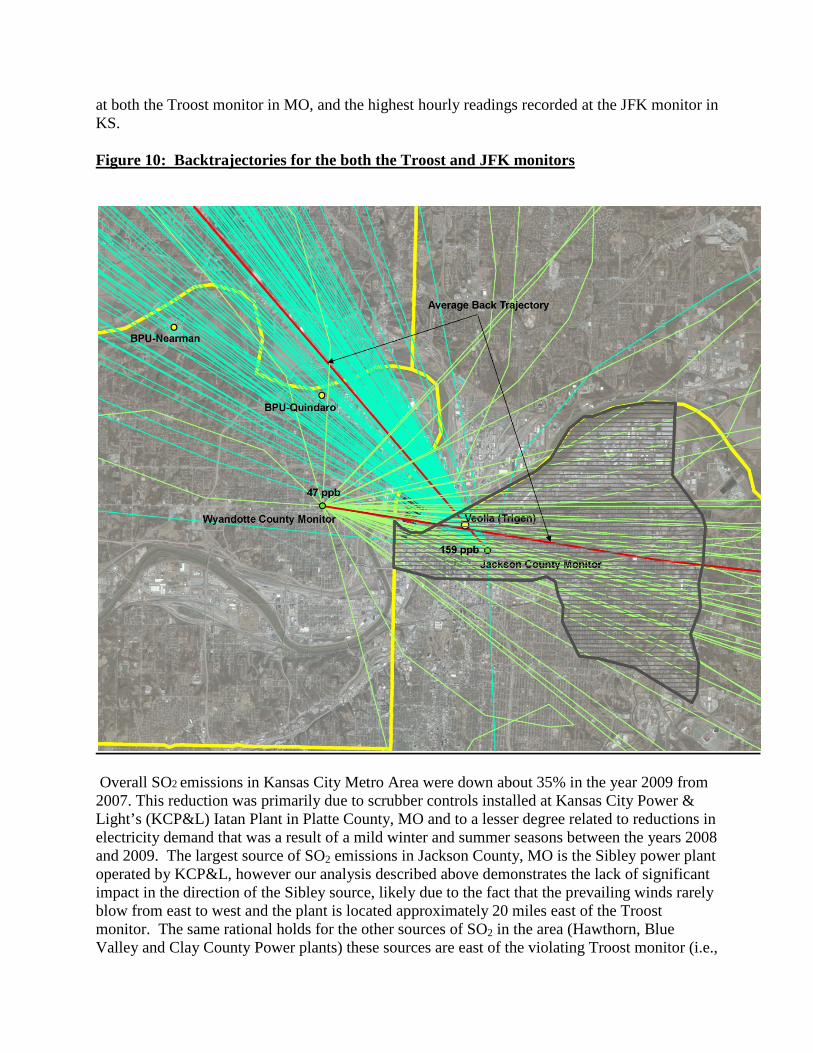
at both the Troost monitor in MO, and the highest hourly readings recorded at the JFK monitor in KS. Figure 10: Backtrajectories for the both the Troost and JFK monitors
Overall SO2 emissions in Kansas City Metro Area were down about 35% in the year 2009 from 2007. This reduction was primarily due to scrubber controls installed at Kansas City Power & Light’s (KCP&L) Iatan Plant in Platte County, MO and to a lesser degree related to reductions in electricity demand that was a result of a mild winter and summer seasons between the years 2008 and 2009. The largest source of SO2 emissions in Jackson County, MO is the Sibley power plant operated by KCP&L, however our analysis described above demonstrates the lack of significant impact in the direction of the Sibley source, likely due to the fact that the prevailing winds rarely blow from east to west and the plant is located approximately 20 miles east of the Troost monitor. The same rational holds for the other sources of SO2 in the area (Hawthorn, Blue Valley and Clay County Power plants) these sources are east of the violating Troost monitor (i.e.,

against the prevailing winds) and at a distance that limits their impact on the concentrations being detected at the Troost monitor. There are also a significant number of minor sources scattered throughout the city limits of Kansas City and Independence, Missouri; however these sources have emissions below 10tpy. EPA recognizes that there may be important new information on emissions levels for the period after 2009, and would consider more recent information if available. MDNR provided emissions information for large sources of SO2 in an around the three counties recommended for nonattainment for the years 2007 through 2009. During our review of MDNR’s boundary recommendation, we relied on the 2008 National Emissions Inventory (NEI) as well as the emissions data supplied by the Missouri for the year 2009. The NEI is updated every three years (e.g., 2008, 2011, etc.) and provides a snapshot of the emissions from the identified sources for the update year. Additional emissions information was provided by the state of Missouri from state emission databases. We do not have emissions data on Quindaro and Nearman for the year 2007. The emission data for Jackson County and the KC area we relied on during our review is included in table 7 below. Table 7 shows total emissions of SO2 (given in tons per year) for violating and potentially contributing counties in and around Jackson County, including Wyandotte County, KS for all sources emitting greater than 1000 tons of SO2 per year. Emissions Controls The emissions data used by EPA in this technical analysis and provided below represent real emissions levels occurring at the sources and thus take into account any control strategies implemented on the stationary sources in Jackson County up to and including the year 2009. EPA received additional information on emissions reductions resulting from state and federally enforceable controls put into place up to 2010.
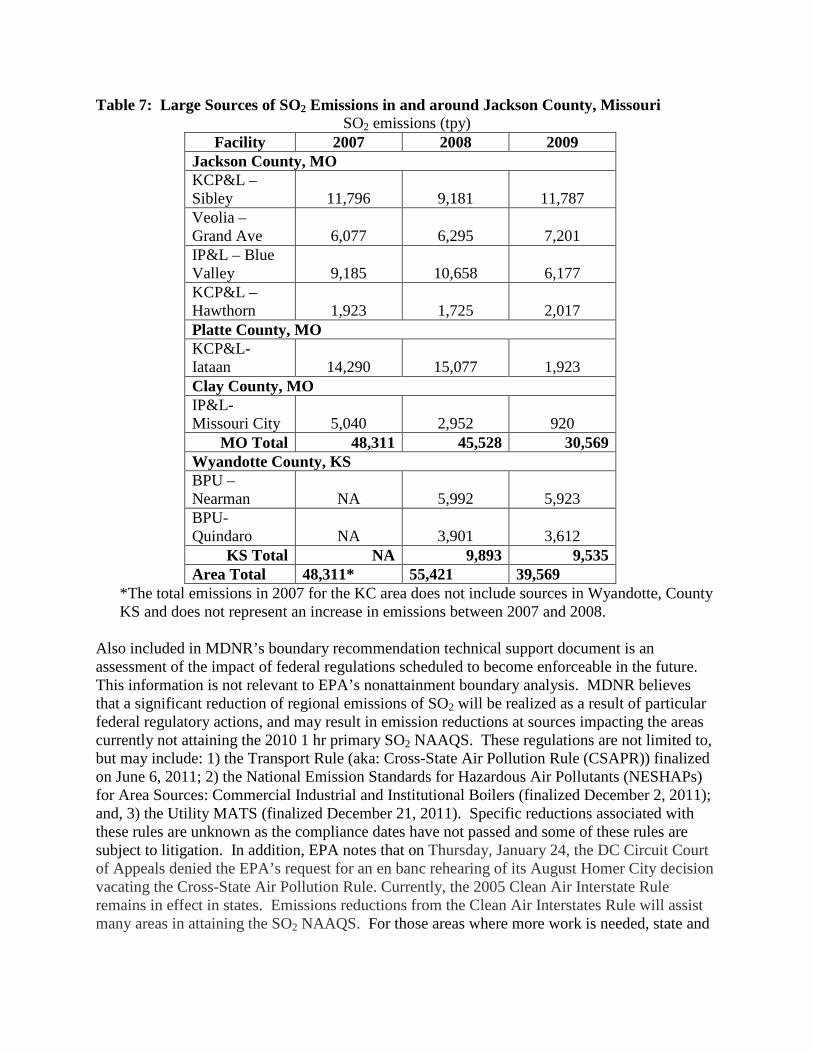
Table 7: Large Sources of SO2 Emissions in and around Jackson County, Missouri SO2 emissions (tpy)
Facility 2007 2008 2009 Jackson County, MO KCP&L – Sibley 11,796 9,181 11,787 Veolia – Grand Ave 6,077 6,295 7,201 IP&L – Blue Valley 9,185 10,658 6,177 KCP&L – Hawthorn 1,923 1,725 2,017 Platte County, MO KCP&L- Iataan 14,290 15,077 1,923 Clay County, MO IP&L- Missouri City 5,040 2,952 920
MO Total 48,311 45,528 30,569 Wyandotte County, KS BPU – Nearman NA 5,992 5,923 BPU- Quindaro NA 3,901 3,612
KS Total NA 9,893 9,535 Area Total 48,311* 55,421 39,569
*The total emissions in 2007 for the KC area does not include sources in Wyandotte, County KS and does not represent an increase in emissions between 2007 and 2008.
Also included in MDNR’s boundary recommendation technical support document is an assessment of the impact of federal regulations scheduled to become enforceable in the future. This information is not relevant to EPA’s nonattainment boundary analysis. MDNR believes that a significant reduction of regional emissions of SO2 will be realized as a result of particular federal regulatory actions, and may result in emission reductions at sources impacting the areas currently not attaining the 2010 1 hr primary SO2 NAAQS. These regulations are not limited to, but may include: 1) the Transport Rule (aka: Cross-State Air Pollution Rule (CSAPR)) finalized on June 6, 2011; 2) the National Emission Standards for Hazardous Air Pollutants (NESHAPs) for Area Sources: Commercial Industrial and Institutional Boilers (finalized December 2, 2011); and, 3) the Utility MATS (finalized December 21, 2011). Specific reductions associated with these rules are unknown as the compliance dates have not passed and some of these rules are subject to litigation. In addition, EPA notes that on Thursday, January 24, the DC Circuit Court of Appeals denied the EPA’s request for an en banc rehearing of its August Homer City decision vacating the Cross-State Air Pollution Rule. Currently, the 2005 Clean Air Interstate Rule remains in effect in states. Emissions reductions from the Clean Air Interstates Rule will assist many areas in attaining the SO2 NAAQS. For those areas where more work is needed, state and
local governments will develop and implement plans to reduce emissions from sources of significant SO2 emissions through enforceable emissions limits. Meteorology (weather/transport patterns) Evidence of source-receptor relationships between specific emissions sources and high SO2 values at violating monitors is another important factor in determining the appropriate contributing sources and the appropriate extent of the nonattainment area boundary. For this factor, EPA considered recent hourly or sub-hourly meteorological data from the metrological site(s) nearest to the violating monitor to determine which wind vectors were associated with 1-hour SO2 exceedances. For the nonattainment areas recommended by MDNR, the general meteorological data used in MDNR’s analysis were from the years 2005 and 2007. Additionally, MDNR utilized highly specific meteorological data for the days and hours proceeding high monitored readings recorded by the violating monitor in Jackson County (this data used for HYSPLIT modeling and analysis discussed more fully in a later section). The meteorological stations this data was collected from are operated by National Weather Service (NWS) for the purposes of cataloging representative weather conditions in the area. The NWS metrological stations used in both EPA’s and MDNR’s analysis are the stations in closest proximity to the violating monitor. In the case of Jackson County, Missouri, the metrological station is 2.8 km (1.74 miles) from the Troost monitor. EPA believes that the meteorological analysis and data used by MDNR properly represents the meteorological conditions that impact SO2 concentrations in the area of the violating monitor. In our review of MDNR’s analysis, EPA used the same meteorological station as MDNR for each of the monitors, but considered differing years to assess the general conditions that exist in Jackson County. In this analysis, we reviewed MDNR’s conclusions: MDNR’s Assessment of wind conditions in Missouri and Jackson County concludes that winds in the state of Missouri predominantly come from the Southeast and Northwest, and that, in general, winds from the Northeast are rare throughout the year. MDNR concludes that the greatest wind direction deviation in the county from the predominant wind pattern in the state routinely occurs in the 3rd quarter of the year and is representative when the winds predominantly come out of the Southwest.
Figure 11 shows a map of the meteorological data location with respect to the SO2 monitors (small purple balloons), large SO2 sources (large blue balloons) in the Jackson County, Missouri area, as well as the MDNR recommended nonattainment boundary outlined in red. Additionally. the metrological station is located on the map and represented as small white balloon.
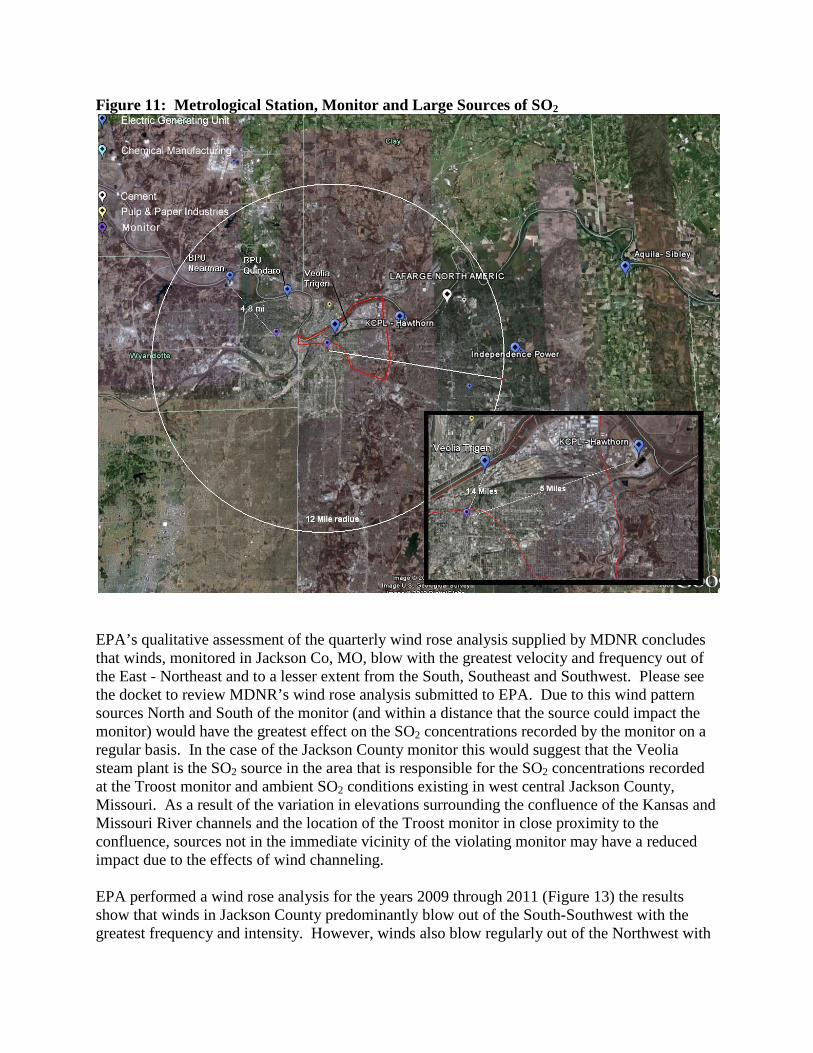
Figure 11: Metrological Station, Monitor and Large Sources of SO2
EPA’s qualitative assessment of the quarterly wind rose analysis supplied by MDNR concludes that winds, monitored in Jackson Co, MO, blow with the greatest velocity and frequency out of the East - Northeast and to a lesser extent from the South, Southeast and Southwest. Please see the docket to review MDNR’s wind rose analysis submitted to EPA. Due to this wind pattern sources North and South of the monitor (and within a distance that the source could impact the monitor) would have the greatest effect on the SO2 concentrations recorded by the monitor on a regular basis. In the case of the Jackson County monitor this would suggest that the Veolia steam plant is the SO2 source in the area that is responsible for the SO2 concentrations recorded at the Troost monitor and ambient SO2 conditions existing in west central Jackson County, Missouri. As a result of the variation in elevations surrounding the confluence of the Kansas and Missouri River channels and the location of the Troost monitor in close proximity to the confluence, sources not in the immediate vicinity of the violating monitor may have a reduced impact due to the effects of wind channeling. EPA performed a wind rose analysis for the years 2009 through 2011 (Figure 13) the results show that winds in Jackson County predominantly blow out of the South-Southwest with the greatest frequency and intensity. However, winds also blow regularly out of the Northwest with
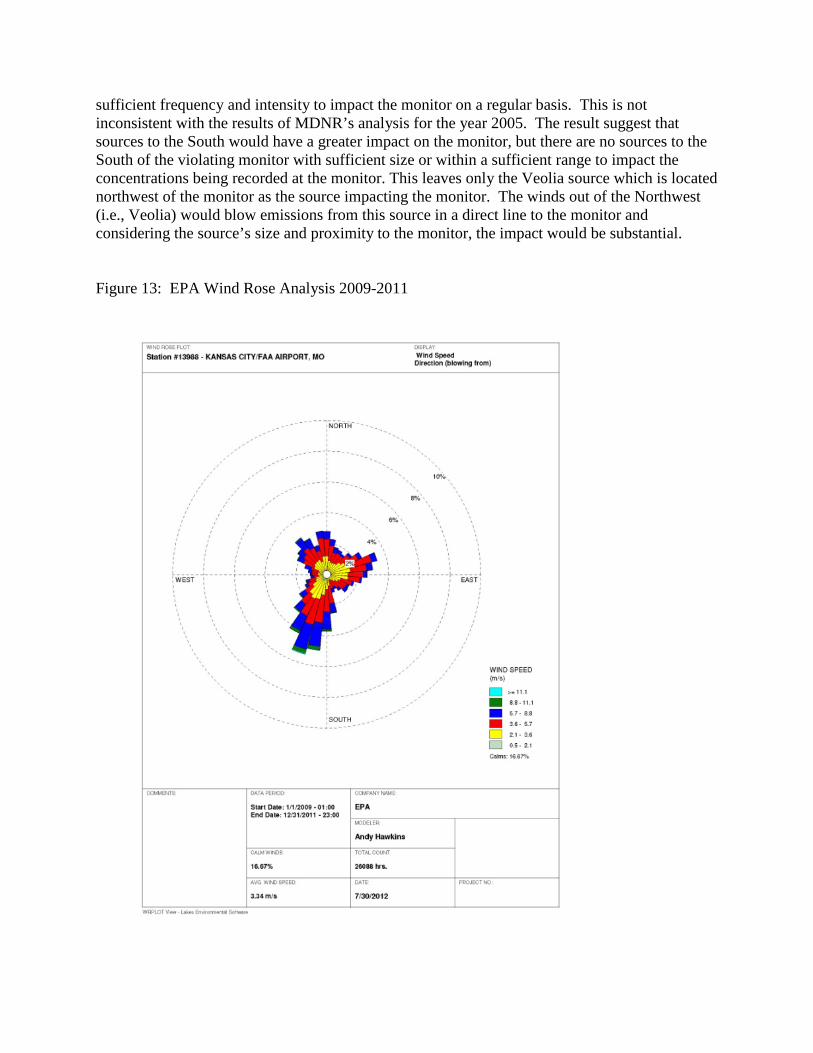
sufficient frequency and intensity to impact the monitor on a regular basis. This is not inconsistent with the results of MDNR’s analysis for the year 2005. The result suggest that sources to the South would have a greater impact on the monitor, but there are no sources to the South of the violating monitor with sufficient size or within a sufficient range to impact the concentrations being recorded at the monitor. This leaves only the Veolia source which is located northwest of the monitor as the source impacting the monitor. The winds out of the Northwest (i.e., Veolia) would blow emissions from this source in a direct line to the monitor and considering the source’s size and proximity to the monitor, the impact would be substantial. Figure 13: EPA Wind Rose Analysis 2009-2011

MDNR submitted back trajectory analysis derived from the Hybrid Single Particle Lagrangian Integrated Trajectory (HYSPLIT) model. Back trajectory modeling assesses the path an air parcel travels during the previous 24 hours to arrive at particular time and location. For this modeling MDNR used meteorological data corresponding to the 4 highest monitored readings at the violating monitors in Jackson County, MO. MDNR submitted to EPA back trajectory analysis derived from the HYSPLIT model. Back trajectory modeling assesses the path an air parcel travels during the previous 24 hours to arrive at particular time and location. For this modeling MDNR used meteorological data corresponding to the 4 highest hourly monitored readings recorded at the violating monitor in Jackson County, MO. A summary of the analysis results from MDNR is discussed below. Please see the docket to review MDNR’s HYPLIT plots for Jackson County, MO which is summarized below. – Jackson County, Missouri HYSPLIT Analysis Summary MDNR performed 12 composite trajectory analyses on days of recorded violations at the violating Troost Monitor. Eight of these trajectories come out of the northwest from the direction of the predominate source in the area (Grand Avenue/Veolia/Trigen). Those eight trajectories also align with two additional sources in Kansas (Nearman, and Quindaro plants) but due to the distance of these plants from the violating monitor, we are uncertain what contribution they make to the concentrations observed at the Troost monitor. We note that the four remaining trajectories originate from vectors which would not be conducive to KS emission contributions to the violating Troost monitor. In analyzing these trajectories, the Veolia/Trigen source remains the primary source of the violations based on the MO HYSPLIT analysis. In addition to the above information, EPA notes two important points. First, EPA conducted a site-specific SO2 source spatial observation analysis (found in the docket) that indicates the Veolia/Trigen plant is most likely to have the predominant impact on the violating Troost monitor due to its close proximity. Second, a review of the back trajectories for the high recorded concentration days at the Wyandotte County, KS monitor shows that on these “high” SO2 days, the back trajectory most frequently implicates the MO Veolia/Trigen plant as the culpable, predominant contributor to these concentrations. Therefore, we conclude that (based on the MO HYSPLIT and EPA observations) the contribution of the Veolia/Trigen plant’s emissions on the “high” value days at the nonviolating JFK monitor in KS, and the contribution of the Veolia/Trigen plant’s emissions on the exceedance days at the violating Troost monitor are the predominant contributions compared to all other SO2 sources in the area. Geography/Topography (mountain ranges or other air basin boundaries) In general, the Northern part of Missouri consists of open plains and contains few features that impede, restrict, or channel air speed and direction. The major geological features that can have small localized effects on wind direction and inversion are the Mississippi and Missouri River valleys. Generally, the effects of the river valleys are to channel localized air movement in a North-South (Mississippi) or East-West (Missouri) wind direction. The effect is not expected to affect the concentrations of SO2 observed at Jackson County monitoring location directly, but
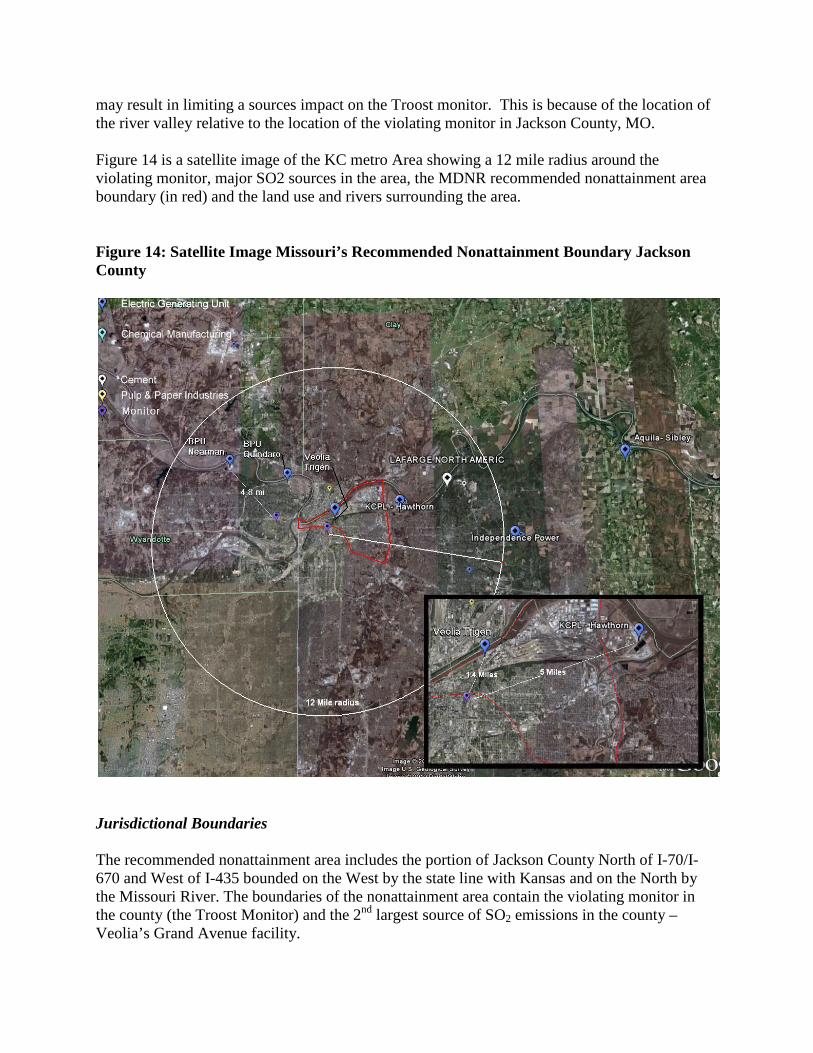
may result in limiting a sources impact on the Troost monitor. This is because of the location of the river valley relative to the location of the violating monitor in Jackson County, MO. Figure 14 is a satellite image of the KC metro Area showing a 12 mile radius around the violating monitor, major SO2 sources in the area, the MDNR recommended nonattainment area boundary (in red) and the land use and rivers surrounding the area. Figure 14: Satellite Image Missouri’s Recommended Nonattainment Boundary Jackson County
Jurisdictional Boundaries The recommended nonattainment area includes the portion of Jackson County North of I-70/I-670 and West of I-435 bounded on the West by the state line with Kansas and on the North by the Missouri River. The boundaries of the nonattainment area contain the violating monitor in the county (the Troost Monitor) and the 2nd largest source of SO2 emissions in the county – Veolia’s Grand Avenue facility.
The nonattainment boundaries recommended by MDNR include the following easily defined features – state, county or township boundaries, and large immovable features (rivers and highways). They are reasonable as they include the area surrounding the violating monitor, the source most likely contributing to the violating monitor, and are easily recognizable by the public. Other Relevant Information The existing information reviewed by EPA can be used to satisfactorily establish a nonattainment area boundary for the area. Conclusion After considering the 5 factors summarized below, EPA intends to find that it is appropriate to include the portions of Jackson County identified by MDNR as a nonattainment areas for the state of Missouri for the 2010 SO2 NAAQS.
The air quality monitor in Jackson County, Missouri shows a violation of the 2010 SO2 NAAQS, based on 2009-2011 air quality data. Based on the consideration of all the relevant and available information, as described above, EPA believes that the boundaries described herein encompass the appropriate initial nonattainment area for the 2010 SO2 NAAQS. .
Nonattainment Designations
Technical analysis for Jefferson County, Missouri
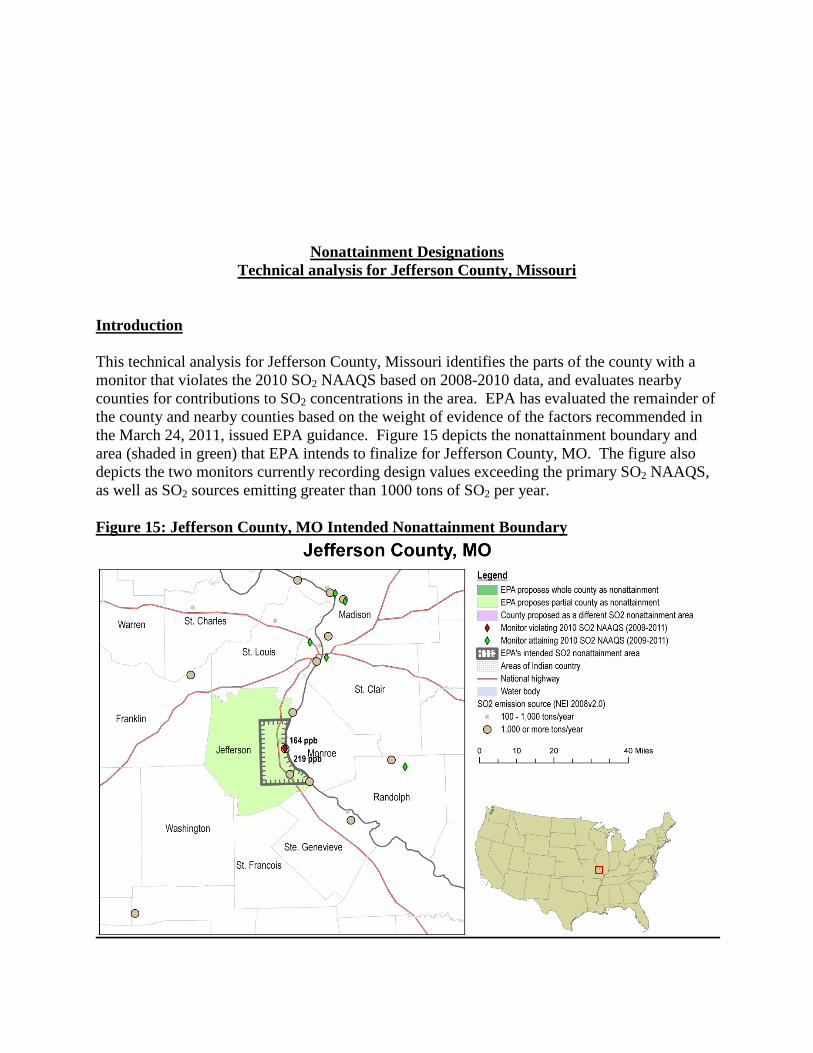
Introduction This technical analysis for Jefferson County, Missouri identifies the parts of the county with a monitor that violates the 2010 SO2 NAAQS based on 2008-2010 data, and evaluates nearby counties for contributions to SO2 concentrations in the area. EPA has evaluated the remainder of the county and nearby counties based on the weight of evidence of the factors recommended in the March 24, 2011, issued EPA guidance. Figure 15 depicts the nonattainment boundary and area (shaded in green) that EPA intends to finalize for Jefferson County, MO. The figure also depicts the two monitors currently recording design values exceeding the primary SO2 NAAQS, as well as SO2 sources emitting greater than 1000 tons of SO2 per year. Figure 15: Jefferson County, MO Intended Nonattainment Boundary
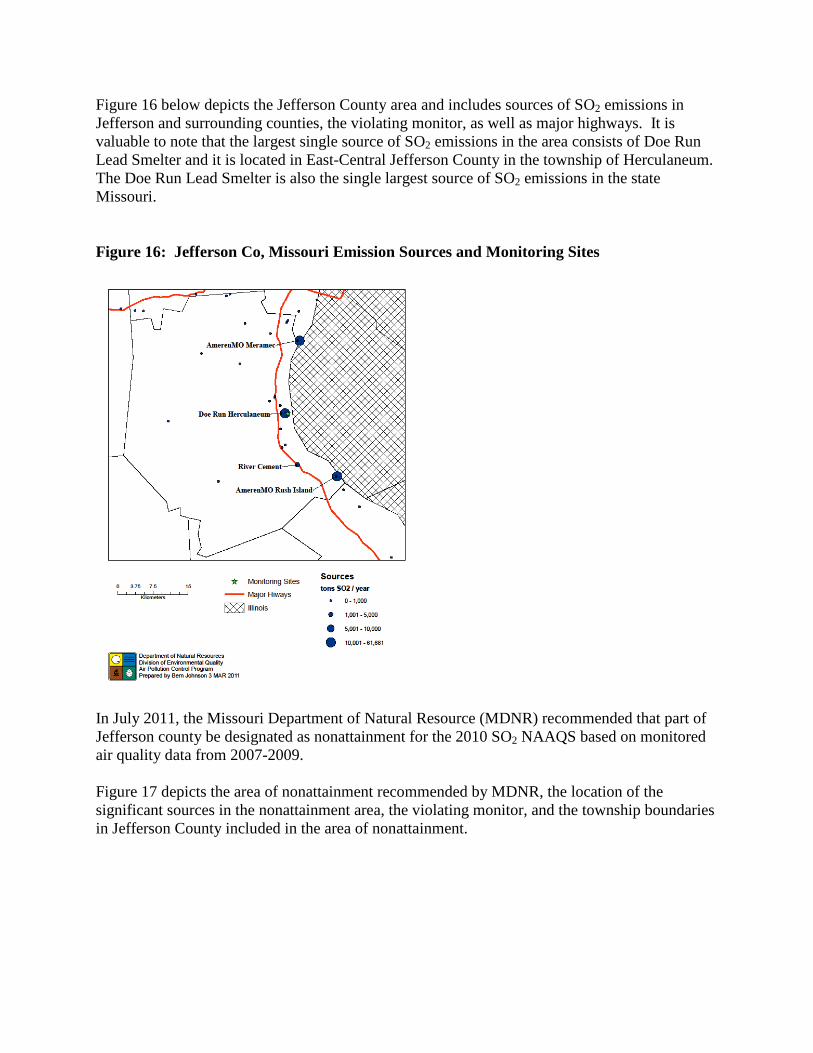
Figure 16 below depicts the Jefferson County area and includes sources of SO2 emissions in Jefferson and surrounding counties, the violating monitor, as well as major highways. It is valuable to note that the largest single source of SO2 emissions in the area consists of Doe Run Lead Smelter and it is located in East-Central Jefferson County in the township of Herculaneum. The Doe Run Lead Smelter is also the single largest source of SO2 emissions in the state Missouri. Figure 16: Jefferson Co, Missouri Emission Sources and Monitoring Sites
In July 2011, the Missouri Department of Natural Resource (MDNR) recommended that part of Jefferson county be designated as nonattainment for the 2010 SO2 NAAQS based on monitored air quality data from 2007-2009. Figure 17 depicts the area of nonattainment recommended by MDNR, the location of the significant sources in the nonattainment area, the violating monitor, and the township boundaries in Jefferson County included in the area of nonattainment.
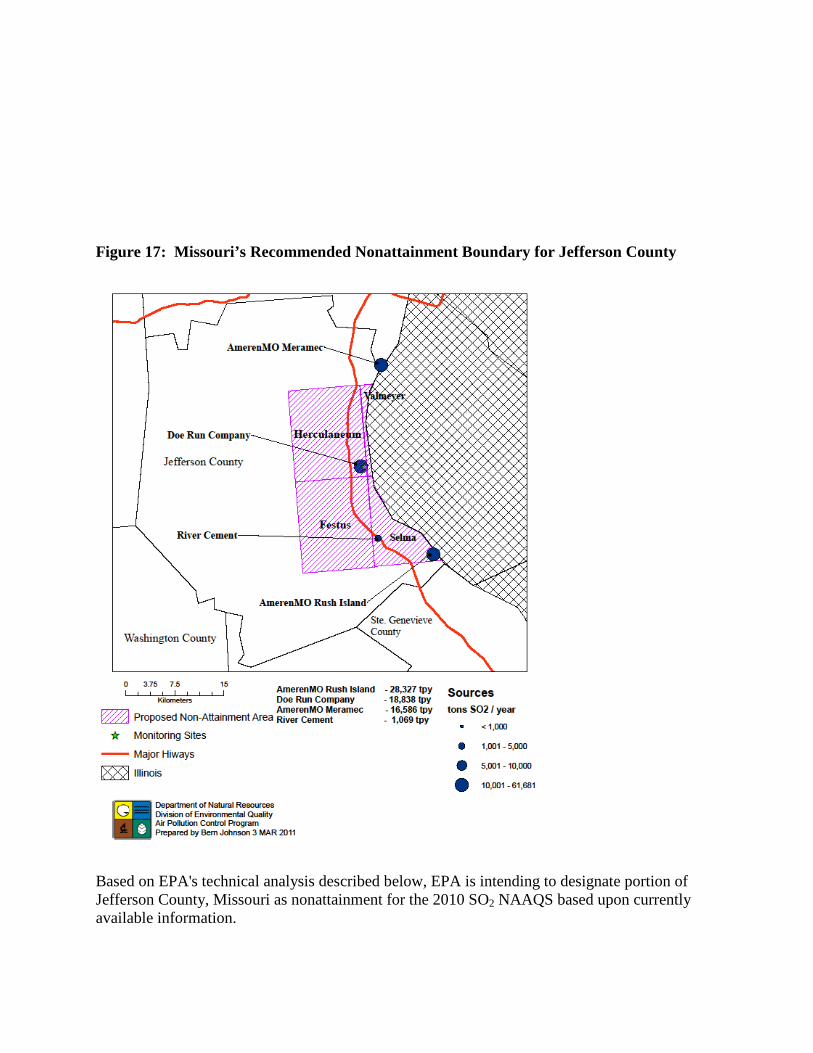
Figure 17: Missouri’s Recommended Nonattainment Boundary for Jefferson County
Based on EPA's technical analysis described below, EPA is intending to designate portion of Jefferson County, Missouri as nonattainment for the 2010 SO2 NAAQS based upon currently available information.

Detailed Assessment Air Quality Data This factor considers the SO2 air quality monitoring data, including the design value (in ppb) calculated for all air quality monitors in Jefferson Counties Missouri, and the surrounding area based on data for the 2008-2010 period. MDNR’s recommendation was based on data collected from monitor(s) located in the state meeting the specifications of a Federal Reference Method (FRM) or Federal Equivalent Method (FEM) in accordance with 40 CFR Part 53 (see letter from Sara Parker Pauley Director of MDNR to Karl Brooks Region Administrator EPA Region 7 dated July 19, 2011) . The 3-year design values for 2007-2009, 2008-2010, and 2009-2011 for the SO2 NAAQS for Jefferson County, MO are shown below in table 8. Table 8: Air Quality Data for Nonattainment Designations in Missouri
County State
Recommended Nonattainment?
Monitor Name Monitor Air Quality System ID Monitor Location
3 yr SO2 Design Value (ppb) ’08 thru‘10
Jefferson, MO Yes Herculaneum Main Street 290990004 Jefferson Co,
MO 289
Jefferson, MO Yes Herculaneum Mott Street* 290990027 Jefferson Co,
MO NA
*Mott Street monitor was relocated from Main Street in 2011 ** Data for Mott and Main Street monitor locations is incomplete in 2011. The monitor was shutdown during for an extended period. EPA was unable to establish a valid design for Jefferson County, Missouri for years 2009 to 2011 due to incomplete monitoring data for 2011. However, the valid design value for Jefferson County, Missouri for the years 2008 to 2010 shows a violation of the 2010 SO2 primary NAAQS. In response to the incomplete data for 2011, EPA elected to use the 2008 through 2010 data to establish a valid design value because the monitored results are representative of the ambient conditions that exist in the area. As a result of the violating design value for 2008 through 2010, some area in this county must be designated nonattainment. The absence of a violating monitor alone is not a sufficient reason to eliminate nearby counties as candidates for inclusion in a nonattainment area. Each area has been evaluated based on the weight of evidence of the five factors and other relevant information. The monitor in Jefferson Co, MO recording ambient air concentrations of SO2 is showing a concentration substantially in excess of the 1-hr SO2 primary NAAQS. The location of the monitor, the surrounding terrain, and the meteorological conditions that exist during the recorded violations suggest that the source of the SO2 in the area is the Doe Run Lead Smelter. The nonattainment boundary recommended by MDNR, appropriately captures the Doe Run sources and properly bounds the area of nonattainment considering these factors. The design value establishing Jefferson County, Missouri as nonattainment for the 2010 1-hr primary SO2 NAAQS is based on data collected between 2008 – 2010 rather than 2009 – 2011.
This is because the original monitor, the Herculaneum Main Street Monitor (AQS ID 290990004) was shutdown and moved to a new location less than 1 block from the previous location on May 23, 2011. The monitor was restarted on June 15, 2011 in its new location on Mott Street (AQS ID 290990027), but the due to the period of shutdown, the data set for 2011 was no longer complete for purposes of establishing a design value for the 2010 1-hr primary SO2 NAAQS. The monitor was relocated because the property where it was located on Main Street (previously owned by the City of Herculaneum) was purchased by the ownership of the Doe Run Lead Smelter, and MDNR no longer had access to operate the monitor by the new property owner. EPA believes that the new monitoring location (on Mott Street) is in close enough proximity to the previous (main Street) location that the data for ambient concentrations of SO2 could be combined (and a review of the data show consistent SO2 concentration measurements before and after the move); however, the lack of data collection between May 23, 2011, and June 15, 2011 caused the data to be incomplete under the provisions of 40 CFR Part 50 Appendix T, and therefore could not be used to establish a design value directly. Using data from both monitor locations and combining for the years 2009-2011, and using a conservative method of replacing missing data with zeros, the design value would be 164ppb, which is a violation of the 2010 SO2 primary NAAQS. In response to this situation, EPA elected to establish the design value in support of the nonattainment boundary designation based on 2008 – 2010 data, as that data is complete and continues to represent the ambient concentrations of SO2 that exist in the area at the present time. Emissions and Emissions-Related Data
Evidence of SO2 emissions sources in the vicinity of a violating monitor is an important factor for determining whether a nearby area is contributing to a monitored violation. For this factor, EPA evaluated county level emissions data for SO2 and any growth in SO2 emitting activities since the date represented by those emissions data. Emissions There are 14 sources of SO2 listed in the NEI in operation in Jefferson County. Of these sources only 4 have emissions of greater than 100 tons per year and 3 that emit over 100 tons of SO2 per year and are considered significant sources of SO2 in the Jefferson County area. All major SO2
sources in Jefferson County are located along the Mississippi River. Overall SO2 emissions were down about 24% from 2007-08. This was due to a new, more accurate method of measurement at the Doe Run’s Herculaneum smelter which resulted in a correction of almost minus 50%, and reductions in electricity demand due to the recession and a mild summer. There are no significant sources west of Interstate 55 in the Jefferson County area. EPA recognizes that there may be important new information on emissions levels for the period after 2008, and would consider more recent information if available. MDNR provided emissions information for large sources of SO2 in an around the three counties recommended for nonattainment for the years 2007 through 2009 as shown in Table 9. During our review of
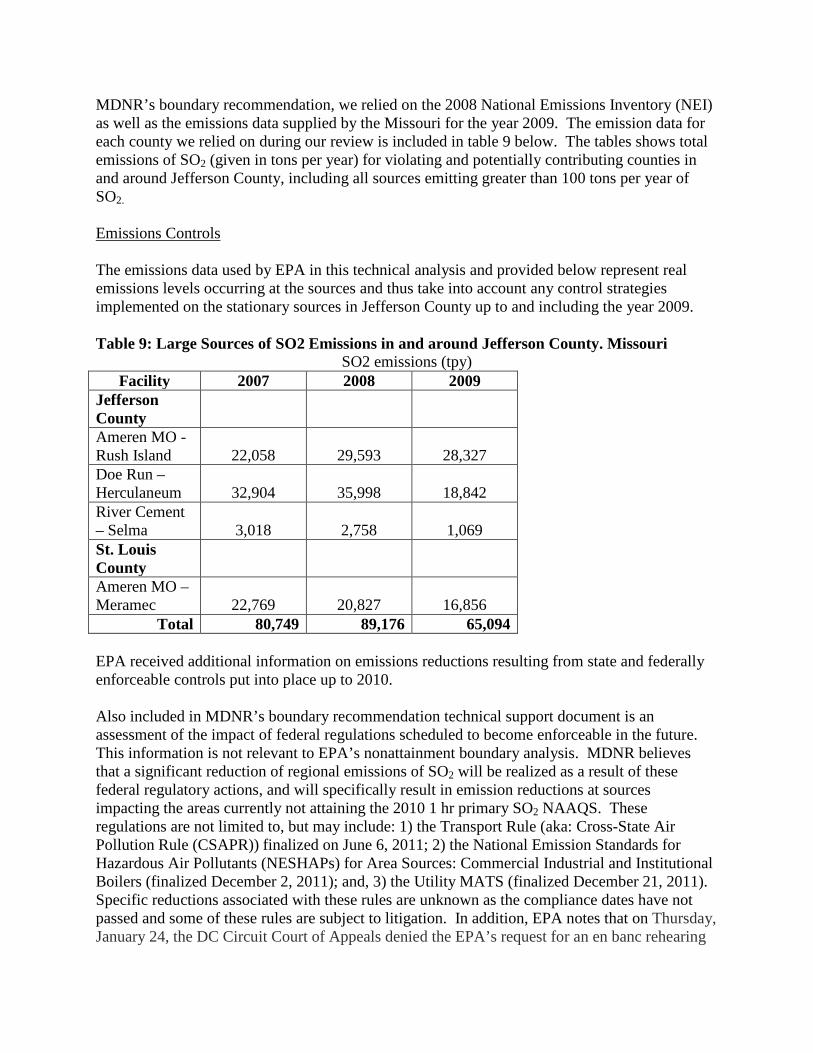
MDNR’s boundary recommendation, we relied on the 2008 National Emissions Inventory (NEI) as well as the emissions data supplied by the Missouri for the year 2009. The emission data for each county we relied on during our review is included in table 9 below. The tables shows total emissions of SO2 (given in tons per year) for violating and potentially contributing counties in and around Jefferson County, including all sources emitting greater than 100 tons per year of SO2. Emissions Controls The emissions data used by EPA in this technical analysis and provided below represent real emissions levels occurring at the sources and thus take into account any control strategies implemented on the stationary sources in Jefferson County up to and including the year 2009. Table 9: Large Sources of SO2 Emissions in and around Jefferson County. Missouri
SO2 emissions (tpy) Facility 2007 2008 2009
Jefferson County Ameren MO - Rush Island 22,058 29,593 28,327 Doe Run – Herculaneum 32,904 35,998 18,842 River Cement – Selma 3,018 2,758 1,069 St. Louis County Ameren MO – Meramec 22,769 20,827 16,856
Total 80,749 89,176 65,094 EPA received additional information on emissions reductions resulting from state and federally enforceable controls put into place up to 2010. Also included in MDNR’s boundary recommendation technical support document is an assessment of the impact of federal regulations scheduled to become enforceable in the future. This information is not relevant to EPA’s nonattainment boundary analysis. MDNR believes that a significant reduction of regional emissions of SO2 will be realized as a result of these federal regulatory actions, and will specifically result in emission reductions at sources impacting the areas currently not attaining the 2010 1 hr primary SO2 NAAQS. These regulations are not limited to, but may include: 1) the Transport Rule (aka: Cross-State Air Pollution Rule (CSAPR)) finalized on June 6, 2011; 2) the National Emission Standards for Hazardous Air Pollutants (NESHAPs) for Area Sources: Commercial Industrial and Institutional Boilers (finalized December 2, 2011); and, 3) the Utility MATS (finalized December 21, 2011). Specific reductions associated with these rules are unknown as the compliance dates have not passed and some of these rules are subject to litigation. In addition, EPA notes that on Thursday, January 24, the DC Circuit Court of Appeals denied the EPA’s request for an en banc rehearing

of its August Homer City decision vacating the Cross-State Air Pollution Rule. Currently, the 2005 Clean Air Interstate Rule remains in effect in states. Emissions reductions from the Clean Air Interstates Rule will assist many areas in attaining the SO2 NAAQS. For those areas where more work is needed, state and local governments will develop and implement plans to reduce emissions from sources of significant SO2 emissions through enforceable emissions limits. Meteorology (weather/transport patterns) Evidence of source-receptor relationships between specific emissions sources and high SO2 values at violating monitors is another important factor in determining the appropriate contributing areas and the appropriate extent of the nonattainment area boundary. For this factor, EPA considered recent hourly or sub-hourly meteorological data from the metrological site(s) nearest to the violating monitor(s) to determine which wind vectors were associated with 1-hour SO2 exceedances. For the nonattainment areas recommended by MDNR, the general meteorological data used in MDNR’s analysis were from the years 2005 and 2007. Additionally, MDNR utilized highly specific meteorological data for the days and hours proceeding high monitored readings recorded by the violating monitors in Jefferson County (this data used for HYSPLIT modeling and analysis discussed more fully in a later section). The meteorological stations this data was collected from are operated by National Weather Service (NWS) for the purposes of cataloging representative weather conditions in the area. The NWS metrological stations used in both EPA’s and MDNR’s analysis are the stations in closest proximity to the violating monitor – in the case of Jefferson County analysis the nearest MWS station is located in St Louis, MO at the Spirit of St. Louis Airport approximately 50.0 km (32 miles) away from the violating monitor in Jefferson County . EPA believes that the meteorological analysis and data used by MDNR properly represents the meteorological conditions that impact SO2 concentrations in the area of the violating monitor. In our review of MDNR’s analysis, EPA used the same meteorological station as MDNR for each of the monitors, but considered differing years to assess the general conditions that exist in Jefferson County. In this analysis we confirmed MDNR’s conclusions for Jefferson County, MO: Winds in the state of Missouri predominantly come from the Southeast and Northwest. Winds from the Northeast are rare throughout the year. The greatest wind direction deviation in Jefferson County from the predominant wind patter in the state routinely occurs in the 2nd quarter of the year and is representative when the wind predominantly comes out of an area that varies equally from Southeast to Northwest. MDNR supplied Wind Rose Data for Jefferson County, Missouri. Please see the docket to review MDNR’s wind rose analysis submitted to EPA. EPA’s qualitative assessment of the of the quarterly wind rose data for Jefferson county concludes that winds in the area blow consistently from all directions, but more consistently from headings that fall within an arc from the North through the West to the East. This pattern suggests that sources both North and South of the violating monitor may influence the concentrations detected at the monitor. However, because the source’s – north and south of the violating monitor - location on the Mississippi River and the violating monitor’s location higher in elevation East of the Mississippi river, and the propensity of the localized topography of the river valley to disperse the emission along the river valley, EPA is not prepared to conclude that the sources North of the violating monitor are
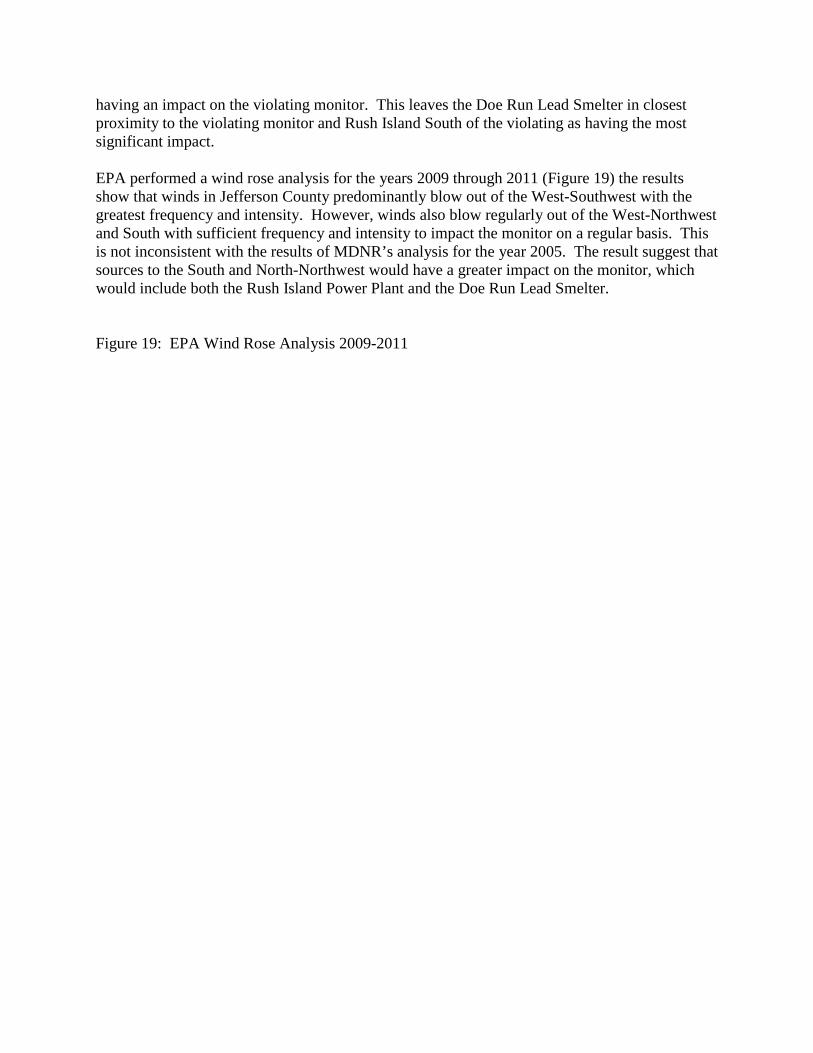
having an impact on the violating monitor. This leaves the Doe Run Lead Smelter in closest proximity to the violating monitor and Rush Island South of the violating as having the most significant impact. EPA performed a wind rose analysis for the years 2009 through 2011 (Figure 19) the results show that winds in Jefferson County predominantly blow out of the West-Southwest with the greatest frequency and intensity. However, winds also blow regularly out of the West-Northwest and South with sufficient frequency and intensity to impact the monitor on a regular basis. This is not inconsistent with the results of MDNR’s analysis for the year 2005. The result suggest that sources to the South and North-Northwest would have a greater impact on the monitor, which would include both the Rush Island Power Plant and the Doe Run Lead Smelter. Figure 19: EPA Wind Rose Analysis 2009-2011
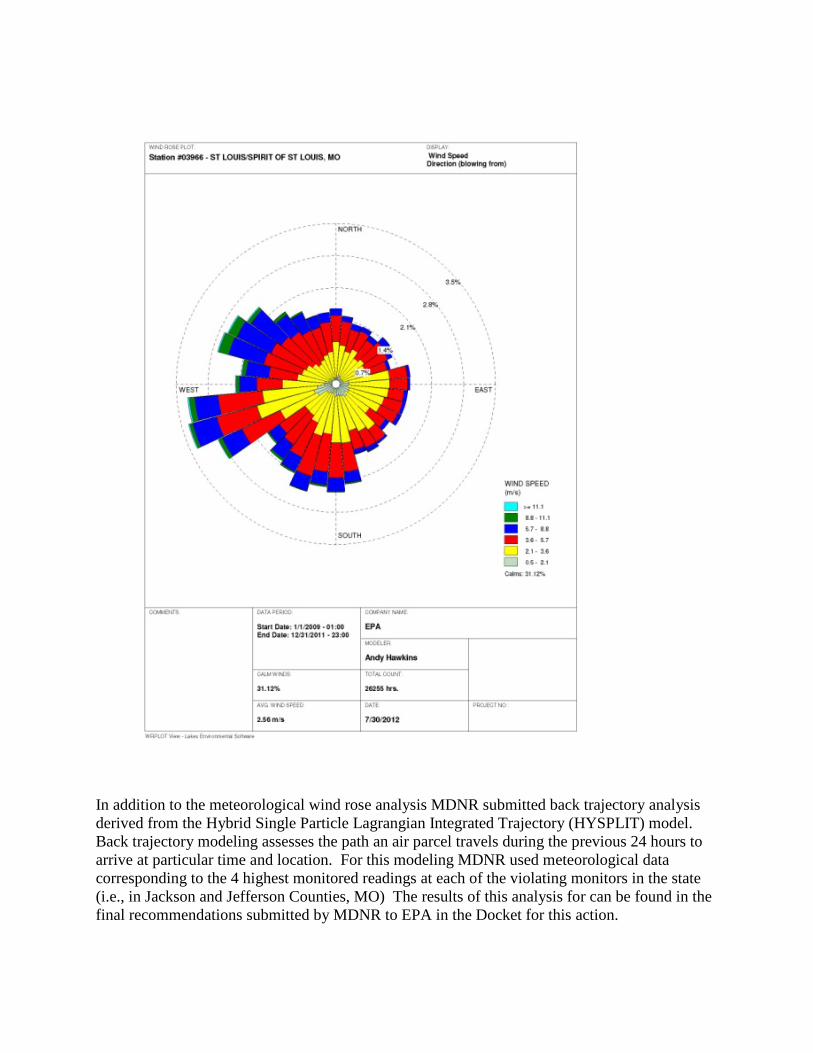
In addition to the meteorological wind rose analysis MDNR submitted back trajectory analysis derived from the Hybrid Single Particle Lagrangian Integrated Trajectory (HYSPLIT) model. Back trajectory modeling assesses the path an air parcel travels during the previous 24 hours to arrive at particular time and location. For this modeling MDNR used meteorological data corresponding to the 4 highest monitored readings at each of the violating monitors in the state (i.e., in Jackson and Jefferson Counties, MO) The results of this analysis for can be found in the final recommendations submitted by MDNR to EPA in the Docket for this action.

– Jefferson County, Missouri Summary of HYSPLIT Analysis MDNR performed 12 composite trajectory analyses on days of recorded violations, eleven of the trajectories come from the South moving up the Mississippi River Valley. The 12th trajectory comes from the West. The result of these trajectories suggest the primary source of SO2 concentrations observed at the Herculaneum Main Street monitor is from a heading slightly South from the direction of the Mississippi River Valley. This would strongly suggest that most significant source of SO2 emissions in the area of the violating monitor in Herculaneum is Doe Run Smelter. The nonattainment boundary recommended by MDNR properly includes the sources of SO2 emissions and the area where the SO2 concentration in the ambient air violates the NAAQS. Geography/Topography (mountain ranges or other air basin boundaries) In general, the Northern part of Missouri consists of open plains and contains few features that impede, restrict, or channel air speed and direction. The major geological features that can have small localized effects on wind direction and inversion are the Mississippi and Missouri River valleys. Generally, the effects of the river valleys are to channel localized air movement in a North-South (Mississippi) or East-West (Missouri) wind direction. The effect is not expected to affect the concentrations of SO2 observed at the monitoring locations (because there are no SO2 sources directly East or west of the violating monitor), but could result in limiting the sources that impact a particular monitor. The channeling effect of the Mississippi River valley is expected to be limiting the affect that both the Meramec and Rush Island power plants have on the violating monitor in Herculaneum township. The monitors location adjacent to the Doe Run Lead Smelter (the largest source of SO2 emissions in Missouri) as well as the consistently high concentrations recorded by the monitor on days of varying wind direction leads EPA to conclude that the Doe Run Smelter is the primary contributor of ambient SO2 concentrations recorded at the Herculaneum monitor and that one of the two power plants in closest proximity is having a measureable impact on the monitor. Figure 20 shows the Jefferson County Area including the location of the violating monitor (purple balloon), a 12 mile radius around the violating monitor (white balloon) and major sources of SO2 in the area (blue balloons), as well as the MDNR recommended nonattainment area (outlined in red). Figure 20: Satellite Image Missouri’s Recommended Nonattainment Boundary Jefferson County
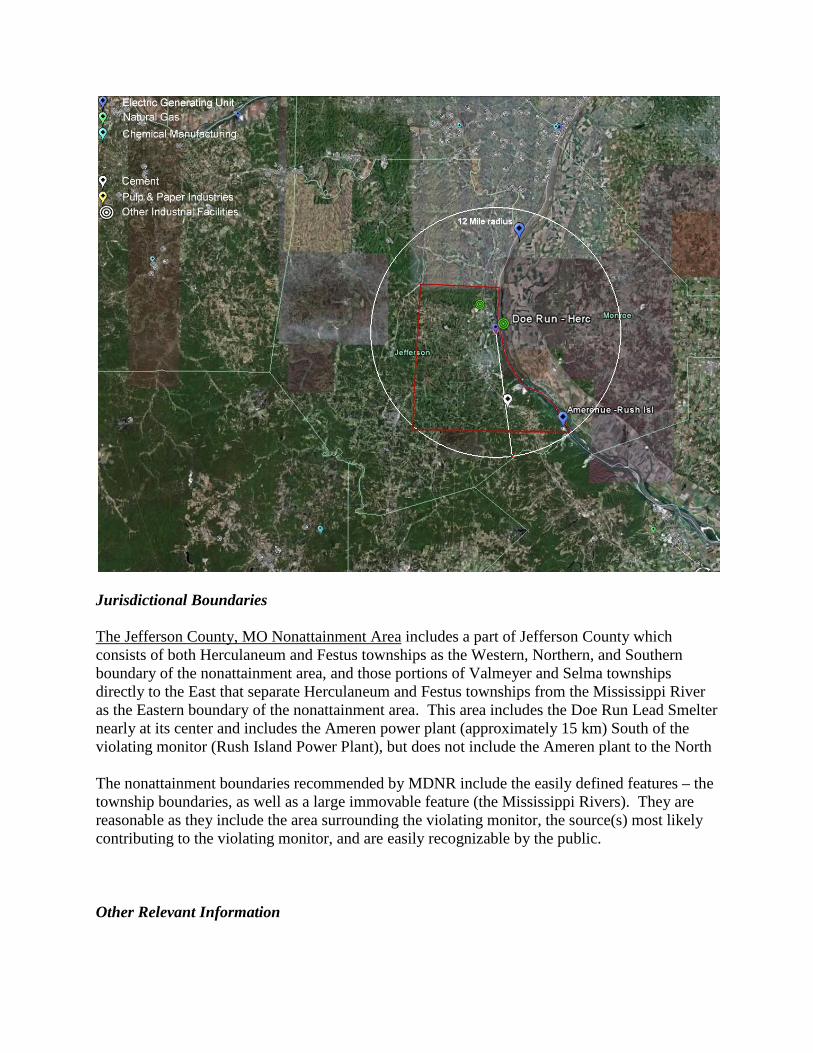
Jurisdictional Boundaries The Jefferson County, MO Nonattainment Area includes a part of Jefferson County which consists of both Herculaneum and Festus townships as the Western, Northern, and Southern boundary of the nonattainment area, and those portions of Valmeyer and Selma townships directly to the East that separate Herculaneum and Festus townships from the Mississippi River as the Eastern boundary of the nonattainment area. This area includes the Doe Run Lead Smelter nearly at its center and includes the Ameren power plant (approximately 15 km) South of the violating monitor (Rush Island Power Plant), but does not include the Ameren plant to the North The nonattainment boundaries recommended by MDNR include the easily defined features – the township boundaries, as well as a large immovable feature (the Mississippi Rivers). They are reasonable as they include the area surrounding the violating monitor, the source(s) most likely contributing to the violating monitor, and are easily recognizable by the public. Other Relevant Information
The existing information reviewed by EPA can be used to satisfactorily establish a nonattainment area boundary for the area. Conclusion After considering the 5 factors summarized below, EPA intends to find that it is appropriate to include the portions of Jefferson County identified by MDNR as a nonattainment area for the state of Missouri for the 2010 SO2 NAAQS. The air quality monitor in Jefferson County shows a violation of the 2010 SO2 NAAQS, based on 2008-2010 air quality data. Based upon the consideration of all relevant and available information, as described above, EPA believes that the boundaries described herein encompass the appropriate initial nonattainment area for the 2010 SO2 NAAQS.