draft -...
TRANSCRIPT

Fort Bend County Hazard Mitigation Plan Update
City of Orchard
2017
DRAFT

i
Table of Contents
Fort Bend County Hazard Mitigation Plan, City of Orchard
Table of ContentsSection 1: Organize and Review ............................................................................................. 1Section 2: Risk Assessment ................................................................................................... 7Drought .................................................................................................................................... 8
Extreme Heat ....................................................................................................................................................................... 11Severe Winter Storms .......................................................................................................................................................... 13Lightning .............................................................................................................................................................................. 17Hailstorms ........................................................................................................................................................................... 20Windstorms ......................................................................................................................................................................... 23Tornadoes ............................................................................................................................................................................ 26Expansive Soils ..................................................................................................................................................................... 30Floods .................................................................................................................................................................................. 31Land Subsidence .................................................................................................................................................................. 35Hurricanes/Tropical Storms .................................................................................................................................................. 37Earthquakes ......................................................................................................................................................................... 41Dam/Levee Failure ............................................................................................................................................................... 43Wildfires .............................................................................................................................................................................. 44Risk Ranking Result .............................................................................................................................................................. 47
Section 3: Mitigation Strategy .............................................................................................. 48Section 4: Finalize Plan Update ............................................................................................ 60Section 5: Approval and Adoption ........................................................................................ 61References ............................................................................................................................. 63Figures
Figure OR.01, City of Orchard Planning Area .......................................................................................................................... 1Figure OR.02, Major Employers .............................................................................................................................................. 2Figure OR.03, Utility Providers ............................................................................................................................................... 2Figure OR.04, Planning Committee Membership .................................................................................................................... 2Figure OR.05, City of Orchard Plan Participation .................................................................................................................... 3Figure OR.06, Plan Stakeholders ............................................................................................................................................ 3Figure OR.07, Review/Incorporation of Sources ..................................................................................................................... 5Figure OR.08, Public Involvement for Updates ....................................................................................................................... 6Figure OR.09, Fort Bend County Hazard Mitigation Plan Maintenance Schedule, City of Orchard ........................................... 6Figure OR.10, Reported Drought Occurrence, Fort Bend County ............................................................................................ 8Figure OR.11, Drought Probability .......................................................................................................................................... 9Figure OR.12, Reported Drought Impacts, Fort Bend County .................................................................................................. 9Figure OR.13, Fort Bend County Hospital Inpatient Data, Extreme Heat ............................................................................... 11Figure OR.14, Winter Weather Occurrences, Fort Bend County ............................................................................................ 13Figure OR.15, Severe Winter Storms Probability .................................................................................................................. 14Figure OR.16, Winter Weather Related Power Outages, Fort Bend Surrounding Areas ......................................................... 14Figure OR.17, Winter Weather Related Crashes, Rural Fort Bend County ............................................................................. 15Figure OR.18, Average Annual Lightning Density, City of Orchard ......................................................................................... 17Figure OR.19, Thunderstorm Related Power Outages, Fort Bend Surrounding Areas ............................................................ 18Figure OR.20, National Hail Days Per Year, City of Orchard ................................................................................................... 20Figure OR.21, Hail Occurrences, City of Orchard .................................................................................................................. 21Figure OR.22, Hailstorms Probability .................................................................................................................................... 21Figure OR.23, National Wind Days Per Year, City of Orchard ................................................................................................. 23Figure OR.24, Reported Wind Events, City of Orchard .......................................................................................................... 24Figure OR.25, Windstorms Probability ................................................................................................................................. 24Figure OR.26, National Tornado Days Per Year, City of Orchard ............................................................................................ 26Figure OR.27, Tornado Events, Fort Bend County ................................................................................................................. 27Figure OR.28, Tornadoes Probability .................................................................................................................................... 28Figure OR.29, Flood Hazard Areas, City of Orchard ............................................................................................................... 31Figure OR.30, City of Orchard Floodplain Acreage ................................................................................................................ 31Figure OR.31, Flood Events, Fort Bend County ..................................................................................................................... 32Figure OR.32, Floods Probability .......................................................................................................................................... 33Figure OR.33, Building Counts, City of Orchard .................................................................................................................... 33Figure OR.34, Building Replacement Values, City of Orchard ................................................................................................ 33
DRAFT

ii
Tabl
e of
Con
tent
sFort Bend County Hazard Mitigation Plan, City of Orchard
Figure OR.35, Groundwater Depletion Zones, City of Orchard .............................................................................................. 35Figure OR.36, Historical Hurricane/Tropical Storm Paths, City of Orchard ............................................................................ 37Figure OR.37, Hurricanes/Tropical Storms Affecting Fort Bend County ................................................................................. 38Figure OR.38, Hurricanes/Tropical Storms Probability .......................................................................................................... 39Figure OR.39, Property Damage Losses, City of Orchard ....................................................................................................... 39Figure OR.40, Earthquakes Probability ................................................................................................................................. 41Figure OR.41, Wildland Urban Interface (WUI), City of Orchard ........................................................................................... 44Figure OR.42, TxWRAP Fire Intensity Acreage – City of Orchard ........................................................................................... 45Figure OR.43, WUI Acreage, City of Orchard ........................................................................................................................ 46Figure OR.44, Risk Ranking Results, City of Orchard ............................................................................................................. 47Figure OR.45, Existing Capabilities, City of Orchard .............................................................................................................. 48Figure OR.46, Mitigation Actions.......................................................................................................................................... 50Figure OR.47, Mitigation Action Summary Worksheet .......................................................................................................... 56Figure OR.48, Mitigation Action Prioritization ..................................................................................................................... 57Figure OR.49, Mitigation Action Impact, City of Orchard ...................................................................................................... 58Figure OR.50, Plan Integration Efforts .................................................................................................................................. 59Figure OR.51, Past Mitigation Action Progress Reports Summary - Completed and Canceled ............................................... 60Figure OR.52, Municipal Jurisdiction Adoption Date ............................................................................................................ 61
DRAFT

Fort Bend County Hazard Mitigation Plan, City of Orchard
1
Organize and R
eview
City of Orchard AnnexSection 1: Organize and ReviewThis section contains a brief description of the City of Orchard and its jurisdictional features. In addition, Section 1 contains the following details regarding Orchard’s:
• participation in the Fort Bend County HMP Update process,
• stakeholder engagement,
• public outreach strategy,
• incorporation efforts, and
• plan maintenance procedures.
*Population: 326
Size of Community: 0.35 sq. miles
*Population over 65 years old: 32
*Population under 16 years old: 87
*Economically Disadvantaged Population ($0-$20k) : 25
Orchard is serviced by the following responders:
Fire: Orchard Volunteer Fire Department (ESD #3)
EMS: Fort Bend County Emergency Medical Services
Law Enforcement: Fort Bend County Sheriff’s Office
*HAZUS-MH 3.2 Updated Census 2010 Population Estimates
Figure OR.01, City of Orchard Planning Area Community DescriptionWhen planning, it is important to take into account the characteristics that make a community unique. Consideration of unique needs when it comes to mitigating or recovering from natural hazards ensures that all members of the community and their needs are addressed.
The City of Orchard is located at the intersection of Farm Road 1489 and State Highway 36, 13 miles west of Richmond in western Fort Bend County, as shown in Figure OR.01.
According to the City of Orchard website, 97% of the commuters drive to work and 62% of the residents are married. Orchard is a General Law City governed by a Mayor, and 2 Commissioners. The City is supported by staff serving on an Economic Development Council (7 members), Industrial Development Corporation (4 members), Orchard Cultural Education Facilities Finance Corporation (3 members), and 4 general city staff.
Orchard is served by the Brazos Independent School District (ISD). Major employers and utility providers are shown in Figures OR.02 and OR.03.
Brazos River
Sugar Land
Katy
Fresno
Sienna Plantation
Pecan Grove
Cinco Ranch
Mission Bend
New TerritoryCumings
East Bernard
Four Corners
Fifth Street
Greatwood
10
69
90
90
59
6
36
99
Map Not to Scale.
NORTH
DRAFT

Fort Bend County Hazard Mitigation Plan, City of Orchard
2
Org
aniz
e an
d R
evie
w
Planning Committee Planners who represented Orchard for the update process are collectively known as the Orchard Mitigation Planning Committee (MPC) and are shown in Figure OR.04.
Figure OR.03, Utility Providers
Type Provider
Electric CenterPointWater City Water - Standpipe back-up source
Gas CenterPoint
Cable/Internet HughesNet
Figure OR.04, Planning Committee Membership
Community/Jurisdiction Agency Title
Figure OR.02, Major Employers
Business Type Name of Employer
Manufacturing EFI Panels, LLC
Education Brazos Elementary School
Retail Chevron (Interview, City Engineer, 2017)
City of Orchard City Hall
Mayor
City EngineerDRAFT

Fort Bend County Hazard Mitigation Plan, City of Orchard
3
Organize and R
eview
Community Planning Involvement
9 Planner’s SurveyData Collection Spreadsheet/GIS Data
9 Planning Worksheets 9 Phone Interview
9 Kick-off 9 Risk Assessment 9 Mitigation Strategy
StakeholdersDuring the Phase 1 Kick-Off Meeting, planners were provided with a Planner/Stakeholder worksheet, referred to in Chapter 1, the Plan Process portion of the Fort Bend County HMP Update. This document allowed planners to identify stakeholders for inclusion in the Risk Assessment and Mitigation Strategy Meetings.
Figure OR.05, City of Orchard Plan Participation
MPC planning activities for the Fort Bend County Hazard Mitigation Plan (HMP) Update are captured in Figure OR.05, which utilizes check-marks to indicate each of the activities that were completed by the Orchard MPC.
9 EventBrite Meeting Posting 9 Public Survey Posting/Collection
Figure OR.06, Plan StakeholdersJurisdiction Agency TitleCity of Orchard City Hall Commissioners
City of Orchard Economic Development Council Chair
City of Orchard Industrial Development Corporation Chair
City of Orchard Cultural Education Facilities Finance Corporation Director
City of Orchard City Hall City Secretary
City of Orchard Water and Sewer Manager
City of Orchard City Hall Assistant Administrator
City of Orchard Volunteer Fire Department Chief
Fort Bend County Emergency Medical Services Director
City of Simonton City Hall City Administrator
City of Rosenberg Fire Department Chief
Brazos ISD Education Superintendent
Harris County Office of Homeland Security and Emergency Management Hazard Mitigation Planner
DRAFT

Fort Bend County Hazard Mitigation Plan, City of Orchard
4
Org
aniz
e an
d R
evie
w
Outreach StrategyThe City of Orchard was active in the outreach activities used to request public participation in the Fort Bend County HMP Update. Their activities included promotion of the HMP Public Survey, the use of EventBrite web tools for meeting announcements, plan phase newsletter distribution, and a draft plan public comment period.
Public Survey Promotion
Orchard advertised the Fort Bend County HMP Update Public Survey on the Orchard homepage, www.orchardtexas.net. Although there were no survey results for the City of Orchard, there were 377 total responses to the survey. Survey data was directly incorporated into the risk ranking process for hazards and mitigation actions. Details regarding the incorporation of the survey results are included in Chapter 2, the Risk Assessment portion of the Fort Bend County HMP Update.
EventBrite Public Meeting Postings
Fort Bend County utilized EventBrite, an online event tool for organizing, promoting and managing public events. By using this tool, the community made the risk assessment and mitigation strategy meetings public events that were searchable and open for registration for citizens, as well as stakeholders.
Plan Phase Newsletters
Orchard MPC utilized newsletters for each phase of the planning process in order to share updates on the planning process with stakeholders, elected officials, City staff and the public. Copies of the newsletters can be found in Appendix A of the Fort Bend County HMP Update.
Plan Draft Public Review and Comment Period
The link to the draft Fort Bend County HMP Update was posted on the City of Orchard website from July 13, 2017 until July 27, 2017. A hard copy was placed in the Orchard City Hall. Comments were collected via online form.
DRAFT

Fort Bend County Hazard Mitigation Plan, City of Orchard
5
Organize and R
eview
Incorporation of SourcesIn addition to stakeholder and public input, the MPC also reviewed other planning resources that could provide useful information to the plan update process. Figure OR.07 lists the documents reviewed and how they were considered for incorporation in the updated plan.
Figure OR.07, Review/Incorporation of Sources
Name of Document Type How Incorporated
2013 State of Texas HMP Plan Utilized hazard definitions and hazard classification names.
Flood Insurance Study Study Incorporated best available hydraulic and hydrological study results for flood hazard profile.
Ordinance 002-74- Private Water Well Ordinance Regulation
Ordinance making illegal the use for human consumption of water from a private water well within the corporate limits of the City of Orchard (sic). Used to consider modifications or enhancements for water conservation and drought mitigation purposes.
Ordinance 027-83- Culverts RegulationOrdinance related to permitting for culvert installation.Used to consider modifications or enhancements for mitigation purposes, for flood.
Ordinance 104-14- Utility Fees and Charges for Water Service
RegulationOrdinance establishing/amending the fees and charges for water service within the City. Used to identify potential funding for flood mitigation projects.
Ordinance 043-99- Regulating Mobile Homes in the City
Regulation
Ordinance prohibiting the installation of mobile homes and manufactured homes outside a mobile home park, and standards for site requirements. Read to identify possible enhancements to further protect mobile homes and manufactured homes from hazards, such as windstorms, tornadoes, hurricane/tropical storms, and expansive soils.
Ordinance 015-78- Ad Valorem Tax Regulation
Ordinance fixing and levying a municipal ad valorem tax on real property in the city. Reviewed to identify potential funding for mitigation projects.
Ordinance 073-05- Establishing an Emergency Management Program
RegulationOrdinance establishing an EM Program. Reviewed for possible enhancements in order to provide for specific authority to perform mitigation.
Ordinance 085-07- Subdivision Ordinance Regulation Ordinance regulating the development of subdivisions with Orchard.
Reviewed for reference to floodplain management standards.
Ordinance 107-2015- Sales Tax Reauthorization Regulation
Ordinance ordering an election to determine whether a sales and use tax will be authorized. Reviewed to identify potential funding for mitigation projects.
Ordinance 110-16- Standardized Building Codes
RegulationOrdinance adopting the 2012 standardized building codes. Reviewed for possible enhancements for mitigation purposes.
Flood Damage Prevention Ordinance Regulation Reviewed existing ordinance for identification of potential higher
standards, such as freeboard.
DRAFT

Fort Bend County Hazard Mitigation Plan, City of Orchard
6
Org
aniz
e an
d R
evie
w
Figure OR.08, Public Involvement for Updates
Activity Public Involvement Method Available
Monitoring
The public will be given notice when items will be reviewed and will receive the
opportunity to review the notes from any notable developments.
Website/Social Media/Newsletter
Evaluation The public will be given a means to voice their opinion on the completed actions. Website/Social Media/Newsletter
UpdatesOnce updates are made, the changes will
be recorded in a public revision history document.
Website/Social Media/Newsletter
Continued Public Participation in Maintenance ProcessThe strategy for updates at the local level for the City will include the opportunities for public involvement, as shown in Figure OR.08.
MaintenanceFigure OR.09 lists the method, schedule, and responsible agent for the monitoring, evaluation, and updating of the adopted 2017 HMP within the Plan’s 5-year update cycle.
Figure OR.09, Fort Bend County Hazard Mitigation Plan Maintenance Schedule, City of Orchard
Task Scope Method Schedule Responsible Agent
Monitoring Jurisdictional
Review mitigation action items using Mitigation Action Progress Report Worksheets (Appendix C of the Fort Bend County HMP Update).
Every 12 months
City of Orchard, City Hall, Mayor
Evaluation Jurisdictional Complete Online Planner Survey (using SurveyMonkey) with evaluation of plan process.
Every 12 months
City of Orchard, City Hall, Mayor
Updates Jurisdictional
Perform updates to Mitigation Strategy to edit/add/omit actions identified during monitoring activities.
Conduct post-disaster review of community annex in order to update for significant occurrences, construction of new criticalinfrastructure or facilities, changes in jurisdictional boundaries and development.
Participate in MPC for 5-year HMP update process.
As needed City of Orchard, City Hall, City Engineer (Consultant)DRAFT

Fort Bend County Hazard Mitigation Plan, City of Orchard
7
Organize and R
eview
Section 2: Risk AssessmentOrchard’s Jurisdictional HazardsThis section contains Orchard’s hazard profiles for each natural hazard included in the Fort Bend County HMP Update. Profiles include the following information:
• Location - the area where the hazard is known to occur.
• Previous Occurrences - a history of reported events for the hazard.
• Significant Previous Occurrences (when applicable) - notable hazard events within the community.
• Extent - the strength or magnitude of the hazard.
• Probability - the likelihood of the hazard event occurring in the future.
• Impact - the consequence or effect (or possible effect) of hazard events.
• Vulnerability Summary - identification of structures, systems, populations or assets susceptible to loss or damage.
Hazard descriptions and extent scales for hazard magnitudes, are found in Chapter 2, the Risk Assessment portion of the Fort Bend County HMP Update.
When available, data specific to Orchard was used for hazard analysis. When no instances were reported specifically for the jurisdiction for regional hazards, County-level data was applied.
State and national datasets were used to determine occurrence, extent, and the respective probabilities, rather than verbal testimonies, in an effort to retain data consistency. For some hazards, the National Oceanic and Atmospheric Administration (NOAA) Storm Events Database was used as the most comprehensive data available for hazards. As a result, injury and damage amounts shown for previous hazard occurrences do not always reflect the most recent totals. The Previous Occurrences section for each hazard identifies instances in which this may occur. Verbal testimony, when available, was integrated into impact or vulnerability summaries.
Hazards profiled within the Risk Assessment include:
• Drought
• Extreme Heat
• Severe Winter Storms
• Lightning
• Hailstorms
• Windstorms
• Tornadoes
• Expansive Soils
• Floods
• Land Subsidence
• Hurricanes/Tropical Storms
• Earthquakes
• Dam/Levee Failure
• Wildfires
DRAFT

8
Ris
k A
sses
smen
tFort Bend County Hazard Mitigation Plan, City of Orchard
DroughtDrought: LocationDrought occurs on a regional scale, therefore, all of the City of Orchard is equally at risk as it can occur anywhere in the jurisdiction.
Drought: Previous OccurrencesThe NOAA Storm Events Database documents 9 drought events for Fort Bend
County since the year 1996 (see Figure OR.10). Although there were no drought events reported specifically for Orchard, the jurisdiction would have been affected by the events that were reported for the surrounding County area.
Fatality, injury and damage amounts are shown in Figure OR.09, per the NOAA Storm Events Database. Community testimony indicates that these amounts do not reflect the most recent totals, however NOAA data is being used as the best source of publicly available information for the record period.
Figure OR.10, Reported Drought Occurrence, Fort Bend County
Location Date Type Fatalities Injuries Property Damage ($)
Crop Damage ($)
FORT BEND (ZONE) 4/1/1996 Drought 0 0 0 0FORT BEND (ZONE) 5/1/1996 Drought 0 0 0 0FORT BEND (ZONE) 6/1/1996 Drought 0 0 0 0
FORT BEND (ZONE) 5/1/1998 Drought 0 0 0 0FORT BEND (ZONE) 6/1/1998 Drought 0 0 0 0FORT BEND (ZONE) 7/1/1998 Drought 0 0 0 0FORT BEND (ZONE) 8/1/1998 Drought 0 0 1,000,000 7,300,000FORT BEND (ZONE) 8/1/2000 Drought 0 0 0 0FORT BEND (ZONE) 9/1/2000 Drought 0 0 0 0Total 0 0 $1,000,000 $7,300,000
(National Oceanic and Atmospheric Administration, 2016)
Drought: Significant Past EventsThe NOAA Storm Events Database had 3 years (1996, 1998, 2000) with reported events for Fort Bend County. However, the database did not include reports for the planning area of the well-known drought years of 2011, 2012, and 2013. U.S. Drought Monitor records indicate that 99% of the State was suffering at least “severe” drought conditions during the drought beginning in 2011, as indicated in an article from The Houston Chronicle explaining the drought period extending from 2011 through 2013 as one of the worst on record for the State (Berger, 2013). Maps illustrating drought conditions throughout these years are available through the U.S. Drought Monitor, and depict drought conditions of up to a category D4 for the planning area during these times (The National Drought Mitigation Center, 2017). Refer to Chapter 2, the Risk Assessment portion of the Fort Bend County HMP Update, for a description of the U.S. Drought Monitor Drought Intensity Index.
Drought: ExtentDrought is measured by the US Drought Monitor Drought Intensity Scale, which classifies drought by 5 categories, D0 through D4, with D4 being the most extreme drought conditions. According to the reported previous drought occurrences in the jurisdiction, the maximum drought extent experienced is a Category D4 drought.
DRAFT

9
Risk A
ssessment
Fort Bend County Hazard Mitigation Plan, City of Orchard
Figure OR.11, Drought ProbabilityNumber of Years
with Reported Event (Drought Year)
Number of Years in Dataset Probability
6 20 0.30
Drought: ImpactFigure OR.12 lists the impact of drought from the years 1997 to 2017 for Fort Bend County according to the Drought Impact Reporter (DIR). The DIR is the nation’s first comprehensive database of drought impacts. This database contains information from multiple Federal agencies, such as NOAA and United States Geological Survey (USGS), which categorizes drought impacts from a national to city level. While there are no impacts reported specifically for the City of Orchard, the effects of drought are not confined to jurisdictional boundaries and occur on a regional scale. Impacts reported at the Fort Bend County level are applicable in illustrating impact to the City.
Drought: ProbabilityBased on 6 years (1996, 1998, 2000, 2001, 2012, 2012, 2013) with drought events within 20 years (3 reported through NOAA in addition to 3 well known drought years affecting the State), a drought event occurs approximately once every 3 years on average in Fort Bend County. Since drought events can happen anywhere throughout the HMP update area and occur on a regional scale, the City of Orchard future probability is assumed to be similar to the surrounding County area. In the future, the City can expect a drought event approximately once every
3 years on average with up to a category D4 drought. Therefore, there is a 30% chance of a drought event in a given year. This information is outlined in Figure OR.11.
Figure OR.12, Reported Drought Impacts, Fort Bend County
Fort Bend Drought Impacts 1997-2017
Category # of Incidents Reported
Agriculture 25Business & Industry 2Energy 1
Fire 10
Plants & Wildlife 10
Relief, Response & Restrictions 17
Society & Public Health 3Tourism & Recreation 0Water Supply & Quality 3
(University of Nebraska-Lincoln, 2016)
DRAFT

10
Ris
k A
sses
smen
tFort Bend County Hazard Mitigation Plan, City of Orchard
Drought: Vulnerability SummaryAccording to community testimony there have not been any water shortage events for Orchard in the recent past. The city has a public water supply that draws from a well. There is no back-up water supply or inter-local agreements for emergency water supply. There is not currently drainage or stormwater management in place in order to utilize surface water as an alternative source of water.
DRAFT

11
Risk A
ssessment
Fort Bend County Hazard Mitigation Plan, City of Orchard
Extreme HeatExtreme Heat: LocationExtreme heat occurs on a regional scale; therefore, all of the City of Orchard is equally at risk as it can occur anywhere in the jurisdiction.
Extreme Heat: Previous OccurrencesNOAA’s Online Weather Data (NOWData) provides temperature data ranging
from 2000 to 2016. NOAA’s National Weather Service (NWS) Heat Index (located in Chapter 2, the Risk Assessment portion of the Fort Bend County HMP Update) indicates that temperatures meeting or exceeding 90°F are designated with an “Extreme Caution” or greater warning classification. According to Houston Sugar Land Memorial Station, the closest local weather data collection center with comprehensive data, the mean number of days with a daily maximum temperature equal or greater than 90°F is 108 days within a year. Currently, the greatest number of days during which the jurisdiction experienced extreme heat is 141 in 2011 while the highest temperature experienced was 108°F in August 2011 (a “Danger” NWS Heat Index classification). Houston Sugar Land Memorial Station is the closest reporting NOWData station to the jurisdiction and applies equally to the City of Orchard due to the regional nature of extreme heat occurrence.
Extreme Heat: ExtentExtreme heat is classified by temperatures, as well as event level designations, within the NWS Heat Index. The extent of extreme heat that the City has experienced can be derived from the data provided from NOWData at Houston Sugar Land Memorial Station since the year 2000. The highest daily mean temperature experienced was 108°F in August 2011. This event is classified by the NWS Heat Index as “Danger”. Refer to Chapter 2, the Risk Assessment portion of the Fort Bend County HMP Update, for a description of heat extent scale, NOAA’s NWS Heat Index.
Extreme Heat: Probability
The probability of future events can be determined by assessing historical averages. Since extreme heat events occur on a regional scale, the City’s future probability is assumed to be similar to the area sur-rounding Houston Sugar Land Memorial Station. Based on NOWData, the City can expect, on average, approximately 108 days a year with temperatures equal or greater than 90°F, and up to a “Danger” warn-ing classification per the NOAA NWS Heat Index. As extreme heat events have occurred every year since 2000, the probability of extreme heat affecting the community is 100% in any given year.
Extreme Heat: ImpactExtreme heat has physical impacts on the public and the infrastructure that supports them. According to the Texas Health Care Information Collection and Trauma Registry from the Texas Department of State Health Services’ Injury Epidemiology & Surveillance Branch, the following number of patients were received in Fort Bend County medical facilities for heat related injuries, as shown in Figure OR.13.
Figure OR.13, Fort Bend County Hospital Inpatient Data, Extreme Heat
E-Code Description 2010 2011 2012 2013 2014
900.0 Accident caused by excessive heat due to weather conditions 0 5 0 0 0
(Texas Department of State Health Services - Injury Epidemiology & Surveillance Branch, 2017)
DRAFT

12
Ris
k A
sses
smen
tFort Bend County Hazard Mitigation Plan, City of Orchard
In addition to the physical impacts, an excessive heat event can also be the cause of cascading incidents. Electrical outages could occur due to the high demands of electricity needed to power cooling systems. A loss of critical resources, such as power, has significant impact on the entire population, with higher impacts to those with vulnerabilities to such conditions. The following portion of the City’s population, according to HAZUS-MH 3.2 updated Census 2010 population estimates, would be greatly impacted by the severe temperatures related to excessive heat and/or the loss of electrical energy in their dwellings.
Population over 65 years old 32
Population under 16 years old 87
Economically Disadvantaged Population ($0-$20k) 25
Extreme Heat: Vulnerability SummaryCommunity testimony indicates that there is not a visible homeless population within the City. There may be some residents who do not have air conditioning units however, there are many who use fans. While City Hall could be utilized as a cooling station, there is no generator back-up to continue to provide cooling during an power interruption. There are churches in town that can also provide cooling during an extreme heat event, but they also lack generator back-up.
DRAFT

13
Risk A
ssessment
Fort Bend County Hazard Mitigation Plan, City of Orchard
Severe Winter StormsSevere Winter Storms: LocationSevere winter storms occur on a regional scale; therefore, all of the City of Orchard is equally at risk.
Severe Winter Storms: Previous OccurrencesThe NOAA Storm Events Database documents 7 winter storm events for Fort Bend County since the year 1997 (see Figure OR.14). Although there were no winter
storm events reported specifically for the City of Orchard, the jurisdiction would have been affected by the events that were reported for the surrounding County area.
Fatality, injury and damage amounts are shown in Figure OR.14, per the NOAA Storm Events Database. Community testimony indicates that these amounts do not reflect the most recent totals, however NOAA data is being used as the best source of public information available for the recorded period.
Figure OR.14, Winter Weather Occurrences, Fort Bend County
Location Date Type Fatalities Injuries Property Damage ($)
Crop Damage ($)
FORT BEND (ZONE) 1/12/1997 Ice Storm 0 0 0 0
FORT BEND (ZONE) 12/24/2004 Heavy Snow 0 0 0 0
FORT BEND (ZONE) 1/16/2007 Ice Storm 0 0 2,000 0
FORT BEND (ZONE) 12/4/2009 Winter Storm 0 0 0 0
FORT BEND (ZONE) 2/3/2011 Ice Storm 0 0 0 0
FORT BEND (ZONE) 1/23/2014 Winter Storm 0 0 0 0
FORT BEND (ZONE) 3/3/2014 Winter Storm 0 0 0 0
Total 0 0 $2,000 $0
(National Oceanic and Atmospheric Administration, 2016)
Severe Winter Storms: Significant Past EventsRegionally, there were significant winter weather events that impacted the City, but were only reported as Fort Bend (Zone) in Figure OR.14. Refer to the Severe Winter Storms: Significant Past Events section within the Fort Bend Unincorporated Areas Annex for narratives discussing these events.
Severe Winter Storms: ExtentIce accumulation is captured and measured with the Regional Snowfall Index (RSI) and the Sperry-Piltz Ice Accumulation (SPIA) Index, as detailed in Chapter 2, the Risk Assessment portion of the Fort Bend County HMP Update. According to the reported previous winter weather occurrences in the jurisdiction, the maximum winter weather extent experienced is a RSI Category 2 snowfall event or SPIA Ice Index Category 2 Ice event. Refer to Chapter 2, the Risk Assessment portion of the Fort Bend County HMP Update, for a description of winter weather extent scales.
DRAFT

14
Ris
k A
sses
smen
tFort Bend County Hazard Mitigation Plan, City of Orchard
Severe Winter Storms: ProbabilityBased on 7 reported events from the NOAA Storm Events Database in 19 years, a winter weather event occurs approximately every 3 years on average in Fort Bend County. There were no events reported specifically for the City. Since these events can happen anywhere throughout the HMP update area and occur on a regional scale, the City’s future probability is assumed to be similar to the surrounding County areas. The jurisdiction can expect a winter weather event approximately once every 3 years on average in the future, with up to a RSI Category 2 snowfall event or SPIA Ice Index Category 2 Ice event. Therefore, there is a 37% chance of a severe winter storm event in a given year. This information is outlined in Figure OR.15.
Severe Winter Storms: ImpactIn addition to the physical impacts, a severe winter storm event can also be the cause of cascading incidents. Electrical outages could occur due to the high demands of electricity needed to power heating systems. A loss of critical resources, such as power, has significant impact on the entire population, with higher impacts to those with vulnerabilities to such conditions. The following portion of the City of Orchard’s population, according to HAZUS-MH 3.2 updated Census 2010 population estimates, would be greatly impacted by the extreme temperature conditions related to severe winter storms and/or the loss of electrical energy in their dwellings.
Population over 65 years old 32
Population under 16 years old 87
Economically Disadvantaged Population ($0-$20k) 25
Figure OR.15, Severe Winter Storms ProbabilityNumber of Reported
Events Number of Years in Dataset Probability
7 19 0.37
An organization called Inside Energy (http://insideenergy.org) provides a compiled database outlining 15 years of power outages across the United States from annual data available at the Department of Energy. Within the database, the following winter storm events affected electrical availability in the areas in or near Fort Bend County (shown in Figure OR.16).
Figure OR.16, Winter Weather Related Power Outages, Fort Bend Surrounding AreasEvent
Description Year Start Date Start Time End Date Respondent Location Customers
Affected
Winter Storm 2010 2/11/2010 12:00 p.m. 2/15/2010Oncor Electric
Delivery Company
Dallas/Fort Worth and East Texas
500,000
Winter Storm 2010 2/12/2010 5:00 a.m. 2/12/2010 American Electric Power
East Texas, Western
Arkansas, Northern Louisiana
52,999
DRAFT

15
Risk A
ssessment
Fort Bend County Hazard Mitigation Plan, City of Orchard
Figure OR.17, Winter Weather Related Crashes, Rural Fort Bend County
CityFatality
IncapacitatingInjury
Non-
Incapacitating
Possible Injury
Crash Year Street Name Surface
ConditionWeather
Condition
Rural Fort Bend County 0 0 0 0 2011 CRABB RIVER RD Ice Sleet/Hail
Rural Fort Bend County 0 0 0 0 2011 US59SB Ice Sleet/Hail
Rural Fort Bend County 0 0 0 0 2011 SH0099 Ice Sleet/Hail
Rural Fort Bend County 0 0 0 0 2011 FM0762 Ice Sleet/Hail
Rural Fort Bend County 0 0 0 0 2011 W BELLFORT Ice Sleet/Hail
Rural Fort Bend County 0 0 0 0 2011 FM1462 Ice Sleet/Hail
Rural Fort Bend County 0 0 0 2 2013 S MASON RD Wet Sleet/Hail
Rural Fort Bend County 0 0 0 0 2014 STARBRIDGE LAKE
LN Wet Sleet/Hail
Rural Fort Bend County 0 0 0 0 2014 SH0099 Ice Sleet/Hail
Although there were no reports specifically for Orchard, data available from the Texas Department of Transportation’s Crash Records Information System shows that between the years of 2010 and 2017, Rural Fort Bend County experienced 14 crashes related to sleet/hail conditions with 3 possible injuries sustained from these crashes. Since winter weather occurs on a regional scale, it is assumed that weather related crashes in the surrounding County area would be similar to those experienced in these conditions within Orchard.
Figure OR.16, Winter Weather Related Power Outages, Fort Bend Surrounding Areas, Cont’dEvent
Description Year Start Date Start Time End Date Respondent Location Customers
Affected
Severe Weather - Winter Storm 2012 12/25/2012 12:45 AM 12/28/2012 Entergy
Arkansas; Louisiana;
Mississippi; Texas
242,509
Severe Weather - Ice/Snow 2013 12/6/2013 1:51 AM 12/11/2013
Oncor Electric Delivery
Company LLC
Greater Houston,
Texas881,000
Public Appeal due to Severe
Weather - Cold2014 1/6/2014 7:01 AM 1/7/2014 ERCOT Texas NA
NA - No data available (Wirfs-Brock, 2014)
DRAFT

16
Ris
k A
sses
smen
tFort Bend County Hazard Mitigation Plan, City of Orchard
Severe Winter Storms: Vulnerability SummaryThe majority of the streets within Orchard are owned by the City. During ice events, Fort Bend County offers support for sanding the streets, with the Texas Department of Transportation sanding the entry points to the city, along Farm to Market Road (FM) 1489 and Highway 36. FM 1489 crosses the Brazos River north of the City and could be vulnerable to ice during severe winter storms. The remainder of crossings within Orchard are culvert crossings.
All of the power lines in Orchard are aerial and are vulnerable to being downed by the weight of ice or snow or by falling branches. This could lead to the interruption of electrical power until electrical crews are able to repair the lines.
Figure OR.17, Winter Weather Related Crashes, Rural Fort Bend County
City
Fatality
IncapacitatingInjury
Non-
Incapacitating
Possible Injury
Crash Year Street Name Surface
ConditionWeather
Condition
Rural Fort Bend County 0 0 0 0 2014 WILLIAMS WAY
BLVD Ice Sleet/Hail
Rural Fort Bend County 0 0 0 0 2014 FM 1093 Ice Sleet/Hail
Rural Fort Bend County 0 0 0 0 2014 WILLIAMS WAY
BLVD Ice Sleet/Hail
Rural Fort Bend County 0 0 0 0 2014 E WESTPARK TOLL
RD Ice Sleet/Hail
Rural Fort Bend County 0 0 0 1 2014 FM1489 Ice Sleet/Hail
Crash Records Information System Query for Accidents in Fort Bend County from 2010-2017 from non-Clear Weather Conditions (Texas Department of Transportation, 2017)
, Cont’d
DRAFT

17
Risk A
ssessment
Fort Bend County Hazard Mitigation Plan, City of Orchard
Lightning: ExtentDue to the lack of reported occurrences, there is not sufficient data to determine the maximum Lightning Activity Level (LAL) for the jurisdiction (refer to Chapter 2, the Risk Assessment portion of the Fort Bend County HMP Update, for a description of the lightning extent scale LAL Grids). However, with the data available, the extent of lightning events that the City of Orchard has experienced can be derived from the NOAA/NLDN data in Figure OR.18. The data suggests that Orchard, which is approximately 0.35 square miles can receive up to 15 to 18 strikes per square mile per year.
Lightning: ProbabilitySince lightning can occur at any location, lightning events could be experienced anywhere within the
LightningLightning: LocationThe entire extent of the City of Orchard is exposed to some degree of lightning hazard. Since lightning can occur at any location, lightning events can be experienced anywhere within the jurisdiction.
Lightning: Previous OccurrencesFigure OR.18 reflects the City of Orchard within the area that was calculated to receive approximately 15 to 18 lightning strikes per square mile per year according to the National Lightning Detection Network (NLDN) data for the years 1997 to 2012. There were no lightning events reported specifically for the jurisdiction in the NOAA Storm Events Database.
Figure OR.18, Average Annual Lightning Density, City of Orchard
(Vaisala NLDN, 2016)DRAFT

18
Ris
k A
sses
smen
tFort Bend County Hazard Mitigation Plan, City of Orchard
Population over 65 years old 32
Population under 16 years old 87
Economically Disadvantaged Population ($0-$20k) 25
An organization called Inside Energy (http://insideenergy.org) provides a compiled database outlining 15 years of power outages across the United States from annual data available at the Department of Energy. Within the database, the following thunderstorm/severe storm events affected electrical availability in the areas in or near Fort Bend County.
jurisdiction. Based on the data provided in Figure OR.18, the City of Orchard can expect future events to fall in line with NLDN data from previous years with an average occurrence of up to approximately 15 to 18 lightning strikes per square mile per year.
Lightning: Impact In addition to the physical impacts, lightning events can also be the cause of additional cascading incidents, such as electrical outage events, due to the impact
that lightning strikes can have on electrical utility infrastructure. A loss of critical resources such as power has significant impact on the entire population, with higher impacts to those with vulnerabilities to such conditions. The following portion of the City of Orchard’s population, according to HAZUS-MH 3.2 updated Census 2010 population estimates, would be greatly impacted by the loss of electrical energy in their dwellings.
Figure OR.19, Thunderstorm Related Power Outages, Fort Bend Surrounding AreasEvent
Description Year Start Date Start Time End Date Respondent Location Customers
Affected
Strong Thunderstorms 2004 5/11/2004 3:30 p.m. 5/11/2004 CenterPoint
Energy
Houston, Texas and
surrounding suburban
areas
62,500 at peak
Strong Thunderstorms 2004 11/23/2004 10:00
p.m. 11/24/2004 CenterPoint Energy
Houston, Texas and
surrounding suburban
areas
119,000
Strong Thunderstorms 2005 5/8/2005 3:00 p.m. 5/8/2005
CenterPoint Energy
Houston Electric
Houston, Texas and
surrounding suburban
areas
243,000
Strong Thunderstorms 2005 5/29/2005 8:00 p.m. 5/30/2005
CenterPoint Energy
Houston Electric
Houston, Texas and
surrounding suburban
areas
123,000
DRAFT

19
Risk A
ssessment
Fort Bend County Hazard Mitigation Plan, City of Orchard
In addition to effects to human life and infrastructure, lightning strikes can also cause a cascading disaster through wildfires. According to the National Fire Protection Association (NFPA), “during 2007-2011, U.S. local fire departments responded to an average of 22,600 fires per year that were started by lightning. These fires caused an average of 9 civilian deaths, 53 civilian injuries and $451 million in direct property damage per year” (National Fire Protection Association, 2013). The source also cites that fires are more common in June through August and in the late afternoon and evening.
Lightning: Vulnerability SummaryAccording to community testimony, City Hall experienced a lighting strike a few years ago that damaged the roof. There were also severe thunderstorms in 2004 and 2007, as previously noted in the 2011 Fort Bend County HMP.
Orchard does not have any specific communications concerns, nor do they have instances of dried or heavy vegetation that could serve as fuel if a lightning strike were to ignite a blaze.
Figure OR.19, Thunderstorm Related Power Outages, Fort Bend Surrounding Areas, Cont’d
EventDescription Year Start Date Start
Time End Date Respondent Location Customers Affected
Severe Thunderstorms 2008 8/3/2008 1:30 a.m. 8/3/2008 Entergy
Corporation
Mississippi, Louisiana,
Texas59,500
Severe Thunderstorms 2008 6/17/2008 9:01 a.m. 6/19/2008
Oncor Electric Delivery
Company LLC
North, Central and East Texas
234,393
Severe Thunderstorms 2011 6/5/2011 5:30 AM 6/6/2011 CenterPoint
Energy
Houston Metro-Area,
Texas78,000
Severe Weather - Thunderstorms 2012 4/20/2012 2:27 PM 4/21/2012 CenterPoint
Energy
Metropolitan Houston,
Texas120,377
Severe Weather - Thunderstorms 2013 8/16/2013 4:58 PM 8/17/2013 CenterPoint
Energy
Houston Service Area
Texas219,681
(Wirfs-Brock, 2014)
DRAFT

20
Ris
k A
sses
smen
tFort Bend County Hazard Mitigation Plan, City of Orchard
HailstormsHailstorms: LocationThe entire City of Orchard is exposed to some degree of hail hazard. Since hail can occur at any location, hail events can be experienced anywhere within the planning area. NOAA’s National Severe Storms Laboratory (NSSL) used historical data from 1980 to 1999 to estimate the daily probability of hail occurrences of at least ¾” diameter hail across the Country. Figure OR.20 shows the average number of hail days per year determined for the City. The density of hail days per year in the map’s
legend indicates the probable number of hail days for each 25-square-mile cell within the contoured zone. It should be noted that the density number does not indicate the number of events that can be expected within each cell, rather the average number of days per year with 1 or more events occurring within each cell. According to this calculation, Orchard can expect 2 hail days per year.
Figure OR.20, National Hail Days Per Year, City of Orchard
Hailstorms: Previous OccurrencesAccording to the NOAA Storm Events Database, there were 2 documented hail events listed for the City of Orchard and 37 documented events listed for Fort Bend County and its unincorporated jurisdictions from year 1961. While the NOAA Storm Events Database lists events since 1961 for the County, events were not documented per jurisdiction until 1995. The hail events reported for the City are shown in the Figure OR.21.
(National Severe Storms Laboratory, 2016)
DRAFT

21
Risk A
ssessment
Fort Bend County Hazard Mitigation Plan, City of Orchard
Figure OR.21, Hail Occurrences, City of Orchard
Location Date Type Extent (mm) Fatalities Injuries Property
Damage ($)Crop
Damage ($)ORCHARD 2/27/1999 Hail 25.40 0 0 10,000 0
ORCHARD 2/27/1999 Hail 25.40 0 0 2,000 0Total 0 0 $12,000 $0
(National Oceanic and Atmospheric Administration, 2016)
Fatality, injury and damage amounts are shown in Figure OR.21 per the NOAA Storm Events Database. Community testimony indicates that these amounts do not reflect the most recent totals, however NOAA data is being used as the best source of public information available for the record period.
Hailstorms: ImpactHail events in the area have been reported to cause up to $10,000 in property damages in one event as seen in the NOAA reports for the City. Additional potential impacts can be determined based on the maximum hail extent experienced 1 inch (25.40 mm), where the TORRO Hailstorm Intensity Scale (found in Chapter 2, the Risk Assessment portion of the Fort Bend County HMP Update) indicates that impact can be expected to include any of the following:
• Varying degrees of damage to vegetation and crops
• Damage to plastic structures
• Varying degrees of damage to glass
• Paint and wood scored
• Vehicle bodywork damage
Figure OR.22, Hailstorms ProbabilityNumber of Reported
Events Number of Years in Dataset Probability
1 21 0.05
Hailstorms: ExtentThe Tornado and Storm Research Organization (TORRO) created a hail extent index to measure hail called the Hailstorm Intensity Scale. According to the reported previous hail occurrences in the planning area, the maximum hail extent experienced is hail up to 1 inch (25.40 mm) in diameter, corresponding to a TORRO Hailstorm Intensity Scale classification of “Severe.” Refer to Chapter 2, the Risk Assessment portion of the Fort Bend County HMP Update, for hail extent scale descriptions.
Hailstorms: ProbabilityAlthough there were 2 recorded hail events for the planning area, they were recorded for the same day. For the purposes of probability, this could be considered 1 event for the area. Based on 1 reported event in 21 years, the City of Orchard can expect a hail event approximately once every 21 years on average in the future, with hail up to 1 inch (25.40 mm). in diameter, corresponding to a TORRO Hailstorm Intensity Scale classification of “Severe.” Therefore, there is a 5% chance of a hailstorm event in a given year. This information is outlined in Figure OR.22.
DRAFT

22
Ris
k A
sses
smen
tFort Bend County Hazard Mitigation Plan, City of Orchard
Hailstorms: Vulnerability Summary A typical hailstorm in Orchard would affect many automobiles as many of the homes do not have garages. City vehicles are parked in a barn behind City Hall. City Hall has a metal roof, as do the other City-owned structures, which are more resistant to impact from hail.
DRAFT

23
Risk A
ssessment
Fort Bend County Hazard Mitigation Plan, City of Orchard
WindstormsWindstorms: LocationThe entire City of Orchard is exposed to some degree of wind hazard. Since wind can occur at any location, wind events can be experienced anywhere within the planning area. NOAA’s NSSL used historical data from 1980 to 1999 to estimate the daily probability of wind occurrences across the U.S., with gusts of at least 58 mph. Figure OR.23 shows the estimates for wind days determined for the City. The density of wind days per year in the map’s legend indicates the probable number
of wind days for each 25-square-mile cell within the contoured zone. It should be noted that the density number does not indicate the number of events that can be expected within each cell, rather the average number of days per year with 1 or more events occurring within each cell. According to this calculation, Orchard can expect 3 wind days per year.
Figure OR.23, National Wind Days Per Year, City of Orchard
Windstorms: Previous OccurrencesAccording to the NOAA Storm Events Database, there were 4 documented wind events listed for the City of Orchard and 51 documented events listed for Fort Bend County and its unincorporated jurisdictions from year 1955. While the database lists events since 1955 for the County, events were not documented per jurisdiction until 1994. The wind events reported for the City are shown in Figure OR.24.
(National Severe Storms Laboratory, 2016)
DRAFT

24
Ris
k A
sses
smen
tFort Bend County Hazard Mitigation Plan, City of Orchard
Fatality, injury, and damage amounts are shown in Figure OR.24, per the NOAA Storm Events Database. Community testimony indicates that these amounts do not reflect the most recent totals, however NOAA data is being used as the best source of public information available for the record period.
Figure OR.24, Reported Wind Events, City of Orchard
Location Date Type Extent (knots) Fatalities Injuries Property
Damage ($)Crop
Damage ($)
ORCHARD 5/2/2000 Thunderstorm Wind NA 0 0 0 2,000,000
ORCHARD 8/11/2004 Thunderstorm Wind 55 kts. EG 0 0 35,000 0
ORCHARD 5/3/2007 Thunderstorm Wind 60 kts. EG 0 0 25,000 0
ORCHARD 9/29/2011 Thunderstorm Wind 51 kts. EG 0 0 5,000 0
Total 0 0 $65,000 $2,000,000
Windstorms: ExtentWind is measured by the Beaufort Wind Scale that relates wind speed to observed conditions on land and sea. According to the reported previous windstorm occurrences in the jurisdiction, the maximum wind extent experienced was 60 knots (Beaufort Wind Scale Classification: “Violent Storm”). Refer to Chapter 2, the Risk Assessment portion of the Fort Bend County HMP Update, for a description of wind extent scales.
Windstorms: ProbabilityFigure OR.23 reports 3 wind days per year as a result of NLDN’s nationwide analysis. Since this calculation is based on national data, a more specific calculation based on local-level NOAA reports was utilized to calculate probability. Based on 4 reported events in 22 years, the City of Orchard can expect a wind event of up to 60 knots approximately once every 5 to 6 years on average in the future (Beaufort Wind Scale Classification: “Violent Storm”). Therefore, there is an 18% chance of a windstorm event in a given year. This information is outlined in Figure OR.25.
Figure OR.25, Windstorms ProbabilityNumber of Reported
Events Number of Years in Dataset Probability
4 22 0.18
Windstorms: Impact Damages can be expected to be in line with the wind magnitude described in the Windstorm: Extent section. Previously reported magnitudes for the surrounding area indicate a “Violent Storm” wind extent, which is described within Chapter 2 of the Fort Bend HMP Update by the Beaufort Wind Scale as involving trees being broken or uprooted as well as considerable structural damage. Mobile and manufactured homes are most susceptible to windstorm damage as they may not have been installed or anchored correctly and can be moved and overturned in high winds. According to HAZUS, the jurisdiction contains 37 mobile and manufactured homes which comprises approximately 25% of the total building count.
DRAFT

25
Risk A
ssessment
Fort Bend County Hazard Mitigation Plan, City of Orchard
Windstorms: Vulnerability SummaryAccording to community testimony, the majority of damage associated with windstorms to orchard affects private structures. While some structures could be impacted by flying debris, roads can also be littered with debris that affects the flow of transportation and impede first responders trying to respond to emergency calls.
Power lines can also be affected by high winds, resulting in possible interruptions in power.
DRAFT

26
Ris
k A
sses
smen
tFort Bend County Hazard Mitigation Plan, City of Orchard
TornadoesTornadoes: LocationThe entire City of Orchard is exposed to some degree of tornado hazard. Since tornadoes can occur at any location, tornado events can be experienced anywhere within the planning area. NOAA’s NSSL used historical data from 1980 to 1999 to estimate the daily probability of tornado occurrences across the U.S., regardless of tornado magnitude. Figure OR.26 shows the average number of tornado days
determined for the City. The density of average tornado days per year in the map’s legend indicates the probable number of tornado days for each 25-square-mile cell within the contoured zone. This density number does not indicate the number of events that can be expected within each cell, rather the average number of days per year with 1 or more events occurring within each cell.
Figure OR.26, National Tornado Days Per Year, City of Orchard
(National Severe Storms Laboratory, 2016)
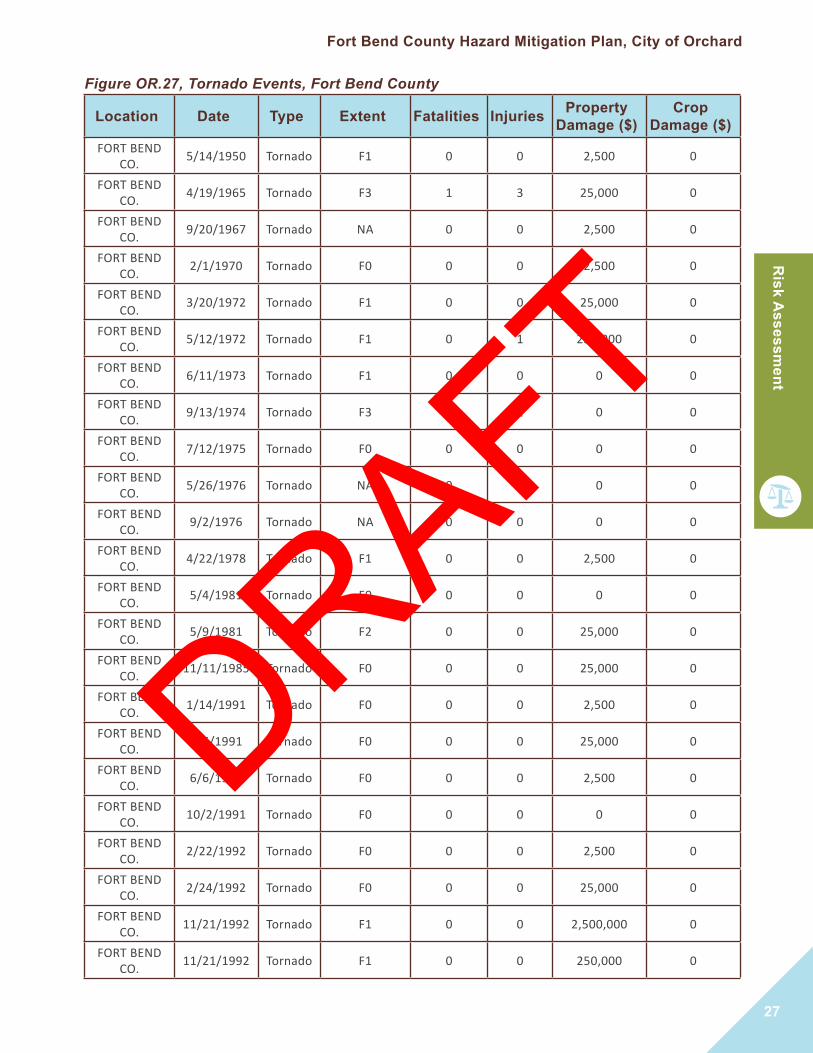
Tornadoes: Previous OccurrencesSince tornadoes can occur at any location, tornado events could be experienced anywhere within the jurisdiction. While the City of Orchard has not had any previous occurrences reported through the NOAA Storm Events Database, if an event were to occur, the event would be similar in size and magnitude to events within the surrounding County area. Figure OR.27 lists the 29 tornado events reported for Fort Bend County and its unincorporated jurisdictions since year 1950.
Fatality, injury and damage amounts are shown in Figure OR.27, per the NOAA Storm Events Database. Community testimony indicates that these amounts do not reflect the most recent totals, however NOAA data is being used as the best source of public information available for the record period.
DRAFT
27
Risk A
ssessment
Fort Bend County Hazard Mitigation Plan, City of Orchard
Figure OR.27, Tornado Events, Fort Bend County
Location Date Type Extent Fatalities Injuries Property Damage ($)
Crop Damage ($)
FORT BEND CO. 5/14/1950 Tornado F1 0 0 2,500 0
FORT BEND CO. 4/19/1965 Tornado F3 1 3 25,000 0
FORT BEND CO. 9/20/1967 Tornado NA 0 0 2,500 0
FORT BEND CO. 2/1/1970 Tornado F0 0 0 2,500 0
FORT BEND CO. 3/20/1972 Tornado F1 0 0 25,000 0
FORT BEND CO. 5/12/1972 Tornado F1 0 1 250,000 0
FORT BEND CO. 6/11/1973 Tornado F1 0 0 0 0
FORT BEND CO. 9/13/1974 Tornado F3 0 2 0 0
FORT BEND CO. 7/12/1975 Tornado F0 0 0 0 0
FORT BEND CO. 5/26/1976 Tornado NA 0 0 0 0
FORT BEND CO. 9/2/1976 Tornado NA 0 0 0 0
FORT BEND CO. 4/22/1978 Tornado F1 0 0 2,500 0
FORT BEND CO. 5/4/1981 Tornado F0 0 0 0 0
FORT BEND CO. 5/9/1981 Tornado F2 0 0 25,000 0
FORT BEND CO. 11/11/1985 Tornado F0 0 0 25,000 0
FORT BEND CO. 1/14/1991 Tornado F0 0 0 2,500 0
FORT BEND CO. 6/6/1991 Tornado F0 0 0 25,000 0
FORT BEND CO. 6/6/1991 Tornado F0 0 0 2,500 0
FORT BEND CO. 10/2/1991 Tornado F0 0 0 0 0
FORT BEND CO. 2/22/1992 Tornado F0 0 0 2,500 0
FORT BEND CO. 2/24/1992 Tornado F0 0 0 25,000 0
FORT BEND CO. 11/21/1992 Tornado F1 0 0 2,500,000 0
FORT BEND CO. 11/21/1992 Tornado F1 0 0 250,000 0
DRAFT

28
Ris
k A
sses
smen
tFort Bend County Hazard Mitigation Plan, City of Orchard
Tornadoes: ExtentTornadoes are measured by severity on the Enhanced Fujita Scale, with a range from 0-6, 6 being most catastrophic. According to the reported previous tornado occurrences in the surrounding areas, the maximum tornado extent experienced were category F3 tornadoes in 1965 and 1974.
Tornadoes: ProbabilityFigure OR.26 reports 1 tornado day per year as a result of NLDN’s nationwide
analysis. Since this calculation is based on national data, a more specific calculation based on local-level NOAA reports was utilized to calculate probability. Based on 29 reported events in 66 years, a tornado event occurs approximately every 2 years on average in Fort Bend County. Since tornado events can happen anywhere throughout the HMP update area, the City’s future probability is assumed to be similar to the surrounding County area. The City can expect a tornado event approximately once every 2 years on average in the future with up to an F3 magnitude. Therefore, there is a 44% chance of a tornado event in a given year. This information is outlined in Figure OR.28.
Figure OR.28, Tornadoes ProbabilityNumber of Reported
Events Number of Years in Dataset Probability
29 66 0.44
Figure OR.27, Tornado Events, Fort Bend County
Location Date Type Extent Fatalities Injuries Property Damage ($)
Crop Damage ($)
FORT BEND CO. 2/25/1993 Tornado F0 0 0 5,000 0
FORT BEND CO. 5/30/1993 Tornado F0 0 0 0 0
GUY 3/30/2002 Tornado F0 0 0 20,000 0FRESNO 10/9/2003 Tornado F0 0 0 0 0
FOUR CORNERS 10/16/2006 Tornado F0 0 0 0 0
CLODINE 1/9/2012 Tornado EF1 0 0 500,000 0Total 1 6 $3,692,500 $0
NA - No data available
(National Oceanic and Atmospheric Administration, 2016)
, Cont’d
Tornadoes: Impact There is no specific event data available for the City of Orchard from which impacts would be calculated. However, it can be assumed that impacts would be similar to those that the surrounding County area experiences.
Based on Fort Bend County having experienced tornadoes between F0 and F3 levels in the past, if similar events were to happen in the future in the City, the type of impacts that the jurisdiction can expect associated with those magnitudes would include, from least to greatest:
DRAFT

29
Risk A
ssessment
Fort Bend County Hazard Mitigation Plan, City of Orchard
• Light Damage - Broken branches; shallow rooted trees pushed over; some chimney damage.
• Moderate Damage - Surface damage to roofs; mobile homes pushed off foundation; moving vehicles pushed off the road.
• Significant Damage - Frame houses have roof torn off; mobile homes completely destroyed; train boxcars overturned; large trees snapped or uprooted; smaller debris turned into missiles.
• Severe Damage - Roofs completely torn off well-constructed buildings, along with some walls; majority of trees uprooted; trains overturned; vehicles lifted off the ground.
(Tornado Facts, 2016)
Additional impacts from tornado events could include downed utility poles, communication towers, street signals, and debris created from residential and urban property.
Critical infrastructure could be disrupted, resulting in periods of impact to service due to the lack of back-up utility resources. See Lightning: Impact section within this annex for more information on utility interruption.
Tornadoes: Vulnerability SummaryThe majority of the homes within Orchard are site-built with few manufactured/mobile homes in private lots. The manufactured and mobile homes face higher risk and greater vulnerability than the other structures within the community. Temporary sheltering can be provided at the City Hall, as it is a repurposed high school with areas capable of holding groups of people. There is not a formal sheltering plan in place, nor does the City Hall have generator back-up. (The water plant has a generator, thus providing continuity for water supply.) Communication of emergency messaging is usually performed by word-of-mouth, as the community does not have warning sirens, reverse 911 or other methods of alert notification. The County does have resources that could be utilized in this event, however coordination is needed for establishing guidelines, triggers and standards for activation.
DRAFT

30
Ris
k A
sses
smen
tFort Bend County Hazard Mitigation Plan, City of Orchard
Expansive SoilsExpansive Soils: LocationAreas within the City of Orchard with structures that are underlain by soils containing clays with swelling potential are most affected by expansive soils. Figure 2.13 within Chapter 2 (the Risk Assessment portion of the Fort Bend County HMP Update) shows the location of expansive soil areas for the City.
Expansive Soils: Previous OccurrencesThere was no documentation of site-specific past events for structural damage due to expansive soils from local, state, or national databases queried.
Expansive soils cannot be documented as a time-specific event, except when they lead to structural and infrastructure damage. There are no specific damage reports or historical records of events in the City, however future events can occur.
Expansive Soils: ExtentAccording to the USGS Expansive Soils Regions, Figure 2.13 in Chapter 2 (the Risk Assessment portion of the Fort Bend County HMP Update), less than 50% of the planning area is underlain with soils with clay textures that have high shrink-swell properties.
Expansive Soils: ProbabilityDue to the minimal amount of swelling potential and the lack of reported events, the probability of a future event is low (unlikely in next 10 years).
Expansive Soils: Impact Building standards help mitigate the impact to an extent. Besides new construction, a portion of the residences in the community were constructed when the City was not yet incorporated. Since building standards were not in place for this earlier development, it is possible that those structures could be impacted by expansive soils in the event of shrink-swell activity.
Expansive Soils: Vulnerability Summary The City of Orchard does not report significant occurrences within the City limits that create concern for this hazard. If the community is seeking to expand on residential and commercial development, previously undetected areas of expansive soils may be identified in the future.DRAFT

31
Risk A
ssessment
Fort Bend County Hazard Mitigation Plan, City of Orchard
FloodsFloods: LocationThere are currently no Special Flood Hazard Areas (SFHAs) mapped and no documented low water crossings within the planning area as shown in Figure OR.29. There is an unnamed tributary to Sandy Branch within the City, therefore localized flooding can still occur. Structures and roads adjacent to this unnamed tributary would be the areas most affected if a flooding event were to occur within
the HMP update area.
Figure OR.29, Flood Hazard Areas, City of Orchard
(Texas Natural Resources Information System, 2011)
Figure OR.30, City of Orchard Floodplain Acreage100yr (1%) Floodplain
Acres (Includes Floodway)500yr (0.2%) Floodplain Acres
(Includes 100yr)Shaded Zone X - Protected
by Levee0 0 0
DRAFT
32
Ris
k A
sses
smen
tFort Bend County Hazard Mitigation Plan, City of Orchard
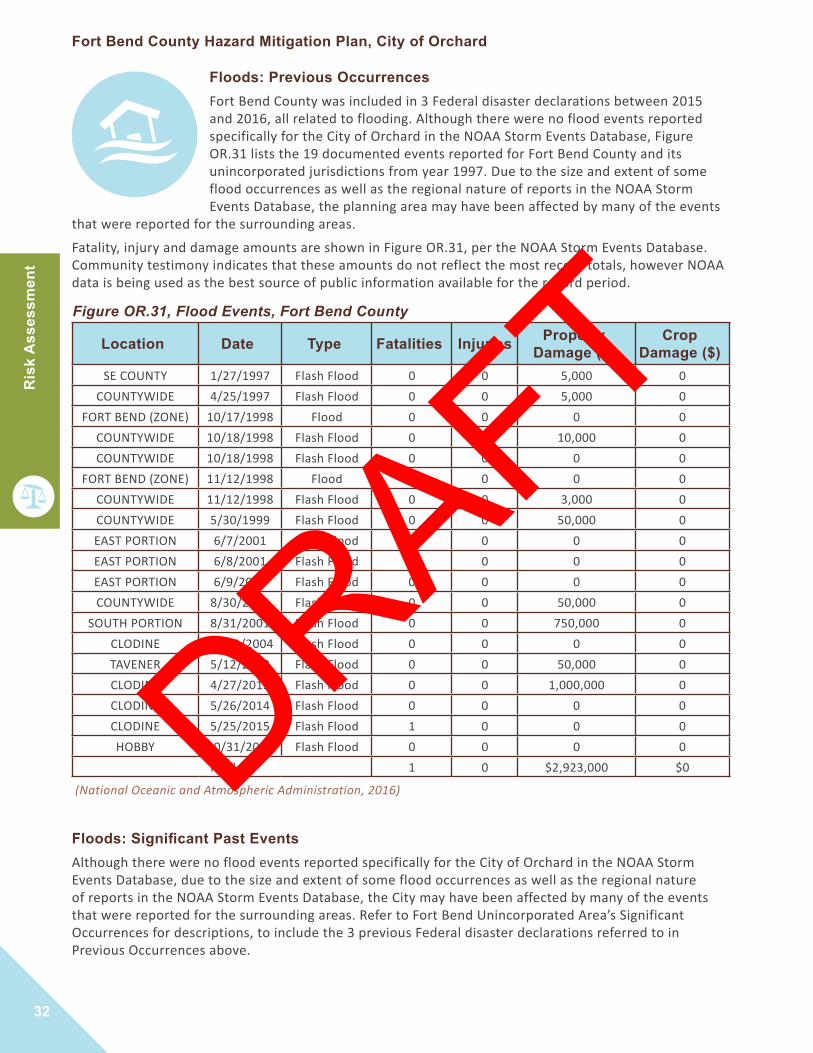
Figure OR.31, Flood Events, Fort Bend County
Location Date Type Fatalities Injuries Property Damage ($)
Crop Damage ($)
SE COUNTY 1/27/1997 Flash Flood 0 0 5,000 0COUNTYWIDE 4/25/1997 Flash Flood 0 0 5,000 0
FORT BEND (ZONE) 10/17/1998 Flood 0 0 0 0COUNTYWIDE 10/18/1998 Flash Flood 0 0 10,000 0COUNTYWIDE 10/18/1998 Flash Flood 0 0 0 0
FORT BEND (ZONE) 11/12/1998 Flood 0 0 0 0COUNTYWIDE 11/12/1998 Flash Flood 0 0 3,000 0COUNTYWIDE 5/30/1999 Flash Flood 0 0 50,000 0EAST PORTION 6/7/2001 Flash Flood 0 0 0 0EAST PORTION 6/8/2001 Flash Flood 0 0 0 0EAST PORTION 6/9/2001 Flash Flood 0 0 0 0COUNTYWIDE 8/30/2001 Flash Flood 0 0 50,000 0
SOUTH PORTION 8/31/2001 Flash Flood 0 0 750,000 0CLODINE 11/23/2004 Flash Flood 0 0 0 0TAVENER 5/12/2012 Flash Flood 0 0 50,000 0CLODINE 4/27/2013 Flash Flood 0 0 1,000,000 0CLODINE 5/26/2014 Flash Flood 0 0 0 0CLODINE 5/25/2015 Flash Flood 1 0 0 0HOBBY 10/31/2015 Flash Flood 0 0 0 0
Total 1 0 $2,923,000 $0
(National Oceanic and Atmospheric Administration, 2016)
Floods: Significant Past EventsAlthough there were no flood events reported specifically for the City of Orchard in the NOAA Storm Events Database, due to the size and extent of some flood occurrences as well as the regional nature of reports in the NOAA Storm Events Database, the City may have been affected by many of the events that were reported for the surrounding areas. Refer to Fort Bend Unincorporated Area’s Significant Occurrences for descriptions, to include the 3 previous Federal disaster declarations referred to in Previous Occurrences above.
Floods: Previous OccurrencesFort Bend County was included in 3 Federal disaster declarations between 2015 and 2016, all related to flooding. Although there were no flood events reported specifically for the City of Orchard in the NOAA Storm Events Database, Figure OR.31 lists the 19 documented events reported for Fort Bend County and its unincorporated jurisdictions from year 1997. Due to the size and extent of some flood occurrences as well as the regional nature of reports in the NOAA Storm Events Database, the planning area may have been affected by many of the events
that were reported for the surrounding areas.
Fatality, injury and damage amounts are shown in Figure OR.31, per the NOAA Storm Events Database. Community testimony indicates that these amounts do not reflect the most recent totals, however NOAA data is being used as the best source of public information available for the record period.
DRAFT

33
Risk A
ssessment
Fort Bend County Hazard Mitigation Plan, City of Orchard
Figure OR.32, Floods ProbabilityNumber of Reported
Events Number of Years in Dataset Probability
19 19 1
Figure OR.33, Building Counts, City of OrchardResidential Commercial Other Total
137 2 9 148
Figure OR.34, Building Replacement Values, City of OrchardBuilding ($) Content ($) Total ($)
29,336,922 17,216,787 46,553,709
Floods: ExtentFlood extent is described by a combination of ground elevation, river heights, 100 year Water Surface Elevations (WSE’s) and depth grids. As there are no mapped floodplains within the City, flood depths and Base Flood Elevations (BFE’s) are unknown for the area. The jurisdiction has an average elevation of 124 feet. However, the maximum flood extent experienced by the surrounding County area has been classified as “Major Flood Stage”. Refer to Chapter 2 for flood extent scales.
Floods: ProbabilityProbability has been calculated on the basis of NOAA reported events, as a standard, consistent calculation method for all hazards profiled with the Fort Bend County HMP. Based on 19 reported events in 19 years, a flood event occurs approximately once per year on average in Fort Bend County and its unincorporated jurisdictions. Due to the size and extent of some flood occurrences, as well as the regional nature of reports in the NOAA Storm Events Database, the City of Orchard’s future probability is assumed to be similar to the surrounding County area. The City can expect a flood event approximately once per year on average in the future, with flood water depths in the category of a “Major Flood Stage.” Therefore, it can be assumed there is a 100% chance of flood event in a given year. This information is outlined in Figure OR.32.
Floods: ImpactThe following describes the inventory counts and building replacement values for the entire jurisdictional area.
A Probabilistic 100-year Return Period HAZUS-MH 3.2 analysis was run on the participating communities. HAZUS results are calculated to census blocks. This analysis utilized the 2013 USGS National Elevation Dataset (NED) 1/3 arc-second Digital Elevation Model (DEM). These blocks were then intersected with the participating community to run a weighted area analysis to get jurisdictional results. The following describes results of the 100-year Return (1% Annual Chance Event) weighted area analysis.
DRAFT

34
Ris
k A
sses
smen
tFort Bend County Hazard Mitigation Plan, City of Orchard
HAZUS-MH Results
General Building Stock Damage
HAZUS estimates that no buildings will be at least moderately damaged within the City. “At least moderately damaged” is defined by HAZUS as greater than 10% damage to a building.
Building-Related Losses
Exposed Value is the total building and content values for structures within the community. The exposed value for the community is $46,553,709. HAZUS estimated no building related losses for this scenario.
Essential Facility Damage
HAZUS does not estimate any critical facilities or infrastructure to be out of service for more than 1 day on the day of the event. Additionally, the model estimates that 100% of available hospital beds are ready for use by patients already in the hospital and those injured by an event.
Debris Generation
HAZUS estimates the amount of debris that no debris will be generated in this scenario requiring no truckloads (with 1 to 25 tons per truck) for removal.
Shelter Requirements
HAZUS estimates the number of households that are expected to be displaced from their homes due to the flood and the associated potential evacuation. HAZUS also estimates those people displaced that will require accommodations in temporary public shelters. The model estimates that no one will be displaced or require temporary shelter in this scenario.
Floods: Vulnerability SummaryThere is no mapped floodplain within the city. Historically the community has not had any flooding issues. Even though there have been other flooding disasters within the county, Orchard has remained unaffected. The most likely source of flooding issues would be related to roadside ditches overtopping. All of the streets in Orchard have roadside ditches. Private residents help greatly with the maintenance of the ditches. The community also receives support from the County through their Road and Bridge Precinct. The city has responsibility for roads within City limits, but the County supplements their efforts. The City buys materials and the County typically provides labor.
National Flood Insurance Program Repetitive Loss (RL)The City of Orchard is a current participant in the National Flood Insurance Program. As of February of 2017, the City does not have any listed RL or SRL properties according to FEMA RL/SRL data and no claims have been made. DRAFT

35
Risk A
ssessment
Fort Bend County Hazard Mitigation Plan, City of Orchard
Land SubsidenceLand Subsidence: LocationTwo major contributing factors to land subsidence are karst areas or groundwater depletion zones. Although the planning area is not within a designated karst region according to Texas Speleological Survey mapping (Texas Speleological Survey, 2017). The City of Orchard is located within a known USGS groundwater depletion area, as illustrated in Figure OR.35. This figure shows groundwater depletion within the US from 1900 to 2008 where long-term cumulative depletion rates were calculated
from 40 separate aquifers measuring the cumulative loss over that time. The City is in an area of the Gulf Coast Aquifer estimated to have had a cumulative annual depletion of 25 to 50 cubic km over 108 years (1900 to 2008) (Leonard F. Konikow, 2013). Figure OR.35 also shows the locations of recent study sites discussed in the next section.
Figure OR.35, Groundwater Depletion Zones, City of Orchard
Land Subsidence: Previous OccurrencesFort Bend Subsidence District was formed in 1989 to provide groundwater withdrawal regulations in an effort to mitigate future subsidence events and regulate all areas within the County. The District’s 2015 Annual Groundwater Report discusses compaction measurements taken from varied extensometer and GPS monitoring sites as part of a joint funding agreement with the District, the Harris-Galveston Subsidence District, the City of Houston, the Brazoria County Groundwater Conservation District, and the Lone Star Groundwater Conservation District. Extensometers measure deformation or displacement under a certain stress load, or in this case, compaction that is associated with land subsidence.
(Groundwater depletion in the United States (1900−2008), 2013)DRAFT

36
Ris
k A
sses
smen
tFort Bend County Hazard Mitigation Plan, City of Orchard
Extensometer sites that were equipped with GPS antennas atop the extensometers’ inner pipe and were used as Continuous Operating Reference Stations (CORS). Additional GPS sites were developed, Periodically Active Monitor Sites (PAMS), to calculate average weekly heights. This data was processed against the data calculated by the CORS sites to calculate subsidence rates at each site.
The closest site to the City of Orchard (PAM 62, illustrated on Figure OR.35), was listed in the report to have had -0.08 feet of subsidence in the year 2015 (Fort Bend Subsidence District, 2015). Although no monitoring sites were listed within the planning area, it can be assumed that the City would experience similar rates
of occurrence as those observed at the closest proximity sites. It should be noted that the reported subsidence rates do not take into account other factors that could have possibly contributed, such as extreme weather or seismic activity, however it is the best data available.
Land Subsidence: ExtentLand subsidence extent can be calculated by the depth in feet that has been lost or that has given way. According to the recent studies detailed in the Land Subsidence Previous Occurrences, the site measured closest to the planning area, PAM 62, had subsidence occurring at a rate in 2015 of -0.08 feet within 1 year.
Land Subsidence: ProbabilityThe occurrence of subsidence is an ongoing process resulting from natural and human-induced causes. As seen in Figure OR.35, the entire City of Orchard is located within a known groundwater depletion area. Additionally, with the documented occurrence of subsidence from recent studies, the probability of a future land subsidence event for the City is high (probable in next 10 years) and can be assumed to be similar in extent to previous events in the area, up to -0.08 feet each year.
Land Subsidence: Impact When considering the impact of land subsidence, it is important to note that any area within the groundwater depletion zone could have structures and infrastructure located in and around the subsided area. The possible impact of isolated incidents within the region could include damage to any, but not all, of the 148 structures located in the zone in the unlikely event of a future occurrence. These structures are cumulatively valued at approximately $46,553,709 based on HAZUS building and content values.
Land Subsidence: Vulnerability SummaryWhile land subsidence is a hazard shown to impact the entirety of the City limits (according to Figure OR.35), the City of Orchard has not experienced the effects of groundwater depletion. A future vulnerability could stem from further residential development and population growth that could deplete groundwater levels and create land subsidence incidents. A general lack of concern stemming from a lack of occurrences lends to less attention to mitigating the hazard and a general increase in vulnerability.DRAFT

37
Risk A
ssessment
Fort Bend County Hazard Mitigation Plan, City of Orchard
Hurricanes/Tropical StormsHurricanes/Tropical Storms: LocationDue to the regional nature of a hurricane or tropical storm event, the entire City of Orchard is equally exposed to a hurricane or tropical storm. Figure OR.36 illustrates the location of the planning area with historical hurricane and tropical storm paths documented by NOAA.
Figure OR.36, Historical Hurricane/Tropical Storm Paths, City of Orchard
Hurricanes/Tropical Storms: Previous OccurrencesPrevious events are listed in Figure OR.37 from NOAA Hurricane Tracker. Included events are those whose track, as defined as the path from the eye of the storm, was within 20 nautical miles of the County or those that are known to have impacted the area. As hurricanes and tropical storms are large and regional in nature, those whose path is near the planning area would still affect the area. Because hurricane and tropical storm events occur on a regional scale, all events that affected Fort Bend County have been included as they would impact the City of Orchard.
(National Oceanic and Atmospheric Administration, 2016)DRAFT

38
Ris
k A
sses
smen
tFort Bend County Hazard Mitigation Plan, City of Orchard
Hurricanes/Tropical Storms: Significant Past EventsSince hurricane and tropical storm events can happen anywhere throughout the HMP update area and occur on a regional scale, the City would have been affected by the events that were captured as affecting the surrounding County area. Refer to Fort Bend Unincorporated Area’s Significant Occurrences for descriptions of significant events affecting the planning area.
Hurricanes/Tropical Storms: ExtentThe Saffir-Simpson Scale measures pressure, wind speed, and storm surge in 5 categories, 5 being the most catastrophic. According to the previous hurricane and tropical storm occurrences in the planning area, the maximum hurricane extent experienced were Category 4 hurricanes in 1900 and 1915. Refer to Chapter 2, the Risk Assessment portion of the Fort Bend County HMP Update, for a description of storm extents.
Figure OR.37, Hurricanes/Tropical Storms Affecting Fort Bend County
Storm Name DateClassification
(highest at recorded point nearest planning area)
Grace 08/30/2003 - 09/02/2003 Tropical Storm
Alicia 8/15/1983 - 08/21/1983 H3
Allison 06/24/1989 - 07/01/1989 Tropical Storm
Allison 06/05/2001 - 06/19/2001 Tropical Depression
Cindy 09/16/1963 - 09/20/1963 Tropical Depression
Danielle 09/04/1980 - 09/07/1980 Tropical Storm
Dean 07/28/1995 - 08/02/1995 Tropical Storm
Delia 09/01/1973 - 09/07/1973 Tropical Storm
Elena 08/30/1979 - 09/02/1979 Tropical Depression
Unnamed 1871 06/01/1871 - 06/05/1871 Tropical Storm
Unnamed 1888 07/04/1888 - 07/06/1888 Tropical Storm
Unnamed 1899 06/26/1899 - 06/27/1899 Tropical Storm
Unnamed 1900 08/27/1900 - 09/15/1900 H4
Unnamed 1915 08/05/1915 - 08/23/1915 H4
Unnamed 1921 06/16/1921 - 06/26/1921 H1
Unnamed 1932 08/12/1932 - 08/15/1932 H3
Unnamed 1938 10/10/1938 - 10/17/1938 Tropical Storm
Unnamed 1941 09/17/1941 - 09/27/1941 H2
Unnamed 1945 08/24/1945 - 08/29/1945 H1
Unnamed 1947 08/18/1947 - 08/27/1947 H1
Unnamed 1949 09/27/1949 - 10/07/1949 H2
Unnamed 1974 08/24/1974 - 08/26/1974 Tropical Depression
Unnamed 1980 07/17/1980 - 07/21/1980 Tropical Depression
Unnamed 1981 06/03/1981 - 06/05/1981 Tropical Depression (National Oceanic and Atmospheric Administration Office of Coastal Management, 2017)DRAFT

39
Risk A
ssessment
Fort Bend County Hazard Mitigation Plan, City of Orchard
Hurricanes/Tropical Storms: ProbabilityBased on 24 reported events in 145 years, a hurricane or tropical storm event occurs approximately every 6 years on average in Fort Bend County. Since hurricane and tropical storm events can happen anywhere throughout the HMP update area, the City of Orchard’s future probability is assumed to be similar to the surrounding County area. In the future, the City can expect an event approximately once every 6 years on average, of up to a magnitude of a Category 4 Hurricane based on historical extents for the planning area. Therefore, there is a 17% chance of a hurricane/tropical storm event in a given year. The 100 year maximum (100yr Max)
wind speeds in Figure OR.38 below represent the maximum sustained (3 second) wind gusts of a 100 year hurricane event per census tract. When the jurisdiction covers multiple census tracts, the highest wind speed value is shown.
Figure OR.38, Hurricanes/Tropical Storms Probability
Number of Reported Events
Number of Years in Dataset Probability 100yr Max Wind
Speed (mph)24 145 0.17 112
Hurricanes/Tropical Storms: ImpactA Probabilistic 100-year Return Period HAZUS-MH 3.2 analysis was run on the participating communities. The following describes the results of this analysis.
Figure OR.39, Property Damage Losses, City of OrchardExposed Value ($)
(Building + Content) Building Loss ($) Content Loss ($) Total Loss ($)
46,553,709 102,000 37,000 139,000
HAZUS-MH Results
General Building Stock Damage
The total property damage losses were $ 139,000. The majority of damage can be expected to impact residential areas (93%). The remaining damages (7%) are for commercial, industrial, agricultural and religious buildings. It is estimated that 1 building will experience severe damage and 1 will be completely destroyed. Exposed Value is the total building and content values for structures within the community. Loss values are divided separately for building and content loss in dollars. Property damage losses are shown in Figure OR.39.
Essential Facility Damage
HAZUS does not estimate any critical facilities or infrastructure to be out of service for more than 1 day on the day of the event. One school is expected to receive at least moderate damage (greater than 50% damage). Before the hurricane, Fort Bend County had 345 hospital beds available for use. On the day of the hurricane, the model estimates that 22 hospital beds (only 6%) are available for use by patients already in the hospital and those injured by the hurricane. After 1 week, 30% of the beds will be in service. By 30 days, 100% will be operational.
DRAFT

40
Ris
k A
sses
smen
tFort Bend County Hazard Mitigation Plan, City of Orchard
Debris Generation
HAZUS estimates the amount of building and tree debris that will be generated by the hurricane. Of the total building debris generated, HAZUS classifies the debris as brick/wood and concrete/steel. For the jurisdiction’s total building debris of 14 tons, brick and wood debris comprises 100% while concrete and steel comprises 0%. If the total building debris tonnage is converted to an estimated number of truckloads, it will require 1 truckload (with 1 to 25 tons per truck) to remove.
For trees, the model does not estimate any tree debris will be generated for the jurisdiction.
Shelter Requirements
HAZUS estimates the number of households that are expected to be displaced from their homes due to the hurricane and the number of displaced people that will require accommodations in temporary public shelters. The model estimates no one to be displaced or require temporary shelter in this scenario.
Hurricanes/Tropical Storms: Vulnerability SummarySimilar to the impacts of windstorms, hailstorms, and lightning, Orchard can expect to be impacted with debris and possible utility interruptions of critical infrastructure. In addition, the community’s proximity to US Highway 36, and Fort Bend County’s designation as a “Pass-Through community, could lead to traffic delays caused during coastal evacuation.
DRAFT

41
Risk A
ssessment
Fort Bend County Hazard Mitigation Plan, City of Orchard
EarthquakesEarthquakes: LocationLocations within proximity to fault lines are typically the areas most at risk of earthquakes. As seen in Figure 2.20 within Chapter 2, the Risk Assessment portion of the Fort Bend County HMP Update, the City of Orchard is not within any proximity to USGS mapped fault lines as the closest line is over 50 miles west of Fort Bend County. Therefore, if an event were to occur, however unlikely, the entire
planning area is equally at risk.
Earthquakes: Previous OccurrencesThere have been no documented earthquake events for the City of Orchard according to USGS 1847 to 2015 data as illustrated in Figure 2.20 within Chapter 2, the Risk Assessment portion of the Fort Bend County HMP Update.
Earthquakes: ExtentEarthquakes are measured by Peak Ground Acceleration (PGA). The HAZUS Peak Ground Acceleration (PGA) for the planning area is 1.89% (see Earthquakes: Impact Section for a description of the HAZUS Analysis). This corresponds to the Modified Mercalli Scale Category IV, with light perceived shaking and no potential structure damage. HAZUS measures PGA on a census tract level. Cities within more than 1 census tract were assigned the highest PGA level to reflect the maximum possible extent. Refer to Chapter 2 for PGA and extent scale descriptions (the Risk Assessment portion of the Fort Bend County HMP Update).
Earthquakes: ProbabilityAs there have been no recorded previous occurrences of earthquakes for the City of Orchard and the PGA is less than 2% for the area, as shown in Figure OR.40, the probability of an earthquake in the City in the future is low (unlikely within the next 10 years).
Figure OR.40, Earthquakes Probability
Number of Reported Events Number of Years in Dataset 500yr PGA %
0 170 1.89
Earthquakes: ImpactThe FEMA How-To Guidance, Understanding Your Risks (FEMA 386-2, page 1-7), suggests the earthquake hazard should be profiled if the PGA is greater than 3%g, where PGA measures the acceleration of gravity (g). The City’s PGA is less than 3%g (0.03) and there have been no recorded earthquakes in or near the jurisdiction. Therefore, only a minimum level-1 HAZUS analysis was profiled using the 500-year probability event scenario. The HAZUS analysis produced a PGA of 1.89%. HAZUS also produced $0 in building damages (Residential, Commercial, Agriculture, Religious and Government) from an event. Critical facilities and Infrastructure did not experience any loss of service. There were no critical facilities or infrastructure that experienced moderate to complete damage. No debris was generated from this event and no people or households required temporary housing. There were no moderate, extensive or completely damaged buildings by this event. HAZUS estimates no households are expected to be displaced from their homes or will require accommodations in temporary public shelters due to the earthquake. Additionally, the HAZUS analysis estimated that there will be no casualties or fatalities from this event.
DRAFT

42
Ris
k A
sses
smen
tFort Bend County Hazard Mitigation Plan, City of Orchard
Earthquakes: Vulnerability SummaryAs the Chapter 2 Risk Assessment and HAZUS analysis state, the jurisdiction has a PGA of less than 3%g and does not have to be profiled (FEMA 386-2, page 1-7). Per HAZUS analysis, the jurisdiction can expect no loss of functionality for critical facilities and infrastructures, utility, transportation, and other essential services as defined in the Earthquakes: Impact section. Additionally, the Mercalli Scale describes the maximum PGA (see Chapter 2 Risk Assessment portion of the Fort Bend County HMP Update) as “Light” with no damage to people or buildings. With
a PGA of less than 3%g, no previous events within the jurisdiction and the nearest fault line approximately 50 miles northwest of the County, vulnerabilities for the jurisdiction are considered negligible.
DRAFT
43
Risk A
ssessment
Fort Bend County Hazard Mitigation Plan, City of Orchard
Dam/Levee FailureDam/Levee Failure: LocationThere are no known dams within the City of Orchard according to US Army Corps of Engineers (USACE) National Inventory of Dams (NID) data. However small, non-documented private dams may exist within or upstream of the jurisdiction. The locations that would be affected by a dam failure event are those directly downstream at lower elevations than dams within or upstream from the HMP update area.
According to the USACE National Levee Database (NLD), there are no known levees within the planning area.
Dam/Levee Failure: Previous OccurrencesThere were no recorded dam or levee failure events found affecting the City of Orchard.
Dam/Levee Failure: ExtentThere are no known dams within the City of Orchard according to USACE NID data. However, privately owned, undocumented dams or levees could exist within or upstream of the planning area. These would most likely be small in size. As they are undocumented, there is insufficient data to determine Hazard Classification. Refer to Chapter 2, the Risk Assessment portion of the Fort Bend County HMP Update for Dam and Levee Extent Scale descriptions.
The extent of levee failure can be determined by assessing the amount of area being protected by the levee; a greater amount of area being protected offers greater opportunity for damage in the event of a failure. FEMA has developed flood zone categories to show different potential flood inundation areas. One such category is Shaded Zone X - Protected by Levee, areas of moderate flood hazard between the 100 year and 500 year floodplain extents. As there are no known levees within the jurisdiction, there are no FEMA flood hazard zones (such as Shaded Zone X – Protected by Levee) to identify an extent for the jurisdiction.
Dam/Levee Failure: ProbabilityThe City of Orchard has had no previous occurrences of dam or levee failure reported. Considering the lack of previous events within the planning area, the probability of a dam or levee failure in the future for the City is low (unlikely in the next 10 years).
Dam/Levee Failure: Impact The impact of a dam/levee failure would affect the areas downstream of any non-reported, non-documented private dams, should they exist. It is unknown how much damage would be caused if a failure were to occur, due to a lack of registry data regarding the size and hazard classification. Damage would likely be experienced by structures and roadways in close proximity to the related breach inundation area. Additionally, infrastructure that supports these homes and other parts of the City could be interrupted or compromised.
Dam/Levee Failure: Vulnerability SummaryThere are no documented dams within the City on any of the registries referenced for the update of the Mitigation Plan. There may, however, be privately owned dams on residents’ property. The risk associated with these dams is that there is no record or assurance of proper maintenance or care. It is unknown if these privately owned dams, should they exist, are upstream of any homes, roadways, or structures.
DRAFT

44
Ris
k A
sses
smen
tFort Bend County Hazard Mitigation Plan, City of Orchard
WildfiresWildfires: Location
The Texas A&M Forest Service Texas Wildfire Risk Assessment Portal (TxWRAP) can be used to help communities understand their wildfire risk. Figure OR.41 below shows the location of TxWRAP’s Wildland Urban Interface (WUI) classifications with-in the City of Orchard. The WUI illustrates areas of development that are abutting
natural areas. Here, communities and the built environment have an increased vulnerability to a wildfire event.
Figure OR.41, Wildland Urban Interface (WUI), City of Orchard
(Texas A&M Forest Service, 2016)
DRAFT

45
Risk A
ssessment
Fort Bend County Hazard Mitigation Plan, City of Orchard
Wildfires: Previous OccurrencesThere have been no ignitions reported according to TxWRAP and USGS Federal Fire Occurrence data from the years 1980 to 2015 for the City of Orchard.
Figure OR.42, TxWRAP Fire Intensity Acreage – City of Orchard
Class Acres Percent
Non-Burnable 162 71.6 %1 (Very Low) 0 0.0 %
1.5 0 0.0 %
2 (Low) 14 6.2 %
2.5 1 0.3 %
3 (Moderate) 49 21.7 %
3.5 0 0.2 %
4 (High) 0 0.0 %
4.5 0 0.0 %5 (Very High) 0 0.0 %
Total 226 100%
Wildfires: ProbabilityAlthough there were no wildfire ignition reports found for the City of Orchard from TxWRAP or USGS Federal Fire Occurrence data, a wildfire can be ignited from a variety of sources including lightning or human activity such as campfires, smoking, arson, or equipment use. Therefore, the probability of a future wildfire event for the City is moderate, (possible in the next 10 years) with up to a potential fire intensity of 3, or “Moderate” classification on the TxWRAP Characteristic Fire Intensity Scale.
Wildfires: ImpactImpact on the community can be measured using TxWRAP Housing Density levels within the WUI. Areas with a higher housing and population density would be affected to a greater extent than more rural areas, and especially areas near burnable fuels. Figure OR.43 lists the population, percent of total population, WUI acreage and percent of WUI acreage for the City of Orchard, according to the Texas A&M Forest Service TxWRAP Community Summary Report.
Wildfires: ExtentFigure OR.42 lists the Fire Intensity Acreage for the City according to the Texas A&M Forest Service TxWRAP Community Summary Report. For a description of the
Characteristic Fire Intensity Scale (FIS), refer to Chapter 2, the Risk Assessment portion of the Fort Bend County HMP Update.
DRAFT

46
Ris
k A
sses
smen
tFort Bend County Hazard Mitigation Plan, City of Orchard
Figure OR.43, WUI Acreage, City of Orchard
Housing Density WUI Population
Percent of WUI Population WUI Acres Percent of WUI
AcresLT 1hs/40ac 0 0.0 % 0 0.0 %
1hs/40ac to 1hs/20ac 0 0.0 % 0 0.0 %
1hs/20ac to 1hs/10ac 0 0.0 % 4 3.0 %
1hs/10ac to 1hs/5ac 55 20.6 % 24 18.0 %
1hs/5ac to 1hs/2ac 35 13.1 % 52 38.6 %
1hs/2ac to 3hs/1ac 177 66.3 % 54 40.4 %
GT 3hs/1ac 0 0.0 % 0 0.0 %
Total 267 100% 134 100%
Wildfires: Vulnerability Summary There are not many heavily wooded areas in Orchard, with most of the areas surrounding the City being cleared agricultural land. There are many trees in yards, as well as in the wooded City Park, however these are all well maintained. City streets act as fire breaks in vegetation The Public Water Supply provides fire hydrants, however these are not equipped with a capacity for pumping water for fire fighting but are better used for filling pumper trucks. There is a fire service that provides large item pick-up events that could be co-marketed as a wildfire mitigation effort.
DRAFT
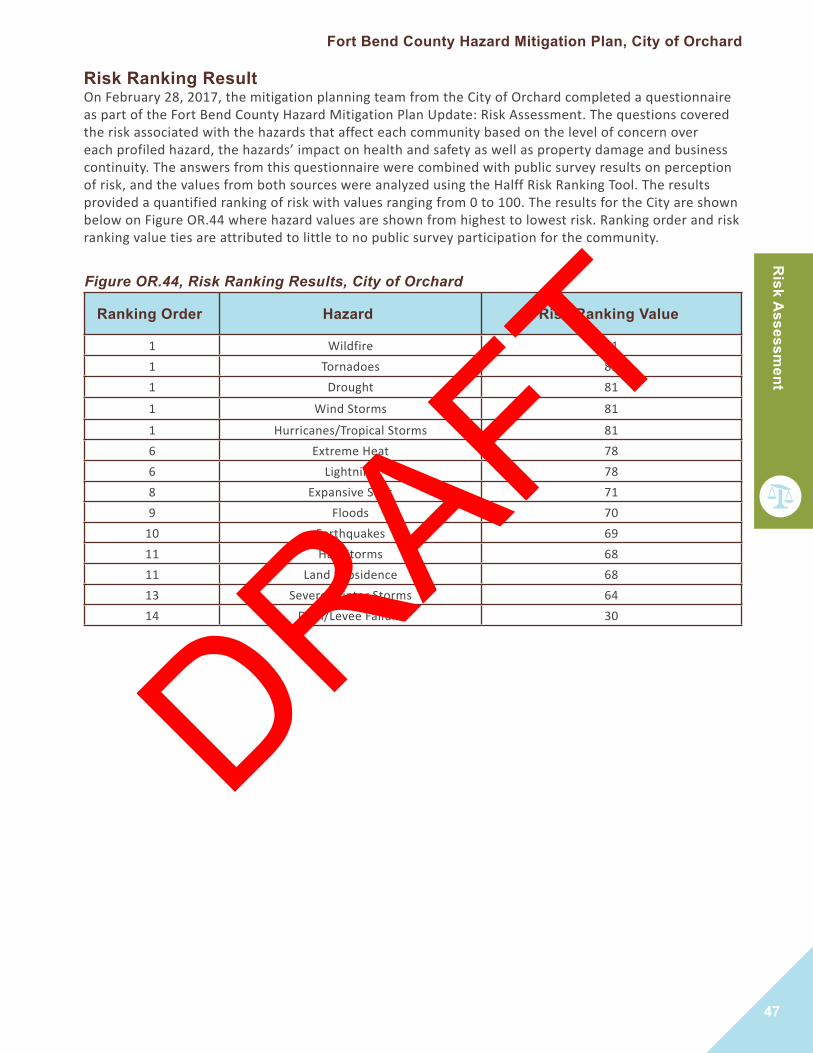
47
Risk A
ssessment
Fort Bend County Hazard Mitigation Plan, City of Orchard
Risk Ranking ResultOn February 28, 2017, the mitigation planning team from the City of Orchard completed a questionnaire as part of the Fort Bend County Hazard Mitigation Plan Update: Risk Assessment. The questions covered the risk associated with the hazards that affect each community based on the level of concern over each profiled hazard, the hazards’ impact on health and safety as well as property damage and business continuity. The answers from this questionnaire were combined with public survey results on perception of risk, and the values from both sources were analyzed using the Halff Risk Ranking Tool. The results provided a quantified ranking of risk with values ranging from 0 to 100. The results for the City are shown below on Figure OR.44 where hazard values are shown from highest to lowest risk. Ranking order and risk ranking value ties are attributed to little to no public survey participation for the community.
Figure OR.44, Risk Ranking Results, City of Orchard
Ranking Order Hazard Risk Ranking Value
1 Wildfire 811 Tornadoes 811 Drought 81
1 Wind Storms 81
1 Hurricanes/Tropical Storms 816 Extreme Heat 786 Lightning 788 Expansive Soils 719 Floods 70
10 Earthquakes 6911 Hail Storms 6811 Land Subsidence 6813 Severe Winter Storms 6414 Dam/Levee Failure 30
DRAFT

48
Miti
gatio
n St
rate
gyFort Bend County Hazard Mitigation Plan, City of Orchard
Section 3: Mitigation StrategyThis section examines the community’s ability to perform mitigation (review of existing capabilities, shown in Figure OR.45) and identifies specific actions to address vulnerabilities for each hazard profiled in the Fort Bend County HMP Update. The mitigation strategy is the application of actions into an approach for performing structural and non-structural mitigation efforts within the jurisdiction. Actions are also prioritized and considered for incorporation into other community programs, regulations, projects or plans.
Completed and canceled actions are also included in a separate section for future reference.
Figure OR.45, Existing Capabilities, City of Orchard
Capability Name Capability Type How it can Accomplish Mitigation
Mayor/Emergency Management Coordinator Elected Official Political support and funding for mitigation actions/
Management of City-level HMP updates.
City Administrator Staff Support for implementation of mitigation actions.
Engineer/Floodplain Administrator Staff Expertise in structural mitigation projects and compliance
with flood damage prevention ordinance.Ad Valorem Tax Funding Provides potential funding for Hazard Mitigation items.
Sales Tax Funding Provides potential funding for Hazard Mitigation items.
Permitting Fees for Development Funding Provides potential funding for Hazard Mitigation items.
Chapter 211 of the Local Government Code: Zoning Authority Authorizes the City to regulate Zoning
Chapter 213 of the Local Government Code: Municipal Comprehensive Plans
Authority Authorizes the City to adopt a comprehensive plan for the long-range development of the City
Chapter 214 of the Local Government Code Authority
Authorizes the City to have regulatory authority as it related to building code (such as structural integrity and plumbing)
Ordinance 002-74- Private Water Wells Regulation
Ordinance making illegal the use for human consumption of water from a private water well within the corporate limits of the Town of Orchard (sic).
Used to consider modifications or enhancements for water conservation and drought mitigation purposes.
Ordinance 027-83- CulvertsRegulation
Ordinance related to permitting for culvert installation
Used to consider modifications or enhancements for mitigation purposes, for flood.
Ordinance 104-14- Utility Fees and Charges for Water Service Regulation Used to identify potential funding for flood mitigation
projects.
Ordinance 043-99- Regulating Mobile Homes in the City Regulation
Read to identify possible enhancements to further protect mobile homes and manufactured homes from hazards, such as windstorms, tornadoes, hurricane/tropical storms, and expansive soils.
Ordinance 015-78- Ad Valorem Tax Regulation Reviewed to identify potential funding for mitigation
projects.
DRAFT

49
Mitigation Strategy
Fort Bend County Hazard Mitigation Plan, City of Orchard
Figure OR.45, Existing Capabilities, City of Orchard
Capability Name Capability Type How it can Accomplish Mitigation
Ordinance 073-05- Establishing an Emergency Management Program
Regulation Reviewed for possible enhancements in order to provide for specific authority to perform mitigation.
Ordinance 085-07- Subdivision Ordinance Regulation Reviewed for reference to floodplain management
standards.Ordinance 107-2015- Sales Tax Reauthorization Regulation Reviewed to identify potential funding for mitigation
projects.Ordinance 110-16- Standardized Building Code Regulation Reviewed for possible enhancements for mitigation
purposes.The Private Real Property Rights Preservation Act - Subchapter B: Chapter 2007 of the General Government Code
Authority Authorizes a “taking”/Regulates construction in an area designated under law as a floodplain.
Texas Senate Bill 936- 77th Legislative Session Authority
Allows counties and general law cities to regulate on the same level as cities are able to. Also allows counties to collect reasonable fees to cover administrative costs incurred by the administration of a local floodplain management program. Also provides for Criminal and Civil Penalties and injunctive relief.
Flood Damage Prevention Ordinance Regulation Reviewed existing ordinance for identification of potential
higher standards, such as freeboard.
National Flood Insurance Program ParticipationCity of Orchard currently participates in the National Flood Insurance Program. Currently, there are no Certified Floodplain Managers on staff, due to a lack of resources and manpower. The amount of mapped floodplain in Orchard is very small. The City has adopted minimum standards in their flood damage prevention ordinance and regulation of the development within the floodplain are done through the City Engineer, a consultant. The City will continue to explore options for higher standards. Orchard has a total of 4 NFIP policies in force, as of June 2017. This totals $770,000 in total insurance coverage.
Mitigation GoalsThe plan-level Mitigation Goals can be found in Chapter 3, the Mitigation Strategy portion of the Fort Bend County HMP Update. These goals apply to each community and were mutually decided upon as the guiding goals for the development of actions in each jurisdiction.
, Cont’d
DRAFT

50
Miti
gatio
n St
rate
gyFort Bend County Hazard Mitigation Plan, City of Orchard
1 Reinforcement of Critical Facilities (previously action 1 in 2011 plan, modified)
Hazard Item Description Implementation Agency
Windstorms, Tornadoes, Hurricanes/Tropical Storms.
Earthquakes
Reinforcement of critical facilities to withstand high winds from severe weather and earthquakes. Fire Station and City Hall buildings require reinforcement to withstand high winds due to age of structures.
City of Orchard
Cost Estimate/Funding Schedule Status as of 2017 *Risk Focus:
$250,000-$500,000 Depending on amount of retrofit needed.
TBD; Initiated upon funding
Seeking funding source
E
Cost and Benefit ConsiderationsInitial review indicates that project is cost-effective.
Figure OR.46, Mitigation Actions*E= Actions reducing risk to existing buildings and infrastructure *F= Actions reducing risk to new development and redevelopment
2 Retrofit Existing Public School Building (previously action 2 in 2011 plan, modified)
Hazard Item Description Implementation Agency
Windstorms, Tornadoes, Hurricanes/Tropical Storms
Retrofit existing public school building to become a community emergency shelter in the event of a tornado, or hazmat incident. In 2002 the school buildings were severely damaged by a tornado and later by a fire. Some of the structures have been repaired. However additional repairs are still needed. Fort Bend County Engineering and Emergency Management should study feasibility of completing repairs or developing other options for residents.
City of Orchard
Cost Estimate/Funding Schedule Status as of 2017 *Risk Focus:
FBC Staff time and resources to complete Study. Project cost could exceed $500,000
TBD; Initiated upon funding
Seeking funding source
E
Cost and Benefit ConsiderationsNot independently cost-effective, but the initial step in identifying appropriate mitigation actions.
DRAFT

51
Mitigation Strategy
Fort Bend County Hazard Mitigation Plan, City of Orchard
3 Increase Public Awareness of Hazards
Hazard Item Description Implementation Agency
Drought, Extreme Heat, Severe Winter Storm, Lightning, Hailstorms, Windstorms,
Tornadoes, Expansive Soils, Floods, Land Subsidence,
Hurricanes/Tropical Storms, Earthquakes, Dam/Levee
Failure, Wildfires
Distribute public awareness information regarding flood hazards, SFHAs, and potential mitigation measures using the local newspaper, utility bill inserts, inserts in the phone book, a City hazard awareness website, and an educational program for school age children or “how to” classes in retrofitting by local merchants. Integrate “Disaster Resistance Education” into the public school curriculum. Provide public education on the importance of maintaining the ditches.
City of Orchard
Cost Estimate/Funding Schedule Status as of 2017 *Risk Focus:
TBD 60 months Ongoing N/A
Cost and Benefit ConsiderationsNot independently cost-effective.
4 Evacuation Plans (previously action 4 in 2011 plan, modified)
Hazard Item Description Implementation Agency
Floods, Hurricanes/Tropical Storms, Dam/Levee Failure,
Wildfires
Ensure that the City has adequate evacuation plans and notification procedures in place.
City of Orchard
Cost Estimate/Funding Schedule Status as of 2017 *Risk Focus:
No additional cost – uses existing staff resources TBD; Initiated upon funding Not Started N/A
Cost and Benefit ConsiderationsNot independently cost-effective, but essential in minimizing loss of life and injuries during significant storms. DRAFT

52
Miti
gatio
n St
rate
gyFort Bend County Hazard Mitigation Plan, City of Orchard
5 Wildfire Hazard Areas (previously action 5 in 2011 plan, modified)
Hazard Item Description Implementation Agency
Wildfires Determine and map potential wildfire hazard areas.
City of Orchard
Cost Estimate/Funding Schedule Status as of 2017 *Risk Focus:
TBD TBD; Initiated upon funding Not Started N/A
Cost and Benefit ConsiderationsNot independently cost-effective, but essential in minimizing loss of life and injuries during significant storms.
6 Monitor Drought Conditions
Hazard Item Description Implementation Agency
Drought, Land Subsidence Continue to monitor drought conditions through contact with State Agencies.
City of Orchard
Cost Estimate/Funding Schedule Status as of 2017 *Risk Focus:
No additional cost – uses existing staff 60 months Ongoing N/A
Cost and Benefit ConsiderationsNot independently cost-effective.
7 Public Information Campaigns
Hazard Item Description Implementation Agency
Drought, Land Subsidence Cooperate and coordinate with the County and State agencies in developing public information campaigns and/or water use restrictions to ensure sufficient water pressure for fire-fighting and provision of drinking water during periods of drought.
City of Orchard
Cost Estimate/Funding Schedule Status as of 2017 *Risk Focus:
No additional cost – uses existing staff resources 60 months Ongoing N/A
Cost and Benefit ConsiderationsVery difficult to determine, but presumed very cost-effective because actions preserves essential function
DRAFT

53
Mitigation Strategy
Fort Bend County Hazard Mitigation Plan, City of Orchard
8 Evaluate Excess Heat Risks (previously action 8 in 2011 plan, modified)
Hazard Item Description Implementation Agency
Extreme Heat Evaluate the risks presented by excessive heat and humidity, especially in terms of high-risk populations such as the elderly/low income.
City of Orchard
Cost Estimate/Funding Schedule Status as of 2017 *Risk Focus:
No additional cost – uses existing staff resources TBD; Initiated upon funding Not Started N/A
Cost and Benefit ConsiderationsNot independently cost-effective, but needed to develop adequate risk reduction efforts
9 Address High Risk Populations (Excessive Heat) (previously action 9 in 2011 plan, modified)
Hazard Item Description Implementation Agency
Extreme Heat In cooperation with County and State officials, ensure that high-risk populations are adequately addressed in response plans that are related to excessive heat risks.
City of Orchard
Cost Estimate/Funding Schedule Status as of 2017 *Risk Focus:
No additional cost – uses existing staff resources TBD; Initiated upon funding Not Started N/A
Cost and Benefit ConsiderationsVery difficult to determine, but presumed very cost-effective as actions serve to prevent death and injury
10 Review Plans and Resources to Address Risk Posed by Snow and Ice Hazards During Winter Storms
Hazard Item Description Implementation Agency
Severe Winter Storms Conduct a review of the City’s current plans and resources to address the risks posed by ice and snow hazards during winter storms. Focus on City’s ability to respond to snow and ice emergencies, and on potentially at-risk populations in the community.
City of Orchard
Cost Estimate/Funding Schedule Status as of 2017 *Risk Focus:
No additional cost – uses existing staff resources 12 months Ongoing N/A
Cost and Benefit ConsiderationsNot independently cost-effective, but contributes to maintaining public services; protects at-risk populations
DRAFT

54
Miti
gatio
n St
rate
gyFort Bend County Hazard Mitigation Plan, City of Orchard
11 Various Mitigation Actions to Reduce Wildfire Risk
Hazard Item Description Implementation Agency
Wildfire On a case-by-case basis, develop and initiate mitigation actions to reduce the wildfire and brushfire risk. Actions may include informing property owners of appropriate actions, clearing vegetation, and monitoring antecedent conditions, among others.
City of Orchard
Cost Estimate/Funding Schedule Status as of 2017 *Risk Focus:
No additional cost – uses existing staff resources TBD/as need is identified Not Started N/A
Cost and Benefit ConsiderationsCost-effective, as measures tend to be inexpensive and prevent fires
12 Upgrades to At-Risk Structures (previously action 12 in 2011 plan, modified)
Hazard Item Description Implementation Agency
Severe Winter Storms, Hailstorms, Windstorms, Tornadoes, Hurricanes/
Tropical Storms
Initiate upgrades to at-risk structures and/or infrastructure. Mitigates specific risks to structures, people and operations.
City of Orchard
Cost Estimate/Funding Schedule Status as of 2017 *Risk Focus:
Varies depending on measure. Funding from General Fund or FEMA grant program/s TBD based on study Not Started E
Cost and Benefit ConsiderationsCost-effectiveness will vary with level of risk and project cost
DRAFT

55
Mitigation Strategy
Fort Bend County Hazard Mitigation Plan, City of Orchard
13 Install Ground Systems/Surge Protection (previously action 10 in 2011 plan)
Hazard Item Description Implementation Agency
Lightning Install grounding systems and/or surge protection at the Fire Station and City Hall
City of Orchard
Cost Estimate/Funding Schedule Status as of 2017 *Risk Focus:
TBD TBD; Initiate upon funding Not Started F
Cost and Benefit ConsiderationsVery cost-effective
14 Review City Ordinances and Building Codes
Hazard Item Description Implementation Agency
Windstorms, Expansive Soils, Land Subsidence
Review city ordinances and building code to ensure that they address expansive soils, land subsidence, and windstorms
City of Orchard
Cost Estimate/Funding Schedule Status as of 2017 *Risk Focus:
TBD TBD; Initiate upon funding Not Started N/A
Cost and Benefit ConsiderationsVery cost-effective
DRAFT

56
Miti
gatio
n St
rate
gyFort Bend County Hazard Mitigation Plan, City of Orchard
Capabilities Assessment
Evaluation/Prioritization of Actions Each action added to the plan was developed using the Mitigation Action Summary Worksheet shown in Figure OR.47. Mitigation action prioritization, Figure OR.48, involved MPC evaluation of existing actions against 10 criteria that quantify feasibility and effectiveness of actions. These determinations were added to risk ranking scores (highest ranking for actions that address multiple hazards) in order to score each mitigation action. These rankings are shown in order from highest priority to lowest, by total score. Non-cost effective projects were not included in prioritization activity.
Figure OR.47, Mitigation Action Summary Worksheet
DRAFT

57
Mitigation Strategy
Fort Bend County Hazard Mitigation Plan, City of Orchard
Figure OR.48, Mitigation Action Prioritization (with Hazards in order of highest priority to lowest)
Mitigation Action
Life Safety
Property Protection
Technical
Political
Legal
Environmental
Social
Adm
inistrative
Local Cham
pion
Other C
omm
unity
Risk R
anking Score
Total Score
2. Retrofit Existing Public School Building + + + + + 0 + + 0 0 81 88
3. Increase Public Awareness of Hazards + 0 + + + 0 + + 0 0 81 87
1. Reinforcement of Critical Facilities+ + 0 + + 0 0 + 0 0 81 86
6. Monitor Drought Conditions0 + + 0 + + 0 + 0 0 81 86
7. Public Information Campaigns0 + + 0 + + 0 0 0 + 81 86
12. Upgrades to At-Risk Structures+ + + + + 0 0 0 0 0 81 86
14. Review City Ordinances and Building Code + + + + 0 0 0 + 0 0 81 86
4.Evacuation Plans+ 0 + 0 + 0 0 + 0 0 81 85
5. Wildfire Hazard Areas+ + 0 0 + 0 0 - 0 + 81 84
8. Evaluate Excess Heat Risks+ 0 + + + 0 + + 0 0 78 84
9. Address High Risk Populations (Excessive Heat) + 0 + + + 0 + + 0 0 78 84
11. Various Mitigation Actions to Reduce Wildfire Risk + + 0 0 + 0 0 - 0 + 81 84
13. Install Grounding Systems/Surge Protection + + + + + 0 0 + 0 0 78 84
DRAFT

58
Miti
gatio
n St
rate
gyFort Bend County Hazard Mitigation Plan, City of Orchard
Mitigation Actions by HazardThe mitigation actions in Figure OR.49 are shown with the hazards that they mitigate.
Figure OR.49, Mitigation Action Impact, City of Orchard
Action N
umber
Drought
Extreme H
eat
Severe Winter
Storms
Lightning
Hailstorm
s
Windstorm
s
Tornadoes
Expansive Soils
Floods
Land Subsidence
Hurricanes/
Tropical Storms
Earthquakes
Dam
/ Levee Failure
Wildfire
1 X X X X2 X X X3 X X X X X X X X X X X X X X4 X X X X5 X6 X X7 X X8 X9 X
10 X11 X12 X X X X X13 X14 X X X
Figure OR.48, Mitigation Action Prioritization (with Hazards in order of highest priority to lowest)
Mitigation Action
Life Safety
Property Protection
Technical
Political
Legal
Environmental
Social
Adm
inistrative
Local Cham
pion
Other C
omm
unity
Risk R
anking Score
Total Score
10. Review Plans and Resources to Address Risk Posed by Snow and Ice Hazards During Winter Storms
+ + + + + 0 + + 0 0 64 71
, Cont’d
DRAFT

59
Mitigation Strategy
Fort Bend County Hazard Mitigation Plan, City of Orchard
Integration Efforts Figure OR.50 captures ways that the Risk Assessment, Goals and Actions developed in the HMP can be integrated into other City of Orchard documents, programs and regulations.
Figure OR.50, Plan Integration EffortsName of
Document Type Item Type Opportunity for Integration
Community Development Block Grant- Disaster Recovery Funding
Funding ActionInclusion of mitigation actions in the County-level plan for the use of General Land Office funds allocated for disaster recovery-related projects.
Hazard Mitigation Grant Program (HMGP)
Funding Action Identify actions that can be funded through new and existing grant awards.
Pre-Disaster Mitigation (PDM)
Funding Action Identify actions that can be funded through new and existing grant awards.
Flood Mitigation Assistance (FMA)
Funding Action Identify actions that can be funded through new and existing grant awards.
TWDB Flood Protection Planning (FPP) Grant
Funding Action Identify actions that can be funded through new and existing grant awards.
TWDB Clean Water State Revolving Fund (CWSRF)
Funding Action Identify actions that can be funded through new and existing grant awards.
Texas Water Development Fund (DFund)
Funding Action Identify actions that can be funded through new and existing loans.
DRAFT

60
Fina
lize
Plan
Upd
ate
Fort Bend County Hazard Mitigation Plan, City of Orchard
Section 4: Finalize Plan Update (Review, Evaluation, and Implementation)Changes in DevelopmentGrowth has been small , with an average of under 10 permits for development per year. They reinstated the Economic Development Council recently to help attract....
Figure OR.51, Past Mitigation Action Progress Reports Summary - Completed and Canceled
13 Structural/Engineering Study of Orchard Public Facilities
Hazard Item Description Implementation Agency
Severe Winter Storms, Hailstorms, Windstorms, Tornadoes, Hurricanes/
Tropical Storms
Complete a detailed structural/engineering survey of Orchard public facilities to ensure their soundness with respect to resisting the effects of high winds, extreme roof loading from snow or ice, hail and earthquake. Forms basis of decisions about any additional actions to mitigate risk.
City of Orchard
Cost Estimate/Funding Schedule Status as of 2017 *Risk Focus:
TBD, but if initiated probably from General FundNot yet established – to
commence only if funding is available
Canceled N/A
Cost and Benefit ConsiderationsNot independently cost-effective, but the initial step in identifying appropriate mitigation actions
Changes in PrioritiesThe City of Orchard has not experienced mass development. They would like to encourage annexations and increased commercial development along the highway to promote growth.
DRAFT

61
Approval and A
doptionFort Bend County Hazard Mitigation Plan, City of Orchard
Section 5: Approval and AdoptionApproval and Adoption Procedure
Figure OR.52, Municipal Jurisdiction Adoption Date
Municipality APA Date Adoption Date
City of Orchard
DRAFT

62
App
rova
l and
Ado
ptio
nFort Bend County Hazard Mitigation Plan, City of Orchard
Jurisdiction Adoption Documentation Placeholder
DRAFT

63
References
Fort Bend County Hazard Mitigation Plan, City of Orchard
ReferencesBerger, E. (2013, 12 3). What a difference 3 years makes in state’s drought. Retrieved from Houston
Chronicle: http://www.houstonchronicle.com/news/science-environment/article/What-a-difference-3-years-makes-in-state-s-drought-5031853.php
City of Orchard. (1974, 07 26). Ordinances: Retrieved from City of Orchard: http://www.orchardtexas.net/users/ords/ORDINANCE%20NO.%202-1974%20Unlawful%20use%20of%20private%20water%20wells.pdf
Fort Bend Subsidence District . (2015). Fort Bend Subsidence District 2015 Annual Groundwater Report.
Geology.com. (2016, 12 01). Expansive Soil: The hidden force behind basement and foundation problems. Retrieved from Soil Article: http://geology.com/articles/soil/
(2013). Groundwater depletion in the United States (1900−2008). Reston, VA: U.S. Geological Survey. Retrieved from USGS: https://pubs.er.usgs.gov/publication/sir20135079
Leonard F. Konikow. (2013). Groundwater Depletion in the United States 1900-2008, USGS Scientific Investigations Report 2013-5079.
National Fire Protection Association. (2013, June). NFPA News & Research. Retrieved from Lightning Fires and Lightning Strikes: http://www.nfpa.org/news-and-research/fire-statistics-and-reports/fire-statistics/fire-causes/lightning-fires-and-lightning-strikes
National Flood Insurance Program. (2016). Repetitive and Severe Repetitive Loss Report for Fort Bend County. Denton, TX: Federal Emergency Management Agency.
National Highway Traffic Safety Administration. (2017, 03 11). Traffic Safety Facts. Retrieved from Texas 2011-2015: https://cdan.nhtsa.gov/SASStoredProcess/guest
National Highway Traffic Safety Administration. (2017, 03 11). Traffic Safety Facts. Retrieved from Texas 2011-2015: https://cdan.nhtsa.gov/SASStoredProcess/guest?_program=%2FUATTest%2FSTSI
National Oceanic and Atmospheric Administration. (2016). Historical Hurricane Tracks. Retrieved from National Oceanic and Atmospheric Administration Coastal Management: https://coast.noaa.gov/hurricanes/
National Oceanic and Atmospheric Administration. (2016, 12 01). National Weather Service Forecast Office- Austin/San Antonio, TX. Retrieved from NOWData- NOAA Online Weather Data: http://w2.weather.gov/climate/xmacis.php?wfo=ewx
National Oceanic and Atmospheric Administration Office of Coastal Management. (2017, 4 17). Historical Hurricane Tracks. Retrieved from NOAA: https://coast.noaa.gov/hurricanes/?redirect=301ocm
National Oceanic and Atmospheric Administration. (2016, 12 01). National Centers for Environmental Information. Retrieved from Data Access: https://www.ncdc.noaa.gov/data-access
National Severe Storms Laboratory. (2016, 12 01). Severe Storm Climatology. Retrieved from Total Threat: http://www.nssl.noaa.gov/projects/hazard/totalthreat.html
State of Texas . (1995, 08 28). Texas Constitution and Statutes. Retrieved from Local Government Code-Title 7. Regulation of Land Use, Structures, Businesses and Related Activities, Subtitle A. Municipal Regulatory Authority, Chapter 214 Municipal Regulation of Housing and Other Structures: http://www.statutes.legis.state.tx.us/Docs/LG/htm/LG.214.htm
State of Texas. (1987, 09 1). Texas Constitution and Statutes. Retrieved from Local Government Code-Title 7. Regulation of Land Use, Structures, Businesses and Related Activities, Subtitle A. Municipal Regulatory Authority, Chapter 211 Municipal Zoning Authority, Subchapter A General Zoning Regulations: http://www.statutes.legis.state.tx.us/SOTWDocs/LG/htm/LG.211.htm
State of Texas. (1997, 09 01). Texas Constitution and Statutes. Retrieved from Local Government
DRAFT

64
Ref
eren
ces
Fort Bend County Hazard Mitigation Plan, City of Orchard
Code-Title 7. Regulation of Land Use, Structures, Businesses and Related Activities, Subtitle A. Municipal Regulatory Authority, Chapter 211 Municipal Comprehensive Plans: http://www.statutes.legis.state.tx.us/Docs/LG/htm/LG.213.htm
Texas A&M Forest Service. (2016, 12 01). Wildfire Risk Assessment Portal. Retrieved from Public Viewer: https://www.texaswildfirerisk.com/
Texas Department of State Health Services - Injury Epidemiology & Surveillance Branch. (2017). Texas Health Care Information Collection and Trauma Registry. Austin, TX: Dr. Stacy Jorgensen.
Texas Department of State Health Services- Injury Epidemiology & Surveillance Branch. (2017). Texas Health Care Information Collection and Trauma Registry. Austin, TX: Dr. Stacy Jorgensen.
Texas Department of Transportation. (2017, 03 11). Crash Records Information System. Retrieved from C.R.I.S Query: https://cris.dot.state.tx.us/public/Query/#/public/welcome
Texas Division of Emergency Management . (2013). State of Texas Hazard Mitigation Plan Update. Austin, TX: Texas Division of Emergency Management.
Texas Natural Resources Information System. (2011). TNRIS Data Catalog Low Water Crossings. Retrieved from TNRIS: https://tnris.org/data-catalog
Texas Speleological Survey. (2017, 4 6). Karst Regions of Texas. Retrieved from Texas Speleological Survey: https://www.texasspeleologicalsurvey.org/karst_caving/karst_regions.php
The National Drought Mitigation Center. (2017, 4 5). U.S. Drought Monitor Map Archive. Retrieved from United State Drought Monitor.
Tornado Facts. (2016, 03 16). Tornado Facts and Information . Retrieved from Tornado Scale: http://www.tornadofacts.net/tornado-scale.php
United States Census Bureau. (2017, 03 11). United States Census Bureau. Retrieved from QuickFacts, Orchard, Texas: https://www.census.gov/quickfacts/
University of Nebraska-Lincoln. (2016, 12 01). The National Drought Mitigation Center. Retrieved from Drought Impact Reporter: http://droughtreporter.unl.edu/map/
Vaisala NLDN. (2016, 12 01). Thunderstorm and Lightning Detection Systems. Retrieved from National Lightning Detection Network: http://www.vaisala.com/en/products/thunderstormandlightningdetectionsystems/Pages/NLDN.aspx
Wirfs-Brock, J. (2014, 08 18). Inside Energy. Retrieved from Data: Explore 15 Years of Power Outages: http://insideenergy.org/2014/08/18/data-explore-15-years-of-power-outages/
DRAFT