draft price proposal - airservices australia...draft price proposal pricing proposal airservices...
TRANSCRIPT
Draft Price Proposal
December 2010
Airservices Australia | 1
Draft Price Proposal
PRICING PROPOSAL 3
PROPOSAL OVERVIEW 5
Background 6 Development of the 2011 LTPA 7 Structure of Prices in the 2011 LTPA 9 Risk Sharing 11 Services Charter 13 Proposed Prices 15
IMPLEMENTATION & CONSULTATION 17
Implementation Timeline 17 Public Meeting Program 17 Website 17
PRICING PRINCIPLES 18
Principles for Determining Prices 18 ACCC Building Block Overview 18 Pricing Period 19 Estimated Allowable Revenues 19 Operating Costs 20 Asset Values, Capital Expenditure and Depreciation 21 Return on Capital (WACC) 22
DETERMINING PRICES 24
Cost Attribution 24 Flight Activity Volume Forecasts 27 Transitional Price Capping 27
BASIS OF CHARGES 29
MTOW (Maximum Take-Off Weight) 29 Charging for General Aviation 29 ARFF Charges for Non-Airside Call-Outs 30 Charging for Out-Of-Hours services 30
IMPACT OF PRICES 31
Estimated Impact by Aircraft Type 31
APPENDIX 1 – ACTIVITY FORECASTS 32
APPENDIX 2 – AVERAGE MTOWS 34
APPENDIX 3 – SERVICES CHARTER PERFORMANCE MEASUREMENT METRICS 36
ATM performance indicators 36 ARFF performance indicators 38
Airservices Australia | 2
Draft Price Proposal
Pricing Proposal
Airservices Australia has developed a new long term pricing proposal for industry consultation that is proposed to commence on 1 July 2011 for each of its service lines of Enroute, Terminal Navigation (TN) and Aviation Rescue and Fire Fighting (ARFF).
The proposal delivers price certainty and a real price reduction of more than six per cent over the next five years. It responds to stakeholder feedback that Airservices has received during a range of consultation processes conducted over the last two years and most recently as part of the Terminal Navigation Pricing Review that was undertaken in accordance with the Government’s National Aviation Policy White Paper.
The five year pricing proposal was developed applying the Australian Competition and Consumer Commission’s (ACCC) building block model. It funds new services and new regulatory requirements as well as improved infrastructure.
To balance the risks associated with pricing over a long period, the proposal includes risk sharing across the three pricing elements: flight activity; capital expenditure; and regulatory change. These risk sharing arrangements reduce excessive over or under cost recovery, hold Airservices accountable for maintaining appropriate capital investment, and make provision for additional costs associated with regulatory changes.
The proposed prices in each year for each service and location are set out in the following pages.
We are now asking for industry comment and would like feedback on this proposal by no later than 24 January 2011 to:
[email protected] or by mail at
Pricing Consultation PO Box 367 Canberra ACT 2600
A number of public consultation sessions will be held in all major capital cities and some regional locations in January 2011. Details on these are provided on page 16.
Based on the feedback received we will then consider whether the proposal needs to be adjusted before we notify the ACCC in early February 2011 of our intention to implement a new Long Term Pricing Agreement from 1 July 2011.
Airservices Australia | 3
Draft Price Proposal
If you have questions on the paper or the review process, please do not hesitate to contact myself on 02 6268 4850 ([email protected]) or Paul Logan, Manager Financial Strategy and Business Performance, on 02 6268 4241 ([email protected]).
Yours sincerely
Andrew Clark Chief Financial Officer 1 December 2010
Airservices Australia | 4
Draft Price Proposal
PROPOSAL OVERVIEW
This proposal is founded on our pricing objectives of:
providing pricing certainty for Airservices and its customers that will support their respective investment programs;
signalling the right investment at the right time; and continuously improving the efficiency of service delivery by both
Airservices and the industry as a whole.
It follows a two year price freeze that was implemented at the expiry of the 2005 Long Term Pricing Agreement (LTPA) in December 2009 which provided certainty for industry while the economy recovered from the effects of the Global Financial Crisis.
The proposal incorporates the outcomes of the Terminal Navigation pricing review undertaken earlier this year, as well as the consultation on all price structures that has occurred over the last two years.
The price strategy provides a five year price path, funds scheduled prioritised investment, improves the linkage between prices and costs, reflects closely located airport synergies and limits price increases to affordable year-on-year changes at or around inflation.
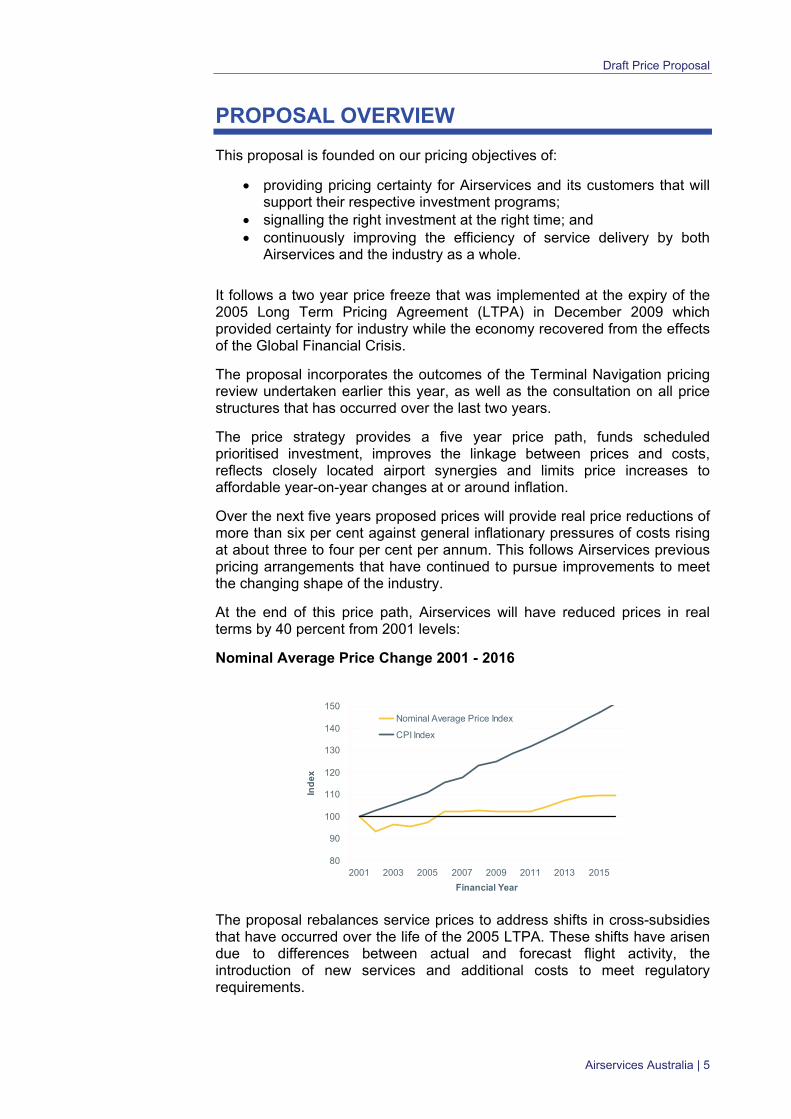
Over the next five years proposed prices will provide real price reductions of more than six per cent against general inflationary pressures of costs rising at about three to four per cent per annum. This follows Airservices previous pricing arrangements that have continued to pursue improvements to meet the changing shape of the industry.
At the end of this price path, Airservices will have reduced prices in real terms by 40 percent from 2001 levels:
Nominal Average Price Change 2001 - 2016
80
90
100
110
120
130
140
150
2001 2003 2005 2007 2009 2011 2013 2015
Financial Year
Ind
ex
Nominal Average Price Index
CPI Index
The proposal rebalances service prices to address shifts in cross-subsidies that have occurred over the life of the 2005 LTPA. These shifts have arisen due to differences between actual and forecast flight activity, the introduction of new services and additional costs to meet regulatory requirements.
Airservices Australia | 5
Draft Price Proposal
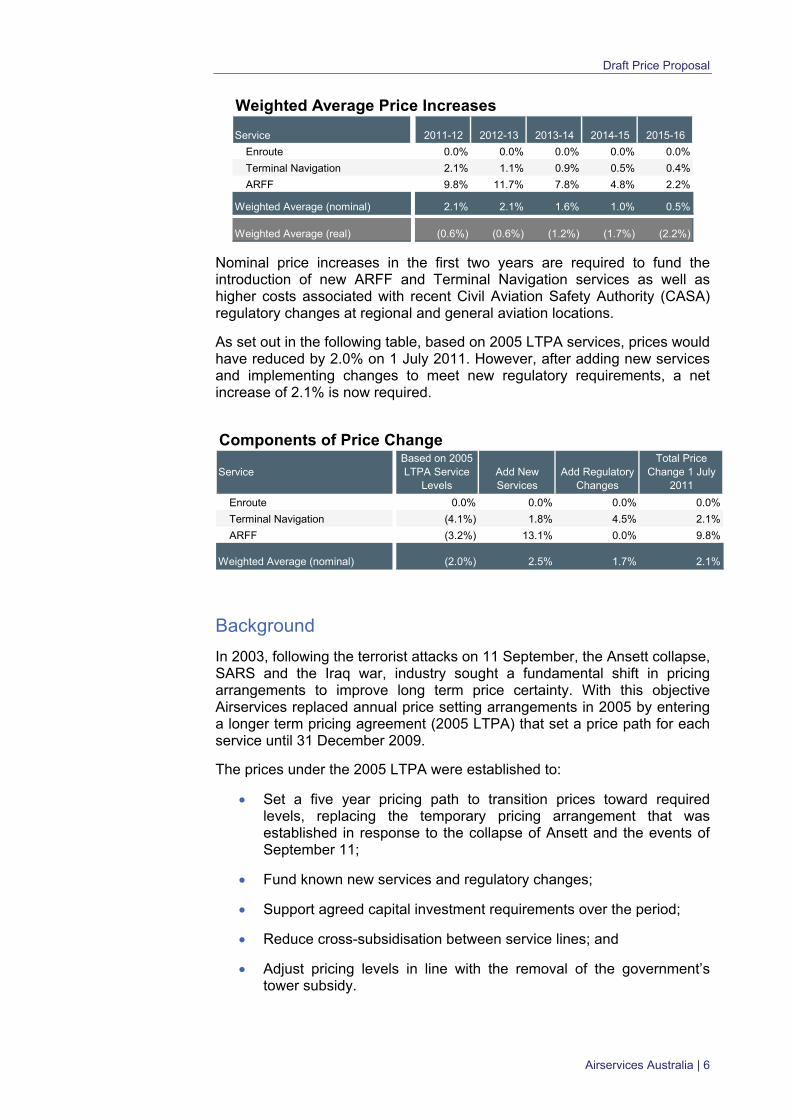
Weighted Average Price Increases
Service 2011-12 2012-13 2013-14 2014-15 2015-16
Enroute 0.0% 0.0% 0.0% 0.0% 0.0%
Terminal Navigation 2.1% 1.1% 0.9% 0.5% 0.4%
ARFF 9.8% 11.7% 7.8% 4.8% 2.2%
Weighted Average (nominal) 2.1% 2.1% 1.6% 1.0% 0.5%
Weighted Average (real) (0.6%) (0.6%) (1.2%) (1.7%) (2.2%)
Nominal price increases in the first two years are required to fund the introduction of new ARFF and Terminal Navigation services as well as higher costs associated with recent Civil Aviation Safety Authority (CASA) regulatory changes at regional and general aviation locations.
As set out in the following table, based on 2005 LTPA services, prices would have reduced by 2.0% on 1 July 2011. However, after adding new services and implementing changes to meet new regulatory requirements, a net increase of 2.1% is now required.
Components of Price Change
ServiceBased on 2005 LTPA Service
LevelsAdd New Services
Add Regulatory Changes
Total Price Change 1 July
2011
Enroute 0.0% 0.0% 0.0% 0.0%
Terminal Navigation (4.1%) 1.8% 4.5% 2.1%
ARFF (3.2%) 13.1% 0.0% 9.8%
Weighted Average (nominal) (2.0%) 2.5% 1.7% 2.1%
Background
In 2003, following the terrorist attacks on 11 September, the Ansett collapse, SARS and the Iraq war, industry sought a fundamental shift in pricing arrangements to improve long term price certainty. With this objective Airservices replaced annual price setting arrangements in 2005 by entering a longer term pricing agreement (2005 LTPA) that set a price path for each service until 31 December 2009.
The prices under the 2005 LTPA were established to:
Set a five year pricing path to transition prices toward required levels, replacing the temporary pricing arrangement that was established in response to the collapse of Ansett and the events of September 11;
Fund known new services and regulatory changes;
Support agreed capital investment requirements over the period;
Reduce cross-subsidisation between service lines; and
Adjust pricing levels in line with the removal of the government’s tower subsidy.
Airservices Australia | 6
Draft Price Proposal
Since the establishment of the 2005 LTPA, Airservices has undertaken extensive consultation with industry on the structure of its prices. This engagement with industry identified that:
the 2005 agreement has been largely successful in providing certainty;
the structure of prices could be improved in terms of the way weight is applied in charging formulas;
there was a need to simplify charging for General Aviation (GA);
the structure of prices needs to retain incentives for efficient investment in new services and facilities; and
a growing capital investment program needed to meet industry priorities and minimise whole of life costs for the existing asset base.
Development of the 2011 LTPA
The 2005 LTPA was originally intended to expire on 31 December 2009, however due to the Global Financial Crisis, the Board of Airservices decided to defer a new set of pricing arrangements until 1 July 2011. This has allowed Airservices to give considerable thought in shaping this proposal and to extensively engage with industry on its prices over the last few years.
2008 Pricing Options Paper
Consultation was undertaken in 2008 and included a comprehensive public and private program of meetings around Australian cities and some overseas locations.
In response to this discussion paper Airservices received 15 formal submissions discussing the structure of price. Most of the responses reflected polarised views on who should fund aviation services and infrastructure reflecting differing views on the relative importance of economic efficiency and the distribution of the charging burden on non-efficiency grounds.
Through this process, the following major pricing issues were identified:
ARFF Prices
The current category based structure was supported by major domestic, regional and smaller operators, but opposed by international airlines. However, given the extensive consultation process undertaken in 2005, there was general acceptance that the existing structure would be likely to continue into future agreements. There had also been support for the proposition that responses to non-airside non-aviation call-outs be charged on a call-out fee basis, with any revenues collected returned to airways customers in an annual rebate at the end of the year.
Airservices Australia | 7
Draft Price Proposal
Enroute Prices
Three structural issues were raised for review: international airlines requested the removal of weight from the charging formula; whether enroute price signals would be improved if there were different prices for different service delivery environments; and how the current basis of charging could be changed to minimise the impact of prices affecting the choice of whether General Aviation (GA) operators choose to fly by instrument flight rules (IFR).
Terminal Navigation Prices
The concerns about Terminal Navigation prices related to the use of weight as the basis of charging and the removal of any residual cross-subsidisation from enroute for regional locations and from major capital city airports to closely located general aviation airports.
General Aviation
Noting that the cost of charging low volume customers (i.e. the bottom 2,000 customers) exceeds the cost of billing and collecting these charges, an alternative arrangement is needed to improve the administrative efficiency of these charges, or to remove charges for these operators.
2009 Price Freeze
In 2009, as the Global Financial Crisis emerged, Airservices decided that rather than pursue a new pricing agreement it would freeze prices to address concerns of severely depressed aviation activity and the significant pressures on airline profitability. At the same time, Airservices was required to make a significant contribution to the defined benefit superannuation fund that supports the retirement incomes of current and past employees. The Board of Airservices has decided not to seek to recover this contribution from users. Similarly, it has decided not to increase its contribution rate in this next pricing round, a cost which is normally passed through as part of Airservices normal labour cost.
This freeze provided time for markets to stabilise and, as is now evident, allowed pessimistic flight activity forecasts at the time to return to a normal growth outlook.
2010 Terminal Navigation Pricing Review
Earlier this year Airservices reviewed its Terminal Navigation prices and received 37 formal responses to its discussion paper. After further discussion and consideration, Airservices has decided upon the following principles for adoption in this pricing proposal:
Location specific costs should be recovered from that location as a key efficiency driver;
Non-location specific support and overhead costs could be recovered on a basis such as total tonnage across all terminal navigation service locations. By recovering non-location specific costs across as wide a base as possible the efficiency loss arising from the need to recover these costs can be minimised. Non-location specific costs are to be taken to mean those costs that are network wide and driven by overall air traffic volumes;
Airservices Australia | 8
Draft Price Proposal
Prices at GA airports in a capital city basin will be capped (the Basin Cap). The shortfall from price capping these services are funded from the major location in the capital city basin in recognition of the fact that the safe and efficient management of traffic at these airports improves the safety and efficiency of the management of traffic at major airports;
Prices at regional locations will be capped (the Regional Cap). The shortfall from price capping these services will be recovered through enroute services where the distortionary impact is likely to be low;
Any location’s price would not exceed either cap (Basin and Regional) and all caps would be increased over time in line with or near normal levels of inflation in the consumer price index;
Where the price for a new terminal navigation service is significantly above the average terminal navigation price, the price will initially recover the forecast incremental operating and annualised capital costs at the location of the service in the first year, then increase the price to a fully allocated basis over the following two years. Any shortfall in the first three years will be recovered through prices in later years;
Activity forecasts for new service locations could be reviewed after 12 months and prices amended for significant variations from original forecasts; and
Administration costs relating to low volume general aviation operators could be minimised through fixed pricing arrangements that reflect broad volumes of usage.
Pricing Consultative Committee (PCC) Meetings
Over this same time period Airservices has maintained regular discussions on pricing through Pricing Consultative Committee (PCC) forums. These meetings have been important in helping to establish and agree pricing frameworks. The PCC comprises representatives from the major domestic and regional carriers, international airlines and associations, and GA operators. The committee played an important role in developing prices for the current LTPA and more recently has discussed the core pricing inputs such as the forward capital works program; weighted average cost of capital; and forecast activity.
Structure of Prices in the 2011 LTPA
The features and structure of this proposal include some important changes to our existing price framework. These changes are the outcome of consultation work noted above and take into account the ACCC criteria for assessing the concerns of industry over different aspects of pricing. Airservices application of the ACCC’s framework and objective criteria for assessing price notifications is set out on page 17.
The proposal also considers the impact of different options and adopts transitional pricing paths where larger increases or more dramatic structural changes would be dislocating for the industry.
Airservices Australia | 9
Draft Price Proposal
The structure for prices in the proposal is as follows:
Terminal Navigation
Terminal Navigation charging is based on the principles derived from the TN Pricing Review as noted on page 7. The proposed pricing structure is largely in line with current arrangements. To limit the impact of any year on year price increase, where applicable, price caps have been applied across all service locations.
Aviation Rescue & Fire Fighting (ARFF)
ARFF category-based charging will continue as is, with the introduction of a combined Category 9/10 price to reflect the entry of the A380 into the fleet.
ARFF domestic response services for attending alarms and incidents in non-aviation and non-aerodrome areas will be charged to the airport on an attending basis, with the revenue this generates rebated to industry. Non-aviation and non-aerodrome areas does not include the aerodrome itself, passengers and freight terminals, hangars, flight kitchens and similar aviation related buildings that access the aerodrome. The precise scope of these will be determined on a case-by-case basis by Airservices and the airport operator as part of wider Memorandum of Understanding (MOU) discussions that are currently under way.
Enroute
Enroute charging will continue broadly as is.
Consideration of options that may provide greater service granularity for enroute by, for example, splitting airspace along functional service lines have been deferred until the next LTPA.
As the conversion of the organisation into these functional service lines is not complete, there are a number of issues that significantly impact the attribution of costs among these service lines and consequently any related charging arrangement. These are likely to be resolved as the service lines and supporting infrastructure are transitioned to the new environment.
In addition, the planning for the next generation of new ATC system that will be implemented shortly after this pricing period may require further changes to this operating model and these changes are likely to commence within the pricing period.
General Parameters
Charging will be based on Maximum Take-off Weight (MTOW) and capped at 500 tonnes as a maximum charging point.
Average MTOW’s will be applied to aircraft types greater than 15.1 tonnes in weight (e.g. as set out in Appendix 2, all Boeing 737-800 will be charged at an average MTOW weight of 77.8 tonnes). This will simplify the currently complex identification of MTOW based on individual airframe and engine configurations.
General aviation pricing will also be simplified with charges only being applied once a $500 threshold has been passed. Further details are provided on page 28.
Airservices Australia | 10
Draft Price Proposal
Service costs have been calculated using standard unit costs to ensure that the price of services does not vary from place to place as a result of non-traffic related factors such as the relative age of the workforce or infrastructure.
Price increases over time have been capped at or near normal levels of inflation.
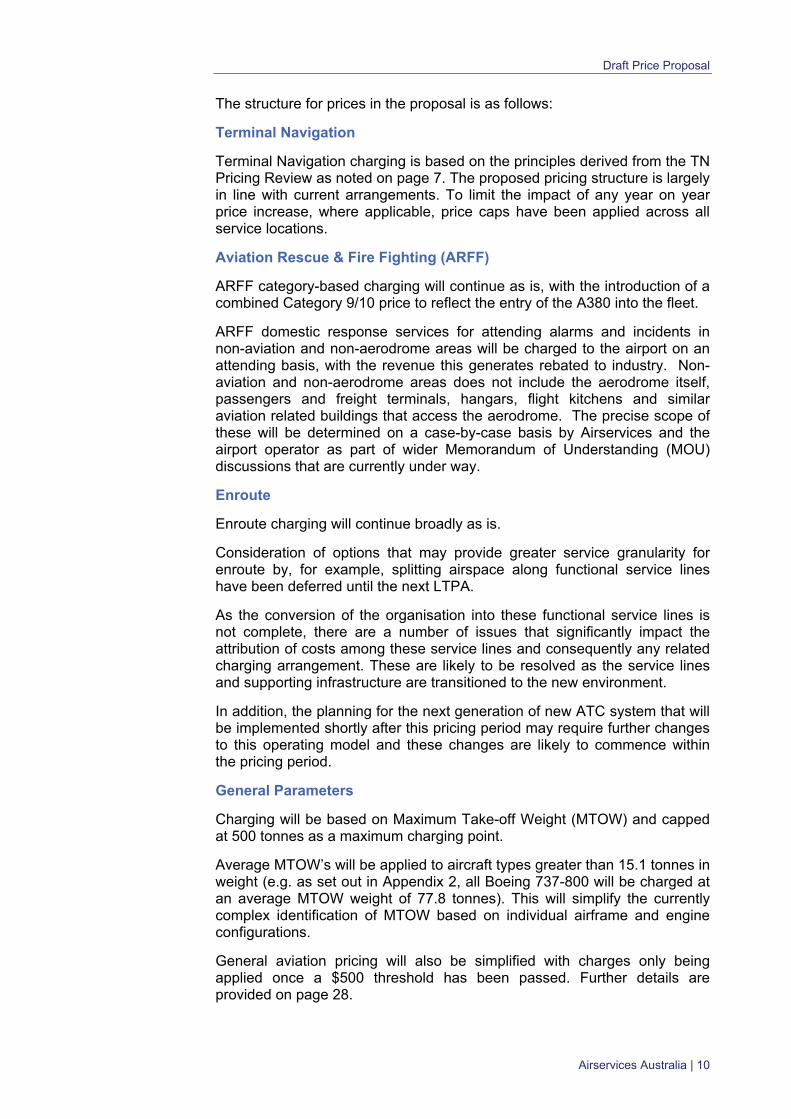
A summary of proposed changes is contained in the table below. Service Current Charges Proposed Charges
As per current charging arrangements
Enroute Services
Levied on IFR flights only Based on aircraft weight (MTOW)
and distance flown
Weight capping for large aircraft Average MTOW of aircraft if
>15.1t
As per current charging arrangements
Terminal Navigation Services
Levied on IFR and VFR full stop landings and practice instrument approaches
Based on aircraft weight (MTOW) Capital city basin pricing Price capping at GA and regional
locations Weight capping for large aircraft Average MTOW of aircraft if
>15t.1 Price capping across ALL
locations
As per current charging arrangements
Aviation Rescue & Fire Fighting Services
Applies to aircraft with MTOW >15.1t, or “target” aircraft with MTOW between 5.7t and 15.1t
Levied on full stop landings and practice instrument approaches
Based on aircraft weight (MTOW) and aircraft ARFF category
Weight capping for large aircraft Average MTOW of aircraft if
>15.1t Call-out charge for non-aviation
false alarms
General Aviation
Charges under standard contract or light aircraft option (LAO)
Cessation of LAO Simplification of charging Free access for low volume
general aviation users Fixed price option available
Risk Sharing
Risk sharing arrangements have been an important feature of the current long term pricing agreement. Stronger than predicted levels of growth will see Airservices return on average, $18 million to customers each year by the time new prices are established in mid 2011. Whilst a long term pricing agreement provides price certainty, risk sharing has been important in mitigating some of the risk inherent in accurately estimating costs and flight activity volumes over longer periods.
In accordance with the current agreement it is proposed that risk continue to be shared. This will occur across three pricing elements as follows:
Airservices Australia | 11
Draft Price Proposal
Flight Activity Volumes
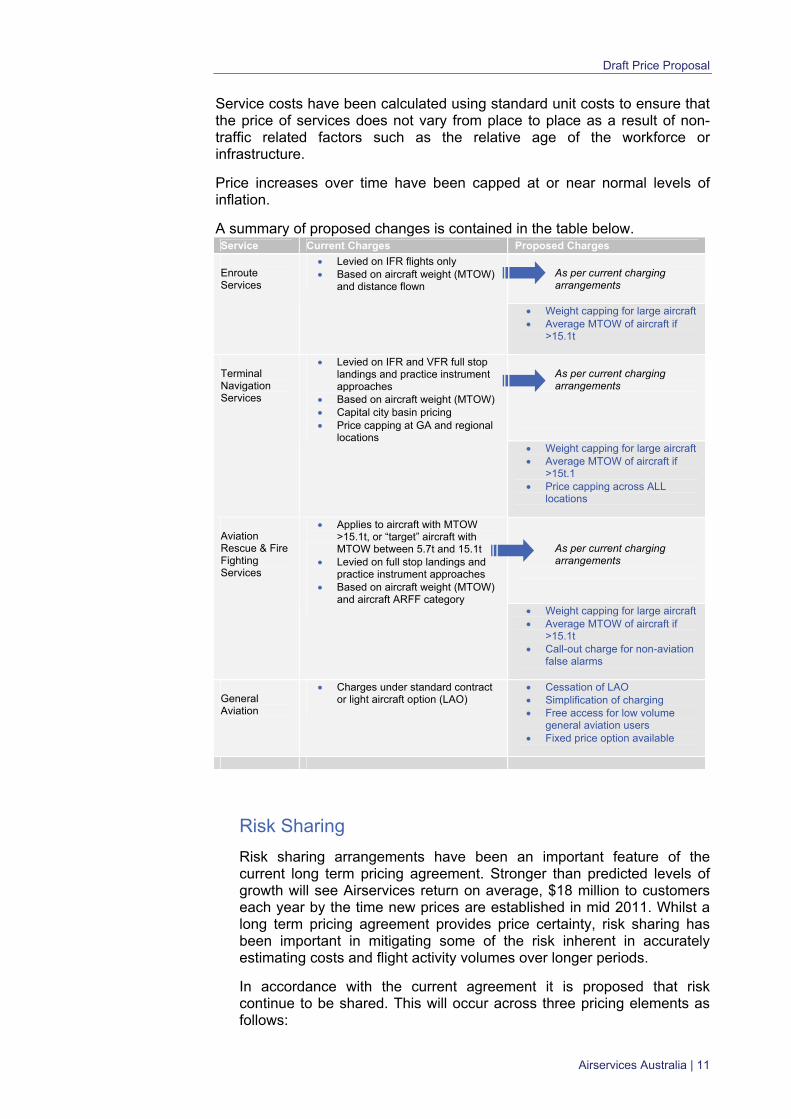
The flight activity volumes that underpin the recovery of service costs under this proposal have been projected to grow at three to five percent per annum. Where flight volumes grow at a rate significantly different to this there is a risk of excessive over or under recoveries. To mitigate this risk, it is proposed that surpluses and deficits greater or less than five per cent of the proposed revenues will trigger a risk sharing event.
Revenues ($mil) 2012 2013 2014 2015 2016
- 5% risk threshold 833 876 925 974 1,014
Revenue 877 922 973 1,025 1,068
+ 5% risk threshold 921 968 1,022 1,077 1,121
Note: revenue targets and thresholds for risk sharing are subject to adjustment, pending the outcome of the final ACCC pricing decision.
Airservices noted the ACCC request to review options to improve the sharing of activity volume risk at individual airports. Consultation on this issue was held through one-on-one meetings, the Pricing Consultative Committee meetings and the 2008 discussion paper.
These discussions identified that while there was support for adjusting for high growth, there was no support for increasing prices if the activity fell significantly below forecast. This position was noted under both a general industry wide agreement or, as an alternative, under a bilateral agreement with an individual airport. As a consequence, no viable alternative to the existing arrangement has been identified.
Capital Expenditure
As well as recovering operating costs, charges help fund capital investment. With this there is an undertaking that funding levels for capital investment will be utilised appropriately. To manage this undertaking, risk sharing also covers capital investment levels.
In accordance with the current price agreement, a risk sharing event will be triggered where shortfalls in capital expenditure are either less than 50 per cent of agreed expenditure in a single year, or less than 25 per cent of agreed expenditure on a cumulative basis.
Capital Expenditure ($mil) 2012 2013 2014 2015 2016
Annual CAPEX Plan 228 188 165 213 206
50% Annual risk threshold 114 94 83 106 103
Cum CAPEX Plan 228 416 581 794 1,000
25% Cum risk threshold n/a 312 436 596 750
Note: capital expenditure targets and thresholds for risk sharing are subject to adjustment, pending the outcome of the final ACCC pricing decision.
Regulatory Change
To promote service productivity and efficiency there is no risk sharing to mitigate risks associated with changes in operating costs under the LTPA. However, where changes in costs are associated with regulatory change, and outside Airservices control, the LTPA provides that risk will be shared.
Airservices Australia | 12
Draft Price Proposal
Under the current agreement costs incorporated into the ARFF charge for forecast regulatory changes were subject to this risk sharing provision. Where these regulatory changes did not eventuate and costs were not incurred, funds were returned to industry.
Under this pricing proposal costs have been included for regulatory change, relating to two new ARFF service locations and category 10 service upgrades at ARFF Perth. Costs have also been included for proposed ATC tower service upgrades at 11 regional ports. As with the current LTPA where projected regulatory changes do not occur or are delayed, cost savings will be returned to industry through annual risk sharing rebate arrangements.
New Services
Any new services that arise which have not been included in this proposal will have a three month grace period, from the services commencement date before charging begins.
Prices for new services will then be reviewed after 12 months to determine whether there has been a significant change in flight activity volumes. If activity levels have varied by more than five per cent from the initial forecast, then after adjusting for demonstrated demand driven cost changes, prices will be varied accordingly.
Services Charter
Measuring and Monitoring Performance
Airservices has been developing a Services Charter over the last 18 months to improve the measurement and monitoring of its performance.
In determining how its services are provided, Airservices is guided by International Civil Aviation Organisation’s (ICAO) key result areas: safety, access and equity, capacity, cost-effectiveness, efficiency, environment, flexibility, global interoperability, participation, predictability and security.
Through its Services Charter, Airservices is seeking to engage stakeholders in a common understanding and agreement of current and future service delivery requirements. To this end, the Charter was developed through consultation with key stakeholders in the Pricing Consultative Committee, including a number of operational performance workshops.
The Charter also aligns with Airservices Just Culture where the information is being provided openly and honestly to the aviation industry with the objective of improving service performance for the industry as a whole.
It sets out a Schedule of Services and Facilities, provides a Quality of Service Framework, establishes Performance Measurement metrics and identifies how Airservices will be reporting performance outcomes.
It was implemented on 1 July 2010 as a work in progress and will be reviewed annually as more data becomes available and there is a better
Airservices Australia | 13

Draft Price Proposal
understanding of the connection between performance measures and actual service quality.
Further details on Charter performance measurement metrics is provided at Appendix 3. A copy of the Services Charter is also available on Airservices website, www.airservicesaustralia.com.
Airservices Australia | 14
Draft Price Proposal
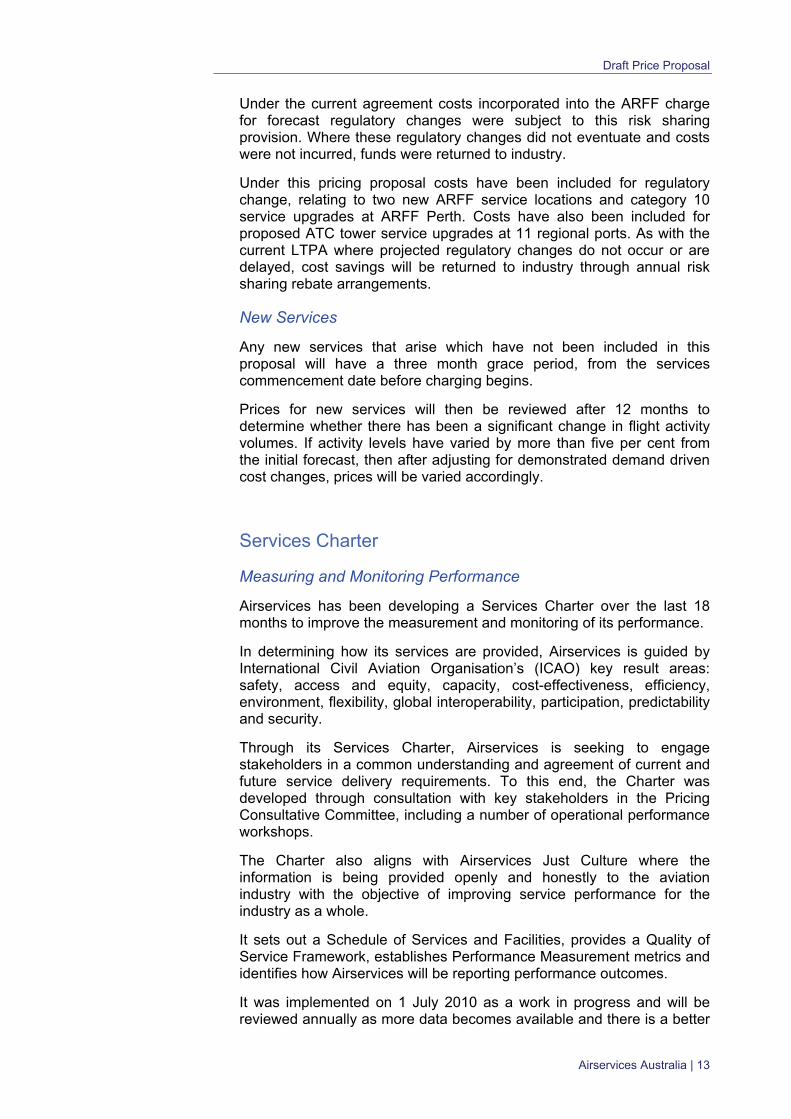
Proposed Prices
CurrentService Price(inc GST) 2011-12 2012-13 2013-14 2014-15 2015-16
Enroute$4.18 20 tonnes or more $4.18 $4.18 $4.18 $4.18 $4.18
$0.93 Up to 20 tonnes $0.93 $0.93 $0.93 $0.93 $0.93
CurrentService Price(inc GST) 2011-12 2012-13 2013-14 2014-15 2015-16
Terminal Navigation$11.43 Adelaide $11.66 $11.83 $11.95 $12.07 $12.07
$5.83 Brisbane $6.15 $6.21 $6.27 $6.34 $6.34
$10.95 Cairns $11.55 $11.96 $12.38 $12.81 $13.26
$12.66 Canberra $12.53 $12.41 $12.28 $12.16 $12.16
$10.82 Gold Coast $10.28 $10.07 $9.92 $9.82 $9.72
$5.06 Melbourne $5.34 $5.53 $5.66 $5.66 $5.66
$8.63 Perth $8.20 $8.03 $7.91 $7.83 $7.76
$5.57 Sydney $5.60 $5.62 $5.64 $5.66 $5.68
$12.69 Albury $13.39 $13.86 $14.34 $14.84 $15.36
$12.69 Alice springs $13.39 $13.86 $14.34 $14.84 $15.36
$5.49 Avalon $4.70 $4.86 $5.03 $5.21 $5.39
$12.69 Broome $13.39 $13.86 $14.34 $14.84 $15.36
$12.69 Coffs Harbour $13.39 $13.86 $14.34 $14.84 $15.36
$9.20 Hamilton Island $9.71 $10.05 $10.40 $10.76 $11.14
$9.54 Hobart $10.06 $10.42 $10.78 $11.16 $11.55
$12.69 Karratha $13.39 $13.86 $14.34 $14.84 $15.36
$12.22 Launceston $12.89 $13.34 $13.81 $14.29 $14.79
$12.69 Mackay $12.56 $12.44 $12.44 $12.44 $12.44
$12.69 Rockhampton $13.39 $13.86 $13.86 $13.86 $13.86
$12.69 Sunshine Coast $13.39 $13.86 $14.34 $14.84 $15.36
$12.69 Tamworth $13.39 $13.86 $14.34 $14.84 $15.36
$12.69 Archerfield $13.39 $13.86 $14.34 $14.84 $15.36
$12.69 Bankstown $13.39 $13.86 $14.34 $14.84 $15.36
$12.69 Camden $13.39 $13.86 $14.34 $14.84 $15.36
$12.69 Essendon $13.39 $13.86 $14.34 $14.84 $15.36
$12.69 Jandakot $13.39 $13.86 $14.34 $14.84 $15.36
$12.69 Moorabbin $13.39 $13.86 $14.34 $14.84 $15.36
$12.69 Parafield $13.39 $13.86 $14.34 $14.84 $15.36
$2.26 Darwin $2.15 $2.11 $2.07 $2.05 $2.03
$2.94 Townsville $2.79 $2.74 $2.69 $2.67 $2.64
Charging Formula for Enroute Services:
For IFR aircraft with an MTOW of 20 tonnes or more: MTOWedistanc
price 100
For IFR aircraft with an MTOW up to 20 tonnes: MTOW100
distanceprice
Charging Formula for Terminal Navigation Services:
For all aircraft: MTOWpriceLocation
Airservices Australia | 15
Draft Price Proposal
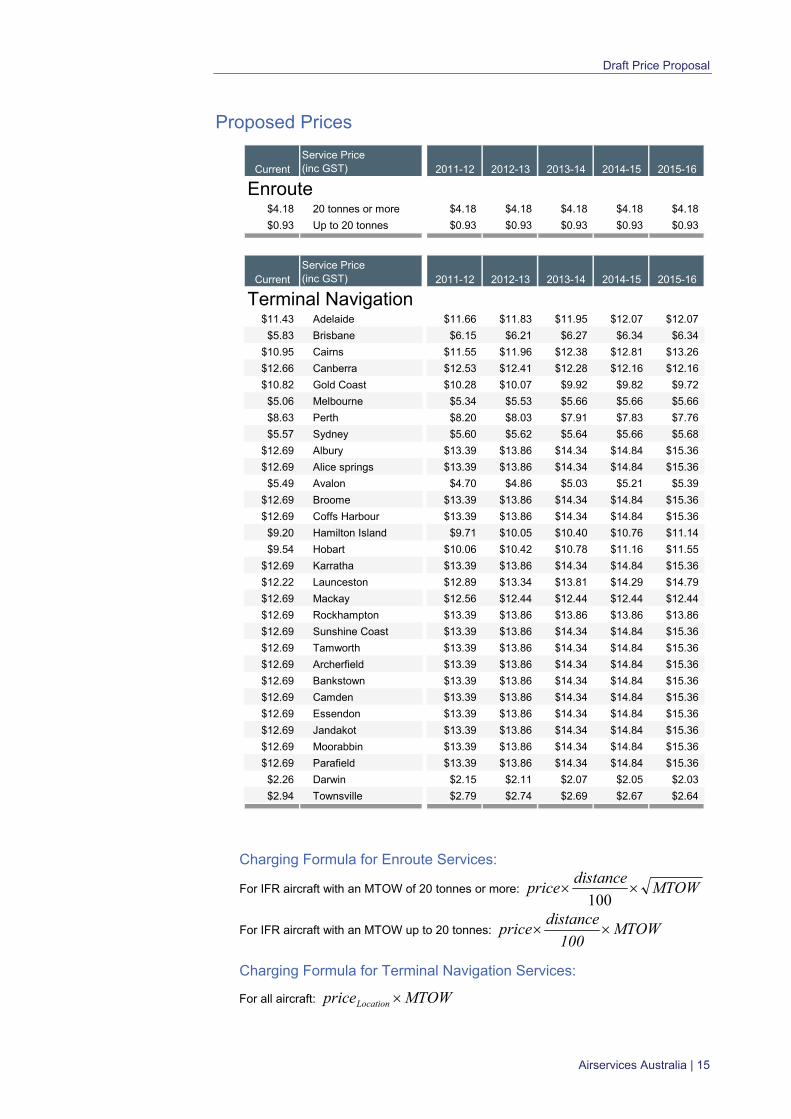
CurrentService Price(inc GST) 2011-12 2012-13 2013-14 2014-15 2015-16
Aviation Rescue & Fire FightingCategory 6 Aircraft & below
$1.81 Brisbane $1.99 $2.19 $2.30 $2.41 $2.45
$1.81 Melbourne $1.99 $2.19 $2.30 $2.41 $2.45
$1.81 Sydney $1.99 $2.19 $2.30 $2.41 $2.45
$1.81 Perth $1.99 $2.19 $2.30 $2.41 $2.45
$1.81 Adelaide $1.99 $2.19 $2.30 $2.41 $2.45
$1.81 Cairns $1.99 $2.19 $2.30 $2.41 $2.45
$1.81 Darwin $1.99 $2.19 $2.30 $2.41 $2.45
$1.81 Gold Coast $1.99 $2.19 $2.30 $2.41 $2.45
$1.81 Canberra $1.99 $2.19 $2.30 $2.41 $2.45
$1.81 Hobart $1.99 $2.19 $2.30 $2.41 $2.45
$1.81 Karratha $1.99 $2.19 $2.30 $2.41 $2.45
$1.81 Townsville $1.99 $2.19 $2.30 $2.41 $2.45
$1.81 Alice Springs $1.99 $2.19 $2.30 $2.41 $2.45
$1.81 Avalon $1.99 $2.19 $2.30 $2.41 $2.45
$1.81 Ayers Rock $1.99 $2.19 $2.30 $2.41 $2.45
$1.81 Broome $1.99 $2.19 $2.30 $2.41 $2.45
$1.81 Hamilton Island $1.99 $2.19 $2.30 $2.41 $2.45
$1.81 Launceston $1.99 $2.19 $2.30 $2.41 $2.45
$1.81 Mackay $1.99 $2.19 $2.30 $2.41 $2.45
$1.81 Rockhampton $1.99 $2.19 $2.30 $2.41 $2.45
$1.81 Sunshine Coast $1.99 $2.19 $2.30 $2.41 $2.45
Category 7 Aircraft$1.93 Brisbane $2.22 $2.55 $2.81 $2.81 $2.81
$1.89 Melbourne $2.17 $2.50 $2.75 $2.75 $2.75
$1.86 Sydney $2.14 $2.46 $2.71 $2.71 $2.71
$2.01 Perth $2.31 $2.66 $2.92 $2.92 $2.92
$2.33 Adelaide $2.68 $2.95 $3.09 $3.25 $3.25
$2.29 Cairns $2.63 $3.03 $3.18 $3.34 $3.51
$3.39 Darwin $3.90 $4.48 $4.93 $5.18 $5.44
$4.01 Gold Coast $4.21 $4.21 $4.21 $4.21 $4.21
$7.91 Canberra $8.31 $8.47 $8.47 $8.47 $8.47
$6.73 Hobart $7.74 $8.13 $8.53 $8.53 $8.53
$7.40 Karratha $7.40 $7.40 $7.40 $7.40 $7.40
$8.47 Townsville $9.74 $11.20 $12.32 $12.94 $13.58
Category 8 Aircraft$2.62 Brisbane $3.01 $3.46 $3.81 $3.81 $3.81
$2.29 Melbourne $2.63 $3.03 $3.33 $3.33 $3.33
$2.08 Sydney $2.39 $2.75 $3.03 $3.03 $3.03
$3.01 Perth $3.46 $3.98 $4.38 $4.38 $4.38
$9.12 Adelaide $7.75 $6.98 $6.63 $6.30 $5.98
$4.76 Cairns $5.47 $6.30 $6.92 $7.62 $8.00
$16.06 Darwin $18.47 $19.39 $20.36 $20.36 $20.36
$4.01 Gold Coast $4.61 $5.30 $5.83 $6.42 $6.74
Category 9 & 10 Aircraft$3.70 Brisbane $4.26 $4.89 $5.38 $5.92 $6.22
$3.03 Melbourne $3.48 $4.01 $4.41 $4.85 $5.09
$2.45 Sydney $2.82 $3.24 $3.56 $3.92 $4.12
$5.08 Perth $5.84 $6.72 $7.39 $8.13 $8.54
ARFF Call-out charges are set out on page 29.
Charging Formula for ARFF Services:
For all aircraft >15.1 tonnes and target aircraft between 5.7 and 15.1 tonnes
MTOWprice LocationCategory
Airservices Australia | 16
Draft Price Proposal
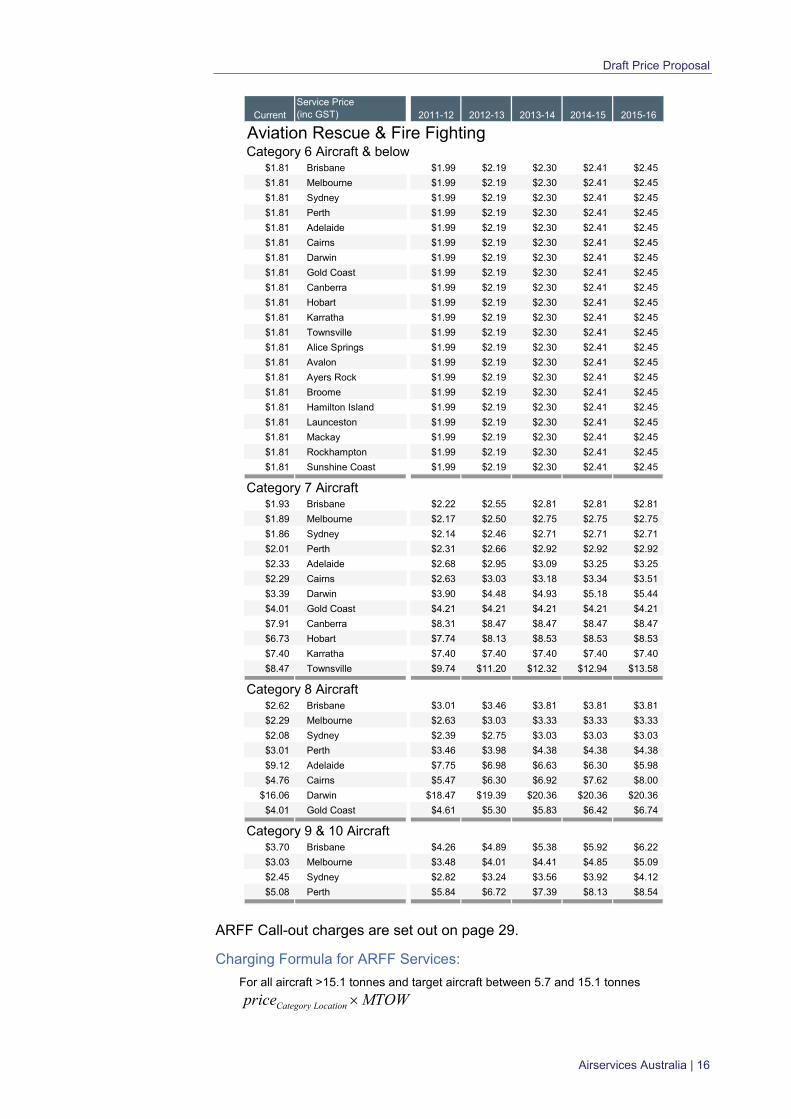
IMPLEMENTATION & CONSULTATION
Implementation Timeline
The proposed implementation date for the new pricing agreement is 1 July 2011.
Over the next seven months, there are a number of consultation and review points that will be undertaken by both Airservices and the ACCC. The final dates for these review points will be dependent on the outcomes of Airservices consultation and the ACCC’s assessment of the relevant issues. As a guide the schedule below sets out the indicative timelines which will be progressively updated through the review process.
Pricing Development Process – Indicative Timeline Date Process
24 Jan 11 Consultation on Draft Pricing Proposal concludes
04 Feb 11 Airservices submits a Draft Price Notification to the ACCC
Early Feb 11 ACCC releases its Issues Paper outlining relevant issues and seeking comment
Late Mar 11 ACCC Consultation Finalised
Late Apr 11 The ACCC publishes its Preliminary View on the Draft Price Notification
Mid May 11 Interested parties submit responses to the ACCC's Preliminary View
31 May 11 Airservices submits its Formal Price Notification
Early Jun 11 The ACCC makes its Final Decision
01 Jul 11 New prices commence
Public Meeting Program
Airservices will be undertaking a public meeting program for interested stakeholders in January 2011 at the locations listed in the table below. The specific dates, times and locations will be published on Airservices website on the 14th of December 2010.
Location Location
Adelaide Perth
Brisbane Rockhampton
Cairns Sydney
Hobart Tamworth
Melbourne
Website
Information relating to previous discussion papers and reviews, including industry responses can be found on our website at:
http://www.airservicesaustralia.com/pricingproposal/
Airservices Australia | 17
Draft Price Proposal
PRICING PRINCIPLES
Principles for Determining Prices
Price setting by Airservices is subject to review by the Australian Competition and Consumer Commission (ACCC).
The ACCC assesses prices based on principles of economic efficiency. This takes into consideration:
productive efficiency, which occurs when firms produce goods or services at least cost;
allocative efficiency, which occurs when resources are used in areas where they provide the greatest value to society as a whole; and
dynamic efficiency, which occurs when firms have appropriate incentives to invest, innovate and improve quality or reduce costs over time.
For Airservices the price setting challenge is to provide economically efficient prices that enable the cost of air navigation and ARFF services to be recovered, while minimising undesirable distortions to airport usage. The ACCC has similarly acknowledged Airservices “need to achieve cost recovery while minimising the attendant distortion to allocative efficiency.”
Using these parameters and considering discussions with customers and stakeholders Airservices applies the following criteria in determining prices:
Prices should encourage economically efficient resource allocation and, as such, should have a strong relationship to the cost and investment decisions in providing services;
Prices should be equitable; and
Prices should be simple and transparent and facilitate planning by end users.
ACCC Building Block Overview
The ACCC assesses Airservices price notifications using a cost-based ‘building block’ approach1, with a specific focus on the efficiency of the cost base and the reasonableness of the rate of return being sought.
The ‘building block model’ is then based on the amount of revenue required to cover the costs of an efficient service. Under this model ‘allowable revenue’ is the sum of return on capital (assets), depreciation of assets, operating expenditure and an allowance for tax.
1 See ACCC Statement of regulatory approach to assessing price notifications June 2009 for more details: http://www.accc.gov.au/content/index.phtml/itemId/700599
Airservices Australia | 18
Draft Price Proposal
From this allowable revenue, individual prices for services are determined using cost attribution, activity forecasts and transitional pricing paths.
Where revenues are derived from other sources, a dual-till approach is adopted and the ACCC considers whether common costs have been appropriately allocated to these sources and excluded from the building block model.
In relation to the structure of relative prices for individual services, the ACCC considers it will generally be appropriate to set these prices to broadly reflect their relative costs as a means of encouraging efficient resource allocation decisions.
In assessing these costs, the ACCC also considers it important that fixed and common costs are allocated in a reasonable and transparent manner, and takes into account demand sensitivities associated with the services provided.
This methodology is applied by the ACCC as part of its regulatory decision making across a number of industries, including pricing for airports, postal services and energy utilities.
Pricing Period
Prices under this proposal will be set for the five year period 1 July 2011 to 30 June 2016. This is consistent with the ACCC’s previously stated preference for longer term pricing arrangements to provide the industry with price certainty over a reasonable period of time.
Where the previous pricing agreement started and ended on a calendar year basis the new agreement will be aligned to financial years beginning in July and ending in June.
Estimated Allowable Revenues
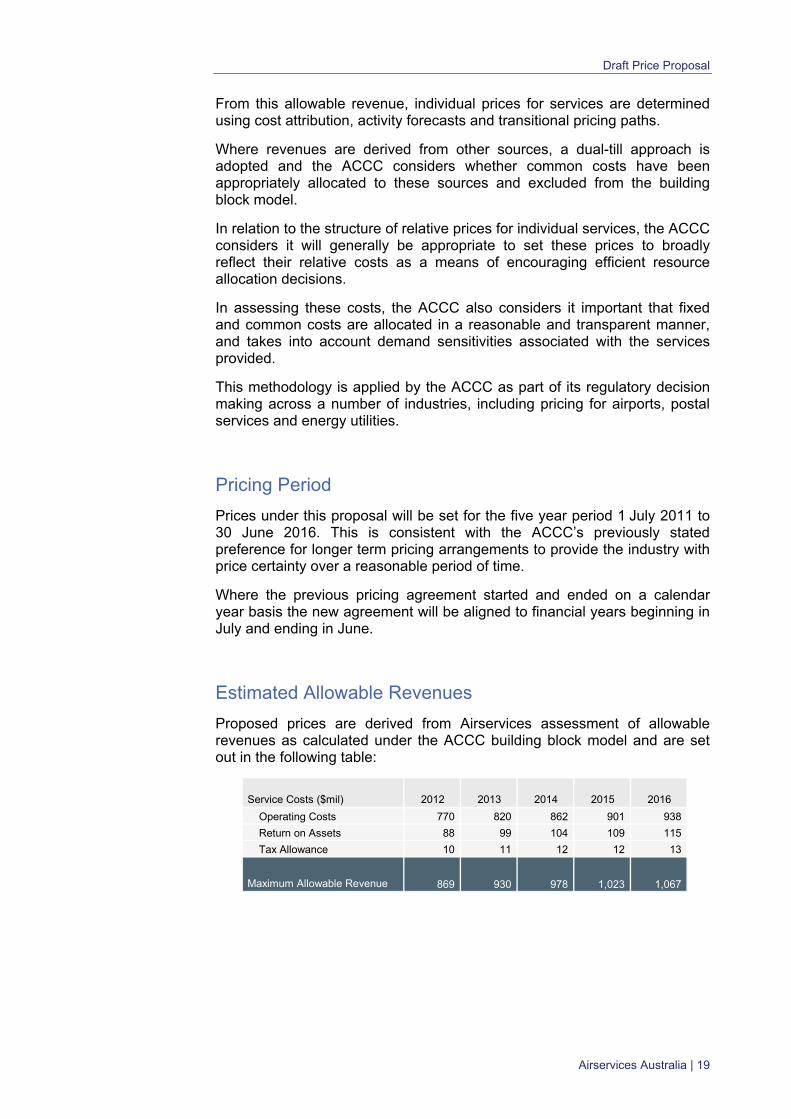
Proposed prices are derived from Airservices assessment of allowable revenues as calculated under the ACCC building block model and are set out in the following table:
Service Costs ($mil) 2012 2013 2014 2015 2016
Operating Costs 770 820 862 901 938
Return on Assets 88 99 104 109 115
Tax Allowance 10 11 12 12 13
Maximum Allowable Revenue 869 930 978 1,023 1,067
Airservices Australia | 19
Draft Price Proposal
Operating Costs
Forecast operating costs have been estimated to reflect the required terminal navigation, enroute and ARFF services over the next five years.
To calculate these costs Airservices maintains dual-till accounting processes, segregating the regulated service costs from costs and risks associated with commercial activities that are not declared under the Trade Practices Act. All costs have been separated out on the basis of their fully allocated cost.
The five year cost projections have been based on Airservices 2010 – 2015 Corporate Plan with additional projections incorporated to estimate costs for 2016.
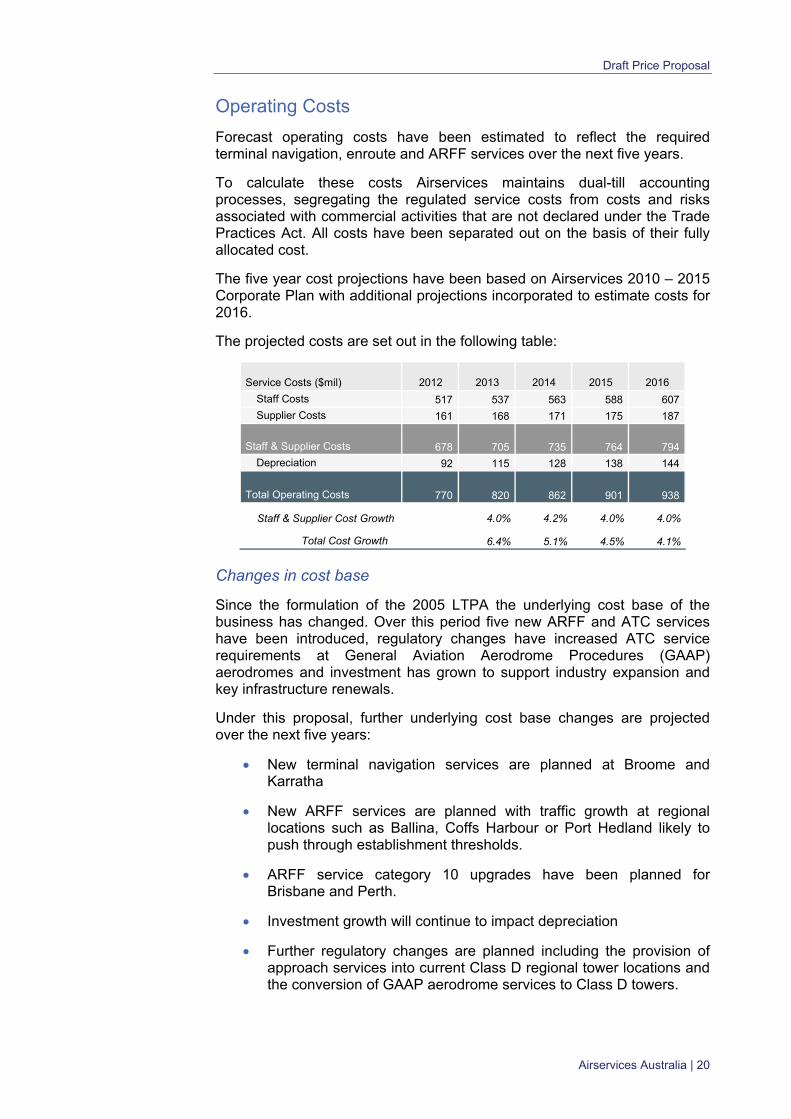
The projected costs are set out in the following table:
Service Costs ($mil) 2012 2013 2014 2015 2016
Staff Costs 517 537 563 588 607
Supplier Costs 161 168 171 175 187
Staff & Supplier Costs 678 705 735 764 794
Depreciation 92 115 128 138 144
Total Operating Costs 770 820 862 901 938
Staff & Supplier Cost Growth 4.0% 4.2% 4.0% 4.0%
Total Cost Growth 6.4% 5.1% 4.5% 4.1%
Changes in cost base
Since the formulation of the 2005 LTPA the underlying cost base of the business has changed. Over this period five new ARFF and ATC services have been introduced, regulatory changes have increased ATC service requirements at General Aviation Aerodrome Procedures (GAAP) aerodromes and investment has grown to support industry expansion and key infrastructure renewals.
Under this proposal, further underlying cost base changes are projected over the next five years:
New terminal navigation services are planned at Broome and Karratha
New ARFF services are planned with traffic growth at regional locations such as Ballina, Coffs Harbour or Port Hedland likely to push through establishment thresholds.
ARFF service category 10 upgrades have been planned for Brisbane and Perth.
Investment growth will continue to impact depreciation
Further regulatory changes are planned including the provision of approach services into current Class D regional tower locations and the conversion of GAAP aerodrome services to Class D towers.
Airservices Australia | 20
Draft Price Proposal
Efficiency
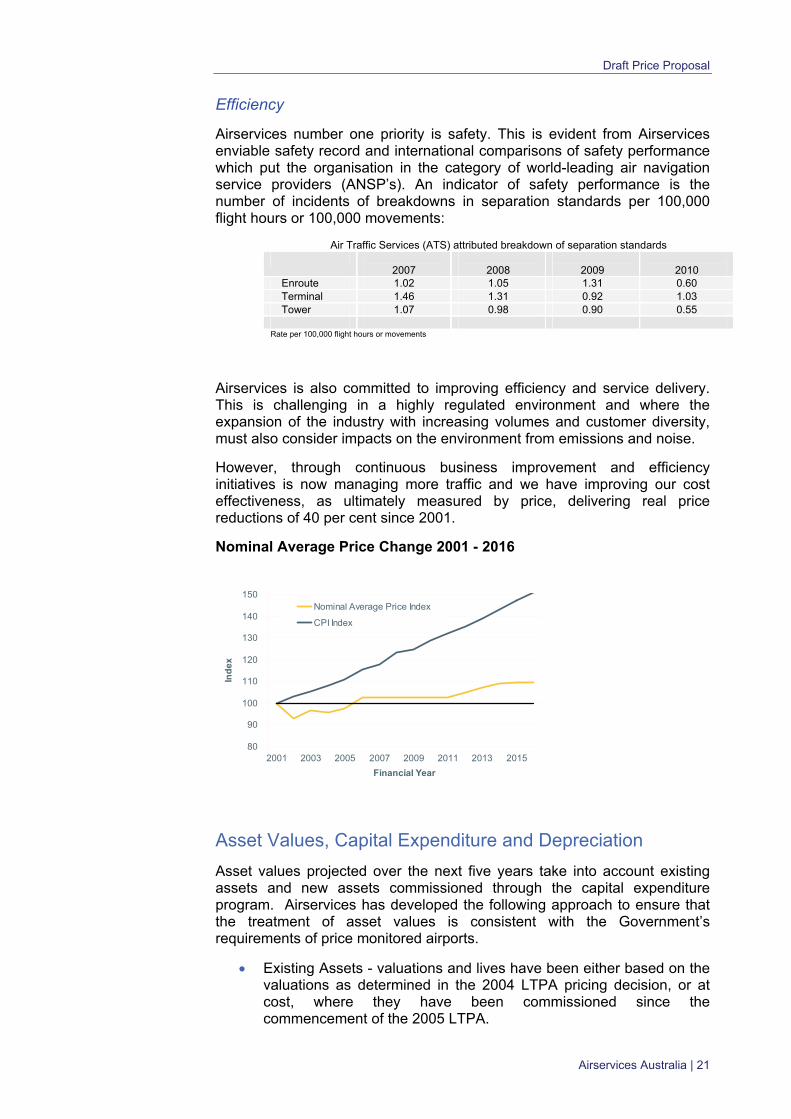
Airservices number one priority is safety. This is evident from Airservices enviable safety record and international comparisons of safety performance which put the organisation in the category of world-leading air navigation service providers (ANSP’s). An indicator of safety performance is the number of incidents of breakdowns in separation standards per 100,000 flight hours or 100,000 movements:
Air Traffic Services (ATS) attributed breakdown of separation standards
2007
2008
2009
2010
Enroute 1.02 1.05 1.31 0.60 Terminal 1.46 1.31 0.92 1.03 Tower 1.07 0.98 0.90 0.55
Rate per 100,000 flight hours or movements
Airservices is also committed to improving efficiency and service delivery. This is challenging in a highly regulated environment and where the expansion of the industry with increasing volumes and customer diversity, must also consider impacts on the environment from emissions and noise.
However, through continuous business improvement and efficiency initiatives is now managing more traffic and we have improving our cost effectiveness, as ultimately measured by price, delivering real price reductions of 40 per cent since 2001.
Nominal Average Price Change 2001 - 2016
80
90
100
110
120
130
140
150
2001 2003 2005 2007 2009 2011 2013 2015
Financial Year
Ind
ex
Nominal Average Price Index
CPI Index
Asset Values, Capital Expenditure and Depreciation
Asset values projected over the next five years take into account existing assets and new assets commissioned through the capital expenditure program. Airservices has developed the following approach to ensure that the treatment of asset values is consistent with the Government’s requirements of price monitored airports.
Existing Assets - valuations and lives have been either based on the valuations as determined in the 2004 LTPA pricing decision, or at cost, where they have been commissioned since the commencement of the 2005 LTPA.
Airservices Australia | 21
Draft Price Proposal
This discounts any asset revaluations that have been recognised as part of normal statutory financial reporting as a result of indexation or re-lifing.
New Assets - include upgrades, replacements, and new technology, as included in the capital expenditure program to 2015-16. New asset values take into account the timing and amount of investment and expected commissioning dates.
Depreciation is based on the estimated useful life of existing and new assets acquired through the capital expenditure program.
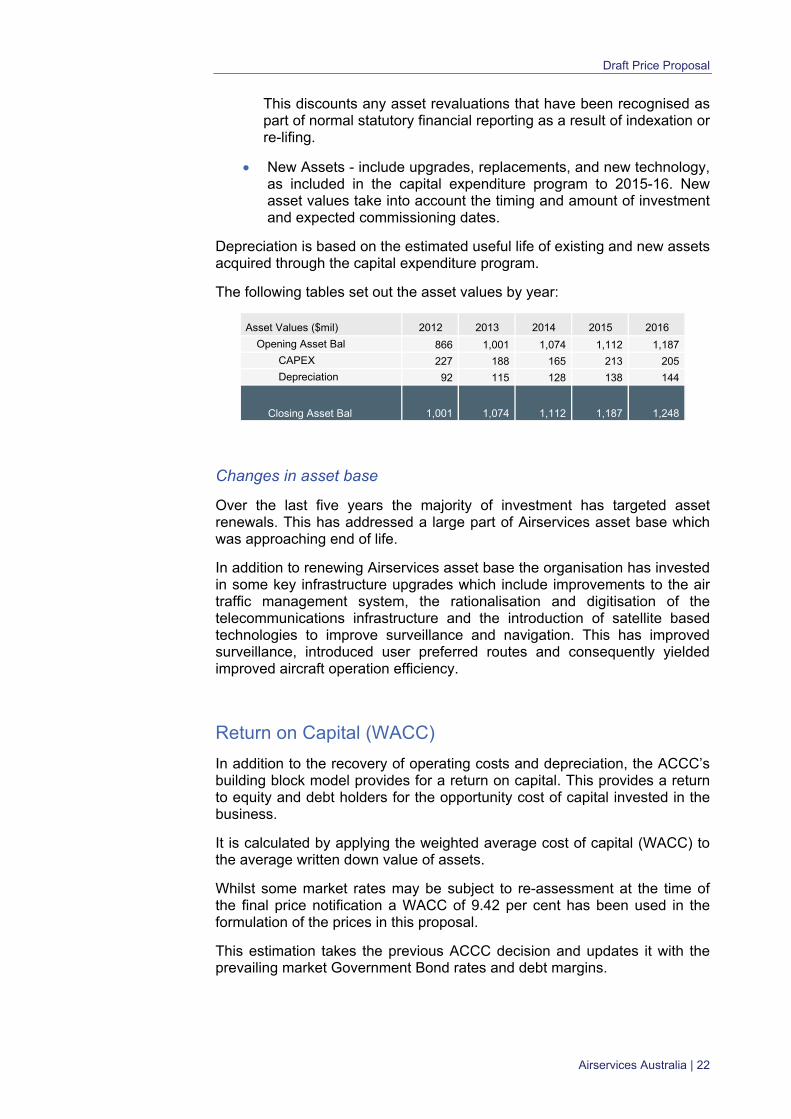
The following tables set out the asset values by year:
Asset Values ($mil) 2012 2013 2014 2015 2016
Opening Asset Bal 866 1,001 1,074 1,112 1,187
CAPEX 227 188 165 213 205
Depreciation 92 115 128 138 144
Closing Asset Bal 1,001 1,074 1,112 1,187 1,248
Changes in asset base
Over the last five years the majority of investment has targeted asset renewals. This has addressed a large part of Airservices asset base which was approaching end of life.
In addition to renewing Airservices asset base the organisation has invested in some key infrastructure upgrades which include improvements to the air traffic management system, the rationalisation and digitisation of the telecommunications infrastructure and the introduction of satellite based technologies to improve surveillance and navigation. This has improved surveillance, introduced user preferred routes and consequently yielded improved aircraft operation efficiency.
Return on Capital (WACC)
In addition to the recovery of operating costs and depreciation, the ACCC’s building block model provides for a return on capital. This provides a return to equity and debt holders for the opportunity cost of capital invested in the business.
It is calculated by applying the weighted average cost of capital (WACC) to the average written down value of assets.
Whilst some market rates may be subject to re-assessment at the time of the final price notification a WACC of 9.42 per cent has been used in the formulation of the prices in this proposal.
This estimation takes the previous ACCC decision and updates it with the prevailing market Government Bond rates and debt margins.
Airservices Australia | 22
Draft Price Proposal
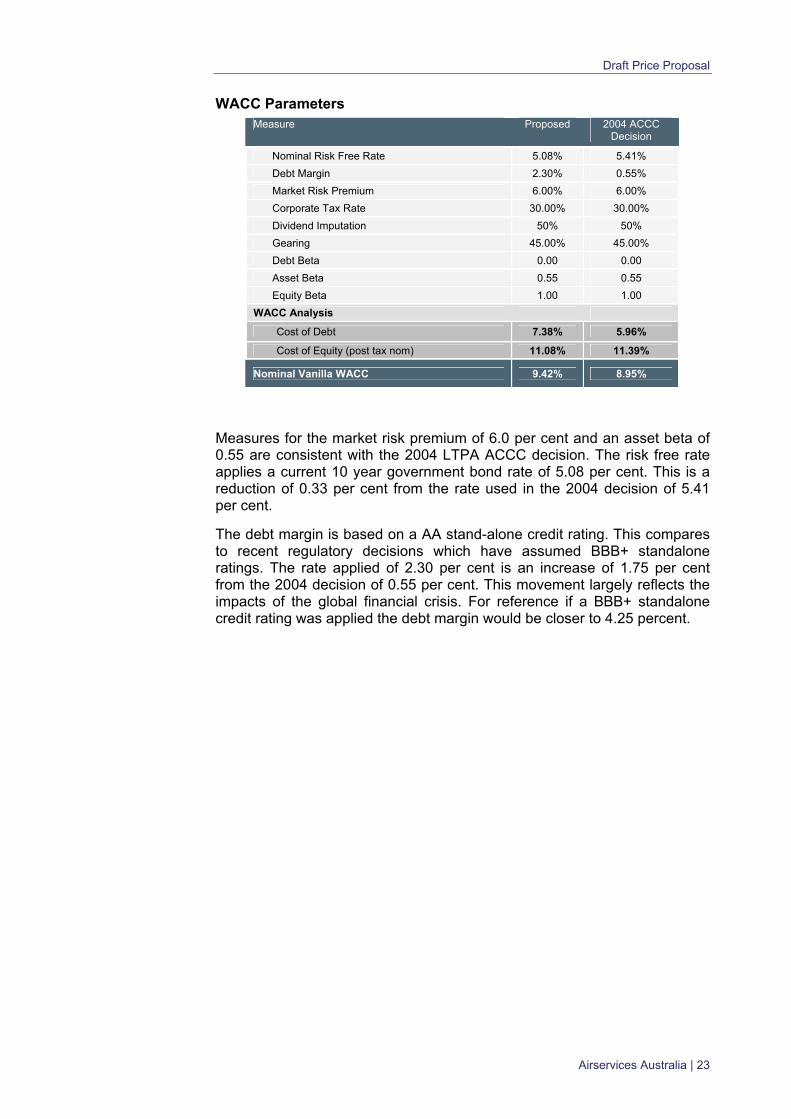
WACC Parameters Measure Proposed 2004 ACCC
Decision
Nominal Risk Free Rate 5.08% 5.41%
Debt Margin 2.30% 0.55%
Market Risk Premium 6.00% 6.00%
Corporate Tax Rate 30.00% 30.00%
Dividend Imputation 50% 50%
Gearing 45.00% 45.00%
Debt Beta 0.00 0.00
Asset Beta 0.55 0.55
Equity Beta 1.00 1.00
WACC Analysis
Cost of Debt 7.38% 5.96%
Cost of Equity (post tax nom) 11.08% 11.39%
Nominal Vanilla WACC 9.42% 8.95%
Measures for the market risk premium of 6.0 per cent and an asset beta of 0.55 are consistent with the 2004 LTPA ACCC decision. The risk free rate applies a current 10 year government bond rate of 5.08 per cent. This is a reduction of 0.33 per cent from the rate used in the 2004 decision of 5.41 per cent.
The debt margin is based on a AA stand-alone credit rating. This compares to recent regulatory decisions which have assumed BBB+ standalone ratings. The rate applied of 2.30 per cent is an increase of 1.75 per cent from the 2004 decision of 0.55 per cent. This movement largely reflects the impacts of the global financial crisis. For reference if a BBB+ standalone credit rating was applied the debt margin would be closer to 4.25 percent.
Airservices Australia | 23
Draft Price Proposal
DETERMINING PRICES
Based on the Building Block elements set out above, prices on a service and location are based on:
cost attributions to those locations;
the forecast activity levels; and
transitional price caps where larger price increases would be dislocating for the industry.
Cost Attribution
Inventorying Facilities & Services Costs
Airservices applies an activity based approach in determining the cost of each service at each location. This methodology provides for location specific pricing, underpinning the principle of ‘user pays’ and supports efficient resource allocation, particularly around capital investment decision making.
In order to appropriately allocate costs an inventory of services and key cost statistics was undertaken. These cost statistics have then been used as the basis for allocating costs and asset values to service lines to the following broad functions:
Direct operational functions; and
Non-operational functions.
Direct operational functions are attributed to services using location and service specific key cost statistics. These include direct ATC and ARFF service costs and asset costs.
Non-operational functions are attributed to services at an aggregated level using broad attribution statistics. These include operational support and safety, environment and corporate management costs.
Standard Costing
To maintain equity across ‘like’ services, standard costings have been applied. This approach provides for the standardisation of costs for similar cost inputs, smoothing any cost anomalies that are not location driven, and providing a cost base that better reflects the level of service and types of assets employed at the particular location.
This means that inputs such as staff and assets, providing the same functionality, have been costed to services at the same rate, for example a standard salary cost for an air traffic controller and a standard asset value and depreciation cost per facility type. This contrasts to actual costs where air traffic controller salaries will vary from location to location based on length of tenure and asset costs which vary based on the timing of the replacement program which may roll out over a number of years.
Airservices Australia | 24
Draft Price Proposal
Attributing Costs to Locations
Service costs have been broadly categorised as:
Location specific (i.e. operational staff, supplier costs, asset maintenance, depreciation and management costs consumed at a location
Non-location specific (i.e. operational support costs, corporate support functions, asset maintenance, depreciation and management costs attributed to a location but not consumed at a location.)
The costs at a location comprise both the location specific and non-location specific costs that are attributed to a location’s cost base by a range of different allocation methods. The main cost components and how they are allocated are discussed below.
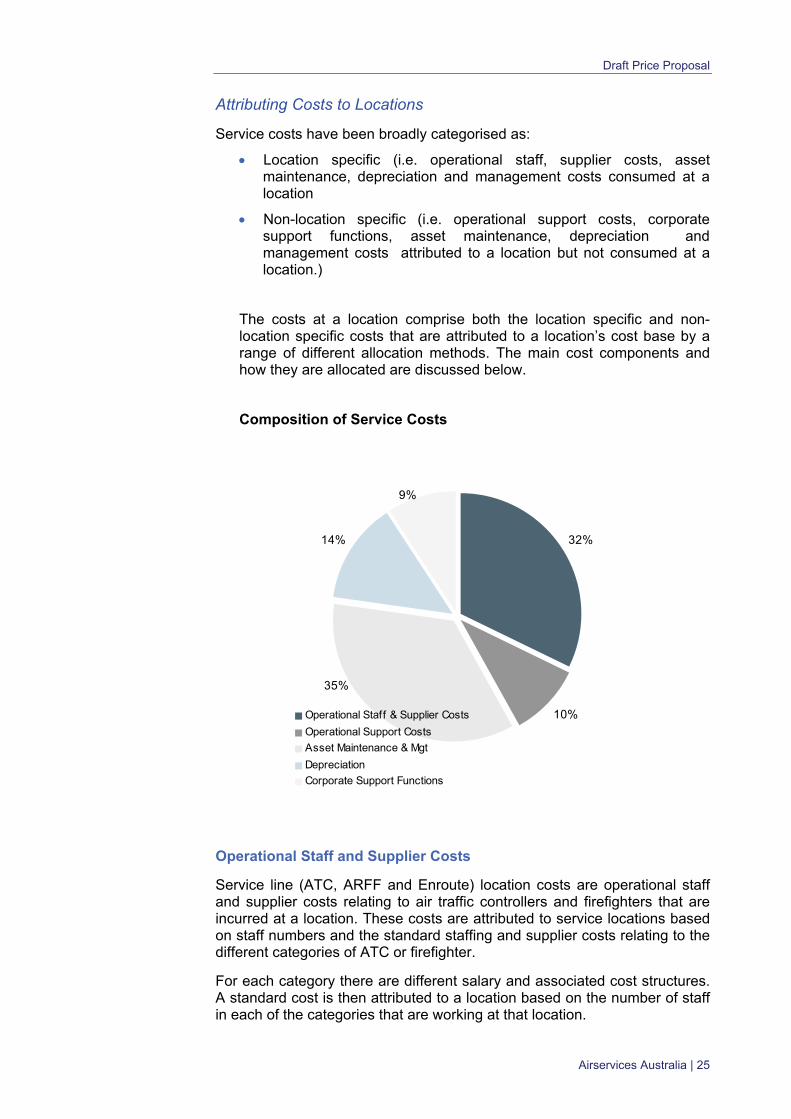
Composition of Service Costs
32%
10%
14%
35%
9%
Operational Staff & Supplier Costs
Operational Support Costs
Asset Maintenance & Mgt
Depreciation
Corporate Support Functions
Operational Staff and Supplier Costs
Service line (ATC, ARFF and Enroute) location costs are operational staff and supplier costs relating to air traffic controllers and firefighters that are incurred at a location. These costs are attributed to service locations based on staff numbers and the standard staffing and supplier costs relating to the different categories of ATC or firefighter.
For each category there are different salary and associated cost structures. A standard cost is then attributed to a location based on the number of staff in each of the categories that are working at that location.
Airservices Australia | 25
Draft Price Proposal
Operational Support Costs
Operational support costs are specialist support costs which are service specific, but do not directly relate to the provision of ATC or ARFF services at a specific location, or airspace sector. These costs include such things as operational training, safety compliance and standardisation as well as some network management services such as aeronautical charting, flight information services and the National Operations Centre.
These costs are allocated to service locations in proportion to the locations share of location specific costs.
Asset Maintenance and Management Costs
Asset costs include Airservices technical maintenance staff costs, third party support contracts, asset support services, non-capital expenses relating to asset renewals and upgrades and property services such as rents, utilities and security. They also include return on assets.
They comprise both location and non-location specific Asset Maintenance and Management costs, with the majority relating to location based operational assets and equipment.
Location specific Asset Maintenance and Management costs reflect the costs of assets that are typically involved in the provision of ATC and ARFF services at a location. These include airways technical equipment and infrastructure (e.g. radars, navigation aids, towers, operational software and communication equipment) and rescue and fire fighting equipment and infrastructure (e.g. fire vehicles, water rescue equipment, alarm monitoring equipment, fire stations and communications equipment).
These location specific based costs are standardised so that the cost of a similar piece of equipment is the same across all locations and is attributed to each service based on the number of units installed at that location. Standard costs take into account asset type as well as the level of service the asset supports.
Non-location specific Asset Maintenance and Management costs relate to assets that are not involved in the provision of a specific ATC or ARFF service, or are not service specific (e.g. Safety Management Reporting Systems). These assets are more network in nature and the costs for these assets are allocated to service locations in two steps. Firstly, to services based on their proportional share of total location costs, then secondly, to individual service locations based on overall demand (i.e. the chargeable units underpinning the service such as tonnes landed).
Depreciation
Depreciation costs are allocated in the same way as Asset Maintenance and Management costs. Location specific depreciation costs are attributed on a standard cost basis to a location. Non-location specific depreciation costs are attributed applying the same two step process as that used for non-location specific Asset Maintenance and Management costs.
Airservices Australia | 26
Draft Price Proposal
Corporate Support Functions
Non-location specific service costs include functions such as safety, environmental monitoring, human resources, finance and administrative support.
These costs have been allocated to service locations in two steps. Firstly, to services based on their proportional share of location costs, then secondly, to individual service locations based on overall demand (i.e. the chargeable units underpinning the service such as tonnes landed).
Flight Activity Volume Forecasts
Airservices engaged IATA Consulting to undertake a forecast of flight activity over the next five years as the basis for this proposal.
Their approach was to analyse the interaction between the prospects for future demand by the customers of domestic and international air transport services on the one hand, and the supply of these services by the airlines on the other. The forecasts of aviation activity that result from this analysis are set out in Appendix 1.
These demand forecasts for air travel are dependent on factors such as income levels and airfares. At a global level, income is represented by Gross Domestic Product (GDP) — for Australia and for the world. Trends in these measures have a powerful effect on demand. Regression analysis of the impact of GDP and airfares on traffic demand was undertaken for most of the markets.
The estimated relationships, together with assumptions about the future development of the causal factors, were used as a basis for forecasting passenger numbers.
Assumptions about airline pricing and aircraft deployment strategies to meet future customer demand were then incorporated into the forecasts. This process took into account the aircraft types in the existing airline fleets, the numbers and types of aircraft on order and the flexibility of the airlines to adjust delivery schedules.
Passenger forecasts were translated into aircraft movement forecasts using assumptions about average load factors and aircraft size. These assumptions were influenced by airline response to developments in passenger demand.
Transitional Price Capping
Taking into account service costs and flight activity volumes the proposed prices for each location have been established to transition along a path from the current price to a price in 2015/16 that reflects the total allocated cost of the service over time.
At an aggregate level, this rate of transition has been capped at general inflationary levels, while at a service and location level there are some increases that are greater than inflation.
Airservices Australia | 27
Draft Price Proposal
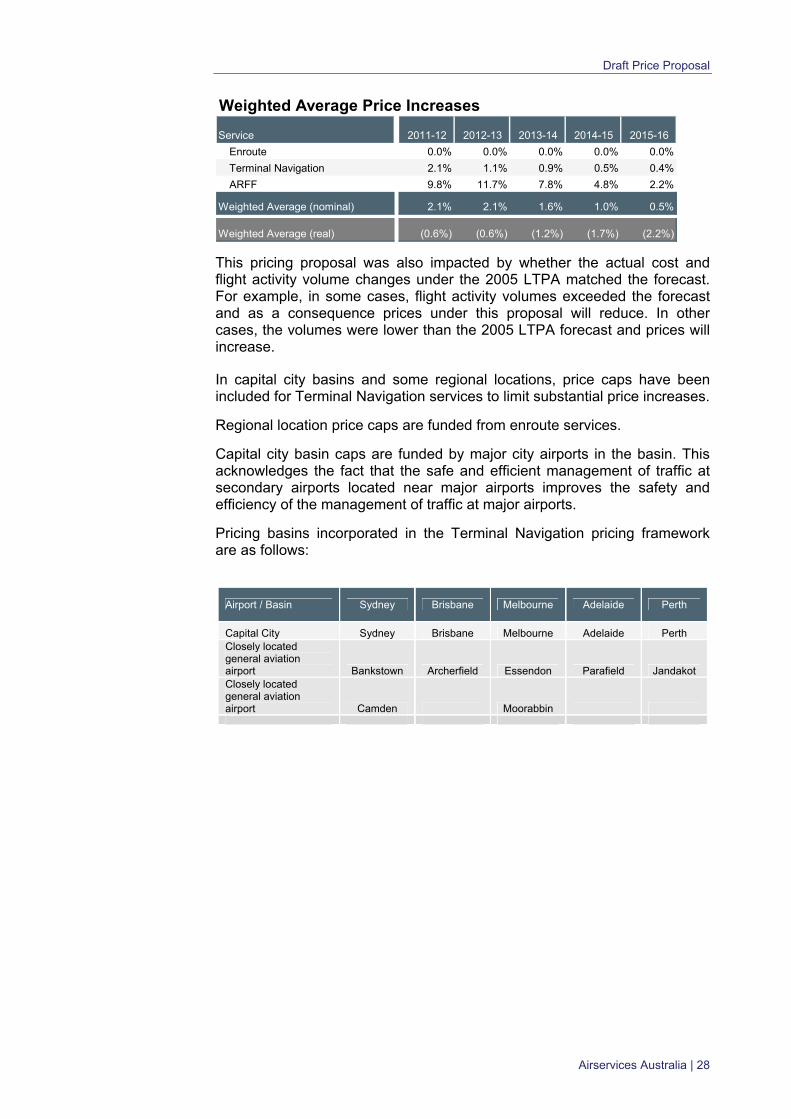
Weighted Average Price Increases
Service 2011-12 2012-13 2013-14 2014-15 2015-16
Enroute 0.0% 0.0% 0.0% 0.0% 0.0%
Terminal Navigation 2.1% 1.1% 0.9% 0.5% 0.4%
ARFF 9.8% 11.7% 7.8% 4.8% 2.2%
Weighted Average (nominal) 2.1% 2.1% 1.6% 1.0% 0.5%
Weighted Average (real) (0.6%) (0.6%) (1.2%) (1.7%) (2.2%)
This pricing proposal was also impacted by whether the actual cost and flight activity volume changes under the 2005 LTPA matched the forecast. For example, in some cases, flight activity volumes exceeded the forecast and as a consequence prices under this proposal will reduce. In other cases, the volumes were lower than the 2005 LTPA forecast and prices will increase.
In capital city basins and some regional locations, price caps have been included for Terminal Navigation services to limit substantial price increases.
Regional location price caps are funded from enroute services.
Capital city basin caps are funded by major city airports in the basin. This acknowledges the fact that the safe and efficient management of traffic at secondary airports located near major airports improves the safety and efficiency of the management of traffic at major airports.
Pricing basins incorporated in the Terminal Navigation pricing framework are as follows:
Airport / Basin Sydney Brisbane Melbourne Adelaide Perth
Capital City Sydney Brisbane Melbourne Adelaide Perth Closely located general aviation airport Bankstown Archerfield Essendon Parafield Jandakot Closely located general aviation airport Camden Moorabbin
Airservices Australia | 28
Draft Price Proposal
Basis of Charges
MTOW (Maximum Take-Off Weight)
Maximum Take-Off Weight (MTOW) will continue to be used as the basis of charges for TN, ARFF and Enroute service charging calculations.
Average MTOW to be applied
To simplify the determination of MTOW for larger aircraft between different operational configurations of very similar aircraft, an average MTOW will be applied.
This average will only apply to aircraft weighing greater than 15.1 tonnes. The average MTOW will be aircraft type specific (e.g. B747-400). A table of MTOW’s applicable for each aircraft type greater than 15.1 tonnes is shown at Appendix 2.
Weight Capping
To reflect the strong consultation feedback on the need to move away from a pure weight based charge this proposal includes a cap on the maximum weight to be used of 500 tonnes. This is intended to support the operational efficiencies that large aircraft provide with regard to capacity, fuel efficiency and noise. It also recognises international policy which discourages the direct relationship between aircraft weight and charges.
Charging for General Aviation
To improve efficiency and cost, the structure of charging for General Aviation is to be changed. This addresses the administrative burden of recovering less than 0.02 per cent of revenue from 4,000 low volume users. It applies to any aircraft weighing less than 5.7 tonnes as follows:
users who incur annual charges of $500, or less will not be liable for Airservices charges.
users incurring charges greater than $500 in value will be liable for the total amount of charges. To pay these charges:
o users may pay them normally as they are incurred, or
o users may elect to pay a fixed annual charge based on prior year usage, calculated from April to March which can be paid on an annual or quarterly basis, depending on the value of the fixed charge. Under this option users will receive a 2.5 per cent discount.
Under these new charging arrangements the light aircraft option (LAO) will no longer be available as payment option for General Aviation users.
Airservices Australia | 29
Draft Price Proposal
Airservices Australia | 30
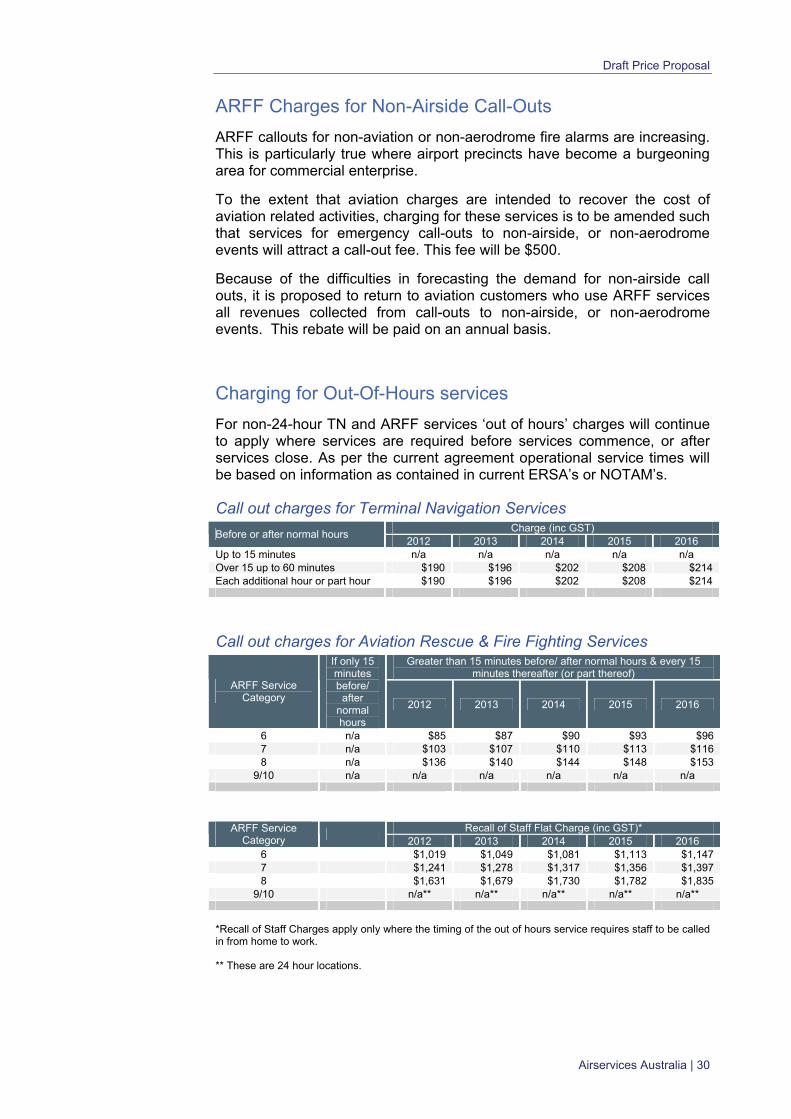
ARFF Charges for Non-Airside Call-Outs
ARFF callouts for non-aviation or non-aerodrome fire alarms are increasing. This is particularly true where airport precincts have become a burgeoning area for commercial enterprise.
To the extent that aviation charges are intended to recover the cost of aviation related activities, charging for these services is to be amended such that services for emergency call-outs to non-airside, or non-aerodrome events will attract a call-out fee. This fee will be $500.
Because of the difficulties in forecasting the demand for non-airside call outs, it is proposed to return to aviation customers who use ARFF services all revenues collected from call-outs to non-airside, or non-aerodrome events. This rebate will be paid on an annual basis.
Charging for Out-Of-Hours services
For non-24-hour TN and ARFF services ‘out of hours’ charges will continue to apply where services are required before services commence, or after services close. As per the current agreement operational service times will be based on information as contained in current ERSA’s or NOTAM’s.
Call out charges for Terminal Navigation Services Charge (inc GST)
Before or after normal hours 2012 2013 2014 2015 2016
Up to 15 minutes n/a n/a n/a n/a n/a Over 15 up to 60 minutes $190 $196 $202 $208 $214 Each additional hour or part hour $190 $196 $202 $208 $214
Call out charges for Aviation Rescue & Fire Fighting Services Greater than 15 minutes before/ after normal hours & every 15
minutes thereafter (or part thereof) ARFF Service
Category
If only 15 minutes before/
after normal hours
2012 2013 2014 2015 2016
6 n/a $85 $87 $90 $93 $96 7 n/a $103 $107 $110 $113 $116 8 n/a $136 $140 $144 $148 $153
9/10 n/a n/a n/a n/a n/a n/a
Recall of Staff Flat Charge (inc GST)* ARFF Service
Category
2012 2013 2014 2015 2016 6 $1,019 $1,049 $1,081 $1,113 $1,147 7 $1,241 $1,278 $1,317 $1,356 $1,397 8 $1,631 $1,679 $1,730 $1,782 $1,835
9/10 n/a** n/a** n/a** n/a** n/a**
*Recall of Staff Charges apply only where the timing of the out of hours service requires staff to be called in from home to work.
** These are 24 hour locations.
Dra
ft P
rice
Pro
posa
l
Airs
ervi
ces
Au
stra
lia |
31
IMP
AC
T O
F P
RIC
ES
Est
imat
ed Im
pact
by
Airc
raft
Typ
e
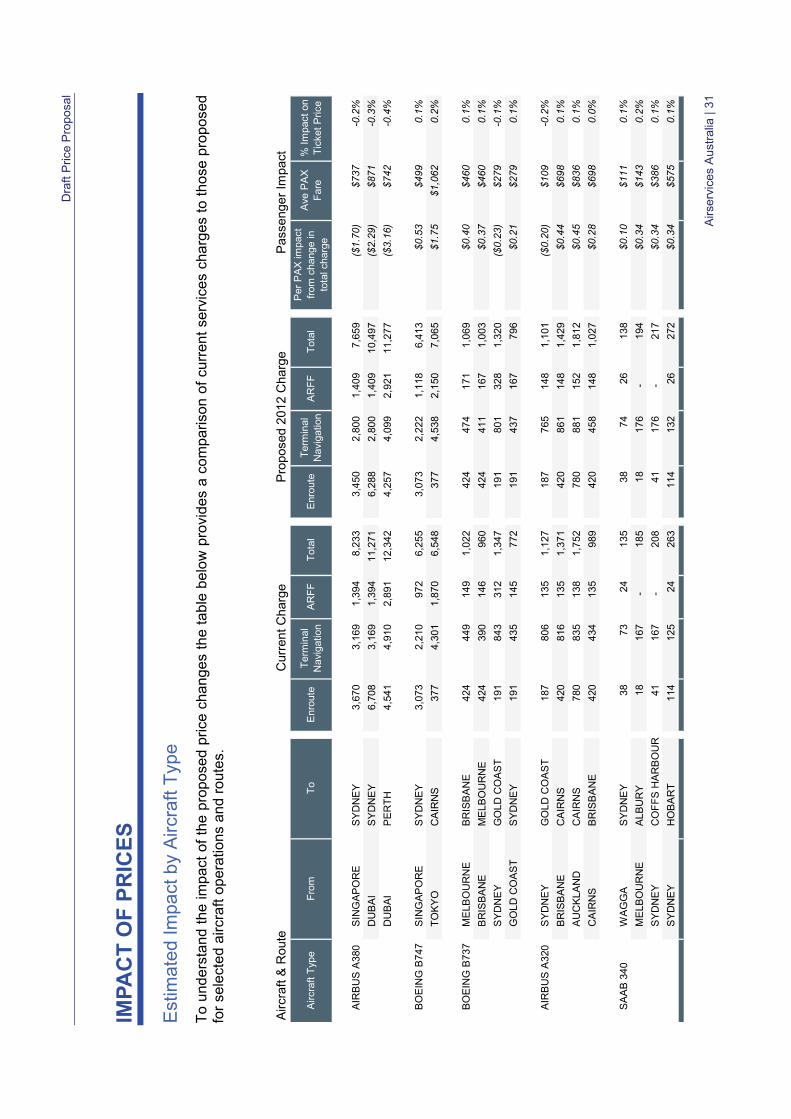
To
unde
rsta
nd t
he im
pact
of
the
prop
osed
pric
e ch
ange
s th
e ta
ble
belo
w p
rovi
des
a co
mpa
rison
of
curr
ent
serv
ices
cha
rges
to
thos
e pr
opos
ed
for
sele
cted
airc
raft
ope
ratio
ns a
nd r
oute
s.
Airc
raft
& R
oute
Cur
rent
Cha
rge
Pro
pos
ed 2
012
Ch
arg
eP
asse
nge
r Im
pact
Airc
raft
Typ
eF
rom
To
Enr
oute
Ter
min
al
Nav
igat
ion
AR
FF
Tot
alE
nrou
teT
erm
inal
N
avig
atio
nA
RF
FT
otal
Per
PA
X im
pact
fr
om c
hang
e in
to
tal c
harg
e
Ave
PA
X
Far
e%
Im
pact
on
Tic
ket
Pric
e
AIR
BU
S A
380
SIN
GA
PO
RE
SY
DN
EY
3,67
0
3,16
9
1,39
4
8,
233
3,
450
2,
800
1,40
9
7,
659
($
1.70
)$7
37-0
.2%
DU
BA
IS
YD
NE
Y6,
708
3,
169
1,
394
11,2
71
6,
288
2,
800
1,40
9
10
,497
($2.
29)
$871
-0.3
%
DU
BA
IP
ER
TH
4,54
1
4,91
0
2,89
1
12
,342
4,25
7
4,09
9
2,
921
11,2
77
($
3.16
)$7
42-0
.4%
BO
EIN
G B
747
SIN
GA
PO
RE
SY
DN
EY
3,07
3
2,21
0
972
6,
255
3,
073
2,
222
1,11
8
6,
413
$0
.53
$499
0.1%
TO
KY
OC
AIR
NS
377
4,
301
1,
870
6,54
8
377
4,
538
2,15
0
7,
065
$1
.75
$1,0
620.
2%
BO
EIN
G B
737
ME
LBO
UR
NE
BR
ISB
AN
E42
4
449
149
1,
022
42
4
474
17
1
1,06
9
$0.4
0$4
600.
1%
BR
ISB
AN
EM
ELB
OU
RN
E42
4
390
146
96
0
424
41
1
167
1,
003
$0
.37
$460
0.1%
SY
DN
EY
GO
LD C
OA
ST
191
84
3
31
2
1,34
7
191
80
1
328
1,
320
($
0.23
)$2
79-0
.1%
GO
LD C
OA
ST
SY
DN
EY
191
43
5
14
5
772
19
1
437
16
7
796
$0
.21
$279
0.1%
AIR
BU
S A
320
SY
DN
EY
GO
LD C
OA
ST
187
80
6
13
5
1,12
7
187
76
5
148
1,
101
($
0.20
)$1
09-0
.2%
BR
ISB
AN
EC
AIR
NS
420
81
6
13
5
1,37
1
420
86
1
148
1,
429
$0
.44
$698
0.1%
AU
CK
LAN
DC
AIR
NS
780
83
5
13
8
1,75
2
780
88
1
152
1,
812
$0
.45
$836
0.1%
CA
IRN
SB
RIS
BA
NE
420
43
4
13
5
989
42
0
458
14
8
1,02
7
$0.2
8$6
980.
0%
SA
AB
340
WA
GG
AS
YD
NE
Y38
73
24
13
5
38
74
26
13
8
$0.1
0$1
110.
1%
ME
LBO
UR
NE
ALB
UR
Y18
167
-
18
5
18
17
6
-
19
4
$0.3
4$1
430.
2%
SY
DN
EY
CO
FF
S H
AR
BO
UR
41
16
7
-
208
41
176
-
217
$0
.34
$386
0.1%
SY
DN
EY
HO
BA
RT
114
12
5
24
263
11
4
132
26
272
$0
.34
$575
0.1%
Draft Price Proposal
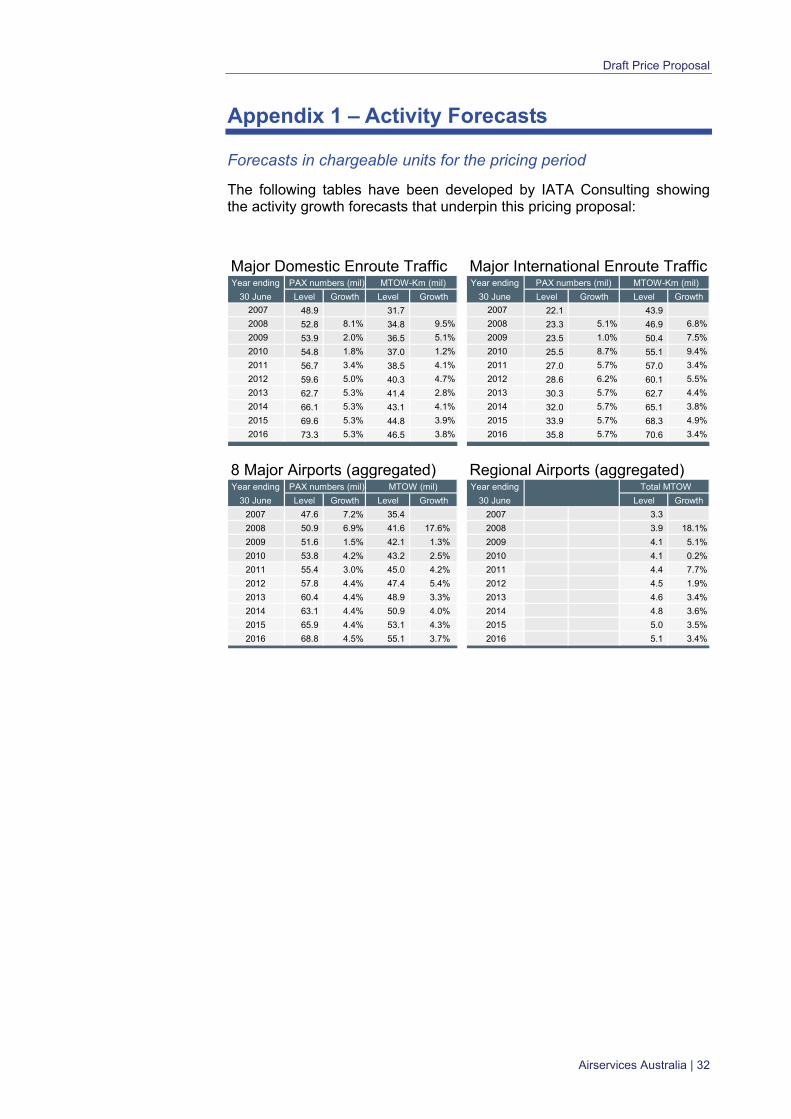
Appendix 1 – Activity Forecasts
Forecasts in chargeable units for the pricing period
The following tables have been developed by IATA Consulting showing the activity growth forecasts that underpin this pricing proposal:
Major Domestic Enroute Traffic Major International Enroute Traffic Year ending PAX numbers (mil) MTOW-Km (mil) Year ending PAX numbers (mil) MTOW-Km (mil)
30 June Level Growth Level Growth 30 June Level Growth Level Growth
2007 48.9 31.7 2007 22.1 43.9
2008 52.8 8.1% 34.8 9.5% 2008 23.3 5.1% 46.9 6.8%
2009 53.9 2.0% 36.5 5.1% 2009 23.5 1.0% 50.4 7.5%
2010 54.8 1.8% 37.0 1.2% 2010 25.5 8.7% 55.1 9.4%
2011 56.7 3.4% 38.5 4.1% 2011 27.0 5.7% 57.0 3.4%
2012 59.6 5.0% 40.3 4.7% 2012 28.6 6.2% 60.1 5.5%
2013 62.7 5.3% 41.4 2.8% 2013 30.3 5.7% 62.7 4.4%
2014 66.1 5.3% 43.1 4.1% 2014 32.0 5.7% 65.1 3.8%
2015 69.6 5.3% 44.8 3.9% 2015 33.9 5.7% 68.3 4.9%
2016 73.3 5.3% 46.5 3.8% 2016 35.8 5.7% 70.6 3.4%
8 Major Airports (aggregated) Regional Airports (aggregated) Year ending PAX numbers (mil) MTOW (mil) Year ending Total MTOW
30 June Level Growth Level Growth 30 June Level Growth
2007 47.6 7.2% 35.4 2007 3.3
2008 50.9 6.9% 41.6 17.6% 2008 3.9 18.1%
2009 51.6 1.5% 42.1 1.3% 2009 4.1 5.1%
2010 53.8 4.2% 43.2 2.5% 2010 4.1 0.2%
2011 55.4 3.0% 45.0 4.2% 2011 4.4 7.7%
2012 57.8 4.4% 47.4 5.4% 2012 4.5 1.9%
2013 60.4 4.4% 48.9 3.3% 2013 4.6 3.4%
2014 63.1 4.4% 50.9 4.0% 2014 4.8 3.6%
2015 65.9 4.4% 53.1 4.3% 2015 5.0 3.5%
2016 68.8 4.5% 55.1 3.7% 2016 5.1 3.4%
Airservices Australia | 32
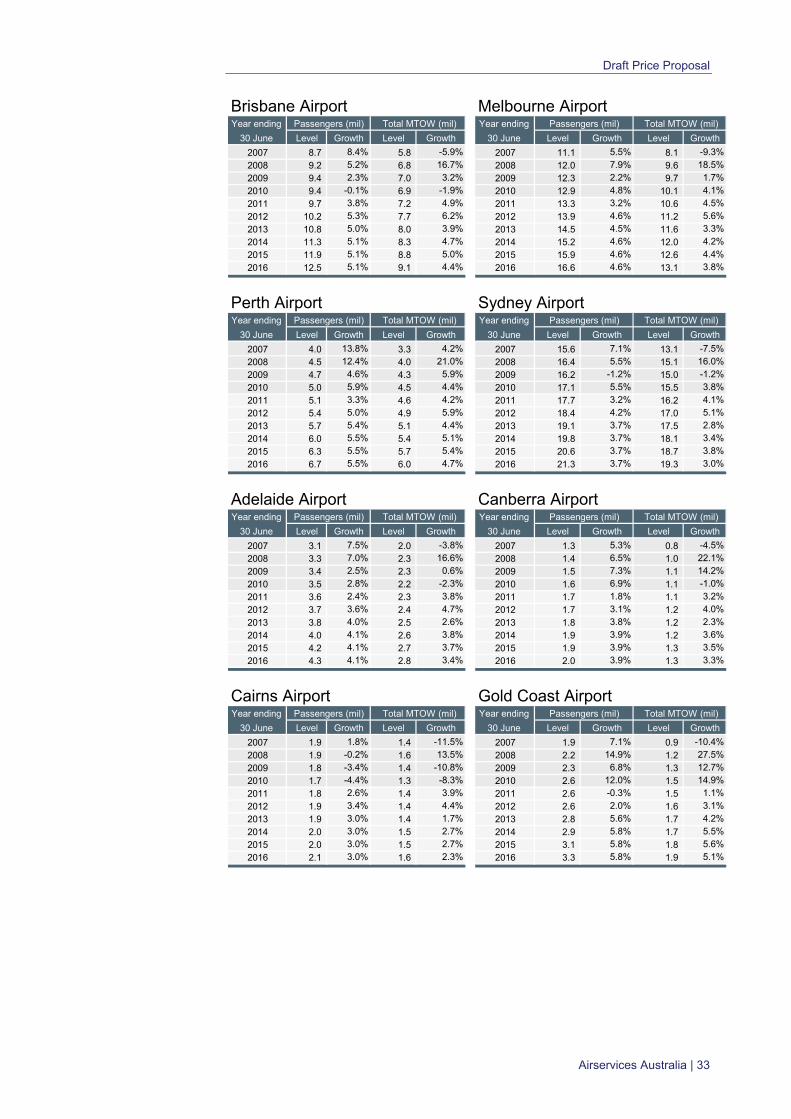
Draft Price Proposal
Brisbane Airport Melbourne Airport Year ending Passengers (mil) Total MTOW (mil) Year ending Passengers (mil) Total MTOW (mil)
30 June Level Growth Level Growth 30 June Level Growth Level Growth
2007 8.7 8.4% 5.8 -5.9% 2007 11.1 5.5% 8.1 -9.3%
2008 9.2 5.2% 6.8 16.7% 2008 12.0 7.9% 9.6 18.5%
2009 9.4 2.3% 7.0 3.2% 2009 12.3 2.2% 9.7 1.7%
2010 9.4 -0.1% 6.9 -1.9% 2010 12.9 4.8% 10.1 4.1%
2011 9.7 3.8% 7.2 4.9% 2011 13.3 3.2% 10.6 4.5%
2012 10.2 5.3% 7.7 6.2% 2012 13.9 4.6% 11.2 5.6%
2013 10.8 5.0% 8.0 3.9% 2013 14.5 4.5% 11.6 3.3%
2014 11.3 5.1% 8.3 4.7% 2014 15.2 4.6% 12.0 4.2%
2015 11.9 5.1% 8.8 5.0% 2015 15.9 4.6% 12.6 4.4%
2016 12.5 5.1% 9.1 4.4% 2016 16.6 4.6% 13.1 3.8%
Perth Airport Sydney Airport Year ending Passengers (mil) Total MTOW (mil) Year ending Passengers (mil) Total MTOW (mil)
30 June Level Growth Level Growth 30 June Level Growth Level Growth
2007 4.0 13.8% 3.3 4.2% 2007 15.6 7.1% 13.1 -7.5%
2008 4.5 12.4% 4.0 21.0% 2008 16.4 5.5% 15.1 16.0%
2009 4.7 4.6% 4.3 5.9% 2009 16.2 -1.2% 15.0 -1.2%
2010 5.0 5.9% 4.5 4.4% 2010 17.1 5.5% 15.5 3.8%
2011 5.1 3.3% 4.6 4.2% 2011 17.7 3.2% 16.2 4.1%
2012 5.4 5.0% 4.9 5.9% 2012 18.4 4.2% 17.0 5.1%
2013 5.7 5.4% 5.1 4.4% 2013 19.1 3.7% 17.5 2.8%
2014 6.0 5.5% 5.4 5.1% 2014 19.8 3.7% 18.1 3.4%
2015 6.3 5.5% 5.7 5.4% 2015 20.6 3.7% 18.7 3.8%
2016 6.7 5.5% 6.0 4.7% 2016 21.3 3.7% 19.3 3.0%
Adelaide Airport Canberra Airport Year ending Passengers (mil) Total MTOW (mil) Year ending Passengers (mil) Total MTOW (mil)
30 June Level Growth Level Growth 30 June Level Growth Level Growth
2007 3.1 7.5% 2.0 -3.8% 2007 1.3 5.3% 0.8 -4.5%
2008 3.3 7.0% 2.3 16.6% 2008 1.4 6.5% 1.0 22.1%
2009 3.4 2.5% 2.3 0.6% 2009 1.5 7.3% 1.1 14.2%
2010 3.5 2.8% 2.2 -2.3% 2010 1.6 6.9% 1.1 -1.0%
2011 3.6 2.4% 2.3 3.8% 2011 1.7 1.8% 1.1 3.2%
2012 3.7 3.6% 2.4 4.7% 2012 1.7 3.1% 1.2 4.0%
2013 3.8 4.0% 2.5 2.6% 2013 1.8 3.8% 1.2 2.3%
2014 4.0 4.1% 2.6 3.8% 2014 1.9 3.9% 1.2 3.6%
2015 4.2 4.1% 2.7 3.7% 2015 1.9 3.9% 1.3 3.5%
2016 4.3 4.1% 2.8 3.4% 2016 2.0 3.9% 1.3 3.3%
Cairns Airport Gold Coast Airport Year ending Passengers (mil) Total MTOW (mil) Year ending Passengers (mil) Total MTOW (mil)
30 June Level Growth Level Growth 30 June Level Growth Level Growth
2007 1.9 1.8% 1.4 -11.5% 2007 1.9 7.1% 0.9 -10.4%
2008 1.9 -0.2% 1.6 13.5% 2008 2.2 14.9% 1.2 27.5%
2009 1.8 -3.4% 1.4 -10.8% 2009 2.3 6.8% 1.3 12.7%
2010 1.7 -4.4% 1.3 -8.3% 2010 2.6 12.0% 1.5 14.9%
2011 1.8 2.6% 1.4 3.9% 2011 2.6 -0.3% 1.5 1.1%
2012 1.9 3.4% 1.4 4.4% 2012 2.6 2.0% 1.6 3.1%
2013 1.9 3.0% 1.4 1.7% 2013 2.8 5.6% 1.7 4.2%
2014 2.0 3.0% 1.5 2.7% 2014 2.9 5.8% 1.7 5.5%
2015 2.0 3.0% 1.5 2.7% 2015 3.1 5.8% 1.8 5.6%
2016 2.1 3.0% 1.6 2.3% 2016 3.3 5.8% 1.9 5.1%
Airservices Australia | 33
Draft Price Proposal
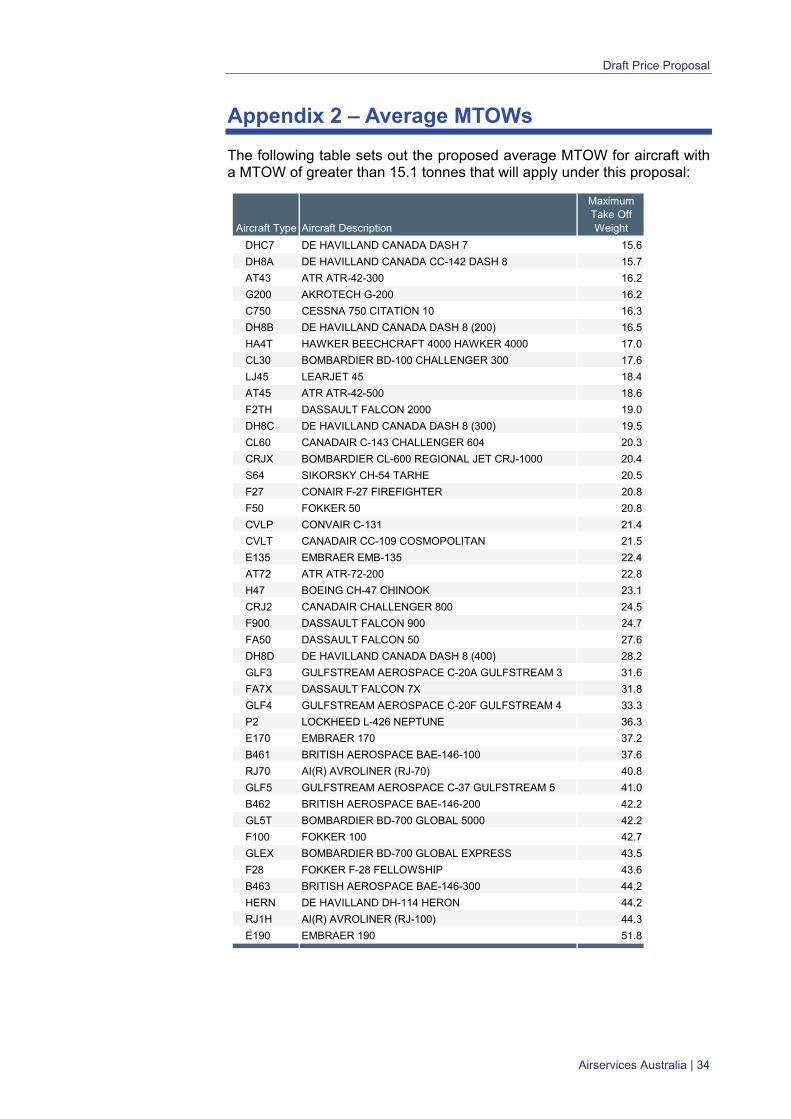
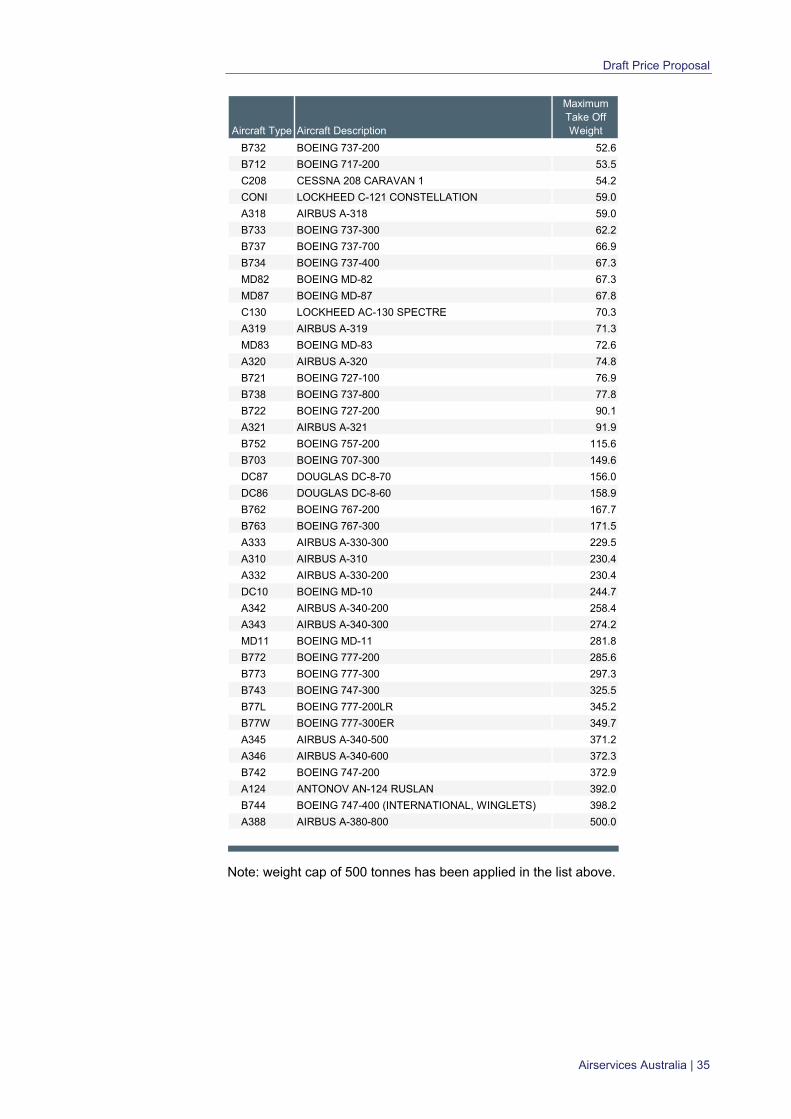
Appendix 2 – Average MTOWs
The following table sets out the proposed average MTOW for aircraft with a MTOW of greater than 15.1 tonnes that will apply under this proposal:
Aircraft Type Aircraft Description
Maximum Take Off Weight
DHC7 DE HAVILLAND CANADA DASH 7 15.6
DH8A DE HAVILLAND CANADA CC-142 DASH 8 15.7
AT43 ATR ATR-42-300 16.2
G200 AKROTECH G-200 16.2
C750 CESSNA 750 CITATION 10 16.3
DH8B DE HAVILLAND CANADA DASH 8 (200) 16.5
HA4T HAWKER BEECHCRAFT 4000 HAWKER 4000 17.0
CL30 BOMBARDIER BD-100 CHALLENGER 300 17.6
LJ45 LEARJET 45 18.4
AT45 ATR ATR-42-500 18.6
F2TH DASSAULT FALCON 2000 19.0
DH8C DE HAVILLAND CANADA DASH 8 (300) 19.5
CL60 CANADAIR C-143 CHALLENGER 604 20.3
CRJX BOMBARDIER CL-600 REGIONAL JET CRJ-1000 20.4
S64 SIKORSKY CH-54 TARHE 20.5
F27 CONAIR F-27 FIREFIGHTER 20.8
F50 FOKKER 50 20.8
CVLP CONVAIR C-131 21.4
CVLT CANADAIR CC-109 COSMOPOLITAN 21.5
E135 EMBRAER EMB-135 22.4
AT72 ATR ATR-72-200 22.8
H47 BOEING CH-47 CHINOOK 23.1
CRJ2 CANADAIR CHALLENGER 800 24.5
F900 DASSAULT FALCON 900 24.7
FA50 DASSAULT FALCON 50 27.6
DH8D DE HAVILLAND CANADA DASH 8 (400) 28.2
GLF3 GULFSTREAM AEROSPACE C-20A GULFSTREAM 3 31.6
FA7X DASSAULT FALCON 7X 31.8
GLF4 GULFSTREAM AEROSPACE C-20F GULFSTREAM 4 33.3
P2 LOCKHEED L-426 NEPTUNE 36.3
E170 EMBRAER 170 37.2
B461 BRITISH AEROSPACE BAE-146-100 37.6
RJ70 AI(R) AVROLINER (RJ-70) 40.8
GLF5 GULFSTREAM AEROSPACE C-37 GULFSTREAM 5 41.0
B462 BRITISH AEROSPACE BAE-146-200 42.2
GL5T BOMBARDIER BD-700 GLOBAL 5000 42.2
F100 FOKKER 100 42.7
GLEX BOMBARDIER BD-700 GLOBAL EXPRESS 43.5
F28 FOKKER F-28 FELLOWSHIP 43.6
B463 BRITISH AEROSPACE BAE-146-300 44.2
HERN DE HAVILLAND DH-114 HERON 44.2
RJ1H AI(R) AVROLINER (RJ-100) 44.3
E190 EMBRAER 190 51.8
Airservices Australia | 34
Draft Price Proposal
Aircraft Type Aircraft Description
Maximum Take Off Weight
B732 BOEING 737-200 52.6
B712 BOEING 717-200 53.5
C208 CESSNA 208 CARAVAN 1 54.2
CONI LOCKHEED C-121 CONSTELLATION 59.0
A318 AIRBUS A-318 59.0
B733 BOEING 737-300 62.2
B737 BOEING 737-700 66.9
B734 BOEING 737-400 67.3
MD82 BOEING MD-82 67.3
MD87 BOEING MD-87 67.8
C130 LOCKHEED AC-130 SPECTRE 70.3
A319 AIRBUS A-319 71.3
MD83 BOEING MD-83 72.6
A320 AIRBUS A-320 74.8
B721 BOEING 727-100 76.9
B738 BOEING 737-800 77.8
B722 BOEING 727-200 90.1
A321 AIRBUS A-321 91.9
B752 BOEING 757-200 115.6
B703 BOEING 707-300 149.6
DC87 DOUGLAS DC-8-70 156.0
DC86 DOUGLAS DC-8-60 158.9
B762 BOEING 767-200 167.7
B763 BOEING 767-300 171.5
A333 AIRBUS A-330-300 229.5
A310 AIRBUS A-310 230.4
A332 AIRBUS A-330-200 230.4
DC10 BOEING MD-10 244.7
A342 AIRBUS A-340-200 258.4
A343 AIRBUS A-340-300 274.2
MD11 BOEING MD-11 281.8
B772 BOEING 777-200 285.6
B773 BOEING 777-300 297.3
B743 BOEING 747-300 325.5
B77L BOEING 777-200LR 345.2
B77W BOEING 777-300ER 349.7
A345 AIRBUS A-340-500 371.2
A346 AIRBUS A-340-600 372.3
B742 BOEING 747-200 372.9
A124 ANTONOV AN-124 RUSLAN 392.0
B744 BOEING 747-400 (INTERNATIONAL, WINGLETS) 398.2
A388 AIRBUS A-380-800 500.0
Note: weight cap of 500 tonnes has been applied in the list above.
Airservices Australia | 35
Draft Price Proposal
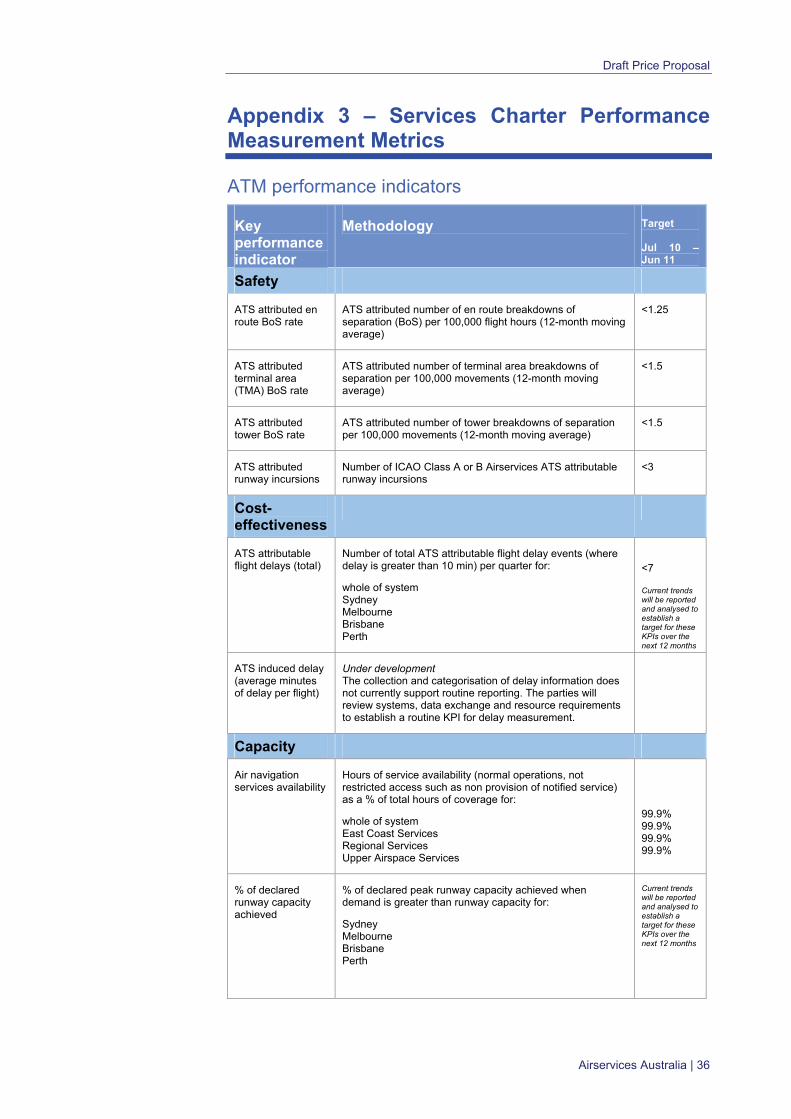
Appendix 3 – Services Charter Performance Measurement Metrics
ATM performance indicators
Key performance indicator
Methodology Target
Jul 10 – Jun 11
Safety
ATS attributed en route BoS rate
ATS attributed number of en route breakdowns of separation (BoS) per 100,000 flight hours (12-month moving average)
<1.25
ATS attributed terminal area (TMA) BoS rate
ATS attributed number of terminal area breakdowns of separation per 100,000 movements (12-month moving average)
<1.5
ATS attributed tower BoS rate
ATS attributed number of tower breakdowns of separation per 100,000 movements (12-month moving average)
<1.5
ATS attributed runway incursions
Number of ICAO Class A or B Airservices ATS attributable runway incursions
<3
Cost-effectiveness
ATS attributable flight delays (total)
Number of total ATS attributable flight delay events (where delay is greater than 10 min) per quarter for:
whole of system Sydney Melbourne Brisbane Perth
<7
Current trends will be reported and analysed to establish a target for these KPIs over the next 12 months
ATS induced delay (average minutes of delay per flight)
Under development The collection and categorisation of delay information does not currently support routine reporting. The parties will review systems, data exchange and resource requirements to establish a routine KPI for delay measurement.
Capacity
Air navigation services availability
Hours of service availability (normal operations, not restricted access such as non provision of notified service) as a % of total hours of coverage for:
whole of system East Coast Services Regional Services Upper Airspace Services
99.9% 99.9% 99.9% 99.9%
% of declared runway capacity achieved
% of declared peak runway capacity achieved when demand is greater than runway capacity for:
Sydney Melbourne Brisbane Perth
Current trends will be reported and analysed to establish a target for these KPIs over the next 12 months
Airservices Australia | 36
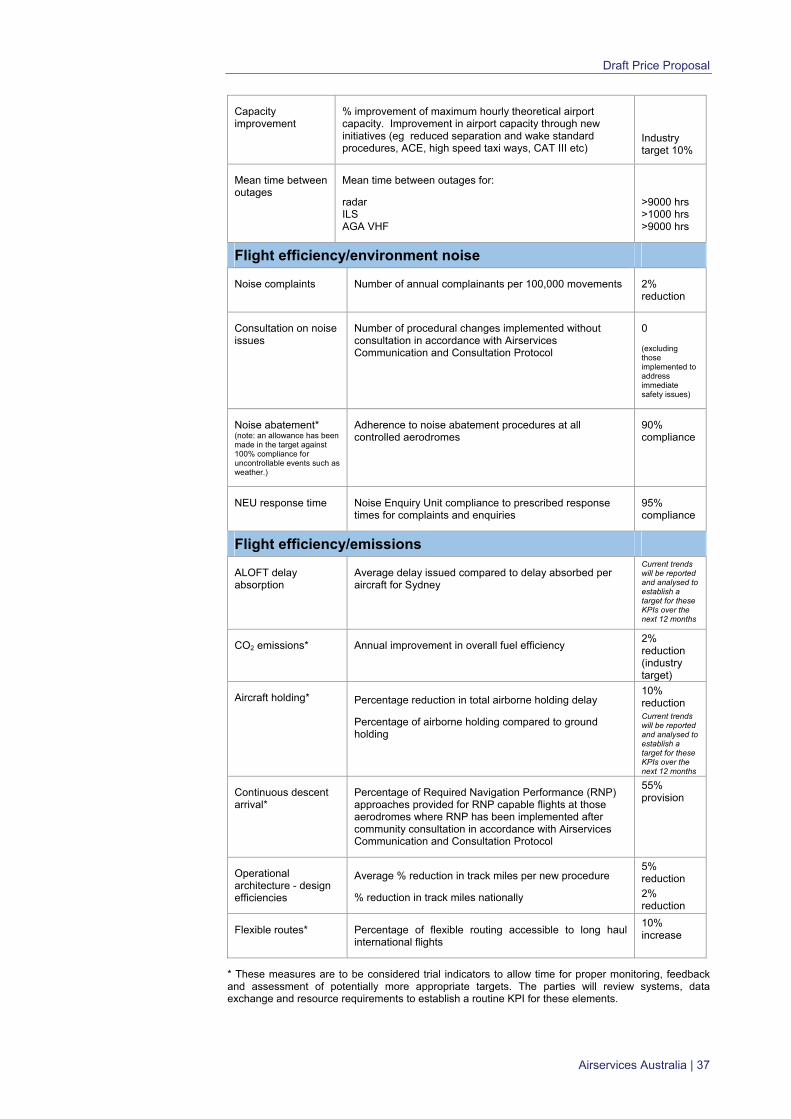
Draft Price Proposal
Capacity improvement
% improvement of maximum hourly theoretical airport capacity. Improvement in airport capacity through new initiatives (eg reduced separation and wake standard procedures, ACE, high speed taxi ways, CAT III etc)
Industry target 10%
Mean time between outages
Mean time between outages for:
radar ILS AGA VHF
>9000 hrs >1000 hrs >9000 hrs
Flight efficiency/environment noise
Noise complaints Number of annual complainants per 100,000 movements 2% reduction
Consultation on noise issues
Number of procedural changes implemented without consultation in accordance with Airservices Communication and Consultation Protocol
0
(excluding those implemented to address immediate safety issues)
Noise abatement* (note: an allowance has been made in the target against 100% compliance for uncontrollable events such as weather.)
Adherence to noise abatement procedures at all controlled aerodromes
90% compliance
NEU response time Noise Enquiry Unit compliance to prescribed response times for complaints and enquiries
95% compliance
Flight efficiency/emissions
ALOFT delay absorption
Average delay issued compared to delay absorbed per aircraft for Sydney
Current trends will be reported and analysed to establish a target for these KPIs over the next 12 months
CO2 emissions* Annual improvement in overall fuel efficiency 2% reduction (industry target)
Aircraft holding* Percentage reduction in total airborne holding delay
Percentage of airborne holding compared to ground holding
10% reduction Current trends will be reported and analysed to establish a target for these KPIs over the next 12 months
Continuous descent arrival*
Percentage of Required Navigation Performance (RNP) approaches provided for RNP capable flights at those aerodromes where RNP has been implemented after community consultation in accordance with Airservices Communication and Consultation Protocol
55% provision
Operational architecture - design efficiencies
Average % reduction in track miles per new procedure
% reduction in track miles nationally
5% reduction
2% reduction
Flexible routes* Percentage of flexible routing accessible to long haul international flights
10% increase
* These measures are to be considered trial indicators to allow time for proper monitoring, feedback and assessment of potentially more appropriate targets. The parties will review systems, data exchange and resource requirements to establish a routine KPI for these elements.
Airservices Australia | 37
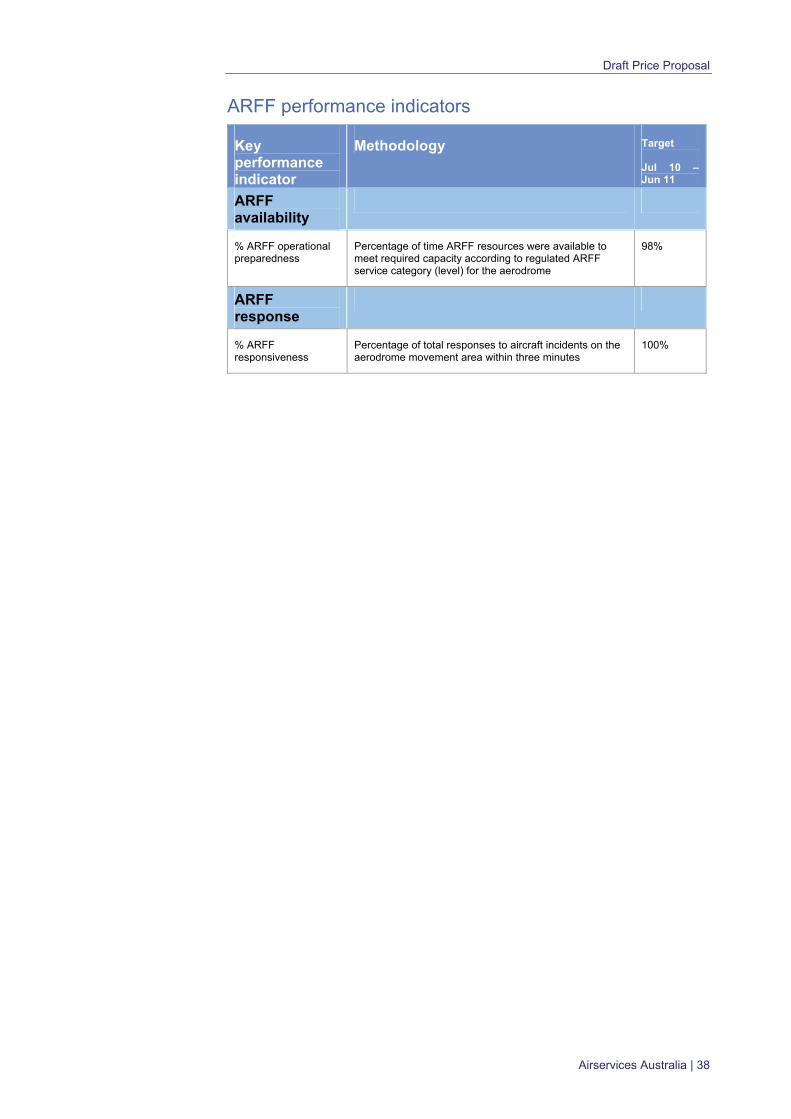
Draft Price Proposal
Airservices Australia | 38
ARFF performance indicators
Key performance indicator
Methodology Target
Jul 10 – Jun 11
ARFF availability
% ARFF operational preparedness
Percentage of time ARFF resources were available to meet required capacity according to regulated ARFF service category (level) for the aerodrome
98%
ARFF response
% ARFF responsiveness
Percentage of total responses to aircraft incidents on the aerodrome movement area within three minutes
100%