draft evaluation of the biotechnology investment...
TRANSCRIPT
Evaluation of the Biotechnology Investment Incentive Tax Credit
Presentation to the Tax Credit Evaluation Committee
Department of Legislative Services Office of Policy Analysis
Annapolis, Maryland
November 2017
DRAFT
ii
Contributing Staff
Writers and Contributors Robert J. Rehrmann George H. Butler, Jr. Annette K. Haldeman Maureen R. Merzlak
Heather N. Ruby Charity L. Scott
Reviewers J. Ryan Bishop
For further information concerning this document contact:
Library and Information Services Office of Policy Analysis
Department of Legislative Services 90 State Circle
Annapolis, Maryland 21401
Baltimore Area: 410-946-5400 ● Washington Area: 301-970-5400 Other Areas: 1-800-492-7122, Extension 5400
TTY: 410-946-5401 ● 301-970-5401 TTY users may also use the Maryland Relay Service
to contact the General Assembly.
Email: [email protected] Home Page: http://mgaleg.maryland.gov
The Department of Legislative Services does not discriminate on the basis of age, ancestry, color, creed, marital status, national origin, race, religion, gender, gender identity, sexual orientation, or disability in the admission or access to its programs, services, or activities. The Department’s Information Officer has been designated to coordinate compliance with the nondiscrimination requirements contained in Section 35.107 of the Department of Justice Regulations. Requests for assistance should be directed to the Information Officer at the telephone numbers shown above.
DRAFT
DRAFT

November 2017 Page 2
iv
• Chapter 6 compares the tax credit program to other government programs that provide assistance to early-stage biotechnology companies.
• Chapter 7 discusses tax credit program activity. • Chapter 8 analyzes the shift in program investments over time. • Chapter 9 discusses the process and implementation issues of the tax credit. • Chapter 10 evaluates the effectiveness of the tax credit in promoting the growth of the
biotechnology industry. • Chapter 11 summarizes the findings of the report and discusses recommended changes to
the tax credit program. We wish to acknowledge the cooperation and assistance provided by the Department of Commerce in the development of this report. DLS trusts that this report will be useful to members of the General Assembly in future deliberations about the biotechnology investment incentive tax credit. Sincerely, Warren G. Deschenaux Executive Director WGD/mrm cc: Thomas V. Mike Miller, Jr., President of the Senate Michael E. Busch, Speaker of the House of Delegates
DRAFT
v
Contents
Letter of Transmittal ........................................................................................................... iii Executive Summary ............................................................................................................ ix Chapter 1 Overview and Background of the Biotechnology Investment Incentive
Tax Credit ..................................................................................................... 1 Overview ........................................................................................................ 1 Tax Credit Evaluation Act .............................................................................. 2 Overview .......................................................................................... 2 Biotechnology Investment Incentive Tax Credit Program ............................. 3 Credit Value and Funding ................................................................. 3 Qualifications .................................................................................... 4 Application and Verification Process ............................................... 6 Legislative Changes .......................................................................... 6 Chapter 2 Intent and Objectives of the Biotechnology Investment Incentive Tax
Credit ............................................................................................................. 9 Intent of the Biotechnology Investment Incentive Tax Credit ....................... 9 Chapter 3 Incentive Programs in Other States ............................................................ 13 Investment Tax Credits in Other States .......................................................... 13 Credit Percentage ...................................................................................... 14 Maryland’s Enhanced Credit Is More Generous ...................................... 15 Holding Period Requirements .................................................................. 15 Prohibitions on Investors .......................................................................... 15 Requirements for a Qualified Business .................................................... 16 Maximum Credit ............................................................................... 17 Program Fees .................................................................................... 17 Credits in Nearby States ................................................................................. 17 Virginia Investment Credit ....................................................................... 17 Expired Programs ............................................................................. 17 Other Venture Capital Programs ...................................................... 18 Chapter 4 Biotechnology Industry and Company Lifecycle ....................................... 19 Biotechnology Industry in the United States .................................................. 19 United States Is Global Leader ................................................................. 19 Biotechnology Industry Is Clustered within Regions ............................... 19 Biotechnology Industry’s Importance to Maryland .................................. 20 Biotechnology Industry Faces Unique Challenges ......................................... 20 FDA Approval Process ................................................................................... 22 Most Tax Credit Participants Require FDA Approval ............................. 22 FDA Drug Therapy Approval Process Is Lengthy and Costly ................. 22
DRAFT
vi
Most Candidates Are Never Successfully Commercialized ..................... 23 Company and Product Development Funding Challenges ............................. 24 Lack of Funding Plays Major Role in Commercialization ....................... 24 Early-stage Financing Challenges ............................................................ 24 Sources of Investment Vary Based on Company Development ............... 25 Companies Employ Different Strategies to Secure Capital ...................... 27 Private Capital Markets and Venture Capital ........................................... 27 Chapter 5 Biotechnology Venture Capital Funding .................................................... 31 Venture Capital Is an Important Source of Funding for New Tech Companies .. 31 Venture Capital Investment in U.S. Companies Has Recently Rebounded 31 Maryland Ranks High in the Ability to Attract Venture Capital .................... 31 Unlike Rest of Nation, Maryland Venture Capital Funding Has Not
Increased Recently .......................................................................................... 32 Maryland Health Care Venture Capital Has Shifted to Biotechnology
Companies ...................................................................................................... 33 Maryland Venture Biotechnology Capital Has Not Shifted to Earlier Stages ........ 34 Investors Remain Unwilling to Invest in Seed Stages .................................... 35 Chapter 6 Small Business Innovative Research and Maryland Technology
Development Corporation Programs .......................................................... 37 National Institutes of Health Programs .......................................................... 37 NIH Impact on Maryland Biosciences Industry ....................................... 37 Program Has Clear Objective with Metrics That Assess Program
Performance .............................................................................................. 39 Application and Decision Process ............................................................ 41 National Academy of Sciences Evaluation .............................................. 41 Objectives and Metrics ............................................................................. 42 Maryland Technology Development Corporation .......................................... 42 Programs Provide Assistance to Biotechnology Companies .................... 42 TEDCO Programs Have a Clear Mission and Are Coordinated .............. 43 NIH and TEDCO Award Processes Are More Likely to Maximize Program
Effectiveness ................................................................................................... 44 Competitive Application Process ............................................................. 45 TEDCO and NIH Criteria Improve Program Focus and Outcomes .............. 46 SBIR and TEDCO Awards Provide Benefit Directly to Company .......... 47 State Tax Credit Is Not Coordinated ........................................................ 47 Chapter 7 Program Fiscal Impact and Overview ........................................................ 49 Program Fiscal Impact .................................................................................... 49 State Costs ........................................................................................ 49 Local Impact ..................................................................................... 49 Overview of Program Activity ......................................................... 50
DRAFT
vii
Chapter 8 Shift in Biotechnology Investments Over Time ......................................... 59 Most Credits Are Awarded to a Relatively Small Number of Companies ..... 59 Credit Concentration Highly Correlated to Years of Program
Participation ...................................................................................... 59 General Assembly Has Expressed Concern Over Credit Distribution ....... 61 Program Has Become Less Open for Investments in New Companies ......... 62 New Entrants Are Likelier to Be Early-stage Companies ...................... 64 Application Process Favors Repeat Applicants ...................................... 64 Credit Provides Significantly Less Support to Early-stage Companies ......... 66 Companies Are Now Much More Dissimilar 68 Investments Now Occur Much Later in Company Development .................. 69 Shift Is Much Greater Than Other Programs .................................................. 70 Chapter 9 Credit Implementation and Process Issues ................................................ 73 Program Application Process ......................................................................... 73 Application Process Has Improvement but Challenges Remain .............. 73 Companies Now Have Two Months to Meet Program Requirements ........... 74 Some Companies Have Lower Than Expected Final Investments ................. 74 Credit Fencing Harms Other Companies .................................................. 76 Similarities with Heritage Structure Rehabilitation Program ................... 76 One Company Is the Source of Most Credit Fencing ............................... 77 PTE Applications Do Not Substantiate Investment Amount ................... 77 Lower Final Investments Are Associated with Poor Program Outcomes 77 Inside Investors Are Eligible to Claim Tax Credits ....................................... 78 Company Insider Credit Activity ............................................................. 78 Company Age Criterion Is Problematic ......................................................... 79 Commerce Does Not Verify That Investors Comply with Program Requirements . 80 Chapter 10 Impact of Credit on Companies and Capital ............................................. 81 Outcomes of Participating Companies ........................................................... 81 Most Companies Maintain a Maryland Presence ..................................... 81 Five-year Outcomes Are Less Positive .................................................... 82 Higher Company Failure Rates Should Be Expected ............................... 83 Credit Should Not Be Viewed as Direct Employment Credit ........................ 83 No Evidence Credit Has Increased Investment in Biotechnology Industry ... 84 Venture Capital in Massachusetts and California Outpaces Maryland .... 85 No Evidence Program Has Increased Industry Investment ............................ 86 No Evidence Credit Has Increased Company Formation and Net Growth .... 87 Chapter 11 Finding and Recommendations ................................................................... 89 There is No Evidence That the Credit Has Increased Investment in the
Biotechnology Industry .................................................................................. 89 State Tax Credit Is Not Coordinated with Other Programs ............................ 89
DRAFT
viii
The Legislative Intent and Performance Metrics of the Credit Are Not Defined ........................................................................................................... 90
Commerce Does Not Award Credits on a Competitive Basis ........................ 90 Biotechnology Clusters Are Preferred for Industry Growth .......................... 91 Maryland’s Biotechnology Investment Incentive Tax Credit Program Has a
Generous Credit .............................................................................................. 92 Company Insiders Are Not Prohibited from Receiving the Credit ................ 92 The Program Is Administratively Burdensome .............................................. 92 Pass-through Entities Fence Off Credits at the Expense of Other Companies ....... 93 Credit Provides Less Support to Early-stage Companies ............................... 94 Company Age Criterion Is Problematic ......................................................... 95 Recapture Provisions Are Not Enforced ........................................................ 95 Recapture Provisions May Unfairly Penalize Investors ................................. 96 The Program Appears to Be Underperforming in Its Ability to Attract
Out-of-state Investment .................................................................................. 96 Appendix 1 Security Exchange Commission Exemptions for Raising Private Capital ..... 97 Appendix 2 Biotechnology Companies, Total Tax Credits, and Years of Participation .... 98
DRAFT
ix
Executive Summary
Since the mid-1990s, the number of State
business tax credits has grown exponentially, as have related concerns about the actual benefits and costs of many of these credits. Although tax credits comprise a small percentage of total income tax revenues, the number and amount of credits claimed have significantly increased over time.
In response to concerns about the fiscal
impact of tax credits on State finances, Chapters 568 and 569 of 2012, the Tax Credit Evaluation Act, established a legislative process for evaluating certain tax credits. The evaluation process is conducted by a legislative evaluation committee that is appointed jointly by the President of the Senate and the Speaker of the House of Delegates. The Act requires that the biotechnology investment incentive tax credit be evaluated by the committee by July 1, 2018. To assist the committee in its work, the Department of Legislative Services (DLS) is required to evaluate the credit on a number of factors, including (1) the purpose for which the tax credit was established; (2) whether the original intent of the tax credit is still appropriate; (3) whether the tax credit is meeting its objectives; (4) whether the goals of the tax credit could be more effectively carried out by other means; and (5) the cost of the tax credit to the State and local governments.
Created by Chapter 99 of 2005, the
biotechnology investment incentive tax credit provides a refundable tax credit for investments in qualified biotechnology companies. The biotechnology investment incentive tax credit is a budgeted tax credit program subject to an annual overall budgetary limit. The program’s fiscal impact
has doubled over time due to an increase in the amounts appropriated to the program. In fiscal 2007, the first year of appropriations to the program, $6 million was provided. Program funding increased in several steps beginning in fiscal 2011, and the program has received $12 million annually since fiscal 2015.
The biotechnology industry faces unique
challenges. Biotechnology entrepreneurs require large amounts of laboratory space, costly equipment, and a team of experienced scientists. More than 90% of the biopharmaceutical industry is comprised of small, emerging companies, and most have either no operating income or negative operating income. A biotechnology company must also successfully navigate the time consuming and costly process of gaining federal regulatory approval.
This report provides an overview of the
biotechnology investment incentive tax credit, a comparison to other government incentive programs, credit implementation and process issues, how biotechnology investments have shifted over time, and the impact of the credit on companies and capital. An overview of the biotechnology industry, company lifecycle, and venture capital funding is also provided.
DLS makes several findings and
recommendations related to the biotechnology investment incentive tax credit as follows:
DRAFT
x
There is No Evidence That the Credit Has Increased Investment in the Biotechnology Industry
Whereas venture capital funding has trended upward nationally, Maryland venture capital funding has been volatile from year to year. The State has not closed the financing gap with industry leaders California and Massachusetts and has actually fallen further behind. DLS failed to find that the program led to a statistically significant increase in industry investment. Additionally, data collected by DLS fails to show that the State tax credit increased the total number of active biotechnology companies in Maryland. While the program is not effectively meeting its objective, DLS acknowledges the importance of providing financial assistance to early-stage biotechnology companies.
Recommendation: The General
Assembly should consider eliminating the program in its current form or allowing the tax credit to sunset in two years and replacing it with a more effective program based on the recommendations below. Alternatively, the General Assembly could consider providing a federal Small Business Innovative Research (SBIR) program matching grant to encourage the biotechnology industry in Maryland.
State Tax Credit Is Not Coordinated with Other Programs
Despite a significant overlap of funding
between the biotechnology investment incentive tax credit and the Maryland Technology Development Corporation (TEDCO) programs, there is no coordination between TEDCO and the Department of Commerce (Commerce). TEDCO does not have a formal mechanism to consider receipt
of State tax credits when making funding decisions. Conversely, TEDCO might determine that a company’s performance does not merit additional investment and/or may exit an initial investment, but the State may continue to provide funds via the tax credit. The biotechnology investment incentive tax credit program is also not coordinated with the federal SBIR program.
TEDCO’s objectives to help commercialize the results of scientific research and development conducted by entities and to promote new research activity and investments that lead to business development in Maryland align well with the presumed objectives of the biotechnology investment incentive tax credit program. TEDCO also has more flexibility than Commerce, and TEDCO already administers the Maryland Venture Fund and the biotechnology grant program.
Recommendation: Commerce should
coordinate biotechnology funding efforts with TEDCO. In addition, the General Assembly should explore the possibility of TEDCO administering the credit program. The Legislative Intent and Performance Metrics of the Credit Are Not Defined
Chapter 99 established the biotechnology investment incentive tax credit but did not specify a specific goal or intent for the credit. Without clearly defined goals and objectives, it is difficult to identify metrics and data requirements to evaluate the effectiveness of the tax credit.
Recommendation: The General Assembly should clearly define the intent
DRAFT
xi
and goals of the tax credit program in statute.
Recommendation: Commerce should define performance metrics for the program and periodically evaluate the program based on those metrics.
Recommendation: Considering the General Assembly’s interest in providing business opportunities for minority- and women-owned businesses, DLS recommends that the General Assembly require Commerce to report on the number of qualified companies that qualify as minority- and women-owned businesses. Commerce Does Not Award Credits on a Competitive Basis
The State tax credit program awards credits on a first come, first served basis if the company meets program requirements. DLS believes that the competitive processes established by the National Institutes of Health (NIH) and TEDCO are superior to the State tax credit program because these processes are more likely to achieve program goals, and TEDCO and NIH use criteria that better target the programs to their intended beneficiaries and desired program outcomes.
Since biotechnology investment incentive tax credits are currently issued on a first come, first served basis, the timing of application submissions determines funding outcomes. Commerce established a new online application system in fiscal 2018, which included a website feature that signaled the start of the application period. Several companies and organizations have expressed frustrations with the newly established process.
Recommendation: Because the first come, first served approach is deficient relative to the discretionary processes used by NIH and TEDCO and is less likely to allocate credits in a manner that maximizes program effectiveness, the General Assembly should require Commerce to implement a competitive award process using criteria to target desired program outcomes. Implementing a competitive award process would eliminate timing issues associated with a first come, first served approach. Biotechnology Clusters Are Preferred for Industry Growth
Biotechnology clusters are ideal for industry growth due to access to capital and a quality workforce. However, the State provides an enhanced 75% credit if the qualified biotechnology company in which an investment is made is located in Allegany, Dorchester, Garrett, or Somerset counties.
The State provides other tax credit
programs that target economic development in rural areas, such as the job creation tax credit that provides an enhanced credit for jobs created in revitalization zones. Multiple programs providing inconsistent incentives do not provide clear signals that help influence business decisions in the desired manner.
Recommendation: Considering the advantages of biotechnology clusters and the existence of other State programs that target economic development in areas designated for revitalization, the General Assembly should eliminate the enhanced credit for investments in Allegany, Dorchester, Garrett, or Somerset counties.
DRAFT
xii
Maryland’s Biotechnology Investment Incentive Tax Credit Program Has a Generous Credit
Maryland’s credit (50%, with an enhanced credit of 75% in certain counties) is more generous than most programs in other states. Of the current or recent programs, the median tax credit value was 33%, with the most common value between 20% and 33%. States that provide an enhanced credit tend to provide only an additional 5 or 10 percentage points, unlike Maryland which provides 25 additional percentage points if the investments are within Allegany, Dorchester, Garrett, or Somerset counties.
Recommendation: The General
Assembly should lower the credit percentage to 33%. If the General Assembly chooses to keep the enhanced credit, it should only be an additional 10 percentage points. Company Insiders Are Not Prohibited from Receiving the Credit
Insider investors likely have a strong personal stake in the firm’s success and may invest regardless of the tax credit. To be eligible for the biotechnology investment incentive tax credit the qualified investor may not, after making the proposed investment, own or control more than 25% of the equity interests in the qualified company. Otherwise, there is no prohibition on claiming the credit for owners, employees, or family members of those individuals. DLS examined investor data and found company insider participation in about one-half of the companies, some of which had extensive participation, and the average insider
investment was made eight years after the company’s start of operations. About two-thirds of the investment identified as being made by company insiders occurred well into the company’s development.
Recommendation: The General Assembly should consider restricting owners or employees of a qualified company or those with a pre-existing fiduciary relationship with the company from qualifying for the credit after the company has been in business for five years as these individuals may have invested in the business regardless of the tax credit. The Program Is Administratively Burdensome
Administering the biotechnology investment incentive tax credit requires processing company and investor applications and having staff conduct a science review to verify that the company meets the program’s requirements related to proprietary technology. Other states authorize the administering agency to charge application fees that are used to defray program administrative costs for similar tax credit programs. Like most State tax credit programs, Maryland does not impose a fee for the biotechnology investment incentive tax credit.
Chapters 475 and 476 of 2017 generally provide an additional two months for an applicant that does not currently meet specified program requirements to qualify as a biotechnology company. Given the recent enactment of this statute, it is not possible to determine its impact; however, Commerce has advised that the statute may complicate credit verification, lead to confusion, and
DRAFT
xiii
could delay the awarding of credits at the beginning of each fiscal year.
Recommendation: To recoup some of its administrative costs, the General Assembly should require Commerce to charge an application fee for a company to apply to qualify and allow a portion of the program’s appropriation to be used to cover the administrative costs of processing investor applications. Charging a fee may dissuade companies that will not likely be a qualifying company within two months from applying, thus reducing some administrative burden for Commerce.
Recommendation: Commerce should advise the General Assembly by January 1, 2019, on the impact of allowing an applicant an additional two months to qualify as a biotechnology company. Pass-through Entities Fence Off Credits at the Expense of Other Companies
At least one and possibly several more companies are using pass-through entities (PTE) to fence off credits in order to gain an advantage over other applicants. The company often does not have finalized investor agreements at the time of application and will later seek investments to fulfill the credit allotment, but often fails to do so. This practice confers an advantage to the credit fencing company at the expense of other companies and increases the number of companies whose investors are denied funding.
Additionally, many of the applications submitted by the PTEs established to fence credits do not substantiate the total proposed
investment amount. The applications either contain information on each investment from the PTE investors that in total are far less than the proposed total investment or do not have any information at all. Despite lacking this information, Commerce has awarded these PTEs substantial initial credit certificates.
Recommendation: If the General
Assembly does not adopt a competitive award process for the biotechnology investment incentive tax credit program, Commerce should require PTEs to provide more investment information on their applications, and Commerce should also comment on ways to limit or eliminate credit fencing. Credit Provides Less Support to Early-stage Companies
The program provides less financial support to newly formed companies than it did at its inception. Altering the program eligibility standards, from an original limit of 10 years to up to 24 years of operation, has allowed later stage companies with significantly more capabilities in raising capital to participate in the program. The percentage of program funding provided to new entrants has fallen to 23% in fiscal 2017, and new applicants were much less likely to be funded than repeat applicants. Compared to repeat applicants, new applicants are more likely to be startup or early-stage companies, have raised few if any rounds of investment, have much lower company valuations, and have a less established company leadership with fewer company assets.
In addition, companies have become
much more dissimilar over time. Whereas in the beginning of the program most companies were newly formed and in similar
DRAFT
xiv
stages of development, some companies are now much more established and have achieved significant development milestones. Despite the increased difference in company characteristics and the higher risk associated with newly formed companies, the program provides the same subsidy to investments made in more established and therefore less risky companies.
Recommendation: The General
Assembly should set aside a portion of the tax credit funds for new investments in early-stage companies since these companies face more financing challenges than more established companies.
Recommendation: Since a few
companies have received most of the program’s funding, the General Assembly should place both an annual limit and a lifetime limit on credits for investments in a single company. Commerce recommended establishing a lifetime limit of $7.0 million on the total credits that could be claimed with respect to each company and to alter the fiscal year company limitation from 15% of the year’s appropriation to $1.5 million. Company Age Criterion Is Problematic
The program does not require a company to be independent in order to qualify for the program, nor does the program take into account the founding or combined employment of all affiliated companies. Commerce advises that if a company merely changes its name, the start of active business looks back to the original company formation. However, DLS identified one instance in which a recent company
participant was originally established in 1993 but changed its name in 2006. Although regulations required a company to provide a factual narrative describing the company from its inception through the date of the application, no further information regarding affiliate companies or prior names is required.
One of the program’s weaknesses is that
its design and implementation are indifferent to the significant variation across participating companies. Companies are in different development stages, ranging from startups that do not generate revenue to profitable companies that have raised significant investment.
Recommendation: The General
Assembly should consider criterion other than company age, such as excluding companies over a specified revenue threshold.
Recommendation: Since investments
in more developed companies are less risky than investments in newly formed companies, the General Assembly should consider lowering the percentage value of the credit for more established companies.
Recommendation: Commerce should
require companies to report on affiliated companies and prior names.
Recapture Provisions Are Not Enforced
The credit may be recaptured if, within two years from the close of the taxable year for which the credit is claimed, (1) the qualified investor sells, transfers, or otherwise disposes of the ownership interest in the qualified Maryland biotechnology
DRAFT
xv
company that gave rise to the credit; or (2) the qualified Maryland biotechnology company that gave rise to the credit ceases operating as an active business with its headquarters and base of operations in the State. However, Commerce does not verify if these recapture events have been triggered or otherwise require investors to provide evidence that the investment has been held for the minimum required period of time.
Recommendation: Commerce, in
collaboration with the Comptroller’s Office, should adopt formal mechanisms to ensure compliance of the credit recapture provisions.
Recapture Provisions May Unfairly Penalize Investors
The program should encourage entrepreneurship and appropriate risk-taking. Having a recapture provision for a company that goes out of operations may contradict with encouraging appropriate risk-taking. If a company decides to relocate out-of-state, investors are liable for repaying the credit, but investors may not have any say in that relocation decision.
Recommendation: The General
Assembly should delete the recapture provision that the credit may be recaptured if, within two years from the close of the taxable year for which the credit is claimed, the company ceases operating as an active business with its headquarters and base of operations in the State. Instead, the General Assembly should require that if a company moves its headquarters and base of operations outside of the State, the company should be responsible for repaying the State for credits claimed by its investors.
The Program Appears to Be Underperforming in Its Ability to Attract Out-of-state Investment
The program appears to be underperforming in its ability to attract investment from major sources of Maryland biotechnology investment including California, Massachusetts, New York, and from overseas investors. The lack of investment from these states likely reflects competition from other biotechnology companies and the correlation between program knowledge and physical distance.
Recommendation: Commerce should comment on its efforts to market the program to nonresidents, particularly in California, Massachusetts, and New York.
DRAFT
1
Chapter 1. Overview and Background of the Biotechnology Investment Incentive Tax Credit
Overview
Since the mid-1990s, the number of State business tax credits has grown significantly, as have related concerns about the actual benefits and costs of many of these credits. Although the reduction in State revenues from tax credits is generally incorporated in the State budget, most tax credits are not subject to an annual appropriation as required for other State programs. However, several of the larger credits that have been more recently established are subject to a budget appropriation, including the heritage structure rehabilitation tax credit and State reimbursement for one-half of the local property tax credit costs under the enterprise zone tax credit program. Reporting information for State tax credits varies. Under certain tax credit programs, agencies are required to publish specified information about the credit on an annual basis. Every other year, the Department of Budget and Management (DBM) is required to prepare a statement of the estimated amount by which exemptions from all types of State taxation reduces revenues.
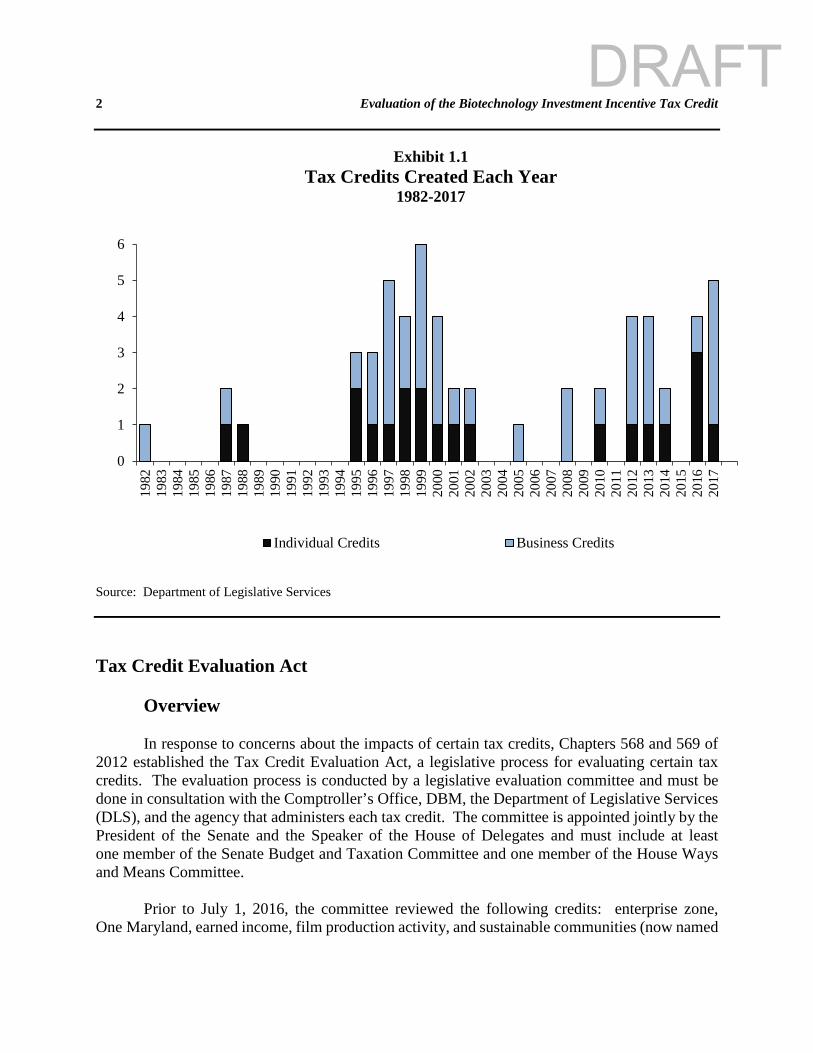
Although tax credits comprise a small percentage of total income tax revenues, Exhibit 1.1 shows that the number and amount of credits claimed has increased over time. Prior to 1995, there was 1 credit for individuals (earned income credit) and 2 primarily business tax credits (enterprise zone and Maryland-mined coal credits). Since 1995, 34 tax credits primarily for businesses and 19 tax credits primarily for individuals have been established. This includes temporary and expired tax credits. Twenty-nine of the credits were established between 1995 and 2002. More recently, 19 credits have been established since 2012, including 9 primarily for businesses. The total amount of credits has increased from a little less than $50 million in tax year 1994 to about $250 million in tax year 2008. Most of this increase has been due to an increase in tax credits for individuals, and in particular earned income credits, which have increased almost five-fold since 1994.
DRAFT
2 Evaluation of the Biotechnology Investment Incentive Tax Credit
Exhibit 1.1
Tax Credits Created Each Year 1982-2017
Source: Department of Legislative Services Tax Credit Evaluation Act
Overview
In response to concerns about the impacts of certain tax credits, Chapters 568 and 569 of 2012 established the Tax Credit Evaluation Act, a legislative process for evaluating certain tax credits. The evaluation process is conducted by a legislative evaluation committee and must be done in consultation with the Comptroller’s Office, DBM, the Department of Legislative Services (DLS), and the agency that administers each tax credit. The committee is appointed jointly by the President of the Senate and the Speaker of the House of Delegates and must include at least one member of the Senate Budget and Taxation Committee and one member of the House Ways and Means Committee.
Prior to July 1, 2016, the committee reviewed the following credits: enterprise zone,
One Maryland, earned income, film production activity, and sustainable communities (now named
0
1
2
3
4
5
6
1982
1983
1984
1985
1986
1987
1988
1989
1990
1991
1992
1993
1994
1995
1996
1997
1998
1999
2000
2001
2002
2003
2004
2005
2006
2007
2008
2009
2010
2011
2012
2013
2014
2015
2016
2017
Individual Credits Business Credits
DRAFT
Chapter 1. Overview and Background of the Biotechnology Investment Incentive Tax Credit 3 heritage structure rehabilitation). Chapter 582 of 2016 altered the Tax Credit Evaluation Act so that the following credits are required to be reviewed by the date indicated: • July 1, 2017: businesses that create new jobs and job creation; • July 1, 2018: research and development and biotechnology investment incentive; and • July 1, 2019: Regional Institution Strategic Enterprise Zones and cybersecurity investment
incentive.
Chapter 582 made additional changes to the tax credit evaluation process. It required the agency that administers a tax credit subject to evaluation to provide information to and otherwise cooperate with DLS and the evaluation committee. The Act also altered the date by which DLS must publish an evaluation of the credit from October 31 to November 15 and the date by which the evaluation committee must hold a public hearing on the evaluation report from December 14 to December 31. Additionally, the Act eliminated the requirement that, in lieu of a specified evaluation date, a credit must be evaluated in the year preceding the termination date of the credit. Lastly, Chapter 582 increased the time period from five to seven years that a tax credit designated for evaluation under the Tax Credit Evaluation Act is subject to reevaluation.
Chapter 149 of 2017 altered the Tax Credit Evaluation Act to require the review of the
More Jobs for Marylanders tax credit by July 1, 2021.
Biotechnology Investment Incentive Tax Credit Program Credit Value and Funding Chapter 99 of 2005 established the biotechnology investment incentive tax credit program, which offers a refundable income tax credit for investments in qualified biotechnology companies. An investor who invests at least $25,000 in a qualified Maryland biotechnology company (QMBC) can claim a credit equal to 50% of the investment, not to exceed $250,000. If the qualified biotechnology company is located in Allegany, Dorchester, Garrett, or Somerset counties, the value of the credit for investments made in these companies is equal to 75% of the investment, not to exceed $500,000. The Department of Commerce (Commerce) administers the tax credit application, approval, and certification process and is required to submit an annual report to the Governor and the General Assembly detailing specified information about the tax credit. Commerce may not certify investments in a single biotechnology company that total more than 15% of the total appropriations to the reserve fund for that fiscal year. The fiscal 2018 operating budget includes $12 million in funding for the program.
DRAFT
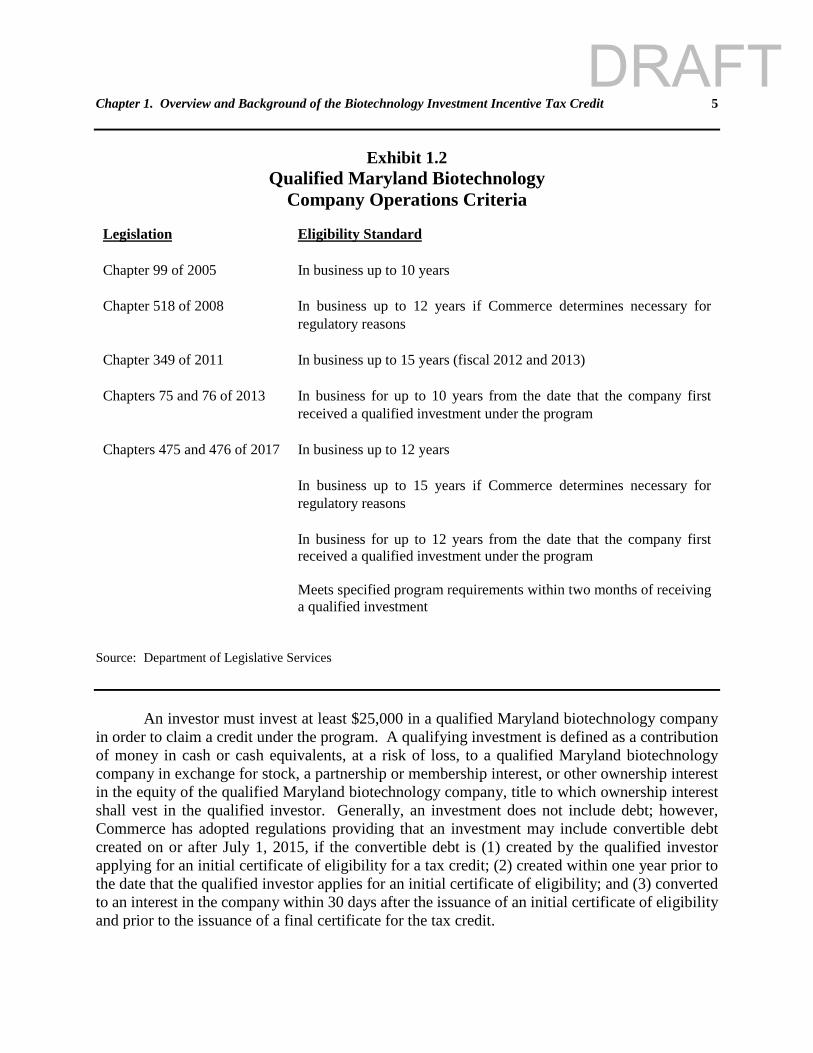
4 Evaluation of the Biotechnology Investment Incentive Tax Credit Qualifications A qualified Maryland biotechnology company is a company organized for profit that is primarily engaged in, or within two months will be primarily engaged in, the research, development, or commercialization of innovative and proprietary technology that comprises, interacts with, or analyzes biological material including biomolecules (DNA, RNA, or protein), cells, tissues, or organs. A company is any entity of any form duly organized and existing under the laws of any jurisdiction for the purpose of conducting business for profit. A company does not include a sole proprietorship. A qualified Maryland biotechnology company also must (1) have its headquarters and base of operations in the State; (2) have fewer than 50 full-time employees; (3) not have its securities publicly traded on any exchange; and (4) have been certified as a biotechnology company by Commerce. Generally, in order to be considered eligible as a qualified Maryland biotechnology company, the company may not have been in active business longer than 12 years. However, eligibility related to the length of time in active service has been expanded since the program’s inception to include (1) a company that has been in active business for up to 15 years if Commerce determines that the company requires additional time to complete the process of regulatory approval; (2) a company that has been in active business no longer than 12 years from the date that the company first received a qualified investment under this section; and (3) a company that meets specified program requirements within two months of receiving a qualified investment. Accordingly, biotechnology companies that have been in active business for up to 24 years may be eligible for the program. Exhibit 1.2 shows the change, from 10 years to a maximum of 24 years, in eligibility criteria since the program’s inception. In order to be eligible for the credit, an investor must be (1) current in all State and local tax obligations; (2) not in default in any State or local contract; and (3) for companies, be in “good standing” with the jurisdiction in which it is organized and with the State and authorized or registered to do business in the State. A qualified pension plan, individual retirement account, or other qualified retirement plan under the Employee Retirement Income Security Act of 1974, as amended, or fiduciaries or custodians under such plans, or similar tax-favored plans or entities under the laws of other countries may not qualify for the credit. A qualified investor may not, after making a proposed investment, own or control more than 25% of the equity interests in the qualified Maryland biotechnology company in which the investment is to be made.
DRAFT
Chapter 1. Overview and Background of the Biotechnology Investment Incentive Tax Credit 5
Exhibit 1.2 Qualified Maryland Biotechnology
Company Operations Criteria Legislation Eligibility Standard Chapter 99 of 2005 In business up to 10 years
Chapter 518 of 2008 In business up to 12 years if Commerce determines necessary for
regulatory reasons
Chapter 349 of 2011 In business up to 15 years (fiscal 2012 and 2013)
Chapters 75 and 76 of 2013 In business for up to 10 years from the date that the company first received a qualified investment under the program
Chapters 475 and 476 of 2017 In business up to 12 years In business up to 15 years if Commerce determines necessary for regulatory reasons In business for up to 12 years from the date that the company first received a qualified investment under the program Meets specified program requirements within two months of receiving a qualified investment
Source: Department of Legislative Services
An investor must invest at least $25,000 in a qualified Maryland biotechnology company in order to claim a credit under the program. A qualifying investment is defined as a contribution of money in cash or cash equivalents, at a risk of loss, to a qualified Maryland biotechnology company in exchange for stock, a partnership or membership interest, or other ownership interest in the equity of the qualified Maryland biotechnology company, title to which ownership interest shall vest in the qualified investor. Generally, an investment does not include debt; however, Commerce has adopted regulations providing that an investment may include convertible debt created on or after July 1, 2015, if the convertible debt is (1) created by the qualified investor applying for an initial certificate of eligibility for a tax credit; (2) created within one year prior to the date that the qualified investor applies for an initial certificate of eligibility; and (3) converted to an interest in the company within 30 days after the issuance of an initial certificate of eligibility and prior to the issuance of a final certificate for the tax credit.
DRAFT
6 Evaluation of the Biotechnology Investment Incentive Tax Credit
Application and Verification Process In order to claim eligibility for the tax credit and to be initially certified as eligible for the
tax credit, an investor must submit an application to Commerce at least 30 days before making an investment in a qualified Maryland biotechnology company. The application must include certain taxpayer information and information concerning the qualified Maryland biotechnology company in which an investment is to be made. Commerce reviews and processes applications and makes allocations of available tax credits on a first come, first served basis in the order in which individual applications are received. Within 30 days after the date of an initial certificate, the qualified investor must make the investment in the qualified Maryland biotechnology company. The qualified investor must then provide notice to Commerce within 10 days after the date on which the investment is made. Commerce issues a final certificate to the qualified investor within 30 days after the investor files the notice of investment. If a qualified investor fails to provide the notice and proof of the making of the investment within 40 days after the date on which Commerce issues an initial certificate, Commerce rescinds the certificate, and the credit amount allocated to the rescinded certificate is made available for allocation by Commerce to other applicants.
The credit may be recaptured if within two years from the close of the taxable year for
which the credit is claimed (1) the qualified investor sells, transfers, or otherwise disposes of the ownership interest in the qualified Maryland biotechnology company that gave rise to the credit; or (2) the qualified Maryland biotechnology company that gave rise to the credit ceases operating as an active business with its headquarters and base of operations in the State.
Within four years after the close of the taxable year for which a tax credit is certified,
Commerce may require an applicant or holder of a certificate to provide any information specified in a written directive for the purpose of determining the initial or continuing eligibility of the holder or applicant for tax credits. In addition, within four years after the close of any taxable year for which a tax credit is approved with respect to an investment in a qualified Maryland biotechnology company, Commerce may require the biotechnology company to provide the department any information for the purpose of determining the company’s initial or continuing eligibility for certification as a qualified Maryland biotechnology company.
Legislative Changes As previously indicated, Chapter 99 established the biotechnology investment incentive
tax credit program by creating a tax credit against the State income tax for individuals, corporations, and venture capital firms that invest in qualified Maryland biotechnology companies. A “qualified Maryland biotechnology company” was defined as a biotechnology company that has (1) its headquarters and base of operations in Maryland; (2) fewer than 50 employees; and (3) been in business for less than 10 years. The value of the credit equaled 50% of an eligible investment made in a qualified biotechnology company during the taxable year. The maximum amount of the credit could not exceed (1) $50,000 for individuals and (2) $250,000 for corporations and venture capital firms. A taxpayer claiming the credit could claim a refund in the amount by which the credit exceeds the tax liability in the year it is claimed. Chapter 99 also established a tax credit
DRAFT
Chapter 1. Overview and Background of the Biotechnology Investment Incentive Tax Credit 7 application and certification procedure and created a reserve fund into which the Governor was required to annually appropriate funds beginning in fiscal 2007; however, no specific amount was mandated.
Chapter 518 of 2008 made several changes to the tax credit program relating to eligibility,
the maximum value of the credit, procedures for claiming the credit, and administration of the credit. Chapter 518 altered the definition of “qualified Maryland biotechnology company” to include a biotechnology company in existence for up to 12 years if Commerce determined that the company required additional time to complete the process of regulatory approval. In addition, the Act specified that a biotechnology company cannot be a publicly traded company. Furthermore, the Act altered provisions concerning the calculation of the credit, providing that any entity that is required to file an income tax return in any jurisdiction and invests at least $25,000 in a qualified biotechnology company can claim a credit equal to 50% of the investment, not to exceed $250,000.
Chapters 605 and 606 of 2009 clarified several provisions related to the biotechnology
investment tax credit program, accelerated applicability of the changes to the program enacted under Chapter 518, and altered the time period in which the credit can be recaptured.
Chapter 349 of 2011 expanded eligibility for the credit by specifying that, for credits in
fiscal 2012 and 2013, a biotechnology company could be in active business for up to 15 years. Chapters 75 and 76 of 2013 added an additional exception to the 10-year limitation on
operations by generally allowing a company to qualify for tax credits for up to 10 years after the first investment by an investor eligible to receive the tax credit.
Chapter 503 of 2016 increased the value of the biotechnology investment tax credit if the
qualified biotechnology company in which an investment is made is located in Allegany, Dorchester, Garrett, or Somerset counties.
Chapters 475 and 476 of 2017 expanded eligibility for the biotechnology investment tax
credit by specifying that a biotechnology company is a company that has been in active business for a maximum of (1) 12 years; (2) 12 years from the date that the company first received a qualified investment under the program; or (3) 15 years if Commerce determines that the company needs additional time to complete the process of regulatory approval. In addition, Chapters 475 and 476 specified that a biotechnology company includes a company that meets specified program requirements within two months of receiving a qualified investment and provides for recapture of the credit if the entity does not satisfy this requirement.
DRAFT

8 Evaluation of the Biotechnology Investment Incentive Tax Credit
DRAFT
9
Chapter 2. Intent and Objectives of the Biotechnology Investment Incentive Tax Credit
Intent of the Biotechnology Investment Incentive Tax Credit Chapter 99 of 2005 established the biotechnology investment incentive tax credit but did not specify a specific goal or intent for the credit. However, a review of the legislative history for Chapter 99 supports the conclusion that, at its outset, the General Assembly intended the credit to encourage the growth of the State’s biotechnology industry and stimulate private-sector investment in the State. Supporters of the 2005 legislation noted that in a 2001 report prepared by Ernst & Young, LLP, entitled Venture Capital Climate for Bioscience in Maryland, Maryland ranked last in venture capital investment relative to the number of biotechnology companies in other states. In addition, that report found that a private venture capital funding gap “appear[ed] to exist for all funding amounts, though the gap appear[ed] most prominent in situations where companies are seeking larger financing amounts, such as those in excess of $3 million.” The report further noted that the funding gap existed even after including investments made by existing State programs. Proponents of the 2005 legislation touted the proposed tax credit as a way to assist emerging-growth biotechnology firms already located in the State to prosper and expand, as well as an incentive to encourage biotechnology companies located in other states to consider moving to Maryland. In its written testimony, the Maryland Chamber of Commerce touted that the Act would provide an incentive for investors to invest early-stage funds so that those startup businesses [could] develop and create the high paying and sustainable jobs that [would] result. In supporting later revisions to the tax credit program, Johns Hopkins University noted that, “[b]efore the biotechnology credit was created, existing biotechnology companies continually experienced significant difficulties in accessing venture capital and other needed cash flow for their research enterprises.” The university noted that although the program had not resolved the issue entirely, the program had “been a resounding success in attracting and cultivating venture capital investment” in the biotechnology field. The university advocated “support [of] fledgling companies in their earlier [stages to] encourage the formation of startups in the State, and the hiring of personnel to implement the work.” Similarly, the Tech Council of Maryland and local economic development organizations supported statutory changes to continue providing incentives for investors to invest in “early-stage” or “seed-stage” biotechnology companies. An emphasis on the importance of the credit program to early-stage biotechnologies continued in testimony before the General Assembly during the consideration of subsequent legislation. In conjunction with the growth of the biotechnology industry in the State, the General Assembly has also intended for the development and preservation of intellectual property in the State. Advocates of the credit have noted that the State benefits from royalties generated on the sales of products by successful biotechnology ventures. For example, in the case of
DRAFT
10 Evaluation of the Biotechnology Investment Incentive Tax Credit 20/20 GeneSystems, which received early funding from the State’s Technology Development Corporation, the State receives royalties on the sales of the BioCheck product. Advocates have suggested that the credit not only serves to attract out-of-state companies to Maryland but also encourages companies founded in Maryland to remain in the State. In support of revisions to the tax credit, Johns Hopkins Institutions noted that the tax credit provides incentives for companies to locate or co-locate their businesses in the East Baltimore Life Sciences Park on the Johns Hopkins Montgomery County Campus in an effort to partner with Johns Hopkins researchers and the University System of Maryland’s research parks. Advocates have also noted that, as home to the National Institutes of Health, the federal Food and Drug Administration, and robust institutions of higher education, the State is in a unique position to attract scientific talent from around the world and qualified biotech human resources; the credit leverages those assets to encourage the development of proprietary technologies in the bioscience field. The General Assembly has also codified its desire to further the development of intellectual property in the definition of “biotechnology company” by requiring a biotechnology company to be “engaged in the research, development, or commercialization of innovative and proprietary technology.” The Department of Commerce (Commerce) has likewise reflected this goal in the department’s regulations. For example, under provisions governing procedures for the certification of a qualified Maryland biotechnology company, the department requires the application for certification to include, among other information, statements or descriptions of the company’s intellectual property assets, plans for predictable progression of its innovative product as research, development and production milestones, and commercialization plans. Moreover, in order to become certified as a qualified Maryland biotechnology company, the company must own or have immediately available and useable rights in biotechnology-related intellectual property and be actively engaged in research, development, or production of a commercially oriented, innovative, and patent protectable biotechnology product. In addition, the company must provide evidence with its application that its existing or proposed biotechnology product is innovative and has the potential for commercial sale. The company must generally own the intellectual property or have exclusive rights to the use of the intellectual property. In addition to a desire to encourage the growth of the State’s biotechnology industry and an increase in venture capital investment in the State, the General Assembly intended that the credit also encourage economic development and job growth. For example, in advocating for revisions to the credit program in 2008, Johns Hopkins Institutions noted its “interest” in the program in relation to “the technologies and invocations discovered by [its] faculty and the commercialization of those inventions to benefit the State’s economy.” Similarly, other advocates for the program have repeatedly touted that support of biotechnology companies would allow those companies to create “high paying and sustainable jobs.” Advocates also suggested that the program would increase revenue to the State from both the businesses and the individuals employed by those businesses. Moreover, proponents of 2016 legislation providing an enhanced tax credit for investments in qualified biotechnology companies located in Allegany, Dorchester, Garrett, or Somerset counties considered the program a tool for economic development; these advocates suggested that the legislation would “strengthen economic prosperity” in those jurisdictions, “develop and spread [the] critical [biotechnology] industry across Maryland,” and attract the
DRAFT
Chapter 2. Intent and Objectives of the Biotechnology Investment Incentive Tax Credit 11 industry to “jurisdictions where average median household income tends to lag behind other areas of Maryland.” Beginning in 2011, the General Assembly pursued legislation expanding eligibility for the biotechnology investment incentive tax credit by altering the definition of “qualified Maryland biotechnology company.” In supporting the expansion of the definition to include, for fiscal 2012 and 2013, a biotechnology company that has been in active business for up to 15 years, proponents of the legislation – including the former Department of Business and Economic Development –indicated that the legislation was necessary to assist “mature, but more struggling” biotechnology companies that had struggled in raising investments during the economic recession in “navigat[ing]” the difficult capital market and avoiding collapse during that “fiscally challenging time.” However, although multiple biotechnology companies strongly supported the 2013 expansion of the definition, arguing that the legislation reflected the original intent of the General Assembly and maintaining that the existing eligibility criteria could be arbitrary and not align to the typical business cycle of a biotechnology company, both Commerce and the Greater Baltimore Committee argued that the 2013 legislation conflicted with the original intent of the program. Commerce stressed that the intent of the program was to benefit “early-stage and startup” companies and that, to date, the program has been effective in “ensuring Maryland’s most promising young biotechnology companies [were] able to secure investment capital.” The department suggested that allowing a company to qualify for the program for an extended period of time and thereby benefit from increased program funding “could prevent the distribution of funds from reaching as many companies as possible.” Similarly, the Greater Baltimore Committee (GBC) noted that “the original intent of the bioscience tax credit was to provide incentives for qualified investors to assist ‘startup’ bioscience companies or those companies that are traversing the ‘valley of death’––that difficult stage of a company’s maturation when it is actively developing a product but has not achieve the level of performance where it is ready to go to ‘market’.” GBC expressed “concern” that the program had been “tinkered with repeatedly since its passage” and opined that “re-examining the biotech tax credit every year and suggesting changes that benefit some companies is not a sound, long term strategy”; the commission advocated instead that both the legislature and industry “take a step back” to evaluate the effectiveness of the program. Despite these concerns, the General Assembly expanded eligibility for the program in both 2013 and 2017.
DRAFT

12 Evaluation of the Biotechnology Investment Incentive Tax Credit
DRAFT
13
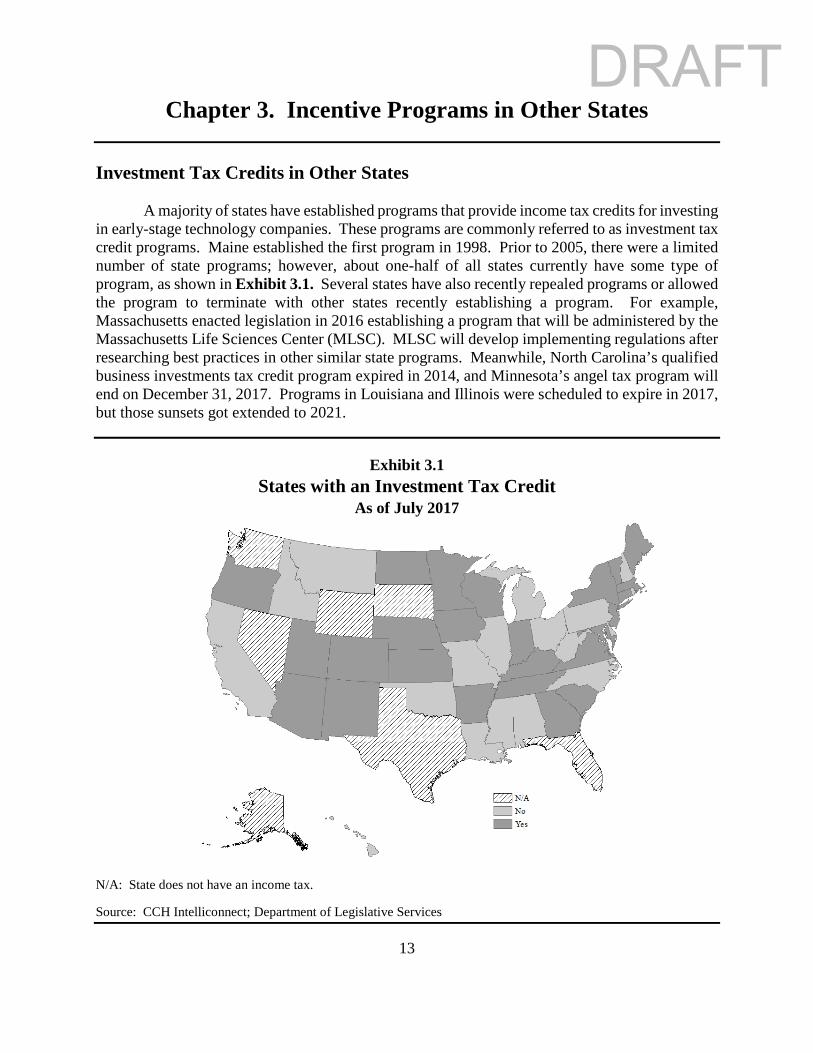
Chapter 3. Incentive Programs in Other States Investment Tax Credits in Other States A majority of states have established programs that provide income tax credits for investing in early-stage technology companies. These programs are commonly referred to as investment tax credit programs. Maine established the first program in 1998. Prior to 2005, there were a limited number of state programs; however, about one-half of all states currently have some type of program, as shown in Exhibit 3.1. Several states have also recently repealed programs or allowed the program to terminate with other states recently establishing a program. For example, Massachusetts enacted legislation in 2016 establishing a program that will be administered by the Massachusetts Life Sciences Center (MLSC). MLSC will develop implementing regulations after researching best practices in other similar state programs. Meanwhile, North Carolina’s qualified business investments tax credit program expired in 2014, and Minnesota’s angel tax program will end on December 31, 2017. Programs in Louisiana and Illinois were scheduled to expire in 2017, but those sunsets got extended to 2021.
Exhibit 3.1 States with an Investment Tax Credit
As of July 2017
N/A: State does not have an income tax.
Source: CCH Intelliconnect; Department of Legislative Services
DRAFT
14 Evaluation of the Biotechnology Investment Incentive Tax Credit
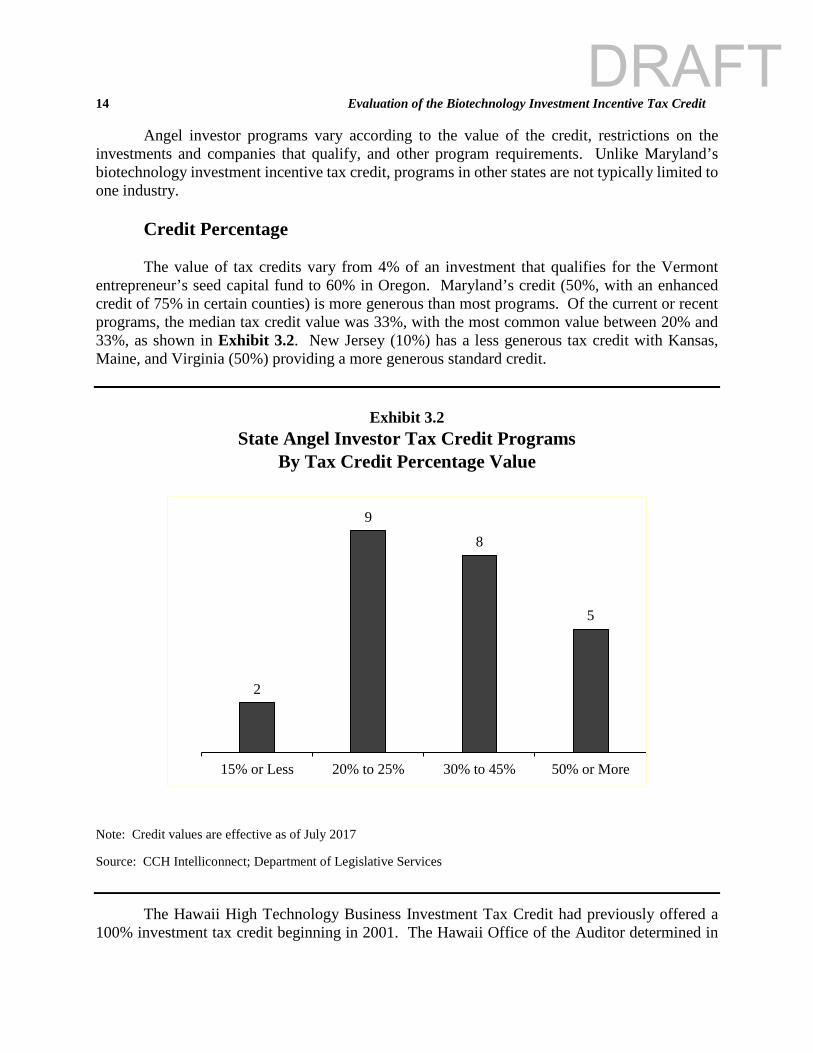
Angel investor programs vary according to the value of the credit, restrictions on the investments and companies that qualify, and other program requirements. Unlike Maryland’s biotechnology investment incentive tax credit, programs in other states are not typically limited to one industry. Credit Percentage The value of tax credits vary from 4% of an investment that qualifies for the Vermont entrepreneur’s seed capital fund to 60% in Oregon. Maryland’s credit (50%, with an enhanced credit of 75% in certain counties) is more generous than most programs. Of the current or recent programs, the median tax credit value was 33%, with the most common value between 20% and 33%, as shown in Exhibit 3.2. New Jersey (10%) has a less generous tax credit with Kansas, Maine, and Virginia (50%) providing a more generous standard credit.
Exhibit 3.2 State Angel Investor Tax Credit Programs
By Tax Credit Percentage Value
Note: Credit values are effective as of July 2017
Source: CCH Intelliconnect; Department of Legislative Services
The Hawaii High Technology Business Investment Tax Credit had previously offered a 100% investment tax credit beginning in 2001. The Hawaii Office of the Auditor determined in
2
9
8
5
0
2
4
6
8
10
15% or Less 20% to 25% 30% to 45% 50% or More
DRAFT
Chapter 3. Incentive Programs in Other States 15 two audits that despite the “flawed high-technology tax credit law” reducing revenues by at least $857 million (and possibly double that amount in later estimates) the state will never know the extent of the credit’s success as the program lacked information to measure its effectiveness. Further, the auditor compared best practices to the program and its subsequent amendments and “found them to be sorely deficient.” The program terminated in 2010. Maryland’s Enhanced Credit Is More Generous
Several states, including Maryland, provide an enhanced credit for investments within certain designated areas. Investments in Arizona, Colorado, Nebraska, and Ohio may qualify for an additional 5 percentage points if the investment is within a distressed or otherwise specified community. Massachusetts provides an additional 10 percentage points if the investment is in a gateway municipality, and investments within a designated distressed Tennessee county qualify for an additional 17 percentage points. North Dakota does not have a geographically targeted credit but instead increases the standard credit from 25% to 35% if the qualified company is based in North Dakota and meets certain requirements.
By comparison, Maryland’s enhanced credit for investments within Allegany, Dorchester,
Garrett, or Somerset counties provides 25 additional percentage points, thereby increasing the credit value by one-half for investments in companies in those counties. Holding Period Requirements
The State biotechnology incentive investment tax credit requires that qualifying investments must be held for two years, or the credit is subject to recapture. The Department of Legislative Services could not identify specific holding period requirements in about one-half of all state programs. Most states with specific provisions require that investments must be held for at least three years, except in Georgia and New Jersey, which have similar requirements as Maryland. New York doubles the value of its credit to 20% if the taxpayer certifies that the investment will not be sold or otherwise disposed of for nine years following the first year in which the credit is claimed. Even though state programs may not specify a minimum holding period, certain private equity investments may be subject to federal regulations that require minimum holding periods that generally range from six months to one year.
Prohibitions on Investors
States appear to be concerned about insider investment activity, as most states prohibit tax credits if the individual who makes an investment has certain connections to the business. The most common restriction is related to employees or family members. For example, Georgia’s tax credit must be recaptured if, within two years after the qualified investment was made, the investor or the investor’s spouse, parent, sibling, or child, or a business controlled by any of these individuals, provides services of any nature to the qualified business for compensation, whether as an employee, a contractor, or otherwise. Michigan’s program prohibits taxpayers related to the
DRAFT
16 Evaluation of the Biotechnology Investment Incentive Tax Credit owners or employees of a qualified business or those with a pre-existing fiduciary relationship with the business. Tennessee prohibits pass-through entities from qualifying for its tax credit.
A 2014 evaluation of the Minnesota angel investor tax credit program found that 42% of
survey respondents were a founder, executive, principal, or board member of the businesses in which an investment was made, and 10% were an immediate family member of one. The evaluation stated that these investors have a strong personal stake in the firm’s success and may have invested regardless of the tax credit. Subsequent to the evaluation, Minnesota enacted legislation that removed program eligibility for an individual who is an officer of the business or who, in combination with their family members, own or control 20% or more of the business.
Likewise, neighboring states have restrictions on who qualifies as a program investor. In West Virginia, investments do not qualify for the credit when ownership of the company is substantially related to the taxpayer or if the board of directors of the company is controlled by the taxpayer. In Virginia, an investment does not qualify if the taxpayer who holds an investment, any of the taxpayer’s family members, or any entity affiliated with the taxpayer receives or has received compensation from the qualified business in exchange for services provided to the business as an employee, officer, director, manager, or independent contractor within one year before or after the date of the investment.
In Maryland, to be eligible for the biotechnology investment incentive tax credit, the
qualified investor may not, after making the proposed investment, own or control more than 25% of the equity interests in the qualified company. Otherwise, there is no prohibition on owners, employees, or family members of those individuals from claiming the credit.
Requirements for a Qualified Business Most states target small startup businesses by placing requirements and restrictions on
which businesses can qualify for the investment tax credits. The common method is limiting the maximum number of employees. Four states restrict credit eligibility to businesses that employ fewer than 25 employees, Maryland and Louisiana’s credits require fewer than 50 full-time employees, and another five states require fewer than 100 employees. Additionally, a majority of states have limits related to the revenue or assets of the business. A business in Kansas, New Mexico, or North Carolina generally must have less than $5 million in revenue. Among other requirements, Iowa and Kentucky specify that the net worth of a business cannot exceed $10 million.
Maryland does not have any revenue or asset restrictions, but the program requires a
company to have been in active business for a maximum period of time. Other states with similar provisions are more restrictive. For example, Connecticut requires that a business may operate for less than 7 consecutive years. In Georgia, a qualified business must be organized no more than 3 years before the qualified investment was made. In Kansas, a qualified business must be operating for less than 5 years (10 years if the business is a bioscience business).
DRAFT
Chapter 3. Incentive Programs in Other States 17
Maximum Credit Most states limit the maximum value of tax credits that can be claimed by a taxpayer. The maximum value in about one-half of states is below $250,000 per investor, with five states that have a maximum credit of $50,000. Several states lack a maximum credit value but limit the credit in other ways, such as limiting the number of investments per business or placing a maximum annual limit on program credits. Compared to other states, Maryland’s standard credit is typical, with the enhanced maximum credit value above the average of other programs.
Program Fees
In at least 10 states, the credit administering agency is authorized to charge application fees that are used to defray program administrative costs. A fee of a few hundred dollars is generally charged or authorized in Connecticut, Indiana, Maine, and Michigan. Louisiana’s application fee ranges from $500 to $15,000 based on the value of the tax credit.
Maryland does not impose a biotechnology investor fee, a company application fee, or a
certification fee. Most State tax credit programs do not charge fees except for the Heritage Structure Rehabilitation Tax Credit Program. These fees are projected to generate about $300,000 in fiscal 2018. Credits in Nearby States
Of Maryland’s nearby states, only Virginia has an active angel investor tax credit program. However, several states have established other programs that encourage venture capital as discussed below. In addition, legislation has been introduced to propose programs. In Delaware, legislation introduced in the 2017 legislative session proposes to establish a 25% angel investor tax credit with $5 million in annual funding. Virginia Investment Credit
The Virginia qualified equity and subordinated debt investments credit provides a credit equal to 50% of a qualified business investment. A business must have annual gross revenues of less than $3 million and raised a total of less than $3 million in equity or debt investments. The business must be in a specified technology-related field, have its principal office or facility located in Virginia, and be engaged in business primarily in or doing substantially all of its production in Virginia. The maximum aggregate annual amount of credits is limited to $5 million. Expired Programs
West Virginia provided a tax credit for investing in a qualified research and development
company for calendar 2005 to 2008. Eligibility was limited based on gross receipts and annual payroll, and the company was required to have its corporate headquarters in the state. The credit
DRAFT
18 Evaluation of the Biotechnology Investment Incentive Tax Credit was equal to 50% of the investment, and a maximum of $1 million in aggregate credits could be claimed each year.
The North Carolina Qualified Business Investment Tax Credit allowed an individual who
purchased the equity securities or subordinated debt of a qualified business to claim a tax credit equal to 25% of the amount invested, subject to maximum limits. An aggregate total of $7.5 million in tax credits could be claimed annually. The program terminated in 2014. Other Venture Capital Programs
While the District of Columbia does not currently provide an angel investor tax credit, the District of Columbia has a certified capital company (CAPCO) program that intends to increase private capital investment in small businesses. Insurance companies may earn premium insurance tax credits equal to the total debt and equity investment in the CAPCO. The CAPCOs use this investment to provide capital to businesses that meet program qualifications. A 2009 program audit found that the program was poorly managed and did not maximize economic development in the District of Columbia. In response to these findings, legislation enacted in 2010 implemented several of the audit’s recommendations. The program is generally similar to the InvestMaryland program, which funded State investments in early-stage technology companies by providing insurance premium tax credits to companies that contribute capital to the program.
The New Pennsylvania Venture Capital Investment program is a $60 million fund that provides loans to venture capital companies that make investments in Pennsylvania companies. The program allocates 50% of the funds to venture capital within historically underserved areas. The program requires a match of $3 of investment for every $1 provided by the program. The New Pennsylvania Venture Guarantee program allows the state to more actively partner with the venture capital community by guaranteeing up to $250 million of the first losses of equity investments made in Pennsylvania companies. These investment guarantees are designed to leverage additional private venture capital investments. The Innovate in Pennsylvania Venture Investment Program seeks to address the financing needs of technology-oriented businesses by increasing the amount of risk capital. Lastly, The Ben Franklin Technology Development Authority Venture Investment program provided funds to venture capital partnerships investing in early-stage Pennsylvania technology companies.
DRAFT
19
Chapter 4. Biotechnology Industry and Company Lifecycle Biotechnology Industry in the United States United States Is Global Leader
Biotechnology, broadly defined, uses living organisms or their products for commercial purposes. The industry traces its beginnings to two scientific breakthroughs in genetic engineering – the 1953 discovery of the structure of DNA and the invention of recombinant-DNA technology in 1973. In 1980, the U.S. Supreme Court ruled that genetically modified life forms can be patented, thereby establishing a commercial market for these products. The industry has grown rapidly and its achievements have been significant – the mapping of the human genome; the cloning of animals; DNA fingerprinting; and the development of synthetic insulin, human growth hormone, and therapeutic drugs to treat cancer, multiple sclerosis, cystic fibrosis, and HIV.
The United States has been and remains the global biotechnology industry leader. Recent industry publications rank the United States first as measured by total companies, patent applications, and research and development (R&D) expenditures. In 2015, the U.S. biotechnology industry spent almost $27 billion on R&D expenses, about eight times the next highest country. The number of companies in the United States has grown exponentially, from a handful in the 1970s to more than 11,000 in recent years. Further, 8 of the world’s 10 largest biotechnology companies are based in the United States. Other statistics show the importance of the industry, as publicly traded American biotechnology companies are capitalized in excess of $860.0 billion, and venture capital investments have also recently increased, averaging $14.4 billion in recent years. The industry employs more than 1.7 million people with average earnings that are about 85% higher than the overall private-sector average.
Biotechnology Industry Is Clustered within Regions
The biotechnology industry is concentrated in a few regions of the country that are ideal for industry growth. Analysts commonly cite access to capital and a quality workforce as the most critical factors. Many of these clusters are anchored by notable research institutions such as universities, research hospitals, and government agencies. The leading biotechnology clusters in Boston/Cambridge and the San Francisco Bay area arose in the early days of the industry and continue to be ranked as the best by most publications as the clusters aggregate more and more talent and capital. Both have elite medical research institutions that not only excel in research and generating patents – each cluster has generated more than 3,000 biotechnology-related patents within the last decade – but also in commercializing these discoveries.
Given its proximity to the Silicon Valley venture capital community, many notable early biotechnology companies began in the San Francisco Bay area. The Boston/Cambridge area
DRAFT
20 Evaluation of the Biotechnology Investment Incentive Tax Credit receives more National Institutes of Health (NIH) funding than any other metropolitan area and has world-class universities and research hospitals as well as a highly skilled workforce. Other notable regional clusters include San Diego, Seattle, Raleigh-Durham, Philadelphia, New York City/New Jersey, the Maryland/DC metropolitan area, and Los Angeles.
Biotechnology Industry’s Importance to Maryland
Maryland is home to a number of firsts in the biotechnology industry: mapping of the human genome, a rapid test for the Ebola virus, and a U.S. Food and Drug Administration (FDA) approved blood test for colon cancer. In addition, Maryland is the global leader in adult stem cell production and vaccine development. The Maryland/DC metropolitan area is typically ranked as between the fourth and sixth leading biotechnology cluster in the country, with more than 2,360 life science companies and dozens of major research facilities including Johns Hopkins University, the nation’s top academic recipient of federal research grant funding, and the University of Maryland. The State’s highly educated workforce typically ranks first nationally in the percentage of professional and technical workers, and the availability of laboratory space is another strength.
An additional asset is the number of federal institutions responsible for setting standards, approving products for sale to the U.S. market, and funding for research. These include, most notably, FDA and NIH and also include the Frederick National Lab for Cancer Research, the U.S. Army Medical Research Institute of Infectious Diseases, and the Walter Reed National Military Medical Center. These agencies are also a source of the industry’s workforce and entrepreneurs. The biohealth industry employs over 41,000 people in Maryland, with wages of approximately $4.3 billion in 2016.
In recognition of the industry’s impact on Maryland, the General Assembly established the Maryland Life Sciences Advisory Board in 2007. The board is tasked with developing a comprehensive strategic plan for the life sciences and promoting life science research, development, commercialization, and manufacturing. In 2016, the board set a goal of making Maryland a top three biohealth ecosystem by 2023. The report also identified four priorities: (1) leverage and grow the current asset base and accelerate commercialization; (2) increase the connectivity among and awareness of Maryland’s biohealth assets and resources; (3) increase the availability and access to capital at each phase of the biohealth lifecycle; and (4) grow the talent pool of experienced biohealth entrepreneurs, business leaders, graduates, and scientists with commercially relevant experience. Biotechnology Industry Faces Unique Challenges
The biotechnology industry faces unique challenges, even when compared to other high-tech sectors. Unlike the proverbial software developer who establishes a major company from a garage, biotechnology entrepreneurs require large amounts of laboratory space, costly
DRAFT
Chapter 4. Biotechnology Industry and Company Lifecycle 21 equipment, and a team of experienced scientists. R&D spending as a percentage of sales is relatively high in both pharmaceuticals (13%) and medical devices (12%) but is especially high in biotechnology (23%).
Two other factors intensify the challenges of successfully securing adequate capital. First,
more than 90% of the biopharmaceutical industry is comprised of small, emerging companies. Most companies either have no operating income or negative operating income. Second, in order to sell a product that generates revenue and ultimately profits, a biotechnology company must successfully navigate the time consuming and costly process of gaining federal regulatory approval.
For drug candidates in particular, the ability to secure capital is constrained by the
combination of long product development times of up to 12 years, significant technical challenges, expenses that can total a billion dollars, a high failure rate, a lack of cash flow, and the limited resources of many small emerging companies. Due to these factors, traditional loans are usually not an option for many businesses, and venture capital investors are often unwilling to provide early capital. Companies employ different strategies to overcome these financing challenges, including securing financing from a variety of sources throughout the company’s early development.
A company’s success depends on a number of factors, including the ability of the
company’s scientists and leadership team to commercialize the promise of the core technology and the experience of company investors. However, most commonly, analysts and company leaders typically cite the lack of sufficient capital as the biggest challenge. Even though emerging companies are a major source of innovation, research has found that the considerable financial constraints facing technology firms can dampen innovation.
DRAFT
22 Evaluation of the Biotechnology Investment Incentive Tax Credit FDA Approval Process
Most Tax Credit Participants Require FDA Approval The Department of Commerce (Commerce) advises that most of the companies that
participate in the biotechnology investment incentive tax credit program are developing products or devices that require federal regulatory approval. Most commonly, companies are developing biologic drugs and must submit a biologics license application with FDA. Companies that are developing medical devices must also seek FDA approval. Commerce advises that the drug therapy approval process takes longer and is more costly. The medical device sector has shorter product development lifecycles (typically 18 to 24 months compared to about 10 years for drug therapies), smaller research expenditures, a greater emphasis on development over research, a lower likelihood of external licensing agreements, and higher profitability and returns to investors.
FDA Drug Therapy Approval Process Is Lengthy and Costly
After conducting basic research that identifies a drug therapy, a company will conduct
preclinical trials. After this, the company will begin the lengthy and costly process of seeking FDA approval. Clinical trials are conducted in four different phases, but Phase III is the most costly and critical as therapies that receive this approval are typically granted final FDA approval. This not only signals the drug therapy’s efficacy and potential to FDA and researchers but also to investors. Once clinical trials are completed, the company submits a new drug application or biologics license application. In 2016, the median approval time for this application was 10.1 months, or 8.0 months if a priority. Over the last 25 years, FDA has considerably reduced the approval processing time.
It is typically at least 10 years before a drug therapy receives FDA approval. Analysts
estimate that this process costs between $800 million and several billion dollars. Clinical trials comprise most of these research and development costs and are generally more expensive in each subsequent phase. Due to more limited resources, new and/or smaller companies may focus on niche drugs that have both fewer costs and lower potential payouts.
There are four phases of clinical trials, but Phase IV is conducted after the therapy has
received FDA approval. The first three phases are: • Phase I: Studies are usually conducted with healthy volunteers and emphasize product
safety. The goal is to discover frequent and serious adverse events. The study typically lasts for several months and has between 20 to 80 participants.
• Phase II: Studies gather preliminary data on the drug’s effectiveness (whether the drug
works in people who have a certain disease or condition). The observed effectiveness is typically compared to a control group. Safety continues to be evaluated, and short-term adverse events are often discovered. The study typically lasts from several months to two years and has between a few dozen to about 300 participants.
DRAFT
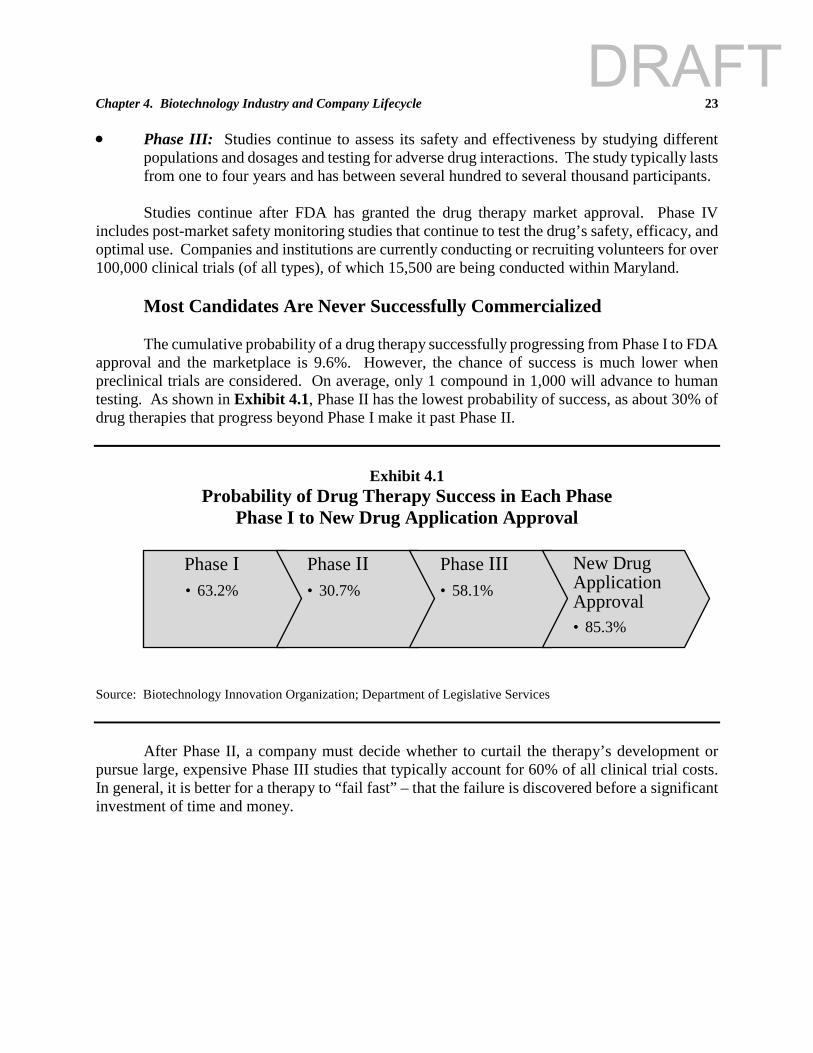
Chapter 4. Biotechnology Industry and Company Lifecycle 23 • Phase III: Studies continue to assess its safety and effectiveness by studying different
populations and dosages and testing for adverse drug interactions. The study typically lasts from one to four years and has between several hundred to several thousand participants.
Studies continue after FDA has granted the drug therapy market approval. Phase IV includes post-market safety monitoring studies that continue to test the drug’s safety, efficacy, and optimal use. Companies and institutions are currently conducting or recruiting volunteers for over 100,000 clinical trials (of all types), of which 15,500 are being conducted within Maryland.
Most Candidates Are Never Successfully Commercialized The cumulative probability of a drug therapy successfully progressing from Phase I to FDA
approval and the marketplace is 9.6%. However, the chance of success is much lower when preclinical trials are considered. On average, only 1 compound in 1,000 will advance to human testing. As shown in Exhibit 4.1, Phase II has the lowest probability of success, as about 30% of drug therapies that progress beyond Phase I make it past Phase II.
Exhibit 4.1 Probability of Drug Therapy Success in Each Phase
Phase I to New Drug Application Approval
Source: Biotechnology Innovation Organization; Department of Legislative Services
After Phase II, a company must decide whether to curtail the therapy’s development or
pursue large, expensive Phase III studies that typically account for 60% of all clinical trial costs. In general, it is better for a therapy to “fail fast” – that the failure is discovered before a significant investment of time and money.
Phase I• 63.2%
Phase II• 30.7%
Phase III• 58.1%
New Drug Application Approval• 85.3%
DRAFT
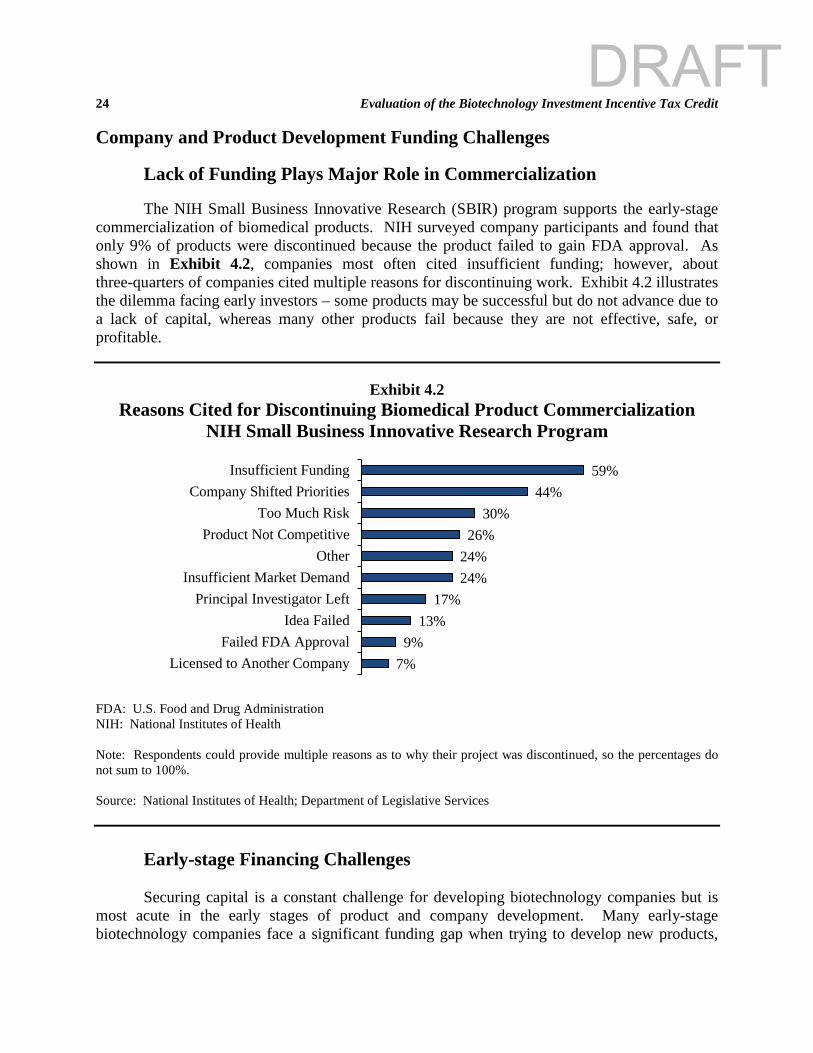
24 Evaluation of the Biotechnology Investment Incentive Tax Credit Company and Product Development Funding Challenges Lack of Funding Plays Major Role in Commercialization
The NIH Small Business Innovative Research (SBIR) program supports the early-stage commercialization of biomedical products. NIH surveyed company participants and found that only 9% of products were discontinued because the product failed to gain FDA approval. As shown in Exhibit 4.2, companies most often cited insufficient funding; however, about three-quarters of companies cited multiple reasons for discontinuing work. Exhibit 4.2 illustrates the dilemma facing early investors – some products may be successful but do not advance due to a lack of capital, whereas many other products fail because they are not effective, safe, or profitable.
Exhibit 4.2 Reasons Cited for Discontinuing Biomedical Product Commercialization
NIH Small Business Innovative Research Program
FDA: U.S. Food and Drug Administration NIH: National Institutes of Health Note: Respondents could provide multiple reasons as to why their project was discontinued, so the percentages do not sum to 100%. Source: National Institutes of Health; Department of Legislative Services
Early-stage Financing Challenges Securing capital is a constant challenge for developing biotechnology companies but is
most acute in the early stages of product and company development. Many early-stage biotechnology companies face a significant funding gap when trying to develop new products,
7%9%
13%17%
24%24%
26%30%
44%59%
0% 10% 20% 30% 40% 50% 60% 70%
Licensed to Another CompanyFailed FDA Approval
Idea FailedPrincipal Investigator Left
Insufficient Market DemandOther
Product Not CompetitiveToo Much Risk
Company Shifted PrioritiesInsufficient Funding
DRAFT
Chapter 4. Biotechnology Industry and Company Lifecycle 25 particularly drug therapies, from preclinical development to a proof of concept clinical trial. The funding gap that prevents the development of promising technologies and can cause a business to fail is commonly referred to as the valley of death.
NIH broadly defines the valley of death as “the period of transition when a developing
technology is deemed promising, but too new to validate its commercial potential and thereby attract the capital necessary for its continued development.” The complexity of each company’s situation and differing challenges across the industry (medical devices compared to drug discovery) prevents precise identification of the point at which companies have successfully bridged the funding gap. However, the valley of death is commonly described as beginning at the company’s formation and is the time period in which companies experience steeply negative cash flows and a rapidly declining total cash position reflecting the significant costs of clinical trials. Other researchers conclude it typically ends at Phase II trials or the point at which the company develops its first revenue-producing product.
During the early stages of this funding gap, the new technology is not proven and has significant, often unquantifiable risks. These risks include technical, scientific, and regulatory risks as well as market risks. Even if the product can be developed and is safe, it may not be profitable. This imbalance of risk and reward is a major factor that prevents companies from securing sufficient private investment.
Sources of Investment Vary Based on Company Development Biotechnology companies are formed to capitalize on narrowly focused ideas. These ideas
or technologies are typically identified during the process of conducting basic research that usually does not have a commercial objective. The federal government is the most significant source of external funding for this research. Even though this support has declined in the last decade, NIH, the National Science Foundation, and the Department of Defense annually provide billions in funding. Foundations and medical philanthropy are also important sources of funding and often support research into specific diseases or conditions.
Although basic research typically does not have a commercial objective, the results can
create intellectual property that can be patented. Biotechnology companies are formed to commercialize this intellectual property. Support from the government, foundations, and medical philanthropy continue to be important sources of funding during this phase. Government support includes the NIH SBIR program and seed investment programs such as those operated by the Maryland Technology Development Corporation. In addition to the importance of this early capital, these programs can help validate the company and its technology, thereby making it easier for the company to attract private investment.
Government-funded incubators and accelerators also assist entrepreneurs with some of the
typical challenges facing new, resource limited companies. Incubators typically provide programs, services, and space based on company needs and incubator policies. The State currently has 14 bio-incubators that offer early-stage companies shared resources, business assistance, and access to equipment and facilities. Accelerators help new entrepreneurs gain the skills,
DRAFT
26 Evaluation of the Biotechnology Investment Incentive Tax Credit mentorship, and advice needed to grow a company. Accelerators are extremely competitive and typically make seed-stage investments in a company in exchange for equity in the company. Maryland currently has five accelerators that focus on biotechnology, technology, or health information technology.
Friends, family, and founders are a critical source of early funds for companies. These
investments are relatively modest, typically under $50,000, but are often large enough to get the company through the earliest stage. As the need for capital intensifies, a company may seek external investments from angel investors and networks who are often the only external private source of funds. In 2016, about 300,000 angel investors made a total of $21.3 billion in early-stage investments, with about 10% of these investments made in the biotechnology industry.
Given the uncertainty over the new technology, investors are often unwilling to provide
capital until the company makes technical and regulatory progress. As a company clears regulatory and technical challenges and begins early commercialization of its product, the company is “de-risked” and its technology is validated. The companies begin to attract private investment; however, ever increasing expenses related to product development and the FDA approval process require greater investment. Venture capital financing is the primary source of private funding for medical devices and the second most important for biotechnology (after debt). However, venture capital firms typically do not invest in companies that are in the early stages of development.
Exhibit 4.3 illustrates the typical sources of capital during the early stages of a
biotechnology company’s development. A company that progresses beyond these stages of development is usually viewed as an established or a mature biotechnology company.
DRAFT
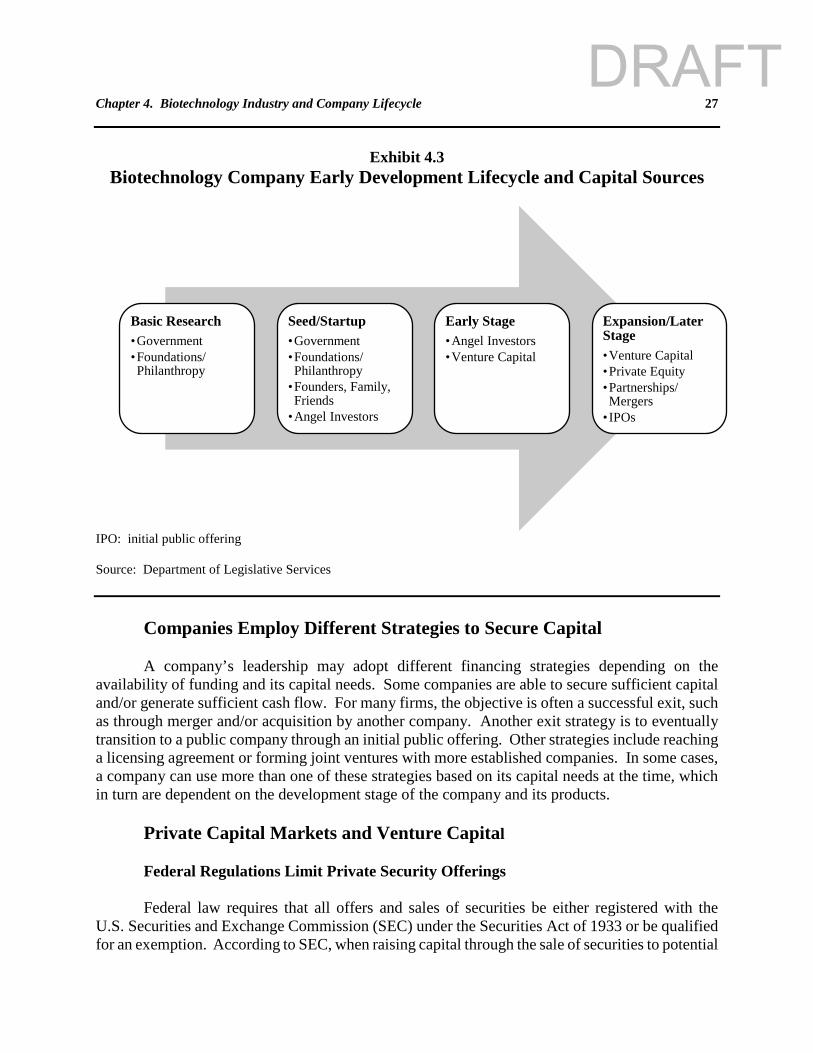
Chapter 4. Biotechnology Industry and Company Lifecycle 27
Exhibit 4.3 Biotechnology Company Early Development Lifecycle and Capital Sources
IPO: initial public offering Source: Department of Legislative Services
Companies Employ Different Strategies to Secure Capital A company’s leadership may adopt different financing strategies depending on the
availability of funding and its capital needs. Some companies are able to secure sufficient capital and/or generate sufficient cash flow. For many firms, the objective is often a successful exit, such as through merger and/or acquisition by another company. Another exit strategy is to eventually transition to a public company through an initial public offering. Other strategies include reaching a licensing agreement or forming joint ventures with more established companies. In some cases, a company can use more than one of these strategies based on its capital needs at the time, which in turn are dependent on the development stage of the company and its products.
Private Capital Markets and Venture Capital Federal Regulations Limit Private Security Offerings Federal law requires that all offers and sales of securities be either registered with the
U.S. Securities and Exchange Commission (SEC) under the Securities Act of 1933 or be qualified for an exemption. According to SEC, when raising capital through the sale of securities to potential
Basic Research•Government•Foundations/ Philanthropy
Seed/Startup•Government•Foundations/ Philanthropy
•Founders, Family, Friends
•Angel Investors
Early Stage•Angel Investors•Venture Capital
Expansion/Later Stage•Venture Capital•Private Equity•Partnerships/ Mergers
• IPOs
DRAFT
28 Evaluation of the Biotechnology Investment Incentive Tax Credit investors in the public capital market (a public offering), the issuer must generally register the offer and sale of securities with SEC, a process that requires extensive information and additional subsequent reporting. Alternatively, a private biotechnology company can raise capital by accessing private capital markets through an unregistered (private) offering in a transaction exempt from registration. This path allows private companies to avoid certain regulatory burdens and the increased oversight that comes with a public offering, with the intended effect of reducing issuance costs and the time required to raise new capital. This particularly benefits smaller firms for whom accessing public capital markets may generally be too costly. However, because of these accommodations, private offering alternatives are generally subject to investor restrictions and/or offering limits. These investor protection provisions must be met to qualify for an exemption from registration.
Given that less than 3% of the 28 million U.S. companies are publicly listed, private
security offerings are crucial to capital formation, particularly for small and emerging businesses that often create new jobs and develop new innovations. SEC estimates that in calendar 2014, registered public securities raised $1.35 trillion in new capital compared to $2.1 trillion in private equity offerings.
The private security restrictions limit the types and number of investors who can purchase
the private securities (generally limited to sophisticated or accredited investors whose income and financial net worth exceeds certain thresholds). There are also limitations on the amount of funds that can be raised. For example, companies may qualify for a seed capital exemption that limits to $5 million the total amount of securities that may be offered in a 12-month period. Appendix 1 provides more detail on these limitations. Venture Capital Financing Rounds Investors provide a loan or acquire equity in the company in exchange for making the investment, and companies will often use the money to achieve a specific goal or objective. In the earliest stage of the company’s financing, seed capital is used to start the business and is often contributed by company founders and principals and the friends and family of those individuals.
After a company has used its seed capital, it will offer early rounds of investment, beginning with Series A financing. Venture capitalists and angel investors are the main purchasers of Series A equities. Early R&D (preclinical to Phase I) account for 74% of Series A venture dollars. A company will offer additional funding rounds (Series B, C, D, etc.) as necessary to meet its capital needs and the time needed to bridge the point at which it can generate sufficient cash flow to meet its financing needs. Within each round a company may offer multiple funding rounds. As shown in Exhibit 4.4, these financing rounds can be used to delineate the company’s development during its growth phase – Series A (early stage), Series B and C (expansion), and Series D and beyond (later stage).
DRAFT
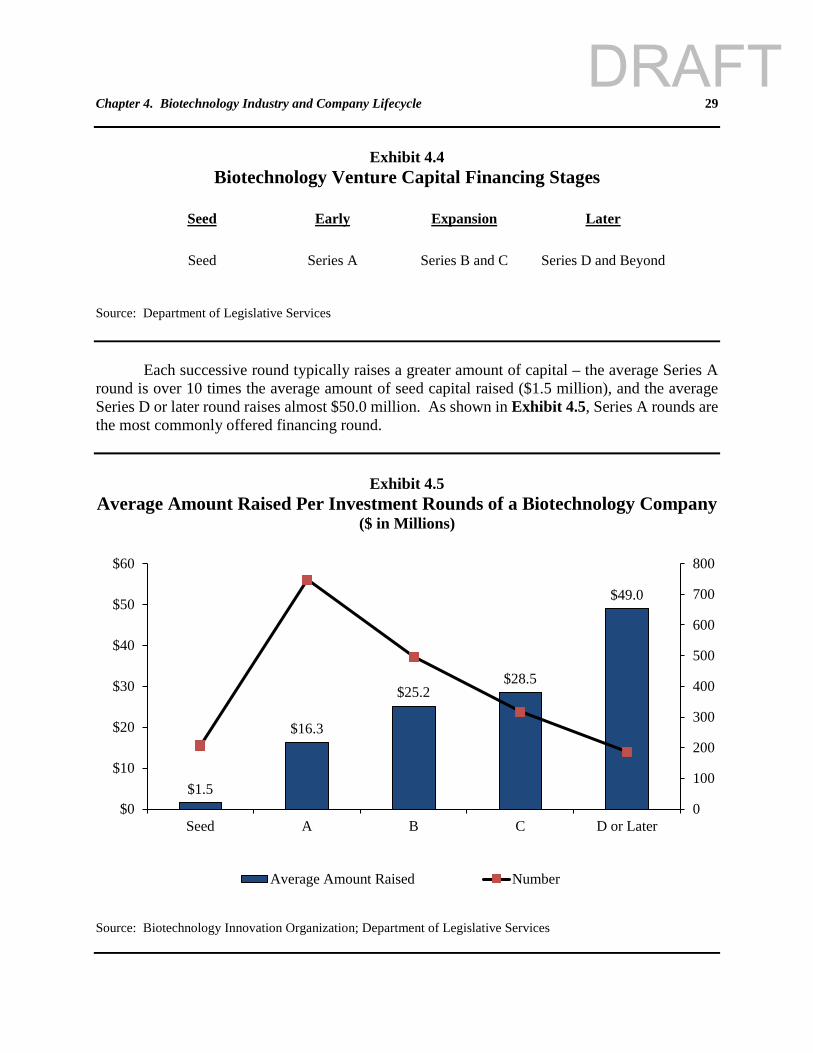
Chapter 4. Biotechnology Industry and Company Lifecycle 29
Exhibit 4.4 Biotechnology Venture Capital Financing Stages
Seed Early Expansion Later
Seed Series A Series B and C Series D and Beyond
Source: Department of Legislative Services
Each successive round typically raises a greater amount of capital – the average Series A round is over 10 times the average amount of seed capital raised ($1.5 million), and the average Series D or later round raises almost $50.0 million. As shown in Exhibit 4.5, Series A rounds are the most commonly offered financing round.
Exhibit 4.5 Average Amount Raised Per Investment Rounds of a Biotechnology Company
($ in Millions)
Source: Biotechnology Innovation Organization; Department of Legislative Services
$1.5
$16.3
$25.2$28.5
$49.0
0
100
200
300
400
500
600
700
800
$0
$10
$20
$30
$40
$50
$60
Seed A B C D or Later
Average Amount Raised Number
DRAFT

30 Evaluation of the Biotechnology Investment Incentive Tax Credit
DRAFT
31
Chapter 5. Biotechnology Venture Capital Funding Venture Capital Is an Important Source of Funding for New Tech Companies
Venture capital is a form of financing that is used primarily by young, innovative, and high-risk companies. Venture capitalists seek to identify promising innovations with high growth potential. Venture capital can leverage a small amount of capital that helps create a large number of new fast growing and innovative companies. In addition to providing capital in order to help bring these innovations to the marketplace, venture capitalists can also provide mentorship, strategic guidance, network access, and other support.
Venture capital investments are highly speculative – most of the companies that receive
funding will ultimately fail. Because the investments are risky, venture capitalists will diversify their portfolios, thereby increasing the chances that one investment will generate significantly large returns that offset the losses on other investments. Since 1979, federal regulations have allowed pension funds to invest in venture capital firms, thereby significantly increasing the pool of venture capital and its importance as a source of funding for new, fast-growing companies.
The Stanford Graduate Business School recently assessed the industry’s importance since
the federal regulatory change. The analysis concluded that of the 1,330 public U.S. companies founded between 1979 and 2013, 574, or 43%, are considered venture-capital backed companies. Moreover, the analysis found that venture capital was particularly important for innovation and technology – companies receiving venture capital investments accounted for 82% of the total research and development of new public companies.
Venture Capital Investment in U.S. Companies Has Recently Rebounded
Venture capital funding peaked in 2000 at about $100 billion but decreased significantly after the dotcom stock market crash of 2001. Venture capital funding totaled $15.5 billion in calendar 2002, according to the Moneytree Report produced by PricewaterhouseCoopers. Total funding increased slowly until tailing off once again during the Great Recession. However, funding has since returned to pre-recession levels, growing significantly beginning in 2014, and totaling $62.7 billion in calendar 2016.
Maryland Ranks High in the Ability to Attract Venture Capital
Since 2002, about 800 venture capital deals have resulted in a total investment of $7.7 billion for Maryland companies. Several organizations rank each state’s ability to attract venture capital investments relative to the state’s economic output or total worker earnings. In its 2014 State New Economy Index, the Information Technology and Innovation Foundation ranked Maryland seventh highest in venture capital investments. In the 2016 State and Technology and
DRAFT
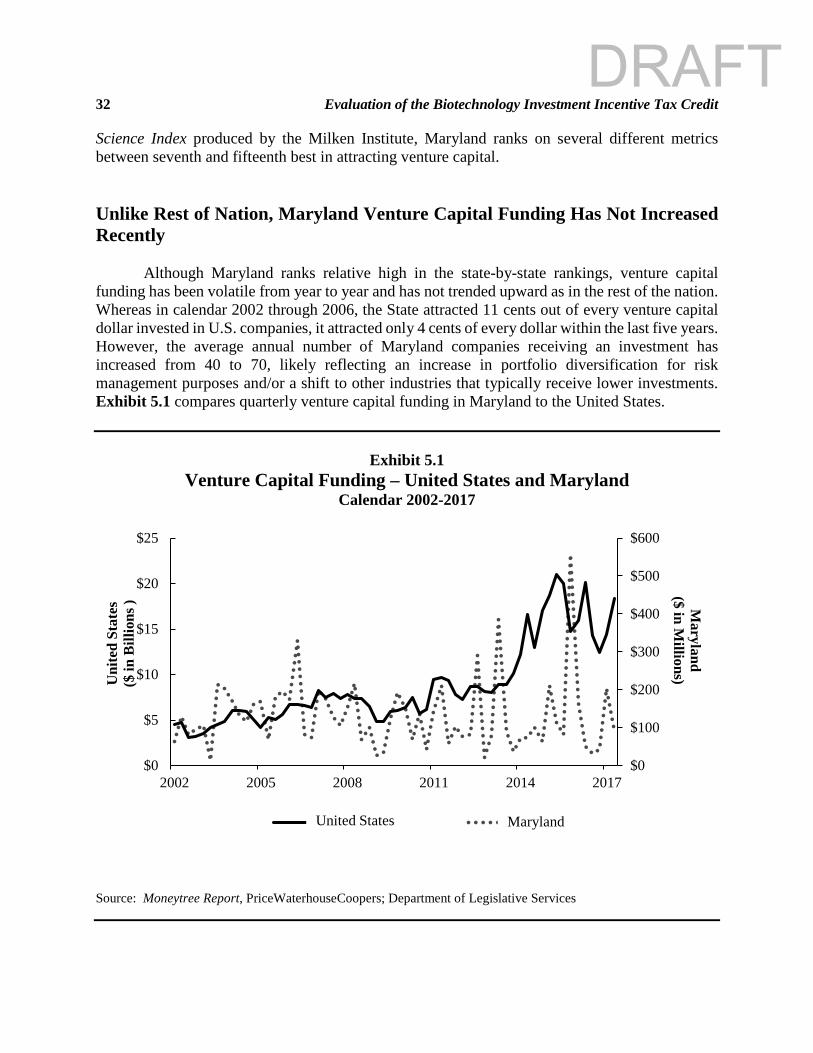
32 Evaluation of the Biotechnology Investment Incentive Tax Credit Science Index produced by the Milken Institute, Maryland ranks on several different metrics between seventh and fifteenth best in attracting venture capital.
Unlike Rest of Nation, Maryland Venture Capital Funding Has Not Increased Recently
Although Maryland ranks relative high in the state-by-state rankings, venture capital funding has been volatile from year to year and has not trended upward as in the rest of the nation. Whereas in calendar 2002 through 2006, the State attracted 11 cents out of every venture capital dollar invested in U.S. companies, it attracted only 4 cents of every dollar within the last five years. However, the average annual number of Maryland companies receiving an investment has increased from 40 to 70, likely reflecting an increase in portfolio diversification for risk management purposes and/or a shift to other industries that typically receive lower investments. Exhibit 5.1 compares quarterly venture capital funding in Maryland to the United States.
Exhibit 5.1
Venture Capital Funding – United States and Maryland Calendar 2002-2017
Source: Moneytree Report, PriceWaterhouseCoopers; Department of Legislative Services
$0
$100
$200
$300
$400
$500
$600
$0
$5
$10
$15
$20
$25
2002 2005 2008 2011 2014 2017
Maryland
($ in Millions) U
nite
d St
ates
($ in
Bill
ions
)
US MDUnited States Maryland
DRAFT
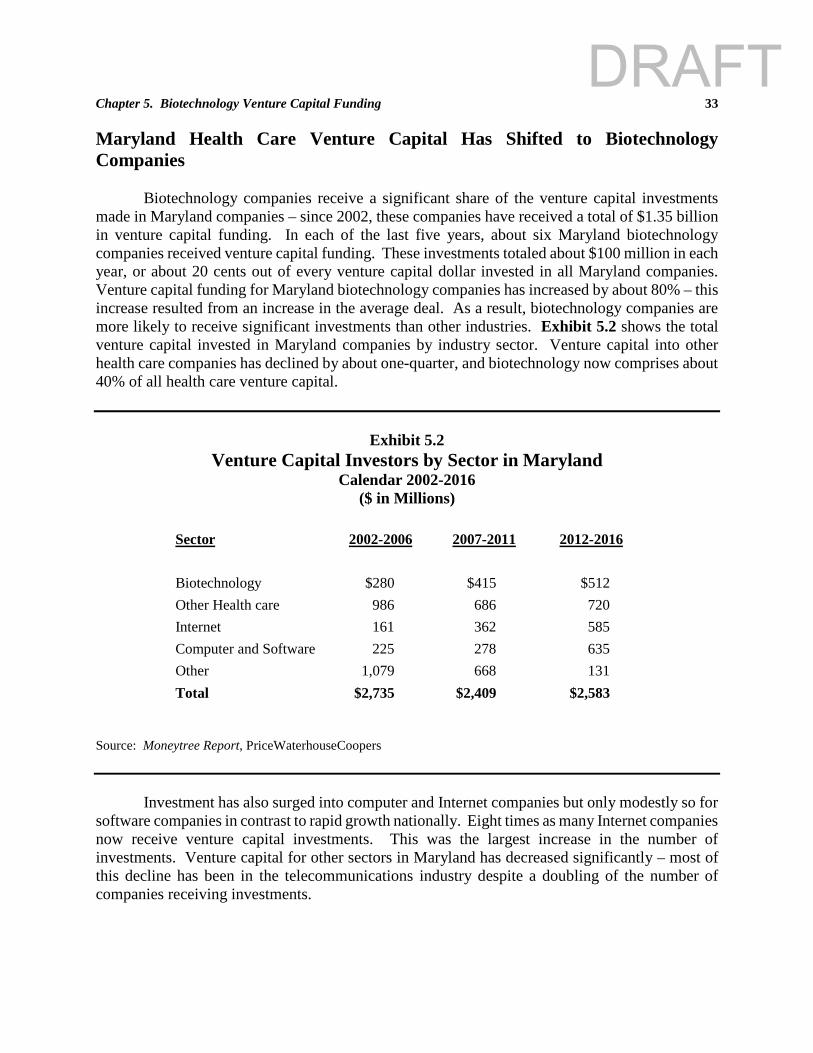
Chapter 5. Biotechnology Venture Capital Funding 33 Maryland Health Care Venture Capital Has Shifted to Biotechnology Companies
Biotechnology companies receive a significant share of the venture capital investments made in Maryland companies – since 2002, these companies have received a total of $1.35 billion in venture capital funding. In each of the last five years, about six Maryland biotechnology companies received venture capital funding. These investments totaled about $100 million in each year, or about 20 cents out of every venture capital dollar invested in all Maryland companies. Venture capital funding for Maryland biotechnology companies has increased by about 80% – this increase resulted from an increase in the average deal. As a result, biotechnology companies are more likely to receive significant investments than other industries. Exhibit 5.2 shows the total venture capital invested in Maryland companies by industry sector. Venture capital into other health care companies has declined by about one-quarter, and biotechnology now comprises about 40% of all health care venture capital.
Exhibit 5.2
Venture Capital Investors by Sector in Maryland Calendar 2002-2016
($ in Millions)
Sector 2002-2006 2007-2011 2012-2016 Biotechnology $280 $415 $512 Other Health care 986 686 720 Internet 161 362 585 Computer and Software 225 278 635 Other 1,079 668 131 Total $2,735 $2,409 $2,583
Source: Moneytree Report, PriceWaterhouseCoopers Investment has also surged into computer and Internet companies but only modestly so for software companies in contrast to rapid growth nationally. Eight times as many Internet companies now receive venture capital investments. This was the largest increase in the number of investments. Venture capital for other sectors in Maryland has decreased significantly – most of this decline has been in the telecommunications industry despite a doubling of the number of companies receiving investments.
DRAFT
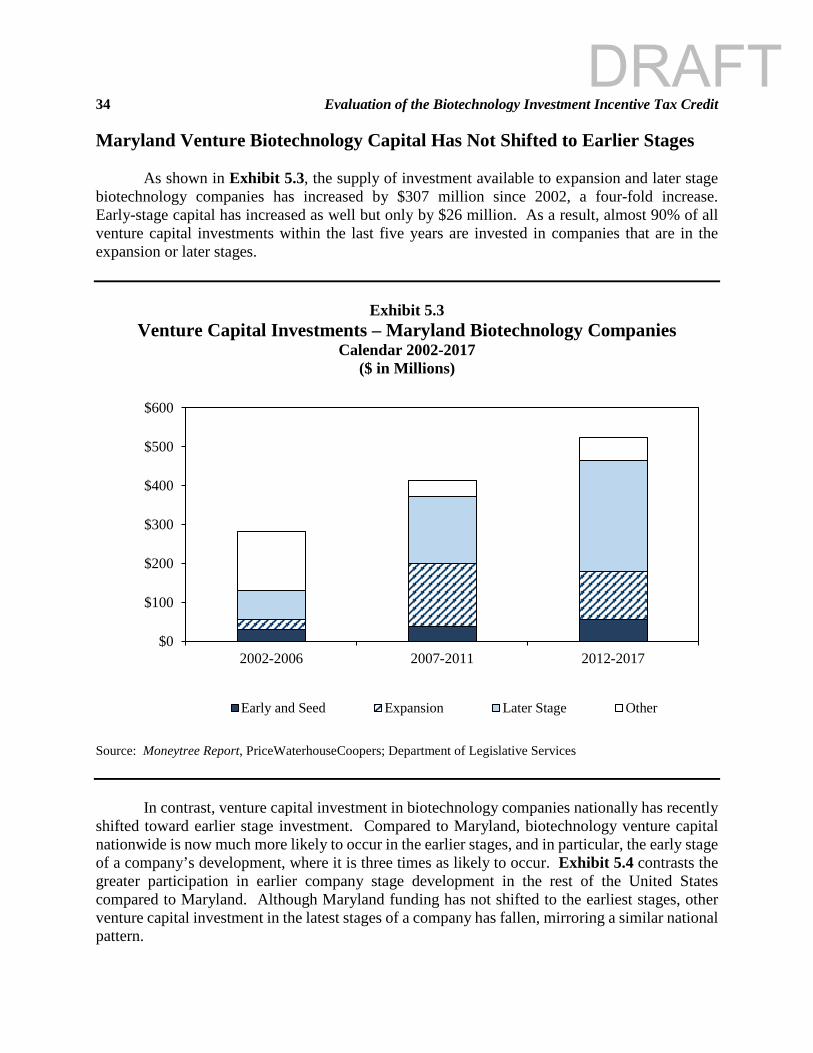
34 Evaluation of the Biotechnology Investment Incentive Tax Credit Maryland Venture Biotechnology Capital Has Not Shifted to Earlier Stages
As shown in Exhibit 5.3, the supply of investment available to expansion and later stage biotechnology companies has increased by $307 million since 2002, a four-fold increase. Early-stage capital has increased as well but only by $26 million. As a result, almost 90% of all venture capital investments within the last five years are invested in companies that are in the expansion or later stages.
Exhibit 5.3 Venture Capital Investments – Maryland Biotechnology Companies
Calendar 2002-2017 ($ in Millions)
Source: Moneytree Report, PriceWaterhouseCoopers; Department of Legislative Services
In contrast, venture capital investment in biotechnology companies nationally has recently
shifted toward earlier stage investment. Compared to Maryland, biotechnology venture capital nationwide is now much more likely to occur in the earlier stages, and in particular, the early stage of a company’s development, where it is three times as likely to occur. Exhibit 5.4 contrasts the greater participation in earlier company stage development in the rest of the United States compared to Maryland. Although Maryland funding has not shifted to the earliest stages, other venture capital investment in the latest stages of a company has fallen, mirroring a similar national pattern.
$0
$100
$200
$300
$400
$500
$600
2002-2006 2007-2011 2012-2017
Early and Seed Expansion Later Stage Other
DRAFT
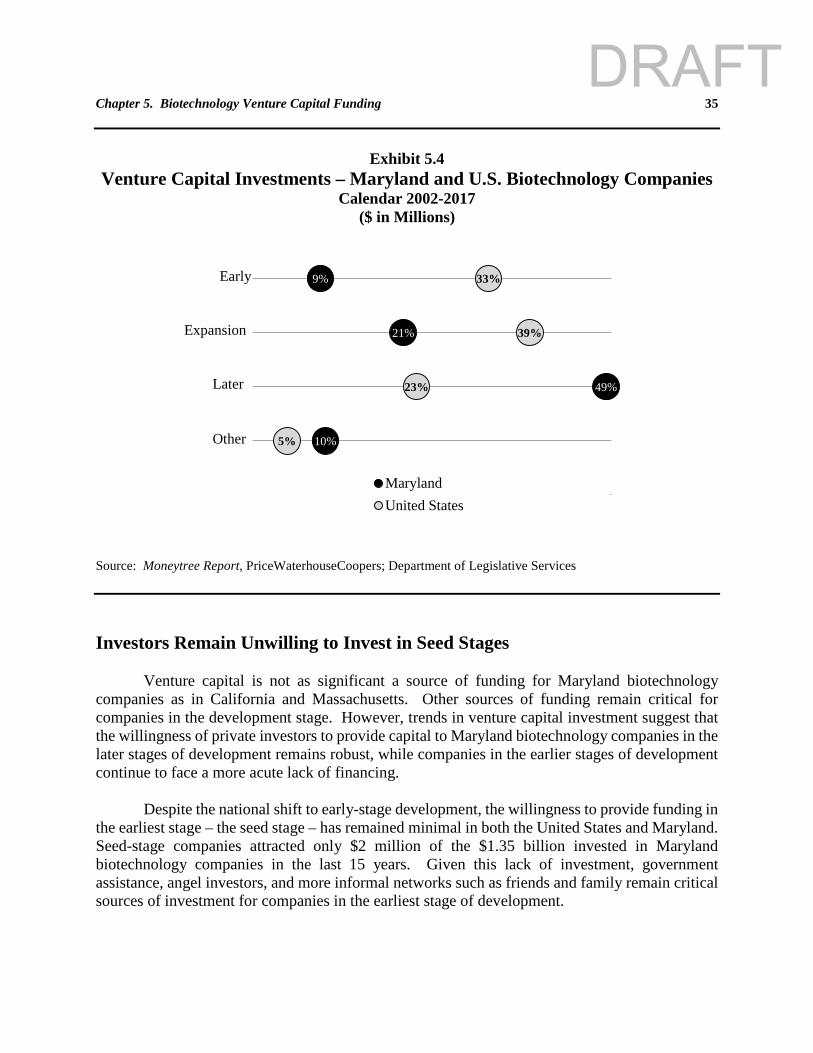
Chapter 5. Biotechnology Venture Capital Funding 35
Exhibit 5.4
Venture Capital Investments – Maryland and U.S. Biotechnology Companies Calendar 2002-2017
($ in Millions)
Source: Moneytree Report, PriceWaterhouseCoopers; Department of Legislative Services Investors Remain Unwilling to Invest in Seed Stages
Venture capital is not as significant a source of funding for Maryland biotechnology companies as in California and Massachusetts. Other sources of funding remain critical for companies in the development stage. However, trends in venture capital investment suggest that the willingness of private investors to provide capital to Maryland biotechnology companies in the later stages of development remains robust, while companies in the earlier stages of development continue to face a more acute lack of financing.
Despite the national shift to early-stage development, the willingness to provide funding in
the earliest stage – the seed stage – has remained minimal in both the United States and Maryland. Seed-stage companies attracted only $2 million of the $1.35 billion invested in Maryland biotechnology companies in the last 15 years. Given this lack of investment, government assistance, angel investors, and more informal networks such as friends and family remain critical sources of investment for companies in the earliest stage of development.
9%
21%
49%
10%
33%
39%
23%
5%
MarylandUnited States
Early
Expansion
Later
Other
DRAFT

36 Evaluation of the Biotechnology Investment Incentive Tax Credit
DRAFT
37
Chapter 6. Small Business Innovative Research and Maryland Technology Development Corporation Programs
National Institutes of Health Programs
The National Institutes of Health (NIH) is the primary federal agency for leading, conducting, and supporting biomedical and behavioral research. NIH employs approximately 18,000 people and is the world’s largest public funder of biomedical research, with annual funding exceeding $30 billion in recent years. Research is conducted internally by NIH personnel (intramural research) and also supported through research funding provided to external organizations and individuals (extramural research).
About 80% of every dollar appropriated to NIH is awarded by the 27 Institute Centers (IC)
to external organizations. Each of the ICs has a specific research agenda, often focusing on particular diseases or body systems. Research project grants, the most commonly awarded grant, support a specific research program. Research and development (R&D) contracts acquire goods or services for the direct benefit or use of the government and support research in areas of significant scientific interest, further scientific knowledge, or to achieve a specific research goal.
NIH Impact on Maryland Biosciences Industry
In addition to the direct impact of its Bethesda headquarters and additional offices in Rockville, Frederick, and the Baltimore area, Maryland universities, hospitals, nonprofit organizations, and for-profit companies also receive significant NIH research funding. In federal fiscal 2016 alone, Maryland organizations and individuals received 2,358 awards totaling $1.47 billion. R&D contracts were the more important source for companies and, along with research project grants, comprised 99% of all funds received by companies. Maryland companies received about one-quarter, or $363.5 million, of all NIH awards made to companies, eclipsing by far any other state, as shown in Exhibit 6.1.
DRAFT
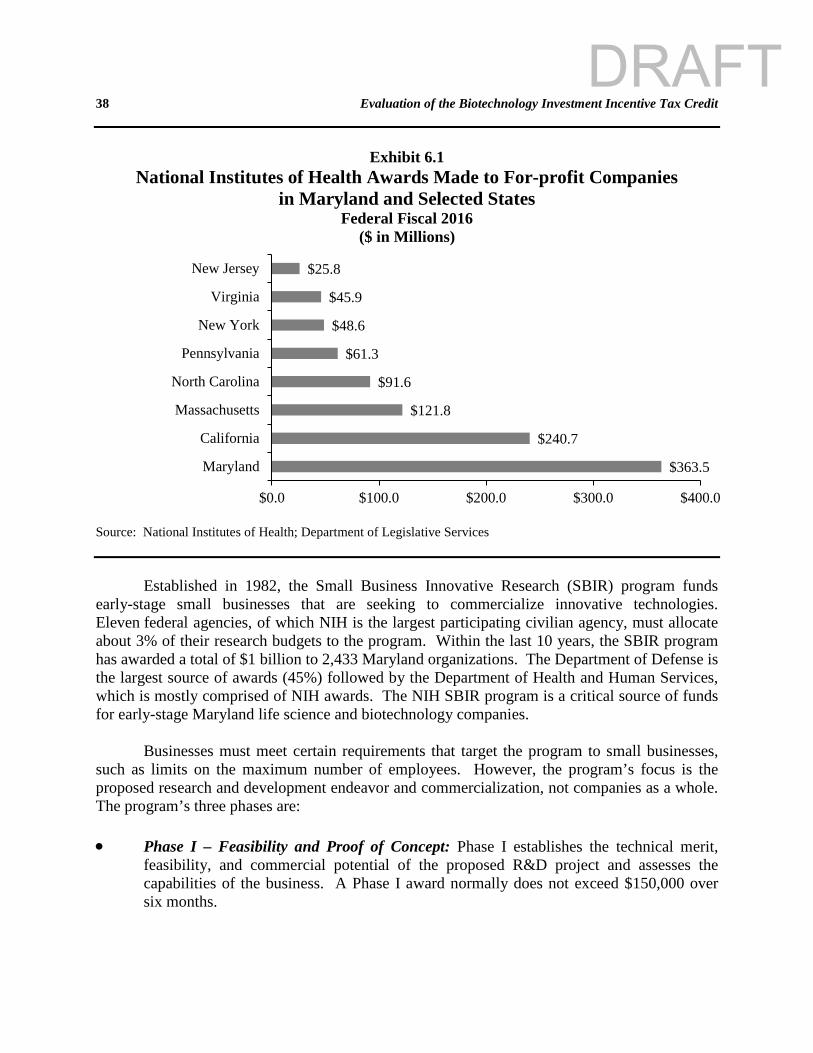
38 Evaluation of the Biotechnology Investment Incentive Tax Credit
Exhibit 6.1 National Institutes of Health Awards Made to For-profit Companies
in Maryland and Selected States Federal Fiscal 2016
($ in Millions)
Source: National Institutes of Health; Department of Legislative Services
Established in 1982, the Small Business Innovative Research (SBIR) program funds early-stage small businesses that are seeking to commercialize innovative technologies. Eleven federal agencies, of which NIH is the largest participating civilian agency, must allocate about 3% of their research budgets to the program. Within the last 10 years, the SBIR program has awarded a total of $1 billion to 2,433 Maryland organizations. The Department of Defense is the largest source of awards (45%) followed by the Department of Health and Human Services, which is mostly comprised of NIH awards. The NIH SBIR program is a critical source of funds for early-stage Maryland life science and biotechnology companies.
Businesses must meet certain requirements that target the program to small businesses,
such as limits on the maximum number of employees. However, the program’s focus is the proposed research and development endeavor and commercialization, not companies as a whole. The program’s three phases are:
• Phase I – Feasibility and Proof of Concept: Phase I establishes the technical merit,
feasibility, and commercial potential of the proposed R&D project and assesses the capabilities of the business. A Phase I award normally does not exceed $150,000 over six months.
$363.5
$240.7
$121.8
$91.6
$61.3
$48.6
$45.9
$25.8
$0.0 $100.0 $200.0 $300.0 $400.0
Maryland
California
Massachusetts
North Carolina
Pennsylvania
New York
Virginia
New Jersey
DRAFT
Chapter 6. Small Business Innovative Research and Maryland Technology Development Corporation Programs 39 • Phase II – Research and Development: Phase II assesses the results achieved in Phase I
and the project’s scientific and technical merits as well as its commercial potential. A Phase II award normally does not exceed $1 million over two years.
• Phase III – Commercialization: The objective of Phase III, when appropriate, is for the
small business to pursue commercialization objectives resulting from Phase I and II research. The SBIR program does not provide funding, as companies seek to secure additional private and public funding, including R&D contracts.
The focus of the program is on the first two stages, and most companies must apply for
funds in both Phase I and Phase II. Since 1992, 280 Maryland companies have received $615.6 million in NIH SBIR awards. Program funding has increased over time – since federal fiscal 2007, about 55 companies each year have received about $36 million annually, an amount that is about four times greater than the annual funding for the State biotechnology incentive investment tax credit. Based on recent application data, Maryland companies comprised about 5% of national recipients, placing Maryland in the top 5 in terms of total awards by state. However, Maryland companies had an average success rate at securing Phase I awards and a slightly less than average success rate of converting Phase I awards into Phase II.
While awards are not limited to biotechnology companies, biotechnology and medical
device companies are the most common recipients. There is no limit on the age of the company; however, a recent analysis determined that most companies were in business for eight years or less, and biotechnology and medical device companies were typically much younger. About one-third of the companies that participated in the State biotechnology tax credit also received an NIH SBIR award (corresponding to 10% of NIH SBIR recipients).
Program Has Clear Objective with Metrics That Assess Program Performance The SBIR program has four legislatively mandated objectives, which are to (1) stimulate technological innovations; (2) increase private-sector commercialization of innovations; (3) use small businesses to meet federal R&D needs; and (4) foster and encourage participation by minority and disadvantaged persons in technological innovations.
NIH typically conducts periodic program evaluations that determine if the program is meeting its objectives. As a crucial part of this process, NIH has developed multiple performance measures for each objective. For example, four metrics assess whether the program increases the commercialization of innovations. These are the percentage of (1) SBIR-supported products that yield sales; (2) awardees that have successfully executed licensing agreements for the SBIR-supported product; (3) awardees that report successful commercialization of the applicable core technology; and (4) awardees that obtain additional, non-SBIR funding for the product. The metrics employed for three of the four objectives in a 2009 evaluation of Phase II awardees are shown in Exhibit 6.2.
DRAFT
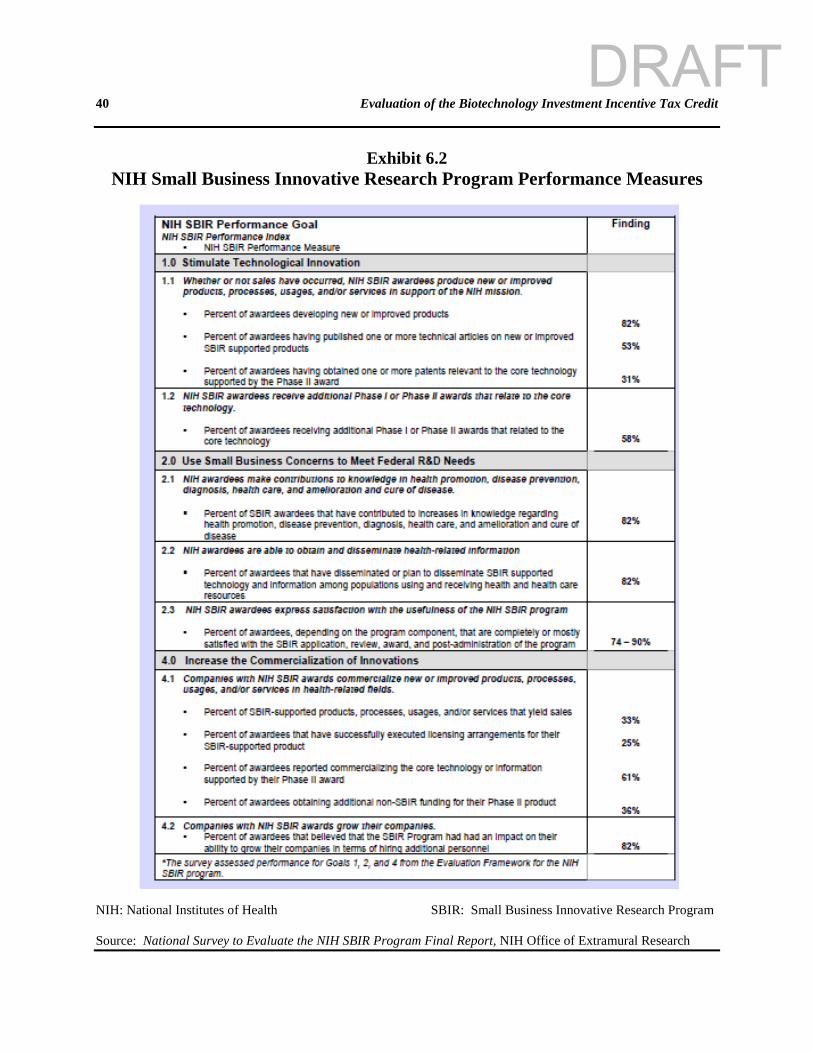
40 Evaluation of the Biotechnology Investment Incentive Tax Credit
Exhibit 6.2 NIH Small Business Innovative Research Program Performance Measures
NIH: National Institutes of Health SBIR: Small Business Innovative Research Program Source: National Survey to Evaluate the NIH SBIR Program Final Report, NIH Office of Extramural Research
DRAFT
Chapter 6. Small Business Innovative Research and Maryland Technology Development Corporation Programs 41 Application and Decision Process NIH currently has three annual application deadlines – January, April, and September – and awards are generally made six months later. The NIH dual peer review process is designed to evaluate the scientific, technical, and programmatic merit of each application for potential research funding with processes that are fair, equitable, timely, and free of bias. NIH also states that using a rigorous dual peer review system ensures that only the most meritorious scientific proposals are funded. In the first stage, applicants are assigned an overall score based on several factors, including (1) project significance, including the extent to which the project addresses an important problem or critical barrier to progress in the field; (2) the experience and capabilities of the researchers; (3) the project’s level of innovation; (4) the quality of research approach; and (5) the sufficient availability of resources and support for researchers. An advisory council/board composed of scientists from the extramural research community and public representatives conducts the second level of review. Many ICs establish a payline, which is a percentile-based funding cutoff point that is determined at the beginning of the fiscal year by balancing the projected number of applications assigned to an IC with the expected available funding. Other considerations are portfolio balance, public health needs, programmatic relevance, IC priorities, and requirements specified in congressional appropriations. National Academy of Sciences Evaluation
In 2009, the National Research Council of the National Academy of Sciences evaluated the NIH SBIR program. The major findings of the evaluation are as follows:
• The program is meeting most of the four legislative objectives of the program. In doing
so, it is expanding knowledge, supporting the NIH mission, supporting small businesses, achieving significant commercialization, and attracting third-party funding.
• Although the council made several recommendations for improvement, the evaluation
found that NIH had developed a positive assessment culture. However, much greater effort was needed to evaluate current outcomes and collect relevant data, including a much expanded annual report. In order to achieve these goals, NIH should be provided sufficient funds to maintain a results-oriented program with a focused evaluation culture.
• The program should retain the flexibility and experimentation that have characterized its
recent management. The SBIR program is effective because a one-size fits all approach has not been imposed across the ICs. Efforts to initiate program innovation, including pilot projects, should be encouraged.
DRAFT
42 Evaluation of the Biotechnology Investment Incentive Tax Credit • NIH should develop clearly articulated rationales for large awards, followed by equally
clear assessment programs to determine whether the awards have been effective. • Awards are open to new entrants – the council found that there was a high proportion of
new Phase I entrants ranging between just under 50% in 2000 and just above 35% in 2005. Awards are widely distributed with more than 1,300 companies receiving at least 1 award within a 10-year period. Another measure cited was the relatively low number of frequent award winners with only 5 companies receiving more than 20 Phase II awards.
Objectives and Metrics Unlike the NIH SBIR program, the biotechnology investment incentive tax credit has not benefitted from regular evaluation. Factors complicating this effort include a lack of legislatively established objectives, as previously discussed. However, since the program was established in 2005, the Department of Commerce (Commerce) has not established an objective or objectives through regulations or developed metrics to assess if the program is producing positive outcomes. The State credit is not sufficiently evidence-based as Commerce does not have adequate information about how the program impacts outcomes such as total investment, industry R&D and patents, company formation and survival rates, and technology commercialization. Commerce has demonstrated a limited analytical capability and utilization of program data beyond providing mandated annual reports requiring company, investor, and initial credit information. Maryland Technology Development Corporation
Established in 1998, the Maryland Technology Development Corporation (TEDCO) helps commercialize the results of scientific R&D conducted by higher education institutions, federal laboratories, and private-sector organizations. TEDCO also aims to promote new research activity and investments that lead to business development in Maryland. To achieve its goals, TEDCO provides investments to early-stage technology businesses, and it funds development and patenting of new technologies at research universities. TEDCO also develops linkages with federal research facilities in the State and helps companies secure additional funding sources. TEDCO’s status as a quasi-public agency affords it some flexibility as it responds to the needs of the quickly evolving technology sector. Chapter 141 of 2015 expanded TEDCO’s role by transferring the Maryland Venture Fund and the biotechnology grant program from Commerce.
Programs Provide Assistance to Biotechnology Companies
TEDCO programs provide funding through a variety of programs designed to assist entrepreneurs and startups. Programs that assist biotechnology companies include:
• Life Science Investment Fund: Invests in Maryland companies developing human health
products that require U.S. Food and Drug Administration approval. The goal of the
DRAFT
Chapter 6. Small Business Innovative Research and Maryland Technology Development Corporation Programs 43
program is to increase the commercialization of these products and the company’s valuation and to better position the company for follow-on investment, product commercialization, and job creation. The maximum award is $200,000.
• Seed Investment Fund: Provides funds to Maryland companies in their effort to develop
and commercialize new technology-based products. TEDCO makes investments in these companies so they can reach critical milestones in their product development efforts and advance their technologies further along the commercialization pathway, which will increase the company’s valuation and lead to follow-on investment, sustainability, and job creation. The maximum award is $100,000 ($200,000 for certain life science companies).
• Maryland Innovation Initiative: Combines the technology transfer expertise of TEDCO
and the research expertise of the State’s research universities with the goal of increasing the commercialization of university research projects. The maximum award is $365,000.
• Maryland Venture Fund: Provides capital through equity purchases for startup companies
that are developing innovative technologies. Awards are typically between $500,000 and $1.5 million.
TEDCO Programs Have a Clear Mission and Are Coordinated
TEDCO programs are divided into three categories and grouped according to the specific purpose they serve in the process of accelerating entrepreneurial innovation and advancing ideas to economic success. Exhibit 6.3 illustrates how each fund is targeted based on the company’s development stage.
DRAFT
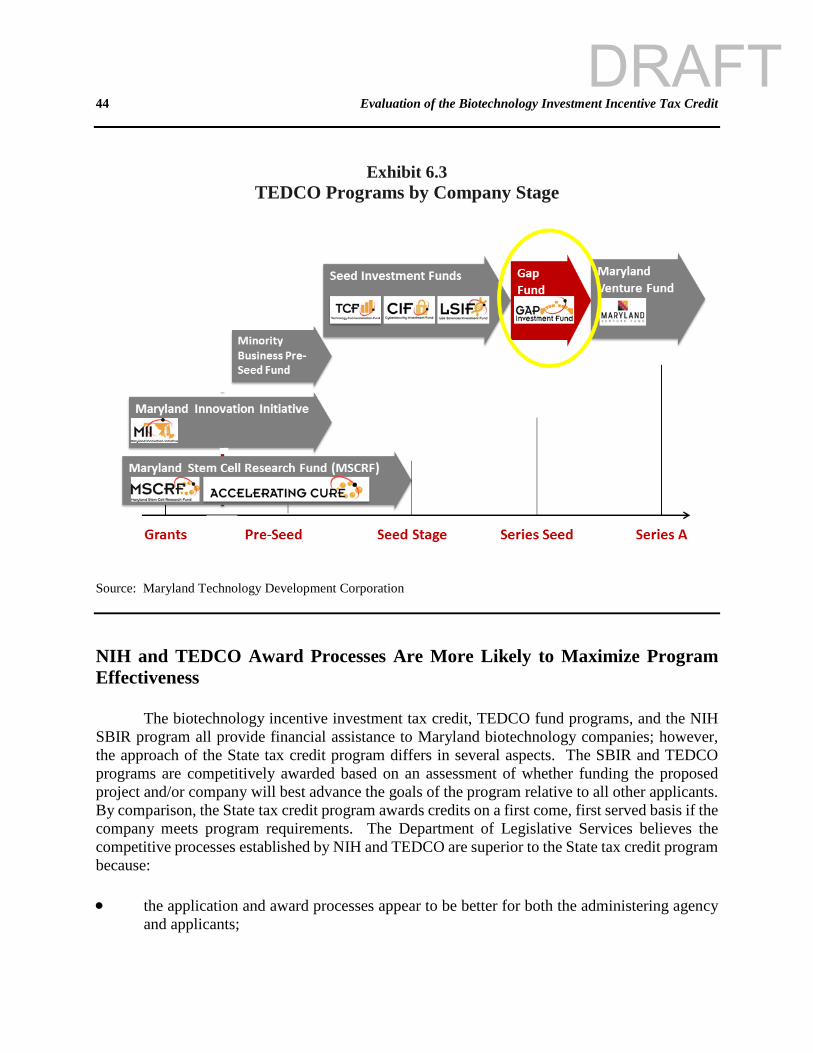
44 Evaluation of the Biotechnology Investment Incentive Tax Credit
Exhibit 6.3 TEDCO Programs by Company Stage
Source: Maryland Technology Development Corporation NIH and TEDCO Award Processes Are More Likely to Maximize Program Effectiveness
The biotechnology incentive investment tax credit, TEDCO fund programs, and the NIH SBIR program all provide financial assistance to Maryland biotechnology companies; however, the approach of the State tax credit program differs in several aspects. The SBIR and TEDCO programs are competitively awarded based on an assessment of whether funding the proposed project and/or company will best advance the goals of the program relative to all other applicants. By comparison, the State tax credit program awards credits on a first come, first served basis if the company meets program requirements. The Department of Legislative Services believes the competitive processes established by NIH and TEDCO are superior to the State tax credit program because:
• the application and award processes appear to be better for both the administering agency
and applicants;
DRAFT
Chapter 6. Small Business Innovative Research and Maryland Technology Development Corporation Programs 45 • the competitive award process is more likely to achieve program goals; and • TEDCO and NIH use criteria that better target the programs to their intended beneficiaries
and desired program outcomes. Competitive Application Process
Only the State biotechnology investment tax credit program awards funds on a first come, first served basis. This approach is deficient relative to the discretionary process used by NIH and TEDCO and is less likely to allocate credits in a manner that maximizes program effectiveness. NIH employs a two-stage merit-based process that selects those projects with the best overall score and determined as the most promising research. By comparison, the State program has awarded about $100 million in credits based on the time in which a company representative either physically queued up or an investor electronically submits an application. As discussed in Chapter 8, there appears to be an advantage for repeat applicants as many of those applicants have significantly higher success rates than new applicants.
As shown in Exhibit 6.4, a merit-based process is more selective – companies and projects must typically show particular promise beyond minimum program standards. By comparison, biotechnology companies that meet the minimum program standards of the State tax credit are likely to receive program funding. The discretionary application, review, and award processes adopted by TEDCO and NIH are deliberative and appear to have fewer problems for both the administering agency and applicants. This contrasts with the State tax credits that are awarded on a first come first served basis, which creates timing and administrative challenges for the department and applicants.
DRAFT
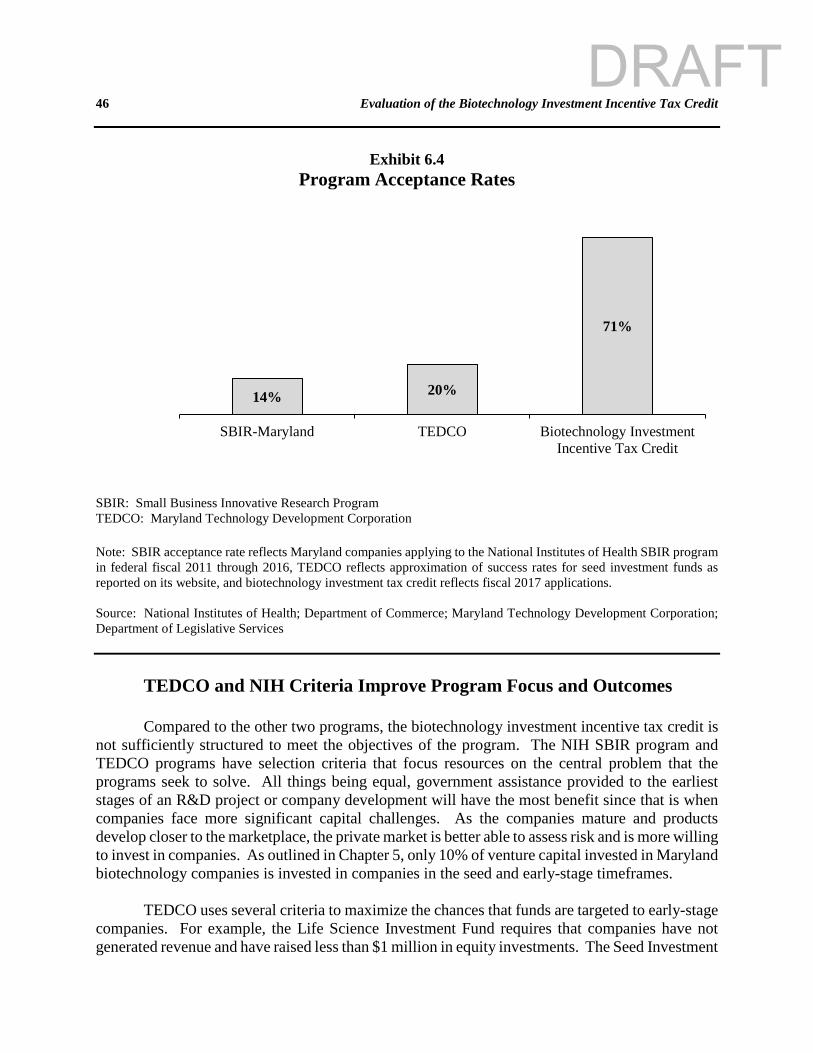
46 Evaluation of the Biotechnology Investment Incentive Tax Credit
Exhibit 6.4 Program Acceptance Rates
SBIR: Small Business Innovative Research Program TEDCO: Maryland Technology Development Corporation Note: SBIR acceptance rate reflects Maryland companies applying to the National Institutes of Health SBIR program in federal fiscal 2011 through 2016, TEDCO reflects approximation of success rates for seed investment funds as reported on its website, and biotechnology investment tax credit reflects fiscal 2017 applications. Source: National Institutes of Health; Department of Commerce; Maryland Technology Development Corporation; Department of Legislative Services
TEDCO and NIH Criteria Improve Program Focus and Outcomes
Compared to the other two programs, the biotechnology investment incentive tax credit is not sufficiently structured to meet the objectives of the program. The NIH SBIR program and TEDCO programs have selection criteria that focus resources on the central problem that the programs seek to solve. All things being equal, government assistance provided to the earliest stages of an R&D project or company development will have the most benefit since that is when companies face more significant capital challenges. As the companies mature and products develop closer to the marketplace, the private market is better able to assess risk and is more willing to invest in companies. As outlined in Chapter 5, only 10% of venture capital invested in Maryland biotechnology companies is invested in companies in the seed and early-stage timeframes.
TEDCO uses several criteria to maximize the chances that funds are targeted to early-stage
companies. For example, the Life Science Investment Fund requires that companies have not generated revenue and have raised less than $1 million in equity investments. The Seed Investment
14% 20%
71%
0
0
0
0
0
1
1
1
1
SBIR-Maryland TEDCO Biotechnology InvestmentIncentive Tax Credit
DRAFT
Chapter 6. Small Business Innovative Research and Maryland Technology Development Corporation Programs 47 Fund requires that companies be in business for less than five years and raise less than $1 million in equity investments. These are not statutory requirements but rather evolving criteria that TEDCO uses to ensure the program is oriented by company stage.
An additional consideration for seed investment funds is if the company has a potential to
grow and have an economic impact in Maryland. TEDCO states that it is “an economic development organization – we want to fund companies with the potential to grow the Maryland economy and create jobs.” There is no similar requirement or goal articulated for the State biotechnology investment tax credit.
SBIR and TEDCO Awards Provide Benefit Directly to Company
The biotechnology incentive investment tax credit provides a potential leverage of up to 1 to 1, if the investor would not have made the same investment in the absence of the credit. Investors have a wide range of risk tolerance and willingness to invest in Maryland biotechnology companies. Many would make these investments without the State tax incentive, while others would not invest even with a much more generous credit. Despite this variation in the likelihood to invest and incentive needed to do so, the State tax credit provides a standard 50% credit across all companies and investors. In many cases, the one-size-fits-all credit percentage will overcompensate investors. Investors will make an investment if the credit provides an incentive beyond their required expected rate of return; however, the converse is not true as investors will not make an investment if it does not meet their requirements. As a result, part of the tax credit benefit is realized by investors who are overcompensated, thereby decreasing the overall benefit of the program to companies.
In addition, companies have become more dissimilar as the program evolved. Some
companies are much more established, are closer to the product market, and are generating revenue and/or are profitable. Other less-established startups that are in the earliest development stages are much riskier propositions. This increased difference in the risk of investment failure across companies makes it more difficult for a one-size-fits-all credit to accurately target investors.
TEDCO’s seed investment and life science investment funds provide financial assistance
directly to the company but require that companies secure a minimum match in cash of 50%. Unlike the tax credit program, TEDCO investments can generate returns or repayments to the State that are reinvested into other companies. For example, as of June 30, 2016, the Maryland Venture Fund has invested $16.2 million; these investments have generated realizations of $1.3 million and the fair market value of the remaining investments is $14.0 million.
State Tax Credit Is Not Coordinated
Programs within TEDCO are generally coordinated and are tailored based on the capital needs of companies at different lifecycle stages. However, despite a significant overlap of funding between the Commerce biotechnology investment incentive tax credit and the TEDCO programs,
DRAFT

48 Evaluation of the Biotechnology Investment Incentive Tax Credit there is no coordination between TEDCO and Commerce. TEDCO does not have a formal mechanism to consider receipt of State tax credits when making funding decisions. Conversely, TEDCO might determine that a company’s performance does not merit additional investment and/or may exit an initial investment, but the State may continue to provide funds via the State tax credit program. As a measure of this lack of coordination, TEDCO did respond to a request for information on the extent to which State tax credit recipients also receive TEDCO funding.
The TEDCO and NIH SBIR programs are critical sources of funds for early-stage biotechnology companies. It is not clear if the purpose of the State biotechnology investment tax credit is to supplement funding at a similar stage or complement the programs by providing funding once companies advance their development beyond the scope of the programs.
DRAFT
49
Chapter 7. Program Fiscal Impact and Overview Program Fiscal Impact State Costs
Program Appropriations The biotechnology incentive investment tax credit is a budgeted tax credit program subject
to an annual overall budgetary limit. Under the budgeted tax credit program, the annual appropriations reflect the total fiscal impact of the program. The Department of Commerce (Commerce) awards initial tax credit certificates based on the appropriation to the program, and tax credits can be claimed once Commerce certifies that the taxpayer has made the investment. Commerce is required to notify the Comptroller’s Office quarterly of completed investments, and upon this notification, the Comptroller’s Office then transfers the amount of credits awarded to the investors back to the general fund. This transfer generally offsets any tax credit claimed by the investor. Transfers from the reserve fund to the general fund do not materially affect State finances.
The program’s fiscal impact has doubled over time due to an increase in the amounts appropriated to the program. In fiscal 2007, the first year of appropriations to the program, $6 million was provided. Program funding increased in several steps beginning in fiscal 2011, and the program has received $12 million annually since fiscal 2015.
Administrative Costs
Administering the biotechnology investment incentive tax credit requires additional resources compared to other State tax credit programs. Commerce processes approximately 40 company applications and 300 investor applications each year. Staff conduct a science review to verify that the company meets the program’s requirements related to proprietary technology, and an assistant Attorney General and a tax specialist provide additional program support. According to Commerce, applications have increased over time and the department indicates that it does not have sufficient resources to administer the program. Local Impact
Local Highway User Revenues Local governments receive a portion of income tax revenues to support the construction
and maintenance of local roads and other transportation facilities. Any tax credits claimed against the corporate income tax will therefore decrease local highway user revenues.
DRAFT
50 Evaluation of the Biotechnology Investment Incentive Tax Credit
Montgomery County Local Grant Program
In 2010, Montgomery County established a biotechnology investment incentive program that provides supplemental grants to investors who invest in biotechnology companies that are physically located in Montgomery County. Investors may receive a grant of up to 50% of the State biotechnology incentive investment tax credit, not to exceed 15% of the county program’s annual budget. The final amount of each grant is based on the investor’s share of the total State credit amount and prorated based on the amount of available funds. The county has budgeted $500,000 for the program in each year since fiscal 2010. Supplemental grants are typically paid between March and May of each year for investments made in the previous calendar year. In fiscal 2016, 81 investors in 13 companies received a supplemental county grant ranging from $1,117 to $22,352.
Overview of Program Activity Commerce first awarded credits beginning with fiscal 2007 and has closed out awards through fiscal 2017. During this time period, $94.0 million has been appropriated to the program. Based on data provided by Commerce, the Department of Legislative Services (DLS) estimates that there have been 1,645 certified investments that totaled $192.8 million. Investors earned $92.6 million in credits, equal to about 48% of the certified investments. This accounts for all but $1.4 million, or 1%, of the program’s appropriations through fiscal 2017.
A total of 92 companies have received at least 1 investment, with the typical company receiving a total investment of $90,000. However, company participation varied greatly from a low of a single investment of $25,000 compared to 269 investments totaling $21.2 million. In a typical year, 22 companies reached 157 investment agreements. While program funding has doubled in recent years, the number of participating companies has not. Despite a doubling in program funding, the number of companies receiving at least 1 investment increased by only one-third and the number of investments rose by only 15%. Exhibit 7.1 shows by fiscal year the number of investments and participating companies.
DRAFT
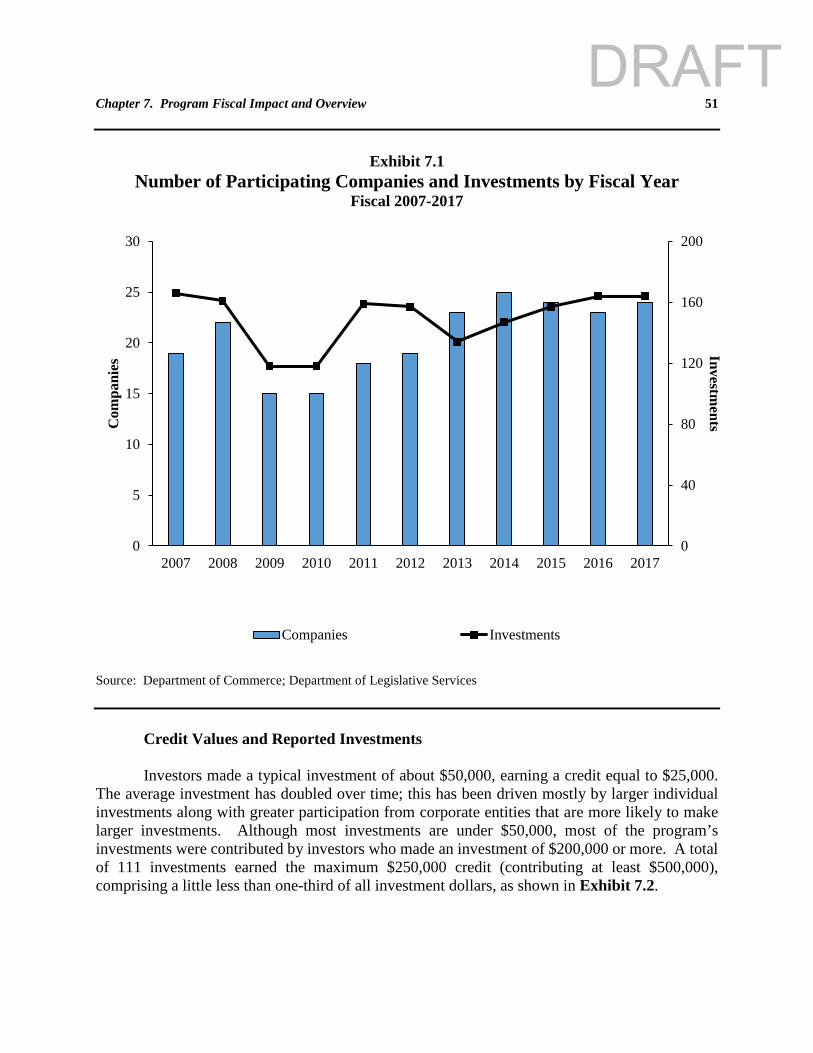
Chapter 7. Program Fiscal Impact and Overview 51
Exhibit 7.1
Number of Participating Companies and Investments by Fiscal Year Fiscal 2007-2017
Source: Department of Commerce; Department of Legislative Services
Credit Values and Reported Investments
Investors made a typical investment of about $50,000, earning a credit equal to $25,000. The average investment has doubled over time; this has been driven mostly by larger individual investments along with greater participation from corporate entities that are more likely to make larger investments. Although most investments are under $50,000, most of the program’s investments were contributed by investors who made an investment of $200,000 or more. A total of 111 investments earned the maximum $250,000 credit (contributing at least $500,000), comprising a little less than one-third of all investment dollars, as shown in Exhibit 7.2.
0
40
80
120
160
200
0
5
10
15
20
25
30
2007 2008 2009 2010 2011 2012 2013 2014 2015 2016 2017
InvestmentsC
ompa
nies
Companies Investments
DRAFT
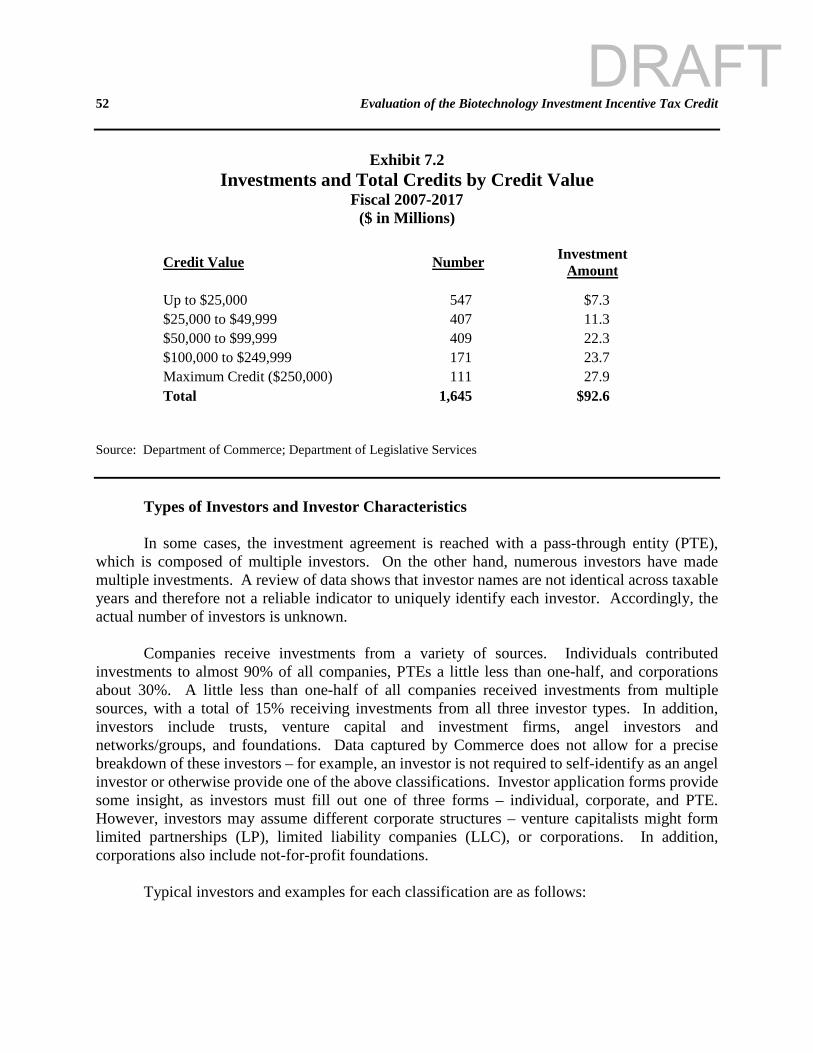
52 Evaluation of the Biotechnology Investment Incentive Tax Credit
Exhibit 7.2 Investments and Total Credits by Credit Value
Fiscal 2007-2017 ($ in Millions)
Credit Value Number Investment
Amount Up to $25,000 547 $7.3 $25,000 to $49,999 407 11.3 $50,000 to $99,999 409 22.3 $100,000 to $249,999 171 23.7 Maximum Credit ($250,000) 111 27.9 Total 1,645 $92.6
Source: Department of Commerce; Department of Legislative Services
Types of Investors and Investor Characteristics In some cases, the investment agreement is reached with a pass-through entity (PTE),
which is composed of multiple investors. On the other hand, numerous investors have made multiple investments. A review of data shows that investor names are not identical across taxable years and therefore not a reliable indicator to uniquely identify each investor. Accordingly, the actual number of investors is unknown.
Companies receive investments from a variety of sources. Individuals contributed investments to almost 90% of all companies, PTEs a little less than one-half, and corporations about 30%. A little less than one-half of all companies received investments from multiple sources, with a total of 15% receiving investments from all three investor types. In addition, investors include trusts, venture capital and investment firms, angel investors and networks/groups, and foundations. Data captured by Commerce does not allow for a precise breakdown of these investors – for example, an investor is not required to self-identify as an angel investor or otherwise provide one of the above classifications. Investor application forms provide some insight, as investors must fill out one of three forms – individual, corporate, and PTE. However, investors may assume different corporate structures – venture capitalists might form limited partnerships (LP), limited liability companies (LLC), or corporations. In addition, corporations also include not-for-profit foundations. Typical investors and examples for each classification are as follows:
DRAFT
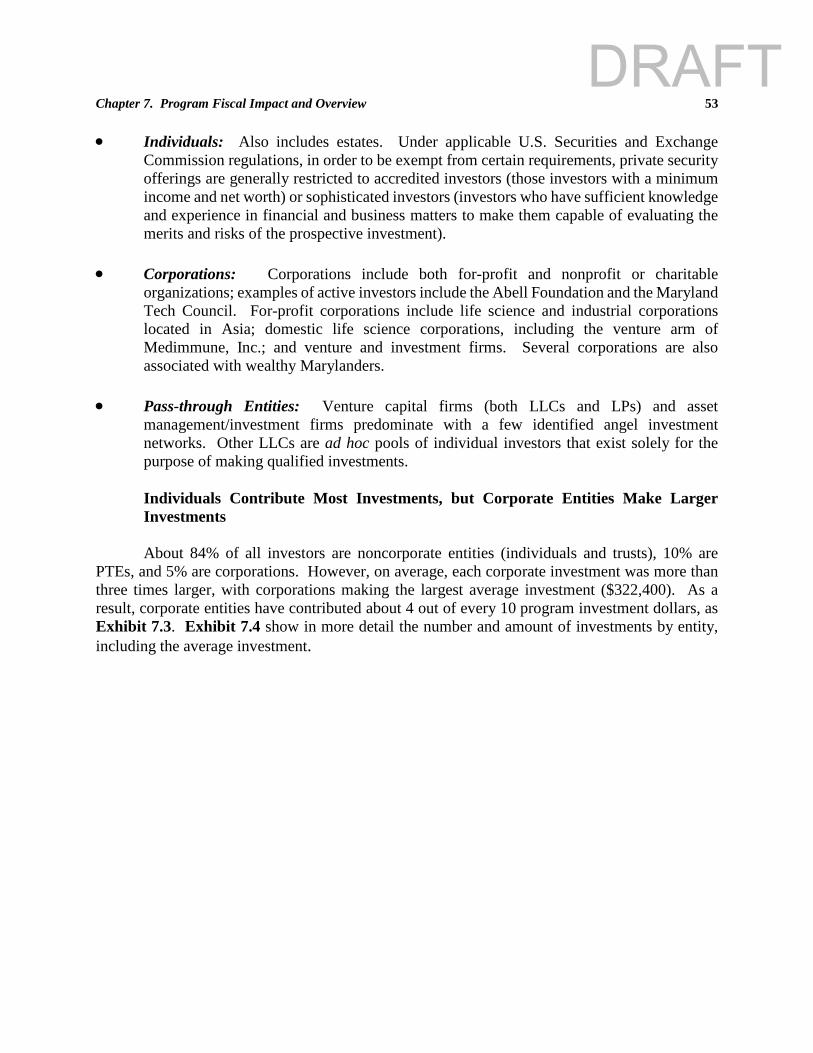
Chapter 7. Program Fiscal Impact and Overview 53 • Individuals: Also includes estates. Under applicable U.S. Securities and Exchange
Commission regulations, in order to be exempt from certain requirements, private security offerings are generally restricted to accredited investors (those investors with a minimum income and net worth) or sophisticated investors (investors who have sufficient knowledge and experience in financial and business matters to make them capable of evaluating the merits and risks of the prospective investment).
• Corporations: Corporations include both for-profit and nonprofit or charitable
organizations; examples of active investors include the Abell Foundation and the Maryland Tech Council. For-profit corporations include life science and industrial corporations located in Asia; domestic life science corporations, including the venture arm of Medimmune, Inc.; and venture and investment firms. Several corporations are also associated with wealthy Marylanders.
• Pass-through Entities: Venture capital firms (both LLCs and LPs) and asset
management/investment firms predominate with a few identified angel investment networks. Other LLCs are ad hoc pools of individual investors that exist solely for the purpose of making qualified investments.
Individuals Contribute Most Investments, but Corporate Entities Make Larger Investments About 84% of all investors are noncorporate entities (individuals and trusts), 10% are PTEs, and 5% are corporations. However, on average, each corporate investment was more than three times larger, with corporations making the largest average investment ($322,400). As a result, corporate entities have contributed about 4 out of every 10 program investment dollars, as Exhibit 7.3. Exhibit 7.4 show in more detail the number and amount of investments by entity, including the average investment.
DRAFT
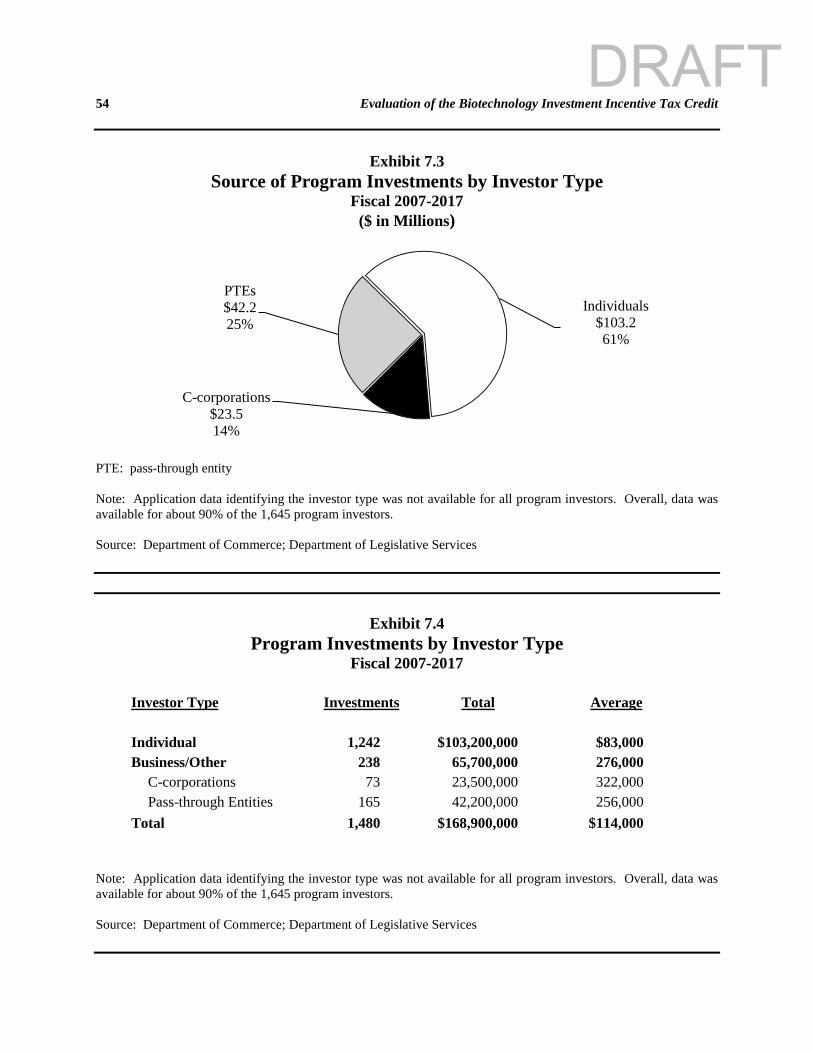
54 Evaluation of the Biotechnology Investment Incentive Tax Credit
Exhibit 7.3 Source of Program Investments by Investor Type
Fiscal 2007-2017 ($ in Millions)
PTE: pass-through entity Note: Application data identifying the investor type was not available for all program investors. Overall, data was available for about 90% of the 1,645 program investors. Source: Department of Commerce; Department of Legislative Services
Exhibit 7.4
Program Investments by Investor Type Fiscal 2007-2017
Investor Type Investments Total Average Individual 1,242 $103,200,000 $83,000 Business/Other 238 65,700,000 276,000
C-corporations 73 23,500,000 322,000 Pass-through Entities 165 42,200,000 256,000
Total 1,480 $168,900,000 $114,000 Note: Application data identifying the investor type was not available for all program investors. Overall, data was available for about 90% of the 1,645 program investors. Source: Department of Commerce; Department of Legislative Services
Individuals$103.261%
C-corporations$23.514%
PTEs$42.2 25%
DRAFT
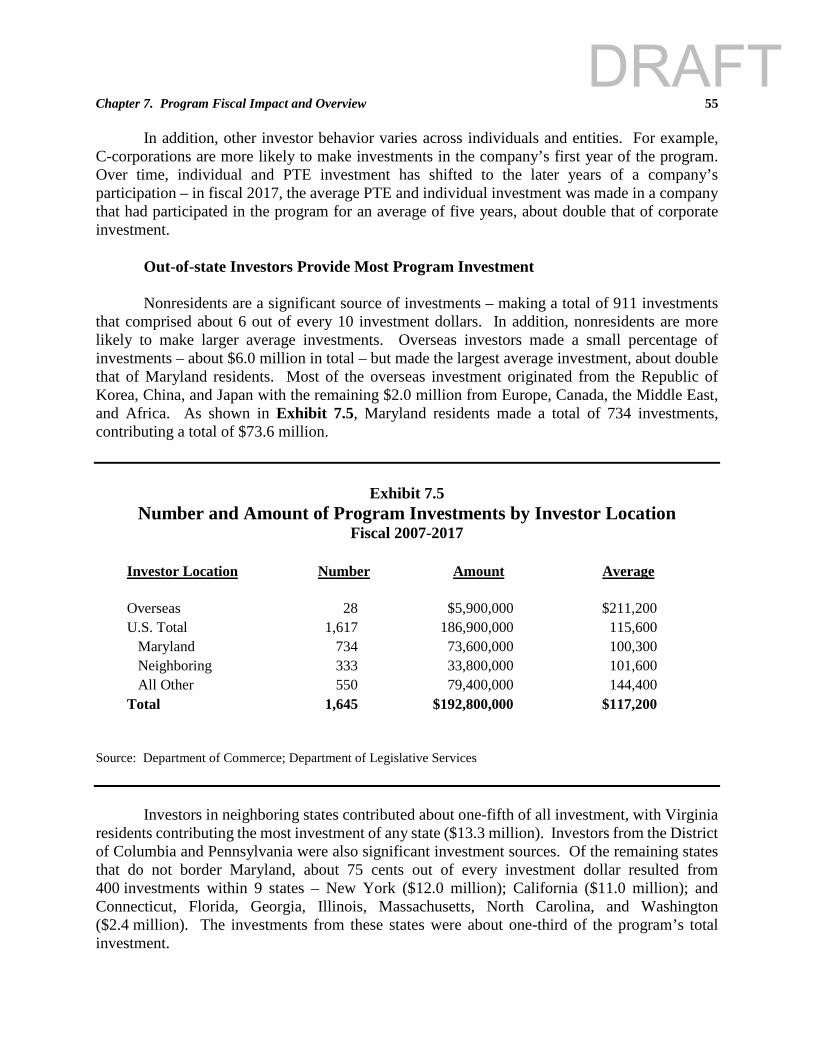
Chapter 7. Program Fiscal Impact and Overview 55
In addition, other investor behavior varies across individuals and entities. For example, C-corporations are more likely to make investments in the company’s first year of the program. Over time, individual and PTE investment has shifted to the later years of a company’s participation – in fiscal 2017, the average PTE and individual investment was made in a company that had participated in the program for an average of five years, about double that of corporate investment.
Out-of-state Investors Provide Most Program Investment Nonresidents are a significant source of investments – making a total of 911 investments
that comprised about 6 out of every 10 investment dollars. In addition, nonresidents are more likely to make larger average investments. Overseas investors made a small percentage of investments – about $6.0 million in total – but made the largest average investment, about double that of Maryland residents. Most of the overseas investment originated from the Republic of Korea, China, and Japan with the remaining $2.0 million from Europe, Canada, the Middle East, and Africa. As shown in Exhibit 7.5, Maryland residents made a total of 734 investments, contributing a total of $73.6 million.
Exhibit 7.5
Number and Amount of Program Investments by Investor Location Fiscal 2007-2017
Investor Location Number Amount Average Overseas 28 $5,900,000 $211,200 U.S. Total 1,617 186,900,000 115,600 Maryland 734 73,600,000 100,300 Neighboring 333 33,800,000 101,600 All Other 550 79,400,000 144,400 Total 1,645 $192,800,000 $117,200
Source: Department of Commerce; Department of Legislative Services
Investors in neighboring states contributed about one-fifth of all investment, with Virginia
residents contributing the most investment of any state ($13.3 million). Investors from the District of Columbia and Pennsylvania were also significant investment sources. Of the remaining states that do not border Maryland, about 75 cents out of every investment dollar resulted from 400 investments within 9 states – New York ($12.0 million); California ($11.0 million); and Connecticut, Florida, Georgia, Illinois, Massachusetts, North Carolina, and Washington ($2.4 million). The investments from these states were about one-third of the program’s total investment.
DRAFT
56 Evaluation of the Biotechnology Investment Incentive Tax Credit
Nationally, California investors were the largest source of all U.S. venture capital investments in the second quarter of 2017 (between 30% and 40% of all deals). New York and Massachusetts were the next largest state sources. Overseas participation was significantly higher in the United States compared to the biotechnology investment tax credit program as between 20% and 30% of all venture capital originated from overseas investors. This national pattern of investment is similar to the major private equity investments made in all Maryland-headquartered biotechnology companies between calendar 2007 and 2017. Comparing the source of this investment to nonindividual investment tax credits suggests that the program is attracting investment from neighboring areas, particularly the District of Columbia and Virginia. The program also appeared to attract investment from certain states including Florida (apparently an angel network in the early years of the program) and Georgia (investments related to a biotechnology company board member who resided in the state). However, the program appears to be underperforming in its ability to attract investment from major sources of Maryland biotechnology investment including California, Massachusetts, New York, and from overseas investors. These investors made about one-half of all investments in Maryland biotechnology companies but comprised only 14% of all nonindividual program investors. The lack of investment from these states likely reflects competition from other biotechnology companies and the correlation between program knowledge and physical distance.
Geographic Location of Companies The geographic distribution of participating biotechnology companies in the State is similar
to the location of biotechnology clusters within Maryland. Although companies in nine counties have received program investments, Montgomery County companies received the most investment ($83.3 million) followed by Baltimore City ($56.4 million). These two counties accounted for about three-fourths of all investments. About 85% of the remaining investments were made within Baltimore, Frederick, Howard, and Prince George’s counties. Exhibit 7.6 and Exhibit 7.7 show the total investment by county.
DRAFT
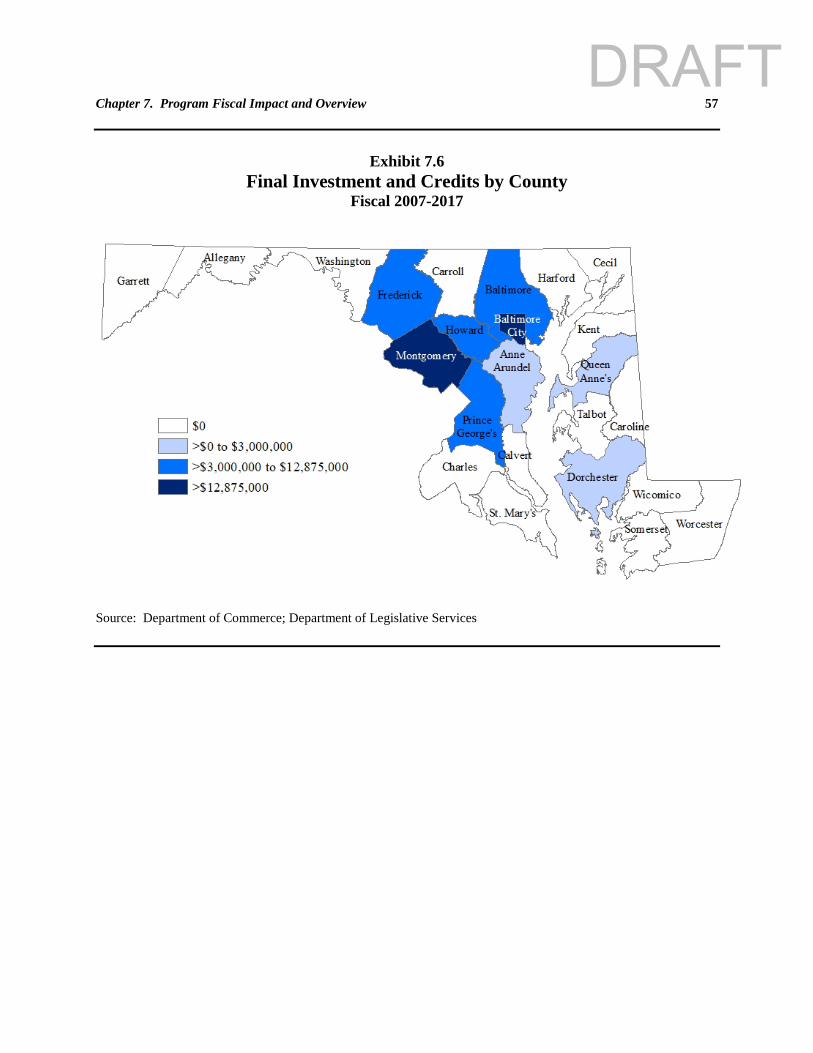
Chapter 7. Program Fiscal Impact and Overview 57
Exhibit 7.6
Final Investment and Credits by County Fiscal 2007-2017
Source: Department of Commerce; Department of Legislative Services
DRAFT
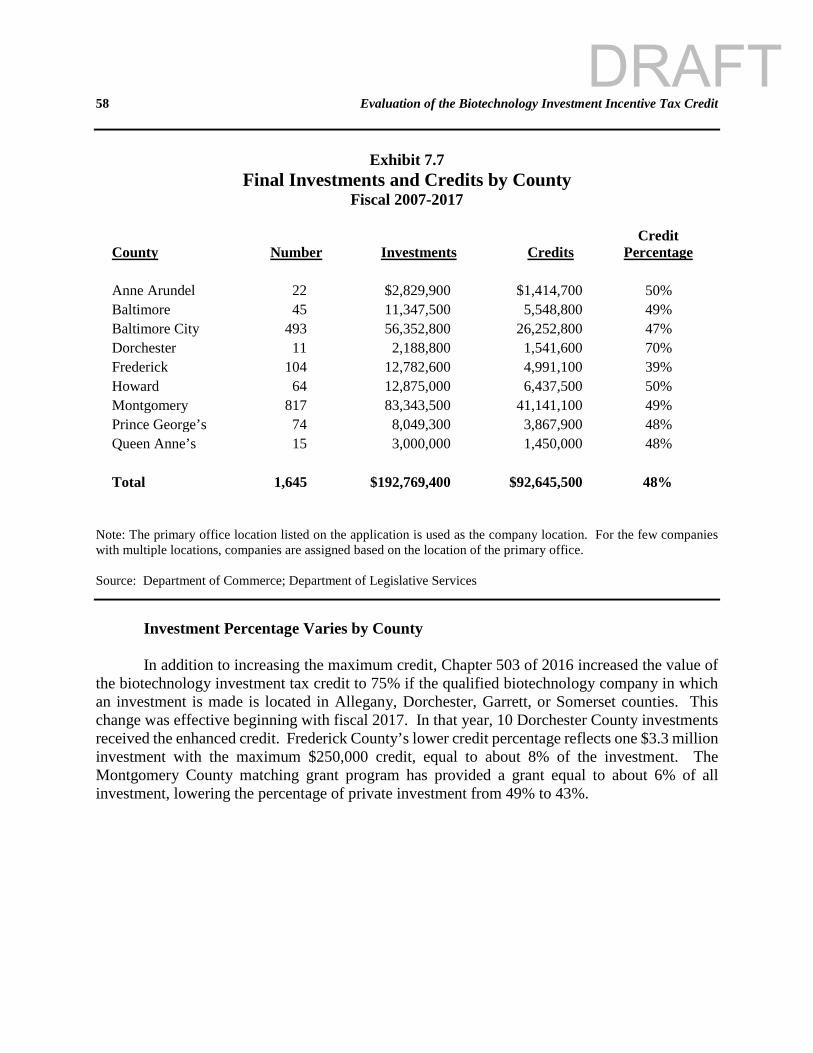
58 Evaluation of the Biotechnology Investment Incentive Tax Credit
Exhibit 7.7 Final Investments and Credits by County
Fiscal 2007-2017
County Number Investments Credits Credit
Percentage Anne Arundel 22 $2,829,900 $1,414,700 50% Baltimore 45 11,347,500 5,548,800 49% Baltimore City 493 56,352,800 26,252,800 47% Dorchester 11 2,188,800 1,541,600 70% Frederick 104 12,782,600 4,991,100 39% Howard 64 12,875,000 6,437,500 50% Montgomery 817 83,343,500 41,141,100 49% Prince George’s 74 8,049,300 3,867,900 48% Queen Anne’s 15 3,000,000 1,450,000 48% Total 1,645 $192,769,400 $92,645,500 48%
Note: The primary office location listed on the application is used as the company location. For the few companies with multiple locations, companies are assigned based on the location of the primary office. Source: Department of Commerce; Department of Legislative Services
Investment Percentage Varies by County In addition to increasing the maximum credit, Chapter 503 of 2016 increased the value of
the biotechnology investment tax credit to 75% if the qualified biotechnology company in which an investment is made is located in Allegany, Dorchester, Garrett, or Somerset counties. This change was effective beginning with fiscal 2017. In that year, 10 Dorchester County investments received the enhanced credit. Frederick County’s lower credit percentage reflects one $3.3 million investment with the maximum $250,000 credit, equal to about 8% of the investment. The Montgomery County matching grant program has provided a grant equal to about 6% of all investment, lowering the percentage of private investment from 49% to 43%.
DRAFT
59
Chapter 8. Shift in Biotechnology Investments Over Time
At the program’s inception, almost all participating companies were in the earlier stages of development (startups and early-stage companies). Over time, subsequent legislative changes allowed later stage companies to participate by extending the maximum years of operation from 10 years to up to 24 years. As a result, participating companies have become much more dissimilar – in company ages, the timeline of their product’s regulatory approval, company valuations, stages of development, and company risk. On the one hand, there are startup companies that are the most unlikely to attract private investment – they have not previously secured significant investment, have just started the technical and regulatory requirements necessary to commercialize a product, are not generating revenue, and have low company valuations. On the other hand, there are later stage companies whose characteristics better enable them to attract additional private investment as some are profitable, entering their second decade of operations, and have made substantial scientific and regulatory progress. A few companies have even secured federal regulatory approval.
The change in the mix of participating companies, primarily caused by the change in company
eligibility requirements, has decreased the program’s effectiveness by:
• concentrating program benefits within a few companies; • shifting program assistance away from early-stage and startup companies to later stage
companies where the evidence shows that the private market is much better at meeting company needs; and
• providing the same credit percentage without regard to the significant difference in
investment risk across companies.
Program funding is capped in each year and is fully allocated. Continuing to provide financial assistance to certain later stage companies has denied funding to startups. As a result, the program now provides less financial support to newly formed companies than it did in its inception.
Most Credits Are Awarded to a Relatively Small Number of Companies
Credit Concentration Highly Correlated to Years of Program Participation
Through fiscal 2017, investments were made in 92 companies and investors received a total
of $92.6 million in credits. The top 10 companies account for a majority ($50.5 million) of the program’s funding. Further, the top company accounts for $10.5 million in credits – this is more than 54 other companies combined. Exhibit 8.1 shows an illustration of the difference in the total
DRAFT
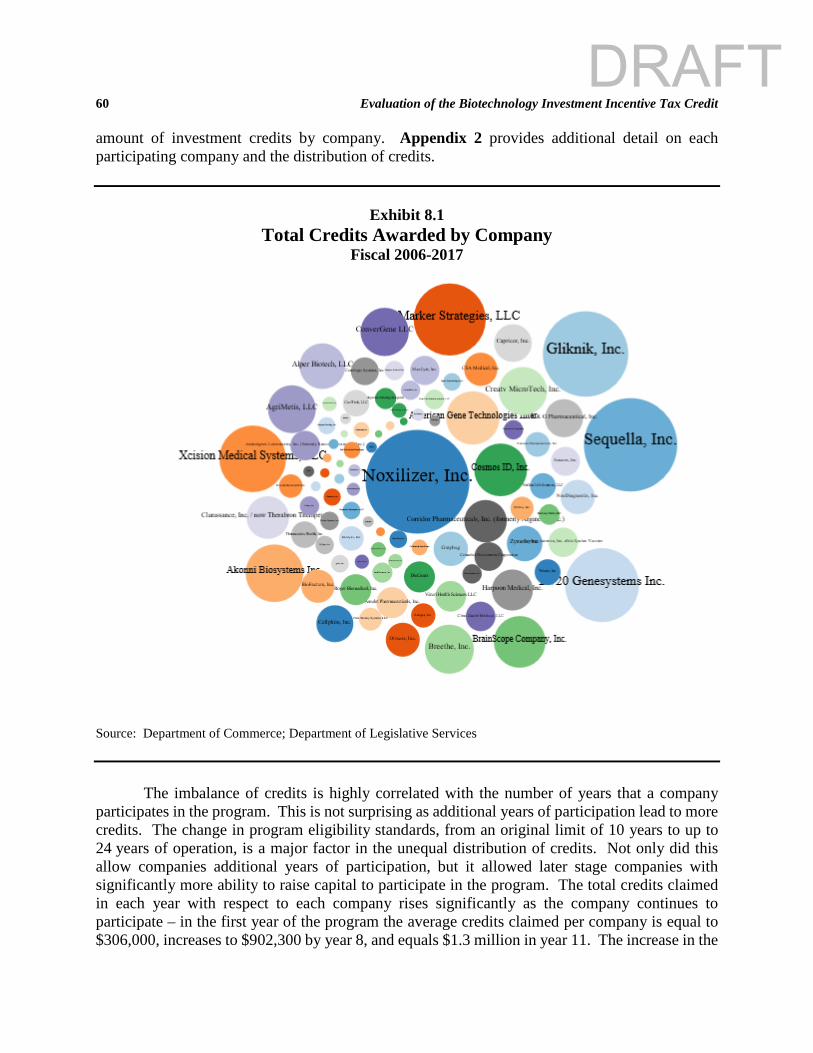
60 Evaluation of the Biotechnology Investment Incentive Tax Credit amount of investment credits by company. Appendix 2 provides additional detail on each participating company and the distribution of credits.
Exhibit 8.1
Total Credits Awarded by Company Fiscal 2006-2017
Source: Department of Commerce; Department of Legislative Services
The imbalance of credits is highly correlated with the number of years that a company
participates in the program. This is not surprising as additional years of participation lead to more credits. The change in program eligibility standards, from an original limit of 10 years to up to 24 years of operation, is a major factor in the unequal distribution of credits. Not only did this allow companies additional years of participation, but it allowed later stage companies with significantly more ability to raise capital to participate in the program. The total credits claimed in each year with respect to each company rises significantly as the company continues to participate – in the first year of the program the average credits claimed per company is equal to $306,000, increases to $902,300 by year 8, and equals $1.3 million in year 11. The increase in the
DRAFT
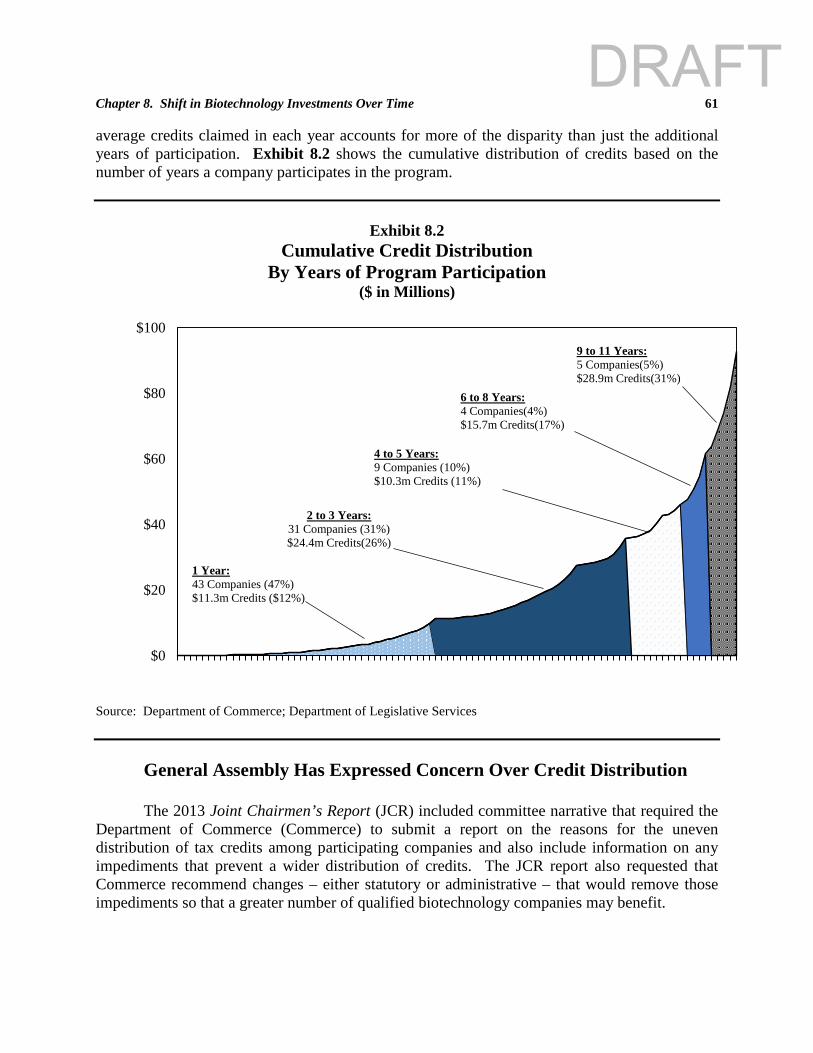
Chapter 8. Shift in Biotechnology Investments Over Time 61 average credits claimed in each year accounts for more of the disparity than just the additional years of participation. Exhibit 8.2 shows the cumulative distribution of credits based on the number of years a company participates in the program.
Exhibit 8.2 Cumulative Credit Distribution
By Years of Program Participation ($ in Millions)
Source: Department of Commerce; Department of Legislative Services
General Assembly Has Expressed Concern Over Credit Distribution
The 2013 Joint Chairmen’s Report (JCR) included committee narrative that required the Department of Commerce (Commerce) to submit a report on the reasons for the uneven distribution of tax credits among participating companies and also include information on any impediments that prevent a wider distribution of credits. The JCR report also requested that Commerce recommend changes – either statutory or administrative – that would remove those impediments so that a greater number of qualified biotechnology companies may benefit.
1 Year:43 Companies (47%)$11.3m Credits ($12%)
2 to 3 Years:31 Companies (31%)$24.4m Credits(26%)
4 to 5 Years:9 Companies (10%)$10.3m Credits (11%)
6 to 8 Years:4 Companies(4%)$15.7m Credits(17%)
9 to 11 Years:5 Companies(5%)$28.9m Credits(31%)
$0
$20
$40
$60
$80
$100
1 4 7 10 13 16 19 22 25 28 31 34 37 40 43 46 49 52 55 58 61 64 67 70 73 76 79 82 85 88 91
DRAFT
62 Evaluation of the Biotechnology Investment Incentive Tax Credit
While Commerce cited several contributing factors in its report, the department concluded that the primary reason was that companies have varying capabilities to raise money and varying capital needs. The department further noted that diagnostic companies needed far less capital than drug discovery (tens or hundreds of millions versus billions) and that companies are at different stages of maturity and have different capital needs.
The department also stated that the purpose of the program is to grow Maryland’s
biotechnology industry – specifically, to attract investment in seed and early-stage, privately held biotechnology companies based in Maryland. Commerce stated that given the original intent of making tax credits available to early-stage companies and distributing these benefits more equitably, the statute is not optimized to achieve these goals. Commerce noted that it lacks the authority to competitively rank biotechnology companies or otherwise alter the distribution of program credits. Commerce recommended legislation that would establish a lifetime limit ($7.0 million) on the total credits that could be claimed with respect to each company and alter the fiscal year company limitation from 15% of the year’s appropriation to $1.5 million. The Department of Legislative Services (DLS) concurs that the program is not optimized to allocate credits in a manner that focuses the program on assisting early-stage companies. DLS notes that the reasons cited by Commerce for the concentration of tax credits do not establish a justification for awarding these large benefits. Specifically, the additional credits awarded for investments in certain companies are not expected to produce additional State benefits such as increased industry and economic development or that the technology will provide significant medical benefits. Given that the largest recipients receive credits that are on average about 30 times the amount provided to companies with the lowest awards, the State should expect significantly better program outcomes for those companies that receive large awards. DLS also notes that medical and diagnostic device companies – not drug therapy companies – account for most of the large tax credit concentrations. Program Has Become Less Open for Investments in New Companies
A total of 35 companies participated in the first two fiscal years of the program. These companies were the first to enter the program and had greater access to funding. The program had the highest average number of new entrants, 19 and 16 in each of these first two years. In the next five fiscal years, an additional 27 companies participated for the first time, an average of 5.4 per year. The number of new entrants since fiscal 2014 has increased modestly as 30 new companies have participated, an average of 7.5 in each year.
The early cohort of companies account for $52.1 million in program funding, more than the other companies combined. This cohort continues to receive significant funding even as the number of these participating companies has decreased to six. Funding to the middle cohort of companies has decreased significantly, even though these companies do not have higher attrition rates. Most of the fiscal 2017 program funding was provided to 15 of the companies that first
DRAFT
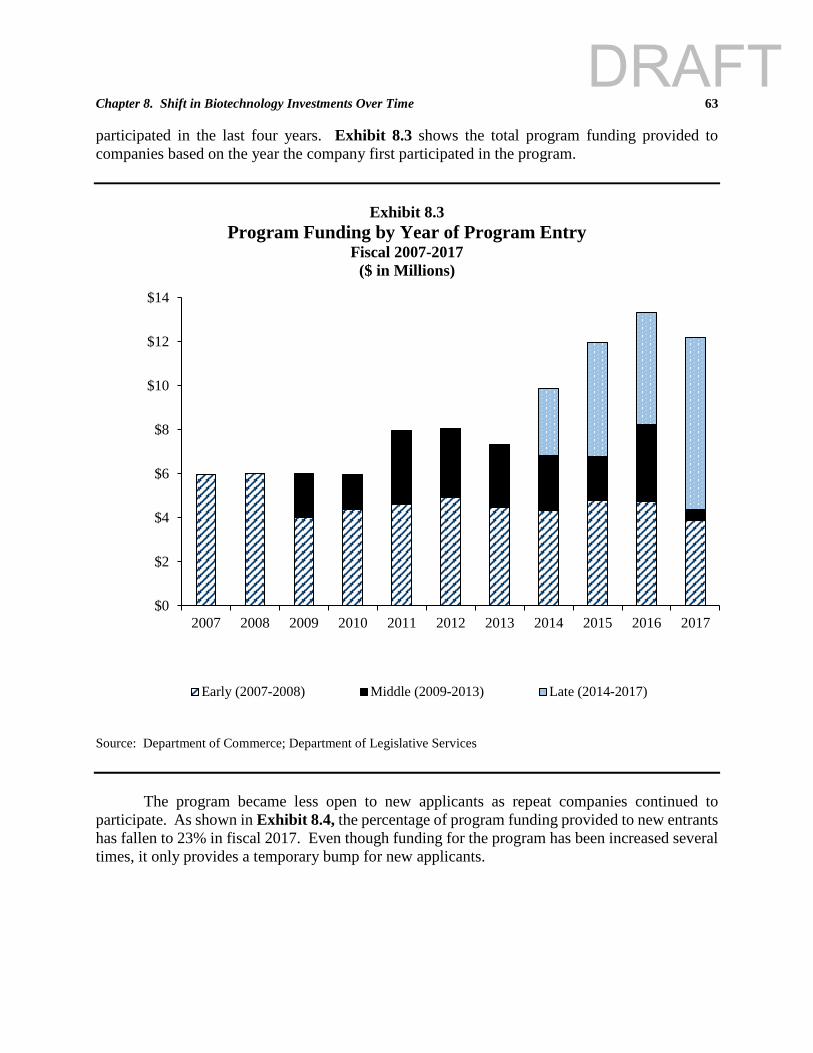
Chapter 8. Shift in Biotechnology Investments Over Time 63 participated in the last four years. Exhibit 8.3 shows the total program funding provided to companies based on the year the company first participated in the program.
Exhibit 8.3
Program Funding by Year of Program Entry Fiscal 2007-2017
($ in Millions)
Source: Department of Commerce; Department of Legislative Services
The program became less open to new applicants as repeat companies continued to
participate. As shown in Exhibit 8.4, the percentage of program funding provided to new entrants has fallen to 23% in fiscal 2017. Even though funding for the program has been increased several times, it only provides a temporary bump for new applicants.
$0
$2
$4
$6
$8
$10
$12
$14
2007 2008 2009 2010 2011 2012 2013 2014 2015 2016 2017
Early (2007-2008) Middle (2009-2013) Late (2014-2017)
DRAFT
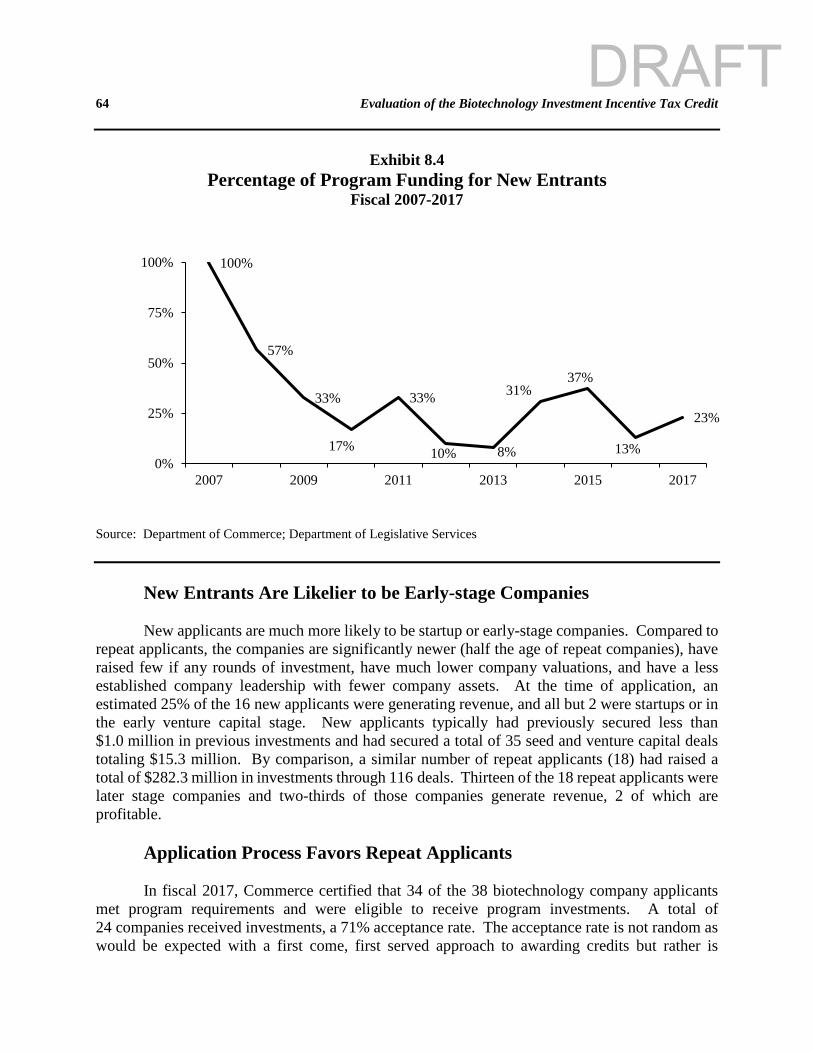
64 Evaluation of the Biotechnology Investment Incentive Tax Credit
Exhibit 8.4 Percentage of Program Funding for New Entrants
Fiscal 2007-2017
Source: Department of Commerce; Department of Legislative Services
New Entrants Are Likelier to be Early-stage Companies
New applicants are much more likely to be startup or early-stage companies. Compared to repeat applicants, the companies are significantly newer (half the age of repeat companies), have raised few if any rounds of investment, have much lower company valuations, and have a less established company leadership with fewer company assets. At the time of application, an estimated 25% of the 16 new applicants were generating revenue, and all but 2 were startups or in the early venture capital stage. New applicants typically had previously secured less than $1.0 million in previous investments and had secured a total of 35 seed and venture capital deals totaling $15.3 million. By comparison, a similar number of repeat applicants (18) had raised a total of $282.3 million in investments through 116 deals. Thirteen of the 18 repeat applicants were later stage companies and two-thirds of those companies generate revenue, 2 of which are profitable.
Application Process Favors Repeat Applicants
In fiscal 2017, Commerce certified that 34 of the 38 biotechnology company applicants met program requirements and were eligible to receive program investments. A total of 24 companies received investments, a 71% acceptance rate. The acceptance rate is not random as would be expected with a first come, first served approach to awarding credits but rather is
100%
57%
33%
17%
33%
10% 8%
31%37%
13%
23%
0%
25%
50%
75%
100%
2007 2009 2011 2013 2015 2017
DRAFT
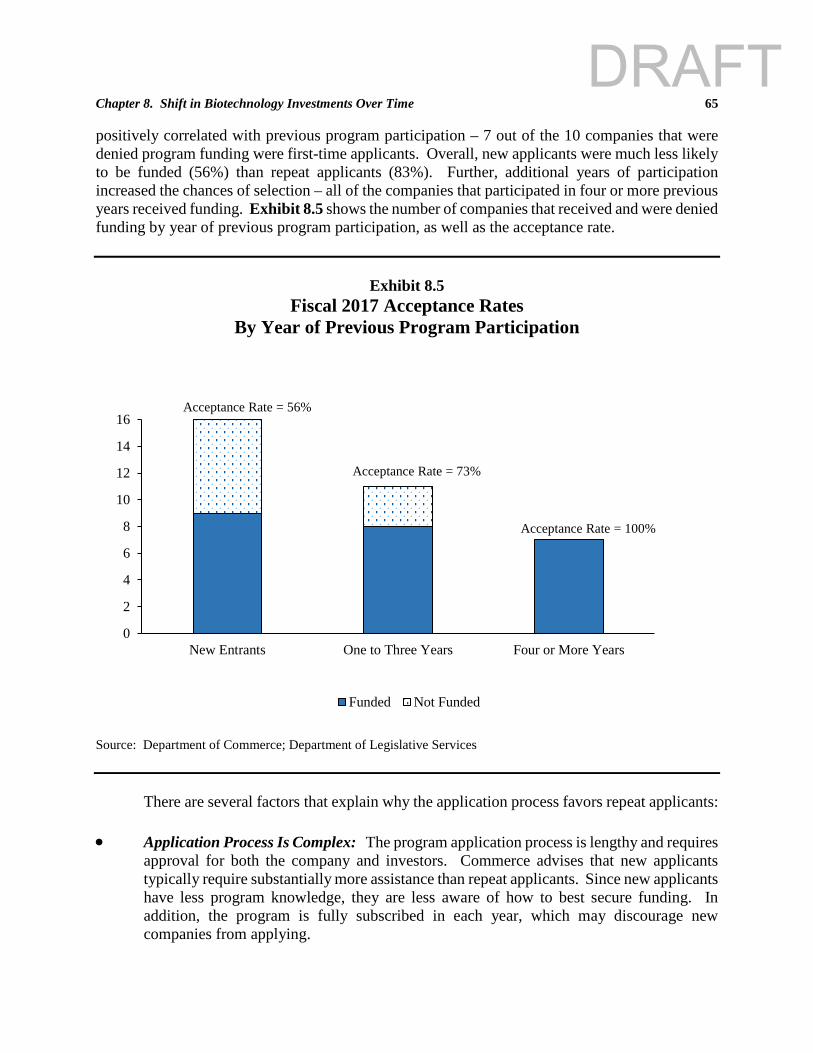
Chapter 8. Shift in Biotechnology Investments Over Time 65 positively correlated with previous program participation – 7 out of the 10 companies that were denied program funding were first-time applicants. Overall, new applicants were much less likely to be funded (56%) than repeat applicants (83%). Further, additional years of participation increased the chances of selection – all of the companies that participated in four or more previous years received funding. Exhibit 8.5 shows the number of companies that received and were denied funding by year of previous program participation, as well as the acceptance rate.
Exhibit 8.5
Fiscal 2017 Acceptance Rates By Year of Previous Program Participation
Source: Department of Commerce; Department of Legislative Services There are several factors that explain why the application process favors repeat applicants: • Application Process Is Complex: The program application process is lengthy and requires
approval for both the company and investors. Commerce advises that new applicants typically require substantially more assistance than repeat applicants. Since new applicants have less program knowledge, they are less aware of how to best secure funding. In addition, the program is fully subscribed in each year, which may discourage new companies from applying.
Acceptance Rate = 56%
Acceptance Rate = 73%
Acceptance Rate = 100%
0
2
4
6
8
10
12
14
16
New Entrants One to Three Years Four or More Years
Funded Not Funded
DRAFT
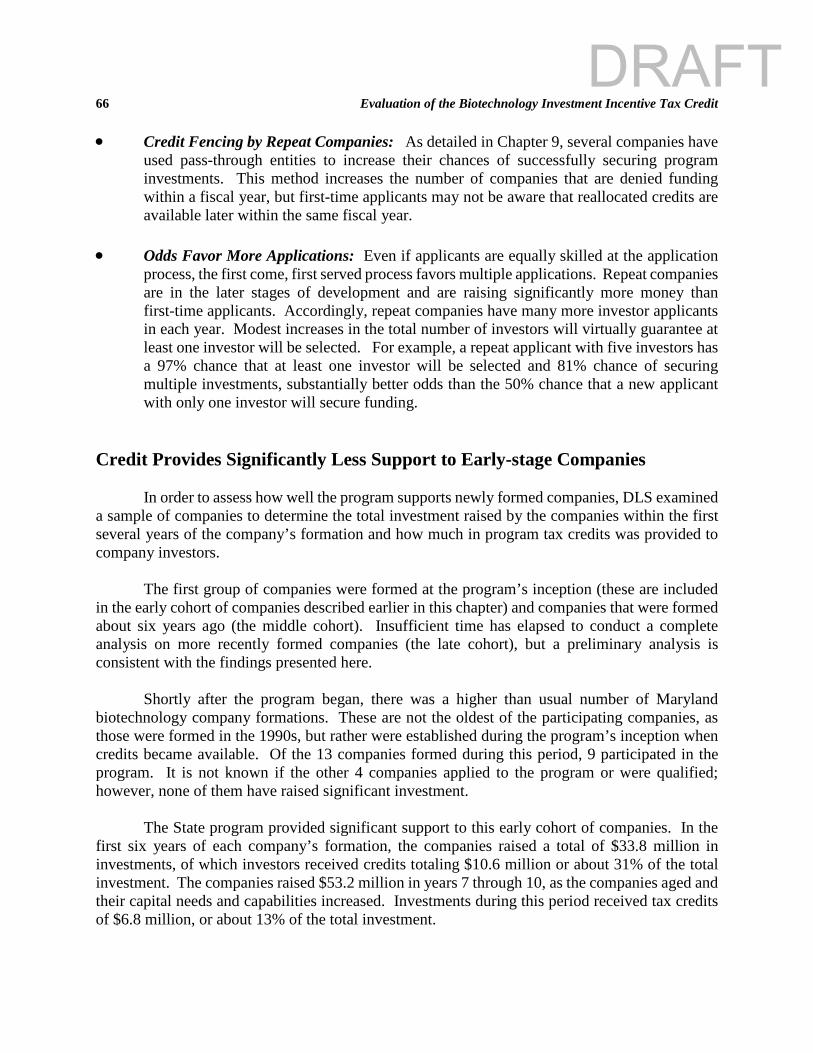
66 Evaluation of the Biotechnology Investment Incentive Tax Credit • Credit Fencing by Repeat Companies: As detailed in Chapter 9, several companies have
used pass-through entities to increase their chances of successfully securing program investments. This method increases the number of companies that are denied funding within a fiscal year, but first-time applicants may not be aware that reallocated credits are available later within the same fiscal year.
• Odds Favor More Applications: Even if applicants are equally skilled at the application
process, the first come, first served process favors multiple applications. Repeat companies are in the later stages of development and are raising significantly more money than first-time applicants. Accordingly, repeat companies have many more investor applicants in each year. Modest increases in the total number of investors will virtually guarantee at least one investor will be selected. For example, a repeat applicant with five investors has a 97% chance that at least one investor will be selected and 81% chance of securing multiple investments, substantially better odds than the 50% chance that a new applicant with only one investor will secure funding.
Credit Provides Significantly Less Support to Early-stage Companies In order to assess how well the program supports newly formed companies, DLS examined a sample of companies to determine the total investment raised by the companies within the first several years of the company’s formation and how much in program tax credits was provided to company investors.
The first group of companies were formed at the program’s inception (these are included in the early cohort of companies described earlier in this chapter) and companies that were formed about six years ago (the middle cohort). Insufficient time has elapsed to conduct a complete analysis on more recently formed companies (the late cohort), but a preliminary analysis is consistent with the findings presented here.
Shortly after the program began, there was a higher than usual number of Maryland
biotechnology company formations. These are not the oldest of the participating companies, as those were formed in the 1990s, but rather were established during the program’s inception when credits became available. Of the 13 companies formed during this period, 9 participated in the program. It is not known if the other 4 companies applied to the program or were qualified; however, none of them have raised significant investment.
The State program provided significant support to this early cohort of companies. In the first six years of each company’s formation, the companies raised a total of $33.8 million in investments, of which investors received credits totaling $10.6 million or about 31% of the total investment. The companies raised $53.2 million in years 7 through 10, as the companies aged and their capital needs and capabilities increased. Investments during this period received tax credits of $6.8 million, or about 13% of the total investment.
DRAFT
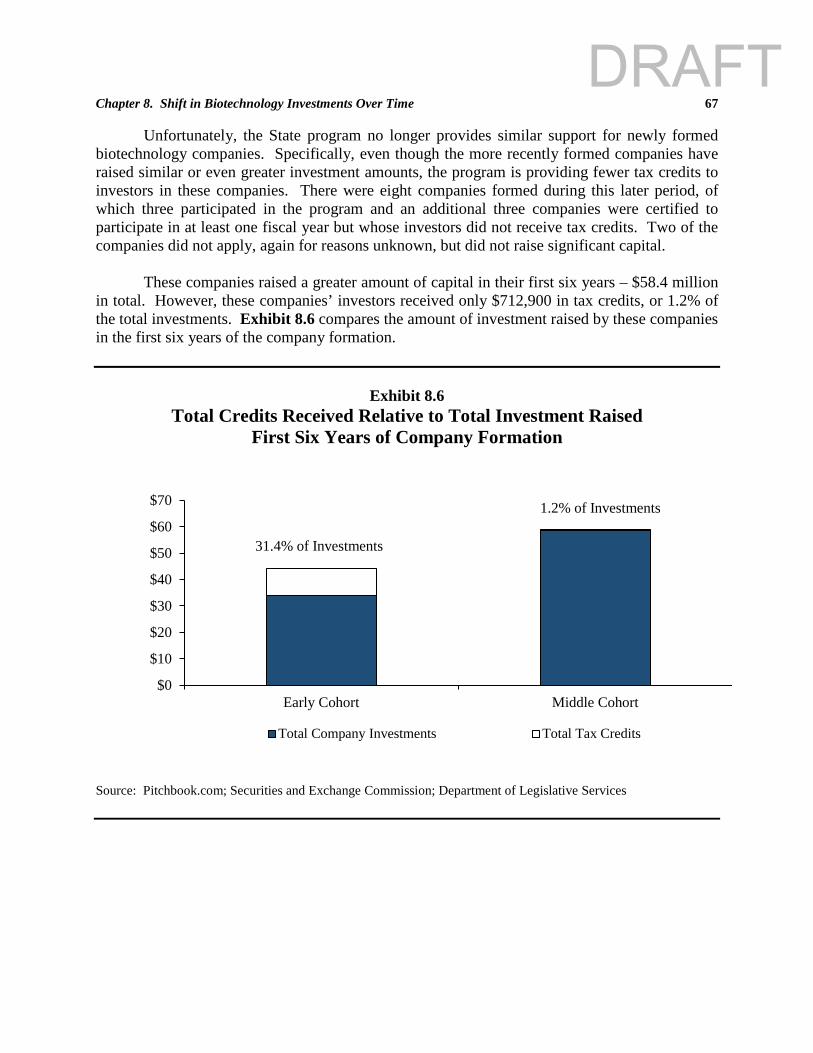
Chapter 8. Shift in Biotechnology Investments Over Time 67 Unfortunately, the State program no longer provides similar support for newly formed biotechnology companies. Specifically, even though the more recently formed companies have raised similar or even greater investment amounts, the program is providing fewer tax credits to investors in these companies. There were eight companies formed during this later period, of which three participated in the program and an additional three companies were certified to participate in at least one fiscal year but whose investors did not receive tax credits. Two of the companies did not apply, again for reasons unknown, but did not raise significant capital.
These companies raised a greater amount of capital in their first six years – $58.4 million in total. However, these companies’ investors received only $712,900 in tax credits, or 1.2% of the total investments. Exhibit 8.6 compares the amount of investment raised by these companies in the first six years of the company formation.
Exhibit 8.6
Total Credits Received Relative to Total Investment Raised First Six Years of Company Formation
Source: Pitchbook.com; Securities and Exchange Commission; Department of Legislative Services
31.4% of Investments
1.2% of Investments
$0
$10
$20
$30
$40
$50
$60
$70
Early Cohort Middle Cohort
Total Company Investments Total Tax Credits
DRAFT
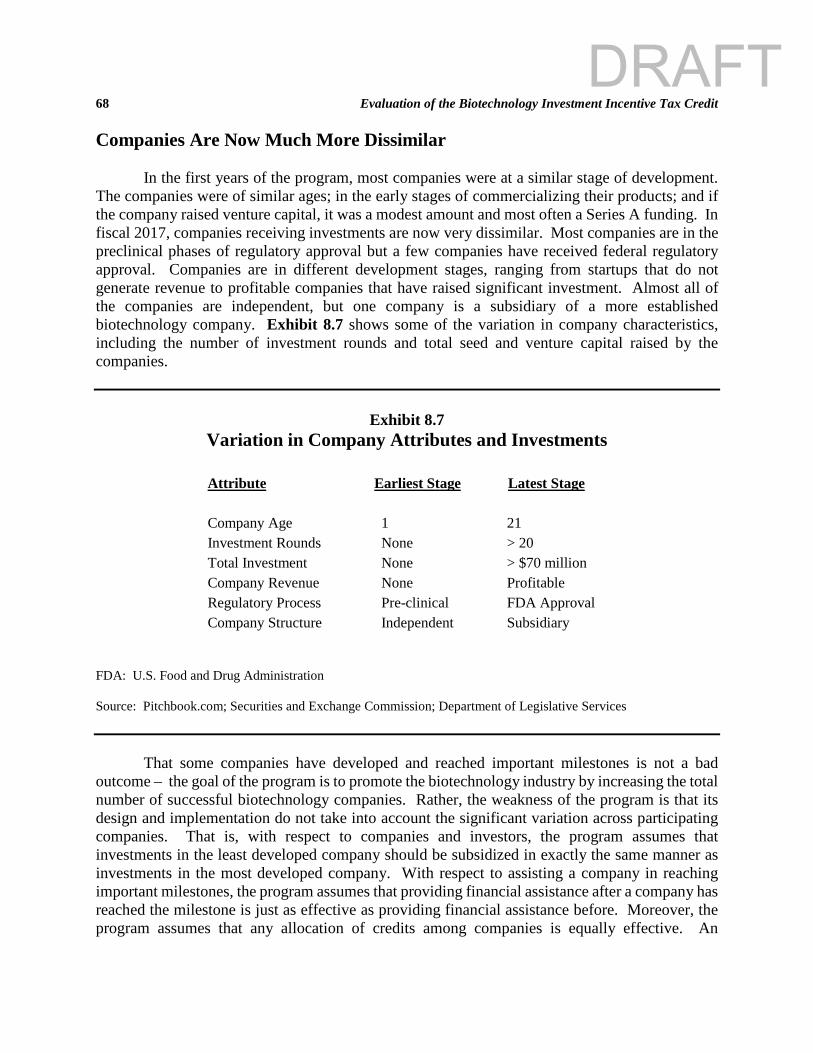
68 Evaluation of the Biotechnology Investment Incentive Tax Credit Companies Are Now Much More Dissimilar
In the first years of the program, most companies were at a similar stage of development. The companies were of similar ages; in the early stages of commercializing their products; and if the company raised venture capital, it was a modest amount and most often a Series A funding. In fiscal 2017, companies receiving investments are now very dissimilar. Most companies are in the preclinical phases of regulatory approval but a few companies have received federal regulatory approval. Companies are in different development stages, ranging from startups that do not generate revenue to profitable companies that have raised significant investment. Almost all of the companies are independent, but one company is a subsidiary of a more established biotechnology company. Exhibit 8.7 shows some of the variation in company characteristics, including the number of investment rounds and total seed and venture capital raised by the companies.
Exhibit 8.7
Variation in Company Attributes and Investments
Attribute Earliest Stage Latest Stage Company Age 1 21 Investment Rounds None > 20 Total Investment None > $70 million Company Revenue None Profitable Regulatory Process Pre-clinical FDA Approval Company Structure Independent Subsidiary
FDA: U.S. Food and Drug Administration Source: Pitchbook.com; Securities and Exchange Commission; Department of Legislative Services
That some companies have developed and reached important milestones is not a bad
outcome – the goal of the program is to promote the biotechnology industry by increasing the total number of successful biotechnology companies. Rather, the weakness of the program is that its design and implementation do not take into account the significant variation across participating companies. That is, with respect to companies and investors, the program assumes that investments in the least developed company should be subsidized in exactly the same manner as investments in the most developed company. With respect to assisting a company in reaching important milestones, the program assumes that providing financial assistance after a company has reached the milestone is just as effective as providing financial assistance before. Moreover, the program assumes that any allocation of credits among companies is equally effective. An
DRAFT
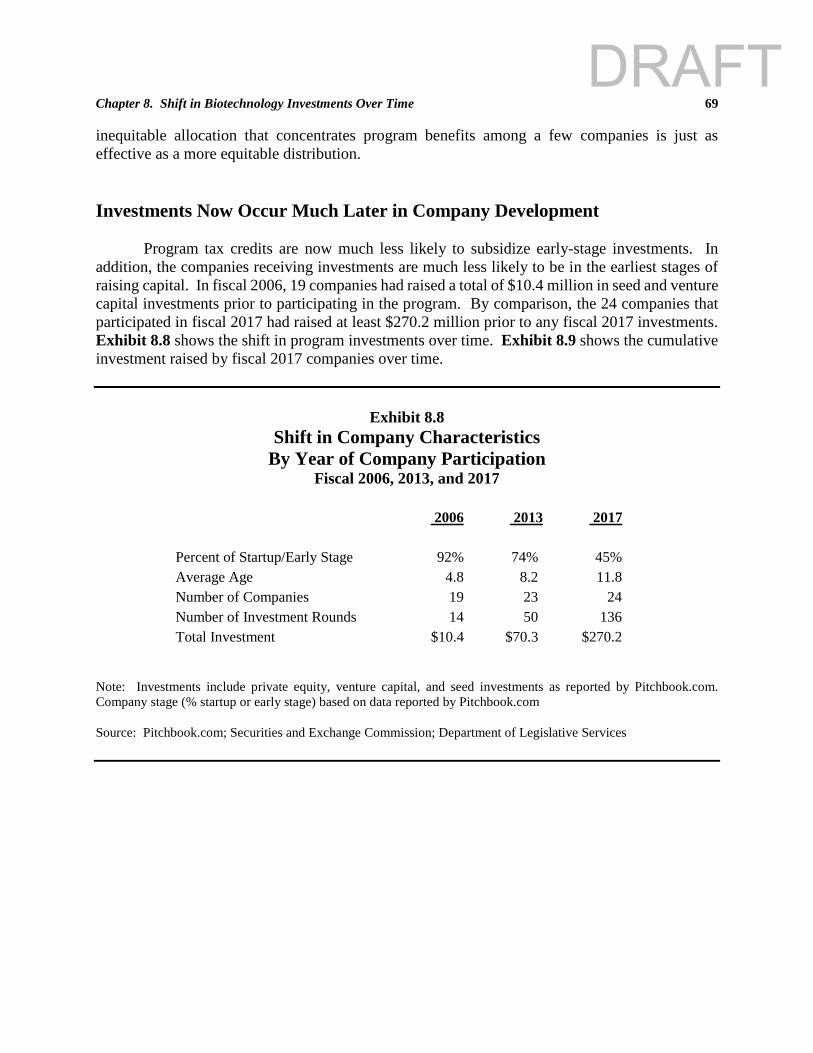
Chapter 8. Shift in Biotechnology Investments Over Time 69 inequitable allocation that concentrates program benefits among a few companies is just as effective as a more equitable distribution.
Investments Now Occur Much Later in Company Development Program tax credits are now much less likely to subsidize early-stage investments. In addition, the companies receiving investments are much less likely to be in the earliest stages of raising capital. In fiscal 2006, 19 companies had raised a total of $10.4 million in seed and venture capital investments prior to participating in the program. By comparison, the 24 companies that participated in fiscal 2017 had raised at least $270.2 million prior to any fiscal 2017 investments. Exhibit 8.8 shows the shift in program investments over time. Exhibit 8.9 shows the cumulative investment raised by fiscal 2017 companies over time.
Exhibit 8.8
Shift in Company Characteristics By Year of Company Participation
Fiscal 2006, 2013, and 2017
2006 2013 2017
Percent of Startup/Early Stage 92% 74% 45% Average Age 4.8 8.2 11.8 Number of Companies 19 23 24 Number of Investment Rounds 14 50 136 Total Investment $10.4 $70.3 $270.2
Note: Investments include private equity, venture capital, and seed investments as reported by Pitchbook.com. Company stage (% startup or early stage) based on data reported by Pitchbook.com Source: Pitchbook.com; Securities and Exchange Commission; Department of Legislative Services
DRAFT
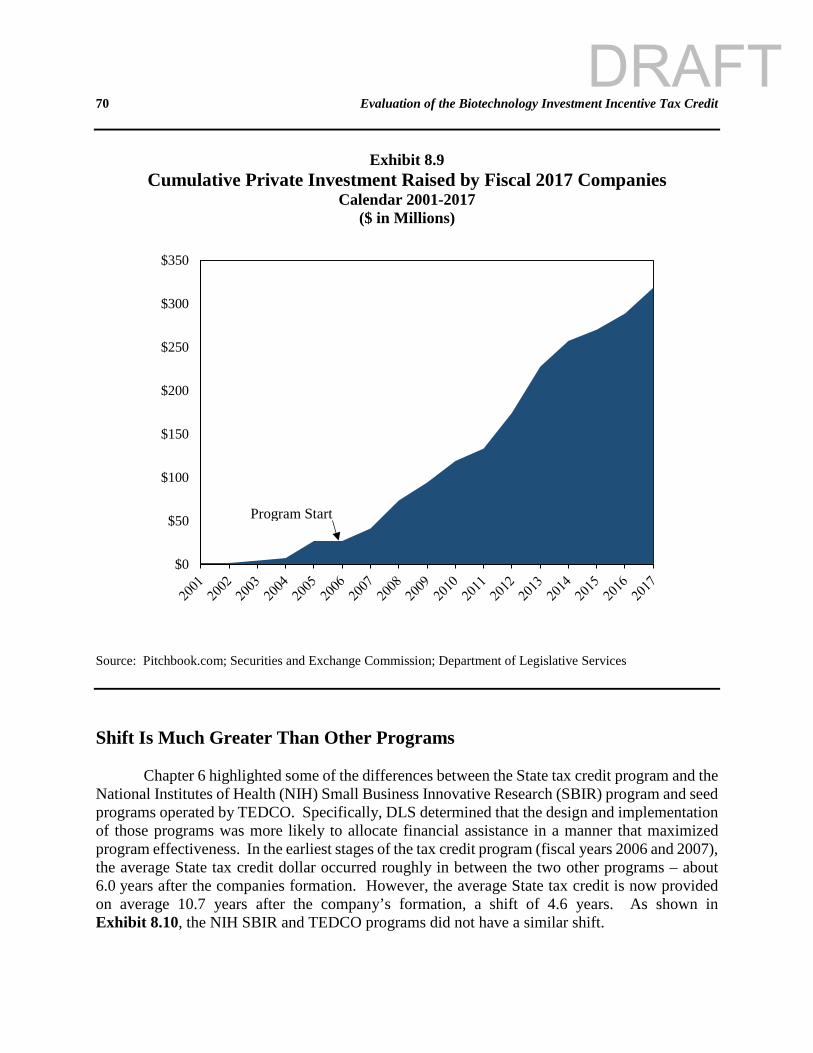
70 Evaluation of the Biotechnology Investment Incentive Tax Credit
Exhibit 8.9 Cumulative Private Investment Raised by Fiscal 2017 Companies
Calendar 2001-2017 ($ in Millions)
Source: Pitchbook.com; Securities and Exchange Commission; Department of Legislative Services Shift Is Much Greater Than Other Programs
Chapter 6 highlighted some of the differences between the State tax credit program and the
National Institutes of Health (NIH) Small Business Innovative Research (SBIR) program and seed programs operated by TEDCO. Specifically, DLS determined that the design and implementation of those programs was more likely to allocate financial assistance in a manner that maximized program effectiveness. In the earliest stages of the tax credit program (fiscal years 2006 and 2007), the average State tax credit dollar occurred roughly in between the two other programs – about 6.0 years after the companies formation. However, the average State tax credit is now provided on average 10.7 years after the company’s formation, a shift of 4.6 years. As shown in Exhibit 8.10, the NIH SBIR and TEDCO programs did not have a similar shift.
$0
$50
$100
$150
$200
$250
$300
$350
Program Start
DRAFT
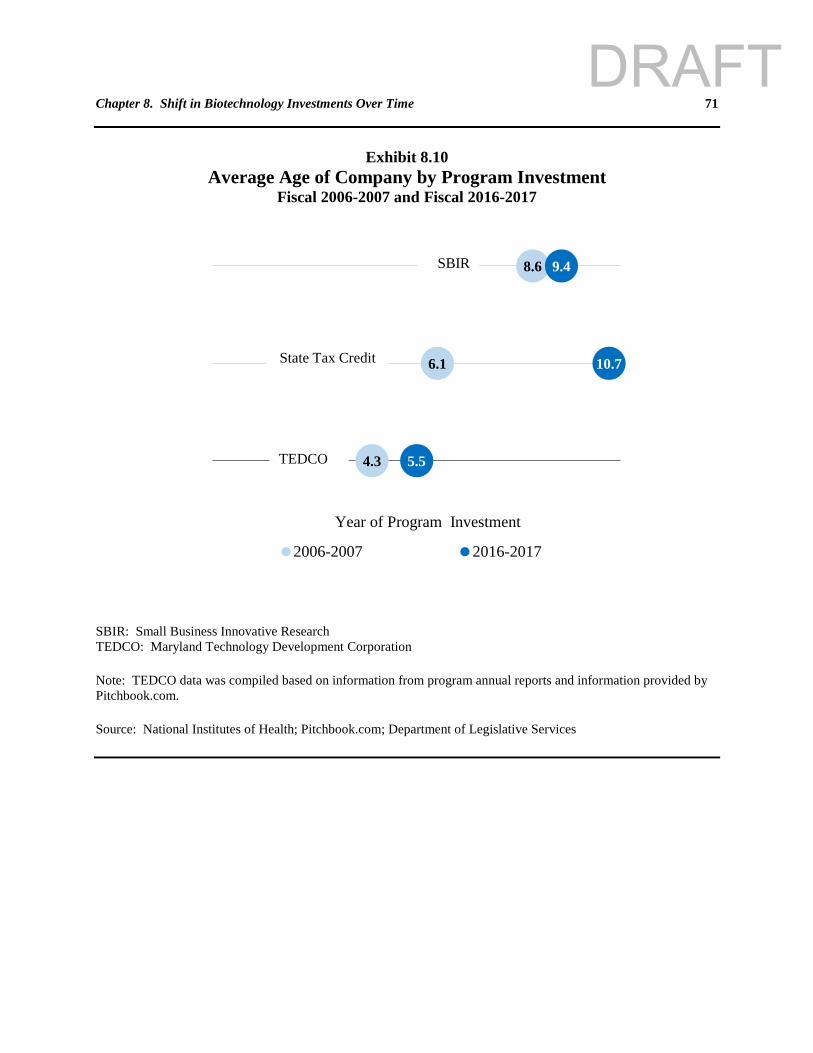
Chapter 8. Shift in Biotechnology Investments Over Time 71
Exhibit 8.10
Average Age of Company by Program Investment Fiscal 2006-2007 and Fiscal 2016-2017
SBIR: Small Business Innovative Research TEDCO: Maryland Technology Development Corporation Note: TEDCO data was compiled based on information from program annual reports and information provided by Pitchbook.com. Source: National Institutes of Health; Pitchbook.com; Department of Legislative Services
8.6
6.1
4.3
9.4
10.7
5.51
2
3
- 6.0
2006-2007 2016-2017
SBIR
State Tax Credit
TEDCO
Year of Program Investment
DRAFT

72 Evaluation of the Biotechnology Investment Incentive Tax Credit
DRAFT
73
Chapter 9. Credit Implementation and Process Issues
Program Application Process
Since biotechnology investment incentive tax credits are issued on a first come, first served basis, the timing of application submissions determines funding outcomes. At least 30 but no more than 60 calendar days prior to making an investment, investors must submit Form A to the Department of Commerce (Commerce), and a qualified Maryland biotechnology company must submit Form B. Generally, beginning in mid-May, Commerce begins accepting Form B applications and will provide a precertification to an eligible company; this occurs as soon as the applications have been reviewed with notification letters sent out by early June. Beginning in June, investors can apply for and receive an electronic user name and reference number.
On the first business day of July, an investor electronically submits an application on the
biotechnology investment incentive tax credit website operated by Commerce. Commerce approves or denies an investor’s application by determining the submission order of the investor’s user name and reference number. Commerce advises that typically 250 investors will submit applications on this day and that funds are exhausted within two minutes after the start of the application process. On August 8, 2017, Commerce issued a total of $12 million in initial fiscal 2018 tax credit certificates to the first 136 investors.
In some cases, the final amount of investment is less than reflected in the initial tax
certificate, or the investor does not timely make the required investment. In these cases, the credit is rescinded by Commerce and the initial credit amounts awarded to those investors are subsequently reallocated to other investors. Around September 15 of the same year, Commerce issues additional reallocated tax credits and expects that it will repeat that process three or four more times throughout the fiscal year before all tax credits are awarded. Approximately 50 additional investors will subsequently apply throughout the remainder of the fiscal year. However, the vast majority of credits are issued in the first allocation based on the investor submissions on the first business day of July.
Application Process Has Improved but Challenges Remain
Prior to implementation of the electronic application process, investors physically queued
up to apply for tax credits. According to the Washington Post, in 2008, investors queued up as early as 17 hours before the department opened for business the next day. In 2009, individuals physically queued up as early as five days prior to the issuance of credits. Although the online application submission process eliminated the need for investors to camp out for credits, other issues have emerged related to the need to submit and process applications within a limited amount of time. Commerce established a new online application system for fiscal 2018 applications, which included a digital clock feature that signaled the start of the application period.
DRAFT
74 Evaluation of the Biotechnology Investment Incentive Tax Credit
Several companies and organizations have expressed frustrations with the newly established process. According to one investor, Commerce incorrectly provided another investor’s user name, complicating the application process for both investors. One company stated that it had expended significant effort to attract first-time investors, but those investors were frustrated with the process and may not participate in the future. Commerce advises that although it had received complaints that its digital clock malfunctioned, it subsequently tested the system and does not believe the system malfunctioned. Companies Now Have Two Months to Meet Program Requirements
Chapters 475 and 476 of 2017 generally provide an additional two months for an applicant that does not currently meet specified program requirements to qualify as a biotechnology company. The eligibility change is intended to assist newly formed companies, including spinouts, by allowing those companies additional time to qualify for the credit.
Given the recent enactment of this statute, it is not yet possible to determine its impact;
however, Commerce has advised that the statute may complicate credit verification and could delay the awarding of credits at the beginning of each fiscal year. Pursuant to the statute, Commerce must issue an initial credit certificate to an investor even though the company may not currently meet program requirements. Commerce advises that this could lead to confusion, as the department will rescind the tax credit certificate if the business subsequently fails to meet program requirements, even though the investor made the required investment.
Commerce also expressed skepticism that the two-month grace period will have a
meaningful benefit as it typically takes additional time to establish a research laboratory and prepare financial statements. However, Commerce has noted that qualified biotechnology company applications increased in fiscal 2018, but it is not yet clear the extent to which any new applicants qualified due to the statutory change.
Some Companies Have Lower Than Expected Final Investments
Compared to other State tax credit programs, final biotechnology incentive investment tax credits are more likely to be less than the amounts approved in the initial tax credit certificates. This can be expected given the complexity of the credit and that, unlike most other programs, an agreement must be finalized between the investor and the company before the final credit can be claimed. On average, final credits are approximately 9% less than initial tax credit certificate amounts, mainly due to lower than initially projected final investments (underinvestment).
Underinvestment has increased over time to a little more than 12% in fiscal 2017, approximately double that when compared to the program’s first few years. However, the underinvestment is not uniformly distributed among program participants; three-fourths of the total amount comes from 18 companies, even though these companies’ investors received only one-fifth
DRAFT
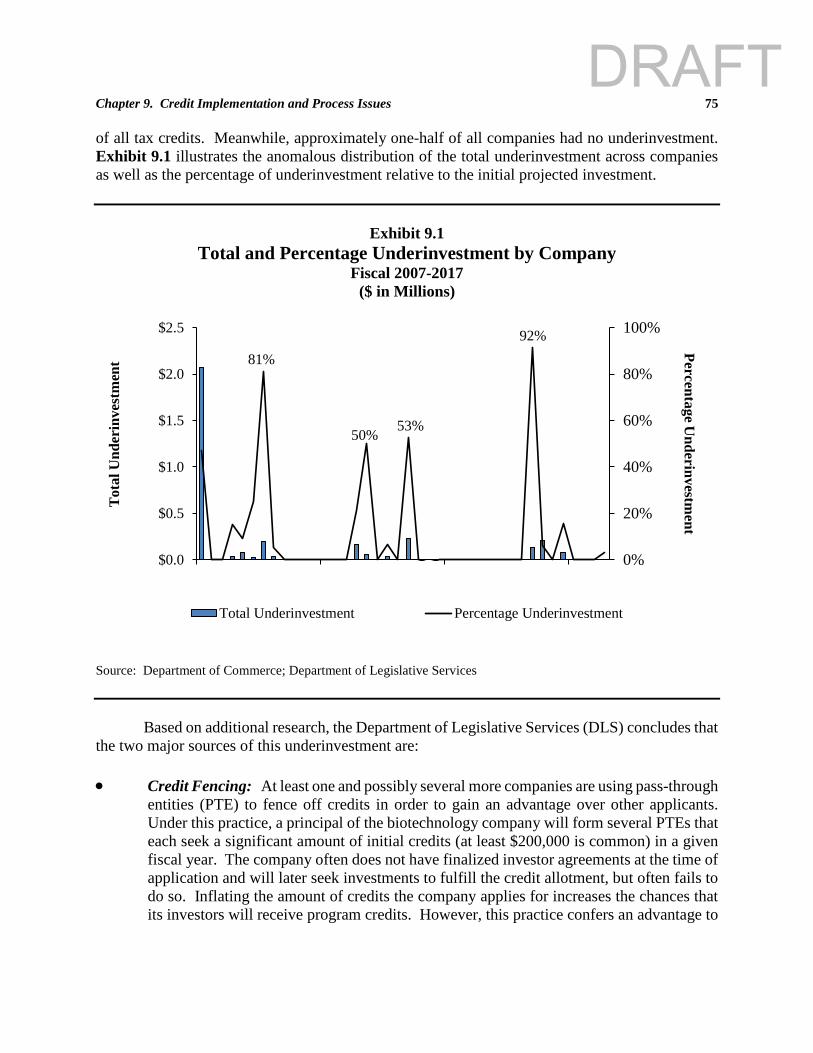
Chapter 9. Credit Implementation and Process Issues 75 of all tax credits. Meanwhile, approximately one-half of all companies had no underinvestment. Exhibit 9.1 illustrates the anomalous distribution of the total underinvestment across companies as well as the percentage of underinvestment relative to the initial projected investment.
Exhibit 9.1
Total and Percentage Underinvestment by Company Fiscal 2007-2017
($ in Millions)
Source: Department of Commerce; Department of Legislative Services
Based on additional research, the Department of Legislative Services (DLS) concludes that
the two major sources of this underinvestment are:
• Credit Fencing: At least one and possibly several more companies are using pass-through entities (PTE) to fence off credits in order to gain an advantage over other applicants. Under this practice, a principal of the biotechnology company will form several PTEs that each seek a significant amount of initial credits (at least $200,000 is common) in a given fiscal year. The company often does not have finalized investor agreements at the time of application and will later seek investments to fulfill the credit allotment, but often fails to do so. Inflating the amount of credits the company applies for increases the chances that its investors will receive program credits. However, this practice confers an advantage to
81%
50% 53%
92%
0%
20%
40%
60%
80%
100%
$0.0
$0.5
$1.0
$1.5
$2.0
$2.5
1 4 7 10 13 16 19 22 25 28 31 34 37 40
Percentage Underinvestm
entT
otal
Und
erin
vest
men
t
Total Underinvestment Percentage Underinvestment
DRAFT
76 Evaluation of the Biotechnology Investment Incentive Tax Credit
the credit fencing company at the expense of other companies and increases the number of companies whose investors are denied funding.
• Tepid Investor Demand: A number of companies, despite a generous standard credit of 50% and enhanced credit of 75%, struggle to attract investment. Companies that have significant underinvestment are more likely to have negative program outcomes (i.e., cease operations, move out of state, or have limited investment and company valuation growth).
Credit Fencing Harms Other Companies
PTE investors are an important source of program investment, contributing to about one-half of all companies and providing about one-quarter of all investment dollars. The vast majority of these PTEs are not associated with companies and do not have significant underinvestment. In recent years, the program has been oversubscribed as the amount of available credits is less than the amount sought by investors. As noted above, those investors who are not awarded initial credits within the first few minutes of the application process are typically unable to participate in the program. Companies have learned that they can gain an advantage by forming multiple PTEs to increase the total credits that their investors would otherwise receive in the fiscal year. This advantage is at the cost of other applicants, who are likely new to the program and/or early-stage companies that lack similar resources. By fencing off these initial credit certificates, the companies obtain an extended period of time during which they can obtain investments while also denying funding to companies competing for investors.
When the final investment of these PTEs is less than the proposed investment, Commerce will reallocate these credits to other companies; however, this typically occurs several months after the first round of applications. Unlike in the initial application round, investors and companies have uncertainty as to the available funding to be reallocated. In its 2013 report on the distribution of program credits, Commerce noted that even though credits are reallocated later in the year, many companies have the perception that tax credits are exhausted after the first round and have become discouraged from applying after the first allocation. In the absence of credit fencing, fewer companies would be denied funding and have the investment agreements that they have reached with investors placed in jeopardy.
Similarities with Heritage Structure Rehabilitation Program
The Maryland Historical Trust (MHT) competitively awards tax credits under the Heritage Structure Rehabilitation Program. Prior to the establishment of the competitive process, credits were awarded on a first come, first served basis. In addition to improving the program in other ways, MHT noted that the competitive process eliminated one issue that was present when credits were not competitively awarded. Some applicants would secure initial credit certificates, even though the proposed project was not financially viable, and would then shop around for investors, but the proposed project would ultimately not proceed. The competitive process used to allocate credits eliminated this program inefficiency.
DRAFT
Chapter 9. Credit Implementation and Process Issues 77
One Company Is the Source of Most Credit Fencing The process of fencing off credits begins with the filing of articles of incorporation for a
PTE by a principal of a biotechnology company. Each year, the principal will form multiple PTEs, with subsequent iterations designated numerically (e.g., Hat Trick Investors #1, Hat Trick Investors #2, etc.). These PTEs have the same principal place of business as the qualified biotechnology company. The principal of the corporation will submit an application to Commerce to be approved as an investor and receive an electronic user name and reference number for each PTE.
In fiscal 2010 through 2015, a principal of one biotechnology company formed at least
17 PTEs that applied for program credits. The total amount of underinvestment of the PTEs formed by this one company was more than double the underinvestment of the 51 other Maryland-based PTEs that invested in other companies. Commerce awarded the 17 PTEs initial credit certificates totaling $3.2 million, but the total final credits awarded equaled $1.2 million, resulting in the reallocation of $2.0 million in credits.
PTE Applications Do Not Substantiate Investment Amount
Applications for credits must include specified information, including the proposed investment amount. The initial credit certificate is equal to the proposed investment, up to the program’s maximum limits. In most instances, the applications submitted by the PTEs established to fence credits do not substantiate the total proposed investment amount. The applications either contain information on each investment from the PTE investors that in total are far less than the proposed total investment or do not have any information at all. Despite lacking this information, Commerce awarded these PTEs substantial initial credit certificates.
Lower Final Investments Are Associated with Poor Program Outcomes Final investments for 18 companies were at least 10% or less than the initial proposed
investment amount. One of these companies is the most frequent user of PTEs to secure funding as described in the previous section. The remaining 17 companies received $14.6 million in final credits; on average, this was 20% less than the initial certificate amounts. About three-quarters of these companies have ceased operations, moved out of the State, or secured limited additional investment. The greater the underinvestment, the more likely a poor program outcome resulted – for example, of the 7 firms in which the final investment was less than 20% of the amount initially certified, 2 have closed, 2 have moved out of state, and the remaining 3 firms had limited investments (including investments not made through the program).
Since credits are not competitively awarded, companies that struggle to secure investment
may continue to participate in the program, thereby increasing the State’s commitment to companies that often ultimately move out of state or cease operations. This reduces the funds that are available to more sustainable companies.
DRAFT
78 Evaluation of the Biotechnology Investment Incentive Tax Credit Inside Investors Are Eligible to Claim Tax Credits
As discussed in Chapter 3, many state angel investor programs exclude inside investors from claiming tax credits. Inside investors typically include individuals who are/were a company founder, executive principal, board member, or general partner at the time of investment, or individuals who are/were an immediate family member of those individuals. One rationale cited for the exclusion of inside investors is that these investors have a strong personal stake in the firm’s success and likely would have invested in the absence of the tax credit. Generally, the purpose of investment programs is to expand the pool of investors and incentivize investment that would not have otherwise been made.
A recent evaluation of Minnesota’s angel investor tax credit program cites research that
principal owners account for 63% of equity investment in U.S. small businesses and that insiders, including other members of the startup team, account for much of the remaining equity, particularly for seed and startup stages. A commonly cited example is the investment that Amazon Chief Executive Officer (CEO) Jeff Bezo’s parents made during the earliest stages of the company’s development.
In the first Biotechnology Investment Incentive Tax Credit Program annual report
(calendar 2006), Commerce recommended nine program changes, including a prohibition on company insiders from claiming the credit. Bills introduced in 2006 and 2007 by Commerce proposed to implement many of these changes, but the bills ultimately failed. In the 2008 session, the department again introduced legislation to implement these changes (HB 723). As introduced, the bill proposed to alter the definition of investor to exclude any individual or entity that, before the investment was made, was a founder, principal, officer, or a member or general partner of the qualified biotechnology company or a parent, spouse, or child of those parties, of the qualified biotechnology company. As passed by the General Assembly, Chapter 518 of 2008 altered the program in several ways, including incorporating several of the department’s recommendations, but the legislation did not exclude company insider participation.
Company Insider Credit Activity
DLS examined investor data and found company insider participation in about one-half of the companies, some of which had extensive participation. These insiders include current and former CEOs, co-founders, board members, and executives. Overall, insider investors made about 10% of all program investments. The estimate only includes a minimal number of family members due to the difficulty in identifying those individuals, thereby underestimating the extent of the participation. The investments of at least six of the companies that participated in the program for only one year were exclusively made by insider investors.
Early-stage companies often fail because they cannot obtain adequate investment, even if the company has a promising technology. Private investors are scarce, and the company is typically not generating revenue. Contributions from company insiders, family, and friends can be a critical source of funds. Although companies continue to face funding challenges, it becomes
DRAFT
Chapter 9. Credit Implementation and Process Issues 79 less acute as investors begin to provide investment to successful companies with demonstrated growth and technological progress. In addition, companies also start generating revenue, and the companies’ valuation increases, which in turn helps those companies raise additional capital.
The average insider investment was made eight years after the company’s start of
operations. DLS examined in detail the insider investment activity of four companies. About two-thirds of the investment identified as being made by company insiders occurred well into the company’s development. At the point of the investments, the companies were generating revenue; their valuations had increased exponentially; in one case, the company had secured a licensing agreement with a major pharmaceutical company. Investment by company insiders at this stage had minimal impact on the company’s future prospects despite the substantial benefit conferred to the insiders.
Company Age Criterion Is Problematic
A key factor in determining eligibility for a biotechnology company is the number of years a company has been active. The age of a company emerged as an eligibility factor primarily because it is often correlated with the company’s ability to generate revenue and secure sufficient financing. Solely using the company’s age in order to determine eligibility is an imperfect measure, since companies have differing rates of growth and ability to raise capital. Beyond the measure’s sufficiency, the process of determining a company’s age is problematic.
Commerce advises that it typically determines the time in which a company became active
as evidenced by legal documents, which show the date of incorporation. However, since companies can be dormant before engaging in active business, the department also considers the date at which a company has financial activity. Commerce gauges any financial activity by examining financial statements and checking accounts. Commerce advises that approximately three companies engaged in active business later than their formation date.
In at least three instances, a qualified biotechnology company was a division or subsidiary
of another biotechnology company. In these instances, the parent company itself would not have met program requirements, primarily because it had been in active business for too many years, or and in at least one instance, the combined employment of the subsidiary and parent company may have exceeded program requirements. The program does not require a company to be independent in order to qualify for the program, nor does the program take into account the founding or combined employment of all affiliated companies.
For example, one parent company was established 16 years prior before its newly formed
division participated in the program. In another instance, the subsidiary’s parent company is also a qualified biotechnology company that has participated in the program for 11 years with its investors receiving a total of $10.5 million in credits. Commerce advises that if a company merely changes its name the start of active business looks back to the original company formation. However, DLS identified one instance in which a recent company participant was originally
DRAFT
80 Evaluation of the Biotechnology Investment Incentive Tax Credit established in 1993 but changed its name in 2006. Although regulations required a company to provide a factual narrative describing the company from its inception through the date of the application, no further information regarding affiliate companies or prior names is required.
Commerce Does Not Verify That Investors Comply with Program Requirements
The credit may be recaptured if, within two years from the close of the taxable year for which the credit is claimed, (1) the qualified investor sells, transfers, or otherwise disposes of the ownership interest in the qualified Maryland biotechnology company that gave rise to the credit; or (2) the qualified Maryland biotechnology company that gave rise to the credit ceases operating as an active business with its headquarters and base of operations in the State.
Commerce does not verify if these recapture events have been triggered or otherwise
require investors to provide evidence that the investment has been held for the minimum required period of time. DLS has identified investments in at least five companies that, during the recapture period, ceased operations, moved out-of-state, or were acquired and did not maintain a principal office and headquarters within the State. In addition, DLS identified another instance in which a company was acquired within the recapture period and investors may have sold their stake in the company.
DRAFT
81
Chapter 10. Impact of Credit on Companies and Capital
Outcomes of Participating Companies Most Companies Maintain a Maryland Presence
There have been a variety of outcomes for participating companies – most have continued to operate as a private independent biotechnology company with the headquarters in Maryland, but others have been acquired by other companies, gone public, moved out of state, or continued to operate but exited the biotechnology industry. From the State’s perspective, ceasing operations, exiting the industry, or moving out of state are negative outcomes. Since there is not a stated objective for the credit, it is not clear if acquisition by another company would be considered a positive outcome for the State, even though it is a positive outcome for the company. The Department of Commerce (Commerce) has advised that one of the program goals is to keep the intellectual property of the companies within the State. However, given that the program’s primary goal is to promote investment and stimulate the industry, acquisition is a positive outcome for the State as long as the acquired company maintains its primary office in the State.
A high percentage (83%) of the companies that have participated through fiscal 2017
(92 total) are still active companies that continue to have some type of active presence in the State. However, 7 of these companies are no longer actively engaged in biotechnology as defined by the program. Three of the 69 remaining biotechnology companies are now public companies and 8 have been acquired, almost always by a larger, out-of-state life sciences company. Of the 16 companies (about 20%) that no longer have a Maryland presence, 11 are no longer in business, and 5 have moved out of state.
Company relocation was the most likely of the negative outcomes to occur soon after
receiving a program investment. California was the most common destination followed by one company each to Massachusetts, North Carolina, and Texas. Given the differing needs of companies and strengths of other biotechnology clusters, such as California and Massachusetts, the program’s effectiveness will be tempered as some companies find it more advantageous to relocate despite the tax credit program.
Most of the acquiring companies are located in California with one each from
Massachusetts, Minnesota, and New Jersey. Each of the companies that were acquired were developing either biomarkers or drug therapies.
From the firm’s perspective, about two-thirds remain as independent active biotechnology
companies. A little less than one-fifth had a negative exit (going out of business or exiting the industry), and 13% had a positive exit (merger/acquisition or going public). Of the four companies that turned public, three are still in the State.
DRAFT
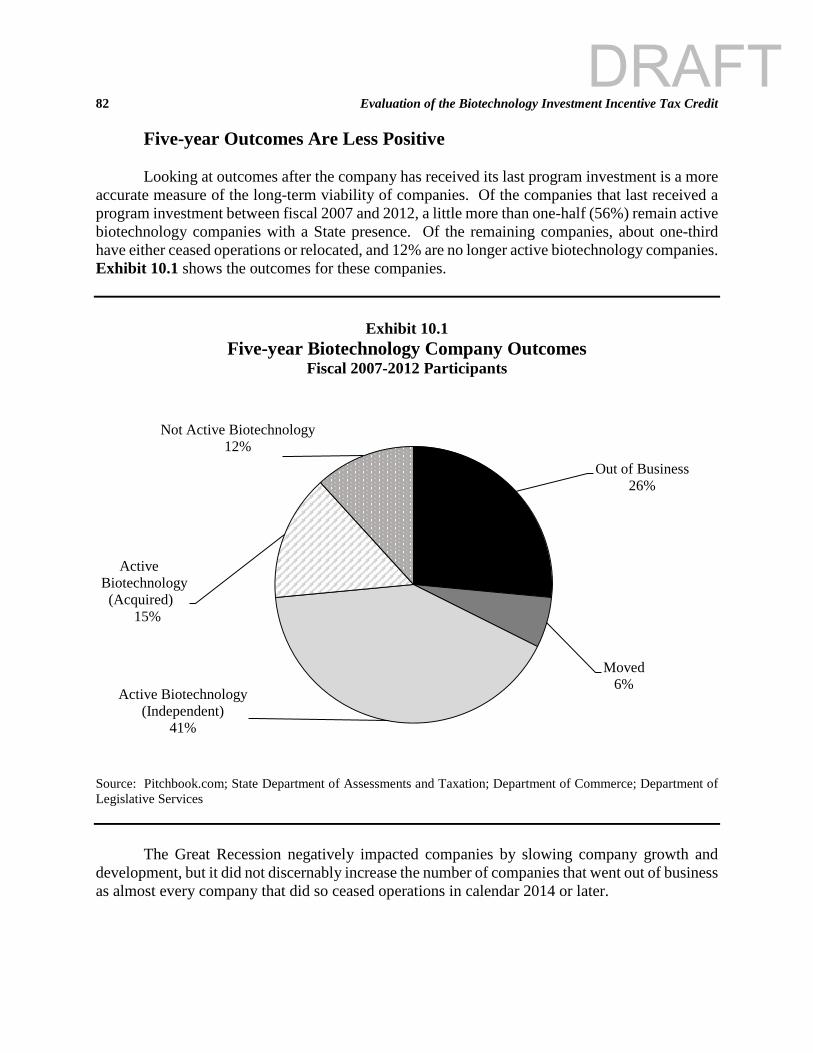
82 Evaluation of the Biotechnology Investment Incentive Tax Credit Five-year Outcomes Are Less Positive Looking at outcomes after the company has received its last program investment is a more accurate measure of the long-term viability of companies. Of the companies that last received a program investment between fiscal 2007 and 2012, a little more than one-half (56%) remain active biotechnology companies with a State presence. Of the remaining companies, about one-third have either ceased operations or relocated, and 12% are no longer active biotechnology companies. Exhibit 10.1 shows the outcomes for these companies.
Exhibit 10.1 Five-year Biotechnology Company Outcomes
Fiscal 2007-2012 Participants
Source: Pitchbook.com; State Department of Assessments and Taxation; Department of Commerce; Department of Legislative Services
The Great Recession negatively impacted companies by slowing company growth and
development, but it did not discernably increase the number of companies that went out of business as almost every company that did so ceased operations in calendar 2014 or later.
Out of Business26%
Moved6%
Active Biotechnology (Independent)
41%
Active Biotechnology(Acquired)
15%
Not Active Biotechnology12%
DRAFT
Chapter 10. Impact of Credit on Companies and Capital 83
Higher Company Failure Rates Should Be Expected As discussed in Chapter 8, changes enacted to the program have reduced the percentage of
investments that are made in early-stage companies. However, even after this shift, the program has a greater emphasis on emerging companies compared to other State tax credit programs that are typically claimed by large, established multi-state corporations. Accordingly, higher failure rates should be expected since participating biotechnology companies are much less established and due to the technical challenges in successfully concluding biotechnology research endeavors. In addition, the program should encourage entrepreneurship and appropriate risk-taking. In some cases, the failed company’s leadership might ultimately form a successful company.
Credit Should Not Be Viewed as Direct Employment Credit
Despite the significant funding provided to the program and the large number of participating companies, the tax credit has not created many direct jobs. In Commerce’s Fiscal 2016 Managing for Results Annual Performance Report, the department reports that the program received $12 million in funding and participating companies created 39 jobs, which equates to over $307,000 in credits per job. Exhibit 10.2 shows the program’s funding and number of jobs created in each fiscal year. Commerce advises that the goal of the program is not job creation but to stimulate the growth of a strategic industry sector.
Biotechnology companies face constant funding challenges, particularly in the early stages of development. Accordingly, companies must conserve scarce capital and often adopt a lean startup model. In fiscal 2017, the typical biotechnology company employed 12 Maryland employees. As companies develop, there is often little increase in direct employment, even if the company reaches a major licensing agreement or otherwise increases its cash flow. Although not unique to the industry, biotechnology companies can indirectly create jobs, primarily by outsourcing services that are provided in the State. Much of the exacting research required for clinical trials is outsourced to contract research organizations, of which there are approximately 350 in Maryland.
DRAFT
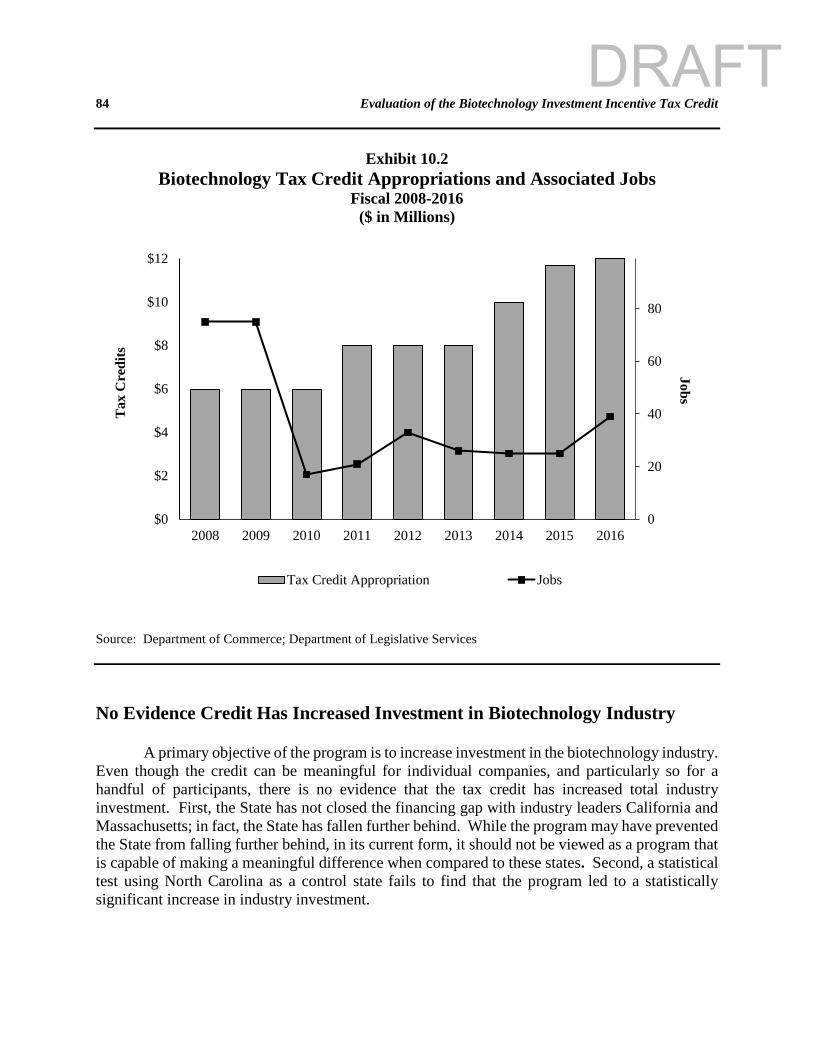
84 Evaluation of the Biotechnology Investment Incentive Tax Credit
Exhibit 10.2 Biotechnology Tax Credit Appropriations and Associated Jobs
Fiscal 2008-2016 ($ in Millions)
Source: Department of Commerce; Department of Legislative Services
No Evidence Credit Has Increased Investment in Biotechnology Industry A primary objective of the program is to increase investment in the biotechnology industry. Even though the credit can be meaningful for individual companies, and particularly so for a handful of participants, there is no evidence that the tax credit has increased total industry investment. First, the State has not closed the financing gap with industry leaders California and Massachusetts; in fact, the State has fallen further behind. While the program may have prevented the State from falling further behind, in its current form, it should not be viewed as a program that is capable of making a meaningful difference when compared to these states. Second, a statistical test using North Carolina as a control state fails to find that the program led to a statistically significant increase in industry investment.
0
20
40
60
80
$0
$2
$4
$6
$8
$10
$12
2008 2009 2010 2011 2012 2013 2014 2015 2016
JobsT
ax C
redi
ts
Tax Credit Appropriation Jobs
DRAFT
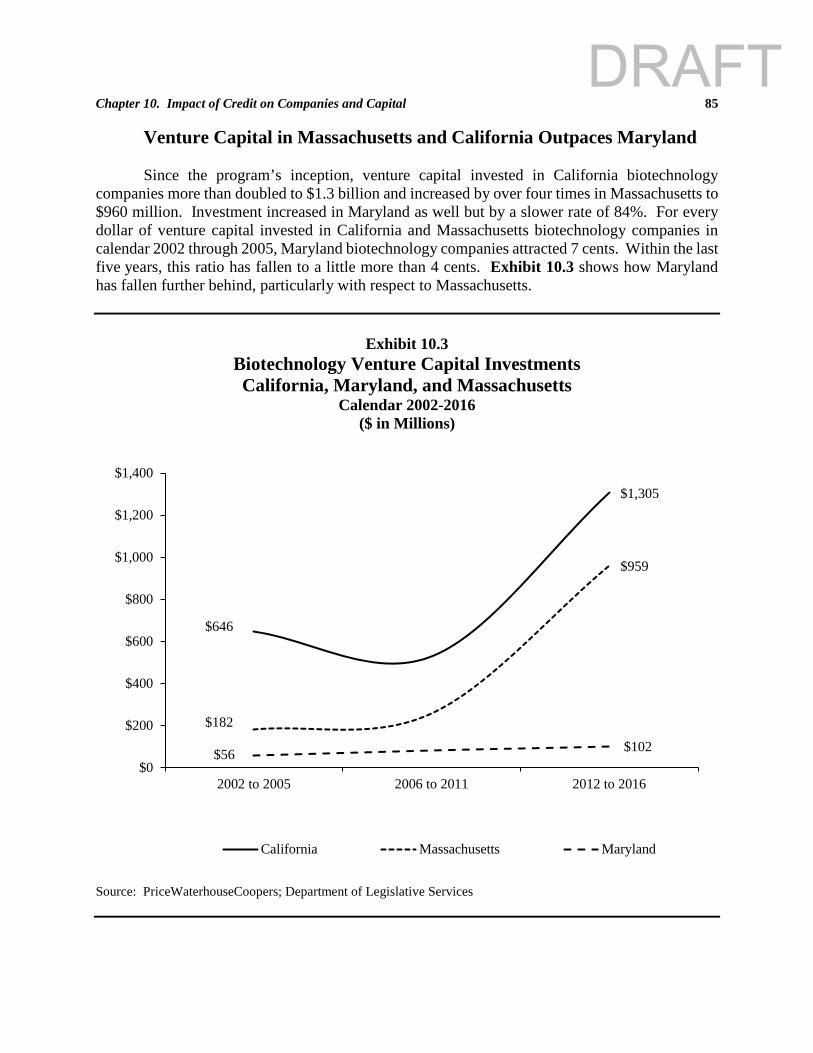
Chapter 10. Impact of Credit on Companies and Capital 85
Venture Capital in Massachusetts and California Outpaces Maryland Since the program’s inception, venture capital invested in California biotechnology
companies more than doubled to $1.3 billion and increased by over four times in Massachusetts to $960 million. Investment increased in Maryland as well but by a slower rate of 84%. For every dollar of venture capital invested in California and Massachusetts biotechnology companies in calendar 2002 through 2005, Maryland biotechnology companies attracted 7 cents. Within the last five years, this ratio has fallen to a little more than 4 cents. Exhibit 10.3 shows how Maryland has fallen further behind, particularly with respect to Massachusetts.
Exhibit 10.3 Biotechnology Venture Capital Investments California, Maryland, and Massachusetts
Calendar 2002-2016 ($ in Millions)
Source: PriceWaterhouseCoopers; Department of Legislative Services
$646
$1,305
$182
$959
$56 $102$0
$200
$400
$600
$800
$1,000
$1,200
$1,400
2002 to 2005 2006 to 2011 2012 to 2016
California Massachusetts Maryland
DRAFT
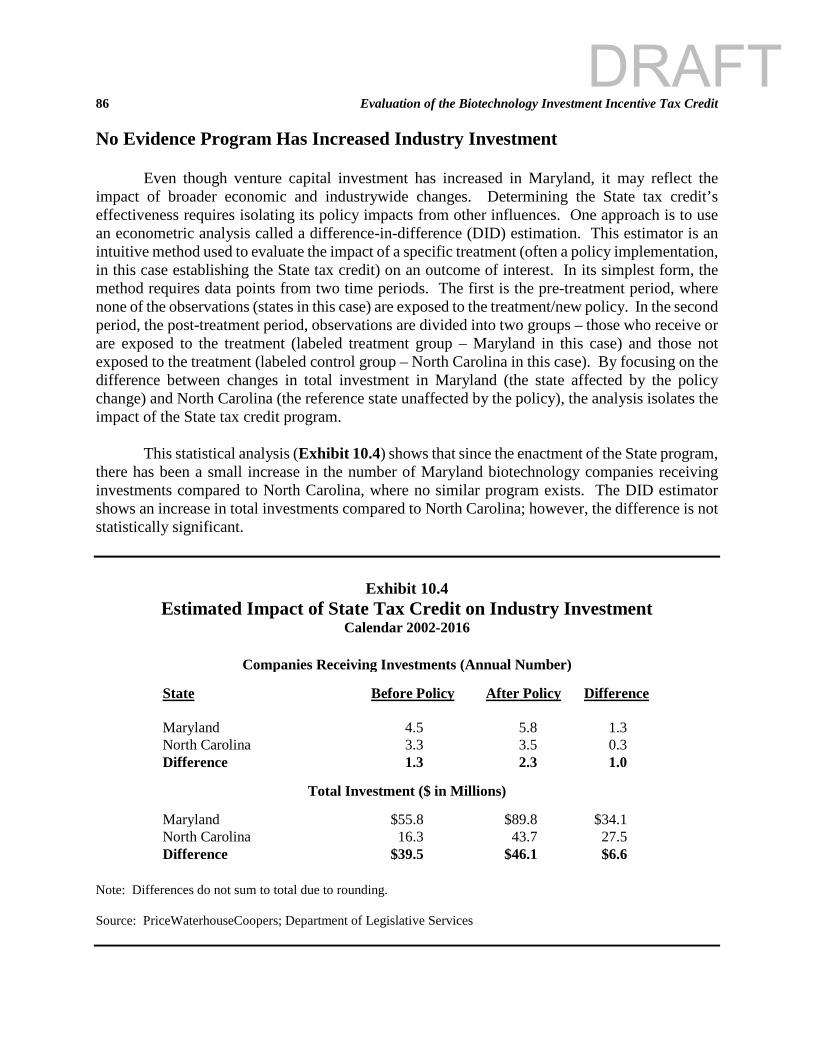
86 Evaluation of the Biotechnology Investment Incentive Tax Credit No Evidence Program Has Increased Industry Investment
Even though venture capital investment has increased in Maryland, it may reflect the impact of broader economic and industrywide changes. Determining the State tax credit’s effectiveness requires isolating its policy impacts from other influences. One approach is to use an econometric analysis called a difference-in-difference (DID) estimation. This estimator is an intuitive method used to evaluate the impact of a specific treatment (often a policy implementation, in this case establishing the State tax credit) on an outcome of interest. In its simplest form, the method requires data points from two time periods. The first is the pre-treatment period, where none of the observations (states in this case) are exposed to the treatment/new policy. In the second period, the post-treatment period, observations are divided into two groups – those who receive or are exposed to the treatment (labeled treatment group – Maryland in this case) and those not exposed to the treatment (labeled control group – North Carolina in this case). By focusing on the difference between changes in total investment in Maryland (the state affected by the policy change) and North Carolina (the reference state unaffected by the policy), the analysis isolates the impact of the State tax credit program.
This statistical analysis (Exhibit 10.4) shows that since the enactment of the State program,
there has been a small increase in the number of Maryland biotechnology companies receiving investments compared to North Carolina, where no similar program exists. The DID estimator shows an increase in total investments compared to North Carolina; however, the difference is not statistically significant.
Exhibit 10.4 Estimated Impact of State Tax Credit on Industry Investment
Calendar 2002-2016
Companies Receiving Investments (Annual Number)
State Before Policy After Policy Difference Maryland 4.5 5.8 1.3 North Carolina 3.3 3.5 0.3 Difference 1.3 2.3 1.0
Total Investment ($ in Millions) Maryland $55.8 $89.8 $34.1 North Carolina 16.3 43.7 27.5 Difference $39.5 $46.1 $6.6
Note: Differences do not sum to total due to rounding. Source: PriceWaterhouseCoopers; Department of Legislative Services
DRAFT
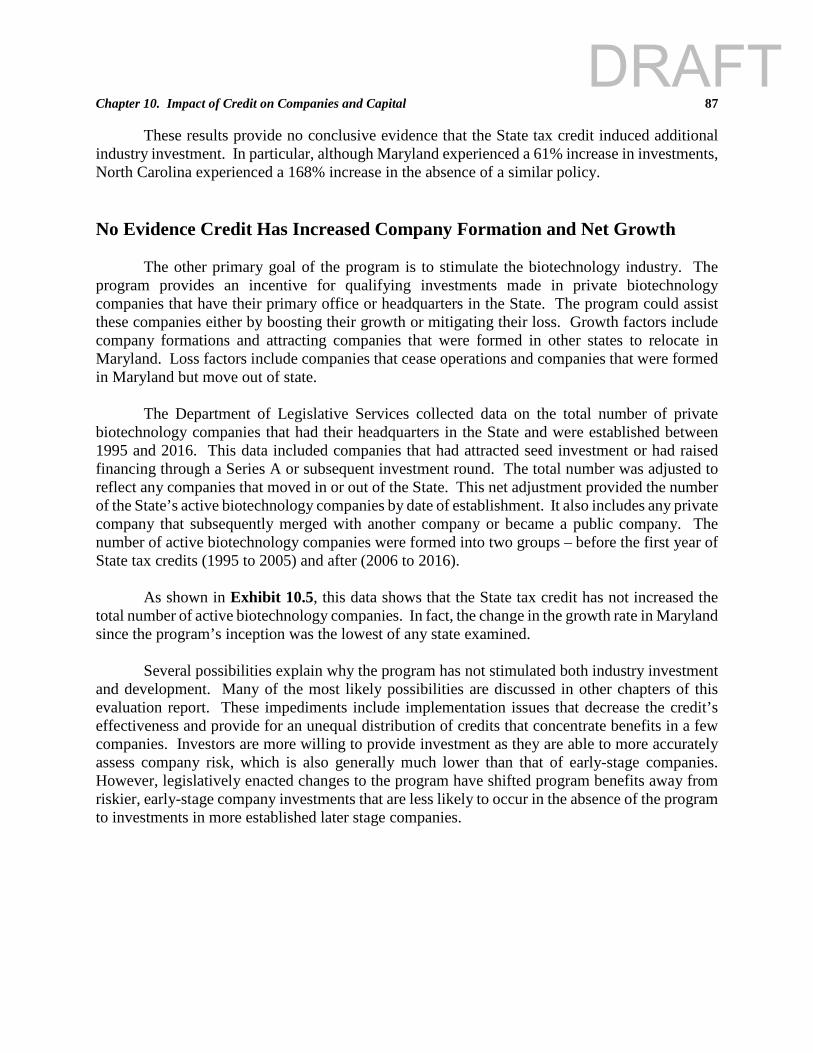
Chapter 10. Impact of Credit on Companies and Capital 87 These results provide no conclusive evidence that the State tax credit induced additional industry investment. In particular, although Maryland experienced a 61% increase in investments, North Carolina experienced a 168% increase in the absence of a similar policy. No Evidence Credit Has Increased Company Formation and Net Growth
The other primary goal of the program is to stimulate the biotechnology industry. The program provides an incentive for qualifying investments made in private biotechnology companies that have their primary office or headquarters in the State. The program could assist these companies either by boosting their growth or mitigating their loss. Growth factors include company formations and attracting companies that were formed in other states to relocate in Maryland. Loss factors include companies that cease operations and companies that were formed in Maryland but move out of state.
The Department of Legislative Services collected data on the total number of private
biotechnology companies that had their headquarters in the State and were established between 1995 and 2016. This data included companies that had attracted seed investment or had raised financing through a Series A or subsequent investment round. The total number was adjusted to reflect any companies that moved in or out of the State. This net adjustment provided the number of the State’s active biotechnology companies by date of establishment. It also includes any private company that subsequently merged with another company or became a public company. The number of active biotechnology companies were formed into two groups – before the first year of State tax credits (1995 to 2005) and after (2006 to 2016).
As shown in Exhibit 10.5, this data shows that the State tax credit has not increased the
total number of active biotechnology companies. In fact, the change in the growth rate in Maryland since the program’s inception was the lowest of any state examined.
Several possibilities explain why the program has not stimulated both industry investment
and development. Many of the most likely possibilities are discussed in other chapters of this evaluation report. These impediments include implementation issues that decrease the credit’s effectiveness and provide for an unequal distribution of credits that concentrate benefits in a few companies. Investors are more willing to provide investment as they are able to more accurately assess company risk, which is also generally much lower than that of early-stage companies. However, legislatively enacted changes to the program have shifted program benefits away from riskier, early-stage company investments that are less likely to occur in the absence of the program to investments in more established later stage companies.
DRAFT
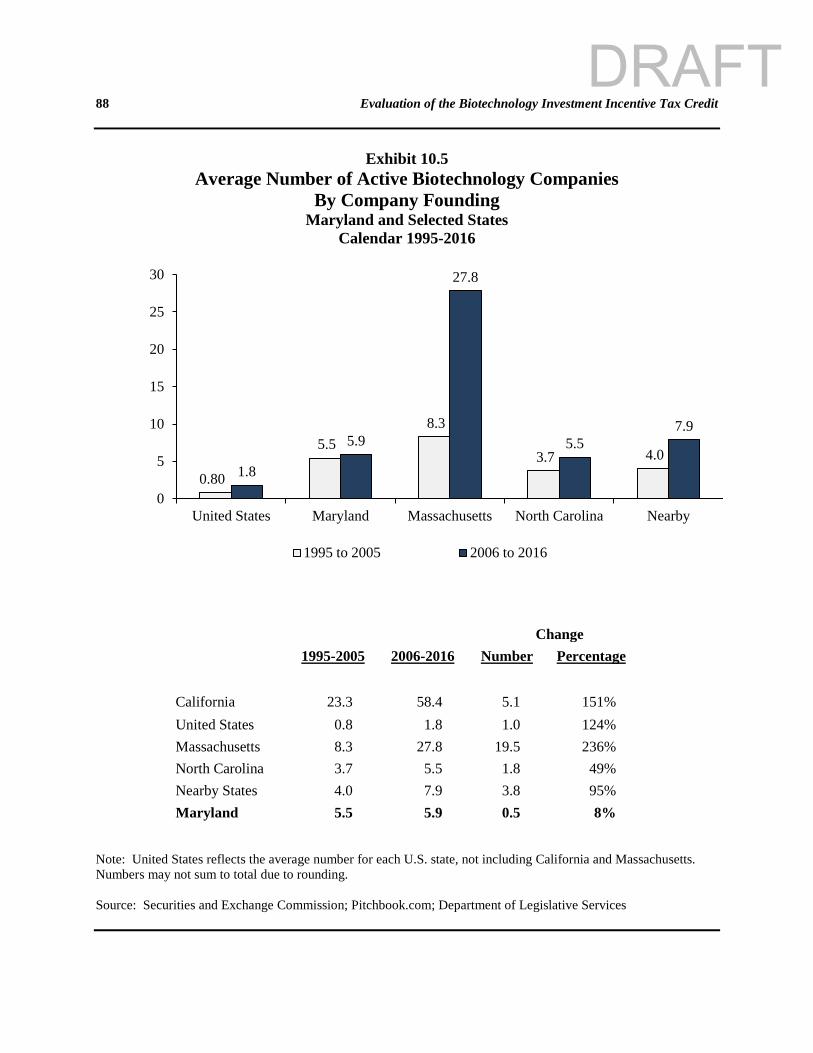
88 Evaluation of the Biotechnology Investment Incentive Tax Credit
Exhibit 10.5
Average Number of Active Biotechnology Companies By Company Founding
Maryland and Selected States Calendar 1995-2016
Change
1995-2005 2006-2016 Number Percentage California 23.3 58.4 5.1 151% United States 0.8 1.8 1.0 124% Massachusetts 8.3 27.8 19.5 236% North Carolina 3.7 5.5 1.8 49% Nearby States 4.0 7.9 3.8 95% Maryland 5.5 5.9 0.5 8%
Note: United States reflects the average number for each U.S. state, not including California and Massachusetts. Numbers may not sum to total due to rounding. Source: Securities and Exchange Commission; Pitchbook.com; Department of Legislative Services
0.80
5.5 8.3
3.7 4.0 1.8
5.9
27.8
5.57.9
0
5
10
15
20
25
30
United States Maryland Massachusetts North Carolina Nearby
1995 to 2005 2006 to 2016
DRAFT
89
Chapter 11. Findings and Recommendations
Based on the information and analysis provided in this report, the Department of Legislative Services (DLS) makes a number of findings and recommendations about the biotechnology investment incentive tax credit, as discussed below. There is No Evidence That the Credit Has Increased Investment in the Biotechnology Industry Whereas venture capital funding has trended upward nationally, Maryland venture capital funding has been volatile from year to year. The State has not closed the financing gap with industry leaders California and Massachusetts and has actually fallen further behind. DLS failed to find that the program led to a statistically significant increase in industry investment. Additionally, data collected by DLS fails to show that the State tax credit increased the total number of active biotechnology companies in Maryland. Thus, DLS questions the overall effectiveness of the biotechnology investment incentive tax credit program. While the program is not effectively meeting its objective, DLS acknowledges the importance of providing financial assistance to early-stage biotechnology companies. The biotechnology industry faces unique challenges, especially in early-stage financing, and the State tax credit helps to alleviate some of those financing challenges. In addition, support of the industry is appropriate given its importance to the State and likelihood of continued growth.
Recommendation: The General Assembly should consider eliminating the program in its current form or allowing the tax credit to sunset in two years and replacing it with a more effective program based on the recommendations below. Alternatively, the General Assembly could consider providing a federal Small Business Innovative Research (SBIR) program matching grant to encourage the biotechnology industry in Maryland.
If the General Assembly chooses to continue the tax credit program, DLS has several
recommendations to improve the credit that are discussed below. State Tax Credit Is Not Coordinated with Other Programs
Despite a significant overlap of funding between the biotechnology investment incentive tax credit and the Maryland Technology Development Corporation (TEDCO) programs, there is no coordination between TEDCO and the Department of Commerce (Commerce). TEDCO does not have a formal mechanism to consider receipt of State tax credits when making funding decisions. Conversely, TEDCO might determine that a company’s performance does not merit additional investment and/or may exit an initial investment, but the State may continue to provide funds via the tax credit. The biotechnology investment incentive tax credit program is also not coordinated with the federal SBIR program.
DRAFT
90 Evaluation of the Biotechnology Investment Incentive Tax Credit
TEDCO aims to help commercialize the results of scientific research and development conducted by entities and to promote new research activity and investments that lead to business development in Maryland. These objectives align well with the presumed objectives of the biotechnology investment incentive tax credit program while Commerce has a broader objective to stimulate private investment and create jobs. TEDCO also has more flexibility than Commerce, and TEDCO already administers the Maryland Venture Fund and the biotechnology grant program. However, TEDCO did not respond to requests for information for this report.
Recommendation: Commerce should coordinate biotechnology funding efforts with
TEDCO. In addition, the General Assembly should explore the possibility of TEDCO administering the credit program. The Legislative Intent and Performance Metrics of the Credit Are Not Defined
Chapter 99 of 2005 established the biotechnology investment incentive tax credit but did not specify a specific goal or intent for the credit. Without clearly defined goals and objectives, it is difficult to identify metrics and data requirements to evaluate the effectiveness of the tax credit. In contrast to the biotechnology investment incentive tax credit program, the SBIR program has four legislatively mandated objectives and the National Institutes of Health (NIH) typically conducts periodic program evaluations that determine if the program is meeting its objectives. As a crucial part of this process, NIH has developed multiple performance measures for each objective. Meanwhile, TEDCO programs are divided into three categories and grouped according to the specific purpose they serve in the process of accelerating entrepreneurial innovation and advancing ideas to economic success. There is no similar requirement or goal articulated for the State tax credit.
Recommendation: The General Assembly should clearly define the intent and goals of the tax credit program in statute.
Recommendation: Commerce should define performance metrics for the program and periodically evaluate the program based on those metrics.
Recommendation: Considering the General Assembly’s interest in providing business opportunities for minority- and women-owned businesses, DLS recommends that the General Assembly require Commerce to report on the number of qualified companies that qualify as minority- and women-owned businesses. Commerce Does Not Award Credits on a Competitive Basis
Funding from the SBIR and TEDCO programs is competitively awarded based on an assessment of whether funding the proposed project and/or company will best advance the goals of the program relative to all other applicants. By comparison, the State tax credit program awards
DRAFT
Chapter 11. Findings and Recommendations 91 credits on a first come, first served basis if the company meets program requirements. DLS believes that the competitive processes established by NIH and TEDCO are superior to the State tax credit program because these processes are more likely to achieve program goals and TEDCO and NIH use criteria that better target the programs to their intended beneficiaries and desired program outcomes.
Since biotechnology investment incentive tax credits are currently issued on a first come, first served basis, the timing of application submissions determines funding outcomes. Commerce established a new online application system in fiscal 2018, which included a website feature that signaled the start of the application period. Several companies and organizations have expressed frustrations with the newly established process.
Recommendation: Because the first come, first served approach is deficient relative
to the discretionary processes used by NIH and TEDCO and is less likely to allocate credits in a manner that maximizes program effectiveness, the General Assembly should require Commerce to implement a competitive award process using criteria to target desired program outcomes. Implementing a competitive award process would eliminate timing issues associated with a first come, first served approach. Biotechnology Clusters Are Preferred for Industry Growth
Companies in Montgomery County and Baltimore City have accounted for about three-fourths of all investments in the biotechnology investment incentive tax credit program. This is not surprising since that is where the biotechnology clusters are within Maryland, making those places ideal for industry growth due to access to capital and a quality workforce. However, the State provides an enhanced 75% credit if the qualified biotechnology company in which an investment is made is located in Allegany, Dorchester, Garrett, or Somerset counties.
The State provides other tax credit programs that target economic development in rural
areas, such as the job creation tax credit that provides an enhanced credit for jobs created in revitalization zones. The enterprise zone and One Maryland tax credit programs also specifically aim to increase economic activity and employment in distressed areas of the State. Multiple programs providing inconsistent incentives do not provide clear signals that help influence business decisions in the desired manner. Recommendation: Considering the advantages of biotechnology clusters and the existence of other State programs that target economic development in areas designated for revitalization, the General Assembly should eliminate the enhanced credit for investments in Allegany, Dorchester, Garrett, or Somerset counties.
DRAFT
92 Evaluation of the Biotechnology Investment Incentive Tax Credit Maryland’s Biotechnology Investment Incentive Tax Credit Program Has a Generous Credit
Maryland’s credit (50%, with an enhanced credit of 75% in certain counties) is more generous than most programs in other states. Of the current or recent programs, the median tax credit value was 33%, with the most common value between 20% and 33%. States that provide an enhanced credit tend to provide only an additional 5 or 10 percentage points, unlike Maryland which provides 25 additional percentage points if the investments are within Allegany, Dorchester, Garrett, or Somerset counties.
Recommendation: The General Assembly should lower the credit percentage to 33%. If the General Assembly chooses to keep the enhanced credit, it should only be an additional 10 percentage points. Company Insiders Are Not Prohibited from Receiving the Credit
Insider investors likely have a strong personal stake in the firm’s success and may invest regardless of the tax credit. To be eligible for the biotechnology investment incentive tax credit, the qualified investor may not, after making the proposed investment, own or control more than 25% of the equity interests in the qualified company. Otherwise, there is no prohibition on claiming the credit for owners, employees, or family members of those individuals. DLS examined investor data and found company insider participation in about one-half of the companies, some of which had extensive participation, and the average insider investment was made eight years after the company’s start of operations. About two-thirds of the investment identified as being made by company insiders occurred well into the company’s development. In the first Biotechnology Investment Incentive Tax Credit Program annual report for calendar 2006, Commerce recommended that a prohibition on company insiders from claiming the credit be enacted.
Recommendation: The General Assembly should consider restricting owners or employees of a qualified company or those with a pre-existing fiduciary relationship with the company from qualifying for the credit after the company has been in business for five years as these individuals may have invested in the business regardless of the tax credit. The Program Is Administratively Burdensome
Administering the biotechnology investment incentive tax credit requires additional resources compared to other State tax credit programs. In addition to processing company and investor applications, staff conduct a science review to verify that the company meets the program’s requirements related to proprietary technology. According to Commerce, applications have increased over time, and the department indicates that it does not have sufficient resources to administer the program. Other states authorize the administering agency to charge application fees
DRAFT
Chapter 11. Findings and Recommendations 93 that are used to defray program administrative costs for similar tax credit programs. The application fees charged in these states are typically a few hundred dollars. Like most State tax credit programs, Maryland does not impose a fee for the biotechnology investment incentive tax credit. However, the program is an administratively burdensome program to oversee, similar to the Heritage Structure Rehabilitation Tax Credit Program, which charges an application fee.
Chapters 475 and 476 of 2017 generally provide an additional two months for an applicant that does not currently meet specified program requirements to qualify as a biotechnology company. The eligibility change is intended to assist newly formed companies, including spinouts, by allowing those companies additional time to qualify for the credit. Given the recent enactment of this statute, it is not possible to determine its impact; however, Commerce has advised that the statute may complicate credit verification, lead to confusion, and could delay the awarding of credits at the beginning of each fiscal year. Recommendation: To recoup some of its administrative costs, the General Assembly should require Commerce to charge an application fee for a company to apply to qualify and allow a portion of the program’s appropriation to be used to cover the administrative costs of processing investor applications. Charging a fee may dissuade companies that will not likely be a qualifying company within two months from applying, thus reducing some administrative burden for Commerce.
Recommendation: Commerce should advise the General Assembly by January 1, 2019, on the impact of allowing an applicant an additional two months to qualify as a biotechnology company. Pass-through Entities Fence Off Credits at the Expense of Other Companies
Compared to other State tax credit programs, final biotechnology investment incentive tax credits are more likely to be less than the initial certificate amount awarded. At least one and possibly several more companies are using pass-through entities (PTE) to fence off credits in order to gain an advantage over other applicants. The company often does not have finalized investor agreements at the time of application and will later seek investments to fulfill the credit allotment, but often fails to do so. Inflating the amount of credits that the company applies for increases the chances that its investors will receive program credits. However, this practice confers an advantage to the credit fencing company at the expense of other companies and increases the number of companies whose investors are denied funding. The Maryland Historical Trust (MHT) had a similar experience when it awarded credits on a first come, first served basis under the Heritage Structure Rehabilitation tax credit program. MHT noted that switching to a competitive process for awarding credits eliminated the issue.
Additionally, many of the applications submitted by the PTEs established to fence credits do not substantiate the total proposed investment amount. The applications either contain information on each investment from the PTE investors that in total are far less than the proposed
DRAFT
94 Evaluation of the Biotechnology Investment Incentive Tax Credit total investment or do not have any information at all. Despite lacking this information, Commerce has awarded these PTEs substantial initial credit certificates.
Recommendation: If the General Assembly does not adopt a competitive award process for the biotechnology investment incentive tax credit program, Commerce should require PTEs to provide more investment information on their applications, and Commerce should also comment on ways to limit or eliminate credit fencing. Credit Provides Less Support to Early-stage Companies
The program provides less financial support to newly formed companies than it did in its inception. Altering the program eligibility standards, from an original limit of 10 years to up to 24 years of operation, has allowed later stage companies with significantly more capabilities in raising capital to participate in the program. The top 10 companies account for most of the program’s funding, with the top company accounting for $10.5 million in credits. Meanwhile, the percentage of program funding provided to new entrants has fallen to 23% in fiscal 2017, and new applicants were much less likely to be funded than repeat applicants. Compared to repeat applicants, new applicants are more likely to be startup or early-stage companies, have raised few if any rounds of investment, have much lower company valuations, and have a less established company leadership with fewer company assets.
In addition, companies have become much more dissimilar over time. Whereas in the
beginning of the program most companies were newly formed and in similar stage of development, some companies are now much more established and have achieved significant development milestones. Despite the increased difference in company characteristics and the higher risk associated with newly formed companies, the program provides the same subsidy to investments made in more established and therefore less risky companies.
Recommendation: The General Assembly should set aside a portion of the tax credit
funds for new investments in early-stage companies since these companies face more financing challenges than more established companies.
Recommendation: Since a few companies have received most of the program’s
funding, the General Assembly should place both an annual limit and a lifetime limit on credits for investments in a single company. Commerce recommended establishing a lifetime limit of $7.0 million on the total credits that could be claimed with respect to each company and to alter the fiscal year company limitation from 15% of the year’s appropriation to $1.5 million. This would allow for greater participation from other companies as those who reach the maximum will drop out of the pool and open up tax credits for which investors in other companies may apply.
DRAFT
Chapter 11. Findings and Recommendations 95 Company Age Criterion Is Problematic
In at least three instances, a qualified biotechnology company was a division or subsidiary of another biotechnology company. In these instances, the parent company itself would not have met program requirements, primarily because it had been in active business for too many years, or and in at least one instance, the combined employment of the subsidiary and parent company may have exceeded program requirements. The program does not require a company to be independent in order to qualify for the program, nor does the program take into account the founding or combined employment of all affiliated companies. Commerce advises that if a company merely changes its name, the start of active business looks back to the original company formation. However, DLS identified one instance in which a recent company participant was originally established in 1993 but changed its name in 2006. Although regulations required a company to provide a factual narrative describing the company from its inception through the date of the application, no further information regarding affiliate companies or prior names is required.
One of the program’s weaknesses is that its design and implementation are indifferent to
the significant variation across participating companies. Companies are in different development stages, ranging from startups that do not generate revenue to profitable companies that have raised significant investment.
Recommendation: The General Assembly should consider criterion other than
company age, such as excluding companies over a specified revenue threshold. Recommendation: Since investments in more developed companies are less risky
than investments in newly formed companies, the General Assembly should consider lowering the percentage value of the credit for more established companies.
Recommendation: Commerce should require companies to report on affiliated
companies and prior names.
Recapture Provisions Are Not Enforced
The credit may be recaptured if, within two years from the close of the taxable year for which the credit is claimed, (1) the qualified investor sells, transfers, or otherwise disposes of the ownership interest in the qualified Maryland biotechnology company that gave rise to the credit; or (2) the qualified Maryland biotechnology company that gave rise to the credit ceases operating as an active business with its headquarters and base of operations in the State. However, Commerce does not verify if these recapture events have been triggered or otherwise require investors to provide evidence that the investment has been held for the minimum required period of time. DLS has identified investments in at least five companies that, during the recapture period, ceased operations, moved out of state, or were acquired and did not maintain a principal office and headquarters within the State. In addition, DLS identified another instance in which a company was acquired within the recapture period and investors may have sold their stake in the company.
DRAFT
96 Evaluation of the Biotechnology Investment Incentive Tax Credit
Recommendation: Commerce, in collaboration with the Comptroller’s Office, should
adopt formal mechanisms to ensure compliance of the credit recapture provisions.
Recapture Provisions May Unfairly Penalize Investors
DLS notes that higher failure rates should be expected because participating biotechnology companies are much less established and due to the technical challenges in successfully concluding biotechnology research endeavors. The program should encourage entrepreneurship and appropriate risk-taking. Having a recapture provision for a company that goes out of operations may contradict with encouraging appropriate risk-taking. If a company decides to relocate out of state, investors are liable for repaying the credit, but investors may not have any say in that relocation decision.
Recommendation: The General Assembly should delete the recapture provision that
the credit may be recaptured if, within two years from the close of the taxable year for which the credit is claimed, the company ceases operating as an active business with its headquarters and base of operations in the State. Instead, the General Assembly should require that if a company moves its headquarters and base of operations outside of the State, the company should be responsible for repaying the State for credits claimed by its investors.
The Program Appears to Be Underperforming in Its Ability to Attract Out-of-state Investment
Nonresidents are a significant source of investments; however, the program appears to be underperforming in its ability to attract investment from major sources of Maryland biotechnology investment including California, Massachusetts, New York, and from overseas investors. These investors made about one-half of all investments in Maryland biotechnology companies but comprised only 14% of all nonindividual program investors. The lack of investment from these states likely reflects competition from other biotechnology companies and the correlation between program knowledge and physical distance. Recommendation: Commerce should comment on its efforts to market the program to nonresidents, particularly in California, Massachusetts, and New York.
DRAFT
97
Appendix 1 Securities Exchange Commission Exemptions for Raising Private Capital
A company can legally offer and sell securities without registering with the Securities
Exchange Commission if it qualifies for one of several exemptions from the registration requirements of the Securities Act. Some commonly used nonpublic offering exemptions include Section 4(a)(2) of the Securities Act and Regulation D, which contains Rules 504 and 506.
Section 4(a)(2) of the Securities Act exempts from registration transactions by an issuer
not involving any public offering. In general, public advertising of the offering and general solicitation of investors is incompatible with the nonpublic offering exemption. To qualify for the Section 4(a)(2) exemption, which is sometimes referred to as the “private placement” exemption, the purchasers of the securities must (1) either have enough knowledge and experience in finance and business matters to be “sophisticated investors” (able to evaluate the risks and merits of the investment), or be able to bear the investment’s economic risk; (2) have access to the type of information normally provided in a prospectus for a registered securities offering; and (3) agree not to resell or distribute the securities to the public.
Regulation D contains Rules 504 and 506, which establish exemptions from Securities Act
registration. Rule 504, known as the “seed capital” exemption, provides an exemption for the offer and sale of up to $5 million of securities in a 12-month period. Rule 504’s offering amount limit was increased from $1 million to $5 million, effective January 2017, and the revised regulation also prohibits certain bad actors from participating in offerings. Commenters on the revision stated that increasing the offering amount limit will allow more small businesses to use this capital raising tool, better satisfying the needs of these businesses for capital formation and helping to facilitate multi-state offerings. Rule 504 is available only to nonreporting issuers that are not investment companies or development stage companies for offerings of up to $5 million in a 12-month period and permits general solicitation and the issuance of unrestricted securities in certain limited situations.
Rule 506 provides two different ways of conducting a securities offering that is exempt from registration: Rule 506(b) and Rule 506(c). Rule 506(b) and 506(c) are available to all issuers without any aggregate offering amount limitations. Rule 506(b) prohibits general solicitation and limits sales to no more than 35 nonaccredited investors. Rule 506(c) permits general solicitation where all purchasers of the securities are accredited investors, and the issuer takes reasonable steps to verify that the purchasers are accredited investors. An accredited investor includes, among other specified entities, a director, executive officer, or general partner of the company selling the securities; an individual with a net worth of at least $1 million, not including the value of his or her primary residence; or an individual with income exceeding $200,000 in each of the two most recent calendar years or joint income with a spouse exceeding $300,000 for those years and a reasonable expectation of the same income level in the current year.
DRAFT
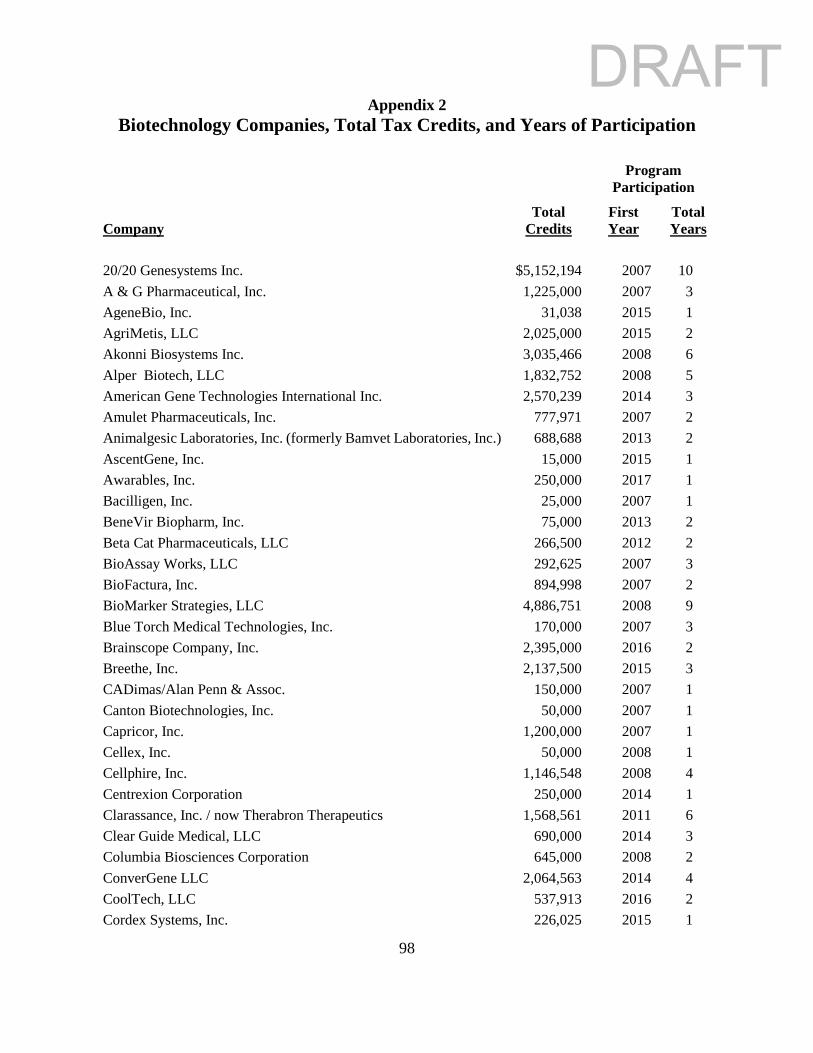
98
Appendix 2 Biotechnology Companies, Total Tax Credits, and Years of Participation
Program Participation
Company Total
Credits First Year
Total Years
20/20 Genesystems Inc. $5,152,194 2007 10 A & G Pharmaceutical, Inc. 1,225,000 2007 3 AgeneBio, Inc. 31,038 2015 1 AgriMetis, LLC 2,025,000 2015 2 Akonni Biosystems Inc. 3,035,466 2008 6 Alper Biotech, LLC 1,832,752 2008 5 American Gene Technologies International Inc. 2,570,239 2014 3 Amulet Pharmaceuticals, Inc. 777,971 2007 2 Animalgesic Laboratories, Inc. (formerly Bamvet Laboratories, Inc.) 688,688 2013 2 AscentGene, Inc. 15,000 2015 1 Awarables, Inc. 250,000 2017 1 Bacilligen, Inc. 25,000 2007 1 BeneVir Biopharm, Inc. 75,000 2013 2 Beta Cat Pharmaceuticals, LLC 266,500 2012 2 BioAssay Works, LLC 292,625 2007 3 BioFactura, Inc. 894,998 2007 2 BioMarker Strategies, LLC 4,886,751 2008 9 Blue Torch Medical Technologies, Inc. 170,000 2007 3 Brainscope Company, Inc. 2,395,000 2016 2 Breethe, Inc. 2,137,500 2015 3 CADimas/Alan Penn & Assoc. 150,000 2007 1 Canton Biotechnologies, Inc. 50,000 2007 1 Capricor, Inc. 1,200,000 2007 1 Cellex, Inc. 50,000 2008 1 Cellphire, Inc. 1,146,548 2008 4 Centrexion Corporation 250,000 2014 1 Clarassance, Inc. / now Therabron Therapeutics 1,568,561 2011 6 Clear Guide Medical, LLC 690,000 2014 3 Columbia Biosciences Corporation 645,000 2008 2 ConverGene LLC 2,064,563 2014 4 CoolTech, LLC 537,913 2016 2 Cordex Systems, Inc. 226,025 2015 1
DRAFT
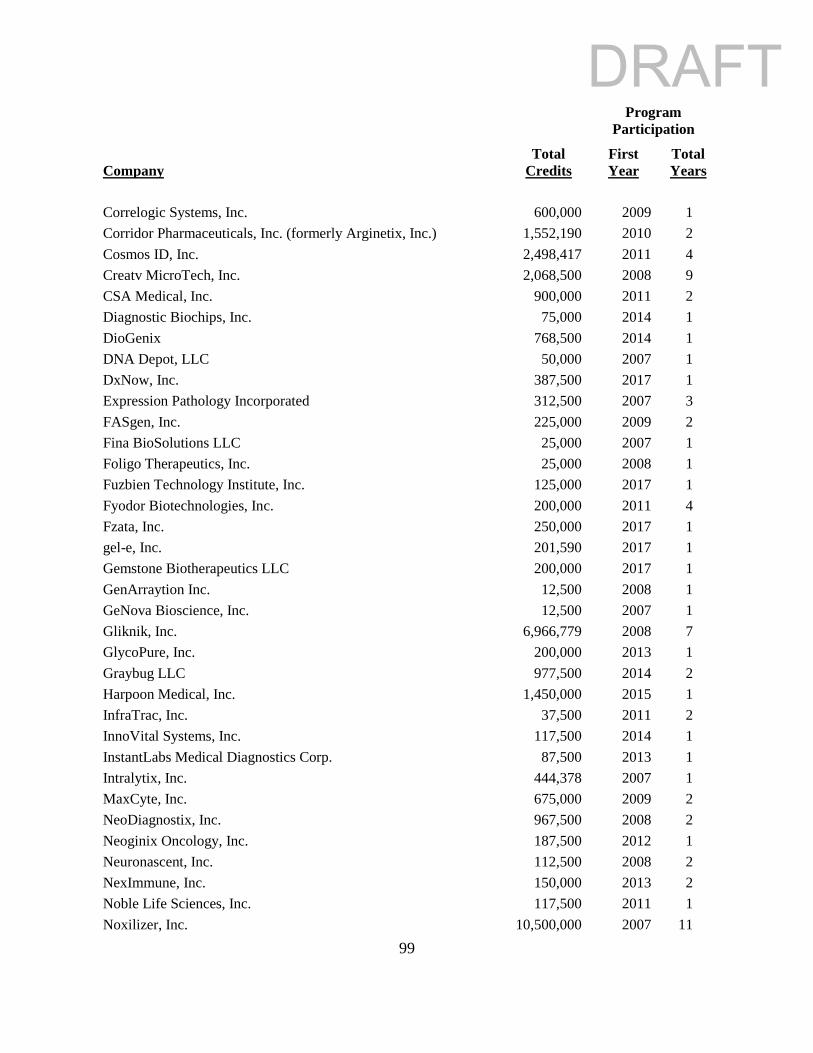
99
Program Participation
Company Total
Credits First Year
Total Years
Correlogic Systems, Inc. 600,000 2009 1 Corridor Pharmaceuticals, Inc. (formerly Arginetix, Inc.) 1,552,190 2010 2 Cosmos ID, Inc. 2,498,417 2011 4 Creatv MicroTech, Inc. 2,068,500 2008 9 CSA Medical, Inc. 900,000 2011 2 Diagnostic Biochips, Inc. 75,000 2014 1 DioGenix 768,500 2014 1 DNA Depot, LLC 50,000 2007 1 DxNow, Inc. 387,500 2017 1 Expression Pathology Incorporated 312,500 2007 3 FASgen, Inc. 225,000 2009 2 Fina BioSolutions LLC 25,000 2007 1 Foligo Therapeutics, Inc. 25,000 2008 1 Fuzbien Technology Institute, Inc. 125,000 2017 1 Fyodor Biotechnologies, Inc. 200,000 2011 4 Fzata, Inc. 250,000 2017 1 gel-e, Inc. 201,590 2017 1 Gemstone Biotherapeutics LLC 200,000 2017 1 GenArraytion Inc. 12,500 2008 1 GeNova Bioscience, Inc. 12,500 2007 1 Gliknik, Inc. 6,966,779 2008 7 GlycoPure, Inc. 200,000 2013 1 Graybug LLC 977,500 2014 2 Harpoon Medical, Inc. 1,450,000 2015 1 InfraTrac, Inc. 37,500 2011 2 InnoVital Systems, Inc. 117,500 2014 1 InstantLabs Medical Diagnostics Corp. 87,500 2013 1 Intralytix, Inc. 444,378 2007 1 MaxCyte, Inc. 675,000 2009 2 NeoDiagnostix, Inc. 967,500 2008 2 Neoginix Oncology, Inc. 187,500 2012 1 Neuronascent, Inc. 112,500 2008 2 NexImmune, Inc. 150,000 2013 2 Noble Life Sciences, Inc. 117,500 2011 1 Noxilizer, Inc. 10,500,000 2007 11
DRAFT
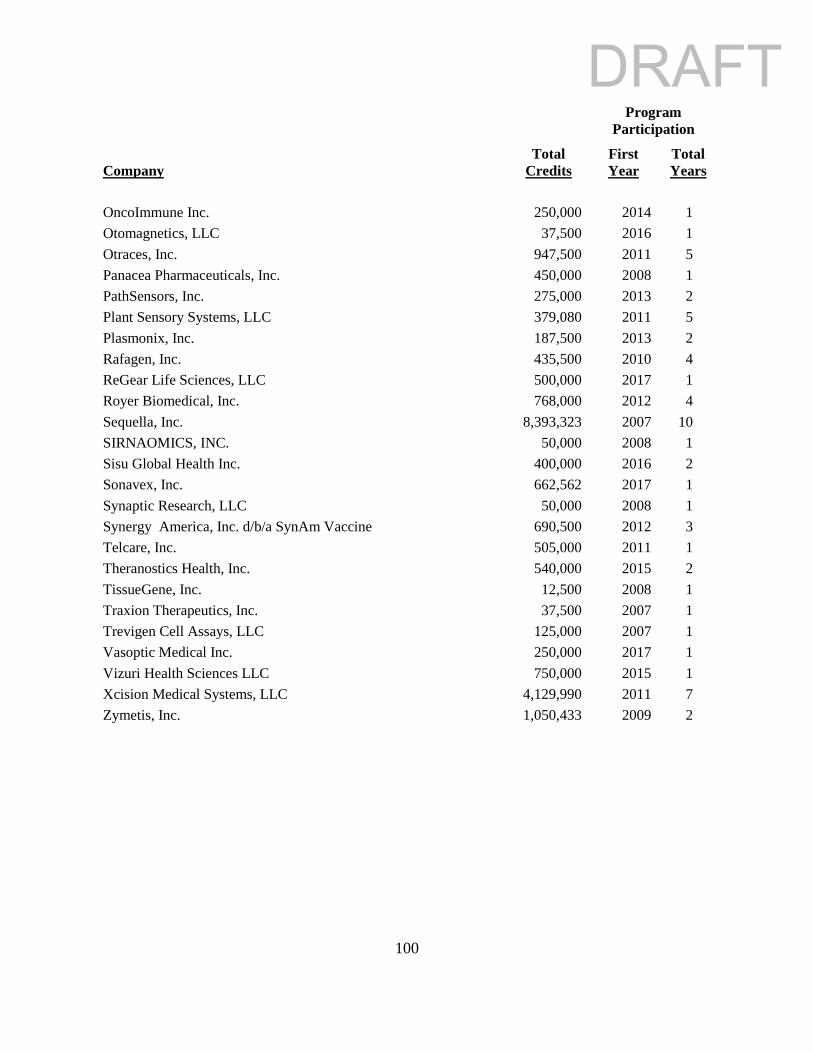
100
Program Participation
Company Total
Credits First Year
Total Years
OncoImmune Inc. 250,000 2014 1 Otomagnetics, LLC 37,500 2016 1 Otraces, Inc. 947,500 2011 5 Panacea Pharmaceuticals, Inc. 450,000 2008 1 PathSensors, Inc. 275,000 2013 2 Plant Sensory Systems, LLC 379,080 2011 5 Plasmonix, Inc. 187,500 2013 2 Rafagen, Inc. 435,500 2010 4 ReGear Life Sciences, LLC 500,000 2017 1 Royer Biomedical, Inc. 768,000 2012 4 Sequella, Inc. 8,393,323 2007 10 SIRNAOMICS, INC. 50,000 2008 1 Sisu Global Health Inc. 400,000 2016 2 Sonavex, Inc. 662,562 2017 1 Synaptic Research, LLC 50,000 2008 1 Synergy America, Inc. d/b/a SynAm Vaccine 690,500 2012 3 Telcare, Inc. 505,000 2011 1 Theranostics Health, Inc. 540,000 2015 2 TissueGene, Inc. 12,500 2008 1 Traxion Therapeutics, Inc. 37,500 2007 1 Trevigen Cell Assays, LLC 125,000 2007 1 Vasoptic Medical Inc. 250,000 2017 1 Vizuri Health Sciences LLC 750,000 2015 1 Xcision Medical Systems, LLC 4,129,990 2011 7 Zymetis, Inc. 1,050,433 2009 2
DRAFT