dr-mukesh (2).ppt
TRANSCRIPT
PBPK Model for Lead: PBPK Model for Lead: Uncertainties and Parameter Uncertainties and Parameter
EstimationEstimation
byby
Sangam Uma ReddySangam Uma Reddy
Thesis SupervisorDr. Mukesh Sharma

OverviewOverview
Introduction Introduction
Objective of the studyObjective of the study
Literature reviewLiterature review
Methodology Methodology
Results and discussionResults and discussion
ConclusionsConclusions

LeadLead
Versatile heavy metalVersatile heavy metal Extensively usedExtensively used Cheap, useful, easy to mine, physical properties Cheap, useful, easy to mine, physical properties
- ubiquitous in air, food, water and soil- ubiquitous in air, food, water and soil Cumulative Neurotoxin, no known biological Cumulative Neurotoxin, no known biological
functionfunction one of most hazardous substances (ATSDR)one of most hazardous substances (ATSDR)

Usage of LeadUsage of Lead
BatteriesBatteries PigmentsPigments Rolled/ExtrusionsRolled/Extrusions AmmunitionsAmmunitions Cable SheathingCable Sheathing Petrol AdditivesPetrol Additives
73%
11%
6%
2%
3%
2%1% 2%
Batteries Pigments Rolled Ext.
Ammunition Cable Sheathing Petrol Additives
Alloys Miscellaneous
Source: ILZSG, 1997Source: ILZSG, 1997
Effects of LeadEffects of Lead
Damage Central Nervous SystemDamage Central Nervous System Causes reduction in IQ and attention spanCauses reduction in IQ and attention span Affects mental and physical developmentAffects mental and physical development Reading and learning disabilities, hyperactivity Reading and learning disabilities, hyperactivity
and other behavioral problemsand other behavioral problems Impairs formation of Hemoglobin, thus AnemiaImpairs formation of Hemoglobin, thus Anemia Irreversible brain damageIrreversible brain damage Even death at higher concentrationEven death at higher concentration

However…However…
Lead continues to be in environment after several Lead continues to be in environment after several years of unleaded gasoline (Morisawa years of unleaded gasoline (Morisawa et al.et al. 2001) 2001) – Why?– Why?
After phase out of lead from gasoline:After phase out of lead from gasoline: Immediate drop in airImmediate drop in air Exposure continues:Exposure continues:
FoodFood WaterWater SoilSoil Air ???Air ???
Objective of the studyObjective of the study
““To estimate the parameter values (KETo estimate the parameter values (KELILI and and
KEKEKIKI) of PBPK model using the observed ) of PBPK model using the observed
blood and urine lead levelsblood and urine lead levels””

Routes of humans exposureRoutes of humans exposure
Exposure MechanismExposure Mechanism
• IngestionIngestion Absorption - 50% in Absorption - 50% in childrenchildren
- 10% in adults- 10% in adults• RespirationRespiration Absorption - 50% in children Absorption - 50% in children
and adultsand adults• DermalDermal Absorption Absorption - Insignificant- Insignificant
6%
41% 53%
Food Water Air
Source: Tripathi Source: Tripathi et al.et al., 1997, 1997Source: Tripathi Source: Tripathi et al.et al., 1997, 1997

DistributionDistribution
BloodBlood Soft tissueSoft tissue BoneBone
Liver, Kidneys, Brain and Muscle
Excretion Urine Bile Sweat Nails Hair
95% of the Pb body burden in bones (O’Flaherty, 1993)
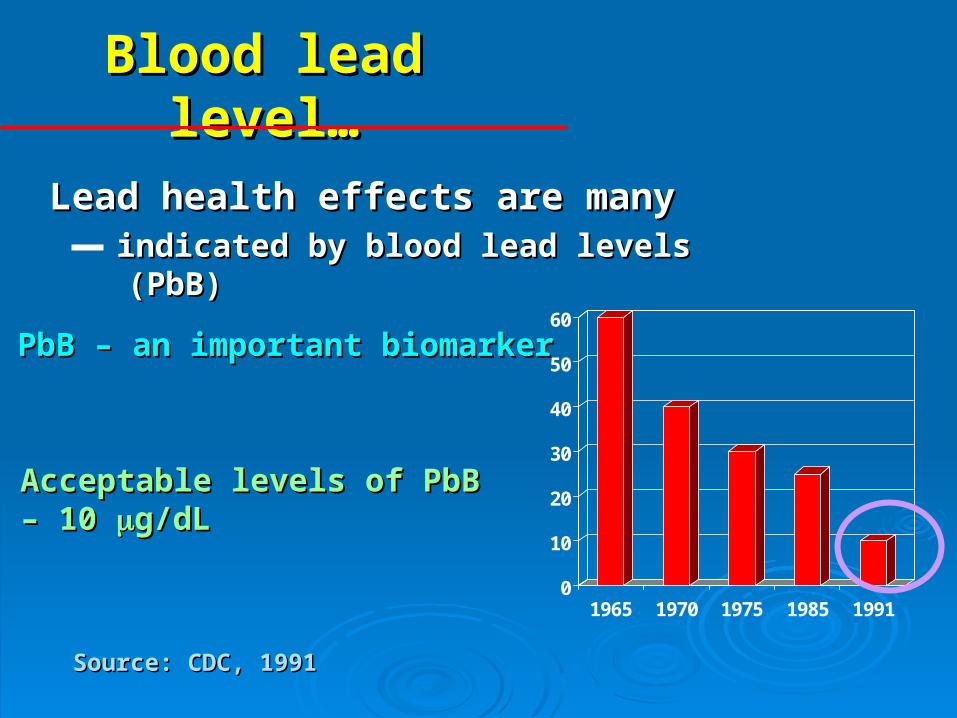
Blood lead level…Blood lead level…
Lead health effects are manyLead health effects are many indicated by blood lead levels (PbB)indicated by blood lead levels (PbB)
PbB – an important biomarkerPbB – an important biomarker
Acceptable levels of PbB Acceptable levels of PbB – – 10 10 g/dLg/dL
0
10
20
30
40
50
60
1965 1970 1975 1985 1991
Source: CDC, 1991Source: CDC, 1991
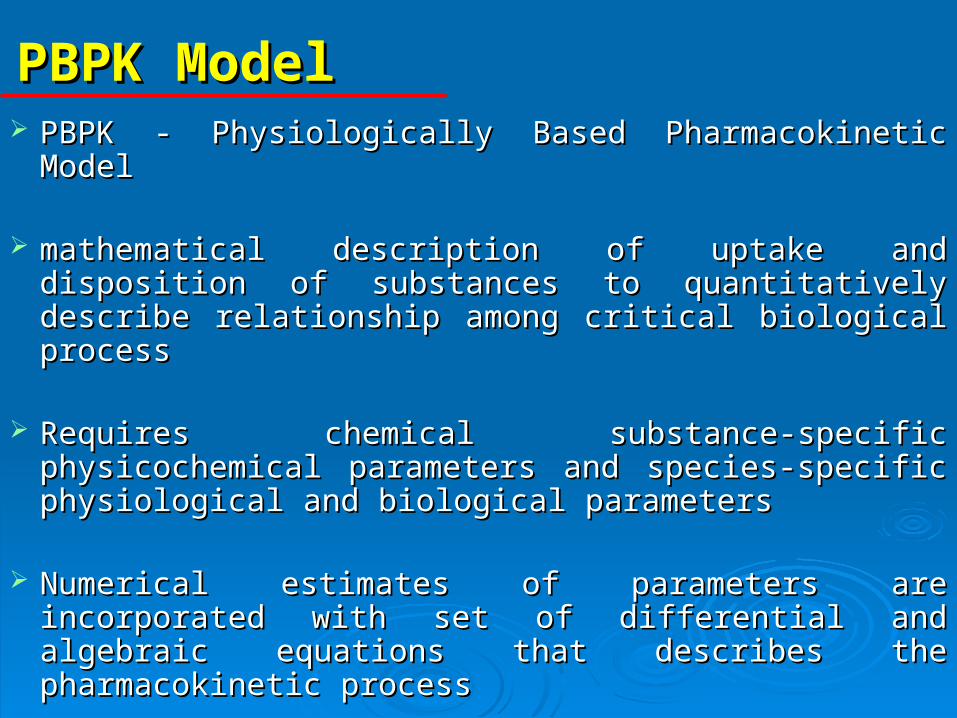
PBPK ModelPBPK Model PBPK - Physiologically Based Pharmacokinetic ModelPBPK - Physiologically Based Pharmacokinetic Model
mathematical description of uptake and disposition of mathematical description of uptake and disposition of substances to quantitatively describe relationship substances to quantitatively describe relationship among critical biological processamong critical biological process
Requires chemical substance-specific Requires chemical substance-specific physicochemical parameters and species-specific physicochemical parameters and species-specific physiological and biological parametersphysiological and biological parameters
Numerical estimates of parameters are incorporated Numerical estimates of parameters are incorporated with set of differential and algebraic equations that with set of differential and algebraic equations that describes the pharmacokinetic processdescribes the pharmacokinetic process
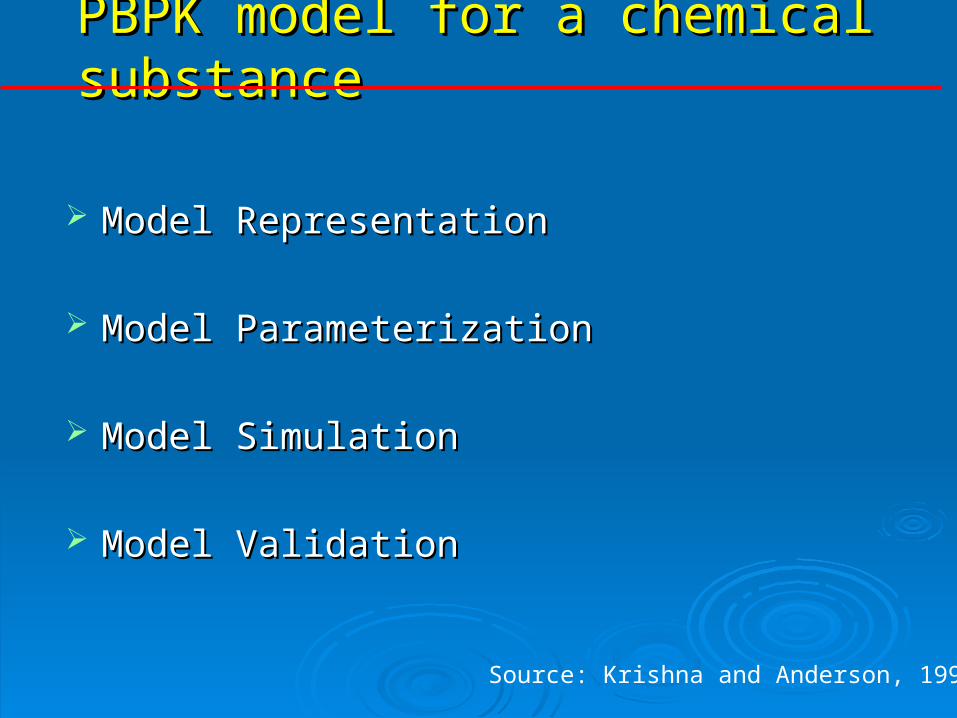
PBPK model for a chemical substancePBPK model for a chemical substance
Model RepresentationModel Representation
Model ParameterizationModel Parameterization
Model SimulationModel Simulation
Model ValidationModel Validation
Source: Krishna and Anderson, 1994

PBPK Model for LeadPBPK Model for Lead
LungsLungsLungsLungs
Rapidly Perfused TissuesRapidly Perfused TissuesRapidly Perfused TissuesRapidly Perfused Tissues
Slowly Perfused TissuesSlowly Perfused TissuesSlowly Perfused TissuesSlowly Perfused Tissues
BoneBoneBoneBone
KidneyKidneyKidneyKidney
LiverLiverLiverLiver
Gastrointestinal TractGastrointestinal TractGastrointestinal TractGastrointestinal Tract
Venous BloodVenous BloodVenous BloodVenous Blood Arterial BloodArterial BloodArterial BloodArterial Blood
InhalationInhalationInhalationInhalation ExhalationExhalationExhalationExhalation
QQQQ QQQQCCvenvenCCvenven CCartartCCartart
CCven,RAven,RACCven,RAven,RA
CCven,SLven,SLCCven,SLven,SL
CCven,BOven,BOCCven,BOven,BO
CCven,KIven,KICCven,KIven,KI
CCven,LIven,LICCven,LIven,LI
AALULUAALULU
AAGIGIAAGIGI
KEKEKIKIKEKEKIKI
KEKELILIKEKELILI
QQRARAQQRARA
QQSLSLQQSLSL
QQBOBOQQBOBO
QQKIKIQQKIKI
QQLILIQQLILI
Source: Morisawa Source: Morisawa et al.et al., 2001, 2001
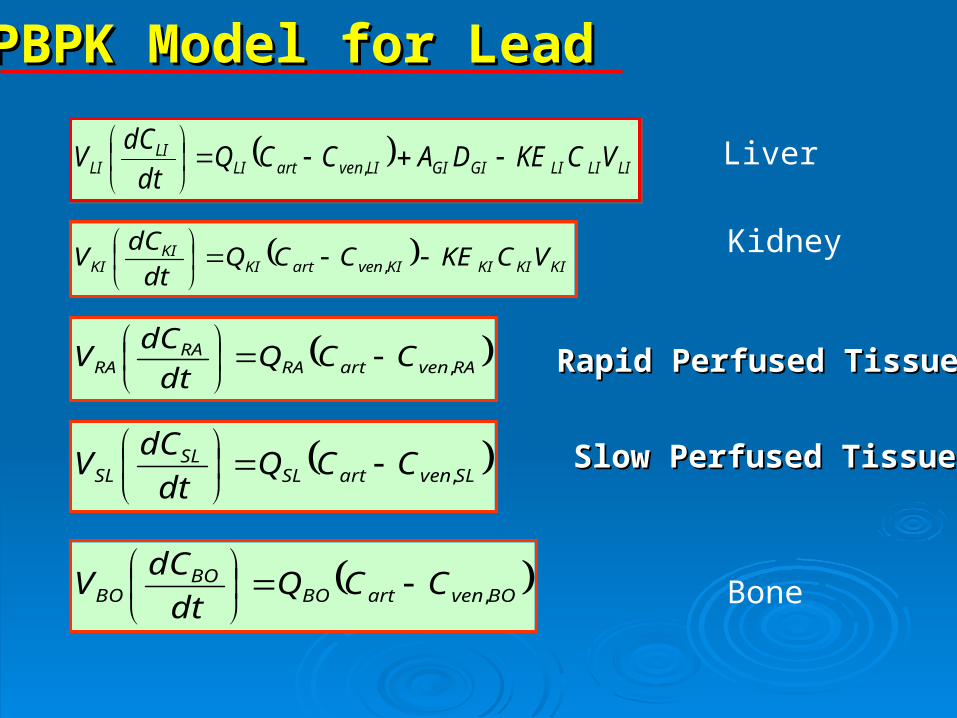
PBPK Model for LeadPBPK Model for Lead
LILILIGIGILIvenartLILI
LI VCKEDACCQdt
dCV
, LILILIGIGILIvenartLILI
LI VCKEDACCQdt
dCV
,
KIKIKIKIvenartKIKI
KI VCKECCQdt
dCV
,
RAvenartRARA
RA CCQdt
dCV ,
SLvenartSLSL
SL CCQdt
dCV ,
BOvenartBOBO
BO CCQdt
dCV ,
Liver
Kidney
Rapid Perfused TissuesRapid Perfused Tissues
Slow Perfused TissuesSlow Perfused Tissues
Bone
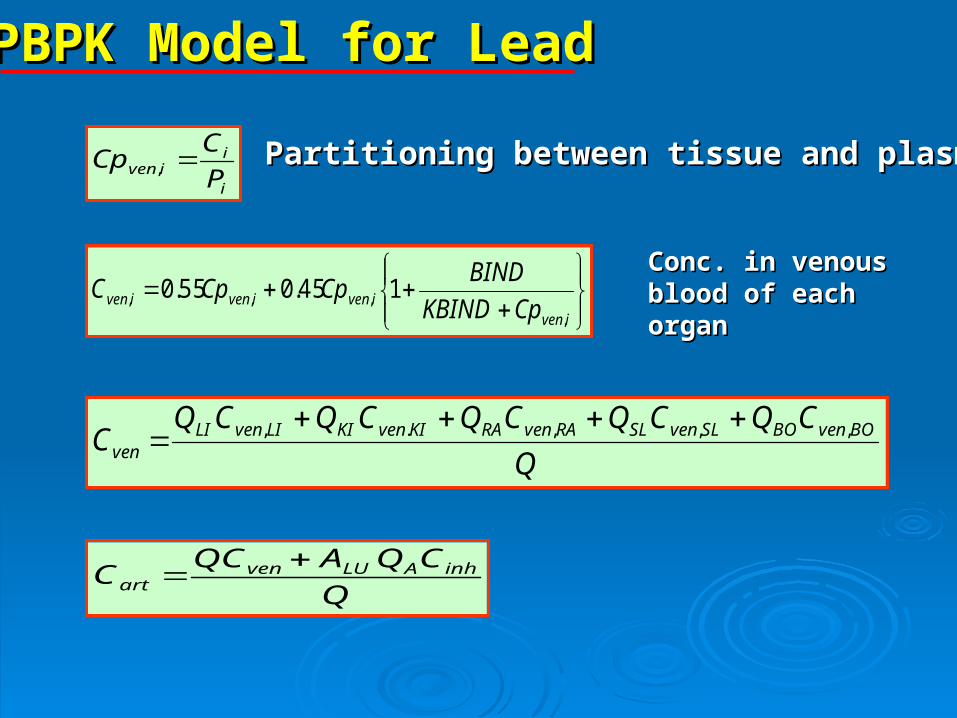
PBPK Model for LeadPBPK Model for Lead
i
iiven P
CCp ,
iveniveniveniven CpKBIND
BINDCpCpC
,,,, 145.055.0
Q
CQCQCQCQCQC BOvenBOSLvenSLRAvenRAKIvenKILIvenLI
ven,,,.,
Q
CQAQCC inhALUven
art
Partitioning between tissue and plasmaPartitioning between tissue and plasma
Conc. in venousConc. in venousblood of eachblood of eachorganorgan
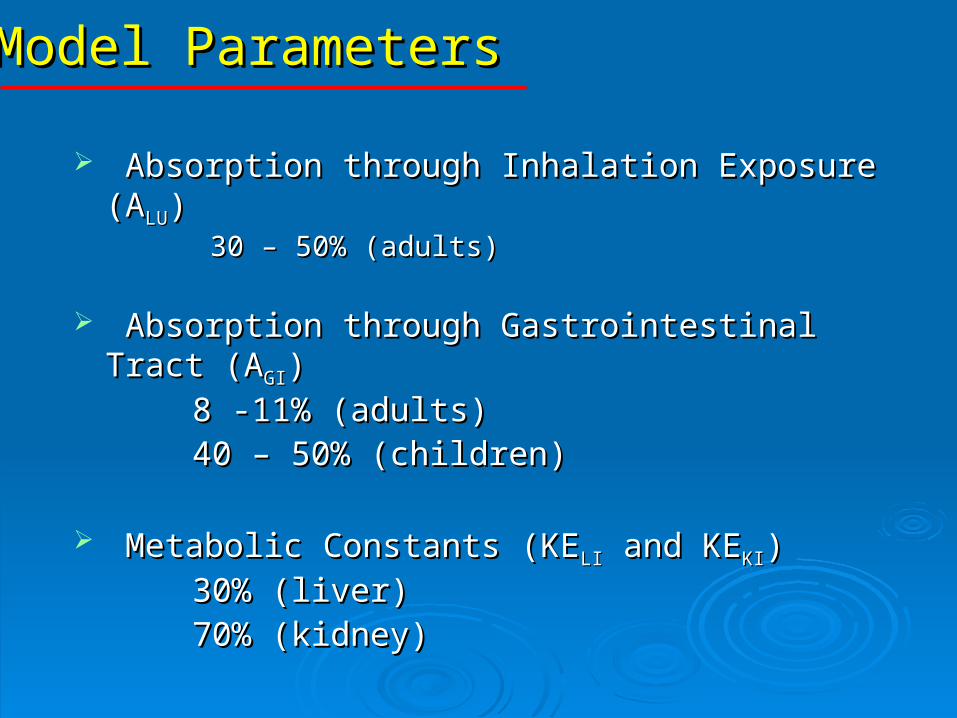
Model ParametersModel Parameters
Absorption through Inhalation Exposure (AAbsorption through Inhalation Exposure (ALULU)) 30 – 50% (adults)30 – 50% (adults)
Absorption through Gastrointestinal Tract (AAbsorption through Gastrointestinal Tract (AGIGI))
8 -11% (adults)8 -11% (adults) 40 – 50% (children)40 – 50% (children)
Metabolic Constants (KEMetabolic Constants (KELILI and KE and KEKIKI))
30% (liver)30% (liver) 70% (kidney)70% (kidney)

Uncertainty and Variability in PBPK modelsUncertainty and Variability in PBPK models
Model errors and data gapsModel errors and data gaps Uncertainty in extrapolating animal data to the case of Uncertainty in extrapolating animal data to the case of
humans (especially metabolic parameters)humans (especially metabolic parameters) Measurement errors and analytical uncertaintiesMeasurement errors and analytical uncertainties Uncertainty in exposure levels and parameter valuesUncertainty in exposure levels and parameter values
Inter-or-intra species variability in kinetics may be due to Inter-or-intra species variability in kinetics may be due to differences in:differences in:
• Physiology (body weight, %body fat, Organ sizes, Physiology (body weight, %body fat, Organ sizes, shapes)shapes)
• Variation (e.g. genetic) in metabolism and biochemistryVariation (e.g. genetic) in metabolism and biochemistry
• Co-exposure to other chemicalsCo-exposure to other chemicals
• Disease statesDisease states
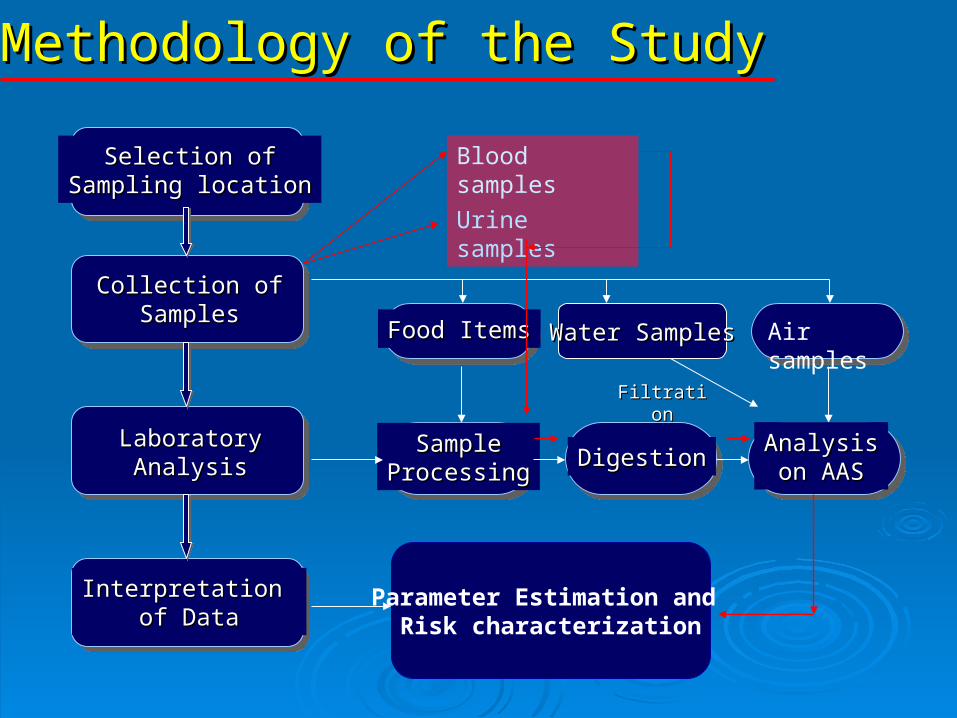
Methodology of the StudyMethodology of the Study
Selection ofSelection ofSampling locationSampling location
Collection ofCollection ofSamplesSamples
Food ItemsFood Items
LaboratoryLaboratoryAnalysisAnalysis
SampleSampleProcessingProcessing DigestionDigestion AnalysisAnalysis
on AASon AAS
Interpretation Interpretation of Dataof Data
Water SamplesWater Samples Air samples
FiltrationFiltration
Urine samples
Blood samples
Parameter Estimation and Risk characterization

Sampling LocationSampling Location
Sample CollectionSample Collection
Air Sample CollectionAir Sample Collection
Food Sample CollectionFood Sample Collection
Blood Sample CollectionBlood Sample Collection
Urine Sample CollectionUrine Sample Collection
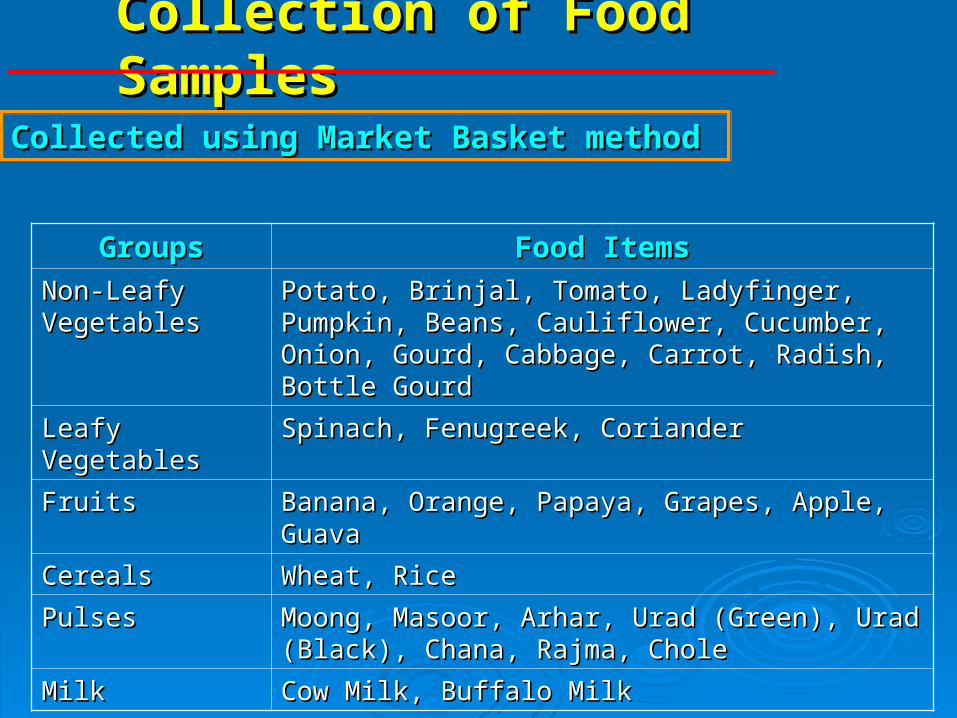
GroupsGroups Food ItemsFood Items
Non-Leafy Non-Leafy VegetablesVegetables
Potato, Brinjal, Tomato, Ladyfinger, Pumpkin, Beans, Potato, Brinjal, Tomato, Ladyfinger, Pumpkin, Beans, Cauliflower, Cucumber, Onion, Gourd, CabbageCauliflower, Cucumber, Onion, Gourd, Cabbage, , Carrot, Radish, Bottle GourdCarrot, Radish, Bottle Gourd
Leafy VegetablesLeafy Vegetables Spinach, Fenugreek, CorianderSpinach, Fenugreek, Coriander
FruitsFruits Banana, Orange, Papaya, Grapes, AppleBanana, Orange, Papaya, Grapes, Apple, Guava, Guava
CerealsCereals Wheat, RiceWheat, Rice
PulsesPulses Moong, Masoor, Arhar, Urad (Green), Urad (Black), Moong, Masoor, Arhar, Urad (Green), Urad (Black), Chana, RajmaChana, Rajma, Chole, Chole
MilkMilk Cow Milk, Buffalo MilkCow Milk, Buffalo Milk
Collection of Food SamplesCollection of Food Samples
Collected using Market Basket methodCollected using Market Basket method Collected using Market Basket methodCollected using Market Basket method
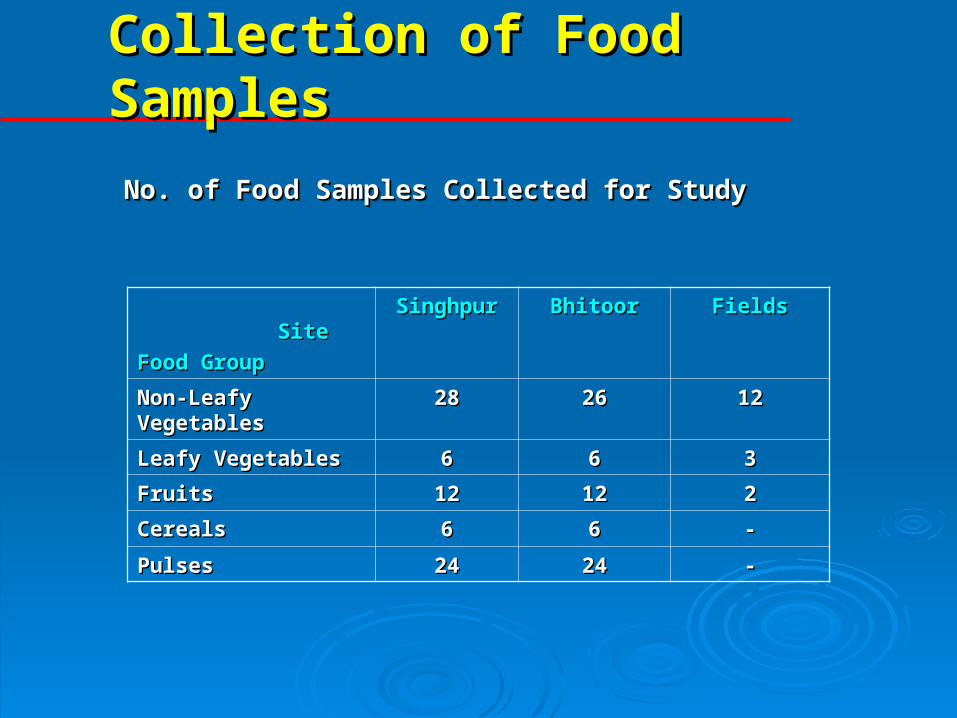
SiteSite
Food GroupFood Group
SinghpurSinghpur BhitoorBhitoor FieldsFields
Non-Leafy VegetablesNon-Leafy Vegetables 2828 2626 1212
Leafy VegetablesLeafy Vegetables 66 66 33
FruitsFruits 1212 1212 22
CerealsCereals 66 66 --
PulsesPulses 2424 2424 --
No. of Food Samples Collected for StudyNo. of Food Samples Collected for StudyNo. of Food Samples Collected for StudyNo. of Food Samples Collected for Study
Collection of Food SamplesCollection of Food Samples
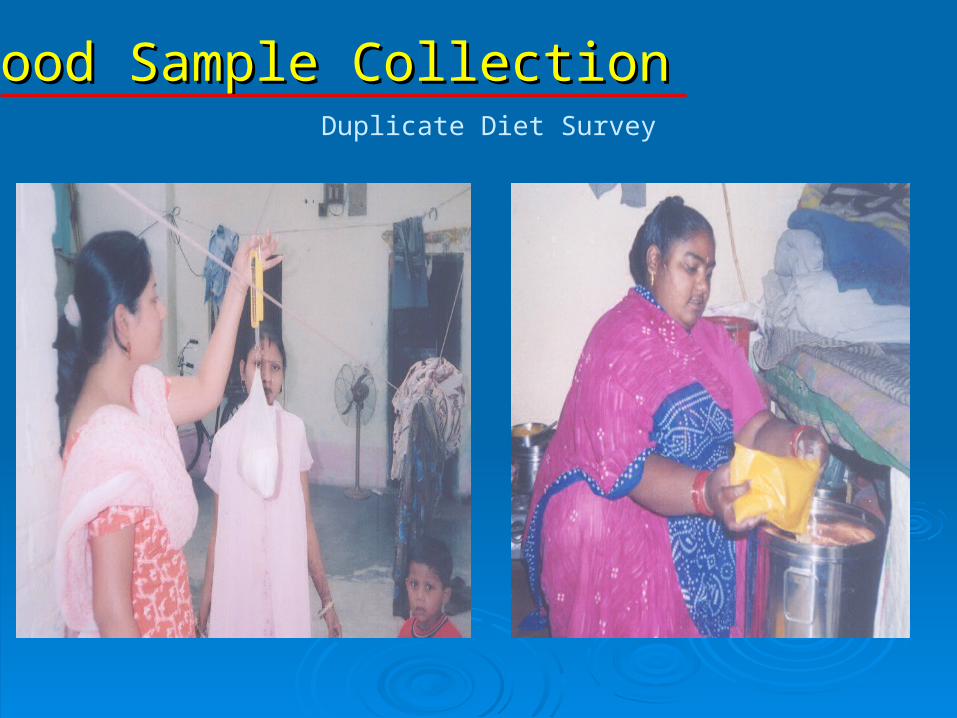
Food Sample CollectionFood Sample CollectionDuplicate Diet Survey
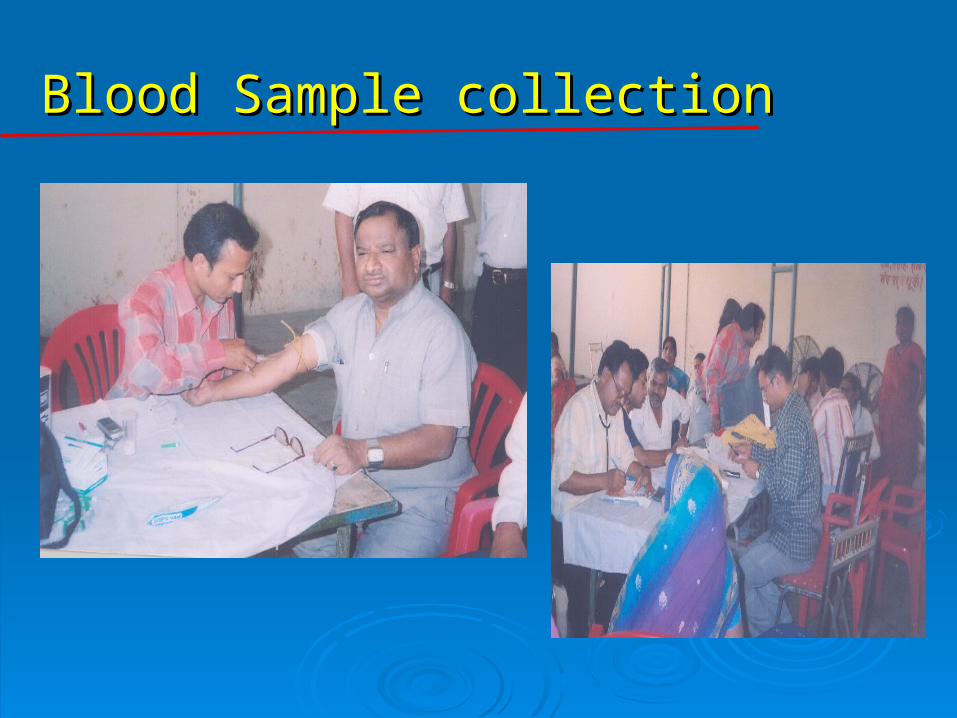
Blood Sample collectionBlood Sample collection

Sample AnalysisSample Analysis
Air Sample AnalysisAir Sample Analysis
Food Sample AnalysisFood Sample Analysis
• Filter Paper ConditioningFilter Paper Conditioning• Sample ExtractionSample Extraction• Instrumentation and AnalysisInstrumentation and Analysis
•Sample ProcessingSample Processing•Sample ExtractionSample Extraction•Instrumentation and AnalysisInstrumentation and Analysis

Sample AnalysisSample Analysis
Blood Sample AnalysisBlood Sample Analysis
Urine Sample AnalysisUrine Sample Analysis
• Sample ExtractionSample Extraction
• Instrumentation and AnalysisInstrumentation and Analysis
• Sample ExtractionSample Extraction
• Instrumentation and AnalysisInstrumentation and Analysis
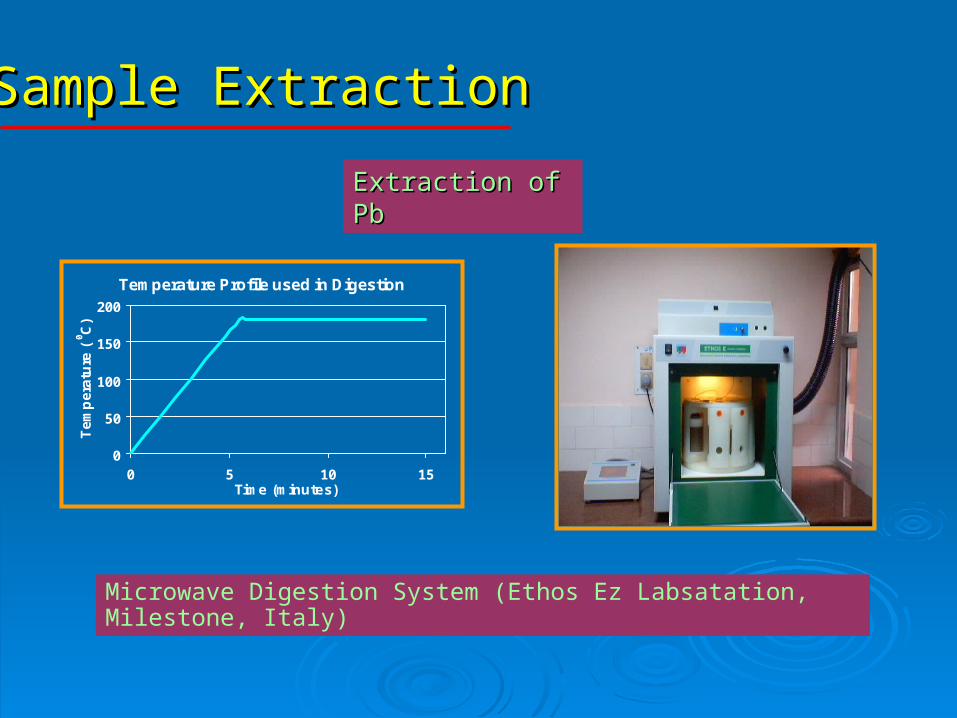
Sample ExtractionSample Extraction
Temperature Profile used in Digestion
0
50
100
150
200
0 5 10 15Time (minutes)
Te
mp
era
ture
(0C
)
Microwave Digestion System (Ethos Ez Labsatation, Milestone, Italy)
Extraction of PbExtraction of Pb

Sample Analysis: GFAAS (GBC Avanta Sigma)Sample Analysis: GFAAS (GBC Avanta Sigma)Sample Analysis: GFAAS (GBC Avanta Sigma)Sample Analysis: GFAAS (GBC Avanta Sigma)
CalibrationCalibration
Working StandardsWorking StandardsWavelength: 283.3 nmWavelength: 283.3 nmVolume injected: 20 Volume injected: 20 LL
CalibrationCalibration
Working StandardsWorking StandardsWavelength: 283.3 nmWavelength: 283.3 nmVolume injected: 20 Volume injected: 20 LL
Final TemperatureFinal Temperature Ramp TimeRamp Time Hold TimeHold Time Gas TypeGas Type
4040 2.02.0 1.01.0 InertInert
9090 5.05.0 5.05.0 InertInert
120120 10.010.0 5.05.0 InertInert
400400 10.010.0 5.05.0 InertInert
400400 1.01.0 1.01.0 NoneNone
21002100 1.51.5 2.02.0 NoneNone
23002300 1.01.0 1.01.0 InertInert
Graphite Furnace ProgramGraphite Furnace ProgramGraphite Furnace ProgramGraphite Furnace Program
Sample AnalysisSample Analysis
MDL: 0.8 ppbMDL: 0.8 ppb
Recovery Recovery Food Samples: 94-95%Food Samples: 94-95%Blood Samples: 89%Blood Samples: 89%

Risk CharacterizationRisk Characterization
Non-LeafyNon-LeafyVegetablesVegetablesNon-LeafyNon-LeafyVegetablesVegetables WaterWaterWaterWater
LeafyLeafyVegetablesVegetables
LeafyLeafyVegetablesVegetables MilkMilkMilkMilk
FruitsFruitsFruitsFruits PulsesPulsesPulsesPulsesCerealsCerealsCerealsCereals
Monte Carlo SimulationMonte Carlo SimulationMonte Carlo SimulationMonte Carlo Simulation
Examine Probability Distribution of lead levels of Food Items and
Quantity of Food Consumed

PBPK Model
Dietary Lead Dietary Lead IntakeIntake
Dietary Lead Dietary Lead IntakeIntake
ExposureExposurethrough Airthrough AirExposureExposure
through Airthrough Air
PbBPbBPbBPbB
Risk CharacterizationRisk Characterization
1010g/dLg/dL
RiskRisk
Quantity of Food Consumed Pb Levels in Food Items

Results and DiscussionResults and DiscussionAverage lead levels in food itemsAverage lead levels in food itemsAverage lead levels in food itemsAverage lead levels in food items
22Sharma Sharma et alet al. (2005); . (2005); 33-ATSDR (1999); -ATSDR (1999); 44-Tripathi -Tripathi et al.et al. (1997); (1997); 55-Zhang -Zhang et al.et al. (1998); (1998); 66-Ysart -Ysart et al.et al. (1999); (1999); 77-Urieta -Urieta et al.et al. (1996); (1996); 8**8**-Cuadrado -Cuadrado et al.et al. (1995), only data of Madrid are taken. (1995), only data of Madrid are taken. 9 9*-Krishnamurti *-Krishnamurti and Vishwanathan (1991), only data of Uttar Pradesh are taken.and Vishwanathan (1991), only data of Uttar Pradesh are taken.
Food GroupPresent Study at
Pratap Pur Hari (1)
Urban area,Kanpur (2)
US cities(3)
Bombay(4)
China(5)
Britain(6)
Basque(7)
Madrid(8)**
IEPHM(9)*
Cereals 106.3880.12(25.93–207.01)
n = 6
119.9982.13(28.97–223.90)
n = 8(2–136)
18.2n = 15
56.4±100.0
(4–616)n = 59
2033
(10–65)n = 12
3041132 170
Pulses 220.80116.47(43.60–405.36)
n = 48
283.28118.42(65.23–415.98)
n = 21
253.3n = 13
33.0±25.6(4–143)
n = 34
10(<5–30)
22.43.0 350
Leafy vegeta
bles
317.6861.80(191.68–437.53)
n=15
325.6074.06(181.56–541.61)
n = 32
100.4n = 11
10 430
Non-leafy vegeta
bles
101.9752.80(36.17–243.70)
n = 66
121.9158.29(24.84–279.29)
n = 114(5–649)
4.1n = 32
2023
(5–45)n = 12
1826 360
Fruits 5.651.77(1.05–17.35)
n = 18
7.326.1(2.22–17.60)
n = 10(5–223)
7.4n = 7
<1015
(<5–25)n = 10
18119
Milk 0.460.19(ND–0.65)
n = 6
4.082.78(0.4–7.79)
n = 8(3–83)
1.6n = 4
<109
(<5–20)n = 4
34.91.8 50
Water 3.960.86(3.16–5.25)
n = 6
8.433.99(4.5–16.04)
n = 11< 5
1.2n = 13
111
Conclusions: Pb concentrations in food items in Kanpur city are high compared to other cities. High in leafy vegetables. Concentration in food items from rural area is somewhat less to urban samples.
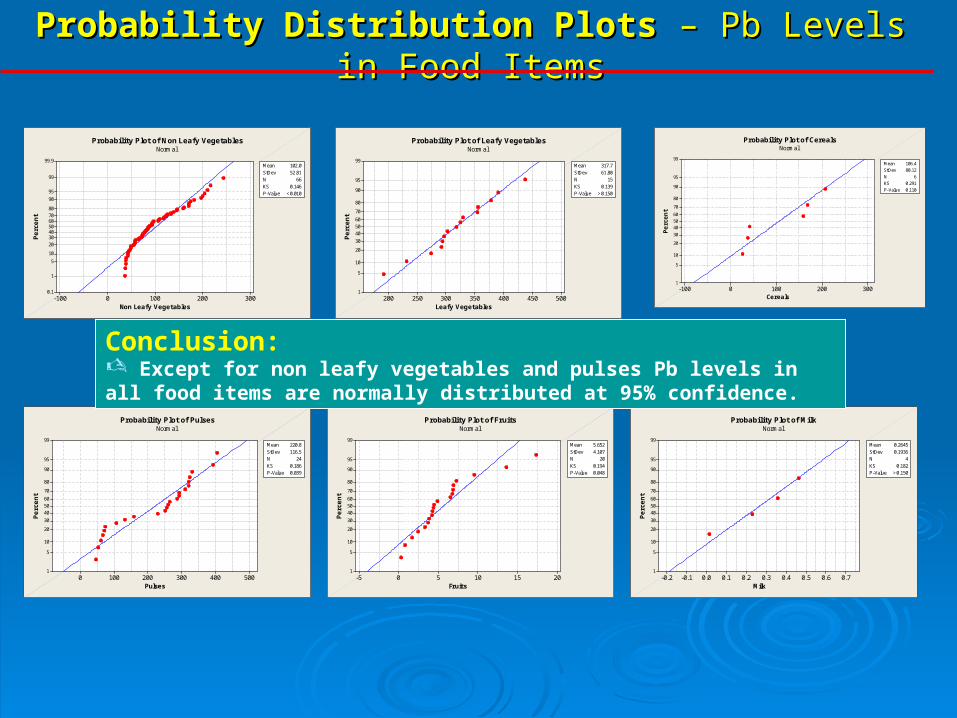
Probability Distribution Plots Probability Distribution Plots – Pb Levels in Food Items– Pb Levels in Food Items
Leafy Vegetables
Perc
ent
500450400350300250200
99
95
90
80
70
605040
30
20
10
5
1
Mean
>0.150
317.7StDev 61.80N 15KS 0.139P-Value
Probability Plot of Leafy VegetablesNormal
Pulses
Perc
ent
5004003002001000
99
95
90
80
70
605040
30
20
10
5
1
Mean
0.039
220.8StDev 116.5N 24KS 0.186P-Value
Probability Plot of PulsesNormal
Milk
Perc
ent
0.70.60.50.40.30.20.10.0-0.1-0.2
99
95
90
80
70
605040
30
20
10
5
1
Mean
>0.150
0.2645StDev 0.1936N 4KS 0.182P-Value
Probability Plot of MilkNormal
Non Leafy Vegetables
Perc
ent
3002001000-100
99.9
99
95
90
80706050403020
10
5
1
0.1
Mean
<0.010
102.0StDev 52.81N 66KS 0.146P-Value
Probability Plot of Non Leafy VegetablesNormal
Cereals
Perc
ent
3002001000-100
99
95
90
80
70
605040
30
20
10
5
1
Mean
0.110
106.4StDev 80.12N 6KS 0.291P-Value
Probability Plot of CerealsNormal
Fruits
Perc
ent
20151050-5
99
95
90
80
70
605040
30
20
10
5
1
Mean
0.048
5.652StDev 4.107N 20KS 0.194P-Value
Probability Plot of FruitsNormal
Conclusion: Except for non leafy vegetables and pulses Pb levels in all food items are normally distributed at 95% confidence.
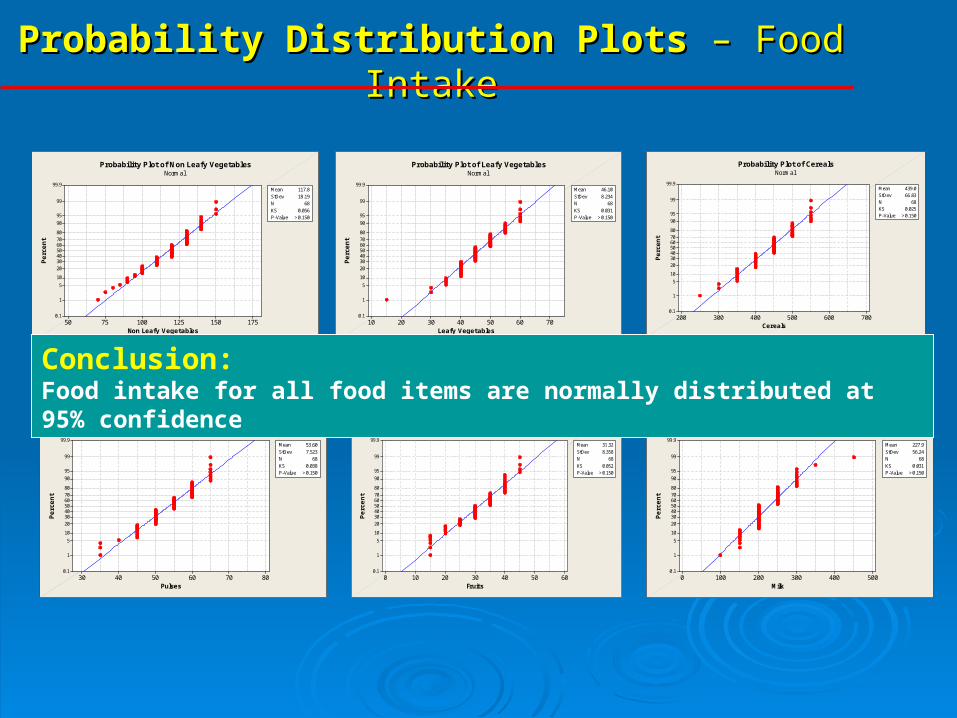
Probability Distribution Plots Probability Distribution Plots – Food Intake– Food Intake
Non Leafy Vegetables
Perc
ent
1751501251007550
99.9
99
95
90
80706050403020
10
5
1
0.1
Mean
>0.150
117.8StDev 18.19N 68KS 0.056P-Value
Probability Plot of Non Leafy VegetablesNormal
Pulses
Perc
ent
807060504030
99.9
99
95
90
80706050403020
10
5
1
0.1
Mean
>0.150
53.60StDev 7.523N 68KS 0.038P-Value
Probability Plot of PulsesNormal
Milk
Perc
ent
5004003002001000
99.9
99
95
90
80706050403020
10
5
1
0.1
Mean
>0.150
227.9StDev 56.24N 68KS 0.031P-Value
Probability Plot of MilkNormal
Cereals
Perc
ent
700600500400300200
99.9
99
95
90
80706050403020
10
5
1
0.1
Mean
>0.150
439.0StDev 66.83N 68KS 0.025P-Value
Probability Plot of CerealsNormal
Leafy Vegetables
Perc
ent
70605040302010
99.9
99
95
90
80706050403020
10
5
1
0.1
Mean
>0.150
46.10StDev 8.234N 68KS 0.031P-Value
Probability Plot of Leafy VegetablesNormal
Fruits
Perc
ent
6050403020100
99.9
99
95
90
80706050403020
10
5
1
0.1
Mean
>0.150
31.32StDev 8.358N 68KS 0.052P-Value
Probability Plot of FruitsNormal
Conclusion:Food intake for all food items are normally distributed at 95% confidence
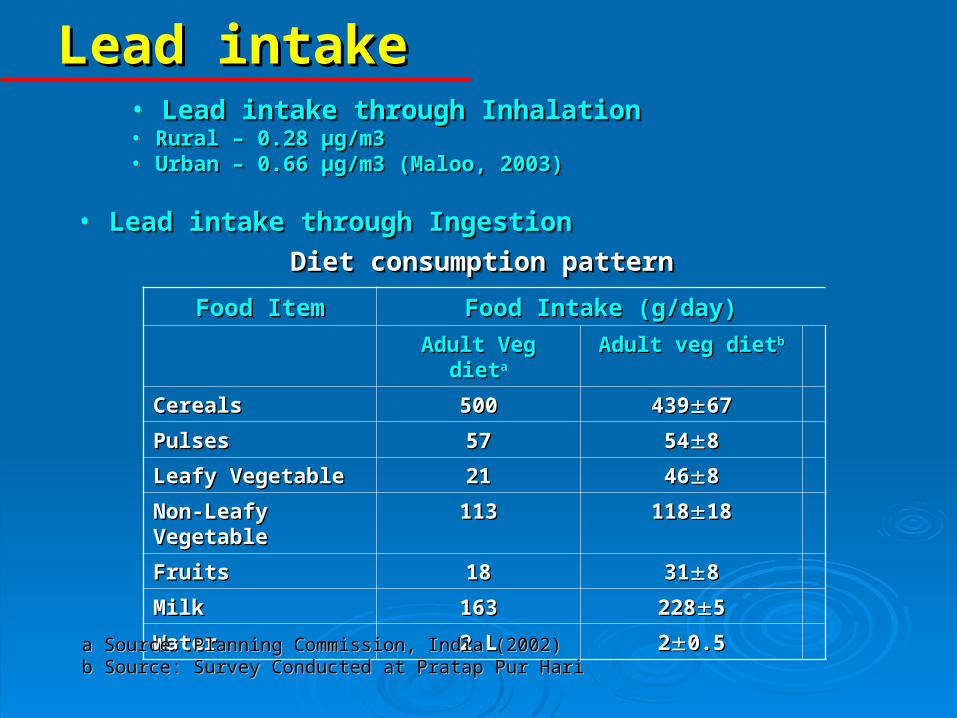
• Lead intake through IngestionLead intake through Ingestion• Lead intake through IngestionLead intake through Ingestion
Diet consumption patternDiet consumption patternDiet consumption patternDiet consumption pattern
Food ItemFood Item Food Intake (g/day)Food Intake (g/day)
Adult Veg dietAdult Veg dietaa Adult veg dietAdult veg dietbb
CerealsCereals 500500 4394396767
PulsesPulses 5757 545488
Leafy VegetableLeafy Vegetable 2121 464688
Non-Leafy VegetableNon-Leafy Vegetable 113113 1181181818
FruitsFruits 1818 313188
MilkMilk 163163 22822855
WaterWater 2 L2 L 220.50.5
a Source: Planning Commission, India (2002)a Source: Planning Commission, India (2002)b Source: Survey Conducted at Pratap Pur Harib Source: Survey Conducted at Pratap Pur Hari
Lead intakeLead intake• Lead intake through Inhalation Lead intake through Inhalation • Rural – 0.28 Rural – 0.28 µg/m3µg/m3• Urban – 0.66 Urban – 0.66 µg/m3 (Maloo, 2003)µg/m3 (Maloo, 2003)
• Lead intake through Inhalation Lead intake through Inhalation • Rural – 0.28 Rural – 0.28 µg/m3µg/m3• Urban – 0.66 Urban – 0.66 µg/m3 (Maloo, 2003)µg/m3 (Maloo, 2003)
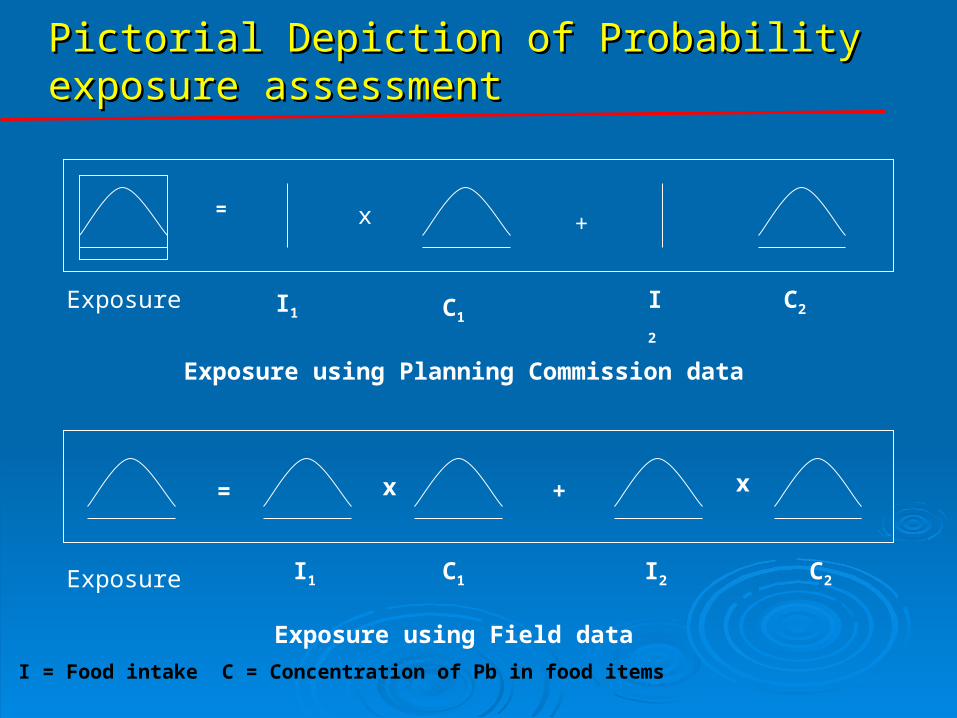
Pictorial Depiction of Probability exposure Pictorial Depiction of Probability exposure assessmentassessment
x +
Exposure I1 C1I2 C2
= x + x
Exposure I1 I2C1 C2
Exposure using Planning Commission data
Exposure using Field data
=
I = Food intake C = Concentration of Pb in food items

Comparison of Dietary Intake Values obtained Comparison of Dietary Intake Values obtained using Field data and Planning Commission datausing Field data and Planning Commission data
Dietary Lead Intake (microgram/ day)
Frequen
cy
450375300225150750
80
70
60
50
40
30
20
10
0
Mean StDev N97.90 53.01 30187.34 40.45 300
VariableField dataPlanning commission data
Normal Probability Density Function
Conclusion:To address the variability/uncertainty actual measurements of dietary Intake should be taken rather than going by fixed food consumption pattern
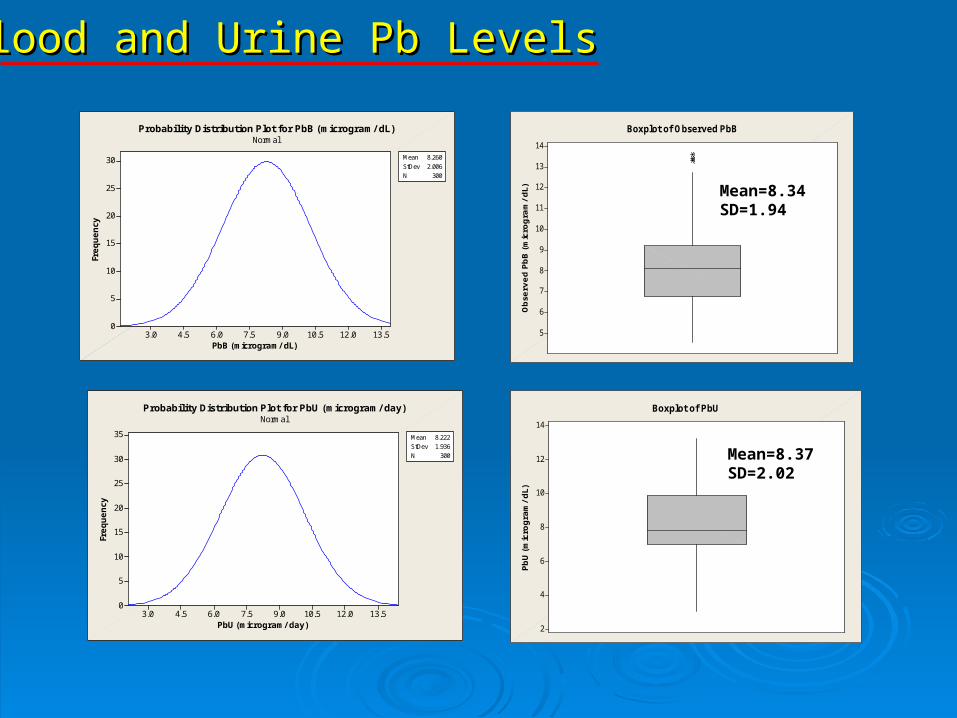
Blood and Urine Pb LevelsBlood and Urine Pb Levels
Obse
rved P
bB (
mic
rogra
m/dL)
14
13
12
11
10
9
8
7
6
5
Boxplot of Observed PbB
PbB (microgram/ dL)
Frequency
13.512.010.59.07.56.04.53.0
30
25
20
15
10
5
0
Mean 8.260StDev 2.006N 300
Normal Probability Distribution Plot for PbB (microgram/ dL)
PbU (
mic
rogra
m/dL)
14
12
10
8
6
4
2
Boxplot of PbU
PbU (microgram/ day)
Frequency
13.512.010.59.07.56.04.53.0
35
30
25
20
15
10
5
0
Mean 8.222StDev 1.936N 300
Normal Probability Distribution Plot for PbU (microgram/ day)
Mean=8.34SD=1.94
Mean=8.37SD=2.02

Comparison of Present Study PbB Levels with Comparison of Present Study PbB Levels with Other StudiesOther Studies
Area No. of Samples
Geometric mean concentration
(μg/dL)
Deonar (suburban Bombay)a
28 8.9(2.9-31.2)
Parel (central Bombay)a
60 11.5(2.9-47.7)
Byculla (central
Bombay)a
94 11.9(1.1-35.3)
Greater Bombaya
77 14.4(2.9-41.2)
Kanpurb 24 18(ND-140)
Present study 68 8.34(4.56-13.59)
Source a : R. N. Khandekar et at, (1987) Source b: Seth (2000)
Conclusion:PbB observed in present study are comparable to that of Deonar Study Study by Seth (2000) shows higher levels as data reported is for year 1996 when leaded gasoline was used

PbB and PbU LevelsPbB and PbU Levels
Area Survey Site
Number of Subjects
Age PbB(µg/L)
PbU (µg/L) Correlation Coefficients
References
Bangkok 52 19-57 32.3 (1.37) 2.35 (1.70) 0.31a Zhang etal._1998a.
Kuala Lumpur 47 21-47 65.4 (1.4) 4.74 (1.79) 0.43b Moon et al._1996.
Manila 45 21-64 37 (1.36) 3.64(1.82) 0.08 Zhang et al._1998b.
Tainan 51 22-66 33.9 (1.26) 1.54 (1.99) 0.12 Ikeda et al._1996.
Beijing 50 20-62 43.4(1.38) 5.73(1.69) 0.31a Zhang et al._1997.
Jinan 50 21-55 35.3(1.44) 2.16(1.55) 0.27 Ibid.
Nanning 50 23-57 54.5(1.42) 1.57(1.99) 0.38b Ibid.
Shanghai 50 23-58 55.4(1.47) 1.81(1.8) 0.45b Ibid.
Xian 50 24-58 43.4(1.32) 3.34(2.14) 0.02 Kae Higashikawa et al., 2000
Tokyo Kyoto 61 40-68 37.7(1.7) 1.74(2.63) 0.63b Shimbo et al._1999.
Seoul Pusan 55 31-49 47.2(1.27) 3.11(2.02) 0.11 Moon et al._1995.
--- 84 --- 300 21.33 0.9a Gross, 1979
Pratap Pur Hari
35 20-45 82.3(16.1) 5.58(1.34) 0.82a The present study
Numbers in the parentheses show standard deviation a. P < 0.05b. P < 0.01
Conclusions: High correlation between PbB and PbU was observed in present study, Study by Gross (1979) and Shimbo et al. (1999). If PbB levels are high, kidney enhances its performance in terms of getting toxic metals out of system

Relationship of Urinary Lead Excretion rate and Blood Lead Concentration
5
6
7
8
9
10
11
12
13
14
5 6 7 8 9 10 11 12 13 14 15
Blood Levels (microgram/dL)
Uri
nar
y L
ead
Exc
reti
on
(m
icro
gra
m/d
ay)
Relationship of Urinary Lead Excretion Rate and PbB
Present Study
Gross, 1979
Conclusions: Trend is comparable with that of Gross, 1979 KEKI may be variable from one person to another
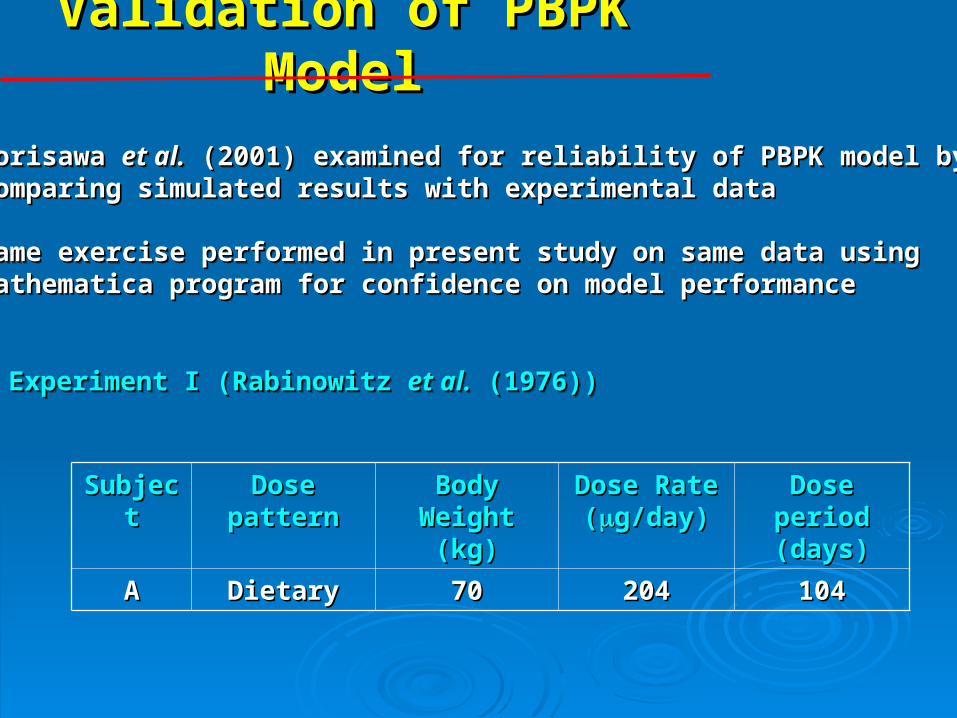
Validation of PBPK ModelValidation of PBPK Model
Morisawa Morisawa et al.et al. (2001) examined for reliability of PBPK model by (2001) examined for reliability of PBPK model bycomparing simulated results with experimental datacomparing simulated results with experimental data
Same exercise performed in present study on same data using Same exercise performed in present study on same data using Mathematica program for confidence on model performanceMathematica program for confidence on model performance
Experiment I (Rabinowitz Experiment I (Rabinowitz et al.et al. (1976)) (1976))Experiment I (Rabinowitz Experiment I (Rabinowitz et al.et al. (1976)) (1976))
SubjectSubject Dose patternDose pattern Body Weight Body Weight (kg)(kg)
Dose Rate Dose Rate ((g/day)g/day)
Dose period Dose period (days)(days)
AA DietaryDietary 7070 204204 104104

Subject A
Time (day)
0 100 200 300
Blo
od le
ad le
vel (
mic
rogr
am/d
L)
0
2
4
6
8ObservedEstimated
Validation of PBPK ModelValidation of PBPK Model
Dots represent experimental dataSolid line output by Mathematica program
Conclusion:The output from Mathematica program matches with experimental data
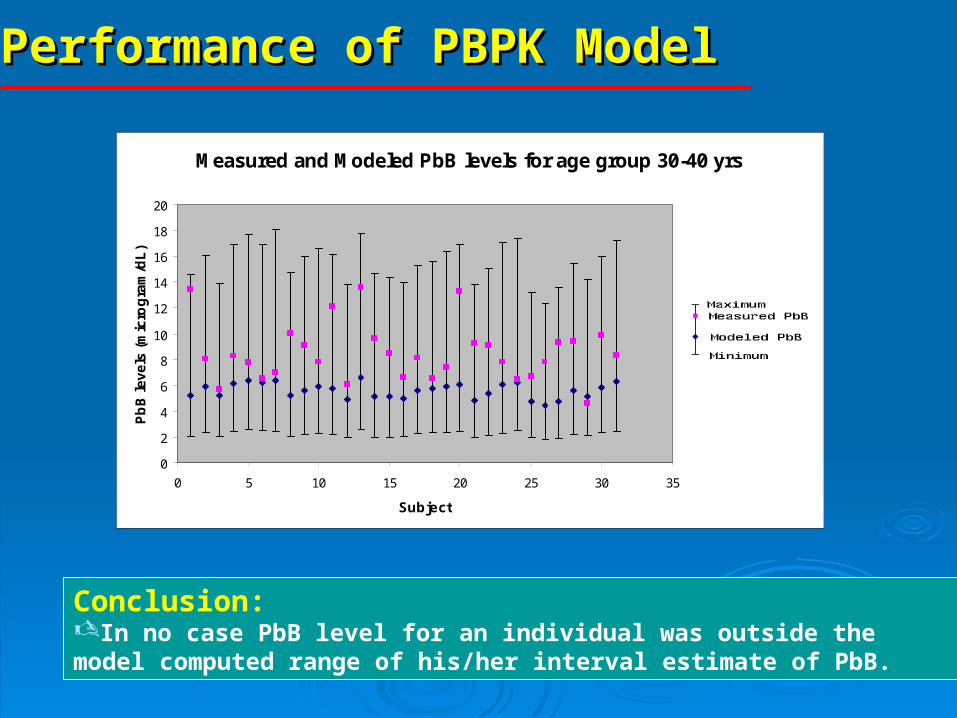
Performance of PBPK ModelPerformance of PBPK Model
Measured and Modeled PbB levels for age group 30-40 yrs
0
2
4
6
8
10
12
14
16
18
20
0 5 10 15 20 25 30 35
Subject
Pb
B l
ev
els
(m
icro
gra
m/d
L)
Conclusion:In no case PbB level for an individual was outside the model computed range of his/her interval estimate of PbB.

Parameters (KEParameters (KELILI, KE, KEKIKI) Estimation) Estimation Steady state PBPK Model
,( ) 0LI art ven LI GI GI LI LI LIQ C C A D KE C V
0, KIKIKIKIvenartKI VCKECCQ
Cart = Cven, RA
Cart = Cven, SL
Cart = Cven, BO
……….(2)
……(1)
……………………………………………(3)
……………………………………………(4)
……………………………………………(5)
i
iiven P
CCp ,
iveniveniveniven CpKBIND
BINDCpCpC
,,,, 145.055.0
Cart = Cven
Q
CQCQCQCQCQC venBOvenSLvenRAKIvenKILIvenLI
ven
,,
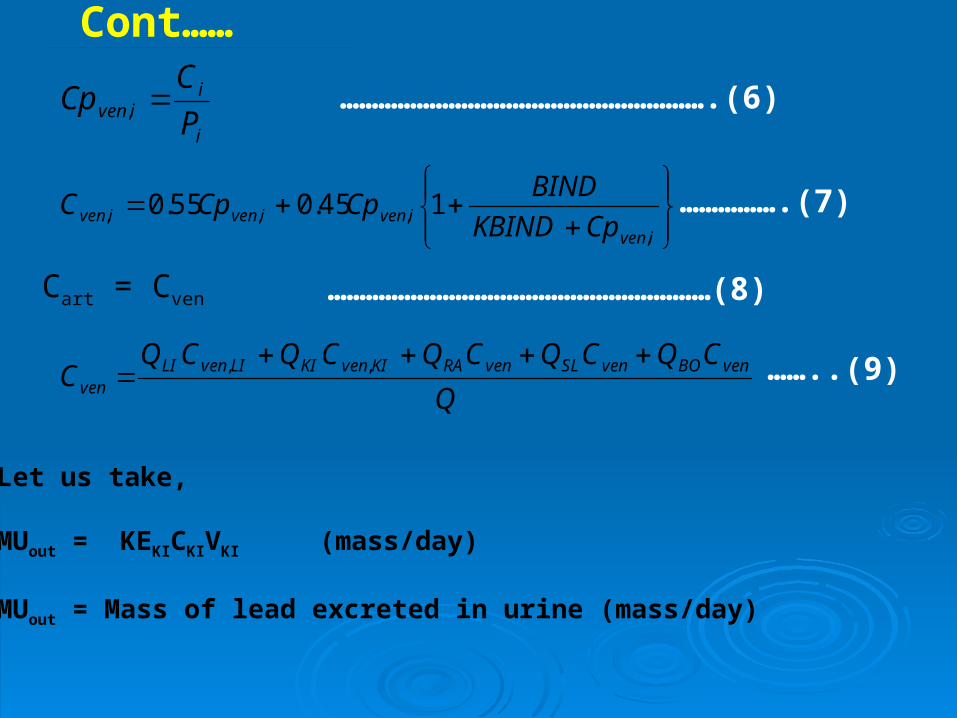
Let us take,
MUout = KEKICKIVKI (mass/day)
MUout = Mass of lead excreted in urine (mass/day)
Cont……
………………………………………………….(6)
…………….(7)
……..(9)
……………………………………………………(8)
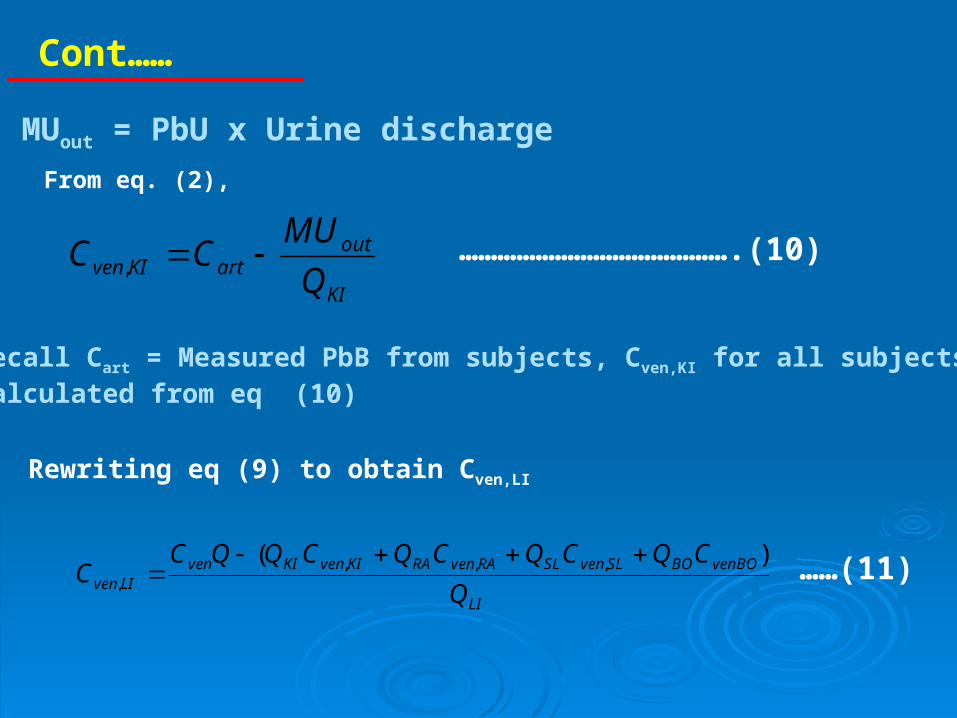
MUout = PbU x Urine discharge
From eq. (2),
KI
outartKIven Q
MUCC ,
Recall Cart = Measured PbB from subjects, Cven,KI for all subjects calculated from eq (10)
…………………………………….(10)
Rewriting eq (9) to obtain Cven,LI
LI
venBOBOSLvenSLRAvenRAKIvenKIvenLIven Q
CQCQCQCQQCC
)( ,,,,
……(11)
Cont……
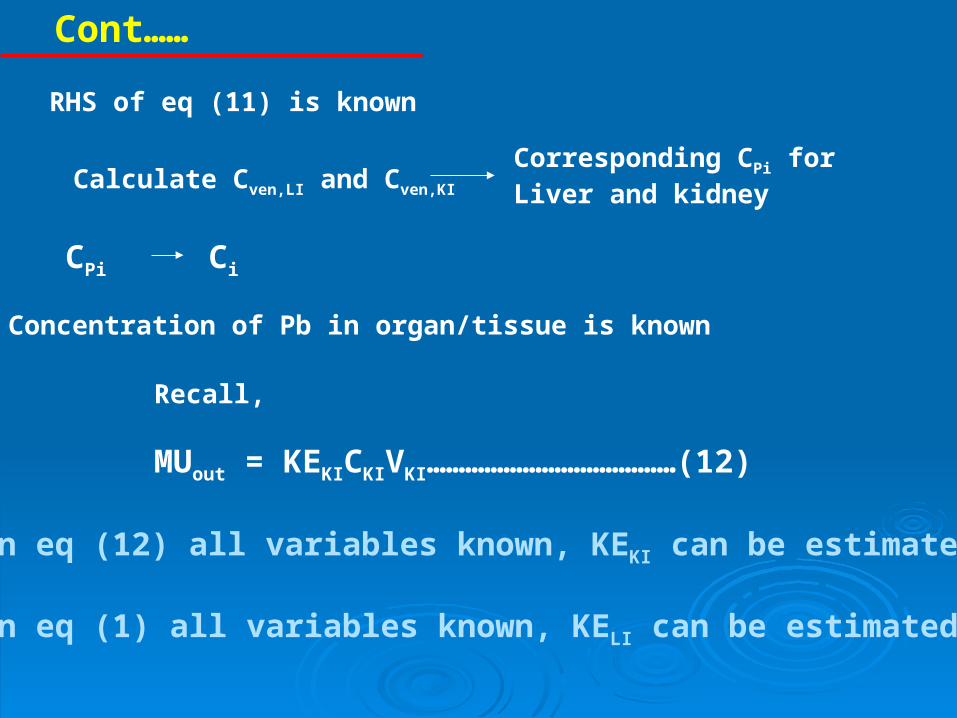
RHS of eq (11) is known
Calculate Cven,LI and Cven,KI
Corresponding CPi forLiver and kidney
CPi Ci
Concentration of Pb in organ/tissue is known
Recall,
MUout = KEKICKIVKI…………………………………(12)
In eq (12) all variables known, KEKI can be estimated
In eq (1) all variables known, KELI can be estimated
Cont……

Variation In KE_LI Value
0
0.05
0.1
0.15
0.2
0.25
0.3
0 5 10 15 20 25 30 35 40
Subject
KE
_LI
(1/d
ay)
KE_LI (1/ day)
Frequency
0.240.210.180.150.120.09
40
30
20
10
0
Mean 0.1602StDev 0.03225N 300
Normal Probability Distribution Plot for KE_LI
KE_LI
Perc
ent
0.250.200.150.100.05
99
95
90
80
70
605040
30
20
10
5
1
Mean
0.140
0.1585StDev 0.03372N 35KS 0.129P-Value
Probability Plot of KE_LINormal
KELI
Mean = 0.16SD = 0.03

Variation in KE_KI Value
00.10.20.30.40.50.60.70.80.9
0 5 10 15 20 25 30 35 40
Subject
KE
_KI
(1/d
ay)
KE_KI (1/ day)
Frequency
0.90.80.70.60.50.40.3
60
50
40
30
20
10
0
Mean 0.6643StDev 0.1095N 300
Normal Prbability Distribution Plot for KE_KI
KE_KI
Perc
ent
1.00.90.80.70.60.50.4
99
95
90
80
70
605040
30
20
10
5
1
Mean
>0.150
0.6554StDev 0.1117N 35KS 0.106P-Value
Probability Plot of KE_KINormal
KEKI
Mean = 0.66SD = 0.11
Conclusion: Metabolic parameters (KELI and KEKI) show substantial variation and one should take these parameters as random variables in model to fully reflect the uncertainties caused due to variability in KELI and KEKI

Group Philadelphia Cab-
drivers
StarkeFL
BarksdaleWI
Los AngelesCab-drivers
Los AnglesOffice workers
Present Study
PbA (μg/m3) 2.62 0.81 1.01 6.10 3.06 0.28
PbB (μg/dl) 21.6 15 12.9 23.7 18.9 8.23
PbU(μg/day) 22.7 15.2 18.2 26.4 20 8.37
RenalClearance
(kg/day)
0.104 0.095 0.135 0.11 0.103 0.101±
0.015
Lead in air, blood and urine (Azar et al., 1975)
Conclusions: Average value of clearance is close to the value reported in other studies through renal clearance. This study additionally provides information on associated uncertainties in renal clearance.
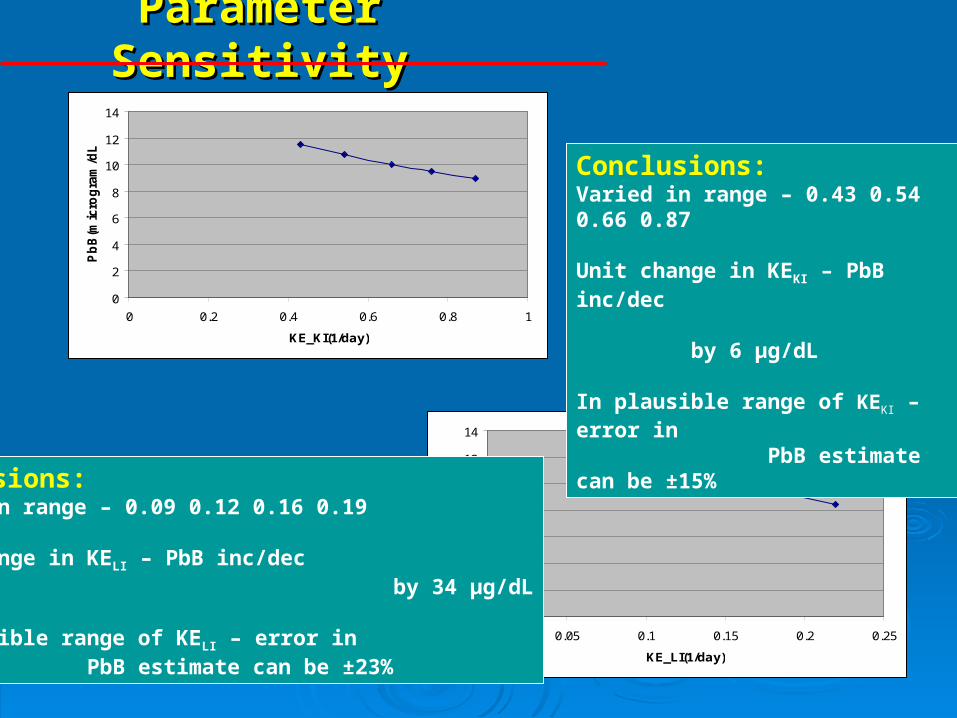
Parameter SensitivityParameter Sensitivity
0
2
4
6
8
10
12
14
0 0.2 0.4 0.6 0.8 1
KE_KI(1/day)
Pb
B(m
icro
gra
m/d
L)
0
2
4
6
8
10
12
14
0 0.05 0.1 0.15 0.2 0.25
KE_LI(1/day)
Pb
B(m
icro
gra
m/d
L)
Conclusions:Varied in range – 0.43 0.54 0.66 0.87
Unit change in KEKI – PbB inc/dec by 6 µg/dL
In plausible range of KEKI – error in PbB estimate can be ±15%
Conclusions:Varied in range – 0.09 0.12 0.16 0.19
Unit change in KELI – PbB inc/dec by 34 µg/dL
In plausible range of KELI – error in PbB estimate can be ±23%

Probabilistic Risk Characterization: ImprovementsProbabilistic Risk Characterization: Improvements
=
PbBParameters (KELI, KEKI)
(fixed)
Food Intake (variable)
Pb Concentration
in Food (Variable)
=
PbB
Parameters (KELI, KEKI)
(fixed)
Food Intake (fixed)
Pb Concentration in Food (Variable)
=
PbBParameters (KELI, KEKI) (variable)
Food Intake (variable)
Pb Concentration in Food (Variable)
Case1: Variability only in Pb concentration in food intake
Case2: Variability in food consumption and concentration
Case3: Variability in food consumption, concentration and parameters (KELI, KEKI)

PbB (microgram/ dL)
Fre
qu
en
cy
121086420
18
16
14
12
10
8
6
4
2
0
Mean
5.043 1.432 100
StDev N4.580 1.161 1004.856 1.367 100
VariableCase1Case2Case3
Normal Probability Distribution Plot Case1, Case2, Case3
8.9x10⁻⁵
5.4x10⁻⁴
9.3x10⁻³
Case 1
Case 2
Case 3
Risk Estimation
Conclusions:The results suggest that by not considering the uncertainties, the error in risk characterization will be underestimated and risk engineers will err on side of false protection.Therefore it is important to address/include the uncertainties in risk Characterization.
8.9x10⁻⁵
Case 1
Case 2
ConclusionsConclusions
The PBPK model parameters (food intake, Pb The PBPK model parameters (food intake, Pb concentration food items, KEconcentration food items, KEKIKI and KE and KELILI) vary from person ) vary from person to person to a large extent and thus they should be to person to a large extent and thus they should be considered as random variables. considered as random variables.
Parameter values (KEParameter values (KEKIKI and KE and KELILI) were found sensitive to ) were found sensitive to model output (PbB). In the plausible range of KEmodel output (PbB). In the plausible range of KEKIKI and and KEKELILI, the error in PbB estimates can be ±15% and ±23% , the error in PbB estimates can be ±15% and ±23% respectively.respectively.
Overall risk characterization was done by considering Overall risk characterization was done by considering these parameters as variables.these parameters as variables.

ConclusionsConclusions
The results suggest that by not considering the The results suggest that by not considering the uncertainties, the error in risk characterization will be uncertainties, the error in risk characterization will be underestimated as given below:underestimated as given below:
Variability only in Pb concentration in food Variability only in Pb concentration in food
intakeintake 8.98 x 108.98 x 10-5-5
Variability in food consumption and Variability in food consumption and concentration concentration
5.43 x 105.43 x 10-4 -4
Variability in food consumption, Variability in food consumption, concentration and parameters (KEconcentration and parameters (KEKI KI and and
KEKELILI) )
9.34 x 109.34 x 10-3-3
ConclusionsConclusions
It can be concluded that by not considering the uncertainties, the error in risk characterization will be underestimated. While wishing to remain conservative in the quantification of risk to err on the side of protection of humans and the environment, an underestimated uncertainty (e.g., food intake, Pb concentration food items, KELI and KEKI) may eclipse safety and may result in a false sense of protection.