dr. frank alvarez superintendent of schools dr. … · dr. frank alvarez superintendent of schools...
TRANSCRIPT
Dr. Frank Alvarez
Superintendent of Schools
Dr. Lydia Furnari
Supervisor of Curriculum
Montclair Public Schools
November 2010
10/19/2010 Department of Instruction 1

- 1 -
Telephone: 973.509.4000 ~ Fax: 973.509.0586 ~ Email: [email protected]
MONTCLAIR PUBLIC SCHOOLS
OFFICE OF THE SUPERINTENDENT 2 2 V A L L E Y R O A D ~ M O N T C L A I R , N E W J E R S E Y 0 7 0 4 2
W W W . M O N T C L A I R . K 1 2 . N J . U S
FRANK R. ALVAREZ, ED.D. Superintendent of Schools
November 1, 2010
Dear Community Member:
The Montclair Public Schools’ Academic Achievement Report is published annually to
provide all stakeholders with data related to the attainment of identified academic goals.
The report is presented to the Montclair Board of Education each fall in an effort to
provide insight into district and school level outcomes on benchmark measures required
by the New Jersey Department of Education and used to measure each district’s overall
quality and improvement.
The data contained in the Academic Achievement Report 2010 includes historic as well
as current assessment results for NJASK 3-8, HSPA, and other benchmark measures in
the form of comparative charts and graphs for both the district and each individual
school. The data presentation is preceded by an informative Executive Summary.
Information contained in the presentation made to the Montclair Board of Education, as
well as the Academic Achievement Report 2010 in its entirety, will be posted on the
Montclair Public Schools website in early November.
Sincerely,
Frank Alvarez
Superintendent
FA:nad

Montclair Public SchoolsNovember 2010
11/1/2010 Department of Instruction 1

Goal 1: To improve academic achievement for all students through the use of differentiated instruction and performance assessment to address diverse learning needs.
Goal 2: To continue to achieve equality and improve efficiency in all programs and services in an effort to serve all students more effectively.
Goal 3: To promote community engagement in examining implications and needs related to emerging educational issues.
11/1/2010 Department of Instruction 2

Review data to identify gaps in achievement levels.
Provide training for teachers in the differentiation of instruction, use of research-based materials, and foster a deeper understanding of the content to be taught.
Monitor the quality of instruction provided to students.
11/1/2010 Department of Instruction 3

As a whole, the achievement gap is more narrow than it once was.
Although it has lessened, a gap still persists between our “general population” and some sub-groups.
There is opportunity for a deeper level of improvement for all students, and a continued reduction in the gap between levels of student academic achievement.
11/1/2010 Department of Instruction 4
87% 87% 87% 87% 87%
79%82% 81% 80%
78%
83% 83%
89%91%
93% 92% 91% 92% 92%
97% 97% 98%
35%37%
30%
40%37%
43%
52%
57%
62%
47% 48% 48%
60%
69% 68%
78%
87%87%85%
83%81%
88%87%91%
41%
49%46%
10%
20%
30%
40%
50%
60%
70%
80%
90%
100%
2001 GEPA
LAL
2002 GEPA
LAL
2003 GEPA
LAL
2004 GEPA
LAL
2005 GEPA
LAL
2006 GEPA
LAL
2007 GEPA
LAL
2008
NJASK8 LAL
2009
NJASK8 LAL
2010
NJASK8 LAL
Pro
ficie
nt
+ A
dvan
ced
Pro
ficie
nt
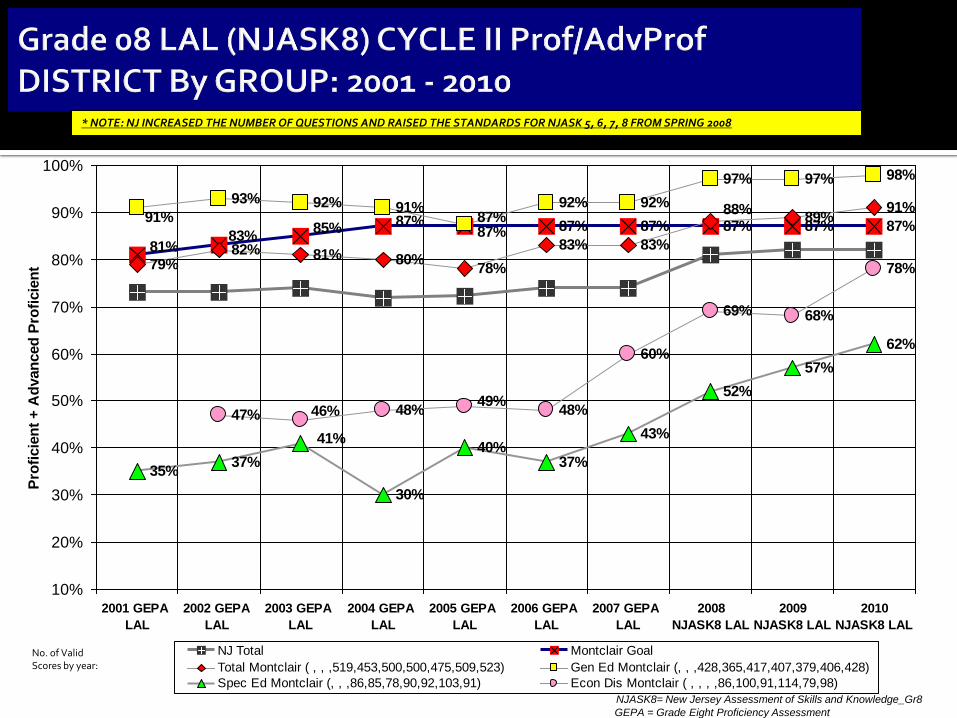
NJ Total Montclair Goal
Total Montclair ( , , ,519,453,500,500,475,509,523) Gen Ed Montclair (, , ,428,365,417,407,379,406,428)
Spec Ed Montclair (, , ,86,85,78,90,92,103,91) Econ Dis Montclair ( , , , ,86,100,91,114,79,98)
GEPA = Grade Eight Proficiency Assessment
* NOTE: NJ INCREASED THE NUMBER OF QUESTIONS AND RAISED THE STANDARDS FOR NJASK 5, 6, 7, 8 FROM SPRING 2008
NJASK8= New Jersey Assessment of Skills and Knowledge_Gr8
No. of Valid Scores by year:
73% 74%72% 72%
74% 74%
81% 82%83%
87% 87% 87% 87% 87% 87%
97% 96% 97%100%
67%69%
78%76%
95%
83%85%
71%
81%
92%
87%
79%
100%97%
93% 94%
100%
93%
85%
87%
94%96%96%
92%
95%
81%
61%
64%64%
67%
89%
75%
90%
100%
10%
20%
30%
40%
50%
60%
70%
80%
90%
100%
2002 GEPA
LAL
2003 GEPA
LAL
2004 GEPA
LAL
2005 GEPA
LAL
2006 GEPA
LAL
2007 GEPA
LAL
2008 NJASK8
LAL
2009 NJASK8
LAL
2010 NJASK8
LAL
Pro
fic
ien
t +
Ad
va
nc
ed
Pro
fic
ien
t
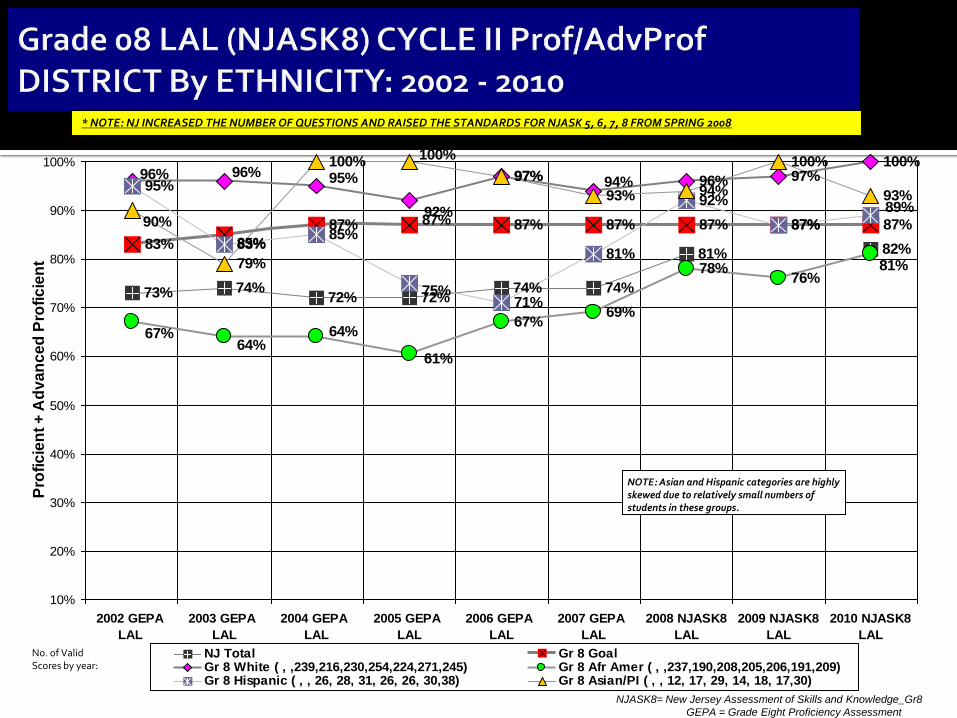
NJ Total Gr 8 GoalGr 8 White ( , ,239,216,230,254,224,271,245) Gr 8 Afr Amer ( , ,237,190,208,205,206,191,209)Gr 8 Hispanic ( , , 26, 28, 31, 26, 26, 30,38) Gr 8 Asian/PI ( , , 12, 17, 29, 14, 18, 17,30)
* NOTE: NJ INCREASED THE NUMBER OF QUESTIONS AND RAISED THE STANDARDS FOR NJASK 5, 6, 7, 8 FROM SPRING 2008
GEPA = Grade Eight Proficiency Assessment
NJASK8= New Jersey Assessment of Skills and Knowledge_Gr8
No. of Valid Scores by year:
NOTE: Asian and Hispanic categories are highly skewed due to relatively small numbers of students in these groups.
95% 95%
97% 97%
99%
96% 96%
98%99%
98%99%
100% 100%99% 99%
100%
71%
69%
78%79%
80%79%
77% 77%78%
86%
90%
92%93%
90%
94% 94%
96%
85%
88%
90%91%
90%91% 91%
93%
95%
95%
87%
87%
60%
70%
80%
90%
100%
2002
HSPA LAL
2003
HSPA LAL
2004
HSPA LAL
2005
HSPA LAL
2006
HSPA LAL
2007
HSPA LAL
2008
HSPA LAL
2009
HSPA LAL
2010
HSPA LAL
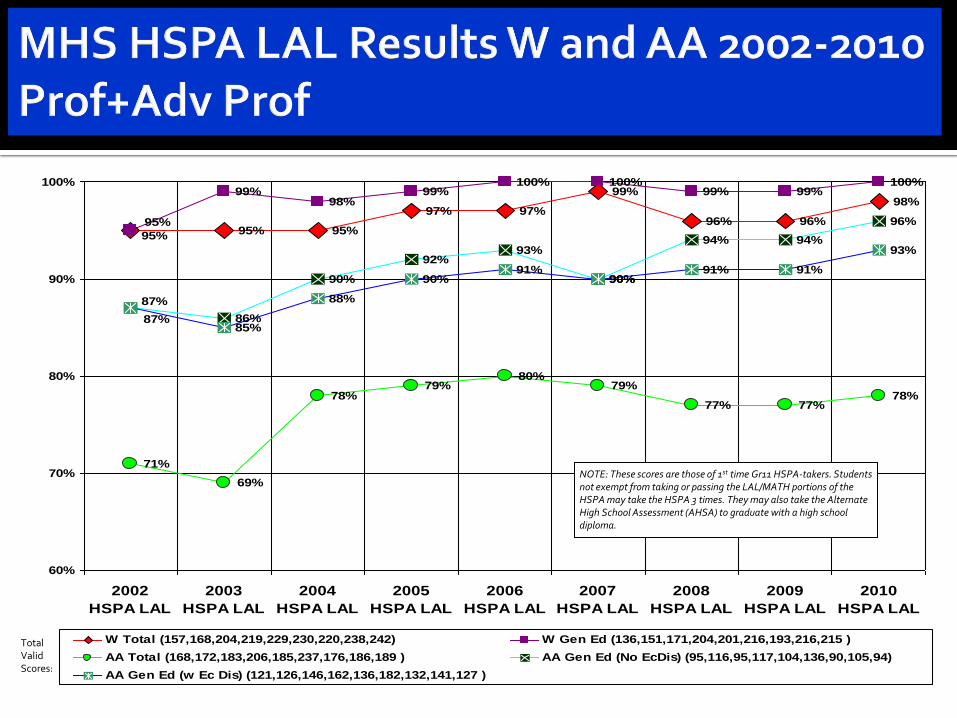
W Total (157,168,204,219,229,230,220,238,242) W Gen Ed (136,151,171,204,201,216,193,216,215 )
AA Total (168,172,183,206,185,237,176,186,189 ) AA Gen Ed (No EcDis) (95,116,95,117,104,136,90,105,94)
AA Gen Ed (w Ec Dis) (121,126,146,162,136,182,132,141,127 )
NOTE: These scores are those of 1st time Gr11 HSPA-takers. Students not exempt from taking or passing the LAL/MATH portions of the HSPA may take the HSPA 3 times. They may also take the Alternate High School Assessment (AHSA) to graduate with a high school diploma.
Total Valid Scores:

NJDOE uses 40 indicators to determine Adequate Yearly Progress (AYP) Percentage of students who take the NJASK 3-8,
HSPA;
Percentage “Proficient” and “Advanced Proficient” in Language Arts and Mathematics;
Demographic Groups▪ Ethnicity
▪ Economic Disadvantage
▪ Special Needs
11/1/2010 Department of Instruction 8

District Factor Grouping (DFG): This designation is used to compare demographically similar school districts (including socio-economics).
Comparison of levels of student achievement between our students and students in other districts where demographics are similar to those of Montclair (DFG “I”).
11/1/2010 Department of Instruction 9

NJASK 4 Language Arts Literacy
11/1/2010 Department of Instruction 10
Grade 4 LAL
DFG “I” Mean
Montclair NJ
Total 218 216 204
General 223 220 210
Sp Ed 193 186 179
Ec Dis 195 190 188
W 218 226 211
AA 201 201 187
A 228 226 221
H 204 208 190
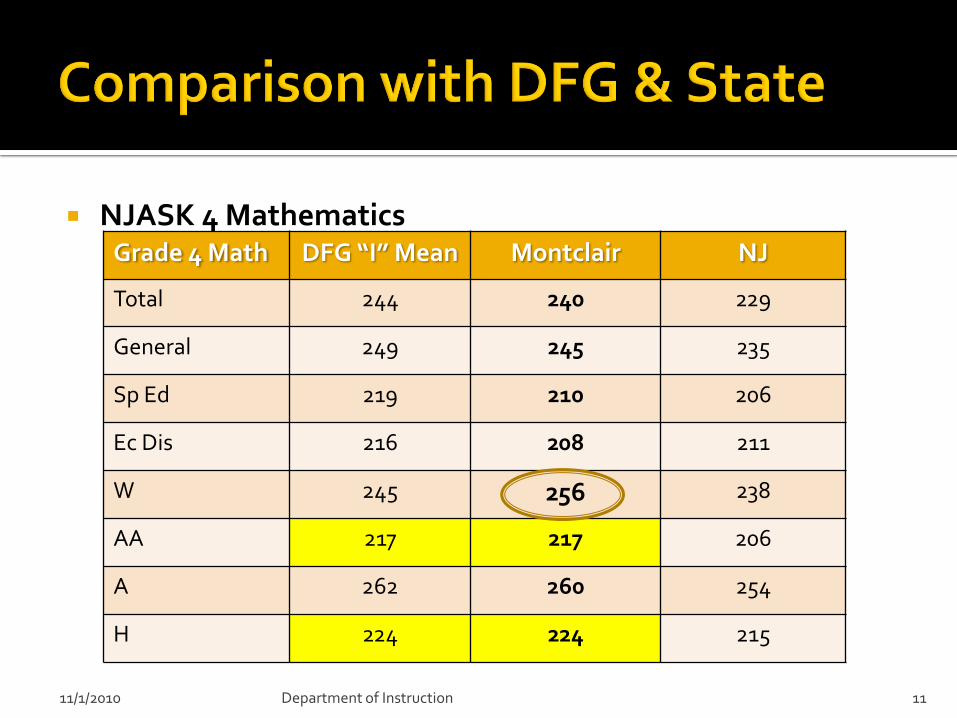
NJASK 4 Mathematics
11/1/2010 Department of Instruction 11
Grade 4 Math DFG “I” Mean Montclair NJ
Total 244 240 229
General 249 245 235
Sp Ed 219 210 206
Ec Dis 216 208 211
W 245 256 238
AA 217 217 206
A 262 260 254
H 224 224 215
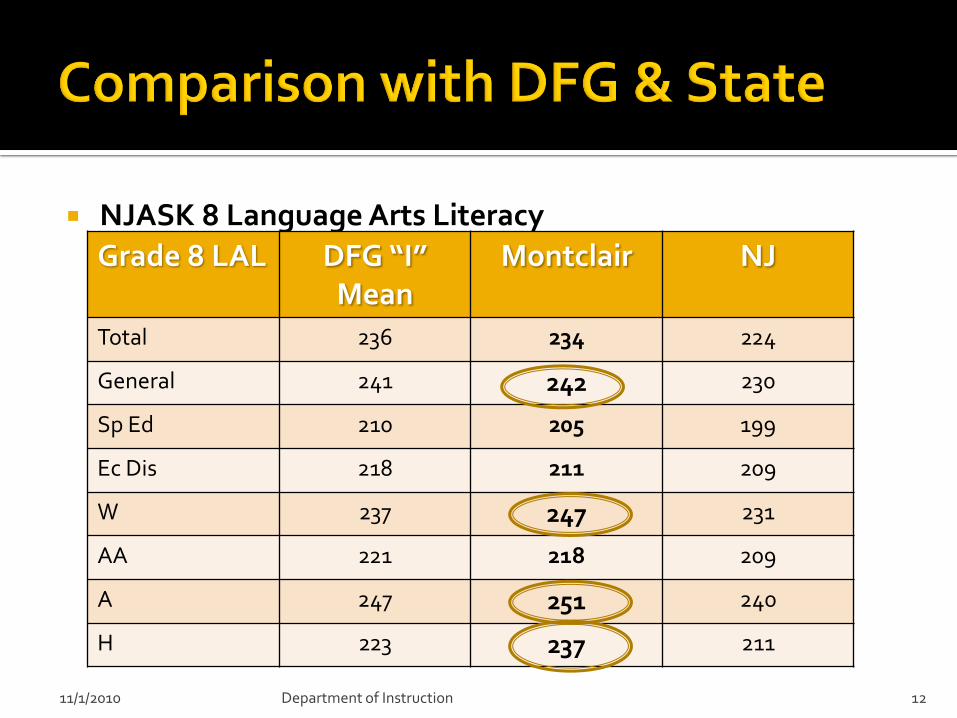
NJASK 8 Language Arts Literacy
11/1/2010 Department of Instruction 12
Grade 8 LAL DFG “I” Mean
Montclair NJ
Total 236 234 224
General 241 242 230
Sp Ed 210 205 199
Ec Dis 218 211 209
W 237 247 231
AA 221 218 209
A 247 251 240
H 223 237 211

NJASK 8 Mathematics
11/1/2010 Department of Instruction 13
Grade 8 Math
DFG “I” Mean
Montclair NJ
Total 239 229 220
General 246 239 229
Sp Ed 192 183 178
Ec Dis 205 191 198
W 239 252 230
AA 205 200 191
A 264 252 253
H 215 219 202

HSPA Grade 11 Language Arts Literacy
11/1/2010 Department of Instruction 14
Grade 11 LAL
DFG “I” Mean
Montclair NJ
Total 240 233 227
General 244 242 234
Sp Ed 217 197 198
Ec Dis 221 207 211
W 242 246 234
AA 224 216 210
A 246 237 239
H 228 235 214
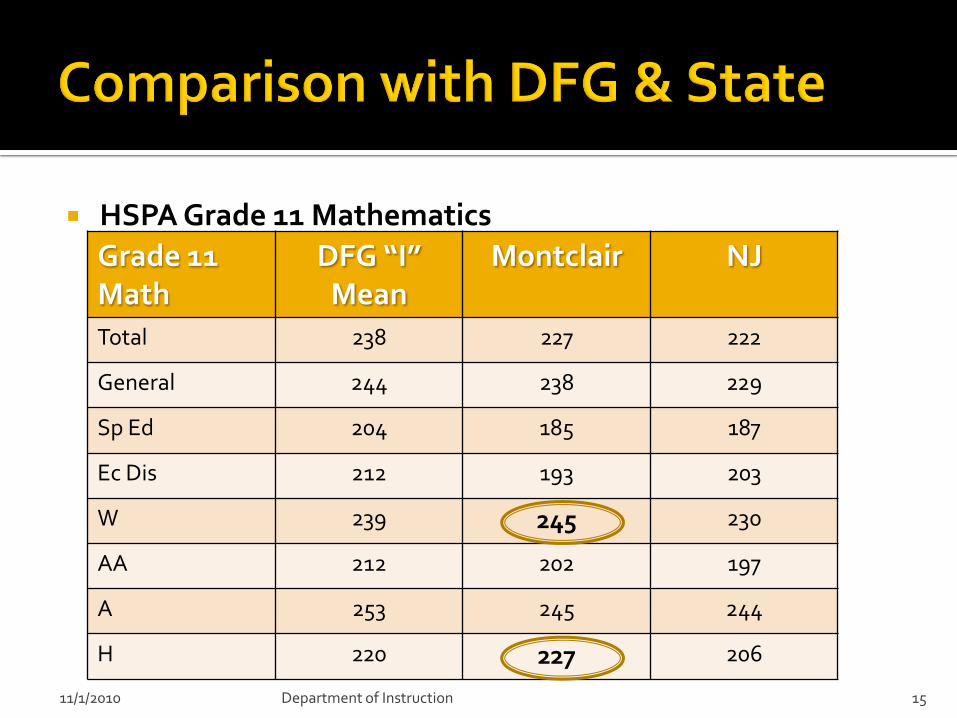
HSPA Grade 11 Mathematics
11/1/2010 Department of Instruction 15
Grade 11Math
DFG “I” Mean
Montclair NJ
Total 238 227 222
General 244 238 229
Sp Ed 204 185 187
Ec Dis 212 193 203
W 239 245 230
AA 212 202 197
A 253 245 244
H 220 227 206

Look for “Bright Spots” in the data. Analyze data to determine what contributed
to the attainment of these bright spots. Replicate successful strategies where
appropriate. Replace ineffective strategies with those
proven to be successful.
11/1/2010 Department of Instruction 16
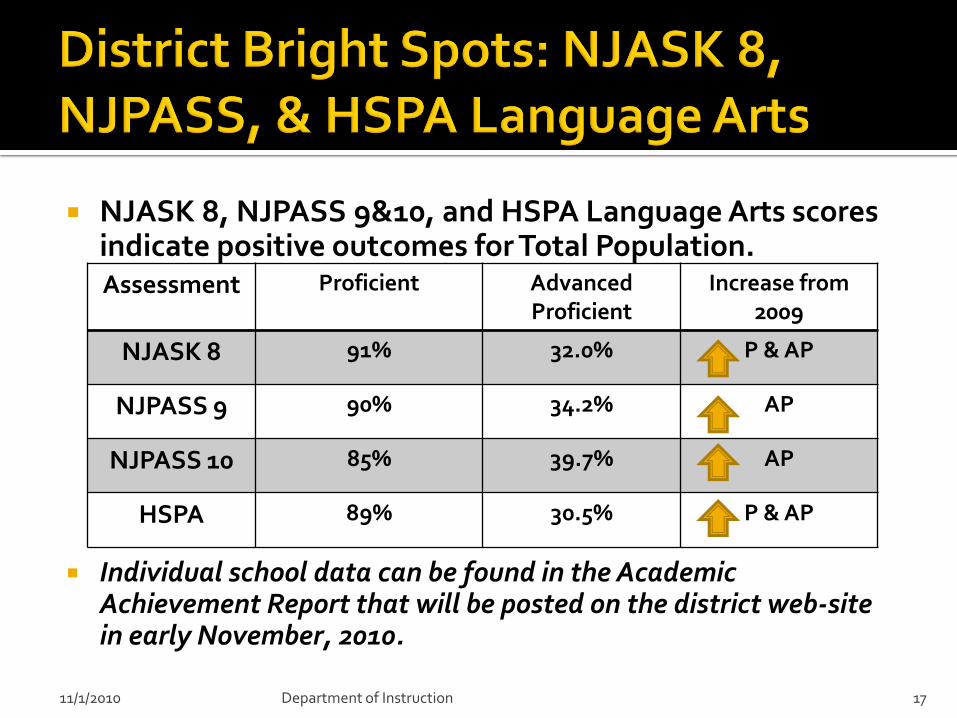
NJASK 8, NJPASS 9&10, and HSPA Language Arts scores indicate positive outcomes for Total Population.
Individual school data can be found in the Academic Achievement Report that will be posted on the district web-site in early November, 2010.
11/1/2010 Department of Instruction 17
Assessment Proficient Advanced Proficient
Increase from 2009
NJASK 8 91% 32.0% P & AP
NJPASS 9 90% 34.2% AP
NJPASS 10 85% 39.7% AP
HSPA 89% 30.5% P & AP
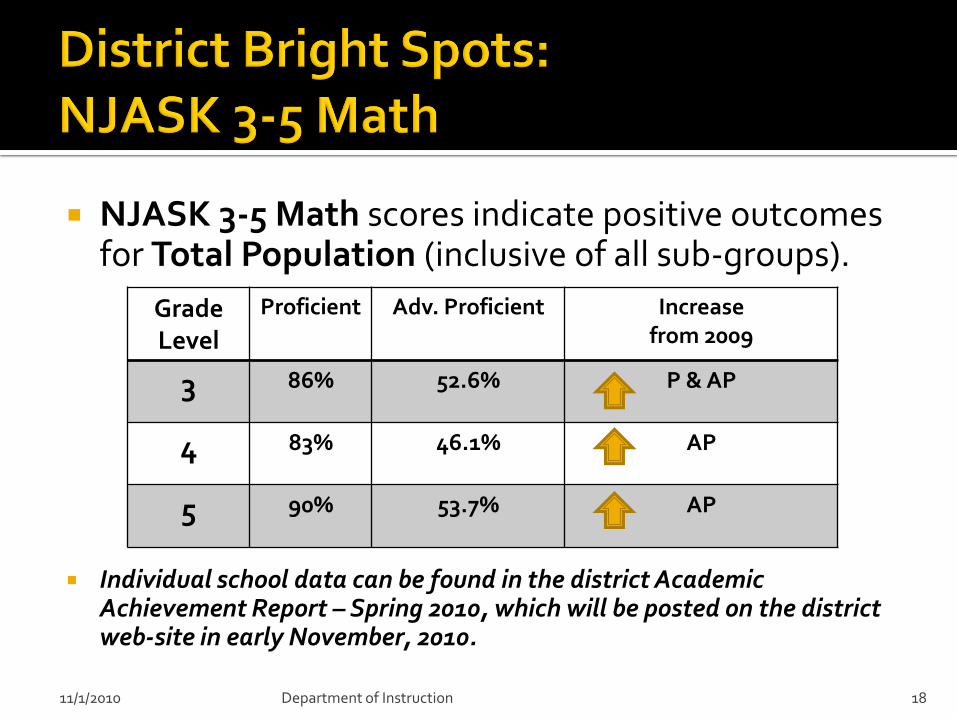
NJASK 3-5 Math scores indicate positive outcomes for Total Population (inclusive of all sub-groups).
Individual school data can be found in the district Academic Achievement Report – Spring 2010, which will be posted on the district web-site in early November, 2010.
11/1/2010 Department of Instruction 18
Grade Level
Proficient Adv. Proficient Increasefrom 2009
3 86% 52.6% P & AP
4 83% 46.1% AP
5 90% 53.7% AP
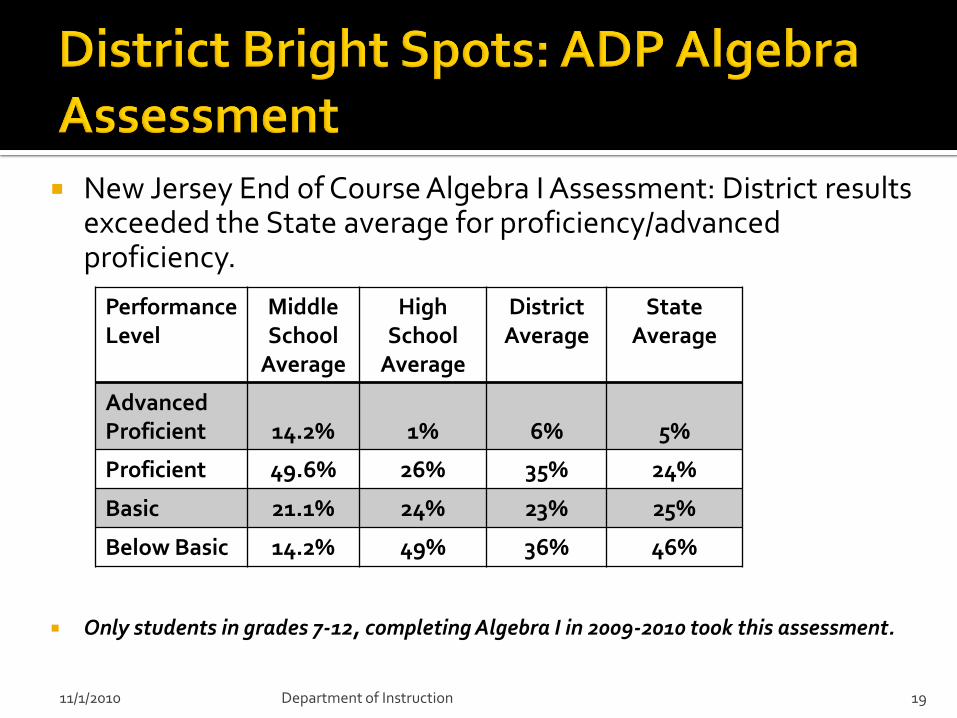
New Jersey End of Course Algebra I Assessment: District results exceeded the State average for proficiency/advanced proficiency.
Only students in grades 7-12, completing Algebra I in 2009-2010 took this assessment.
11/1/2010 Department of Instruction 19
Performance Level
Middle School
Average
High School
Average
District Average
State Average
Advanced Proficient 14.2% 1% 6% 5%
Proficient 49.6% 26% 35% 24%
Basic 21.1% 24% 23% 25%
Below Basic 14.2% 49% 36% 46%
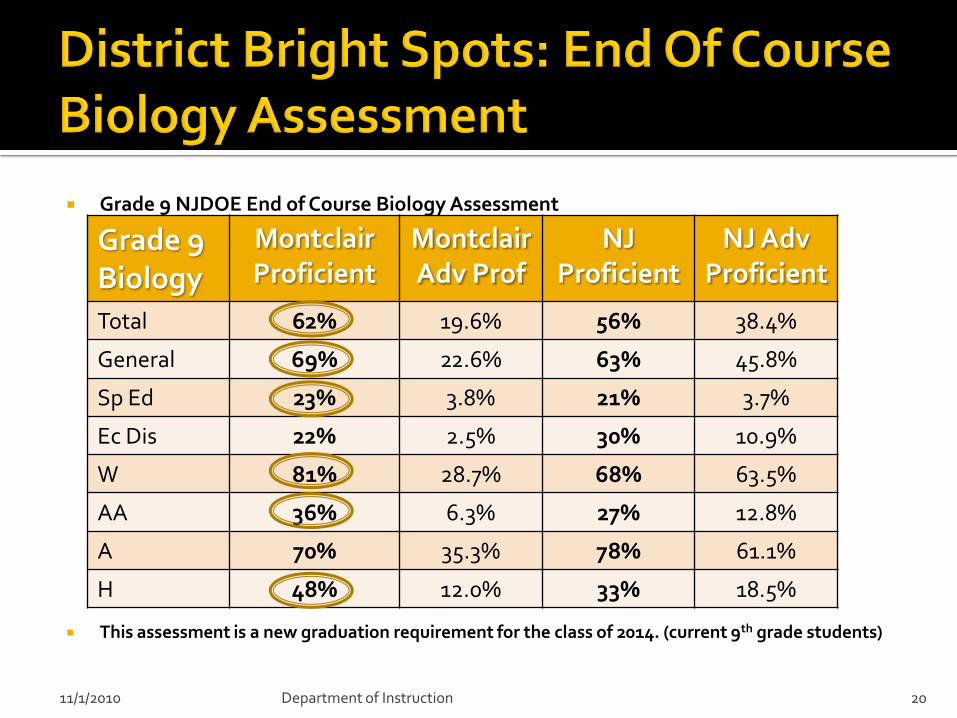
Grade 9 NJDOE End of Course Biology Assessment
This assessment is a new graduation requirement for the class of 2014. (current 9th grade students)
11/1/2010 Department of Instruction 20
Grade 9Biology
MontclairProficient
MontclairAdv Prof
NJProficient
NJ AdvProficient
Total 62% 19.6% 56% 38.4%
General 69% 22.6% 63% 45.8%
Sp Ed 23% 3.8% 21% 3.7%
Ec Dis 22% 2.5% 30% 10.9%
W 81% 28.7% 68% 63.5%
AA 36% 6.3% 27% 12.8%
A 70% 35.3% 78% 61.1%
H 48% 12.0% 33% 18.5%
NJDOE compares like grade level data to calculate AYP. {Different Students}
District Cohort Data
Student academic growth from year to year. {Same Students}
11/1/2010 Department of Instruction 21

11/1/2010 Department of Instruction 22
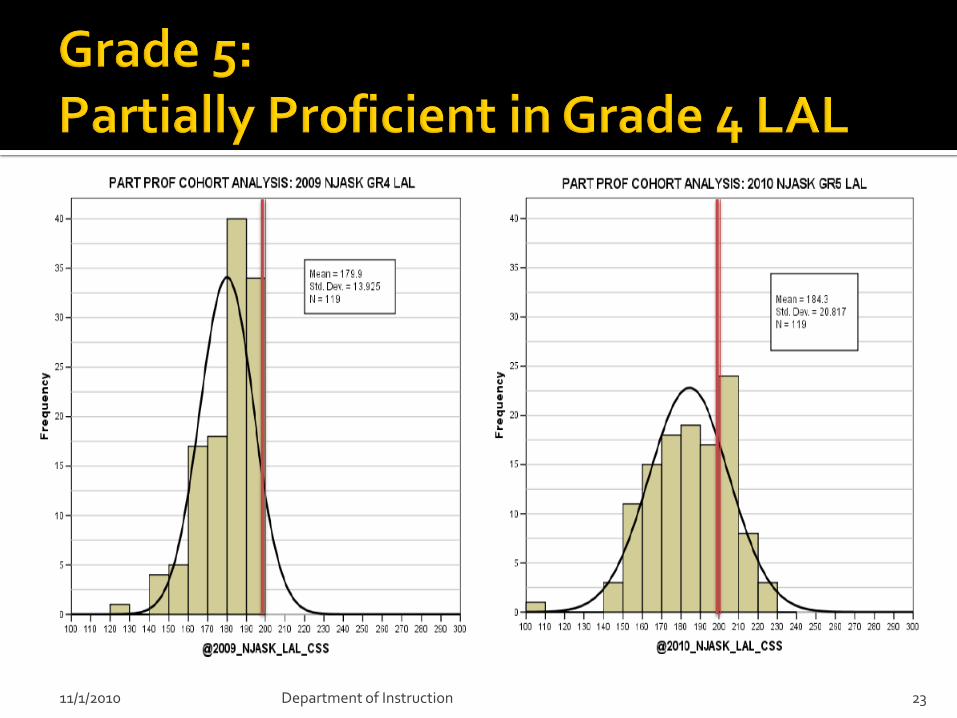
11/1/2010 Department of Instruction 23
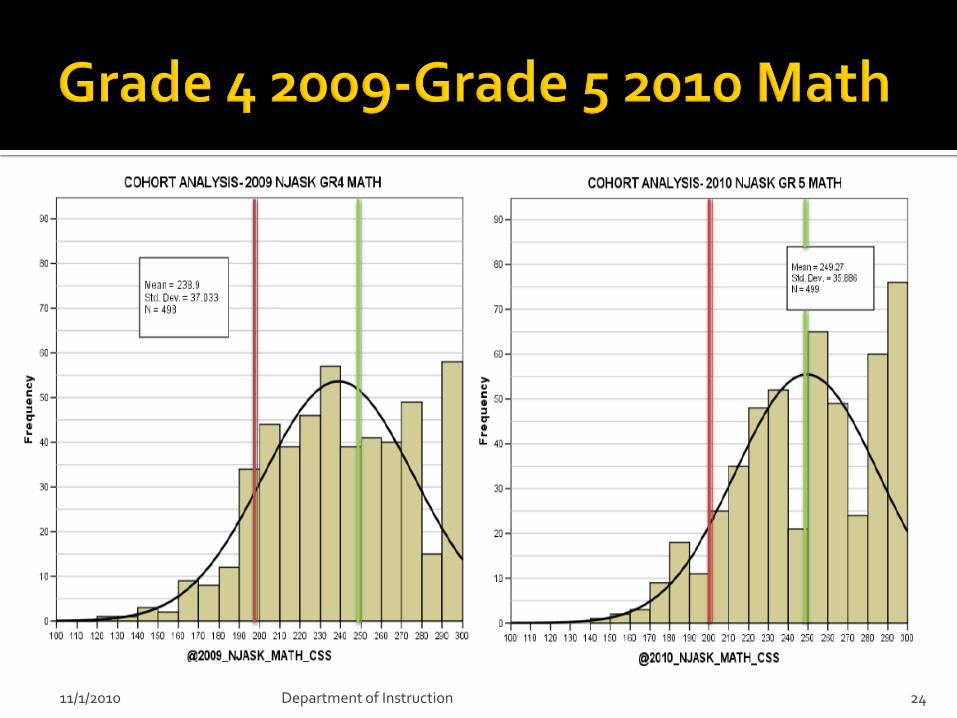
11/1/2010 Department of Instruction 24
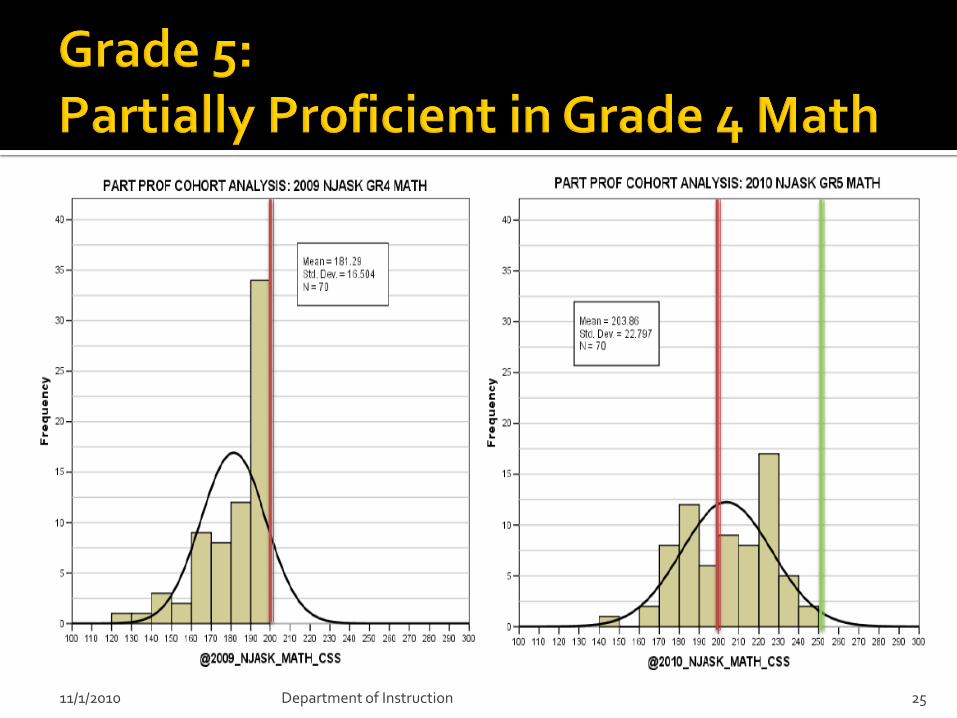
11/1/2010 Department of Instruction 25

11/1/2010 Department of Instruction 26
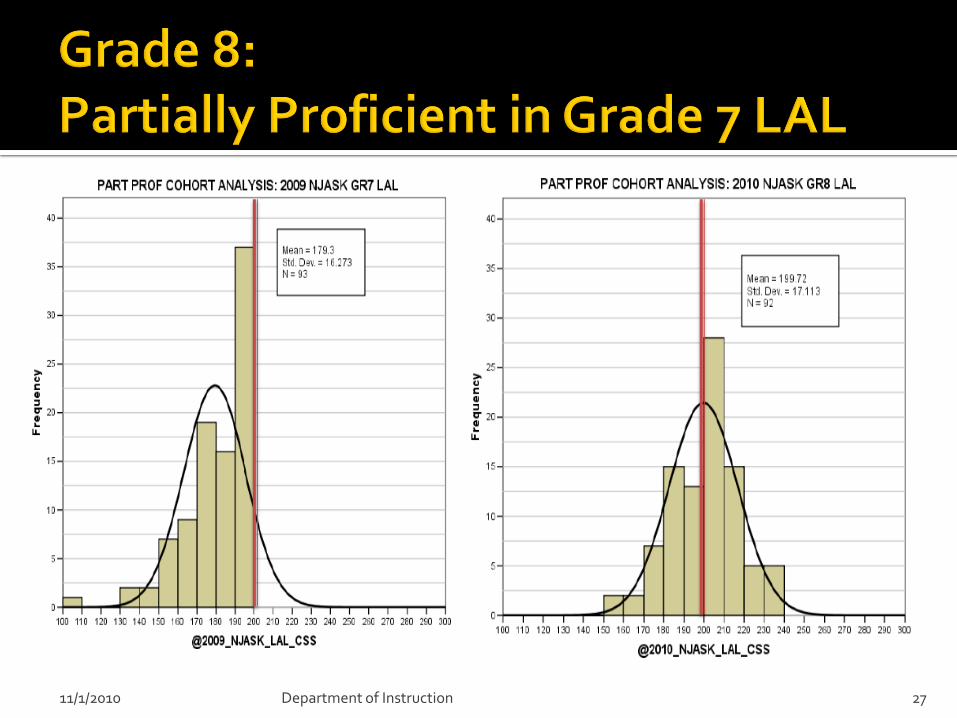
11/1/2010 Department of Instruction 27

11/1/2010 Department of Instruction 28

11/1/2010 Department of Instruction 29
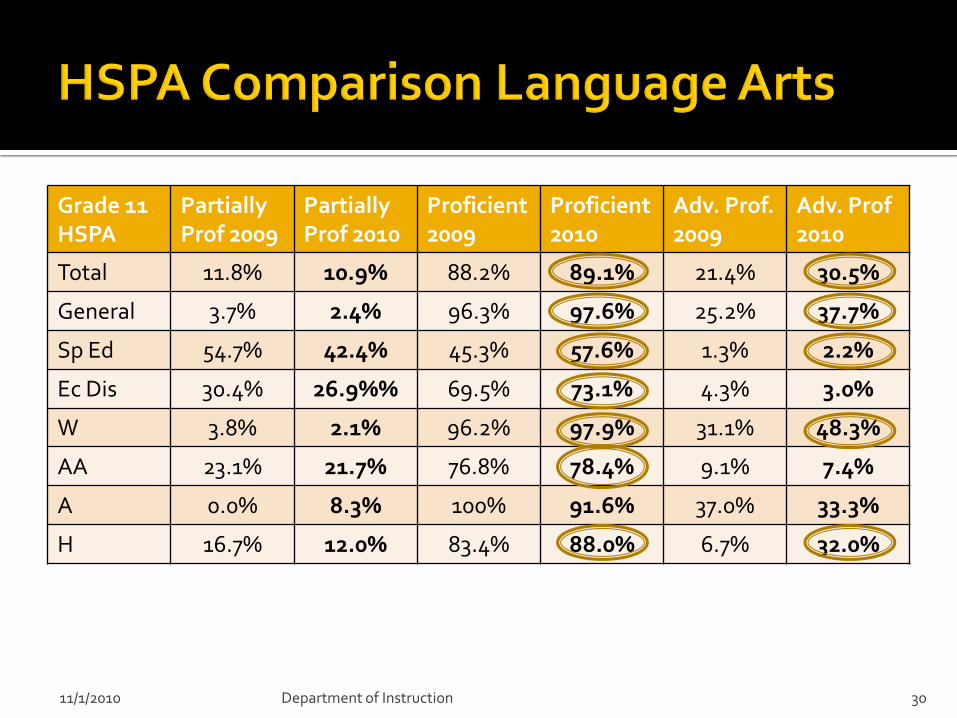
Grade 11 HSPA
Partially Prof 2009
Partially Prof 2010
Proficient 2009
Proficient2010
Adv. Prof.2009
Adv. Prof 2010
Total 11.8% 10.9% 88.2% 89.1% 21.4% 30.5%
General 3.7% 2.4% 96.3% 97.6% 25.2% 37.7%
Sp Ed 54.7% 42.4% 45.3% 57.6% 1.3% 2.2%
Ec Dis 30.4% 26.9%% 69.5% 73.1% 4.3% 3.0%
W 3.8% 2.1% 96.2% 97.9% 31.1% 48.3%
AA 23.1% 21.7% 76.8% 78.4% 9.1% 7.4%
A 0.0% 8.3% 100% 91.6% 37.0% 33.3%
H 16.7% 12.0% 83.4% 88.0% 6.7% 32.0%
11/1/2010 Department of Instruction 30

Grade 11 HSPA
Partially Prof 2009
Partially Prof 2010
Proficient 2009
Proficient2010
Adv. Prof.2009
Adv. Prof 2010
Total 20.3% 23.0% 79.7% 76.9% 30.1% 34.3%
General 10.2% 10.4% 89.8% 89.6% 34.5% 41.9%
Sp Ed 75.3% 72.5% 24.6% 27.5% 6.8% 4.4%
Ec Dis 46.4% 63.6% 53.6% 36.4% 1.4% 6.1%
W 7.6% 5.3% 92.4% 94.6% 46.8% 54.7%
AA 36.6% 47.3% 63.4% 52.6% 7.7% 8.5%
A 3.7% 8.3% 96.3% 91.7% 51.9% 50.0%
H 36.7% 16.0% 63.4% 84.0% 16.7% 24.0%
11/1/2010 Department of Instruction 31
NJDOE Educational Proficiency Plans for any student who does not achieve proficiency in any area of the NJASK 8 or HSPA. (September 2010)
EPPs intended to document interventions and supports provided to students as they strive to earn a high school diploma.
All MHS students (other than those exempt from passing the HSPA) attained proficiency as measured by HSPA, or AHSA by the end of the 2009-2010 school year.
11/1/2010 Department of Instruction 32

1999 2010
GRADS 338 459
ATTENDING COLLEGE:
W 124 86% 207 94%
AA 118 69% 160 85%
H 8 66% 21 77%
A 11 100% 21 100%
Total 261 77% 409 89%
This data set tells a story; provides threads in a tapestry of learning.
As educators, we strive never to forget that the data represents the levels to which each child demonstrates attainment of skills and knowledge.
While this is in no way the whole story, The Montclair Public Schools know that it is critical that we do not lose sight of the learning outcomes for one single child.
11/1/2010 Department of Instruction 34

Department of Instruction
10/21/2010
1
MONTCLAIR PUBLIC SCHOOLS
EXECUTIVE SUMMARY
ACADEMIC ACHIEVEMENT REPORT
LANGUAGE ARTS LITERACY
2009-2010
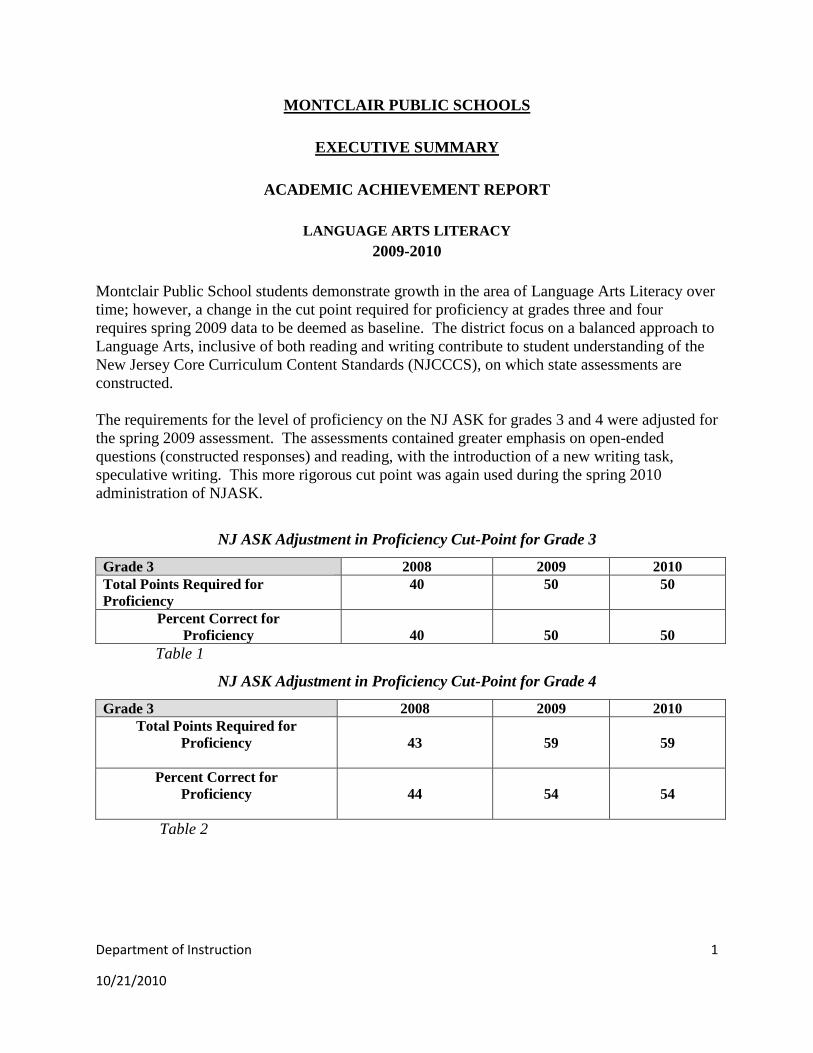
Montclair Public School students demonstrate growth in the area of Language Arts Literacy over
time; however, a change in the cut point required for proficiency at grades three and four
requires spring 2009 data to be deemed as baseline. The district focus on a balanced approach to
Language Arts, inclusive of both reading and writing contribute to student understanding of the
New Jersey Core Curriculum Content Standards (NJCCCS), on which state assessments are
constructed.
The requirements for the level of proficiency on the NJ ASK for grades 3 and 4 were adjusted for
the spring 2009 assessment. The assessments contained greater emphasis on open-ended
questions (constructed responses) and reading, with the introduction of a new writing task,
speculative writing. This more rigorous cut point was again used during the spring 2010
administration of NJASK.
NJ ASK Adjustment in Proficiency Cut-Point for Grade 3
Grade 3 2008 2009 2010
Total Points Required for
Proficiency
40
50
50
Percent Correct for
Proficiency
40
50
50
Table 1
NJ ASK Adjustment in Proficiency Cut-Point for Grade 4
Grade 3 2008 2009 2010
Total Points Required for
Proficiency
43
59
59
Percent Correct for
Proficiency
44
54
54
Table 2
Department of Instruction
10/21/2010
2
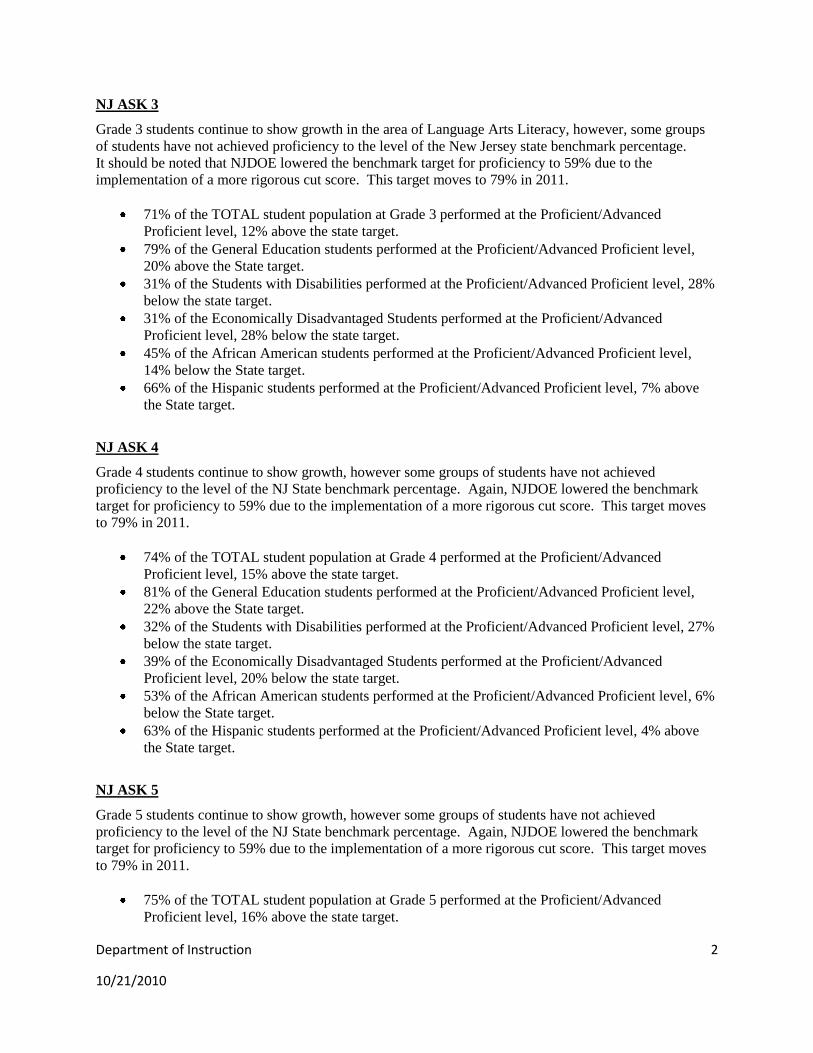
NJ ASK 3
Grade 3 students continue to show growth in the area of Language Arts Literacy, however, some groups
of students have not achieved proficiency to the level of the New Jersey state benchmark percentage.
It should be noted that NJDOE lowered the benchmark target for proficiency to 59% due to the
implementation of a more rigorous cut score. This target moves to 79% in 2011.
71% of the TOTAL student population at Grade 3 performed at the Proficient/Advanced
Proficient level, 12% above the state target.
79% of the General Education students performed at the Proficient/Advanced Proficient level,
20% above the State target.
31% of the Students with Disabilities performed at the Proficient/Advanced Proficient level, 28%
below the state target.
31% of the Economically Disadvantaged Students performed at the Proficient/Advanced
Proficient level, 28% below the state target.
45% of the African American students performed at the Proficient/Advanced Proficient level,
14% below the State target.
66% of the Hispanic students performed at the Proficient/Advanced Proficient level, 7% above
the State target.
NJ ASK 4
Grade 4 students continue to show growth, however some groups of students have not achieved
proficiency to the level of the NJ State benchmark percentage. Again, NJDOE lowered the benchmark
target for proficiency to 59% due to the implementation of a more rigorous cut score. This target moves
to 79% in 2011.
74% of the TOTAL student population at Grade 4 performed at the Proficient/Advanced
Proficient level, 15% above the state target.
81% of the General Education students performed at the Proficient/Advanced Proficient level,
22% above the State target.
32% of the Students with Disabilities performed at the Proficient/Advanced Proficient level, 27%
below the state target.
39% of the Economically Disadvantaged Students performed at the Proficient/Advanced
Proficient level, 20% below the state target.
53% of the African American students performed at the Proficient/Advanced Proficient level, 6%
below the State target.
63% of the Hispanic students performed at the Proficient/Advanced Proficient level, 4% above
the State target.
NJ ASK 5
Grade 5 students continue to show growth, however some groups of students have not achieved
proficiency to the level of the NJ State benchmark percentage. Again, NJDOE lowered the benchmark
target for proficiency to 59% due to the implementation of a more rigorous cut score. This target moves
to 79% in 2011.
75% of the TOTAL student population at Grade 5 performed at the Proficient/Advanced
Proficient level, 16% above the state target.

Department of Instruction
10/21/2010
3
81% of the General Education students performed at the Proficient/Advanced Proficient level,
22% above the State target.
45% of the Students with Disabilities performed at the Proficient/Advanced Proficient level, 14%
below the state target.
49% of the Economically Disadvantaged Students performed at the Proficient/Advanced
Proficient level, 10% below the state target.
56% of the African American students performed at the Proficient/Advanced Proficient level, 3%
below the State target.
69% of the Hispanic students performed at the Proficient/Advanced Proficient level, 10% above
the State target.
NJ ASK 6
Grade 6 students continue to show growth, however some groups of students have not achieved
proficiency to the level of the NJ State benchmark percentage of 72%. This target moves to 86% in 2011.
80% of the TOTAL student population at Grade 6 performed at the Proficient/Advanced
Proficient level, 8% above the state target.
88% of the General Education students performed at the Proficient/Advanced Proficient level,
16% above the State target.
37% of the Students with Disabilities performed at the Proficient/Advanced Proficient level, 35%
below the state target.
52% of the Economically Disadvantaged Students performed at the Proficient/Advanced
Proficient level, 20% below the state target.
65% of the African American students performed at the Proficient/Advanced Proficient level, 7%
below the State target.
82% of the Hispanic students performed at the Proficient/Advanced Proficient level, 10% above
the State target.
NJ ASK 7
Grade 7 students continue to show growth, however some groups of students have not achieved
proficiency to the level of the NJ State benchmark percentage of 72%. This target moves to 86% in 2011.
82% of the TOTAL student population at Grade 7 performed at the Proficient/Advanced
Proficient level, 10% above the state target.
88% of the General Education students performed at the Proficient/Advanced Proficient level,
16% above the State target.
50% of the Students with Disabilities performed at the Proficient/Advanced Proficient level, 22%
below the state target.
54% of the Economically Disadvantaged Students performed at the Proficient/Advanced
Proficient level, 18% below the state target.
65% of the African American students performed at the Proficient/Advanced Proficient level, 7%
below the State target.
67% of the Hispanic students performed at the Proficient/Advanced Proficient level, 5% below
the State target.
NJ ASK 8

Department of Instruction
10/21/2010
4
Grade 8 students continue to show growth, however some groups of students have not achieved
proficiency to the level of the NJ State benchmark percentage of 72%. This target moves to 86% in 2011.
91% of the TOTAL student population at Grade 8 performed at the Proficient/Advanced
Proficient level, 19% above the state target.
98% of the General Education students performed at the Proficient/Advanced Proficient level,
26% above the State target.
62% of the Students with Disabilities performed at the Proficient/Advanced Proficient level, 10%
below the state target.
78% of the Economically Disadvantaged Students performed at the Proficient/Advanced
Proficient level, 6% above the state target.
81% of the African American students performed at the Proficient/Advanced Proficient level, 9%
above the State target.
89% of the Hispanic students performed at the Proficient/Advanced Proficient level, 17% above
the State target.
HSPA
Grade 11 students continue to show growth, however some groups of students have not achieved
proficiency to the level of the NJ State benchmark percentage of 85%. This target moves to 92% in
2011.
89% of the TOTAL student population at Grade 11 performed at the Proficient/Advanced
Proficient level, 4% above the state target.
98% of the General Education students performed at the Proficient/Advanced Proficient level,
13% above the State target.
58% of the Students with Disabilities performed at the Proficient/Advanced Proficient level, 27%
below the state target.
73% of the Economically Disadvantaged Students performed at the Proficient/Advanced
Proficient level, 1% above the state target.
78% of the African American students performed at the Proficient/Advanced Proficient level, 7%
below the State target.
88% of the Hispanic students performed at the Proficient/Advanced Proficient level, 3% above
the State target.
RECOMMENDATIONS
The data generated and the information gained from the NJ ASK will be analyzed and used by teachers
and administrators to directly inform instruction. The information provides teachers the means to develop
appropriate differentiated instruction strategies to ensure that students are afforded every opportunity to
learn and achieve. Language Arts teachers should review the Language Arts (Writing and Reading)
cluster scores, as well as the district’s standards-based curriculum and teacher-developed curriculum
maps in order to properly differentiate instruction for all students. In addition, technology based
instruction and assessment tools such as DRA2, Read 180, System 44, Learnia and Study Island should
continue to be employed as a means for supporting student academic growth.
Teachers of students in need of academic support inclusive of students with special needs should continue
to implement differentiated instruction strategies to increase students’ transfer of knowledge.
Professional development in the use of research-based instructional programs such as DRA2, Learnia,
Department of Instruction
10/21/2010
5
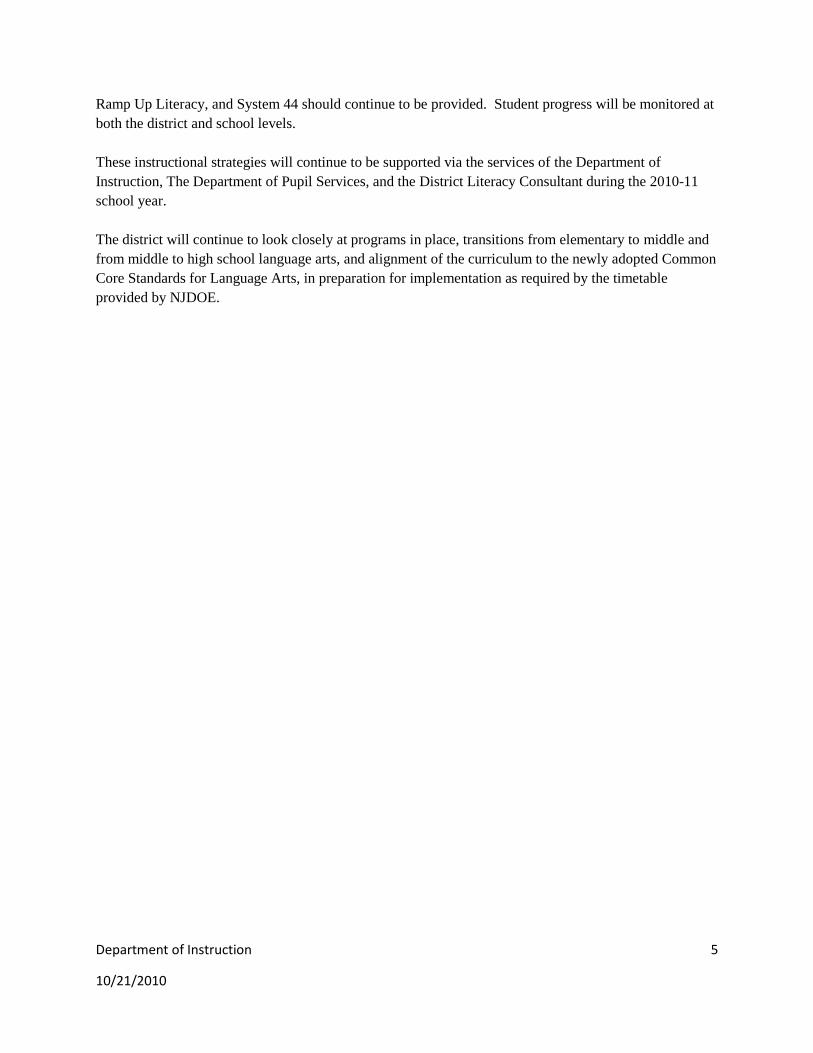
Ramp Up Literacy, and System 44 should continue to be provided. Student progress will be monitored at
both the district and school levels.
These instructional strategies will continue to be supported via the services of the Department of
Instruction, The Department of Pupil Services, and the District Literacy Consultant during the 2010-11
school year.
The district will continue to look closely at programs in place, transitions from elementary to middle and
from middle to high school language arts, and alignment of the curriculum to the newly adopted Common
Core Standards for Language Arts, in preparation for implementation as required by the timetable
provided by NJDOE.

Department of Instruction
10/21/2010
6
MATHEMATICS
2008-2009
Montclair Public School students demonstrate long term growth over time. However, a change in the cut-
point required for proficiency at grades 3 and 4 requires the treatment of spring 2009 data as baseline at
those two grade levels. Developmental growth over time has been sustained with systemic professional
development of content knowledge and pedagogy with the Creative University School Partnership
(CUSP) at Montclair State’s Professional Resource in Science and Math (PRISM) Center and the New
Jersey Statewide Systemic Initiative (NJSSI). New to the District Math teachers were trained in grade
level content knowledge as well as strategies to present concepts for standards-based math, at Montclair
State. Middle School Mathematics teachers participated in on-site, individualized professional
development provided through a coaching model by a consultant from Stevens Institute of Technology
(CEISE).
The requirements for the level of proficiency on the NJASK for grades 3 and 4 were adjusted for the
spring 2009 assessment. The assessments contained new features such as greater emphasis on numerical
operations, additional constructed response items, and a greater number of items overall. The tables
below represent the adjustment to the cut-point for proficiency effective spring 2009, and its continuance
in 2010.
NJ ASK Adjustment in Proficiency Cut-Point for Grade 3
Grade 3 2008 2009 2010
Total Points Required for
Proficiency
33 50 50
Percent Correct for
Proficiency
42 52 52
Table 1
NJ ASK Adjustment in Proficiency Cut-Point for Grade 4
Grade 4 2008 2009 2010
Total Points Required for
Proficiency
43 50 50
Percent Correct for
Proficiency
42 50 50
Table 2
Department of Instruction
10/21/2010
7
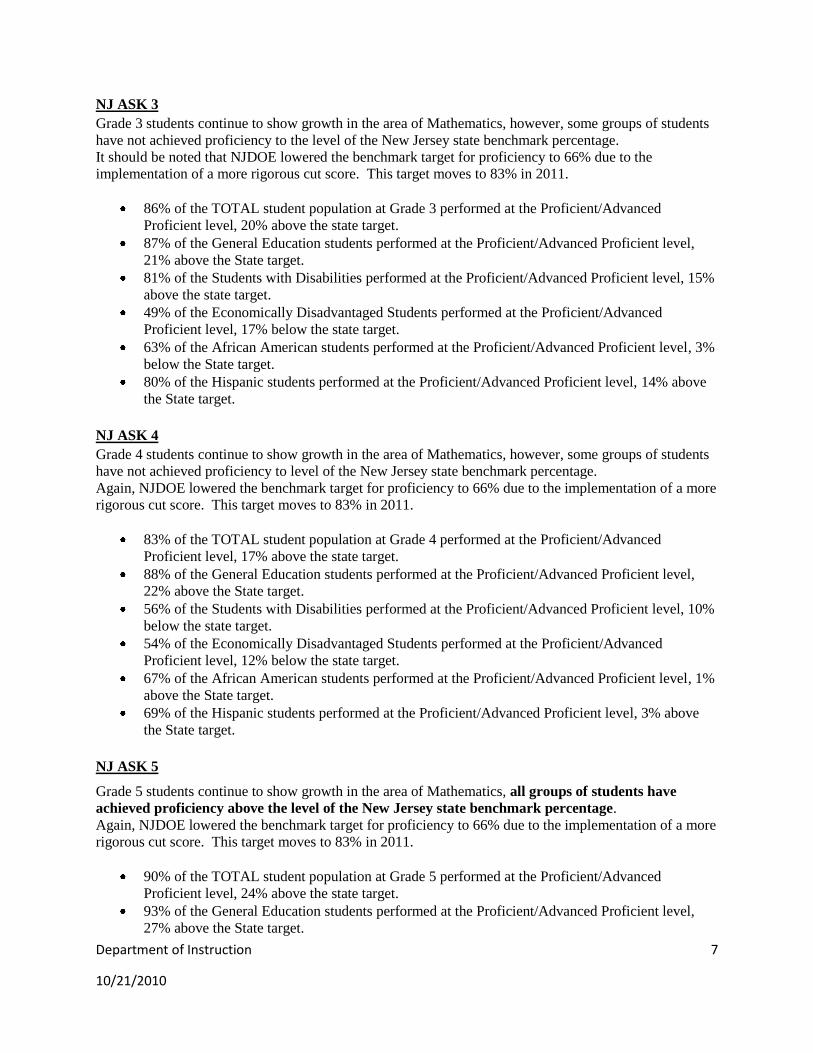
NJ ASK 3
Grade 3 students continue to show growth in the area of Mathematics, however, some groups of students
have not achieved proficiency to the level of the New Jersey state benchmark percentage.
It should be noted that NJDOE lowered the benchmark target for proficiency to 66% due to the
implementation of a more rigorous cut score. This target moves to 83% in 2011.
86% of the TOTAL student population at Grade 3 performed at the Proficient/Advanced
Proficient level, 20% above the state target.
87% of the General Education students performed at the Proficient/Advanced Proficient level,
21% above the State target.
81% of the Students with Disabilities performed at the Proficient/Advanced Proficient level, 15%
above the state target.
49% of the Economically Disadvantaged Students performed at the Proficient/Advanced
Proficient level, 17% below the state target.
63% of the African American students performed at the Proficient/Advanced Proficient level, 3%
below the State target.
80% of the Hispanic students performed at the Proficient/Advanced Proficient level, 14% above
the State target.
NJ ASK 4
Grade 4 students continue to show growth in the area of Mathematics, however, some groups of students
have not achieved proficiency to level of the New Jersey state benchmark percentage.
Again, NJDOE lowered the benchmark target for proficiency to 66% due to the implementation of a more
rigorous cut score. This target moves to 83% in 2011.
83% of the TOTAL student population at Grade 4 performed at the Proficient/Advanced
Proficient level, 17% above the state target.
88% of the General Education students performed at the Proficient/Advanced Proficient level,
22% above the State target.
56% of the Students with Disabilities performed at the Proficient/Advanced Proficient level, 10%
below the state target.
54% of the Economically Disadvantaged Students performed at the Proficient/Advanced
Proficient level, 12% below the state target.
67% of the African American students performed at the Proficient/Advanced Proficient level, 1%
above the State target.
69% of the Hispanic students performed at the Proficient/Advanced Proficient level, 3% above
the State target.
NJ ASK 5
Grade 5 students continue to show growth in the area of Mathematics, all groups of students have
achieved proficiency above the level of the New Jersey state benchmark percentage.
Again, NJDOE lowered the benchmark target for proficiency to 66% due to the implementation of a more
rigorous cut score. This target moves to 83% in 2011.
90% of the TOTAL student population at Grade 5 performed at the Proficient/Advanced
Proficient level, 24% above the state target.
93% of the General Education students performed at the Proficient/Advanced Proficient level,
27% above the State target.
Department of Instruction
10/21/2010
8
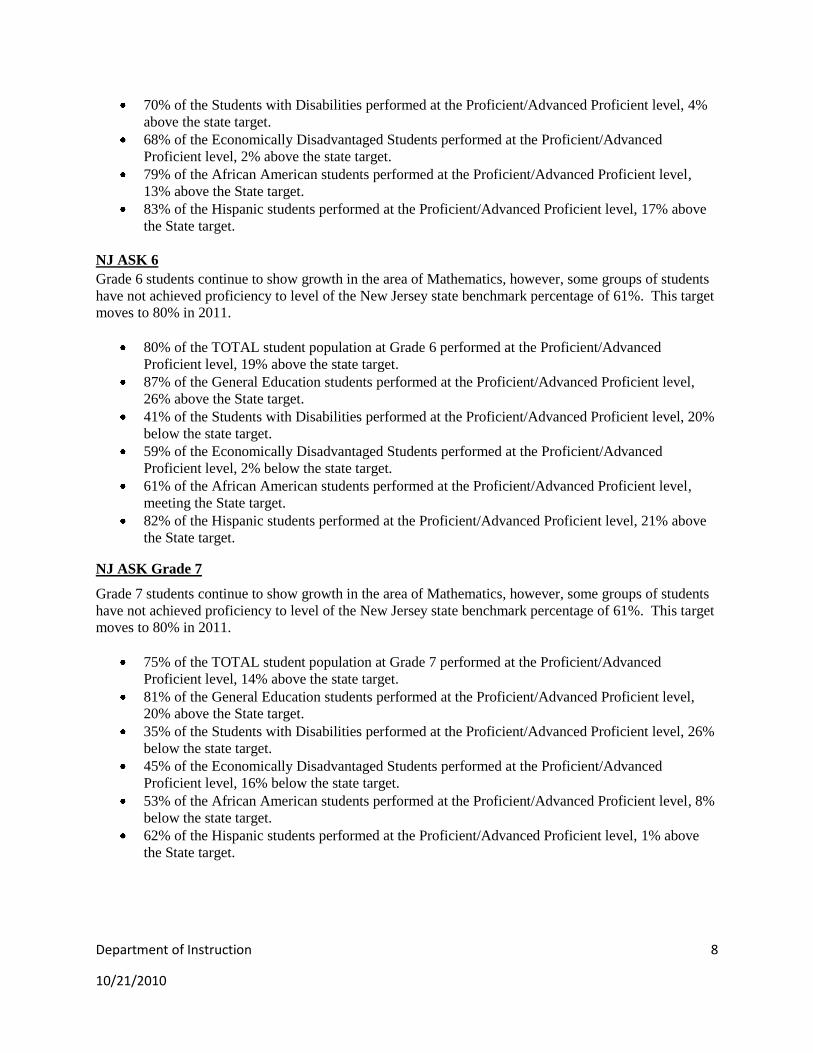
70% of the Students with Disabilities performed at the Proficient/Advanced Proficient level, 4%
above the state target.
68% of the Economically Disadvantaged Students performed at the Proficient/Advanced
Proficient level, 2% above the state target.
79% of the African American students performed at the Proficient/Advanced Proficient level,
13% above the State target.
83% of the Hispanic students performed at the Proficient/Advanced Proficient level, 17% above
the State target.
NJ ASK 6
Grade 6 students continue to show growth in the area of Mathematics, however, some groups of students
have not achieved proficiency to level of the New Jersey state benchmark percentage of 61%. This target
moves to 80% in 2011.
80% of the TOTAL student population at Grade 6 performed at the Proficient/Advanced
Proficient level, 19% above the state target.
87% of the General Education students performed at the Proficient/Advanced Proficient level,
26% above the State target.
41% of the Students with Disabilities performed at the Proficient/Advanced Proficient level, 20%
below the state target.
59% of the Economically Disadvantaged Students performed at the Proficient/Advanced
Proficient level, 2% below the state target.
61% of the African American students performed at the Proficient/Advanced Proficient level,
meeting the State target.
82% of the Hispanic students performed at the Proficient/Advanced Proficient level, 21% above
the State target.
NJ ASK Grade 7
Grade 7 students continue to show growth in the area of Mathematics, however, some groups of students
have not achieved proficiency to level of the New Jersey state benchmark percentage of 61%. This target
moves to 80% in 2011.
75% of the TOTAL student population at Grade 7 performed at the Proficient/Advanced
Proficient level, 14% above the state target.
81% of the General Education students performed at the Proficient/Advanced Proficient level,
20% above the State target.
35% of the Students with Disabilities performed at the Proficient/Advanced Proficient level, 26%
below the state target.
45% of the Economically Disadvantaged Students performed at the Proficient/Advanced
Proficient level, 16% below the state target.
53% of the African American students performed at the Proficient/Advanced Proficient level, 8%
below the state target.
62% of the Hispanic students performed at the Proficient/Advanced Proficient level, 1% above
the State target.
Department of Instruction
10/21/2010
9
NJ ASK 8
Grade 8 students continue to show growth in the area of Mathematics, however, some groups of students
have not achieved proficiency to level of the New Jersey state benchmark percentage of 61%. This target
moves to 80% in 2011.
73% of the TOTAL student population at Grade 8 performed at the Proficient/Advanced
Proficient level, 12% above the state target.
83% of the General Education students performed at the Proficient/Advanced Proficient level,
22% above the State target.
32% of the Students with Disabilities performed at the Proficient/Advanced Proficient level, 29%
below the state target.
40% of the Economically Disadvantaged Students performed at the Proficient/Advanced
Proficient level, 21% below the state target.
52% of the African American students performed at the Proficient/Advanced Proficient level, 9%
below the state target.
63% of the Hispanic students performed at the Proficient/Advanced Proficient level, 2% above
the State target.
HSPA – Grade 11
Grade 11 students continue to show growth, however some groups of students have not achieved
proficiency to the level of the NJ State benchmark percentage of 74%. This target moves to 86% in
2011.
77% of the TOTAL student population at Grade 11 performed at the Proficient/Advanced
Proficient level, 3% above the state target.
90% of the General Education students performed at the Proficient/Advanced Proficient level,
16% above the State target.
28% of the Students with Disabilities performed at the Proficient/Advanced Proficient level, 46%
below the state target.
36% of the Economically Disadvantaged Students performed at the Proficient/Advanced
Proficient level, 38% below the state target.
53% of the African American students performed at the Proficient/Advanced Proficient level,
18% below the State target.
84% of the Hispanic students performed at the Proficient/Advanced Proficient level, 10% above
the State target.
RECOMMENDATIONS
The data generated and the information gained from the NJASK, should be analyzed by teachers and
administrators to directly inform instruction. The information provides teachers the means to develop
appropriate differentiated instruction strategies to ensure that students are afforded every opportunity to
learn and achieve. Math teachers should review math cluster data, the district standards-based
curriculum, teacher developed curriculum maps, and instructional pacing in order to properly differentiate
instruction for all students. Differentiation occurs in the regular classroom setting and as part of the SAIL
model, STARS, and programs for Students with Disabilities. The district mid-year and end of year
assessments in mathematics will continue at all levels.
Department of Instruction
10/21/2010
10
In addition, technology based instruction and assessment tools, such as Study Island, and Learnia should
be employed as a means of supporting student academic growth.
Teachers of students in need of academic support, inclusive of students with special needs should
continue to implement differentiated instruction strategies to increase students’ transfer of knowledge.
Professional development in the use of research-based instructional programs such as Mathematics
Navigator, Ramp-Up Mathematics, Learnia, and Study Island will be provided. Student progress will be
monitored at both the district and school levels.
The district will continue to look closely at programs in place, transitions from elementary to middle and
from middle to high school mathematics, and alignment of the curriculum to the newly adopted Common
Core Standards for Mathematics, in preparation for implementation as required by the timetable provided
by NJDOE.