downsizing industrial metabolism - wachstum im wandel · 2013-09-05 · downsizing industrial...
TRANSCRIPT

Downsizing Industrial
Metabolism
Presentation to
„Wachstum im Wandel“
Konferenz 2012
Marina Fischer-Kowalski
Institute for Social Ecology, Vienna

Introduction
• Existing discourse about „degrowth“: widespread efforts to
disclose economic mechanisms that allow a departure from
growth without harming human welfare.
• Another version: Keep aspiring to „growth“, but instead of
growing GDP, strive for growing human quality of life, or
welfare. (OECD, Sarkozy…)
• Still another version: Green Growth: grow economically, but
in an environmentally friendly way.
• Instead, I will talk about the physical economy: about
downsizing industrial metabolism – about physical
degrowth.

Downsizing Industrial Metabolism:
1. Why should this happen?
2. How can this happen?
3. Why will this happen?

1. Why should this happen?

0
50
100
150
200
250
300
(6-12 t/cap*yr)
Energy and material consumption
per capita by sociometabolic regime
Source: after Sieferle et al. 2006, Schandl et al. 2008
Hunter &
Gatherer
Agrarian
societies
Industrial
society
~ 10
(~ 2 t/cap*yr)
40-70
(3-6 t/cap*yr)
140-440
avg 280
(9-27 t/cap*yr
avg. 18t/cap*yr)
40 – 140
avg 75
(4-14 t/cap*yr
avg. 7t/cap*yr)
GJ
/ca
p*y
r
(DMC)
future
society
avg 100 ?
(<20C, oil scarcity)

GDP in $ Income/cap in $
Source: UNEP International Resource Panel, Decoupling Report 2011
GDP Trillion (1012) international dollars
Income International dollars cap/yr
Biomass
Construction minerals
Fossil energy carriers
Ores and industrial minerals
Biomass
Construction
minerals
Fossil energy carriers
Ores and industrial minerals
Global material extraction 1900-2005
Global metabolic rates 1900-2005
Material extraction Billion tons
During the 20th century
Metabolic rate t/cap/yr

Trend scenario: tripling of annual global
resource extraction by 2050
Alternative: per capita resource
consumption of industrial economies
declines (50%), rest of the world can
converge to same level
Source: UNEP International Resource Panel, Decoupling Report 2011

This BAU growth dynamics must not be
sustained on a limited planet
• Limits to non-renewable resources
• Limits to renewable resources and biocapacity
• Limits to the absorption capacity for human wastes and
emissions
• Limits to our right to plunder the planet at the expense of
future human generations and all other living beings

The current industrial metabolism is
detrimental in two ways:
1. By using the majority of the world‘s resources for the
benefit of 20% of its (current) population
2. By providing a model that the rest of the world is quickly
trying to emulate (and is actively induced to emulate for the
sake of global markets)

2. How can downsizing of industrial
metabolism happen?

Drivers of the scale of industrial metabolism
• Population: population is the strongest driver of the scale of social metabolism (elasticity ~ 1). Population growth in mature industrial countries is low (fed mainly by immigration) and may turn negative in this century.
• Income: is a somewhat weaker driver (elasticity ~ 0,7), there is „decoupling“. During the 20th century, av. global income increased 5,4 fold, while material use per capita increased just 3,2 fold. „Degrowth“ in per capita income would presumably reduce metabolic rates.
• Energy availability: Energy and materials use are directly causally related. A „dematerialization“ of energy (e.g. solar instead of fossil fuels) will directly reduce materials use. A decline in available primary energy (scarcity, cost barriers) would strongly lower metabolic scale.
• Material efficiency: in contrast to arguments based on selected technical cases („Factor 5“, „Factor 10“), on a macro level, material efficiency gains contribute only marginally to keeping material use at bay and are to a large degree compensated for by rebound effects.
• Structural change: structural change from a biomass-based (agrarian) social metabolism to a fossil-fuel-based industrial metabolism induces technology change increasing material consumption (see Kaya analysis in UNEP-CSIRO 2010), structural change from fossil fuel based to renewables (Energiewende) would drive dematerialization.

USA
China
India
Germany
Brazil
Metabolic rate t/cap/yr
R2 = 0.60
Source: UNEP
Decoupling Report
2011.
Sociometabolic rates: A log-log-linear
function of per capita income
Data for the year 2000

Raising material efficiency I:
J. Allwood‘s et al. White Paper (2011)
Extensive meta-analysis of literature illustrates:
• Plausible material efficiency improvements in production and processing of steel, cement, plastic, paper & alluminium will not amount to the CO2 reductions required by IPCC targets
• There are strong economic and business barriers to adopting material efficiency strategies (lock-in with production systems based on cheap energy; business models oriented at growing sales motivate towards planned obsolescence…)
• There are strong social barriers (fashion and lack of emotional attachment to things, convenience creating overcapacities, no moral disapproval of wasting any more, pervasive idealized life styles…)
• Mechanisms promoting material efficiency are comparatively weak (business opportunities for second-hand and leasehold, resource and waste taxes, voluntary simplicity on the consumer side…)
J.Allwood, M.F. Ashby, T.G.Gutowski & E.Worrell, Material Efficiency: A white
paper. Resources, Conservation and Recycling 55(2011), 362-381

Raising material efficiency II:
„Closing the Eco-Innovation Gap in Europe“
• Survey of 600 000 companies in all European countries
found 320 000 „innovators“, but only 80 000 companies
trying to reduce material use
• DEMEA analyzed 100 case studies in Germany for financial
impact of resource savings, arriving at estimates between
1% - 2,3% of output annually (much lower with large, higher
with small companies)
EIO (2012), Closing the Eco-Innovation Gap. An economic opportunity for
business. Brussels (DG Environment)

Resource use reduction targets for EU 27 Ambitious Moderate Conservative
GHG emissions
(baseline 1990)
-30% by 2020
-95% by 2050
-20% by 2020
-80% by 2050
-20% by 2020
-50% by 2050
Energy
consumption
(GIEC)
(baseline 2005)
-20% by 2020
-40% by 2050
-15% by 2020
-30% by 2050
-10% by 2020
-20% by 2050
Material use
(DMC)
(baseline 2005)
-30% by 2020
-70% by 2050
-10% by 2020
-30% by 2050
-5% by 2020
-20% by 2050
Land use Zero net demand of
foreign land by 2020
Zero net take of
artificial land by 2020
Limit annual net
increase of artificial
land to 200 km2 by
2020
Water use
Water Exploitation
Index (WEI)
<20% WEI by 2020
<10% WEI by 2050
<25% WEI by 2020
<20% WEI by 2050
<30% WEI by 2020
<25% WEI by 2050
Legend for
feasibility:
Possibility to achieve
targets with significant
changes in levels of
activity and significant
advancement from known
and future technologies
Possibility to achieve
targets with slight
changes in levels of
activity and greater
investments in known
technologies
Possibility to achieve
targets while maintaining
current levels of activity
and cost effective
investments in known
technologies
Source: BIOIS, SEC & SERI (2012), Assessment of Resource Use Indicators, report to DG Environment, p. 96

Multi-Return strategies for resource use reduction
• Changing the human diet towards a lower share of animal based food. Tackling this will have several effects: – Positive effects on human health (less obesity, less cardiovascular diseases, lower
risk of livestock-related epidemics)
– Decreasing livestock and thus lowering pressure on land because less land area is needed for agricultural production (i.e. market fodder for livestock)
– Lowering pressures on groundwater (nitrification)
– Savings of energy (cooling, transportation)
– Decreasing GHG emissions from ruminants
– Savings on water use
• Steady stocks of built-up infrastructure and densification of settlements, reducing urban sprawl – decreasing material use, i.e. construction minerals, metals use in infrastructure,
– facilitating a continuous recycling of construction materials
– decreasing energy use for the construction of infrastructure, in transport and in the use phase (more efficient heating, shorter distances)
– decreasing use of land area and sealing of land
Source: BIOIS, SEC & SERI (2012), Assessment of Resource Use Indicators. Report to DG Environment, p. 81

Question 2: Conclusion
• Under the structural conditions prevailing in the past
decades – emphasis on economic growth, emphasis on
private rather than public goods, emphasis on increasing
profits in the financial sector – efforts at climate protection,
saving of natural resources and driving material efficiency
towards dematerialization proved relatively futile.
• In particular, increases in material efficiency = resource
productivity = decoupling did generally not decrease
resource use; (over)compensation by economic growth
• Can we detect signs of new structural conditions that would
offer better framework conditions?

3. Why will a downsizing of industrial
metabolism indeed happen?

• Since the early 1970s the mature industrial countries
worldwide showed indications of biophysical saturation
on a high level of resource consumption, while the
economies kept growing.
A sociometabolic transformation
is currently ongoing …

Global metabolic rates grow slower than
income, in particular since the first oil crisis
Source: after Krausmann et al. 2009
-
3
6
9
12
19
60
19
65
19
70
19
75
19
80
19
85
19
90
19
95
20
00
20
05
0
1,5
3
4,5
6
DMC GDP (const. 2000 $)
0
30
60
90
19
60
19
65
19
70
19
75
19
80
19
85
19
90
19
95
20
00
20
05
0
2
4
6
TPES GDP (const. 2000 $)
material input
t/cap/yr (left
axis)
energy input
GJ/cap/yr (left
axis)
income
$/cap*yr (right
axis)
income
$/cap*y (right
axis)
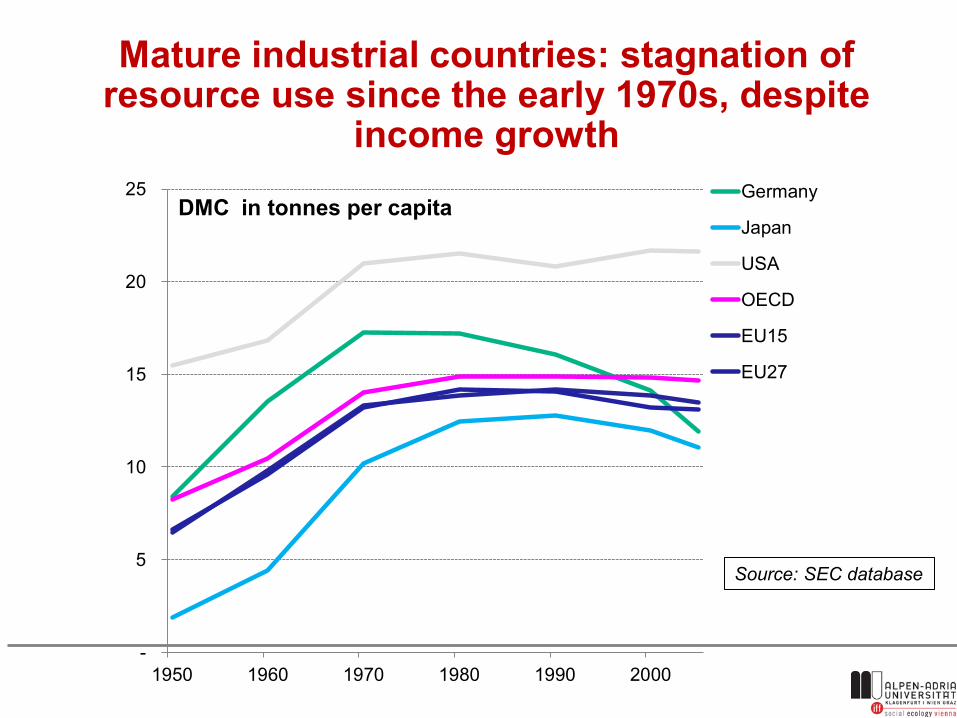
Mature industrial countries: stagnation of resource use since the early 1970s, despite
income growth
-
5
10
15
20
25
1950 1960 1970 1980 1990 2000
DMC in tonnes per capita Germany
Japan
USA
OECD
EU15
EU27
Source: SEC database

Mature industrial countries: stagnation of resource use since the early 1970s, despite
economic growth
-
5
10
15
20
25
1950 1960 1970 1980 1990 2000 2010
DMC in tonnes per capita Germany
Japan
USA
OECD
EU15
EU27
world
Source: SEC database

0
50
100
150
200
250
300
350
183
0
184
0
185
0
186
0
187
0
188
0
189
0
190
0
191
0
192
0
193
0
194
0
195
0
196
0
197
0
198
0
199
0
200
0
(MJ/h
ou
r w
ork
ed
)
Energy Intensity
per working hour (employment)
AUT MJ DEC/hour
UK MJ DEC/hour
based on Krausmann 2001 and Maddison 2008, SEC data base
(ongoing project: „Arbeit und Energie: Österreich“, funded by BMLFUW)

• Since the early 1970s the mature industrial countries
worldwide show indications of biophysical saturation on a
high level of resource consumption, while the economy
keeps growing: „decoupling“
• At the same time, the „historic“ Great Transformation
happens in many emerging economies: they transit from
agrarian to fossil-fuel based industrial. Their population size
is much larger that that of the mature industrial economies.
They emulate the industrial countries model of welfare by
high resource consumption.
A sociometabolic transformation
is currently ongoing …

Emerging economies: take off and accelleration in the transition to high resource use
0
2
4
6
8
10
12
14
16
1970 1975 1980 1985 1990 1995 2000 2005
ton
s p
er
cap
ita
Metabolic rates of "growing giants" 1970-2005 (DMC/cap*y)
Brazil
India
China
Global average
Sources: UNEP Asia & Pacific 2011, SEC database

HOWEVER:
Downsizing is no more just a moral appeal:
new forces are at work…

Unprecedented rise in commodity prices
Source: McKinsey Global Institute. 2011. Resource Revolution: Meeting the world’s energy,
materials, food and water needs. www.iwar.tu-Darmstadt.de

Figure A2.1: Declining ore grades in the major producing countries
Source: Giurco et al, 2010, p.28: based on Mudd 2010, 2009, 2007
Exhaustion of the mineral resource base?

Key messages from McKinsey‘s (2011)
Resource Revolution
• Over the past century, progressively cheaper resource prices have underpinned economic growth.
• Has changed: prices have risen since the turn of the century (+147% real commodity prices, 100% increase in av cost to bring a new oil well on line since 2000). Resource price inflation and volatility could further increase.
• At least $ 1 trillion more investment in the resource system (1/3 more than currently) is needed per year to meet future demands
• Need to achieve a resource productivity revolution comparable to the labour productivity revolution of the 20th century
• Supply of oil and natural gas could fall by approx. 6% per year, supply of coal by 3%
• Growing concern about inequality might require action
Ch 1: „The resource intensive growth model of the past“ … needs to be abandoned (that is what they say p.21ff)

Randers‘ „2052“ Club of Rome Projection (2012):
core assumptions about global dynamics that
make a difference: • Population will peak much earlier than current UN projections, because
of reduced family size in increasingly urban populations (emulating the
case of the EU 1950-2010, p.366). Peak assumed at about 2035 (63)
• Labour productivity will grow ever more slowly, because of a shift of
work towards caretaking of an aging population (that is difficult to
rationalize) and because of social conflicts and tensions that make fine-
tuning difficult (emulating the case of the US 1950-2010, p.367)
• An increasing share of GDP will have to be invested to solve the
emerging problems of depletion, pollution and inequity, prevention and
adaptation. This will reduce the share available for consumption (55).

Increasing investment
…throwing money at problems…
“…increasing scarcity of various resources, unpleasant
accumulation of various pollutants, imminent loss of
selected species and ecosystems, growing needs to
defend our buildings against new and scary weather
patterns, time consuming problems associated to
congestions… (will initially not) lead to a decision to
pull back, … instead (to) a decision to throw money at
the problem.”(76)
The increasing investment may be forced (ex post, as after a hurricane) or
voluntary (ex ante as with developing new low carbon energy sources).

New structural framework conditions ahead
• Basically Randers says: structural change, and an end to consumption
growth, will be forced upon humanity. But global society won‘t do its job
properly, at least not in time to escape disaster 2050-2100.
• In the coming decades, the mature industrial countries will face slow
economic growth, if growth at all. Slow economic growth will first hurt the
low income groups, and this will create political conflicts – which are in
part necessary to stimulate change.
• I also believe that the convincing response to this are not futile efforts at
recapturing economic growth, but to focus on a more equal distribution
of human wellbeing and how this can be achieved at lower
environmental cost.
• Talking in complex systems‘ terms, we might be at the take-off point to a
new sociometabolic regime – all of a sudden, things could start moving
much faster.
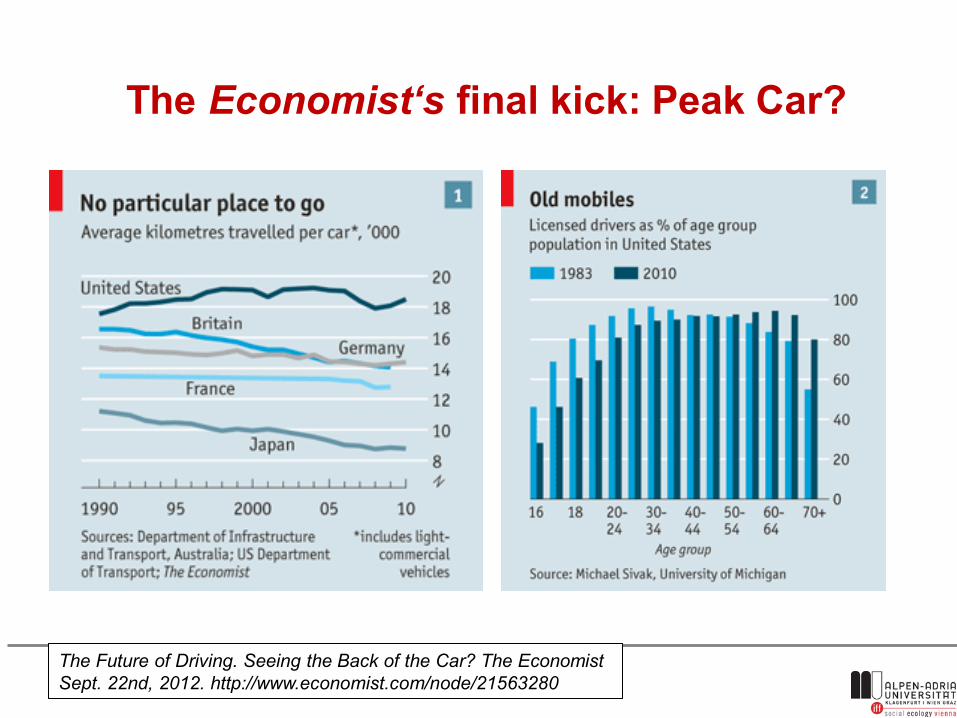
The Economist‘s final kick: Peak Car?
The Future of Driving. Seeing the Back of the Car? The Economist
Sept. 22nd, 2012. http://www.economist.com/node/21563280

Major recent global sustainability reports
• McKinsey Global Institute. 2011. Resource Revolution: Meeting the world’s energy, materials, food and water needs. www.iwar.tu-Darmstadt.de
• Randers, J. 2012. 2052. A Global Forecast for the Next Forty Years. A Report to the Club of Rome. White River Junction, Vermont: Chelsea Green Publishing.
• Raskin, P. D., C. Electris, R. A. Rosen. 2010. The Century Ahead: Searching for Sustainability. Sustainability. 2: 2626-2651.
• The Royal Society. 2012. People and the Planet. London: The Royal Society.
• UNEP, International Resource Panel. 2011. Decoupling Resource use and Environmental Impacts from Economic Growth. Paris: UNEP
• WBGU (German Advisory Council on Global Change) 2011. World in Transition. A Social Contract for Sustainability. Flagship Report. Berlin: WBGU.