Download - Zep q1 2015

Zep Inc. First Quarter Fiscal 2015 Earnings Conference Call January 6, 2015 John K. Morgan Chairman, President and Chief Executive Officer Mark R. Bachmann Executive Vice President and Chief Financial Officer © 2015 Zep Inc. - All rights reserved.
Safe Harbor This presentation and our commentary contain forward-looking statements within the meaning of the Private Securities Litigation Reform Act of 1995. Specifically, forward-looking statements include, but are not limited to, statements relating to our future economic performance, business prospects, revenue, income, and financial condition; and statements preceded by, followed by, or that include the words “plans,“ expects," "believes," "intends," "will," "anticipates," “confident,” “strategy,” “continuing,” “to be,” “opportunity,” “well-positioned,” “excited about” and similar terms that relate to future events, performance, or our results. Examples of forward-looking statements in this presentation include, but are not limited to, statements about our sales pipeline gaining momentum, statements about favorable demographic trends continuing, statements about having mitigated risks present previously, statements regarding our expectation to experience quarter-to-quarter gross profit margin inconsistencies from mix and promotions, statements regarding the next phase of investments in training, sales management & additional sales reps, statements about achieving full manufacturing capability by the end of the fiscal second quarter, statements regarding the continued residual effects of lost customers due to the fire on sales, statements about our increasing optimism with respect to our fiscal 2015 net sales expectation, statements regarding John K. Morgan’s 10b5-1 plan, the timing of its execution and the resulting beneficial ownership, statements regarding possible benefits on raw materials purchases as a result of changing oil prices, and the timing of those benefits, statements about our intent to reduce overall inventories levels and utilize proceeds to further reduce net debt, and statements regarding low single digit revenue growth, gross profit margin of 46-48%, higher selling, distribution and administrative expenses, $6-7 million of interest expense, total capital expenditures of $25-$30 million and a tax rate of 36-38% for fiscal 2015. Our forward-looking statements are subject to certain risks and uncertainties that could cause actual results, expectations, or outcomes to differ materially from our historical experience as well as management's present expectations or projections. These risks and uncertainties include, but are not limited to:
• the ongoing impact of the fire that occurred at our aerosol manufacturing facility on May 23, 2014 on our financial results, operations and prospects; • general economic conditions; • the cost or availability of raw materials; • competition in the markets we serve; • our ability to realize anticipated benefits from strategic planning initiatives and the timing of the benefits of such actions; • market demand and pricing for our products and/or services; • our ability to maintain our customer relationships; and • litigation and other contingent liabilities, such as environmental matters.
A variety of other risks and uncertainties could cause our actual results to differ materially from the anticipated results or other expectations expressed in our forward-looking statements. A number of those risks are discussed in Part I, "Item 1A. Risk Factors" of our Annual Report on Form 10-K for the fiscal year ended August 31, 2014. Management believes these forward-looking statements are reasonable; however, undue reliance should not be placed on any forward-looking statements, which are based on current expectations. Further, forward-looking statements speak only as of the date they are made, and management undertakes no obligation to update publicly any of them in light of new information or future events. Reconciliations of non-GAAP measures referenced in this presentation to their nearest GAAP measure are included in the earnings press release available on the Zep Inc. website and at the end of this presentation.
2 © 2015 Zep Inc. - All rights reserved.

Introduction

1st Quarter Update
§ Sales pipeline gaining momentum
§ Growth in transportation and industrial maintenance end-markets
§ Growth across channels of distribution § Home improvement
§ Auto aftermarket retailers
4 © 2015 Zep Inc. - All rights reserved.
Recent Success Driven by Three Primary Factors

Drivers of Recent Success
1. Focus on strategic end markets § Transportation
§ Grows with new car sales, average age and miles driven
§ Industrial maintenance § Improving GDP and increased employment
2. Following channel shift in janitorial end market
3. Quality and speed of fire-recovery effort instrumental in preserving business and strengthening customer relationships
5 © 2015 Zep Inc. - All rights reserved.
63% of Sales to Transportation and Industrial End-Markets
Fiscal 1st Quarter 2015 Summary
6 © 2015 Zep Inc. - All rights reserved.
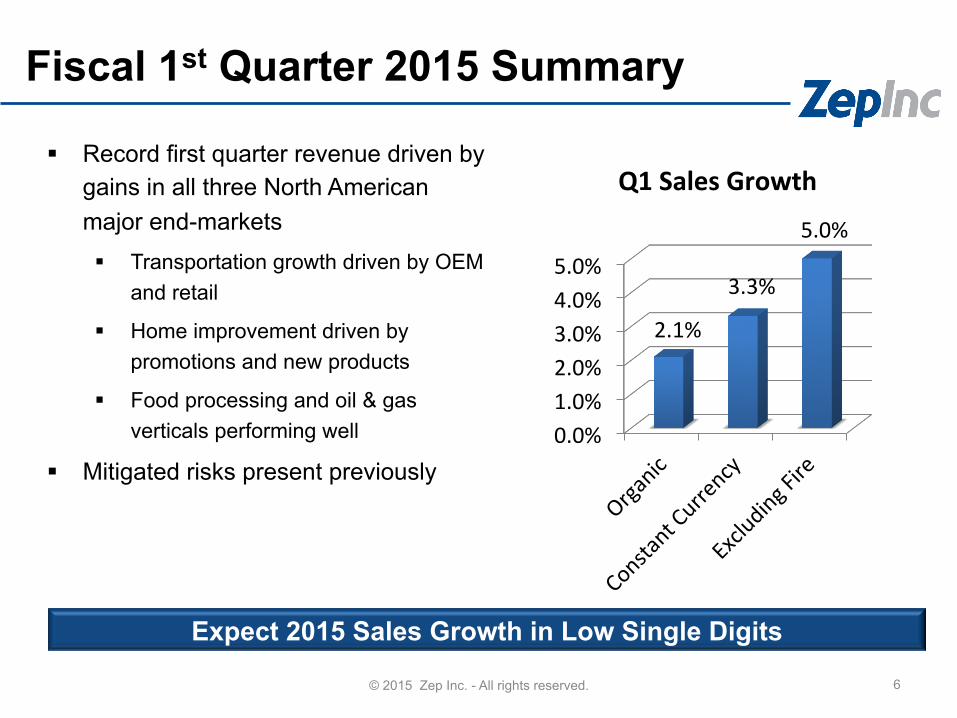
§ Record first quarter revenue driven by gains in all three North American major end-markets § Transportation growth driven by OEM
and retail
§ Home improvement driven by promotions and new products
§ Food processing and oil & gas verticals performing well
§ Mitigated risks present previously
Expect 2015 Sales Growth in Low Single Digits
0.0% 1.0% 2.0% 3.0% 4.0% 5.0%
2.1%
3.3%
5.0%
Q1 Sales Growth
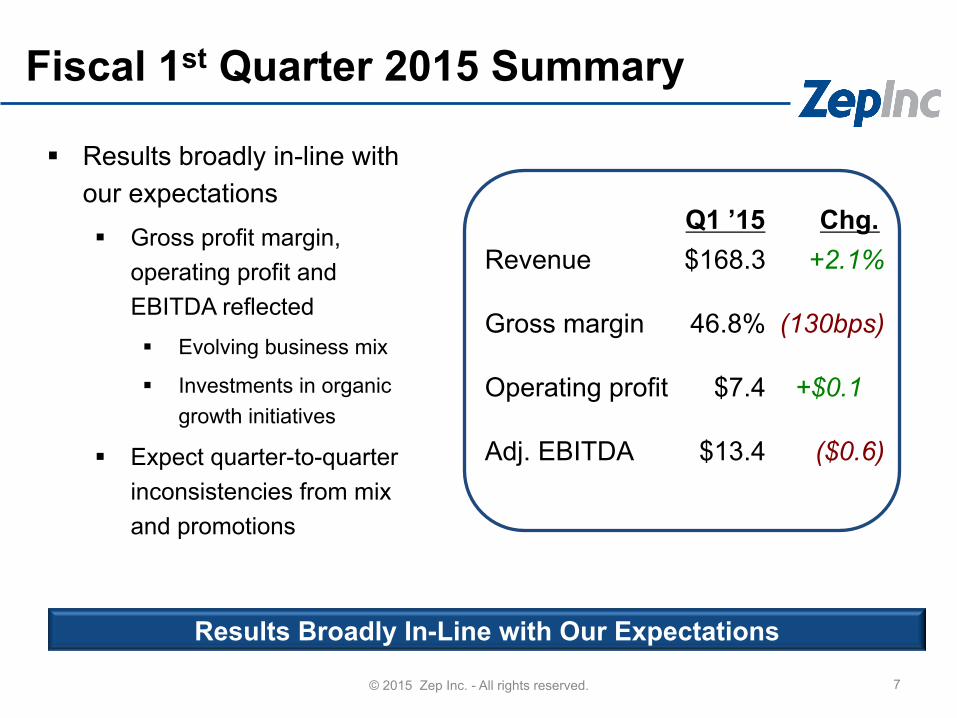
Q1 ’15 Chg. Revenue $168.3 +2.1% Gross margin 46.8% (130bps) Operating profit $7.4 +$0.1 Adj. EBITDA $13.4 ($0.6)
Fiscal 1st Quarter 2015 Summary
7 © 2015 Zep Inc. - All rights reserved.
§ Results broadly in-line with our expectations § Gross profit margin,
operating profit and EBITDA reflected § Evolving business mix
§ Investments in organic growth initiatives
§ Expect quarter-to-quarter inconsistencies from mix and promotions
Results Broadly In-Line with Our Expectations

NASS Investments
§ First phase of transformative changes in NASS business is complete § New strategy took effect on January 1st
§ Pleased with response from Zep sales reps and customers
§ Next phase includes additional sales reps, investments in training & sales management
8 © 2015 Zep Inc. - All rights reserved.
Early Signs Encouraging

Fire Recovery
§ Fire recovery progressing…Expect full production capability by end of Q2 § Continue to experience residual effects of lost customers/sales due to
the fire – but at a reduced rate
§ Organic growth is more than offsetting residual lost sales and contributing to our fiscal 2015 sales optimism
§ Received all necessary permits and resumed production in late December
§ Expect to utilize a mix of insource and outsource manufacturing capacity
9 © 2015 Zep Inc. - All rights reserved.
Recovering Capabilities Quickly - Instrumental to Organic Growth

Detailed Financial Performance
© 2015 Zep Inc. - All rights reserved.
11
1st Quarter ‘15 Revenue Drivers
© 2015 Zep Inc. - All rights reserved.
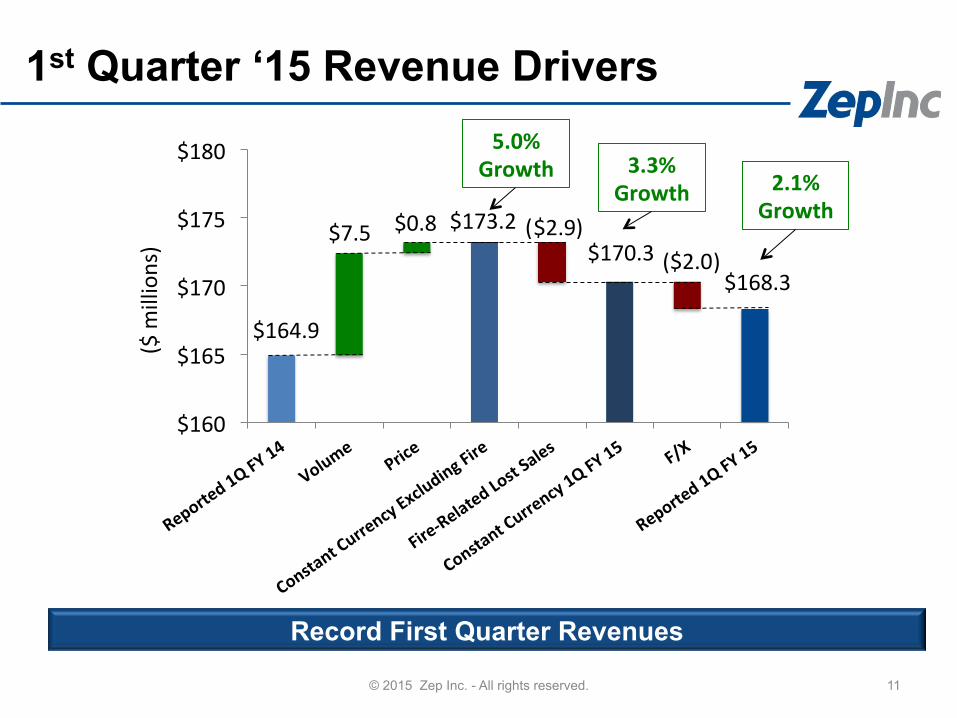
Record First Quarter Revenues
$164.9
$173.2 $170.3
$168.3
$7.5 $0.8 $2.9 $2.0
$160
$165
$170
$175
$180 ($ m
illions)
( ) ( )
3.3% Growth 2.1%
Growth
5.0% Growth

Decreases
0% 10% 20% 30% 40% 50% 60% 70% 80% 90% 100%
• Distribu?on • Generalist Direct Sales
• Zep Vehicle Care
1st Quarter ‘15 Revenue Drivers
12 © 2015 Zep Inc. - All rights reserved.
Growth in All Three Major End-Markets
• Auto/OEM
• Auto/ALermarket
• Home Improvement
• Oil & Gas
• Food Processing
Increases
Transporta?on
Jan/San & Ins?tu?onal
Industrial/ MRO & Other
39%
24%
37%
63%
% of Q1 2015 North American Revenue
2.0%
1.9%
4.8%
Q1 Growth

13
1st Quarter ‘15 Gross Profit Margin
© 2015 Zep Inc. - All rights reserved.
Year-over-Year (130) bps
48.1%
46.8%
1.3%
45%
46%
47%
48%
49%
Gross Margin within Expected Range
( ) § Raw Material Expectations
§ 45% sourcing cost related to petro-chemicals
§ Unique supply & demand characteristics
§ Too early to quantify benefit of declines in oil prices
§ May take a couple of quarters to realize benefits

S, D & A, Interest & Taxes
§ Lower legal and professional fees allowed for investments in organic growth initiatives
§ Expect Q2 selling, distribution and administrative expense as a percent of sales to be 200-300 basis points sequentially higher driven by seasonality and investments
§ New credit facility lowered interest expense by approximately $500,000 in the quarter
§ Effective tax rate was 36.5% for the quarter § Expect to range from 36-38% for the year
14 © 2015 Zep Inc. - All rights reserved.
Fiscal 2015 S,D & A Expected to be 41-43% of Sales
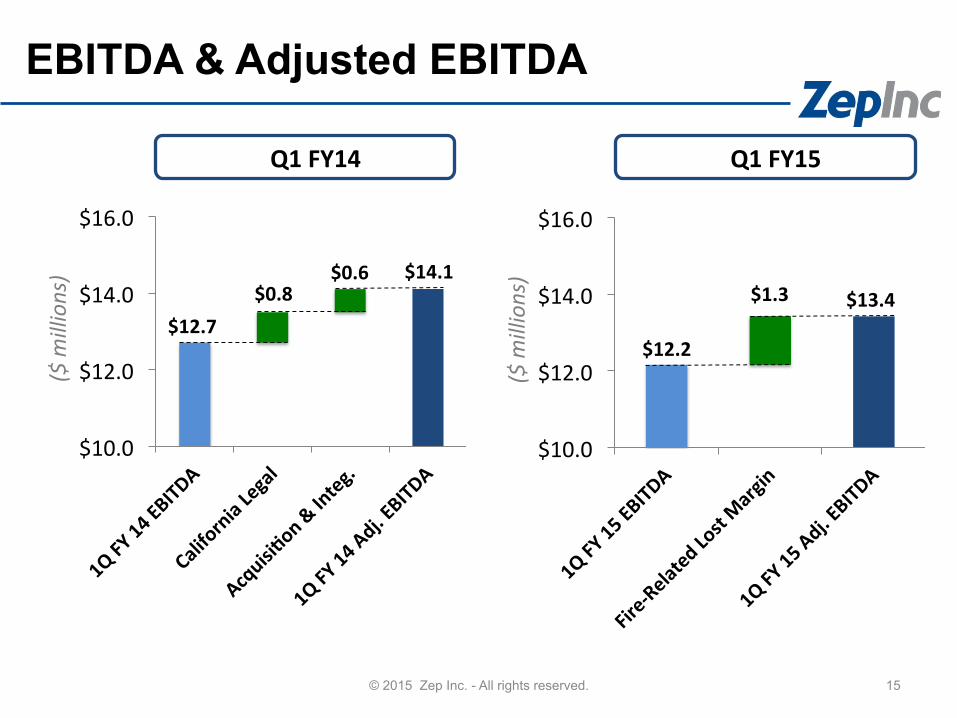
$12.7
$14.1 $0.8
$0.6
$10.0
$12.0
$14.0
$16.0
($ m
illions)
15
EBITDA & Adjusted EBITDA
© 2015 Zep Inc. - All rights reserved.
$12.2
$13.4 $1.3
$10.0
$12.0
$14.0
$16.0
($ m
illions)
Q1 FY15 Q1 FY14
16
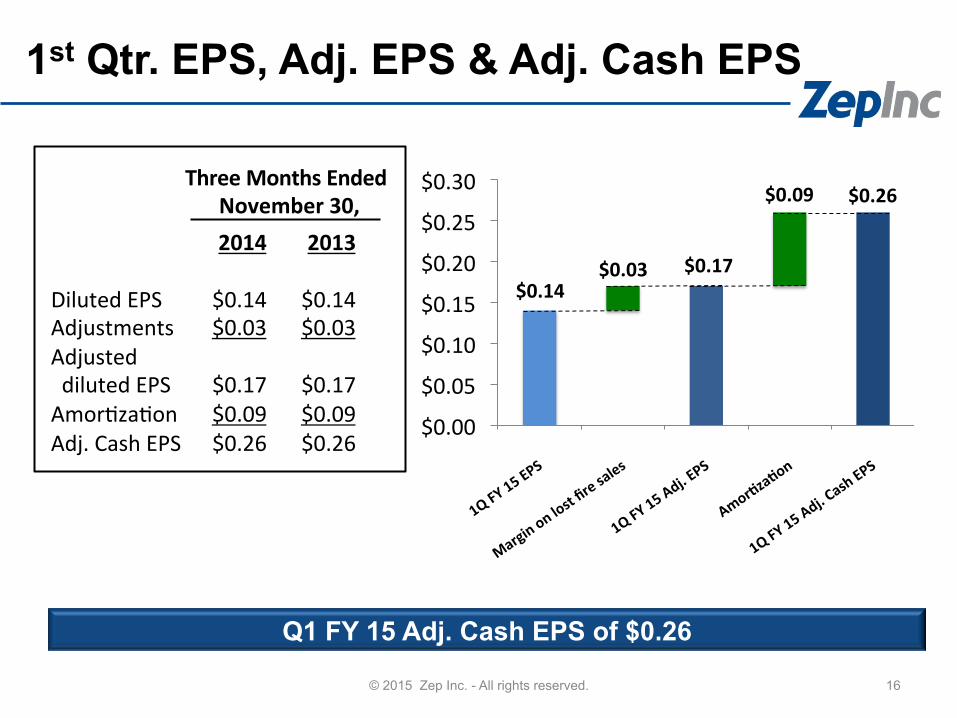
1st Qtr. EPS, Adj. EPS & Adj. Cash EPS
© 2015 Zep Inc. - All rights reserved.
$0.14 $0.17
$0.26
$0.03
$0.09
$0.00
$0.05
$0.10
$0.15
$0.20
$0.25
$0.30
Q1 FY 15 Adj. Cash EPS of $0.26
2014 2013 Diluted EPS $0.14 $0.14 Adjustments $0.03 $0.03 Adjusted diluted EPS $0.17 $0.17 Amor?za?on $0.09 $0.09 Adj. Cash EPS $0.26 $0.26
Three Months Ended November 30,

3.30x 3.06x 3.13x
4.50x
1Q FY14 4Q FY14 1Q FY15 Covenant
$204.7 $192.6 $198.5
1Q FY14 4Q FY14 1Q FY15
2.08x 2.22x 2.66x
1.25x
1Q FY14 4Q FY14 1Q FY15 Covenant
Fixed Charge
Coverage Ratio*
Debt to EBITDA*
Net Debt Position ($MM)
Covenants
Debt Position
17 © 2015 Zep Inc. - All rights reserved.
§ Temporarily higher inventories increased net debt position
* As defined by Zep Inc.’s Credit Facility
Inventory Reductions in 2H FY15 Will Generate Cash Flow

Insurance Recovery
§ Received $16.9 million to date as advance against property damage
§ Continue to have dialogue with insurance companies regarding business interruption portion of claim
18 © 2015 Zep Inc. - All rights reserved.
Insurance Claim Progressing as Expected

Fiscal 2015 Guidance
Item Expectation § Net Sales Low Single Digit Growth § Gross profit margin 46-48% § Selling, distribution & admin. (16-18% variable) 41-43% § Interest expense $6-$7 million § Capital expenditures
§ Normal rate $10 million § Restoration of aerosol capacity $15-20 million
§ Total $25-$30 million § Tax Rate 36-38%
19 © 2015 Zep Inc. - All rights reserved.
Questions and Answers
© 2015 Zep Inc. - All rights reserved.


