
Young people, alcohol and influencesA study of young people and their relationship with alcohol
Pamela Bremner, Jamie Burnett,Fay Nunney, Mohammed Ravat,Dr Willm MistralJune 2011
This report presents the findings from a major study of young people and their relationship with alcohol, and explores the wide range of influences on their drinking.
Where this study differs from other research is that it develops evidence of how different domains of influence work together, understanding their relative importance in tackling different patterns of drinking among different groups. The study involved a survey of 5,700 teenagers aged 13–14 (Year 9) and 15–16 (Year 11) in schools in England and data was statistically modelled using binary logistic regression to highlight the strongest influences on and predictors of young people’s drinking.
The report:
examines circumstances surrounding young people’s first time drinking, their current drinking patterns including levels of consumption, and their experiences of drunkenness; and
develops our understanding of what really influences young people’s drinking patterns by identifying the domains and indicators that have the strongest relationship with their behaviour.
www.jrf.org.uk


Contents
List of figures and tables 4
Executive summary 8
1 Introduction 14
2 Young people’s drinking patterns 22
3 Explaining the statistical modelling 60
4 The most important influences on different behaviours and groups 63
5 Conclusion and implications for policy and practice 79
Notes 83
References 86
List of appendices 89
Acknowledgements and About the authors 90

4 List of figures and tables
List of figures and tables
Figures
Has had an alcoholic drink by year group 241
Ten most frequently cited reasons for never having had an alcoholic drink by year group 242
Has had an alcoholic drink by year group by gender 253
Age when they had their first alcoholic drink by year group 254
Frequency of drinking by year group 325
When student last had an alcoholic drink by year group 336
Number of drinks consumed last time drinking by year group 347
Differences in the number of drinks consumed last time drinking by when the drinking took 8 place by year group 34
Location last time drinking by year group 359
Who student was with last time drinking by year group 3610
Source of alcohol last time drinking by year group (five most frequently cited responses) 3711
Types of drinks consumed in the last seven days by year group 4412
Drinks consumed in the last seven days as a percentage of all drinks consumed by year group 4513
Percentage of drinks consumed by day of the week by year group 4614
Number of units consumed by year group 4715
Extent of drunkenness by year group 5116
Age when first drunk by year group 5117
Intentionally getting drunk by year group 5218
Intentionally getting drunk by current drinking level by year group 5219

5List of figures and tables
Location last time drunk compared to location last time drinking (top five presented) 5420
Who students were with last time they were drunk compared to who they were with last 21 time drinking (top four listed) 55
Tables
Behaviours and different groups of interest 171
Main domains and influences measured 192
Drinking patterns and behaviours measured 193
Achieved sample: profile by year group 214
Demographic domain: Most significant bivariate relationship on likelihood of having had an 5 alcoholic drink is religion 26
Demographic domain: Second most significant bivariate relationship on likelihood of having 6 had an alcoholic drink is ethnicity 27
Individual domain: Most significant bivariate relationship on likelihood of having had an alcoholic 7 drink is ‘It’s ok to get drunk to see what it’s like’ 27
Individual domain: Second most significant bivariate relationship on likelihood of having had an 8 alcoholic drink is ‘It’s ok to try drinking alcohol to see what it’s like’ 28
Family domain: Most significant bivariate relationship on likelihood of having had an alcoholic 9 drink is seeing parents or carers drunk 28
Family domain: Second most significant bivariate relationship on likelihood of having had an 10 alcoholic drink is seeing older siblings drunk 29
Local context domain: The most significant bivariate relationship on likelihood of having had an 11 alcoholic drink is peer drinking 29
Local context domain: Second most significant bivariate relationship on likelihood of having had an 12 alcoholic drink is ease of access 30
Media and celebrity domain: Most significant bivariate relationship on likelihood of having had an 13 alcoholic drink is parental supervision of 18-rated films 30
Media and celebrity domain: Second most significant bivariate relationship on likelihood of 14 having had an alcoholic drink is time spent listening to music 31
Reliability of recall about when last drinking 3315
Differences in the location of last time drinking by when the drinking took place by year group 3616

6 List of figures and tables
Individual domain: Most significant bivariate relationship on likelihood of having had an alcoholic 17 drink in the previous week is the student’s perceived level of drinking compared to their peers 38
Individual domain: Second most significant bivariate relationship on likelihood of having had an 18 alcoholic drink in the previous week is ‘It’s ok to get drunk once a week’ 39
Family domain: Most significant bivariate relationship on likelihood of having had an alcoholic 19 drink in the previous week is parents knowing where their child is on a Saturday evening 39
Family domain: Second most significant bivariate relationship on likelihood of having had an 20 alcoholic drink in the previous week is seeing an older sibling drunk 40
Local context domain: Most significant bivariate relationship on likelihood of having had an 21 alcoholic drink in the previous week is the proportion of friends who drink 40
Local context domain: Second most significant bivariate relationship on likelihood of having 22 had an alcoholic drink in the previous week is the perceived ease of obtaining alcohol 41
Media and celebrity domain: Most significant bivariate relationship on likelihood of having had an 23 alcoholic drink in the previous week is parental supervision of 18-rated films 41
Drinking patterns: Most significant bivariate relationship on likelihood of having had an alcoholic 24 drink in the previous week is related to being drunk 42
Drinking patterns: Most significant bivariate relationship on likelihood of having had an alcoholic 25 drink in the previous week is the approximate number of drinks last consumed 42
Individual domain: Most significant bivariate relationship on likelihood of having consumed higher 26 volumes in the previous week is the student’s perceived level of drinking compared to peers 48
Individual domain: Second most significant bivariate relationship on likelihood of having consumed 27 higher volumes in the previous week is ‘It’s ok to get drunk once a week’ 48
Family domain: Most significant bivariate relationship on likelihood of having consumed higher 28 volumes in the previous week is the number of evenings they are permitted to spend with friends 49
Family domain: Second most significant bivariate relationship on likelihood of having consumed 29 higher volumes in the previous week is parents knowing where their child is on a Saturday night 49
Individual domain: Most significant bivariate relationship on likelihood of having been drunk on 30 more than one occasion is having seen their parent(s) drunk 56
Individual domain: Second most significant bivariate relationship on likelihood of having been 31 drunk on more than one occasion is parents knowing where children are on a Saturday evening 56
Individual domain: Most significant bivariate relationship on likelihood of having been drunk 32 more than once is the student’s perceived drinking compared to their peers 57
Influence of friends (1) 6533

7List of figures and tables
Influence of family members 6634
Influence of perceived drinking norms 7035
Influence of friends (2) 7036
Influence of family drinking 7137
Influence of friends (3) 7338
Frequency of drinking 7639

8 Executive summary
Executive summary
Background and objectives
The Joseph Rowntree Foundation (JRF) commissioned Ipsos MORI to carry out a study involving a survey of over 5,700 young people in school years 9 and 11 (with an age range of 13–15 years). The study gathered robust information on the students’ levels and patterns of drinking and detailed information on the wide range of influences on drinking. Where this study differs from other research is that it develops evidence of how different domains of influence work together, understanding their relative importance in tackling different patterns of drinking among different groups. The different domains are demographic characteristics, individual factors, family, local context, and media and celebrity. The groups of interest to the research are:
Model 1: Those who have consumed alcohol versus those who have not – this will provide greater understanding of the relative importance of influences on young people drinking alcohol.
Model 2: Those who have consumed alcohol in the previous week versus those who have consumed alcohol but not in the previous week – this will provide greater understanding of the relative importance of influences on current drinking.
Model 3: Those who have consumed higher volumes of alcohol in the preceding week versus those who have consumed lower volumes of alcohol in the preceding week – this will provide greater understanding of the relative importance of influences on excessive drinking.
Model 4: Those who have been drunk more than once versus those who have consumed alcohol but have been drunk once or never at all – this will provide greater understanding of the relative importance of influences on drunkenness.
Young people’s drinking patterns
How many young people drink alcohol?
The majority of students in years 9 and 11 have had an alcoholic drink (70 per cent and 89 per cent, respectively).1 Among year 9 students, there are clear gender differences, with girls significantly more likely than boys to have had an alcoholic drink; this gap closes by year 11. For the minority in both year groups who have not had an alcoholic drink, lack of interest in alcohol was the primary reason.
The majority of young people were aged ten and over when they had their first alcoholic drink, most commonly this took place around the age of twelve to thirteen. Around three-quarters of each year group reported being with an adult when they first had an alcoholic drink (77 per cent in year 9, 74 per cent in year 11). They were also likely to have been celebrating a special occasion at the time, such as a family or religious event.

9Executive summary
Different factors have strong bivariate relationships with whether or not young people have had an alcoholic drink, including their religion and ethnicity, their opinions on specific drinking norms, their family’s behaviour with alcohol, their friends’ behaviour with alcohol and their exposure to media.2
How often are young people drinking, with whom and where?
In terms of frequency of drinking, the proportion drinking regularly is significantly lower among year 9 than year 11 students. While almost half (47 per cent) of year 9 students drinks monthly and two in ten (20 per cent) drink weekly, this increases to around seven in ten (72 per cent) and almost four in ten (39 per cent), respectively, among year 11 students.
Almost a quarter of year 9 students had consumed alcohol in the week prior to the survey, increasing to almost half of year 11 students. The survey finds an increase in the number of drinks consumed between years 9 and 11. Around one-quarter of year 9 students are most likely to have had one or two drinks the last time they consumed alcohol. Around one-quarter of year 11 students say they had six or more drinks the last time they consumed alcohol. While both year groups are most likely to have been drinking at home the last time they consumed alcohol, this reduces as young people get older. Related to this, year 9 students are more likely to have been with parents or siblings when last drinking, whereas year 11 students are most likely to have been with friends. There is a link between young people drinking alcohol more recently (in the previous week) and showing more independence from the home and family when drinking. Young people who were not drinking at home, not drinking with family members and who were sourcing alcohol from friends were more likely to have been drinking alcohol in the previous week.
In terms of whether or not a young person is currently drinking, the most significant bivariate relationships are with specific opinions they hold on drinking norms, supervision and drinking behaviour within the family, peer behaviour with alcohol, easy access to alcohol, exposure to 18-rated films and musical preferences. The number of drinks consumed the last time they were drinking and whether they have ever been drunk have a strong relationship with current drinking behaviour.
What are young people drinking?
Detailed reporting of alcohol consumption by year 9 students shows that they are more likely to have been drinking alcopops in the last seven days. The second most frequently consumed drink is beer. By year 11, students are more likely to have been drinking beer, lager, spirits (or liqueurs). In both year groups, those drinking beer and lager consume a higher number of drinks than those drinking other types of alcohol.
In year 9, almost four in ten (39 per cent) students who had consumed alcohol in the preceding seven days consumed 7 units or more. In year 11, the same proportion consumed 14 units or more. For this research, these consumption levels are used to determine excessive drinking.
In terms of the influencing factors on whether or not a young person is an excessive drinker, the most significant bivariate relationships are with their region and ethnicity, their specific opinions on drinking norms, supervision in the family and their family’s drinking behaviour, who they were drinking with, ease with which they can obtain alcohol and their musical preferences. As regards drinking patterns, the most significant relationship with excessive drinking is buying alcohol in a shop.
Being drunk
Over half (54 per cent) of year 9 students who have had an alcoholic drink say they have been drunk; a relatively equal proportion say they have been drunk once as say they have been drunk more than once. By year 11, around four in five (79 per cent) students have been drunk, with over half (52 per cent) drunk
10 Executive summary
more than once. In many cases, getting drunk is intentional, with half of year 9 and two-thirds of year 11 students who drink saying that they and their friends sometimes drink to get drunk.
A range of different factors influence whether or not a young person has been drunk more than once. These include their year group and age, specific opinions on drinking norms, witnessing drinking behaviour in the family and parental supervision, their friends’ behaviour with alcohol, their ease of accessing alcohol, exposure to media and music preferences. A further key bivariate relationship is whether they bought their alcohol in a shop.
Developing our understanding of drinking patterns and behaviour
These findings address the first of this study’s research aims, providing robust data on the levels and patterns of drinking and collecting a range of information on influencers of drinking. This information provides insight but does not fully address the research aims. While we have established strong bivariate relationships within the various domains of influence, there is still no sense of how these factors relate to one another across the domains. The second research aim uses statistical modelling to establish the relative importance of these factors by establishing the strongest predictors of drinking among young people across all the domains.
The relative importance of influences
Model 1: The relative importance of influences on young people drinking
The experience of drinking alcohol is widespread among young people and there are a number of strong predictors of the likelihood of a young person having had an alcoholic drink emerging from across each of the different domains. The strongest predictor is the presence of drinking among friends.
The influence of family on this drinking behaviour is substantial and influences from within this domain outnumber those from other domains as a means of predicting whether or not a young person has had an alcoholic drink. The level of parental supervision has a strong influence on a young person’s behaviour. Family behaviours with alcohol, particularly perceptions of drunkenness among family members, also have strong influences on young people with those who have witnessed any level of family drinking and drunkenness more likely to have had an alcoholic drink than those who have not.
Perceived social norms about drinking also feature highly in this model. Young people who expect positive outcomes from drinking and who find a range of drinking habits acceptable for someone of their age, are also strong predictors of having had an alcoholic drink. Religion (typically shared by a family) and ethnicity are other key predictors of having had an alcoholic drink.
Model 2: The relative importance of influences on current drinking
The strongest predictor for ‘current drinking’ (consumed alcohol in the previous week) is the age of a young person when they first drink alcohol, however, there are inconsistencies in the relationship. Typically, the earlier a young person had their first drink, the more likely it is that they will have been drinking in the previous week. However, among the oldest students participating in the study, the reverse is true with those who started most recently being most likely to have been drinking in the previous week. The circumstance of their first time drinking is also a strong predictor of current drinking with those who were introduced to alcohol at a family celebration less likely to have been drinking in the previous week.
As with Model 1, a young person’s perceived social norms play a critical role on their behaviour with those expecting positive outcomes from drinking and finding a range of drinking behaviour acceptable more likely to be current drinkers. Witnessing the behaviour of others is, again, a critical indicator and having family members who are frequent drinkers remains a strong predictor of current

11Executive summary
drinking. The influence of friends in the local context is also strong. When most of a young person’s friends drink alcohol, as opposed to some or a few of their friends, this is a strong indicator of current drinking. Finding it easy to access alcohol is also a strong indicator of current drinking.
Model 3: The relative importance of influences on excessive drinking
Whilst, overall, the perceived positive outcome from drinking is the strongest individual predictor of current excessive drinking, the local context is dominant in this model.
The drinking behaviour of friends is a particularly strong influence and again, it is when most of a young person’s friends drink alcohol that this factor has its biggest influence. The amount of time spent with friends is also a strong influence. In many cases, simply spending multiple evenings with friends is the key; spending every evening with friends, however, is particularly influential. Recalling that the last time they were drinking was with friends also acts as a strong indicator, as does the source of the alcohol. That alcohol was bought or stolen by them or their friends and generally finding alcohol easy to obtain act as strong indicators of heavy drinking.
The locality of a young person also influences their likelihood to have been drinking excessively in the previous week. Drinking is more likely to be excessive among young people living in the south-east and Yorkshire and Humberside. Young people living in London and the South West are less likely to be drinking excessively.
Excessive current drinking is the only model where the family domain does not directly form one of the strongest indicators. However, parental supervision is reflected indirectly in relation to the amount of evenings a young person spends with friends.
Model 4: The relative importance of influences on drunkenness
Frequency of drinking is the strongest indicator of drunkenness with a clear linear relationship; the more frequently a young person drinks, they more likely it is that they will have been drunk more than once. Age also plays a particularly strong role. The likelihood of having been drunk more than once increases as age increases with the ages of 14 to 15 providing the critical turning point in behaviour. Those who had their first drink when they were extremely young (when 6 years old or younger) are most likely to have been drunk more than once.
The family is a key factor here, with the experience of having seen parents and older siblings drunk strong indicators of a young person’s behaviour. If young people had an adult present when they first drank alcohol, they are less likely to report having been drunk more than once. Friends impact on drunken behaviour, for example, those who were with friends the last time they consumed alcohol are more likely to have been drunk more than once, although the overall influence of friends is not quite as strong as in previous models.
Developing our understanding of the relative importance of factors
Looking across and within the domains, we can see how different influences come to the fore when analysing different behaviours. A number of factors identified as having strong bivariate relationships on drinking behaviour, when modelled and set in relative terms, continue to be strong indicators of behaviour; these factors include the influence of friends and family. However, some relationships are no longer a leading force on behaviour and diminish in strength, such as measures in the media-related domain where factors appear circumstantial rather than predictors of behaviour.
The strongest predictors of drinking behaviours have been identified and whilst some of these cannot be influenced, or in some cases cannot be influenced easily, a number of them can. Outcomes are not inevitable; the question now is how to use this knowledge and insight to effect positive change.

12 Executive summary
Conclusions and implications for policy and practice
Conclusions
Peer influence The perceived drinking behaviour of friends emerges from the analysis as one of the main factors associated with young people having drunk alcohol. The higher the perceived proportion of friends drinking alcohol, the more likely young people were to have been drinking alcohol in the previous week. Peer drinking behaviour also influences the amount that young people drink, with the likelihood of young people drinking heavily falling significantly when some/a few friends drink alcohol compared to those who say that all of their friends drink alcohol.
Family influence Parents strongly influence young people’s alcohol-related behaviour through supervision and monitoring, as well as playing a role in modelling this behaviour. Being with a parent suggests an element of supervision and monitoring, which can reduce the likelihood of drinking, frequent drinking and higher levels of alcohol consumption or drunkenness. Witnessing family behaviour with alcohol can have a negative influence when drinking behaviour is normalised in the home.
Attitudes and expectations The perceived social norms surrounding alcohol have a strong link to a range of alcohol-related behaviours. Young people are more likely to exhibit a range of behaviours with alcohol if they believe that it is acceptable to act that way. Positive expectations, specifically the expectations that drinking will be fun and make you happy, increase the likelihood of a young person drinking. Conversely, negative associations, including a fear that you will not be able to stop drinking or will be sick, decrease the likelihood of drinking.
Looking across the different behaviours and groups of interest to the study, findings suggest that it is direct personal experience that has the strongest influence on behaviour. Personally knowing people who drink, who drink frequently and who get drunk are key predictors of a young person’s behaviour with alcohol. Their friends play a critical role, however, acting as a direct and indirect influence is a young person’s family. Parent behaviour has a particularly strong influence ranging from the point at which alcohol is introduced, a young person’s exposure to adult drinking and drunkenness, to the amount of supervision that is placed on a young person as they gain independence.
It can be argued that these findings predict that a young person is more likely to drink, to drink frequently and to drink to excess if:
They receive less supervision from a parent or other close adult.
They have friends who drink or if they spend multiple evenings a week with friends.
They are exposed to a close family member, especially a parent, drinking or getting drunk.
They have positive attitudes towards and expectations of alcohol.
They have very easy access to alcohol.
It can be argued that findings point towards critical points in a young person’s relationship with alcohol where a carefully timed intervention could steer a young person towards a positive outcome. A good example of this is their introduction to alcohol; findings reveal that parental introduction of alcohol to their child too early can have a negative outcome and yet there are dangers in the parent not introducing

13Executive summary
alcohol and leaving their child to explore alcohol in more harmful surroundings. Not introducing their child to alcohol can also lead to negative outcomes.
Implications for policy and practice: recommendations
This research shows that whilst it is not inevitable that young people will drink, there appears to be little benefit at this point in time in policy aiming to prevent young people from trying alcohol or encouraging an alcohol-free childhood. Instead, policy should seek to prevent immediate and long-term harm to young people from alcohol. These findings show this can be done by focusing on the strongest predictors of current, excessive and risky drinking that can be influenced. The new alcohol strategy offers the opportunity to set out a strong central policy direction and send out a set of clear messages to parents, local policy-makers and frontline services.
National policy must focus on the strongest predictors that can be influenced. This research shows that parental influence is of paramount importance. The findings suggest that efforts to improve drinking behaviour among young people are best directed at supporting and educating parents. This should include positive messages for parents about how they can influence their child’s behaviour and stress the importance of parent’s own drinking behaviours and how they are observed or perceived by their children.
Friends are another key area of influence. Schools could help by adopting a social-norms approach to education whereby they challenge incorrect perceptions about the regularity and scale of heavy drinking by peer groups and in doing so positively impact young people’s drinking behaviour. Schools could also provide a channel for information, offering the opportunity to disseminate targeted messages to parents that encourage actions at specific times in their child’s development.
Access to alcohol is important and messages to parents will need to emphasise that the most common place for alcohol to be accessed is in the home, showing that how they store alcohol and, critically, how they monitor its use, are important. Young people who buy their own alcohol are the ones most likely to be harmful drinkers; consequently, controlling the price of alcohol and enforcing licensing policy with a focus on reducing underage sales could prevent harmful drinking.
Local policy around young people’s drinking should build on local needs and be in line with a nationally set direction. Support services and guidance for parents and families developed locally should incorporate clear messages about the importance of parental drinking behaviour, access to alcohol at home, parental supervision and encouraging young people into positive activities. It is also important to highlight what the research shows to be key predictors outside of the home that parents can still have influence over, such as the frequency with which a young person spends their evenings with friends and whether their parents know where they are on a Saturday evening. This approach should be incorporated into relevant provision.
Schools can use their unique role in the community to give timely provision of information to parents throughout their child’s life. Joined-up approaches between police, licensing departments and Children’s Services could also help those with riskier drinking behaviour such as taking action on underage sales and proxy sales of alcohol.
Frontline services have a vital role to play by delivering these key messages to parents via midwifery and health visiting services, parenting programmes, family interventions, schools and youth services.

14 Introduction
1 Introduction
Background
Prevalence of alcohol use
In recent years, increasing alcohol consumption and related harm and disorder involving young people generally, and those aged under 18 years in particular, have become significant problems in the UK.
In 2003, a British Medical Association report Adolescent Health (BMA, 2003) showed UK adolescents having among the highest European levels of alcohol use, binge drinking and drunkenness. This was supported by the 2007 European School Survey Project on Alcohol and other Drugs (Hibell, et al., 2009).
In 2008, the mean amount of alcohol consumed by young people aged 11–15 who had drunk in the previous week was 14.6 units. Boys drank more than girls and older pupils more than younger ones (Fuller, 2009).
There is evidence, however, of a polarisation of drinking patterns among young people. The proportion of 11–15-year-olds who drink regularly fell from 28 per cent in 2001 to 21 per cent in 2006 (DCSF, et al., 2008); and a survey of 8,000 young people aged 11–15 showed those who had never drunk alcohol increased from 39 per cent in 2003 to 48 per cent in 2008 (Fuller, 2009). The Youth Alcohol Action Plan (DCSF, et al., 2008) reported differences in consumption patterns between girls and boys in England, with 47 per cent of 15-year-old girls having been drunk in the previous week compared with 37 per cent of boys.
In summary, whereas a large proportion of young people in the UK has consumed alcohol, the percentage appears to be decreasing. Whilst this can be construed as encouraging, it is set against a worrying situation in terms of increased consumption among those who are drinking.
Influences on drinking behaviour
Several studies have set out to explore what influences young people and their use of alcohol. A review of the literature, conducted as part of this research, reveals numerous factors that have been associated with use of alcohol among young people, including the following.
Family influencesPractices in different families as to how much young people are permitted to drink appear to vary greatly (DCSF, et al., 2008). Some parents provide alcohol in the home and for drinking elsewhere and children tend to follow parents’ consumption example. With parents who never drink, 10 per cent of children drink regularly; with parents who drink at least three times a week, 31 per cent of children drink frequently (Harrington, 2000). Fuller (2009) reports that of 11–15-year-olds who drank 15 or more units in the previous week, 45 per cent claimed to have been given alcohol by their parents, whilst 40 per cent took it without consent.
Dalton, et al. (2005) showed that pre-school children playacting as adults had well-established expectations that they would purchase alcohol for use in social situations. It seemed clear that these expectations were linked to observations of adult, especially parental, behaviour. Also, older siblings’

15Introduction
desire to use and their actual use are predictors of younger siblings’ later relationship to alcohol (Velleman, 2009).
Research also indicates increased early initiation into drinking and intoxication in one-parent families (e.g. Hellandsjo Bu, et al., 2002; Duncan, et al., 2006). Seljamo, et al. (2006) found a child’s permanent separation from at least one biological parent to be the strongest socio-demographic predictor of a 15-year-old drinking. It may be, however, that it is not the structural factors per se that cause problems, but that they reduce exposure to or influence of some of the more positive relational aspects (Velleman, 2009).
Monitoring and supervisionLedoux, et al. (2002), from data on 1,174 boys and 1,110 girls in France and 1,280 boys and 1,361 girls in the UK, showed that the strongest predictor of heavier use of alcohol and other drugs was parents not knowing young people’s whereabouts on Saturday evenings. More than a decade of surveys in the USA (CASA, 2004–2009) show consistently that the more often children (aged 12–17) eat dinner with their family, the less likely they are to drink alcohol, smoke or misuse drugs. McVie and Bradshaw (2005) found that non-users had significantly greater parental supervision and substance misuse was highly associated with leisure pursuits away from parents and increased peer influence.
A number of family factors are associated with reduced alcohol use by adolescents:
responsive and supportive parenting;
child management practices involving clear, consistent and enforced rules;
parental modelling of appropriate alcohol use;
clear and open communication of expectations about alcohol use and potential disapproval when expectations are unmet;
higher family cohesion, levels of family bonding and family cooperation; and
satisfactory child-parent relationships and children wanting to emulate parents (Velleman, 2009).
Ease of access Although under 18-year-olds cannot legally buy alcohol in the UK, it appears to be relatively easy for young people to purchase. A Home Office report (2006) suggests that around 13 per cent of 10–15-year-olds who have drunk alcohol in the past year have been successful in buying it from a shop and 11 per cent from a bar or a pub, although off-licences and supermarkets remain the most important sources of alcohol, especially for 14–15-year-olds (SHEU, 2007).
Peer influencePeers become important as adolescents develop an identity apart from the family and learn social behaviours important in young adulthood. Drinking initiation and excessive consumption are influenced by:
exposure to pro-drinking peers and adults, and weak bonds with conventional social institutions (Martino, et al., 2006);
perceptions of friends’ acceptance of heavy drinking (Donovan, et al., 2004; Simons-Morton, 2004).

16 Introduction
However, parental involvement can continue to play an important role, even when faced with growing peer influences (Nash, et al., 2005; Wood, et al., 2004; Wood, 2007). In a survey of over 600 girls aged 10–25 (Girlguiding UK, 2008), although 72 per cent said female friends had the greatest influence on their views, 63 per cent reported parents and families had the next greatest impact.
Advertising, marketing, celebrity endorsementSince 2002, young people in the UK have been exposed to fewer alcohol commercials on television. However, young people are likely to say that adverts make alcohol look appealing and will encourage people to drink (Ipsos MORI, 2007). A review of seven international studies (Smith and Foxcroft, 2007) demonstrated an association between exposure to alcohol advertising and marketing and drinking behaviour in young people. Young people are influenced by television and magazine commercials, films, music videos and celebrities who explicitly or implicitly convey positive associations with alcohol (Christenson, et al., 2000; Roberts, et al., 1999, 2002). Dalton, et al. (2006) suggest that parental rules and monitoring of children’s movie viewing may have a protective influence on children’s risk for drinking.
Antisocial behavioursA number of factors can be both outcome and risk factor for alcohol-related problems. These include antisocial behaviour at either school or at home, truancy, delinquency and association with drink- or drug-using peers or those behaving in ways defined as antisocial (Velleman, 2009).
Academic achievementPoor integration into school, poor academic achievement and low educational aspirations are associated with substance-using behaviour (e.g. Crum, et al., 2006), although substance use may be a symptom, rather than a cause, of poor academic adjustment and educational failure (Bachman, et al., 2008).
DemographicsAge matters: through adolescence, the odds of recently having drunk alcohol increase with each year. Gender also plays its part. Although boys tended to drink more than girls, by the age of 15, girls were more likely to have been drunk on three or more occasions in the previous two weeks.
In north-west England, Hughes, et al. (2008) found a higher percentage of binge and frequent drinkers were male, but a higher percentage of drinkers in public places were female. Hughes, et al. also found a pattern among young risky drinkers: they were typically aged 16, had a weekly income and were not involved with a hobby, sports team or club. Of further regional significance, pupils in Yorkshire and the Humber had increased odds of having drunk alcohol in the previous week, compared with pupils in London and other regions (Information Centre for Health and Social Care, 2009).
All minority ethnic groups are less likely to have drunk alcohol than those who describe themselves as white (Fuller, 2009). The personal importance of religion is found to be inversely related to alcohol use (Pedersen and Kolstad, 2000; Abbott-Chapman and Denholm, 2001; Regnerus and Elder, 2003).
Fuller (2009) found that pupils whose homes had at least one shelf of books had around half the odds of having drunk alcohol in the previous week compared with those who had no books at home (a proxy indicator of social class), but receipt of free school meals, an indicator of low income, was not associated with drinking in the previous week.
Identifying the main influences on behaviour
As shown above, there has been a lot of previous research noting levels and patterns of risky drinking by young people and factors that influence these behaviours. Data analyses in these previous studies, however, have tended to focus on specific influences in isolation or on the relationship between two or three different factors that influence engagement in risky behaviours in relation to alcohol.

17Introduction
As a result, whilst these factors have been identified as those that may influence behaviour, their level of influence is unknown because we do not understand how all the factors relate to one another. It is not clear from previous studies which factors have the most influence on behaviour.
The present study is the first in the UK to analyse the relative importance of, and the relationship between, a wide range of factors that may influence young people’s alcohol-related behaviours.
Research aims
This research aims to develop the evidence base in two key areas:
To provide nationally robust data on the levels and patterns of drinking and, importantly, detailed 1 information on the wide range of influences on young people’s drinking.
The research not only collects comprehensive data on levels and patterns of drinking but also places it in context by analysing this behaviour in relation to the various influences on a young person.
To develop evidence of how different domains of influence work together, understanding their relative 2 importance in tackling different patterns of drinking among different groups of young people.
The research looks across the various domains and influences to remove overlapping and consequential outcomes and expose the most important drivers of a young person’s behaviour.
This second aim refers to ‘different groups’. Given the complexities of youth drinking, it is essential that the research extends beyond simply considering what influences young people to drink alcohol. Whilst this is an important issue, it is only part of the problem. The research aims to address several layers of drinking behaviour and develop evidence that will directly address each of these behaviours. In meeting this second aim, the research aims to develop evidence of how different domains of influence work together for the following groups (see Table 1).
Table 1: Behaviours and different groups of interest
Behaviours Different groups of interest
To understand the relative importance of influences on young people drinking alcohol
Those who have never consumed alcohol versus those who have consumed alcohol
To understand the relative importance of influences on current drinking
Those who have consumed alcohol in the previous week versus those who have consumed alcohol but not in the previous week
To understand the relative importance of influences on excessive drinking
Those who have drunk higher volumes of alcohol in the preceding week versus those who have consumed lower volumes of alcohol in the preceding week
To understand the relative importance of influences on drunkenness
Those who have been drunk more than once versus those who have either been drunk once or have never been drunk
18 Introduction
Methodology
The research comprises four stages:
A scoping phase with a literature review.This stage comprised a scan of the most recent relevant research and pre-existing literature reviews, the aim being to generate the optimum set of indicators to be collected in the survey in terms of their value and policy relevance. The literature review, produced as a separate document, presents a list of key survey indicators that formed the basis of the questionnaire development work.1 The scope of the study was also refined in this stage, including final decisions on research design and analysis methods.
Questionnaire development with cognitive testing.The literature review was used as the basis of questionnaire coverage. Two rounds of cognitive interviews were conducted, each with a cross-section of six year 9 and six year 11 students (24 interviews in total), to help test and refine the questionnaire.
A survey of over 5,000 young people in school years 9 and 11 in England.2
All fieldwork was administered through interviewer-supervised self-completion sessions in class groups in school. During the classroom session, Ipsos MORI interviewers explained the survey process to students, reassuring them of confidentiality, distributed a questionnaire to each student in the classroom, remained present to answer queries or provide assistance and collected the completed questionnaires at the end of the classroom session.
Data analysis and statistical modelling.Following data processing, a rigorous process of data analysis and statistical modelling took place for each of the different drinking behaviours and groups of interest, looking across the various significant influences to identify the factors that have the strongest influence on different drinking behaviours.3 This report presents the main findings of the statistical modelling. For further details of the modelling outcomes and supporting information, please see the supporting Technical Document.
Key considerations
Progressing from the literature review to the questionnaireCritical to the success of the research are decisions about which ‘influencers’ should be measured. Following the literature review, and with consideration of all the factors identified by previous studies as those that may influence behaviour, the research team, in consultation with a JRF Project Advisory Group, identified the main domains of influence on young people’s drinking behaviours. Within these domains, the team identified the key factors, or indicators, that influence behaviour. This framework was used to develop a self-completion questionnaire and, as such, includes only quantifiable factors suitable to this data collection format.
The main domains of influence and associated indicators measured in this study were agreed as follows (see Table 2).
It was equally critical to measure the most appropriate drinking patterns and behaviour. With consideration of the findings from the literature review, in terms of key behaviours, and mindful of the research aims, the following are measured in this study (see Table 3).

19Introduction
Table 2: Main domains and influences measured
Main domains of influence Key indicators of influence
1 Demographic characteristics GenderAgeSocio-economicVulnerabilityReligionEthnicity
2 Individual factors Well-being Self-efficacyConfidence and self-esteemViews of schoolPositive feelings about the futureActivities in spare time
Problem behaviour TruancyExclusion from schoolPerceptions of acceptable behaviour relating to alcohol
Values Personal motivators for drinking/not drinking
3 Family factors Family structureCohesionSupervision/controlSupportFamily and alcohol (exposure to family behaviour/norms as perceived by the young person)
4 Local context Peer influence Time spent with friendsFriends and alcohol (exposure to friends’ behaviour/norms as perceived by the young person)
Availability of alcohol Source of alcoholEase of access
5 Media and celebrity Exposure to key media channels
TVFilmMusic
Celebrities Role models
Table 3: Drinking patterns and behaviours measured
Drinking patterns and behaviour Key indicators
First time drinking Has drunk alcoholAge first consumed alcoholCircumstances around first time drinking
Current behaviour Frequency of drinkingConsumption levelCircumstances of last time drinking
Drunkenness Has been drunkAge first time drunkEstablish if drunk on multiple occasionsCircumstances of last time drunk

20 Introduction
In the supporting Technical Document, Appendix 1 presents the question numbers corresponding to each of the key indicators and Appendix 2 presents the questionnaire.
Defining the sampleMany of the studies identified in the literature review include young people aged 11–15. For this research, to include all age groups within the target sample size of 5,000 would have meant that for the more extreme behaviours of interest (excessive drinking and drunkenness), the lower prevalence of that behaviour within each age group would result in sub-samples too small to conduct meaningful analysis. This was particularly the case at the lower end of the age spectrum. Notwithstanding, it was vital that our sample represented more than one age group, so as to identify different behaviours at different ages. It was agreed that this research would instead focus on two year groups: young people in school years 9 and 11.
A total of 5,785 self-completed questionnaires were completed by a representative sample of year 9 and year 11 students in schools in England. Fieldwork was conducted between 9 February and 22 May 2009. Table 4 presents an overview of the achieved sample. For further details of the sampling process and sample profile, see Appendix 3 in the supporting Technical Document.
Structure of this report
This report presents the key findings from the research and comprises the following chapters:
Chapter 2 contributes to research aim one, presenting an overview of the students’ drinking patterns. This descriptive chapter examines circumstances surrounding their first time drinking, their current drinking behaviour including levels of consumption and their experiences of drunkenness. The chapter develops understanding by also identifying the influencing factors that have the most significant bivariate relationship with their behaviour.
Chapter 3 links research aims one and two, explaining the purpose of the statistical modelling. The modelling determines how the different influences work together and how we establish which of the influences are most important. The chapter explains how to understand and interpret the modelling work.
Chapter 4 contributes to research aim two, presenting the key findings from the statistical modelling. This important chapter develops our understanding of what really drives young people’s drinking behaviour by identifying the domains and indicators that have the strongest relationship with their behaviour. Findings are presented for each of the drinking behaviours and different groups of interest individually and, therefore, identify the strongest influences for each level of drinking.
Chapter 5 draws conclusions on research findings and presents recommendations to policy-makers and practitioners on what predictors of drinking should be targeted.
Precision of estimates
Data presented in this report is from a sample of students in years 9 and 11, rather than a census of students and, as such, is subject to sampling error. Appendix 4 in the supporting Technical Document details the standard errors and design effects for key survey estimates.
Differences between young people are commented upon in the text only if they are significant at the 95 per cent confidence level. This means there is no more than a 5 per cent chance that any reported difference is not real but a consequence of sampling error.

21Introduction
Table 4: Achieved sample: profile by year group4 Year 9 Year 11
Unweighted Weighted Unweighted Weighted
Base sizeN
3,327N
3,327N
2,458N
2,458
% % % %
Gender MaleFemale
5049
5049
4950
5049
Age 13141516
4752
00
4752
00
00
4751
00
4653
Ethnicity5 WhiteBlackAsianMixedOther
786942
795942
882541
844641
Disability YesNo
196
196
296
296
Learning difficulty YesNo
984
985
790
889
Religion ChristianMuslimJewish BuddhistSikhHinduOtherNone
407**222
44
407**212
44
4031*112
48
4141*112
48
Free school meals YesNo
1286
1187
890
1188
School type StateIndependent
973
937
9010
919
* represents a value below 0.5%

22 Young people’s drinking patterns
2 Young people’s drinking patterns
Key findings
First experiences of drinking alcohol
The majority of students has had an alcoholic drink. For the minority who has not had an alcoholic drink, lack of interest in alcohol is the primary reason. The majority of students was aged ten or over for the first alcoholic drink; most were with an adult at the time and celebrating a special occasion.
The most significant bivariate relationships with this behaviour are with the student’s religion and ethnicity, their opinions on specific drinking norms, their family and friends’ behaviour with alcohol and their exposure to media.
Most recent drinking behaviour
Almost half of year 9 students says they drink monthly and two in ten drink weekly. By year 11, this increases to around seven in ten drinking monthly and almost four in ten drinking weekly.
Around one-quarter of year 9 students is likely to have had one or two drinks the last time drinking; the same proportion of year 11 students says to have had six or more drinks. Students are more likely to have been drinking at home, with year 9 students more likely to have been with family and year 11 students with friends.
The most significant bivariate relationships with this behaviour are opinions on drinking norms, family supervision, family and peers’ drinking behaviour, access to alcohol, exposure to 18-rated films and specific musical preferences.
Alcohol consumption over the previous seven days
Analysis of drinking over the past seven days shows that year 9 students are more likely to have been drinking alcopops or beer, whilst year 11 students are more likely to have been drinking beer, lager or spirits (or liqueurs). Almost four in ten year 9 students who had been drinking consumed 7 units or more over the previous seven days. In year 11, the same proportion consumed 14 units or more.
The most significant bivariate relationships with excessive drinking behaviour are region and ethnicity, opinions on drinking norms, supervision in the family, the family’s drinking behaviour, with whom students were drinking, access to alcohol, musical preferences and having bought alcohol in a shop.
Being drunk
Over half of year 9 students who have had an alcoholic drink say they have been drunk; this increases to around four in five with year 11 students. In many cases, getting drunk is intentional.
The most significant bivariate relationships with being drunk more than once are year group and age, opinions on drinking norms, family and friends’ drinking behaviour, parental supervision, access to alcohol, exposure to media, music preferences and having bought alcohol in a shop.
23Young people’s drinking patterns
Introduction
This chapter presents the drinking patterns of our student sample. The chapter starts with a discussion on whether the students have ever had an alcoholic drink and for those who have not, presents their reasons for this. The majority of the chapter involves those who have had an alcoholic drink, discussing the circumstances of their drinking: their first time drinking alcohol, their most recent drinking experience, including the amount and type of alcohol consumed, and their experience of being drunk.
For each of these drinking circumstances, we first present simple frequency counts for the results of the survey, showing differences in behaviour by year group. The chapter then develops our understanding by introducing factors that appear to influence behaviour. Within each domain of influence, the key bivariate relationships between the drinking behaviour and the various influencing factors are identified and discussed. It is not claimed at this stage that these key bivariate relationships are those that most influence the students, simply that there is a particularly strong bivariate relationship between behaviour and identified factor. After discussing the findings for each drinking circumstance or behaviour, a short summary of findings is presented.
The chapter concludes by summarising what we can understand from this analysis and considers how this can be further developed.
Bivariate analysis
Throughout this chapter, references are made to bivariate relationships. Bivariate analysis is the analysis of a relationship between two variables, for example, whether or not a young person has ever had an alcoholic drink and a factor such as their ethnicity.
This analysis helps improve our understanding of young people and their drinking patterns by introducing the effects that individual factors may have on their behaviour. Bivariate analysis in this chapter looks for a relationship between the student’s behaviour and each individual influencing factor, independent of one another.
First experiences of alcohol
Whether or not a young person has consumed alcohol
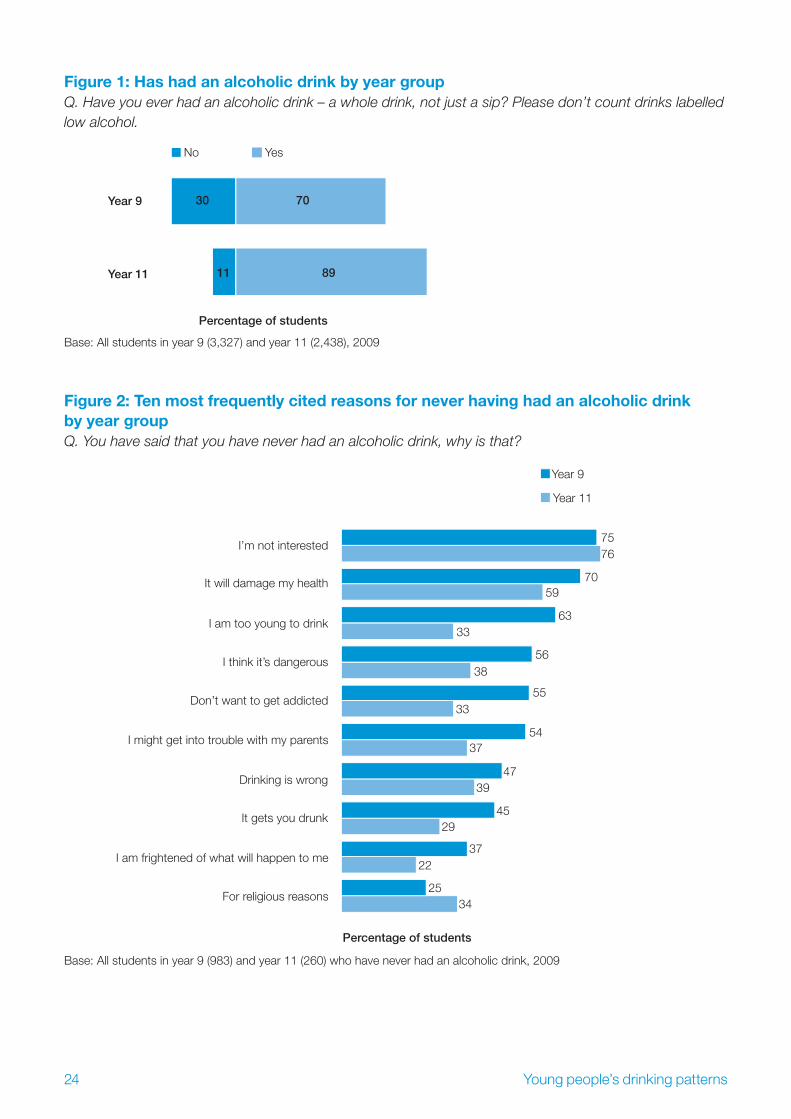
A minority of students say that they have not had an alcoholic drink, that is, having a whole drink, not just a sip of alcohol. As shown in Figure 1, in year 9, three in ten students (30 per cent) say they have never had an alcoholic drink; among year 11 students, this decreases to around one in ten (11 per cent).
Of those in year 9 who have never had an alcoholic drink, 75 per cent say that they are simply ‘not interested’ in drinking alcohol, 70 per cent feel that drinking ‘will damage their health’, 63 per cent feel they are ‘too young to drink’, 56 per cent that ‘it is too dangerous’, 55 per cent say they ‘don’t want to get addicted’ and 54 per cent think it ‘might get them into trouble with their parents’.
As shown in Figure 2, a similar proportion of year 11 students who have never had an alcoholic drink cite not being interested as their reason (76 per cent). Among the other reasons given, whilst the range of reasons is similar to those given by year 9 students, much smaller proportions give these same reasons for not drinking. Furthermore, of non-drinkers in year 11, only one in three (33 per cent) states being ‘too young to drink’ (compared to almost two in three, i.e. 63 per cent, in year 9).
24 Young people’s drinking patterns
Figure 1: Has had an alcoholic drink by year groupQ. Have you ever had an alcoholic drink – a whole drink, not just a sip? Please don’t count drinks labelled low alcohol.
Percentage of students
YesNo
Year 9
Year 11
30 70
11 89
Base: All students in year 9 (3,327) and year 11 (2,438), 2009
Figure 2: Ten most frequently cited reasons for never having had an alcoholic drink by year group Q. You have said that you have never had an alcoholic drink, why is that?
Year 9
Year 11
Percentage of students
I’m not interested
It will damage my health
I am too young to drink
I think it’s dangerous
Don’t want to get addicted
I might get into trouble with my parents
Drinking is wrong
It gets you drunk
I am frightened of what will happen to me
For religious reasons
7576
7059
6333
5638
5533
5437
4739
4529
3722
2534
Base: All students in year 9 (983) and year 11 (260) who have never had an alcoholic drink, 2009

25Young people’s drinking patterns
Figure 3: Has had an alcoholic drink by year group by genderQ. Have you ever had an alcoholic drink – a whole drink, not just a sip? Please don’t count drinks labelled low alcohol.
Year 9
Year 11
Percentage of students
73
Girls
Boys
68
89
89
Base: All female students in year 9 (1,629) and year 11 (1,238), and all male students in year 9 (1,671) and year 11 (1,198), 2009
Seven in ten students (70 per cent) in year 9 say they have had an alcoholic drink, that is, a whole drink, not just a sip.1 The proportion is significantly higher among girls in this year group than boys (73 per cent compared to 68 per cent). In year 11, the proportion having had an alcoholic drink increases to almost nine in ten (89 per cent); however, by this stage, there is no difference between boys and girls (see Figure 3).
First time drinking alcohol: age
Among both year 9 and year 11 students who have had an alcoholic drink, the majority was aged 10 or over when they had their first alcoholic drink. In year 9, the most frequent response was 12 years and in year 11 it was 13 years. As shown in Figure 4, the distribution of ages for first time drinking is broadly similar across the year groups.
Figure 4: Age when they had their first alcoholic drink by year groupQ. How old were you when you had your first alcoholic drink?
Year 9
Year 11
Per
cent
age
of
stud
ents
Age
30
25
20
15
10
5
0
unde
r 5 5 6 7 8 9 10 11 12 13 14 15 16
Base: All students in year 9 (2,344) and year 11 (2,198) who have had an alcoholic drink, 2009

26 Young people’s drinking patterns
First time drinking alcohol: circumstances
In the majority of cases, students reported that an adult was present the first time they had an alcoholic drink,2 around three-quarters were in the company of an adult (77 per cent of year 9 students and 74 per cent of year 11 students).
In order to understand further the context of their first experience of drinking alcohol, the students were asked if they were celebrating a special family or religious event at the time, for example, a birthday, wedding or baptism. Almost seven in ten (68 per cent) students in year 9 and around six in ten (61 per cent) students in year 11 say they were celebrating when they had their first alcoholic drink.
Key bivariate relationships relating to a young person having had an alcoholic drink
This bivariate analysis looks for a relationship between a young person having had an alcoholic drink and each factor influencing this behaviour.
Significant relationships exist between most of the influencing factors and drinking behaviour – this is expected due to the factors having been explicitly selected because they were identified as influential in the literature review.3 Rather than list all bivariate relationships that exist, this section presents the two influencing factors in each domain that have the most significant relationship with the likelihood of having had an alcoholic drink.4
Domain: Demographic factorsBivariate analysis reveals that of all the demographic characteristics included in the study, religion and ethnicity have the most significant relationships with the likelihood that a young person has had an alcoholic drink.
1 ReligionStudents with no religion are significantly more likely to have had an alcoholic drink than those with a religion.
Interpreting Table 5, we find that in year 9, 81 per cent of those with no religion have had an alcoholic drink compared to 62 per cent of those with a religion. The gap reduces by year 11 but it is still significant: 94 per cent of year 11 students with no religion have had an alcoholic drink compared to 84 per cent with a religion.
Looking at religious affiliation, those of Christian faith are much more likely to have had an alcoholic drink than those of Muslim faith; students who are Muslim are least likely to have had an alcoholic drink.
Table 5: Demographic domain: Most significant bivariate relationship on likelihood of having had an alcoholic drink is religion Q. Have you ever had an alcoholic drink – a whole drink, not just a sip? Please don’t count drinks labelled low alcohol.
ReligionYear 9 Year 11
Yes%
No%
Yes%
No%
No religion 81 19 94 6
Any religion 62 38 84 16
Christian 71 29 91 9
Muslim 13 87 26 74
Base: All students in year 9 (3,327) and year 11 (2,458), 2009

27Young people’s drinking patterns
Table 6: Demographic domain: Second most significant bivariate relationship on likelihood of having had an alcoholic drink is ethnicityQ. Have you ever had an alcoholic drink – a whole drink, not just a sip? Please don’t count drinks labelled low alcohol.
EthnicityYear 9 Year 11
Yes%
No%
Yes%
No%
White 78 22 93 7
Mixed 67 33 86 14
Black 48 52 78 22
Other 44 56 67 33
Asian 27 73 37 63
Base: All students in year 9 (3,327) and year 11 (2,458), 2009
2 Ethnicity As shown in Table 6, students of White ethnicity are significantly more likely than those of other ethnic groups to have had an alcoholic drink: 78 per cent in year 9 rising to 93 per cent in year 11.5 Asian students are significantly less likely than those of other ethnicities to have had an alcoholic drink.6
We understand that it is extremely likely that it is the Muslims within the Asian category who are least likely to have had an alcoholic drink – there is in an overlap between religion and ethnicity that bivariate analysis implies but cannot confirm. We will take this overlap into account later in the statistical modelling.
Domain: Individual factorsA young person’s perceived acceptability of certain drinking behaviours is related to the likelihood of them having had an alcoholic drink. The two most significant bivariate relationships with the likelihood of a young person having had an alcoholic drink are whether they consider it acceptable for someone of their age (1) to get drunk to see what it is like and (2) to try alcohol to see what it is like.
Overall, in year 9, only 28 per cent of students think it is acceptable to get drunk to see what it is like; 1 this increases to 63 per cent in year 11. As shown in Table 7, those who do consider it acceptable for someone of their age to get drunk are significantly more likely to have had an alcoholic drink than those who find this behaviour unacceptable.
Table 7: Individual domain: Most significant bivariate relationship on likelihood of having had an alcoholic drink is ‘It’s ok to get drunk to see what it’s like’ Q. Have you ever had an alcoholic drink – a whole drink, not just a sip? Please don’t count drinks labelled low alcohol.
For someone of my age to get drunk to see what it’s like is…
Year 9 Year 11
Yes%
No%
Yes%
No%
OK 80 20 93 7
Not OK 34 66 37 63
Base: All students in year 9 (3,327) and year 11 (2,458), 2009

28 Young people’s drinking patterns
Table 8: Individual domain: Second most significant bivariate relationship on likelihood of having had an alcoholic drink is ‘It’s ok to try drinking alcohol to see what it’s like’Q. Have you ever had an alcoholic drink – a whole drink, not just a sip? Please don’t count drinks labelled low alcohol.
For someone of my age to try drinking alcohol to see what it’s like is…
Year 9 Year 11
Yes%
No%
Yes%
No%
OK 80 20 93 7
Not OK 34 66 37 63
Base: All students in year 9 (3,327) and year 11 (2,458), 2009
Whilst overall, the majority of students agree that for someone of their age, ‘it is ok to try drinking 2 alcohol to see what it is like’ (75 per cent in year 9 and 90 per cent in year 11), and agreement with this statement is relatively high even among those who have not had an alcoholic drink, this variable generates the second most significant bivariate relationship on likelihood to have had a drink. As shown in Table 8, those who believe it is acceptable to try alcohol are significantly more likely to have had an alcoholic drink than those who do not think it acceptable.
Domain: Family factorsBivariate analysis reveals that whether a young person believes they have seen their parents or their older siblings drunk has a particularly significant relationship with the likelihood of a young person having had an alcoholic drink.
Parental drunkenness Overall, 64 per cent of those in year 9 and 73 per cent of those in year 11 say they have seen their parents drunk. As shown in Table 9, there is a significant relationship between whether a young person believes they have seen their parents drunk and the likelihood of them having had an alcoholic drink. The relationship appears linear in terms of the frequency of witnessing their parent’s behaviour but there are different effects depending on the age of the student.
Among year 9 students, there is a difference in the relationship between behaviour and frequency of having seen their parents drunk: year 9 students are more likely to have had an alcoholic drink if they have seen their parents drunk lots of times, compared to a few times/once or twice. Among year 11 students, frequency appears not to play a role: year 11 students are just as likely to have had an alcoholic drink whether they have seen their parents drunk lots of times or a few times once or twice. Year 11 students are also more likely than year 9 students to have had an alcoholic drink even if they have never seen their parents drunk.
Table 9: Family domain: Most significant bivariate relationship on likelihood of having had an alcoholic drink is seeing parents or carers drunkQ. Have you ever had an alcoholic drink – a whole drink, not just a sip? Please don’t count drinks labelled low alcohol.
Frequency of seeing parents drunk
Year 9 Year 11
Yes%
No%
Yes%
No%
Lots of times 90 10 96 4
A few times/once or twice 82 18 95 5
Never 46 54 72 28
Base: All students in year 9 (3,327) and year 11 (2,458), 2009

29Young people’s drinking patterns
Table 10: Family domain: Second most significant bivariate relationship on likelihood of having had an alcoholic drink is seeing older siblings drunkQ. Have you ever had an alcoholic drink – a whole drink, not just a sip? Please don’t count drinks labelled low alcohol.
Frequency of seeing older siblings drunk
Year 9 Year 11
Yes%
No%
Yes%
No%
Lots of times 94 6 97 3
A few times/once or twice 87 13 95 5
Never 51 49 70 30
Base: All students in year 9 (3,327) and year 11 (2,458), 2009
Older sibling drunkenness Overall, 35 per cent of all year 9 students and 46 per cent of all year 11 students say they have seen an older brother or sister drunk. As regards the influence this may have on the student, a similar pattern to that of parents is evident, as shown in Table 10. In this instance, however, whilst across both year groups students are significantly more likely to have had an alcoholic drink if they have seen an older sibling drunk than if they have not, they are also more likely than not to have had a drink regardless of witnessing this behaviour (though the difference is minimal for year 9 students).
Domain: Local contextBivariate analysis reveals that the number of friends who drink alcohol and the ease with which the students can get alcohol have particularly significant relationships with the likelihood of them having had an alcoholic drink.
Number of friends who drink alcohol Overall, 72 per cent of year 9 students and 94 per cent of year 11 students say they have at least a few friends who drink alcohol. Across both year groups, bivariate analysis suggests that the larger the proportion of friends who drink alcohol, the more likely it is that the students will have had an alcoholic drink themselves (see Table 11).
Table 11: Local context domain: The most significant bivariate relationship on likelihood of having had an alcoholic drink is peer drinkingQ. Have you ever had an alcoholic drink – a whole drink, not just a sip? Please don’t count drinks labelled low alcohol.
Proportion of friends who drink alcohol
Year 9 Year 11
Yes%
No%
Yes%
No%
All/almost all 93 7 95 5
Some/a few 77 23 79 21
None 26 74 38 62
Base: All students in year 9 (3,327) and year 11 (2,458), 2009

30 Young people’s drinking patterns
Table 12: Local context domain: Second most significant bivariate relationship on likelihood of having had an alcoholic drink is ease of accessQ. Have you ever had an alcoholic drink – a whole drink, not just a sip? Please don’t count drinks labelled low alcohol.
Getting access to alcohol is…Year 9 Year 11
Yes%
No%
Yes%
No%
Easy 84 16 93 7
Difficult 63 37 85 15
Base: All students in year 9 (3,327) and year 11 (2,458), 2009
Ease of getting alcohol Overall, 50 per cent of year 9 students and 76 per cent of year 11 students say that if they wanted to get alcohol, it would be easy. Students who say that getting alcohol is easy are significantly more likely to have had an alcoholic drink than those who say that it is difficult – particularly those in year 9. However, even among those who say that it is difficult, the majority has still consumed alcohol, as shown in Table 12.
Domain: Media and celebrityBivariate analysis reveals that parental supervision of 18-rated films and the amount of time spent listening to music have particularly significant relationships with the likelihood of a young person having had an alcoholic drink.
Parental supervision of 18-rated films In this domain, this factor generates by far the most significant bivariate relationship with the likelihood that a young person has had an alcoholic drink. Students whose parents exercise more control over their film viewing are significantly less likely to have had an alcoholic drink than those who are able to watch whatever they choose. As shown in Table 13, students who say that they have not had an alcoholic drink are more likely to say that their parents only let them watch films rated 18 if they are with them or do not let them watch films rated 18 at all.
Table 13: Media and celebrity domain: Most significant bivariate relationship on likelihood of having had an alcoholic drink is parental supervision of 18-rated films Q. Have you ever had an alcoholic drink – a whole drink, not just a sip? Please don’t count drinks labelled low alcohol.
Parents allow them to watch 18-rated films…
Year 9 Year 11
Yes%
No%
Yes%
No%
On their own/with friends 85 15 93 7
They don’t know what I watch 70 30 72 28
Only if they are with me 65 35 74 26
Never 49 51 88 12
Base: All students in year 9 (3,327) and year 11 (2,458), 2009

31Young people’s drinking patterns
Table 14: Media and celebrity domain: Second most significant bivariate relationship on likelihood of having had an alcoholic drink is time spent listening to musicQ. Have you ever had an alcoholic drink – a whole drink, not just a sip? Please don’t count drinks labelled low alcohol.
Hours spent listening to music on a typical weekday
Year 9 Year 11
Yes%
No%
Yes%
No%
7+ 82 18 93 7
6 82 18 90 10
5 75 25 94 6
4 77 23 87 13
3 72 28 89 11
2 68 32 87 13
1 or less 58 42 79 21
None 36 64 82 18
Base: All students in year 9 (3,327) and year 11 (2,458), 2009
Time young people spend listening to music Those who spend longer hours listening to music on a typical weekday are much more likely to have had an alcoholic drink than those who listen to very little or no music at all, as shown in Table 14. As with the most significant bivariate relationship in this domain (18-rated films), the pattern appears stronger for year 9 students.
Summary: First experiences of drinking alcohol
The majority of students in years 9 and 11 have had an alcoholic drink (70 per cent and 89 per cent respectively). Among year 9 students there are clear gender differences, with girls significantly more likely than boys to have had an alcoholic drink; this gap closes by year 11. For the minority in both year groups who have not had an alcoholic drink, lack of interest in alcohol was the primary reason.
The majority of young people were aged ten or over when they had their first alcoholic drink, most commonly this took place around the ages of 12–13. Around three-quarters of each year group reported being with an adult when they first had an alcoholic drink (77 per cent year 9; 74 per cent year 11). They were also likely to have been celebrating a special occasion at the time, such as a family or religious event.
In terms of the influencing factors on whether or not a young person has ever had an alcoholic drink, the most significant bivariate relationships are with the student’s religion and ethnicity, their opinions on specific drinking norms, their family and friends’ behaviour with alcohol and their exposure to media.
N.B. For the remainder of this chapter, analysis only includes those who have had an alcoholic drink.
Most recent drinking behaviour
Frequency of drinking
Students who have had an alcoholic drink were asked how often they usually drink alcohol. This can be a difficult question for young people to answer as it requires recall and some degree of identifiable pattern in their drinking; however, even with these limitations, it does provide insight into how frequently they think they are drinking.
32 Young people’s drinking patterns
Figure 5: Frequency of drinking by year groupQ. How often do you USUALLY have an alcoholic drink?
Year 9
Year 11
Only on special
occasions
A few times a
year
About once a month
About once a
fortnight
About once a week
About twice a week
Every day or almost every day
29
13
17
1114 14 13
19
10
20
8
16
13
Per
cent
age
of
stud
ents
Base: All students in year 9 (2,344) and year 11 (2,198) who have had an alcoholic drink, 2009
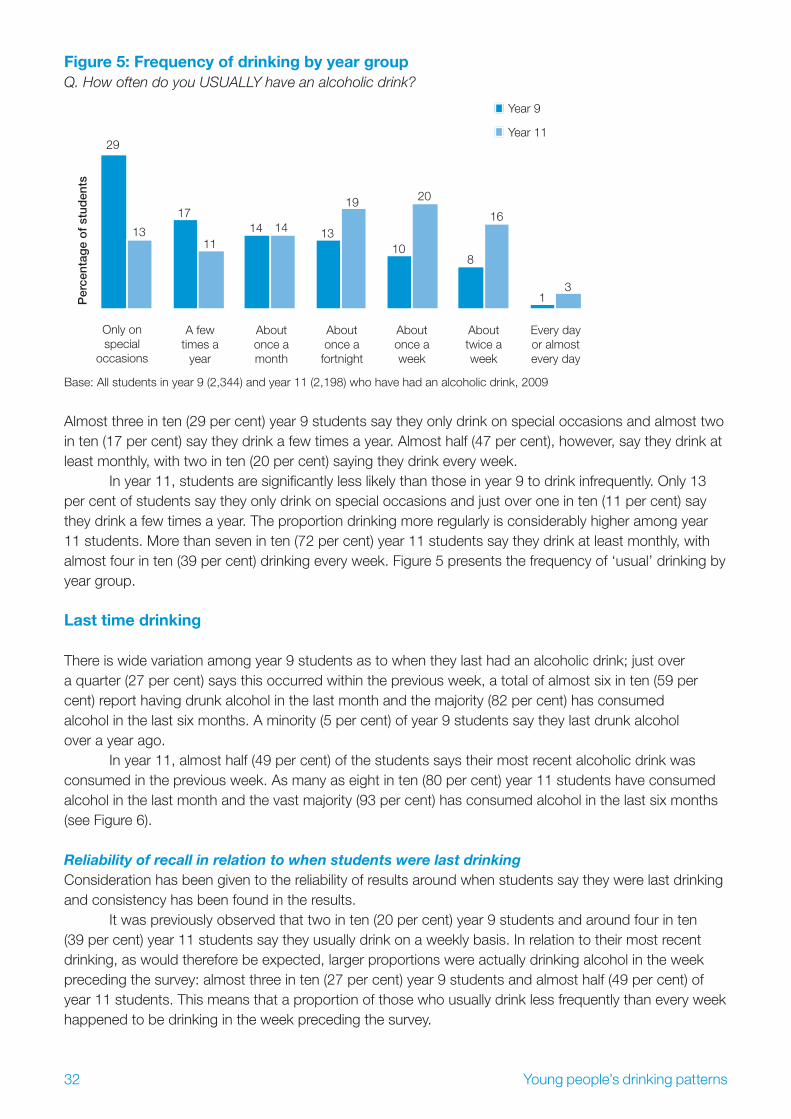
Almost three in ten (29 per cent) year 9 students say they only drink on special occasions and almost two in ten (17 per cent) say they drink a few times a year. Almost half (47 per cent), however, say they drink at least monthly, with two in ten (20 per cent) saying they drink every week.
In year 11, students are significantly less likely than those in year 9 to drink infrequently. Only 13 per cent of students say they only drink on special occasions and just over one in ten (11 per cent) say they drink a few times a year. The proportion drinking more regularly is considerably higher among year 11 students. More than seven in ten (72 per cent) year 11 students say they drink at least monthly, with almost four in ten (39 per cent) drinking every week. Figure 5 presents the frequency of ‘usual’ drinking by year group.
Last time drinking
There is wide variation among year 9 students as to when they last had an alcoholic drink; just over a quarter (27 per cent) says this occurred within the previous week, a total of almost six in ten (59 per cent) report having drunk alcohol in the last month and the majority (82 per cent) has consumed alcohol in the last six months. A minority (5 per cent) of year 9 students say they last drunk alcohol over a year ago.
In year 11, almost half (49 per cent) of the students says their most recent alcoholic drink was consumed in the previous week. As many as eight in ten (80 per cent) year 11 students have consumed alcohol in the last month and the vast majority (93 per cent) has consumed alcohol in the last six months (see Figure 6).
Reliability of recall in relation to when students were last drinking Consideration has been given to the reliability of results around when students say they were last drinking and consistency has been found in the results.
It was previously observed that two in ten (20 per cent) year 9 students and around four in ten (39 per cent) year 11 students say they usually drink on a weekly basis. In relation to their most recent drinking, as would therefore be expected, larger proportions were actually drinking alcohol in the week preceding the survey: almost three in ten (27 per cent) year 9 students and almost half (49 per cent) of year 11 students. This means that a proportion of those who usually drink less frequently than every week happened to be drinking in the week preceding the survey.

33Young people’s drinking patterns
Figure 6: When student last had an alcoholic drink by year groupQ. When did you last have an alcoholic drink?
In the last week
2–3 weeks
ago
1 month ago
2 months ago
3–6 months
ago
7–12 months
ago
Over a year ago
Per
cent
age
of
stud
ents
Year 9
Year 11
Don’t know
Notstated
27
49
2022
129
117
12
6 62
52
62 1 1
Base: All students in year 9 (2,344) and year 11 (2,198) who have had an alcoholic drink, 2009
Furthermore, students were asked explicitly at a later point in the questionnaire if they had consumed alcohol in the last seven days. Responses to this question are broadly consistent with those given in relation to when they last had an alcoholic drink, as shown in Table 15.
The distinction of whether or not drinking took place ‘in the last week’ is important to this research. Drinking ‘in the last week’ is used as a proxy for current drinking, which is a key behaviour of interest to the research and is used in the statistical modelling. Consequently, in addition to looking at the overall patterns of behaviour the last time our student sample was drinking, the following analysis also considers differences between those who have and those who have not reported drinking in the previous week.
Number of drinks consumed last time drinking
To approximate the amount of alcohol young people consumed the last time they were drinking, students were asked how many drinks they consumed.
Year 9 students are most likely to say they had either one (26 per cent) or two (21 per cent) drinks the last time they drank alcohol. In contrast, in year 11, students have much higher consumption levels. Whilst approximately one-third had one or two drinks (16 per cent and 18 per cent, respectively), as many as one-quarter (25 per cent) say they had six or more drinks. Figure 7 presents the number of drinks students say they consumed the last time they were drinking.
Table 15: Reliability of recall about when last drinking
Year 9 Year 11
% %
Q. When did you last have an alcoholic drink?ALL ANSWERING ‘IN THE LAST WEEK’
27 49
Q. Have you had an alcoholic drink in the last 7 days? ALL ANSWERING ‘YES’
30 49
Base: All students in year 9 (2,344) and year 11 (2,198) who have had an alcoholic drink, 2009

34 Young people’s drinking patterns
Figure 7: Number of drinks consumed last time drinking by year groupQ. Thinking about the LAST TIME you were drinking alcohol, approximately how many drinks did you have? Please count any whole drinks such as glasses, bottles or cans, rather than sips.
Less than a whole drink
1 drink 2 drinks 3 drinks 4 drinks 5 drinks 6 or more drinks
Don’t know
Notstated
11
4
26
16
21
18
12 13
7
10
5
8
11
25
6 5
1 1
Year 9
Year 11
Per
cent
age
of
stud
ents
Base: All students in year 9 (2,344) and year 11 (2,198) who have had an alcoholic drink, 2009
Figure 8: Differences in the number of drinks consumed last time drinking by when the drinking took place by year groupQ. Thinking about the LAST TIME you were drinking alcohol, approximately how many drinks did you have? Please count any whole drinks such as glasses, bottles or cans, rather than sips.
Percentage of students
Year 9HAS NOT had an alcoholic drink
in the last week
Year 9HAS had an alcoholic drink in the last week
Less than a whole drink
1 drink
2 drinks
6 or more drinks
12 7
2228
22 18
7 22
Percentage of students
Year 11HAS NOT had an alcoholic drink
in the last 7 days
Year 11HAS had an alcoholic drink in the last 7 days
6 3
18 14
23 35
Less than a whole drink
2 drinks
6 or more drinks
Base: All students in year 9 (2,344) and year 11 (2,198) who have had an alcoholic drink, 2009

35Young people’s drinking patterns
Further analysis reveals significant differences between the number of drinks consumed the last time the student was drinking based on whether or not this drinking had occurred in the previous week.
As shown in Figure 8, students in year 9 who had not consumed alcohol in the previous week are significantly more likely to have had a smaller number of drinks the last time they were drinking. In year 11, students who had consumed alcohol in the previous week are significantly more likely to have consumed a larger number of drinks. Only amounts generating significant differences are presented in Figure 8.
Location of last time drinking
Students are most likely to say that they were at home the last time they were drinking alcohol; year 9 students are especially likely to say this (43 per cent compared to 34 per cent of year 11 students). Year 9 students are also more likely than year 11 students to have been at a relative’s home (13 per cent compared to 9 per cent in year 11).
Findings suggest that as young people get older, they are much more likely to drink away from their own homes or the homes of their family. Almost twice as many year 11 students than year 9 students drank alcohol at a friend’s home when they were last drinking (23 per cent compared to 13 per cent). A sizeable minority in both year groups says that the last time they drank alcohol, they did so outside (15 per cent of year 9 and 17 per cent of year 11 students). The location of last time drinking is presented in Figure 9.
Figure 9: Location last time drinking by year groupQ. The LAST TIME you were drinking alcohol, where were you?
2016
80
Year 9
Year 11
One place
More than one place
Home
Friend my age or younger’s home
Older friend’s home
Outside
Somewhere else
Bar or pub
Relative’s home
Neighbour’s…home
Disco or club
Restaurant
Not stated
Don’t know
Percentage of students
79
4334
1323
9131517
99
511
139
7456
44
2
21
Base: All students in year 9 (2,344) and year 11 (2,198) who have had an alcoholic drink, 2009

36 Young people’s drinking patterns
Table 16: Differences in the location of last time drinking by when the drinking took place by year groupQ. The LAST TIME you were drinking alcohol, where were you?
Location
Year 9Had been drinking last week
Year 11Had been drinking last week
Yes%
No%
Yes%
No%
Outside (e.g. in the street, in a park, on the beach or other open area)
25 11 21 13
At an older friend’s or older boyfriend/girlfriend’s home
14 8 15 11
In a bar or pub – – 15 8
In a disco or club – – 8 5
Base: All students in year 9 (2,344) and year 11 (2,198) who have had an alcoholic drink, 2009
Figure 9 also shows that approximately eight in ten students (80 per cent in year 9 and 79 per cent in year 11) say the last time they were drinking, they drank in only one location. This means that a sizeable minority did drink in multiple locations, moving from place to place as they were drinking; almost one in six year 9 students (16 per cent), increasing to one in five year 11 students (20 per cent), were drinking in more than one location.
Students in both year groups who had been drinking in the previous week are significantly more likely than those who had not been drinking in the previous week to have been drinking outside or at the home of an older friend or boyfriend/girlfriend. Year 11 students are also significantly more likely to have been drinking in a pub or club than those who had not – Table 16 presents these significant differences.
Who young people were with last time drinking
Reflecting the differences in where the students were when they were last drinking, there are differences in who the students were with, as shown in Figure 10.
Around half of year 9 students (51 per cent) say they were with at least one parent last time they were drinking alcohol. Around half (49 per cent) were with a friend or boyfriend/girlfriend. Year 11 students are much more likely to have been drinking with their peers than their parents. Overall, just over two-thirds (67 per cent) were with a friend or boyfriend/girlfriend last time they were drinking whereas just over a third (34 per cent) were with at least one of their parents.
Figure 10: Who student was with last time drinking by year groupQ. The LAST TIME you were drinking alcohol, who were you with?
67
23
34
49
36
51
Friend
Parent
Sibling
Year 9
Year 11
Percentage of students
Base: All students in year 9 (2,344) and year 11 (2,198) who have had an alcoholic drink, 2009

37Young people’s drinking patterns
We have established that students in both year groups who had been drinking in the previous week were significantly more likely to have been outside or at an older friend’s house when this drinking took place than those who had not been drinking the previous week. It is no surprise, therefore, to find that students who drank in the previous week were also more likely to have been with friends and less likely to have been with their family.
Source of alcohol last time drinking
As may be expected, due to the fact that many were at home and in the company of a parent the last time they were drinking, almost half (46 per cent) of year 9 students says that it was their parents who gave them the alcohol. Around one in five (21 per cent) says they were given the alcohol by an adult relative or another adult. Fewer, although still a sizeable proportion, say a friend or boyfriend/girlfriend gave them the alcohol: around one in seven (15 per cent) were given alcohol by a friend their age or younger, the same proportion by an older friend (14 per cent). Around one in eight (13 per cent) year 9 students say they bought alcohol in a shop.
Despite differences between the year groups in terms of location and company, year 11 students are still most likely to say that it was their parents who gave them the alcohol (38 per cent). Compared to year 9 students, however, larger proportions of year 11 students are obtaining alcohol from sources other than their parents. Around one in five obtained alcohol from friends (21 per cent say a friend their age or younger and 19 per cent say an older friend). Almost one in five (18 per cent) year 11 students says they bought alcohol in a shop. Figure 11 presents the five most frequently cited sources of alcohol the last time students were drinking.
The last time they were drinking, the students were often obtaining alcohol from more than one source; almost four in ten (38 per cent) of year 9 students and almost half (46 per cent) of year 11 students say that more than one person or source provided them with alcohol.
Students in both year groups who had been drinking in the previous week are significantly more likely than those who had not been drinking to have bought their alcohol or asked someone to buy it for them. Furthermore, year 9 students who had been drinking in the previous week are also significantly more likely to have consumed stolen alcohol than those who had not been drinking. These students were most likely to have stolen the alcohol from their parents.
Figure 11: Source of alcohol last time drinking by year group (five most frequently cited responses)Q. The LAST TIME you were drinking alcohol, where did you get it?
Parent
Adult/relative other adult
Same age or younger friend
Older friend
Bought it in a shop
38
46
2118
15
21
1419
1318
Year 9
Year 11
Percentage of students
Base: All students in year 9 (2,344) and year 11 (2,198) who have had an alcoholic drink, 2009

38 Young people’s drinking patterns
Key bivariate relationships relating to a young person’s most recent drinking patterns
All the students in this section have had an alcoholic drink; what we have been examining is their most recent drinking behaviour. In addition, we have sought to understand the differences in behaviour between those who had consumed alcohol in the previous week – our current drinkers – with the behaviour of those who had consumed alcohol but not in the previous week. It has been established that there are different patterns in behaviour between the two groups; for example, those who were drinking in the previous week were more likely to have consumed larger amounts and more likely to have been in an unsupervised environment than those who had not been drinking in the previous week.
In the following bivariate analysis, attention is focused solely on better understanding the influences that may exist between those who had and those who had not been drinking in the previous week.
This section presents the influencing factors in each domain that have the most significant relationship with the likelihood of having had an alcoholic drink in the previous week.7
Domain: Demographic factorsBivariate analysis reveals that of all the demographic characteristics included in the research, year group has the most significant relationship with the likelihood that a young person has been drinking in the previous week.
Year group As previously discussed and illustrated in Figure 5, students in year 11 are significantly more likely to have been drinking in the previous week than students in year 9 (49 per cent compared to 27 per cent in year 9) and it is this year group factor that has the most significant demographic relationship with the likelihood of drinking in the previous week.
Domain: Individual factorsA young person’s perceptions about drinking norms among their peers are related to the likelihood of them having had an alcoholic drink in the previous week. The two most significant bivariate relationships with the likelihood of a young person having had an alcoholic drink in the previous week are how they believe their level of drinking compares to their friends and their attitude to regularly getting drunk.
Level of drinking compared to their friends In both year groups, students who believe that they drink more than most people their age are significantly more likely to have been drinking in the previous week. Table 17 presents the results by year group.
Table 17: Individual domain: Most significant bivariate relationship on likelihood of having had an alcoholic drink in the previous week is the student’s perceived level of drinking compared to their peers Q. When did you last have an alcoholic drink?
Perceived level of drinking compared to other people their age
Year 9 Year 11
Last week
%
Before last week
%
Last week
%
Before last week
%
Drinks more than most 74 26 82 18
Drinks around the same amount 42 58 69 31
Drinks less than most 20 80 35 65
Base: All students who have had an alcoholic drink in year 9 (3,327) and year 11 (2,458), 2009

39Young people’s drinking patterns
Table 18: Individual domain: Second most significant bivariate relationship on likelihood of having had an alcoholic drink in the previous week is ‘It’s ok to get drunk once a week’Q. When did you last have an alcoholic drink?
Someone my age gets drunk once a week is…
Year 9 Year 11
Last week
%
Before last week
%
Last week
%
Before last week
%
OK 55 45 69 31
Not OK 21 79 36 64
Base: All students who have had an alcoholic drink in year 9 (3,327) and year 11 (2,458), 2009
It is acceptable to get drunk once a week In both year groups, students who think it is acceptable to get drunk once a week are significantly more likely to have been drinking in the previous week. Volume of drinking is not considered at this stage. Table 18 presents the results by year group.
Domain: Family factorsParents knowing where their child is on a Saturday night (a measure of parental supervision) and having seen an older sibling drunk have particularly significant relationships with the likelihood of a young person having had an alcoholic drink in the previous week.
Parents knowing where the student is on a Saturday eveningThe patterns in the relationship between parents knowing where their child is on a Saturday evening and their child having been drinking in the previous week are presented in Table 19. The findings show a linear relationship between the frequency of knowing where they are and their likelihood not to have been drinking recently. As knowledge improves, the likelihood that the student was drinking in the previous week reduces.
Table 19: Family domain: Most significant bivariate relationship on likelihood of having had an alcoholic drink in the previous week is parents knowing where their child is on a Saturday eveningQ. When did you last have an alcoholic drink?
Parents know where their child is on a Saturday evening
Year 9 Year 11
Last week
%
Before last week
%
Last week
%
Before last week
%
Almost always 18 82 41 59
Often 29 71 46 54
Sometimes 33 67 55 45
Not often 50 50 59 41
Almost never 58 42 69 31
Base: All students who have had an alcoholic drink in year 9 (3,327) and year 11 (2,458), 2009

40 Young people’s drinking patterns
Table 20: Family domain: Second most significant bivariate relationship on likelihood of having had an alcoholic drink in the previous week is seeing an older sibling drunkQ. When did you last have an alcoholic drink?
Has seen an older sibling drunk
Year 9 Year 11
Last week
%
Before last week
%
Last week
%
Before last week
%
Lots of times 44 56 66 33
A few times/once or twice 30 70 49 50
Never 18 82 28 72
Base: All students who have had an alcoholic drink in year 9 (3,327) and year 11 (2,458), 2009
Seeing an older sibling drunk Among both year 9 and year 11 students, there is a linear relationship between frequency of having seen an older sibling drunk and the likelihood that a young person would have drunk alcohol in the previous week. Among year 9 students, over two-fifths (44 per cent) who say that they have seen siblings drunk lots of times have been drinking in the previous week compared to 30 per cent who say they have seen this a few times/once or twice and 18 per cent who have never seen an older sibling drunk. The pattern among year 11 students is similar (66 per cent of those who have seen older siblings drunk lots of times have drunk alcohol in the previous week, falling to 49 per cent who say a few times/once or twice and 28 per cent who say never). The findings are presented in Table 20.
Domain: Local contextBivariate analysis reveals that the drinking behaviour of peers and the ease of obtaining alcohol have significant relationships with the likelihood of a young person having had an alcoholic drink in the previous week.
Amount of friends drinking alcohol As shown in Table 21, students who say that all/most of their friends drink alcohol are significantly more likely to have been drinking alcohol in the previous week than those who say that fewer of their friends drink alcohol (either some or none). In year 9 just under half (47 per cent) and in year 11 over half (56 per cent) of students who say all/most of their friends drink alcohol have had an alcoholic drink in the previous week, compared to 18 per cent and 27 per cent, respectively, who say some/a few friends drink alcohol.
Table 21: Local context domain: Most significant bivariate relationship on likelihood of having had an alcoholic drink in the previous week is the proportion of friends who drinkQ. When did you last have an alcoholic drink?
Proportion of friends who drink
Year 9 Year 11
Last week
%
Before last week
%
Last week
%
Before last week
%
All/almost all 47 53 56 44
Some/a few 18 82 27 73
None 9 91 10 90
Base: All students who have had an alcoholic drink in year 9 (3,327) and year 11 (2,458), 2009

41Young people’s drinking patterns
Table 22: Local context domain: Second most significant bivariate relationship on likelihood of having had an alcoholic drink in the previous week is the perceived ease of obtaining alcoholQ. When did you last have an alcoholic drink?
Ease of obtaining alcohol
Year 9 Year 11
Last week
%
Before last week
%
Last week
%
Before last week
%
Easy 35 75 54 46
Not easy 15 85 32 68
Base: All students who have had an alcoholic drink in year 9 (3,327) and year 11 (2,458), 2009
Access: ease of obtaining alcohol In both year groups, students who say that getting alcohol is easy are more likely to have been drinking in the previous week than those who say it is not easy, as shown in Table 22.
Domain: Media and celebrityBivariate analysis reveals that parental supervision of 18-rated films and listening to drum and bass have particularly significant relationships with the likelihood of a young person having had an alcoholic drink in the previous week.
Parental supervision of 18-rated films There is a linear relationship between parental control over 18-rated films and drinking in the previous week. Students who are not permitted to watch 18-rated films are significantly less likely to have been drinking in the previous week than those who are allowed to watch them or those who say their parents do not know what they are watching. Table 23 presents the results.
Listening to drum and bass Those who listen to drum and bass are more likely to have been drinking than those who do not usually listen to this style of music.
Table 23: Media and celebrity domain: Most significant bivariate relationship on likelihood of having had an alcoholic drink in the previous week is parental supervision of 18-rated filmsQ. When did you last have an alcoholic drink?
Parental supervision of films
Year 9 Year 11
Last week
%
Before last week
%
Last week
%
Before last week
%
Do not let me watch films rated 18 14 86 26 74
Let me watch films rated 18 but only if they are with me 22 78 28 72
Do not know what films I’m watching 28 72 49 51
Let me watch films rated 18 on my own or with friends 33 67 52 48
Base: All students who have had an alcoholic drink in year 9 (3,327) and year 11 (2,458), 2009

42 Young people’s drinking patterns
Table 24: Drinking patterns: Most significant bivariate relationship on likelihood of having had an alcoholic drink in the previous week is related to being drunkQ. When did you last have an alcoholic drink?
Have you ever been drunk?
Year 9 Year 11
Last week
%
Before last week
%
Last week
%
Before last week
%
Yes, more than once 49 51 65 35
Yes, once 29 71 39 61
Never 14 86 21 79
Base: All students who have had an alcoholic drink in year 9 (3,327) and year 11 (2,458), 2009
Domain: Drinking patternsBivariate analysis reveals that when a young person usually drinks has a particularly significant relationship with the likelihood of a young person having had an alcoholic drink in the previous week. This finding is somewhat self-explanatory and so we look beyond the most significant relationship to gain insight. The next strongest relationships are whether the student has been drunk and the number of drinks consumed the last time they were drinking.
Whether the student has been drunk Table 24 shows the bivariate relationship between drunkenness and drinking in the following week. Students are more likely to have been drinking the previous week if they have been drunk before, even more so if they have been drunk on multiple occasions. This, of course, mirrors the individual-domain finding in relation to accepting regular drunken behaviour as the norm for people of their own age (see Table 18).
Approximate number of drinks consumed last time drinking For both year groups, Table 25 shows that the heavier the level of drinking, the more likely it is that students were drinking in the previous week.
Table 25: Drinking patterns: Most significant bivariate relationship on likelihood of having had an alcoholic drink in the previous week is the approximate number of drinks last consumedQ. When did you last have an alcoholic drink?
Number of drinks consumed
Year 9 Year 11
Last week
%
Before last week
%
Last week
%
Before last week
%
Less than a whole drink 17 83 24 76
1 drink 22 78 43 57
2 drinks 23 77 38 62
3 drinks 29 71 46 54
4 drinks 33 67 46 54
5 drinks 42 58 52 48
6 or more drinks 53 47 66 34
Base: All students who have had an alcoholic drink in year 9 (3,327) and year 11 (2,458), 2009

43Young people’s drinking patterns
Summary: Most recent drinking behaviour
In terms of frequency of drinking, the proportion drinking regularly is significantly lower among year 9 than year 11 students. Whilst almost half (47 per cent) of year 9 students drinks monthly and two in ten (20 per cent) drink weekly, this increases to around seven in ten (72 per cent) drinking monthly and almost four in ten (39 per cent) drinking weekly among year 11 students. Almost a quarter of year 9 students had consumed alcohol in the week prior to the survey, increasing to almost half of year 11 students. The survey finds an increase in the number of drinks consumed between year 9 and year 11. Around one-quarter of year 9 students is more likely to have had one or two drinks the last time they consumed alcohol. Around one-quarter of year 11 students says to have drunk six or more drinks the last time they consumed alcohol.
Whilst both year groups are more likely to have been drinking at home the last time they consumed alcohol, this reduces as young people get older. Related to this, year 9 students are more likely to have been with parents or siblings when last drinking, whereas year 11 students are more likely to have been with friends. There is a link between young people drinking alcohol more recently (in the previous week) and showing more independence from the home and family when drinking. Young people who were not at home, not drinking with family members and who were sourcing alcohol from friends are more likely to have been drinking alcohol in the previous week.
In terms of whether or not a young person is currently drinking, the most significant bivariate relationships are with specific opinions they hold on drinking norms, supervision and drinking behaviour within the family, peer behaviour with alcohol, access to alcohol, exposure to 18-rated films and musical preferences. The number of drinks consumed last time they were drinking and whether they have ever been drunk have a strong relationship with current drinking behaviour.
Alcohol consumption in the previous seven days
Approach to measuring consumption
Students who say they had an alcoholic drink in the seven days preceding the survey were asked for a detailed account of the types and number of drinks they had consumed over each of the previous seven days. By examining the types of alcoholic drink and the number of times each drink was consumed and calculating a unit value of their consumption, we can better understand the patterns of current drinking behaviour and identify those with heavier drinking levels.
The questionnaire specified five types of drink:
beer or lager1
cider2
wine, Martini or sherry3
spirit or liqueur (e.g. vodka, whisky, gin, tequila)4
alcopop (e.g. WKD, Vodka Kick, Bacardi Breezer, Smirnoff Ice)5
For each of the last seven days, students were asked to record how many of each type of drink they had consumed. To help students calculate the number of drinks, the drink types were expressed in terms of how they are typically packaged or delivered:

44 Young people’s drinking patterns
beer or lager was recorded as the number of pints or bottles and cans consumed;
cider was recorded as the number of pints or bottles and cans consumed;
wine, Martini or sherry was recorded as the number of glasses consumed;
spirit or liqueur was recorded as the number of shots/single measures or glasses consumed;
alcopop was recorded as the number of bottles consumed.
A unit conversion rate was applied to calculate a unit value for each student’s consumption.8 Even more than with adults, it is difficult to measure accurately consumption of alcohol among
young people. Firstly, attempts to recall alcohol consumption over the past week can be erroneous; this is a generally acknowledged problem for most surveys measuring alcohol-consumption levels. Secondly, young people tend to drink in informal settings, which means that the quantities they drink are not necessarily standard measures. The questions were fully tested to minimise any risk in reporting levels.
Types of drink consumed in the last seven days
Of those in year 9 who had consumed alcohol in the previous seven days, over four in ten (42 per cent) say they drank an alcopop; this is higher than any other type of alcoholic drink. Alcopops are often seen as an entry point into regular drinking due to sweetness and lack of a strongly alcoholic taste (Alcohol Concern, 2007). The next most frequently cited drink for year 9 students is beer or lager; almost four in ten (38 per cent) year 9 students say they drank beer or lager in the previous seven days.
In year 11, just over four in ten (41 per cent) students say they drank an alcopop over the previous seven days. Although this is a very similar proportion to year 9 students, there is a key difference between the two year groups. In year 11, alcopops are not the most frequently cited drink; more students say they drank beer or lager, or spirits or liqueurs.
Just over half (53 per cent) of year 11 students say they drank beer or lager over the previous seven days and half (50 per cent) say they drank spirits and liqueurs. This suggests that the preference for drinks such as beer, lager or spirits and liqueurs increases with age and that alcopops, although still widely consumed, become less popular. Figure 12 presents the types of drinks consumed by both year groups in the last seven days.
Figure 12: Types of drinks consumed in the last seven days by year groupQ. We want to know what alcoholic drinks you have had IN THE LAST 7 DAYS.
Year 9
Year 11
Alcopops
Beer or lager
Spirits & liqueurs
Cider
Wine, Martini or sherry
Percentage of students
4142
3853
3350
2633
2430
Base: All students who have consumed alcohol in the last 7 days in year 9 (697) and year 11 (1,119), 2009

45Young people’s drinking patterns
Figure 13: Drinks consumed in the last seven days as a percentage of all drinks consumed by year groupQ. We want to know what alcoholic drinks you have had IN THE LAST 7 DAYS.
Year 9
Year 11
Beer or lager
Alcopops
Spirits & liqueurs
Cider
Wine, Martini or sherry
Percentage of all drinks consumed
3529
2617
2225
1312
1011
Base: Number of drinks consumed in the last 7 days, year 9 (4,060) and year 11 (9,838), 2009
Frequency of consuming different types of drink in the previous seven days
Having established the types of drinks our student sample has consumed, it is also important to understand how many of these drinks were consumed.
In both year groups, a larger proportion of beer or lager drinks is consumed than any other type of drink. This is particularly the case for year 11 students, who consumed almost one and a half times more beer or lager than spirit and liqueur drinks.
Figure 13 shows that in year 9, a total of 4,060 drinks were consumed in the previous seven days and of these drinks, the largest proportion was beer or lager (29 per cent). In year 11, a total of 9,838 drinks was consumed in the previous seven days and of these drinks the largest proportion, by far, is beer and lager (35 per cent).
This analysis reveals that although a large number of our student sample is consuming alcopops, when students do so, they appear to be drinking these in lower quantities. Those who drink beer and lager appear to be consuming these in much larger quantities.
Days of the week different types of drinks were consumed in the previous seven days
Of those students who had been drinking in the last seven days, Friday and Saturday sees them drinking the largest number of drinks, as shown in Figure 14.
Students in both year groups consumed more alcohol on a Saturday than any other day of the week. Of all the drinks consumed by year 9 students in the previous seven days, 38 per cent were consumed on Saturday. Of all the drinks consumed by year 11 students, 43 per cent were consumed on Saturday.
Number of units of alcohol consumed in the last seven days
Understanding the influences of excessive drinking behaviour is a particular interest of this research. It is therefore essential that a detailed measure of alcohol consumption is calculated for each student. The number of units consumed in the last seven days by each year group is presented in Figure 15.9 The figure shows a range from ‘less than one unit’ to ‘20+ units’.

46 Young people’s drinking patterns
Figure 14: Percentage of drinks consumed by day of the week by year groupQ. We want to know what alcoholic drinks you have had IN THE LAST 7 DAYS.
Mon
day
Tues
day
Wed
nesd
ay
Thur
sday
Frida
y
Satur
day
Sunda
y
Days of the week
50
40
30
20
10
0
Per
cent
age
of
dri
nks
Year 9
Year 11
Base: Number of drinks consumed in the last 7 days in year 9 (4,060) and year 11 (9,838), 2009
The distribution of units consumed by year 9 students is reasonably balanced across the range. Sixteen per cent of year 9 students report consumption equating to 20 units or more of alcohol in the previous seven days; a similar proportion reports consumption equating two units or fewer. Overall, around four in ten (39 per cent) year 9 students report consumption equating to less than seven units; the same proportion (39 per cent) reports consumption equating to seven units or more.
Year 11 students are more likely to report drinking a higher number of units than year 9 students. In year 11, a quarter of students (25 per cent) reports consumption equating to 20 units or more of alcohol in the previous seven days; only around one in ten (11 per cent) reports consumption equating to two units or fewer.
Students in year 9 consumed an average of 13.6 units and those in year 11 consumed an average of 18 units in the seven days prior to the survey.10
Also presented in Figure 15 is a calculation that will be used in the statistical modelling to define ‘excessive’ drinking. For the purposes of this research, excessive drinking for year 9 students is classified as having drunk seven or more units in the seven days before the survey; thus includes 39 per cent of the sample. For year 11 students, excessive drinking is classified as having drunk 14 or more units in the seven days before the survey; thus 38 per cent of the sample.
Key bivariate relationships relating to a young person’s excessive drinking
All the students in this section have had an alcoholic drink in the previous seven days and we have been discussing the types and volume of drinks they have consumed. In particular, we have sought to understand the different levels of drinking and have calculated a unit consumption level for all students. A unit consumption level has been set for each year group that defines excessive drinking: 7 units or more for year 9 and 14 units or more for year 11.
In the following bivariate analysis, attention is focused solely on better understanding the influences that may exist between those who have been drinking higher volumes and those who have not. This section presents the influencing factors in each domain that have the most significant relationship with the likelihood of having been drinking to excess.11

47Young people’s drinking patterns
Figure 15: Number of units consumed by year groupQ. We want to know what alcoholic drinks you have had IN THE LAST 7DAYS.
Per
cent
age
of
stud
ents
Year 9
<1 1–2 3–4 5–6 7–10 11–13 14–19 20+ <7 7+
Number of units
2
1513
9 10
68
16
39 39
Year 11
Per
cent
age
of
stud
ents
1
10 118
14
8
13
25
53
38
Number of units
<1 1–2 3–4 5–6 7–10 11–13 14–19 20+ <14 14+
Base: All students who have consumed alcohol in the last 7 days in year 9 (697) and year 11 (1,119), 2009
Domain: Demographic factorsBivariate analysis reveals that of all the demographic characteristics included in the research, region and ethnicity have the most significant relationships with the likelihood that a young person has been drinking to excess in the previous week.
Region Focusing on students in year 11, excessive drinking is particularly prevalent in the North East compared to other regions.12 Just over half (52 per cent) of all year 11 students who live in the North East and who have been drinking in the previous week reports having consumed more than 14 units; this is compared to the national average of 38 per cent. The average number of units in this region is 24.4 compared to 18 units nationally. This is significantly higher than the national average and a number of other regions.
Ethnicity Bivariate analysis shows that ethnicity has the second most significant relationship with drinking excessively. White year 9 students are significantly more likely to have consumed larger volumes than all other ethnic groups.

48 Young people’s drinking patterns
Table 26: Individual domain: Most significant bivariate relationship on likelihood of having consumed higher volumes in the previous week is the student’s perceived level of drinking compared to peers Q. We want to know what alcoholic drinks you have had IN THE LAST 7 DAYS.
Perceived level of drinking compared to other people their age
Year 9 Year 11
<7 units%
7+ units%
<14 units%
14+ units%
Drinks more than most 22 78 39 61
Drinks around the same amount 42 57 67 33
Drinks less than most 73 26 91 9
Base: All students who have consumed alcohol in the last 7 days in year 9 (697) and year 11 (1,119), 2009
Domain: Individual factorsYoung people’s perceptions about drinking norms are related to the likelihood of them having consumed higher volumes of alcohol in the previous week. The two most significant bivariate relationships are their perceptions on their own level of drinking compared to their peers and their attitudes to getting drunk regularly.
Level of drinking compared to peers As shown in Table 26, those who think they drink more than their peers are more likely to have consumed higher volumes in the previous week – they know they drink heavily.
It is acceptable to get drunk once a week As shown in Table 27, those who believe that it is acceptable to get drunk once a week are significantly more likely to have consumed higher volumes in the previous week than those who do not think this is acceptable behaviour.
Domain: Family factorsBivariate analysis reveals that measures of parental supervision produce the strongest bivariate relationships with drinking to excess. The amount of time students are allowed to spend with their friends and the belief that their parents know where they are on a Saturday night have particularly significant relationships with the likelihood of a young person consuming higher volumes of alcohol in the previous week.
Table 27: Individual domain: Second most significant bivariate relationship on likelihood of having consumed higher volumes in the previous week is ‘It’s ok to get drunk once a week’Q. We want to know what alcoholic drinks you have had IN THE LAST 7 DAYS.
Someone my age getting drunk once a week is…
Year 9 Year 11
<7 units%
7+ units%
<14 units%
14+ units%
OK 25 75 49 51
Not OK 62 38 81 19
Base: All students who have consumed alcohol in the last 7 days in year 9 (697) and year 11 (1,119), 2009

49Young people’s drinking patterns
Table 28: Family domain: Most significant bivariate relationship on likelihood of having consumed higher volumes in the previous week is the number of evenings they are permitted to spend with friendsQ. We want to know what alcoholic drinks you have had IN THE LAST 7 DAYS.
Number of evenings per week spend with friends
Year 9 Year 11
<7 units%
7+ units%
<14 units%
14+ units%
None 70 30 78 22
1 72 28 88 13
2 61 39 72 28
3 65 35 82 18
4 47 53 76 24
5 47 53 75 25
6 49 51 58 42
7 29 71 56 44
Base: All students who have consumed alcohol in the last 7 days in year 9 (697) and year 11 (1,119), 2009
Time allowed with friends There is a clear linear bivariate relationship between the amount of evenings in a typical week that the student is allowed to spend with friends: the greater the number of evenings, the more likely it is that they student has consumed higher volumes of alcohol in the previous week (see Table 28).
Parents knowing where their child is on a Saturday evening Table 29 shows a clear bivariate relationship between the students’ belief that their parents know where they are and their level of drinking. When parents know (often or always) where their child is, the student is less likely to have been drinking higher volumes of alcohol. When parents do not know where their child is (not often or never) the gap is greater. Almost as many as eight in ten year 9 students drink to excess when parents do not know where they are on a Saturday evening.
Table 29: Family domain: Second most significant bivariate relationship on likelihood of having consumed higher volumes in the previous week is parents knowing where their child is on a Saturday nightQ. We want to know what alcoholic drinks you have had IN THE LAST 7 DAYS.
Parents know where they are on a Saturday evening
Year 9 Year 11
<7 units%
7+ units%
<14 units%
14+ units%
Almost always 67 33 82 18
Often 63 37 76 24
Sometimes 37 63 71 29
Not often 20 80 52 48
Never 21 79 39 61
Base: All students who have consumed alcohol in the last 7 days in year 9 (697) and year 11 (1,119), 2009
50 Young people’s drinking patterns
Domain: Local contextBivariate analysis reveals that who a student was with the last time they were drinking and the ease of obtaining alcohol have particularly significant relationships with the likelihood of a young person having consumed higher volumes of alcohol in the previous week.
Last time drinking was with an older friend Those who were last drinking with an older friend (or older boyfriend/girlfriend) are significantly more likely to have consumed higher volumes in the previous week than those who were in other company.
Ease of getting alcohol For year 9 students, those who say it is easy to obtain alcohol are more likely to be drinking higher volumes than those who say it is not easy (44 per cent of those who say it is easy are higher volume drinkers; 24 per cent of those who say it is not easy are higher volume drinkers).
Domain: Media and celebrityBivariate analysis reveals that those who listen to rap and garage music are much more likely to have consumed higher volumes of alcohol in the previous week than those who do not usually listen to these styles of music.
Domain: Drinking patternsBivariate analysis shows that a young person having bought their alcohol in a shop the last time they were drinking has a significant bivariate relationship with high volumes of consumption.
Summary: Alcohol consumption over the last seven days
Detailed reporting of alcohol consumption by year 9 students shows they are more likely to have been drinking alcopops in the last seven days. The second most frequently consumed drink is beer. By year 11, students are more likely to have been drinking beer, lager and spirits or liqueurs.
In both year groups, those drinking beer and lager consume a higher number of drinks than those drinking other types of alcohol. In year 9, almost four in ten (39 per cent) students who had consumed alcohol in the preceding seven days consumed 7 units or more. In year 11, the same proportion consumed 14 units or more.
In terms of the influencing factors on whether or not a young person is an excessive drinker, the most significant bivariate relationships are with their region and ethnicity, their specific opinions on drinking norms, supervision in the family and their family’s drinking behaviour, with whom they were drinking, ease with which they can obtain alcohol and their musical preferences. As regards drinking patterns, the most significant relationship with excessive drinking is buying alcohol in a shop.
Being drunk
Whether young people have ever been drunk
Students who have had an alcoholic drink were asked if they have ever been drunk.13 Over half (54 per cent) of year 9 students say they have been drunk; just over a quarter (28 per cent) say they have been drunk once and a quarter (25 per cent) has been drunk more than once.
Of those in year 9 who say they have been drunk, around one in five (22 per cent) reports having been drunk once in the previous four weeks and around one in ten (11 per cent) reports having been drunk three or more times in the previous four weeks. Around half (49 per cent) say they have not been drunk in the four-week period before the survey.
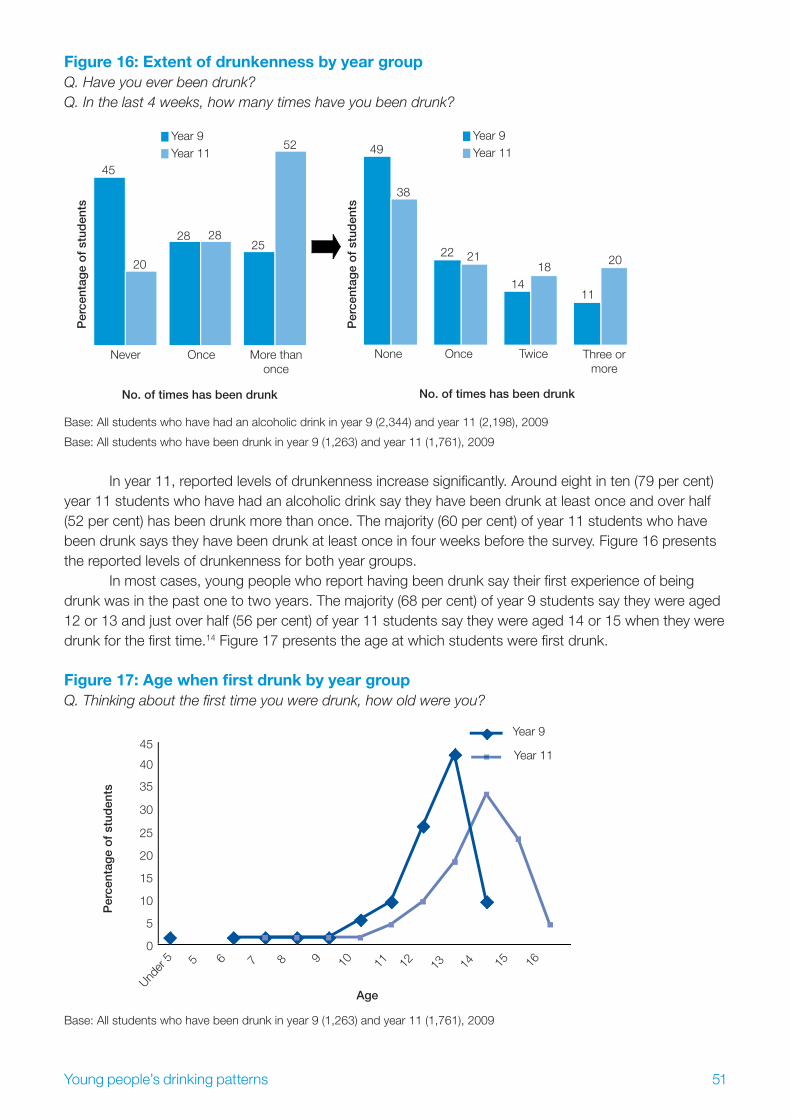
51Young people’s drinking patterns
Figure 16: Extent of drunkenness by year groupQ. Have you ever been drunk?Q. In the last 4 weeks, how many times have you been drunk?
Year 9Year 11
Per
cent
age
of
stud
ents
No. of times has been drunk
Never Once More than once
45
20
28 2825
52Year 9Year 11
No. of times has been drunk
None Once Twice Three or more
49
38
22 21
1418
11
20
Per
cent
age
of
stud
ents
Base: All students who have had an alcoholic drink in year 9 (2,344) and year 11 (2,198), 2009
Base: All students who have been drunk in year 9 (1,263) and year 11 (1,761), 2009
In year 11, reported levels of drunkenness increase significantly. Around eight in ten (79 per cent) year 11 students who have had an alcoholic drink say they have been drunk at least once and over half (52 per cent) has been drunk more than once. The majority (60 per cent) of year 11 students who have been drunk says they have been drunk at least once in four weeks before the survey. Figure 16 presents the reported levels of drunkenness for both year groups.
In most cases, young people who report having been drunk say their first experience of being drunk was in the past one to two years. The majority (68 per cent) of year 9 students say they were aged 12 or 13 and just over half (56 per cent) of year 11 students say they were aged 14 or 15 when they were drunk for the first time.14 Figure 17 presents the age at which students were first drunk.
Figure 17: Age when first drunk by year groupQ. Thinking about the first time you were drunk, how old were you?
Under
5 5 6 7 8 9 10 11 12 13 14 15 16
Age
Per
cent
age
of
stud
ents
45
40
35
30
25
20
15
10
5
0
Year 9
Year 11
Base: All students who have been drunk in year 9 (1,263) and year 11 (1,761), 2009

52 Young people’s drinking patterns
Figure 18: Intentionally getting drunk by year groupQ. How often, if at all, do you and your friends drink alcohol to get drunk?
Per
cent
age
of
stud
ents
Year 9
Year 11
Every day or almost every day
Twice a week
Once a week
Once a fortnight
Once a month
Few times a
year
Once or twice a
year
I never get drunk
now
Notstated
2 2
8
12
10
17
12
16 16
1918
1516
8
15
9
4
2
Base: All students who have been drunk in year 9 (1,263) and year 11 (1,761), 2009
Drinking to get drunk
For a significant proportion of our student sample, drunkenness has, at least at times, been intentional. Almost half (47 per cent) of year 9 students and two thirds (66 per cent) of year 11 students who have been drunk say that they and their friends drink to get drunk at least monthly. Around two in ten (19 per cent) year 9 students, increasing to around three in ten (31 per cent) year 11 students, say that they and their friends drink to get drunk at least weekly (see Figure 18).
Further analysis reveals that these claims of drinking to get drunk are reflected in current drinking levels. There is a correlation between the number of units consumed in the last seven days and the intention to get drunk. As current drinking levels increase, so, too, does the frequency with which the students claim to be drinking to get drunk (see Figure 19).
Figure 19: Intentionally getting drunk by current drinking level by year groupQ. How often, if at all, do you and your friends drink alcohol to get drunk?Q. We want to know what alcoholic drinks you have had IN THE LAST 7 DAYS.
At least weekly At least monthly
Per
cent
age
of
stud
ents
Number of units
<7 7+ but less than 14
14+
16
46
29
7063
87
Year 9
At least weekly At least monthly
Per
cent
age
of
stud
ents
Number of units
<7 7+ but less than 14
14+
16
46
29
70
63
87
Year 11
Base: All students who have been drunk and have consumed alcohol in the 7 days before the survey in year 9 (430) and year 11
(955), 2009

53Young people’s drinking patterns
Figure 19 shows that among those who have been drunk and have consumed alcohol in the seven days before the survey, the higher the current level of drinking (less than 7 units, at least 7 but less than 14 units or 14+ units), the larger the proportion that is drinking to get drunk. This applies to both year groups and to those who drink to get drunk at least weekly and monthly.
Location of drinking last time student was drunk
Students who say they have been drunk before were asked about the circumstances when they were drunk last: who they were with and where.
Figure 20 presents the five most frequently cited locations where the students were drunk last and reveals that these are, to an extent, different to the locations when they were drinking (they were not necessarily getting drunk the last time they were drinking).
Just as year 9 students were more likely to having been at home when they last had an alcoholic drink, they are also more likely to have been at home when they were last drunk. As many as 28 per cent of all year 9 students were at home the last time they were drunk. Whilst, overall, fewer are drinking and getting drunk outside the home, they are more likely to be getting drunk in these other locations rather than simply having a drink.
In year 11, while students are still more likely to be drinking at home, they are not more likely to be getting drunk at home. By this stage, students are more likely to be at a friend’s home when they were last drunk (31 per cent).
In year 9, students who say that they have been drunk more than once are twice as likely than those who have been drunk only once to have been outside when this happened (33 per cent compared to 15 per cent). Year 9 students who have been drunk in the last four weeks are three times more likely than those who have not been drunk in the last four weeks to have been outside when this happened (36 per cent compared to 12 per cent).
In year 11, students who say that they have been drunk more than once are more likely than those who have been drunk once to have been outside when this happened (22 per cent compared to 16 per cent). Year 11 students who have been drunk in the last four weeks are twice as likely than those who have not been drunk in the last four weeks to have been outside when this happened (25 per cent compared to 12 per cent).
This correlates with findings from two recent studies on the reasons for drinking outdoors. Forsyth and Barnard (2000) reported that risky drinking was more likely in locations where there was least scope for adult supervision and this was supported by Newburn and Shiner (2001), stating that unsupervised outdoor locations are believed to provide the most likely setting for binge drinking and associated problems.
Who students were with when they were drunk last
In both year groups, students who have been drunk once are more likely to say that they were with a parent on that occasion. In year 9, 38 per cent of those who have been drunk once were with a parent compared to 26 per cent who have been drunk more than once. In year 11, 21 per cent of those who have been drunk once were with a parent compared to 14 per cent who have been drunk more than once.
Figure 21 shows the most frequently cited people who students were with when they were last drinking and compares this to who they were with the last time they were drunk. In both year groups, students are less likely to have been with their parents the last time they were drunk compared to the last time they had an alcoholic drink and much more likely to have been drinking with friends. Even so, around a quarter of year 9 students were with their parents the last time they were drunk.

54 Young people’s drinking patterns
Figure 20: Location last time drunk compared to location last time drinking (top five presented)Q. The LAST TIME you were drinking alcohol, where were you?Q. The last time you were drunk, where were you?
Per
cent
age
of
stud
ents
Year 9
At home Outside Friend my age or younger’s
home
Older friend’s home
Relative’s home
Location
43
28
15
23
1317
913 13
11
Last time drinking Last time drunk
Year 11
Per
cent
age
of
stud
ents
34
1917
2023
31
13
18
97
Location
At home Outside Friend my age or younger’s
home
Older friend’s home
Relative’s home
Last time drinking Last time drunk
Base: All students who have had an alcoholic drink in year 9 (2,344) and year 11 (2,198), 2009
Base: All students who have been drunk in year 9 (1,263) and year 11 (1,761), 2009
Key bivariate relationships relating to a young person’s drunkenness
All the students in this section have had an alcoholic drink; we have been examining the circumstances around their experience(s) of being drunk. In addition, we have sought to understand the differences in behaviour between those who have been drunk once and those who have been drunk more than once. It has been established that there are different patterns in behaviour between the two groups: for example, those who have been drunk more than once are more likely to have been in an unsupervised environment than those have been drunk once.
In the following bivariate analysis, attention is focused solely on better understanding the influences that may exist between those who have been drunk once and those who have been drunk

55Young people’s drinking patterns
more than once. This section presents the influencing factors in each domain that have the most significant relationship with the likelihood of having been drunk more than once.15
Demographic domainBivariate analysis reveals that year group and age have the most significant relationships with the likelihood of having been drunk more than once. These are undoubtedly linked; the older the students, the more likely it is that they have been drunk more than once.
Figure 21: Who students were with last time they were drunk compared to who they were with last time drinking (top four listed)Q. The LAST TIME you were drinking alcohol, who were you with?Q. The last time you were drunk, who were you with?
Per
cent
age
of
stud
ents
Year 9
Friend my age or younger
Older friends My mother My father
Who student was with
36
49
30
45 43
28
36
22
Last time drinking Last time drunk
Year 11
Per
cent
age
of
stud
ents
54
65
41
52
28
14
24
11
Who student was with
Last time drinking Last time drunk
Friend my age or younger
Older friends My mother My father
Base: All students who have had an alcoholic drink in year 9 (2,344) and year 11 (2,198), 2009
Base: All students who have been drunk in year 9 (1,263) and year 11 (1,761), 2009

56 Young people’s drinking patterns
Table 30: Individual domain: Most significant bivariate relationship on likelihood of having been drunk on more than one occasion is having seen their parent(s) drunkQ. Have you ever been drunk?
Have seen parent(s) drunk
Year 9 Year 11
Yes, more than once
%
Yes, once%
Yes, more than once
%
Yes, once%
Lots of times 42 35 69 22
A few times/once or twice 26 30 53 30
Never 11 22 32 27
Base: All students who have had an alcoholic drink in year 9 (2,344) and year 11 (2,198), 2009
Domain: IndividualUnsurprisingly, issues around acceptability of excessive drinking behaviour produce the most significant relationships in the individual domain. Students who believe they drink more than most people their age and who think regular drunkenness is acceptable are more likely to exhibit these behaviours. The students know they are drinking more than others their age but equally think that their behaviour is acceptable.
Domain: FamilyHaving seen their parents drunk is the most significant relationship in the family domain, followed by whether the student believes their parent knows where they are on a Saturday night. As shown in Table 30, those who have seen their parents drunk are significantly more likely to have been drunk themselves on more than one occasion. Those who believe their parents know where they are on Saturday evenings are less likely to have been drunk on more than one occasion.
Having seen parents drunk As shown in Table 30, those who think they have seen their parents drunk are significantly more likely to have been drunk on multiple occasions than those who have not seen their parents drunk.
Table 31: Individual domain: Second most significant bivariate relationship on likelihood of having been drunk on more than one occasion is parents knowing where children are on a Saturday eveningQ. Have you ever been drunk?
Parents know where they are on a Saturday evening
Year 9 Year 11
Yes, more than once
%
Yes, once%
Yes, more than once
%
Yes, once%
Almost always 15 28 42 30
Often 24 32 47 31
Sometimes 40 28 66 23
Not often 45 28 63 27
Almost never 57 24 75 21
Base: All students who have had an alcoholic drink in year 9 (2,344) and year 11 (2,198), 2009

57Young people’s drinking patterns
Parent knows where they are on a Saturday evening As shown in Table 31, there is a clear linear relationship between knowing where the students are and drunkenness. Those who say their parents know where they are on a Saturday evening are significantly less likely to have been drunk on more than one occasion.
Domain: Local contextBivariate analysis reveals that who the student was with and how they sourced their alcohol when they were last drinking have particularly significant relationships with the likelihood of a young person having consumed higher volumes of alcohol in the previous week.
Friends who drink alcohol As shown in Table 32, those who have friends who drink alcohol are significantly more likely to have been drunk on more than once occasion.
Ease of obtaining alcohol Students who think accessing alcohol is easy are significantly more likely to have been drunk on more than one occasion than those who do not find it easy.
Domain: Media and celebrityBivariate analysis reveals that parental supervision of access to films is the most significant relationship with drunkenness. Those who are permitted to watch 18-rated films on their own or those whose parents do not know what they watch are more likely to report drunkenness on more than one occasion than those who have greater supervision.
In this domain, style of music plays a part. The second most significant relationship with being drunk on more than once occasion is with those who listen to drum and bass.
Domain: Drinking patternsThe most significant bivariate relationship in this domain concerns the number of drinks respondents report having had the last time they were drinking. As expected, those who drink higher volumes report being drunk on more than one occasion.
Table 32: Individual domain: Most significant bivariate relationship on likelihood of having been drunk more than once is the student’s perceived drinking compared to their peers Q. Have you ever been drunk?
Proportion of friends who drink alcohol
Year 9 Year 11
Yes, more than once
%
Yes, once%
Yes, more than once
%
Yes, once%
All/most 45 31 60 27
Some/a few 16 30 28 32
None 6 20 24 23
Base: All students who have had an alcoholic drink in year 9 (2,344) and year 11 (2,198), 2009

58 Young people’s drinking patterns
Summary: Being drunk
Over half (54 per cent) of year 9 students who have had an alcoholic drink says they have been drunk: a relatively equal proportion says this happened only once and that they have been drunk more than once. By year 11, around four in five (79 per cent) students have been drunk, with over half (52 per cent) drunk more than once. In many cases, getting drunk is intentional, with half of year 9 and two-thirds of year 11 students who drink saying that they and their friends sometimes drink to get drunk.
In terms of influencing factors on whether or not a young person has been drunk, the most significant bivariate relationships are with their year group and age, their specific opinions on drinking norms, witnessing drinking behaviour in the family and parental supervision, their friends’ behaviour with alcohol, their ease of accessing alcohol, exposure to media and music preferences. As regards drinking patterns, the most significant relationship with being drunk is whether they bought their alcohol in a shop.
Developing our understanding of drinking patterns and behaviour
In this chapter, drinking patterns of the student sample have been discussed in detail, focusing on their first time drinking, the behaviours and circumstances surrounding their last time drinking alcohol, their current drinking levels and their experiences of being drunk. Through these various sections, the chapter builds a picture of escalating behaviour, exploring simple relationships as a way of understanding these behaviours.
A number of relationships between influencing factors and the student’s drinking behaviour has emerged and this chapter has detailed the factors with the most significant bivariate relationships. Through this bivariate analysis, patterns emerge between behaviour and factors that appear to influence behaviour:
Religion and ethnicity appear to have the strongest influence on a young person’s behaviour with alcohol at the entry level. Belonging to a minority ethnic or religious group (most typically Muslim, but not exclusively) can reduce the likelihood of developing a relationship with alcohol. Once alcohol has been tried, however, these factors have a much weaker influence on behaviour as other factors become more important.
A general acceptance of getting drunk appears to have a strong influence across all drinking behaviours, although, beyond the entry level to drinking, opinions harden. When analysing current drinking, excessive drinking and drunkenness, ‘normal’ behaviour moves from it being acceptable to get drunk to see what being drunk is like to it being acceptable to get drunk regularly. Acceptance of the social norm appears to shift as behaviour shifts. This manifests itself in other measures of peer behaviour, for example, having friends who drink alcohol. This appears to be a strong influencing factor across all behaviours. Beyond entry level, among students who are current drinkers, who drink excessively and who get drunk, there seems to be an acknowledgement that their behaviour goes beyond the social norm as they report drinking more than most people their age.
Ease of access to alcohol also appears to have a strong influence across all behaviours. At entry level to alcohol, with current drinking and with drunkenness, there is a strong relationship with behaviour and finding it easy to get alcohol. Among excessive drinkers, however, the issue appears to be that they are not simply finding it easy to obtain but are actually buying their alcohol in shops.
A number of influencing factors within the family appears to be strong across all behaviours and links into issues of supervision and access to media. Having seen (or believing to have seen) their parents drunk appears to have a strong relationship on the student having tried alcohol themselves and having

59Young people’s drinking patterns
themselves been drunk. Having seen older siblings drunk also appears to have a strong influence on trying alcohol and on current drinking. Beyond entry level to drinking, family supervision appears to have a strong influence on behaviour; each behaviour appears to be influenced by whether or not students’ parents know where they are on a Saturday evening. Present across trying alcohol, current drinking and drunkenness is a relationship between behaviour and whether or not students’ parents allow them to watch 18-rated films (and, if they do, whether or not this is supervised).
The findings presented in this chapter address the first of this study’s research aims, providing robust data on the levels and patterns of drinking and collecting a range of information on influencers of drinking. This information provides insight but does not yet fully address the aims of the research. Whilst we have established strong bivariate relationships within the various domains of influence and can begin to see patterns emerging in how these factors might influence behaviour, there is still no sense of how these factors relate to one another across the domains.
The second aim of this research sets out to establish the relative importance of these factors by asking which are circumstantial and what factors are the strongest predictors of drinking among young people. To answer these questions and develop our understanding further, statistical modelling has been conducted.
Chapter 3 provides information about the modelling, including how to understand and interpret the findings (strongly recommended for all who are not familiar with modelling). Chapter 4 then presents these findings, explaining the strength of the relationships between the influencing factors and the student’s behaviour with alcohol.

60 Explaining the statistical modelling
3 Explaining the statistical modelling
Introduction
This chapter explains the purpose of the statistical modelling process. The chapter also confirms the behaviours and groups of interest included in the statistical modelling and, importantly, explains how to understand and interpret the findings from the modelling work.1
The purpose of modelling
Findings from this research in relation to patterns of drinking – how much young people drink, where they drink and with whom they drink – are, to an extent, similar to other studies referenced in this report and the supporting literature review, although they are not always directly comparable when varying measures of data collection are taken into account (for example, different unit measurements). This indicates that the sample used in this research is similar to that in other youth alcohol studies in terms of drinking behaviour. Where this research differs is that the focus is firmly on the relative importance of a range of influences and drivers of drinking among young people and the relationship between these factors and different drinking behaviours.
Using simple bivariate analysis (analysis of a relationship between two variables), this research has found – and in many cases confirmed – that a range of domains influences drinking behaviour among young people. Simple bivariate analysis, however, can be prone to over-estimating the strength of the relationship between these factors and drinking behaviours. The reason for this is that it does not take into account the possibility that some of these factors overlap with one another; for example, children who spend more evenings out with friends are more likely to say their parents do not know where they are on a Saturday night.
In this research, we have used a multiple regression approach, which allows us to move beyond a simple bivariate analysis to one where we can estimate the association of each factor with the drinking behaviour after adjusting for other significant factors in the model. This allows all of the significant factors to be accounted for simultaneously and for the relative magnitude of their effects on drinking behaviours to become apparent.
Furthermore, by controlling for demographics in the model, we can be sure that the non-demographic factors in the model are not significant simply due to demographic differences. For further information on what we mean by controlling for demographics, we have provided an example using survey data in Appendix 12 of the supporting Technical Document.
Behaviours and groups of interest
Other studies have applied regression analysis to explain elements of drinking; for example, the annual Smoking, drinking and drug use among young people in England report includes regression analysis focused on drinking alcohol in the previous week.
This research has wider concerns and uses multiple regression techniques to investigate several behaviours relating to alcohol consumption. The importance of the modelling process is that it gets underneath the headline findings and discovers what really influences (or does not influence) different drinking behaviours. The following four behaviours are investigated in this research:

61Explaining the statistical modelling
Those who have never had an alcoholic drink versus those who have had an alcoholic drink.1
Those who have consumed alcohol in the previous week versus those who have consumed alcohol 2 but not in the previous week.
Those who have consumed higher volumes of alcohol in the preceding week versus those who have 3 consumed lower volumes of alcohol in the preceding week. (For the purposes of this research, higher volumes are defined for year 9 students as 7 units or more in the week preceding the survey and for year 11 as 14 units or more in the week preceding the survey.)
Those who have been drunk more than once versus those who have either been drunk once or have 4 never been drunk.
All factors that have a significant bivariate relationship with the drinking behaviours listed above were included in the model building process.
Chapter 2 of this report presented year 9 and year 11 results separately. The statistical models combine the two year groups, due to the small sample sizes in each year group that exhibit certain drinking behaviours (especially in the younger year group). For each model, tests were performed to check if there was any evidence that the influence of each factor on the drinking behaviours differed significantly by age and year group.
Understanding the findings
The statistical modelling allows us to calculate an estimate of the probability that a young person with particular characteristics, attitudes and behaviours will have certain drinking behaviours, for example, whether they have ever had an alcoholic drink or have ever been drunk.
The main output used to interpret these models is the odds ratio. Odds ratios are the ratio of two odds and odds are calculated based on the expected probabilities from the model.
To explain how odds ratios are calculated, we will use an example from this survey.
In Table A, we present the count of students who have had an alcoholic drink by gender.
From Table A, we can calculate the probability of a young person having had an alcoholic drink given they are a boy as:
P(had an alcoholic drink/Boy) = 2132/2906 = 0.734
And given they are a girl as:
P(had an alcoholic drink/Girl) = 2180/2829 = 0.771
Table A: Has had an alcoholic drink
Gender No Yes Total
Boy 774 2132 2906
Girl 649 2180 2829
Base: All students, 2009

62 Explaining the statistical modelling
We can also calculate the probability that they have never had an alcoholic drink given they are a boy as:
P(Never had an alcoholic drink/Boy) = 1 – P(had an alcoholic drink/Boy) = 1 - 0.734 = 0.266
And given they are a girl as:
P(Never had an alcoholic drink/Girl) = 1 - 0.771 = 0.229
From these probabilities, we can then calculate the odds of drinking for a boy and the odds of drinking for a girl by dividing one probability by the other.2
Odds of a boy having had an alcoholic drink = 0.734/0.266 = 2.759
Odds of a girl having had an alcoholic drink = 0.771/0.229 = 3.367
The odds ratio is the ratio of these two odds. The odds ratio for a girl having had an alcoholic drink compared to a boy is
Odds ratio = 3.367/2.759 = 1.22.
Therefore, on average, the odds of a girl having had an alcoholic drink are 1.22 times greater than those of a boy.
The point of reference when discussing odds ratios is 1 and the further away the odds ratio moves from 1, the greater the difference in the odds. If the odds ratio is less than 1, the odds of a certain behaviour occurring are lower. If the odds ratio is more than 1, the odds of a certain behaviour occurring are higher, or greater.
For the remainder of the report we will be interpreting the output from the models in terms of the odds ratio. Findings will be commented on if they are found to be significant at the 5 per cent level.3
The following chapter presents the findings of the modelling work. Further details on the workings of the models, including the data tables with full results, are provided in the supporting Technical Document as Appendix 8.

63The most important influences on different behaviours and groups
4 The most important influences on different behaviours and groups
Key findings
The relative importance of influences on ever having had an alcoholic drink
Among the strongest predictors of this behaviour is the drinking behaviour of friends. Exposure to at least a few friends who drink alcohol significantly increases the odds of a young person having had an alcoholic drink.
Another particularly strong predictor is a young person’s expectations on the outcomes of drinking alcohol; positive and negative associations increase or decrease the odds respectively. The family’s behaviour with alcohol is also a strong indicator. The odds of having had an alcoholic drink are greater if a young person simply believes to have seen a family member drunk, rather than the frequency with which this has happened.
The relative importance of influences on current drinking
Among the strongest predictors of being a current drinker is the age of young people when they first had an alcoholic drink. Typically, the earlier they had their first drink, the greater the likelihood that they will have been drinking in the previous week, although complexities in the findings prevent this from being a straightforward outcome.
Further strong predictors are a young person’s acceptability of social norms around drinking (the odds of young people drinking alcohol in the previous week more than double when they think that it is acceptable to drink alcohol once a week compared with those who think this behaviour is not acceptable) and a young person’s expectations on the outcomes of drinking alcohol.
The relative importance of influences on excessive drinking
Among the strongest factors explaining excessive drinking is whether or not a young person agrees that it is acceptable to get drunk once a week. The odds of a young person agreeing with this and having consumed higher volumes in the previous week are twice those of a young person who does not think that it is acceptable behaviour.
Another one of the key factors in determining whether young people drink more heavily is the drinking levels of their friends. The likelihood of a young person drinking excessively decreases significantly if they say that some/a few of their friends drink alcohol compared to those who say that all of their friends drink alcohol. A further strong influence on excessive drinking is the region in which a young person lives.
The relative importance of influences on being drunk more than once
Frequency of drinking is the strongest indicator of drunkenness with a clear linear relationship; the more frequently a young person drinks, the greater the odds that they will have been drunk more than once.

64 The most important influences on different behaviours and groups
Age also plays a particularly strong role. The odds of having been drunk more than once increase as age increases, with the age of 14–15 providing the critical turning point in behaviour. Those who had their first drink when they were extremely young (when 6 years or younger) have higher odds on having been drunk more than once.
Introduction
This chapter provides a summary of the interpretation of the results of the statistical modelling, presenting each of the different drinking behaviours and groups of interest and looking across the various significant influences to identify which factors have the strongest influence on different drinking behaviours.
Each drinking behaviour is presented with the influencing factors presented in the order or the strength of their relationship with that behaviour. The chapter concludes by discussing what these findings tell us about the relative importance of influences on young people and their behaviour with alcohol.
Whether a young person has ever had an alcoholic drink
The aim of this model
The aim of this model is to identify the characteristics, behaviours and attitudes of a young person and the behaviours of parents, siblings and friends who have a significant relationship with a young person’s likelihood to having ever had an alcoholic drink. In building the model, only those factors that show a significant relationship with a student’s response to the question ‘have you ever had an alcoholic drink – a whole drink, not a sip?’ are included.
Significant predictors
The following variables are significant predictors of whether or not a young person has ever had an alcoholic drink.1 The variables below are those that appear as significant when other factors are controlled for; this is the case for variables included in each of the models.
The ten strongest relationships are presented below.2 Variables are ordered in terms of the strength of the relationship, with the strongest presented first.
The drinking behaviour of a young person’s friends. 1
A young person’s perception of the benefits and drawbacks of drinking (fun, happy, unhealthy, 2 addictive, etc.)/their expectations regarding alcohol.
Drunkenness among their family members.3
A young person’s religion.4
The frequency of drinking among family members.5
The frequency with which a young person spends evenings with friends. 6
A young person’s perceived level of supervision by parents/carers/whether parents know where they 7 are on a Saturday evening.

65The most important influences on different behaviours and groups
A young person’s perceived level of supervision their parents/carers have over what films they watch.8
A young person’s ethnicity.9
A young person’s attitude towards certain drinking behaviours (acceptability of getting drunk and 10 frequency of consumption).
InteractionsThe modelling process also tests for evidence of significant interactions between each of the main demographic variables: gender, age/year group, ethnicity, religion and the other significant non-demographic factors in the final model. Where there is a significant interaction, this is highlighted in the following discussion.
Research findings
The findings below are ordered largely in terms of the strength of their relationship towards the behaviour: in this case whether a young person has ever had an alcoholic drink.
Local context domain: Peer drinking behaviour The model shows that the drinking behaviour of a young person’s friends is one of the main factors associated with the odds of them ever having had an alcoholic drink.
As shown in Table 33, where some, most or all of their friends drink alcohol, the odds of a young person ever having had an alcoholic drink are two to three times greater than if they had no friends who drink alcohol. Also interesting to note is that the thresholds, where there is a considerable increase in the odds of having had an alcoholic drink, seem to be between those young people who have no friends who drink alcohol, those who have a few friends who drink alcohol and those who have more than a few (some/most/all). There is no real distinction between some, most or all friends.
Exposure to at least ‘a few’ friends who drink alcohol significantly increases the odds of a young person having had an alcoholic drink. Accounting for all the other factors in the model, however, if ‘some’ friends drink alcohol then the odds of a young person having had an alcoholic drink do not significantly increase if ‘most’ or ‘all’ of their friends drink alcohol.
Individual domain: Expectations of drinking alcohol – perceptions of benefits and drawbacks There is a general link between young people’s expectations about alcohol and their behaviour with alcohol. When other factors are accounted for, this relationship is still apparent but only for certain attitudes and expectations.
Table 33: Influence of friends (1)
Odds Ratio
How many of your friends drink alcohol?
None 1
A few 1.95
Some 3.18
Most 3.21
All 2.40
Base: All students, 2009

66 The most important influences on different behaviours and groups
Associations between drinking alcohol and feeling happy or having fun can be predictors of having had an alcoholic drink. There is a particularly strong association between alcohol and fun; the odds of a young person having had an alcoholic drink are more than doubled (2.16 odds ratio) if they think they will ‘have a lot of fun’ when drinking alcohol compared to those who do not share this view. Similarly, the odds of a young person having had an alcoholic drink are 1.76 times greater among those who think they will feel happy if they drink alcohol compared with those who do not share this view.
Conversely, the model shows that young people have lower odds of drinking alcohol if they agree with certain negative alcohol-related outcomes, namely not being able to stop drinking, feeling sick (these are both strongly significant relationships) and harming their health.
Looking at these perceived negative outcomes in more detail, there are differences between groups of young people. One of the significant interactions that becomes apparent is the age of a young person and their view that they will harm their health by drinking alcohol. Rather than being constant, according to the age of the young person, there is evidence to suggest that the relationship between expecting a negative consequence of alcohol and not drinking is significantly stronger for a 16-year-old, and therefore this belief holds more importance among this age group in determining the likelihood of drinking, than in younger age groups. However, the belief that ‘I will have a lot of fun if I drink alcohol’ is also a greater predictor of drinking among 16-year-olds than in any other age group. The perception that ‘I might not be able to stop drinking’ has a stronger effect on the odds of girls not having had an alcoholic drink than on boys.
Family domain: Drunkenness among family members A key factor emerging from the model is whether young people have seen family members drunk.
The threshold for influencing a young person’s drinking behaviour seems to be more to do with whether they have seen a family member drunk at all and less related to the frequency with which this has happened, as shown in Table 34. The odds that a young person will have had an alcoholic drink do not significantly differ across the different frequencies except between those young people who have never seen any of their relatives drunk and those who have.
Demographic characteristics domain: Religion Once all other factors are accounted for, religion continues to have an impact on whether young people have had an alcoholic drink. The odds of a young Muslim having had an alcoholic drink are significantly lower than a young person who says they do not belong to any religion.
Family domain: Frequency of drinking among family members The questionnaire asks about frequency of drinking by adult family members, concentrating on parents, step-parents and other carers.
As with drunkenness among family members, it appears that the factor having the greatest influence on whether a young person has had an alcoholic drink is not how much the rest of the family
Table 34: Influence of family members
Seeing family members drunk Odds Ratio
How often, if at all, have you seen one or more of your parents/carers/older brother or sister drunk?
Never 1
At least one of them once or twice 1.88
At least one of them a few times 1.72
At least one of them lots of times 1.68
Base: All students, 2009

67The most important influences on different behaviours and groups
drinks but whether they drink at all. Young people who say that at least one family member drinks alcohol one or two days a week have almost double the odds (1.90) of having had an alcoholic drink than those who say no family member drinks alcohol. There is no linear relationship between behaviour and this influence; the odds of a young person having had an alcoholic drink do not increase in line with how often family members drink.
Local context domain: Evenings spent with friends Whilst this emerges as a factor to be considered once all other factors are accounted for, the model does not indicate a direct linear relationship between the odds that a young person has had an alcoholic drink and the number of evenings spent with friends. There is a relationship between evenings spent with friends and the odds of having had an alcoholic drink, for instance, a young person who spends four evenings a week with friends has higher odds of having had an alcoholic drink than one who does not spend any evenings with friends. There is, however, not a significant relationship between spending five or six nights a week with friends and greater odds of having had an alcoholic drink compared with spending fewer evenings with friends.
Family domain: Parental knowledge of young people’s whereabouts on a Saturday evening Parental knowledge of a young person’s whereabouts on a Saturday evening is often used in studies with young people as a measure of parental supervision and control. As background, those who have had an alcoholic drink are significantly less likely to say that their parents almost always/often know their whereabouts (71 per cent in year 9 and 67 per cent in year 11) compared to those who have never had an alcoholic drink (88 per cent in year 9 and 90 per cent in year 11).
Once all other factors are controlled for, there remains a relationship between this influence and a young person’s propensity to have had an alcoholic drink. The odds of a young person saying they have had an alcoholic drink are greater if their parents do not ‘almost always’ know where they are on a Saturday evening. There also appears to be a difference between those who say their parents ‘often’ know where they are and those who think their parents know where they are ‘sometimes’ or ‘not often’, with higher odds of having had an alcoholic drink among young people giving the latter two responses.
Media and celebrity domain: Parental attitudes towards young people watching 18-rated filmsThis question ascertains the level of supervision that parents have over the films their children watch and although it sits within the media and celebrity domain, it spans wider issues such as parental monitoring and control.
Young people have a greater likelihood of having had an alcoholic drink if their parents allow them to watch films rated 18 on their own or with friends compared with young people whose parents do not allow them to watch films rated 18. The odds of a young person whose parents allow them to watch films rated 18 without supervision having had an alcoholic drink are 1.73 times greater than the odds of those whose parents do not allow them to watch such films.
The model suggests some significant interactions by demographic factors with parental attitudes towards watching films rated 18 and, whilst overall parental attitudes towards films do not have one of the strongest influences on young people drinking, when considered among certain groups of young people, the importance increases. There is evidence that the relationship between a young person having had an alcoholic drink and being allowed to watch these types of films is not constant according to gender or ethnicity; this is especially the case in relation with ethnicity. Among young Asian people, parental supervision of the films they watch is not a significant factor in predicting likelihood of initiation into drinking alcohol whilst for other ethnic groups it is a significant predictor.
The relationship between this variable and whether a young person has ever consumed alcohol is stronger for girls than for boys, especially when comparing those allowed to watch 18-rated films alone or

68 The most important influences on different behaviours and groups
with friends and parents not knowing what films have been watched (the categories suggest lower levels of parental supervision) with those not allowed to watch any 18-rated films. If girls are allowed to watch films with lower levels of supervision, this has a greater impact on the odds of them drinking alcohol than it does for boys.
Individual domain: Attitudes towards drinking Many of the factors discussed so far in this section are likely to contribute towards forming ‘social norms’ for young people in relation to drinking and play a role in forging their attitudes towards the acceptability of certain drinking behaviours.
When all other factors are controlled for, the difference between the odds of a young person having consumed alcohol or not depends on whether they agree with the following three attitudes: ‘it is ok to drink alcohol to see what it is like’, ‘it is ok to get drunk to see what it is like’ and ‘it is ok to drink alcohol once a week’. The difference is strongly significant and, in all cases, young people who agree with these statements have a greater likelihood of having had an alcoholic drink. This is not the case for the fourth statement asked of young people – ‘it is ok to get drunk once a week’ – in this case, the difference in the odds of having had an alcoholic drink based on agreement with this statement is not significant.
Whether a young person has been drinking alcohol in the previous week – current drinking
The aim of this model
The aim of this model is to identify the factors that have a significant relationship with current drinking, that is, a young person’s likelihood to have had an alcoholic drink in the previous week. In building the model, only those factors that show a significant relationship with a young person’s response to the relevant questions are included. As before, significant interactions between each of the main demographic variables are noted where applicable.
Significant predictors
This analysis model focuses on factors associated with young people drinking in the previous week. The following variables were included in the model and are the ten strongest relationships as presented below, ordered in terms of the strength of the relationship, with the strongest presented first.
Age at first alcoholic drink.1
A young person’s attitude towards certain drinking behaviours (acceptability of getting drunk and 2 frequency of consumption).
A young person’s perception of the benefits and drawbacks of drinking (fun, happy, unhealthy, 3 addictive, etc.)/expectations regarding alcohol.
A young person’s age.4
The drinking behaviour of a young person’s friends. 5
The frequency of drinking among family members.6
Circumstances of first drink: whether celebrating a special occasion.7

69The most important influences on different behaviours and groups
Accessibility of alcohol: ease of getting alcohol.8
A young person’s ethnicity.9
Who a young person was with the last time they drank alcohol.10
Research findings
Analysis reveals that once factors are considered in isolation and with other factors controlled for, a range of factors remains that determines the likelihood of a young person having drunk alcohol in the previous week.
Drinking patterns domain: Age at first drink The model shows that age at first drink has the strongest influence on drinking during the previous week; overall, the younger a person is when they start drinking alcohol, the greater the likelihood that they have been drinking alcohol in the previous week. However, when interactions are introduced, this has an effect on results. The effect of the interaction suggests that the relationship between the age at the first drink and the likelihood of drinking in the previous week is not consistent across the population as a whole. Results indicate that for older students in our sample, the later they were introduced to alcohol, the greater the odds that they were drinking in the previous week. For example, the odds that a 16-year-old who had their first drink at 14 has been drinking in the previous week are greater than those of a 16-year-old who had the first drink at 11-years-old (odds ratio of 6.23 compared to 1.95). This anomaly may be linked to the manner in which the alcohol was introduced; those who first drank alcohol at a younger age are also more likely to have had an adult present when they first had an alcoholic drink, suggesting that current drinking is, to some extent, influenced by a supervised first-drinking setting rather than by a delayed first-drinking setting.
Individual domain: Attitudes, perceptions of benefits and drawbacks and expectations of drinking alcohol Among the strongest predictors in explaining drinking alcohol in the previous week are whether young people exhibit certain attitudes and expectations towards alcohol, as shown in Table 35. Once all other factors are accounted for, it becomes apparent that some attitudes and expectations are less important in driving the odds of a young person having drunk alcohol in the previous week, whilst others remain key predictors.
Whether or not a young person agrees that it is acceptable to drink alcohol once a week has a significant relationship on whether they actually have been drinking in the previous week. The odds of a young person drinking alcohol in the previous week more than double (with an odds ratio of 2.44) when they think that it is acceptable to drink alcohol once a week compared with those who think this behaviour is not acceptable.
Once other factors are accounted for, young people who expect to feel happy if they drink alcohol are more likely to have been drinking in the previous week than those who do not agree with this view; again, this is a significant relationship with the likelihood of having been drinking alcohol in the previous week.
Another attitude that plays a key role in whether or not young people have consumed alcohol in the previous week is whether they consider it acceptable for someone their age to get drunk to see what it is like. Whilst this has a weaker relationship to frequency of drinking alcohol than other factors, young people who agree with this still have a greater likelihood of drinking alcohol in the previous week.
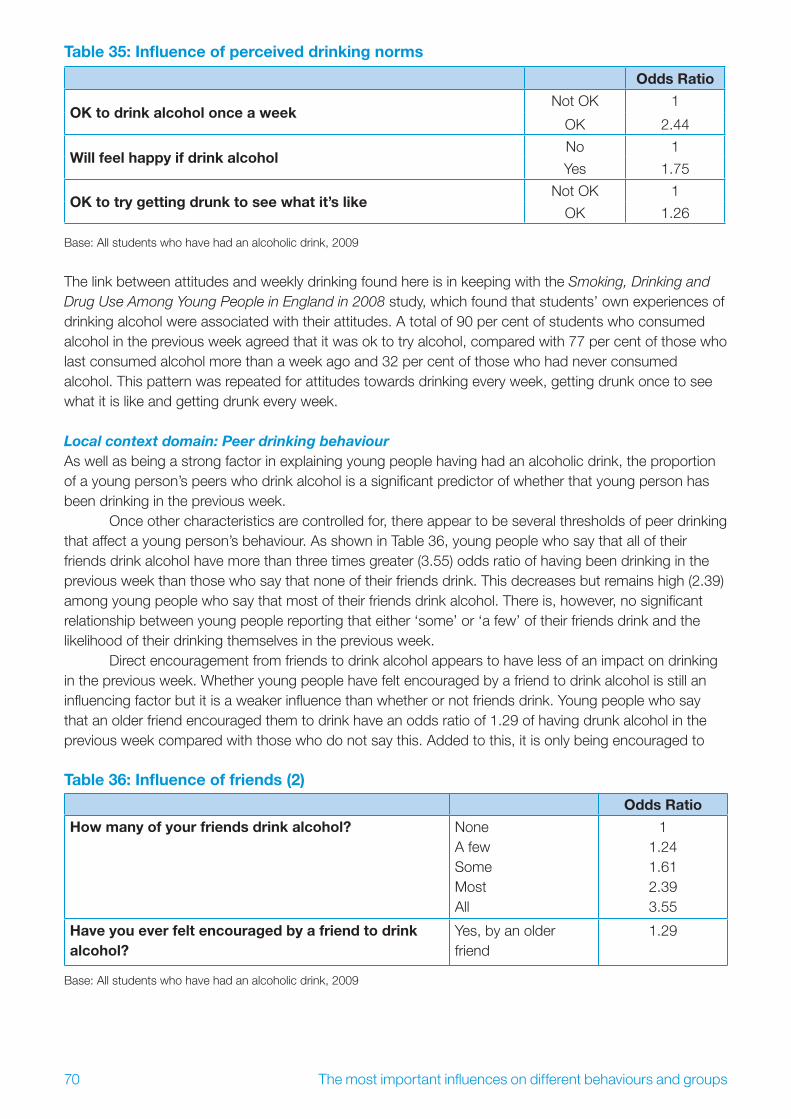
70 The most important influences on different behaviours and groups
Table 35: Influence of perceived drinking norms
Odds Ratio
OK to drink alcohol once a weekNot OK 1
OK 2.44
Will feel happy if drink alcoholNo 1
Yes 1.75
OK to try getting drunk to see what it’s likeNot OK 1
OK 1.26
Base: All students who have had an alcoholic drink, 2009
The link between attitudes and weekly drinking found here is in keeping with the Smoking, Drinking and Drug Use Among Young People in England in 2008 study, which found that students’ own experiences of drinking alcohol were associated with their attitudes. A total of 90 per cent of students who consumed alcohol in the previous week agreed that it was ok to try alcohol, compared with 77 per cent of those who last consumed alcohol more than a week ago and 32 per cent of those who had never consumed alcohol. This pattern was repeated for attitudes towards drinking every week, getting drunk once to see what it is like and getting drunk every week.
Local context domain: Peer drinking behaviour As well as being a strong factor in explaining young people having had an alcoholic drink, the proportion of a young person’s peers who drink alcohol is a significant predictor of whether that young person has been drinking in the previous week.
Once other characteristics are controlled for, there appear to be several thresholds of peer drinking that affect a young person’s behaviour. As shown in Table 36, young people who say that all of their friends drink alcohol have more than three times greater (3.55) odds ratio of having been drinking in the previous week than those who say that none of their friends drink. This decreases but remains high (2.39) among young people who say that most of their friends drink alcohol. There is, however, no significant relationship between young people reporting that either ‘some’ or ‘a few’ of their friends drink and the likelihood of their drinking themselves in the previous week.
Direct encouragement from friends to drink alcohol appears to have less of an impact on drinking in the previous week. Whether young people have felt encouraged by a friend to drink alcohol is still an influencing factor but it is a weaker influence than whether or not friends drink. Young people who say that an older friend encouraged them to drink have an odds ratio of 1.29 of having drunk alcohol in the previous week compared with those who do not say this. Added to this, it is only being encouraged to
Table 36: Influence of friends (2)
Odds Ratio
How many of your friends drink alcohol? NoneA fewSomeMostAll
11.241.612.393.55
Have you ever felt encouraged by a friend to drink alcohol?
Yes, by an older friend
1.29
Base: All students who have had an alcoholic drink, 2009

71The most important influences on different behaviours and groups
drink by an older friend that has an influence on frequency of alcohol consumption once all other factors are accounted for; being encouraged to drink by a friend the same age or younger does not explain the variation in frequency of drinking alcohol.
Family domain: Frequency of drinking among family members Whilst drunkenness among family members does not emerge from the model as a key factor affecting frequency of drinking in the same way that it does for whether or not young people have ever had an alcoholic drink, the frequency of drinking among family members still has a bearing on behaviour.
The first model indicated that in relation to family drinking, the factor having the greatest influence on whether a young person has had an alcoholic drink is not how much the rest of the family drink, but whether they drink at all. However, as regards the frequency of young people drinking alcohol, the relationships influencing the likelihood of young people drinking every week are more complex.
Young people who say that at least one family member drinks one or two days a week have an odds ratio of 1.65 in terms of their likelihood of having been drinking in the previous week compared to young people who say that their family members do not drink. However, the odds of young people saying they drink weekly increases if at least one family member drinks three to six days a week (an odds ratio of 2.20 compared to those who say none of their family drink) or every day (an odds ratio of 2.13 compared to those who say that none of their family drinks). Table 37 presents these ratios.
Drinking patterns domain: Circumstances of first drink – whether celebrating a special occasion The circumstance of a young person’s first drink of alcohol also appears to impact on their future drinking behaviour. There is a significant relationship between young people saying they had their first proper drink when they were celebrating a special family or religious event (e.g. a birthday, wedding, baptism) and being less likely to have had an alcoholic drink in the week preceding the survey. Young people who say this have lower odds (odds ratio of 0.70) of having been drinking in the preceding week compared to young people who were not celebrating a family event. Whilst not always conclusive, young people being at a family event could suggest a degree of monitoring and supervision by adults that may not occur when young people are with their peers the first time they drink alcohol. It could also suggest a different motivation for first time drinking, however, this research cannot draw conclusions on this hypothesis.
Local context domain: Accessibility – ease of getting alcohol Another factor that is a significant predictor on whether or not a young person has been drinking in the previous week is access to alcohol. With this factor, the odds of young people drinking alcohol in the previous week are greater if they say that they bought alcohol themselves the last time when they were drinking.
Table 37: Influence of family drinking
Odds Ratio
Thinking about a normal week, how often, if at all, do the following members of your family usually drink alcohol?
Family does not drinkAt least 1 member drinks every dayAt least 1 member drinks 3-6 days/wkAt least 1 member drinks 1-2 days/wk
12.132.201.65
Base: All students who have had an alcoholic drink, 2009

72 The most important influences on different behaviours and groups
The model shows that young people who believe that obtaining alcohol is easy are more likely than those who say that it is not to have had an alcoholic drink in the week preceding the survey. It being ‘very easy’ appears to be the key threshold for ease of accessing alcohol impacting on frequency of consumption; apart from those who say that it is easy to access alcohol, there are no significant access differences once all other factors are accounted for in the model.
Demographic characteristics domain: Ethnicity Young people of White ethnic origin have odds of having drunk alcohol in the week preceding the survey that are five times greater (5.05 times) than young people of Asian origin. There are no significant differences with this factor across other ethnic groups.
Drinking patterns domain: Who young person was with on last drinking occasion (adult supervision) Literature indicates that there is a relationship between the extent of adult supervision relating to alcohol and the drinking behaviour of young people. One measure of supervision used in this research is who a young person was with on the last occasion they were drinking alcohol. The model shows that this acts as a key influencer on their likelihood to have been drinking alcohol in the previous week. The odds of young people who were with either an adult relative or an adult friend saying that they have drunk alcohol in the previous week are lower (0.55 times and 0.73 times lower odds respectively) than before.
Whether a young person has consumed higher volumes of alcohol in the previous week – currently drinking excessively
The aim of the model
This model focuses on the amount of alcohol units consumed by young people who said they had been drinking in the seven days prior to taking part in the survey.3 Different benchmarks of ‘higher volumes’ of alcohol consumption have been used in the model according to year group as it is assumed that, in general, students in year 9 who drink alcohol are likely to drink less than students in year 11. The model looks at year 9 students who have consumed 7 or more units in the last seven days versus those who have consumed fewer and year 11 students who have consumed 14 or more units in the previous week versus those who have consumed fewer.
Significant predictors
The ten strongest predictors of excessive drinking are presented below – they are ordered largely in terms of the strength of their relationship towards the behaviour, in this case whether a young person has consumed larger volumes of alcohol in the seven days before the survey.
A young person’s attitude towards certain drinking behaviours (acceptability of getting drunk and 1 frequency of consumption).
The drinking behaviour of a young person’s friends. 2
The region in which a young person lives.3
Accessibility: ease of getting alcohol.4
The frequency with which a young person spends their evenings with friends.5

73The most important influences on different behaviours and groups
A young person’s school year group.6
The importance of religious belief to a young person.7
Who a young person was with last time they were drinking alcohol.8
Where alcohol was sourced the last time a young person was drinking.9
Their gender.10
Research findings
Individual domain: Attitudes towards alcohol Among the strongest factors explaining whether or not young people drink a higher volume of units (7+/14+) is whether or not they agree that it is acceptable to get drunk once a week. The odds of a young person agreeing with this behaviour and having consumed higher volumes of alcohol in the previous week are twice as large (odds ratio 2.25) than those who do not think it is acceptable behaviour: in essence, those who drink high volumes are more likely to think that it is acceptable to get drunk on a weekly basis.
Local context domain: Peer drinking behaviour As with other alcohol consumption measures, one of the key factors in determining whether young people drink more heavily is the drinking levels of their friends. The likelihood of young people drinking 7+/14+ units per week decreases significantly if they say that some/a few of their friends drink alcohol compared to a young person who says that all of their friends drink alcohol. The difference between the likelihood of a young person who says most of their friends drink is, however, not a significant one compared to someone who says that all friends drink. In addition, the difference between the likelihood of young people who say none of their friends drink and that all of their friends drink is not a significant one, although this is likely to be due to small base sizes for the sub-group of young people who say none of their friends drink at the relevant question.4 Analysis outcomes are presented in Table 38 below.
Table 38: Influence of friends (3)
Odds Ratio
How many of your friends drink alcohol?
AllMostSomeA fewNone
11.140.490.360.41
Thinking about a typical week during term-time, how many evenings do you spend with your friends?
None1 evening2 evenings3 evenings4 evenings5 evenings6 evenings7 evenings
11.492.351.962.342.462.374.06
Base: All students who consumed alcohol in the last 7 days, 2009
74 The most important influences on different behaviours and groups
Demographic characteristics domain: Region A strong influence on excessive drinking is the region in which a young person lives. The odds that a young person living in London or the South West consumes higher volumes of alcohol (7+/14+ units) are lower than those in all other regions. The odds are that young people living in the South East (odds ratio 1.69), the North East (odds ratio 1.58) and Yorkshire and Humberside (odds ratio 1.54) will consume higher volumes compared to all other regions.
Local context domain: Access to alcohol Young people who say that obtaining alcohol would be very easy have almost four times greater odds (odds ratio = 3.73) than those who say that it would not at all be easy to drink higher volumes of alcohol (7+/14+ units).
Local context domain: Evenings spent with friends Young people who spend one or more evenings with friends are more likely to have consumed higher volumes of alcohol (7+/14+ units) than those who do not spend any evenings with friends. However, there is no clear linear relationship between the number of evenings spent with friends and levels of alcohol consumed. Up to a point, there is little difference in the odds of drinking 7+/14+ units based on the number of evenings once the threshold of two evenings is reached. Spending evenings with friends from two to six evenings a week increases the odds of drinking more heavily by between 2.34 and 2.46 times. It is only when time spent reaches seven evenings that the odds increase substantially, rising to 4.06, meaning that if a young person spends every evening with friends the odds of them drinking higher volumes of alcohol are four times greater than for someone who spends no evenings with friends.
Analysis outcomes are presented in Table 38.
Demographic characteristic domain: Year group Year group is one of the strong predictors on volume of drinking, appearing in the model as a result of the different thresholds set for defining ‘heavy’ consumption.
Drinking patterns domain: Who young people were drinking with when last drinkingYoung people who were drinking with friend(s) or an older boyfriend/girlfriend the last time they were drinking have greater odds (odds ratio 1.75) of having consumed a higher volume of units (7+/14+) in the previous week than those who were not drinking in such company.
Drinking patterns domain: Source of alcohol when last drinking The odds that a young person drinking higher volumes (7+/14+ units) obtains their alcohol in the following ways are greater than those who obtained alcohol in other ways:
Stole it/someone stole it (odds ratio = 2.71)
Bought it in a bar or club (odds ratio = 2.12)
Given by older brother or sister (odds ratio = 1.93)
Bought it in a shop (odds ratio = 1.59)

75The most important influences on different behaviours and groups
Demographic characteristics: Gender Unlike other models, there is a difference by gender once all other factors are controlled for, with girls significantly less likely than boys to have consumed higher volumes in the previous week. Bivariate analysis supports this, showing that for those in year 11, girls consume significantly less alcohol at 13.9 units and boys consume significantly more at 21.7 units. Heavy drinking was not set at different levels for boys and girls, which may explain the presence of gender as a strong predictor in this model compared to other models (which do not involve volume of alcohol).
Having been drunk more than once
The aim of this model
This model compares the responses of young people who have been drunk more than once with those who have either never been drunk or have been drunk only once.5
Significant predictors
The ten strongest predictors used in the model are presented below, ordered in terms of the strength of the relationship, with the strongest presented first.
How often a young person usually has an alcoholic drink.1
Young person’s age.2
Age at first drink.3
Drunkenness among parents/carers.4
The drinking behaviour of a young person’s friends. 5
Drunkenness among older siblings.6
Where alcohol was sourced from on last drinking occasion.7
Who young person was with the last time they drank alcohol.8
Circumstances of first alcoholic drink: adult presence/supervision.9
A young person’s perception of the benefits and drawbacks of drinking (fun, happy, unhealthy, 10 addictive, etc.)/expectations regarding alcohol.
Research findings
Drinking patterns domain: How often a young person usually has an alcoholic drink This is an extremely strong predictor of the odds of young people being drunk more than once. The model indicates that young people who only drink on special occasions are less likely to have been drunk more than once. Whilst young people who say they drink between ‘a few times a year’ and ‘up to once a fortnight’ have a higher odds ratio of being drunk more than once than those who ‘only drink on special occasions’ (odds ratio = between 1.59 for a few times a year and 1.74 for once a fortnight). The increase

76 The most important influences on different behaviours and groups
in the odds of getting drunk more than once is much greater for young people who drink more often than fortnightly. Young people who drink once a week have an odds ratio of 2.70 of being drunk more than once versus those who only drink on special occasions. For young people who drink about twice a week, the likelihood of having been drunk on multiple occasions is greater (the odds ratio increases to 4.40) and for those who drink every day/almost every day, it is greater still (the odds ratio increases to 6.29 times). Results are presented in Table 39.
Drinking patterns: Age – young person’s current age and age at first drink There is a strong linear relationship with being drunk and age; once all other factors are accounted for, the odds of getting drunk more than once increase as a young person’s age increases. Thirteen-year-olds have the lowest likelihood of having been drunk more than once, with 14-year-olds generating greater odds (1.35 times) at having been drunk multiple times. The odds of 15- and 16-year-olds being drunk multiple times are over twice that of 13-year-olds (2.29 and 2.67 respectively). There is a significant increase in young people getting drunk more than once between the ages of 14 and 15.
There is also a relationship between age of initiation to alcohol and drunkenness. Young people who say that they were aged six or younger when they first drank alcohol are more likely to have been drunk more than once. For young people who say they first drank alcohol aged over 6 years but under 12 years, there is not a significant difference in their behaviour compared to those who reported being aged up to 6 years. There is, however, a marked difference in whether young people have been drunk more than once if they drank alcohol for the first time aged 13 or older. If a young person is 13 or 14 the first time they drink alcohol, the odds of being drunk on more than one occasion fall by half compared to those who began drinking alcohol at a younger age (i.e. aged 6 years or younger). Young people who first drank at ages 15–16 have even lower odds (odds ratio = 0.22) of having been drunk more than once compared to those who had their first drink when they were up to 6 years old. Therefore, it appears that having first drunk alcohol aged 13 or over is the key threshold relating to likelihood of having been drunk more than once compared to those who were aged six or younger.
Family context: Whether young people have seen parents/carers drunk As regards the number of times young people have been drunk, the level of drinking among their peers does not play the same key influencing role found in the other models. However, the frequency of drunkenness among immediate family members, which was a less influential force in other models, increases in importance here.
The frequency of young people seeing their parents drunk is a particularly strong predictor. The likelihood that a young person has been drunk on more than one occasion is greater if they have seen their parents drunk a few times (the difference between young people who have never seen parents drunk and who have seen them drunk once or twice is barely significant). The data does not indicate that a
Table 39: Frequency of drinking
Odds Ratio
How often do you usually have an alcoholic drink? Only on special occasionsEvery day or almost every dayAbout twice a weekAbout once a weekAbout once a fortnightAbout once a monthA few times a year
1 6.294.402.701.741.651.59
Base: All students who have ever had an alcoholic drink, 2009

77The most important influences on different behaviours and groups
young person’s propensity to get drunk on more than one occasion increases between them having seen their parents drunk a few times (odds ratio = 2.03 versus never) and lots of times, in fact, there is a slight decrease (odds ratio for ‘lots of times’ = 1.97 versus ‘never’). This indicates that seeing parents drunk a few times is the key threshold for influencing a young person’s behaviour where getting drunk is concerned.
Local context domain: The drinking behaviour of a young person’s friends There is a strong relationship between having friends who drink alcohol and a young person’s likelihood of having been drunk. Once all other factors are controlled for, the difference in proportion of friends is not significant.
Family domain: Whether young people have seen older siblings drunk There is a significant difference between a young person’s likelihood of having been drunk more than once, depending on whether or not they have seen an older sibling drunk. Young people who have seen their older siblings drunk once or twice have an odds ratio of 1.63 of being drunk themselves more than once, compared to those who have never seen an older sibling drunk. As with frequency of seeing their parents drunk, it appears that there are greater odds that young people will have been drunk on more than one occasion if they have seen an older sibling drunk at least a few times compared to once or twice. Again, ‘a few times’ provides the threshold; there is no difference between having seen older siblings drunk a few times or lots of times.
Drinking patterns: Source of alcohol last time drinking Young people who say that the last time they consumed alcohol they bought it themselves or that an adult relative/another adult bought it for them show around 1.5 times greater odds than those who did not source alcohol in this way to have been drunk more than once.
Drinking patterns: Age first drinking/adult presence/supervision The odds of young people who say that an adult was present at their first drink being drunk on more than once occasion are lower (0.64 times) than among those who say that an adult was not present, indicating the protective effect of adult supervision.
Individual domain: A young person’s perception of the benefits and drawbacks of drinking (fun, happy, unhealthy, addictive, etc.)/expectations regarding alcohol Young people who possess certain positive expectations of outcomes of drinking are more likely to have been drunk more than once. These expectations are ‘I will feel happy if I drink alcohol’ (odds ratio of 1.69 versus those who do not think this) and ‘I will feel more friendly and outgoing if I drink alcohol’ (odds ratio = 1.41).
Local context domain: Drinking with friends when last drinking The odds of being drunk more than once are greater among young people who were with friends last time they consumed alcohol (odds ratio of 1.5).
Individual domain: A young person’s attitude towards certain drinking behaviours (acceptability of getting drunk and frequency of consumption) Unsurprisingly, there is a relationship between a young person’s attitudes towards drunkenness and the frequency with which they have been drunk. Young people who think it is ‘ok to get drunk to see what it’s like’ have greater odds of being drunk more than once than those who think that this is not acceptable (odds ratio = 1.41). Whilst young people who think it’s ‘ok to get drunk more than once’ are more likely to have done this themselves (odds ratio = 1.54 compared to those who do not agree with this), this also

78 The most important influences on different behaviours and groups
has a more significant effect on girls than boys. The odds of girls with this attitude having been drunk more than once are over twice as high (odds ratio = 2.14).
Model validation
For model validation, please refer to Appendix 11 in supporting Technical Document.
Developing our understanding of the relative importance of factors
In this chapter, the relative importance of factors has been discussed to determine which of the many influencing factors provide the strongest predictors of behaviour. Looking across and within the domains, we can see how different influences come to the fore when analysing different behaviours.
A number of factors identified in previous chapters as having strong bivariate relationships on drinking behaviour, when modelled and set in relative terms, continue to be strong indicators of behaviour. These include a young person’s understanding of social norms around drinking and the influence of seeing others drinking and being drunk. However, some relationships, when modelled and set in relative terms, are no longer a leading force behind behaviour and diminish in strength. Such examples are typically found in the media-related domain where factors appear circumstantial rather than real indicators of behaviour.
Looking across the different research groups of interest to the study, findings suggest that it is direct personal experience that has the strongest influence on behaviour. Personally knowing people who drink, who drink frequently and who get drunk are key predictors of a young person’s behaviour with alcohol. Their friends play a critical role, however, acting as a direct and indirect influence is a young person’s family. Parents and, to a lesser degree, older siblings have a particularly strong influence on a young person. These influences range from the point at which alcohol is introduced, to a young person’s exposure to adult drinking and drunkenness, to the amount of supervision that is placed on a young person. This also includes the ease of access to alcohol, which is another strong predictor, and which, in many cases, is sourced through the family.
The strongest predictors of drinking behaviours have been identified and whilst some of these cannot be influenced or, in some cases, cannot be influenced easily, a number of them can – and it is these predictors that should be the focus of attention for those looking to address young people’s behaviour with alcohol.

79Conclusion and implications for policy and practice
5 Conclusion and implications for policy and practice
Conclusions
The analytical approach taken in this research allows a wide range of significant factors to be accounted for simultaneously and has demonstrated the relative magnitudes of their effect on drinking patterns among young people. The findings become most interesting and useful where they can:
be used to predict the likelihood of alcohol-related problems arising from, or associated with, particular sets of circumstances; or
be linked to, or inform, government policy in relation to preventing problems associated with alcohol use.
It can be argued that these findings predict that a young person is more likely to drink, to drink frequently and to drink to excess if:
they receive less supervision from a parent or other close adult;
they have friends who drink or if they spend multiple evenings a week with friends;
they are exposed to a close family member, especially a parent, drinking or getting drunk;
they have positive attitudes towards and expectations of alcohol;
they have very easy access to alcohol.
It can also be argued that these findings point towards critical points in a young person’s relationship with alcohol where a carefully timed intervention could generate a positive outcome. An example of this includes a young person’s introduction to alcohol; findings reveal that parental introduction of alcohol to a child too early can have a negative outcome (greater likelihood that they would be current drinkers) and yet there are dangers in parents not introducing alcohol and leaving their child to explore alcohol in more harmful surroundings. Not introducing a child to alcohol can also lead to negative outcomes (more likely to be drinking away from the home).
The identified predictors collectively construct a young person’s pattern of behaviour around drinking. Findings suggest that it is direct personal experience that has the strongest influence on behaviour. As noted above, friends play a critical role, however, acting as a direct and indirect influence is a young person’s family. Parents have a particularly strong influence ranging from the point at which alcohol is introduced, to a young person’s exposure to adult drinking and drunkenness, to the amount of supervision that is placed on a young person. The parents’ own relationship with alcohol, or certainly the child’s perception of their parents’ behaviour with alcohol, is inextricably linked to the child’s subsequent behaviour with alcohol.

80 Conclusion and implications for policy and practice
Implications for policy and practice
There is a gap in government policy concerning young people and alcohol. Previous national campaigns on this issue have been halted, a new national alcohol strategy is planned for the summer (Commons Hansard, 2011) and although the recent drug strategy (HM Government, 2010) indicates a closer strategic relationship with tackling alcohol misuse, there is no clear government message on young people and drinking.
It is not inevitable that all young people will drink but this research demonstrates that the majority will have had an alcoholic drink by the time they are 12 or 13 years old. This research also shows there is little that can be done to influence the strongest predictors that impact on whether a young person will try alcohol. As a result, there appears to be little benefit at this point in policy aiming to prevent young people from trying alcohol or encouraging an alcohol-free childhood.
Instead, policy should seek to prevent immediate and long-term harm to young people from alcohol. These findings show this can be done by focusing on the strongest predictors of current, excessive and risky drinking that can be influenced. This is in line with the direction set out in the drug strategy to prevent ’the escalation of use and harm, including stopping young people from becoming drug or alcohol dependent adults’ (HM Government, 2010, p12).
This research identifies the important opportunities for intervention and presents robust evidence regarding what influences the relationship between young people and alcohol. Policy-makers, decision-makers and frontline services should consider the implications for future policy and practice at national, local and frontline level.
National policy
The relationship between young people and alcohol is complex, with many factors playing a role in young people’s drinking behaviour. There is no single solution to prevent alcohol harm among young people, therefore national policy must focus on the strongest predictors that can be influenced.
The influence of parentsThis research shows that parental influence is of paramount importance. The findings suggest that efforts to improve drinking behaviour among young people are best directed at supporting and educating parents. The government’s approach should build on the evidence from this research, highlighting that parents are the key partners in preventing alcohol harm to their child. This approach should include positive messages for parents about how they can influence their child’s behaviour. This could also include how and when parents can introduce their child to alcohol, practical steps that parents can take at times when their child’s drinking and exposure to alcohol is likely to increase and should stress the importance of parents’ own drinking behaviours and how they are observed or perceived by their children.
Messages reinforcing the importance of parents’ behaviour and supervision will need to be far-reaching and designed to be effective with the majority of families, as well as targeted to meet the needs of the minority of more complex families.
The influence of friendsThe influence of peer group behaviour – both real and perceived – on negative drinking behaviours by young people is another key area for influence. This research shows that the drinking behaviour of friends is among the strongest predictors of having had an alcoholic drink and of excessive drinking, whilst a young person’s perception of social norms around drinking is a key predictor for those currently drinking.
In terms of possible interventions in this area, the EU Drug Abuse Prevention research programme demonstrates that adopting a social norms approach to education about alcohol in schools can positively

81Conclusion and implications for policy and practice
impact young people’s drinking behaviour by challenging incorrect perceptions about the regularity and scale of heavy drinking by their peer group (Faggiano, et al., 2008).
In addition, schools could provide a channel for information, offering the opportunity for getting targeted messages to parents to encourage actions at specific times in their child’s development. This would echo an approach in the new drug strategy that commits to ’good quality education and advice so that young people and their parents are provided with credible information to actively resist substance misuse‘ (HM Government, 2010, p9).
Guidance for schools on preventing drug and alcohol misuse is currently being revised and simplified. This offers an opportunity to embed messages from this research about the importance of a social norms approach and the impact of messages to parents.
Access to alcohol Access to alcohol is important. This research suggests that the easier it is for young people to get hold of alcohol, the greater the potential risk they face. Messages to parents will need to emphasise that the most common place for alcohol to be accessed is in the home, showing that how they store alcohol and, critically, how they monitor its use, are important.
Those young people who do buy their own alcohol are the ones most likely to be harmful drinkers. This finding has implications for the retailing of alcohol. Controlling the price of alcohol has a growing evidence base, which demonstrates that a minimum unit price of 50 pence per unit could prevent harm among young people by reducing its availability (Faggiano, et al., 2008). Licensing policy already has a focus on reducing underage sales, ensuring that all alcohol retailers have an age verification policy; however, enforcement of this should be done in partnership with the alcohol industry. The government should also concentrate on communicating consistent messages to parents about their role in enabling their children to access alcohol.
The new alcohol strategy offers the opportunity to set out a strong central policy direction and send out a set of clear messages to parents, local policy-makers and frontline services using this evidence to target the strongest predictors where influence can be brought to bear.
Local policy
As the localism agenda develops, greater control of funding and decision-making will be made at local level. Local policy around young people’s drinking should build on local evidence of need and be in line with a nationally-set direction.
Support services and guidance for parents and families developed locally should incorporate clear messages about the importance of parental drinking behaviour, access to alcohol at home, parental supervision and encouragement for young people to join positive activities. It is also important to highlight what the research shows to be key predictors outside of the home over which parents can still have influence, such as the frequency with which young people spend their evenings with friends and whether parents know where they are on a Saturday evening. This approach should be incorporated into relevant provision, such as parenting programmes, the redesign of children’s centres, the Healthy Child Programme and community budgets.
The research shows the benefits of ensuring the provision of positive activities on Friday and Saturday evenings alongside parental encouragement to children to take up these activities. This would have the greatest impact if this provision targeted groups of young people where regular drinking is normalised.
It will be important for areas to build a local evidence base around young people’s drinking behaviours that could support social norms-based education in schools. Schools can use their unique role in the community to give timely provision of information to parents throughout their child’s life, focusing on the critical points highlighted in this report. This could be done through the regular

82 Conclusion and implications for policy and practice
communication channels with parents. Schools also have the opportunity to identify those young people with risky drinking behaviours and help them access appropriate support services in their local area.
Local action on availability is key, especially as those young people who buy their own alcohol are shown to be most at risk. There are some areas demonstrating success in limiting young people’s ability to buy alcohol by encouraging ‘Challenge 21’ or ‘Challenge 25’ schemes in alcohol retailers, taking action on underage sales and proxy sales of alcohol through joined-up approaches between police, licensing departments and children’s services. This should be supplemented by messages to parents demonstrating that evidence shows that they are the main route of access to alcohol for young people.
Frontline practice
Frontline services have a vital role to play in delivering these key messages to parents throughout a child’s life and at critical times as shown in this research, via midwifery and health visiting services, parenting programmes, family interventions and schools. Youth services and schools can reinforce national messages and augment these with local data to challenge perceptions about social norms and reinforce negative associations with drinking.

83Notes
Notes
Executive Summary
Defined as a whole drink, not just a sip.1
A bivariate relationship is a relationship between two variables.2
1 Introduction
Produced as an internal document and not intended for publication. A copy is held by JRF for 1 reference.
Year 9 students are aged 13–14 years and year 11 students are aged 15–16 years.2
Modelling was conducted using binary logistic regression.3
Although the number of students in the sample from ages 13–16 is broadly even, due to sampling by 4 school year group and the timing of fieldwork, our sample incorporates those at the older end of 13 and the younger end of 16. The sample is therefore not representative of all 13–16-year-olds.
Ethnicity was collected at the detailed level (white includes white British, Asian or Asian British 5 Pakistani, black or black British African) but is shown here at the top-level description due to relatively small base sizes for many minority ethnic groups. The questionnaire in the Technical Document (Appendix 3) provides the full list of ethnic groups measured.
2 Young people’s drinking patterns
This study found that a higher percentage of 13-year-olds had consumed an alcoholic drink 1 compared to the Smoking, drinking and drug use among young people in England 2008 study (67 per cent compared with 52 per cent). For 15-year-olds and 16-year-olds, the proportion was more in line but still slightly higher (74 per cent compared with 70 per cent and 89 per cent compared with 80 per cent, respectively). This research used an adapted version of the Smoking, drinking and drug use question and is therefore not directly comparable. Cognitive testing for this research found that the use of the word ‘proper’ in the question (for example, asking young people if they have had a ‘proper alcoholic drink’) often made students think of particularly high-content alcohol drinks, such as spirits. At the testing stage, participants were answering no, even if they had consumed alcoholic drinks such as beer. The word ‘proper’ was subsequently removed from the question for this research, which may, in part, explain the differences among the findings.
Adult was defined for the respondent as someone aged 18 years or older.2
Tested at the 5 per cent level of significance.3
This is based on the 4 p value from the likelihood ratio test.

84 Notes
‘White’ includes students who defined themselves as white British, white Irish, white traveller of Irish 5 heritage, white Romany or Gypsy or white – any other white background.
‘Asian’ includes students who defined themselves as Asian or Asian British Pakistani, Asian or Asian 6 British Indian, Asian or Asian British Bangladeshi, Asian or Asian British – any other Asian background.
This is based on the 7 p value from the likelihood ratio test.
Details for this conversion rate are provided as Appendix 7 in the supporting Technical Document.8
Applying the conversion factors listed in Appendix 7.9
Smoking, drinking and drug use among young people in England in 200810 found that 11–13-year-olds drank an average of 12 units, 14-year-olds 15.1 units and 15-year-olds 15.5 units. These results are not directly comparable to this survey as different calculations of alcohol strength and unit conversions were used.
This is based on the 11 p value from the likelihood ratio test.
Base sizes for year 9 are small.12
Cognitive testing for this research found that young people did not have consistent views on what 13 ‘being drunk’ meant, although they typically defined ‘being drunk’ as displaying extreme behaviours such as falling over. An explanation was provided in the questionnaire to enable a more accurate measurement of drunkenness. Some people describe being drunk as ‘having drunk enough alcohol to feel less in control’, ‘wobbly or under strong influence of alcohol’ or ‘doing something or saying things that you wouldn’t normally do or say (without drinking)’.
The differences between year groups may in part reflect issues around recall.14
This is based on the 15 p value from the likelihood ratio test.
3 Explaining the statistical modelling
Figures and tables are used to illustrate findings where appropriate. Where results do not add up to 1 100 per cent, this may be due to computer rounding, multiple responses, or the inclusion of ‘neither/nor’ or ‘don’t know’ categories.
Odds are calculated as p: 1-p or equivalently as p/(1-p): 1, where p is the proportion having the 2 characteristic of interest, e.g. having had an alcoholic drink.
A 5 per cent level of significance implies that there is only a 5 per cent chance (1 in 20) that a 3 significant relationship found in the survey data is not actually true. This is the standard level at which most survey data is tested for significance. An alternative way of looking at this test is to say that the significant relationship we have found in the data has a 95 per cent chance of being true in the population as a whole.

85Notes
4 The most important influences on different behaviours and groups
Tested at the 5 per cent level of significance.1
The full list of significant predictors for this model and the following three models are presented as 2 Appendix 10 in the supporting Technical Document.
We had planned originally to look at year 9 and year 11 separately but due to small base sizes we 3 combined the years for modelling purposes. For year 9, the outcome was defined as whether they had consumed 7 or more units in the last 7 days and for year 11, we modelled on whether they had consumed 14 or more units in the last 7 days. Our binary variable was coded with ‘Drank 7/14 or more units in last 7 days’ = 1 and ‘Drank less than 7/14 units’ = 0. The base consisted of those who had consumed alcohol in the last 7 days from QD20.
Twenty-seven young people who say that none of their friends drink answered QD21 (how many and 4 what types of drinks they have drunk in the last 7 days).
‘Has been drunk more than once’ versus ‘Has been drunk once’ or ‘has never been drunk’, as 5 defined by QD22. We modelled the likelihood that they have been drunk more than once, so our binary variable was ‘Has been drunk more than once’ = 1, ‘Has been drunk only once or never’ = 0. The base consists of those who have had an alcoholic drink from QD10.
86 References
References
Abbott-Chapman, J. and Denholm, C. (2001) ‘Adolescent risk activities, risk hierarchies and the influence of religiosity’, Journal of Youth Studies, 4, 3, 279–298
Alcohol Concern (2007) Cheap at twice the price: Young People, Purchasing Power and Alcohol. London: Alcohol Concern
Bachman, J., O'Malley, P., Schulenberg, J., Johnston, L., Freedman-Doan, P. and Messersmith, E. (2008) The Education-Drug Use Connection: How Successes and Failures in School Relate to Adolescent Smoking, Drinking, Drug Use, and Delinquency. New York: Lawrence Erlbaum Associates/Taylor & Francis
British Medical Association (2003) Adolescent Health. London: British Medical Association
CASA (2004, 2005, 2006, 2007, 2009) The Importance of Family Dinners, I,II,III,IV,V. New York: National Center on Addiction and Substance Abuse at Columbia University
Christenson, P. G., Henriksen, L., and Roberts, D. F. (2000) Substance Use in Popular Prime-Time Television. Available at: www.nmpreventionnetwork.org/primetimetv.pdf [Accessed 24 March 2011]
Commons Hansard (5 January 2011) Column 160 Available at: http://www.publications.parliament.uk/pa/cm201011/cmhansrd/cm110125/debtext/110125-0001.htm [Accessed 24 March 2011]
Crum, R., Juon, H-S., Green, K., Robertson, J., Fothergill, K. and Ensminger, M. (2006) ‘Educational achievement and early school behaviour as predictors of alcohol-use disorders: a 35-year follow-up of the Woodlawn Study’, Journal of Studies on Alcohol, 67, 75–85
Dalton, M., Bernhardt, A., Gibson, J., Sargent, J., Beach, M., Adachi-Mejia, A., Titus-Ernstoff, L. and Heatherton, T. (2005) ‘Use of cigarettes and alcohol by preschoolers while role-playing as adults – “Honey, have some smokes”’, Archives of Pediatrics & Adolescent Medicine, 159(9), 854–859
Dalton, M., Adachi-Mejia, A., Longacre, M., Titus-Ernstoff, L., Gibson, J., Martin, S., Sargent, J. and Beach, M. (2006) ‘Parental rules and monitoring of children's movie viewing associated with children’s risk for smoking and drinking’, Pediatrics, 118(5), 1932–1942
Department of Children, Schools and Families, Home Office and Department of Health (2008) Youth Alcohol Action Plan. London: Crown Copyright
Donovan, J., Leech, S., Zucker, R., Loveland-Cherry, C., Jester, J., Fitzgerald, H., Puttler, L., Wong, M. and Looman, W. (2004) ‘Really underage drinkers: Alcohol use among elementary students’, Alcoholism: Clinical and Experimental Research, 28, 341–349
Duncan, S., Duncan, T. and Strycker, L. (2006) ‘Alcohol use from ages 9 to 16: A cohort-sequential latent growth model’, Drug and Alcohol Dependence, 81, 71–81
Faggiano F., Galanti M. R., Bohrn K., Burkhart G., Vigna-Taglianti F., Cuomo G. L., Fabiani L., Panella M.,

87References
Perez T., Siliquini R., van der Kreeft P., Vassara M., Wiborg G. The EU-Dap Study Group (2008) ‘The effectiveness of a school-based substance abuse prevention program: EU-Dap cluster randomised controlled trial’, Preventive Medicine Volume 47, Issue 5, November 2008, 537–543
Forsyth, A. J. M. and Barnard, M. A. (2000) ‘Preferred Drinking Locations of Scottish Adolescents’, Health and Place, 6, 105–115
Fuller, E. (2009) (Ed.) Smoking, drinking and drug use among young people in England in 2008. NHS Information Centre
Girlguiding UK (2008) Celebrities and the Internet Strengthen Their Hold on Young Women. (Online press article, no longer available.)
Harrington, V. (2000) Underage Drinking: Findings from the 1998–99 Youth Lifestyles Survey. London: Home Office
Hellandsjo Bu, E. T., Watten, R. G., Foxcroft, D. R., Ingebrigtsen, J. E. and Relling, G. (2002) ‘Teenage alcohol and intoxication debut: The impact of family socialization factors, living area and participation in organized sports’, Alcohol and Alcoholism, 37, 74–80
Hibell, B., Guttormsson, U., Ahlström, S., Balakireva, O., Bjarnason, T., Kokkevi, A. and Kraus, L. (2009) The 2007 ESPAD report: substance use among students in 35 European countries. Stockholm: Swedish Council for Information on Alcohol and Other Drugs
HM Government (2010) Reducing demand, restricting supply, building recovery: Supporting people to live a drug free life. London: HM Government
Home Office (2006) Underage Drinking: Findings from the 2004 Offending, Crime and Justice Survey, Home Office Research Findings No. 277. London: Home Office
Hughes S., Bellis M., Hughes K. (2008) Risky drinking in North West school children and its consequences: a study of fifteen and sixteen year olds. Liverpool: Centre for Public Health, Liverpool John Moores University
Information Centre for Health and Social Care (2009) Statistics on Alcohol: England, 2009. Available at: http://www.ic.nhs.uk/webfiles/publications/alcoholeng2009/Final%20Format%20draft%202009%20v7.pdf [Accessed 24 March 2011]
Ipsos MORI (2007) Young People and Alcohol Advertising. An investigation of alcohol advertising following changes to the Advertising Code
Ledoux, S., Miller, P., Choquet, M. and Plant, M. (2002) ‘Family structure, parent-child relationships, and alcohol and other drug use among teenagers in France and the United Kingdom’, Alcohol and Alcoholism, 37, 1, 52–60
Martino, S., Collins, R., Ellickson, P., Schell, T. and McCaffrey, D. (2006) ‘Socio-environmental influences on adolescents’ alcohol outcome expectancies: a prospective analysis’, Addiction, 101, 971–983
McVie, S. and Bradshaw, P. (2005) Adolescent Smoking, Drinking and Drug Use. Centre for Law and

88 References
Society, The University of Edinburgh
Nash, S., McQueen, A. and Bray, J. (2005) ‘Pathways to adolescent alcohol use: family environment, peer influence, and parental expectations’, Journal of Adolescent Health, 37(1), 19–28
Newburn, T. and Shiner, M. (2001) Teenage kicks? Young people and alcohol: a review of the literature. Joseph Rowntree Foundation
Pedersen, W. and Kolstad, A. (2000) ‘Adolescent alcohol abstainers: traditional patterns in new groups’, Acta Sociologica, 43, 219–233
Regnerus, M. D. and Elder, G. H. Jr. (2003) Religion and Vulnerability among Low-Risk Adolescents. Social Science Research, 32, 633–658
Roberts, D. F., Henriksen, L. and Christenson, P. G. (1999) ‘Substance Use in Popular Movies and Music’, Washington DC: Office of National Drug Control Policy. Available at: http://www.eric.ed.gov:80/ERICWebPortal/search/detailmini.jsp?_nfpb=true&_&ERICExtSearch_SearchValue_0=ED449404&ERICExtSearch_SearchType_0=no&accno=ED449404 [Accessed 24 March 2011]
Roberts, D., Christensen, P., Henriksen, L. and Bandy, E. (2002) ‘Substance use in popular music videos’, Washington DC: Office of National Drug Control Policy. Available at: http://www.scenesmoking.org/research/SubstanceUseIinMusic.pdf [Accessed 24 March 2011]
Seljamo, S., Aromaa, M., Koivusilta, L., Rautava, P., Sourander, A., Helenius, H. and Sillanpää, M. (2006) ‘Alcohol use in families: a 15-year prospective follow-up study’, Addiction, 101, 984–992
SHEU – Schools Health Education Unit (2007) Young People into 2007 – Alcohol & Drugs. Exeter: SHEU
Simons-Morton, B. (2004) ‘Prospective association of peer influence, school engagement, drinking expectancies, and parent expectations with drinking initiation among sixth graders’, Addictive Behaviors, 29(2), 299–309
Smith, L. and Foxcroft, D. (2007) The effect of alcohol advertising and marketing on drinking behaviour in young people: A systematic review. Alcohol Education and Research Council
Velleman, R. (2009) Children, young people and alcohol: how they learn and how to prevent excessive use. Joseph Rowntree Foundation. Available at: http://www.jrf.org.uk/publications/young-people-alcohol-excessive-prevention [Accessed 24 March 2011]
Wood, M., Read, J., Mitchell, R. and Brand, N. (2004) ‘Do parents still matter? Parent and peer influences on alcohol involvement among recent high school graduates’, Psychology of Addictive Behaviors, 18(1), 19–30
Wood, M. (2007) ‘Parenting practices and adolescent alcohol use’ (Editorial), Addiction, 102, 1019–1020

89List of appendices
List of appendices
List of appendices included in the supporting Technical Document
Appendix 1: Domains and influences with corresponding question numbers
Appendix 2: Self-completion questionnaire
Appendix 3: Sample design and profile
Appendix 4: Design effects
Appendix 5: Year 9 topline
Appendix 6: Year 11 topline
Appendix 7: Measuring consumption – conversion rates
Appendix 8: Model output
Appendix 9: Binary logistic regression
Appendix 10: Significant predictors
Appendix 11: Model validation
Appendix 12: Controlling for demographics in the model

90 Acknowledgements and About the authors
AcknowledgementsThe research team from Ipsos MORI and University of Bath would like to thank sincerely all the schools and students who gave their time and participated in the survey.
Many thanks also go to the Joseph Rowntree Foundation, specifically Claire Turner, and to Charlie Lloyd (formerly of JRF, now University of York), as well as the Project Advisory Group for their support, advice and enthusiasm.
The Project Advisory Group consists of Professor Richard Velleman (University of Bath), Betsy Thom (Middlesex University), Lesley Smith (Oxford Brookes University), Andrew McNeill (Institute of Alcohol Studies), Robert Street (Home Office) and Clive Henn (Department of Health).
Thanks also go to Matthew Scott, Director of Tonic Consulting, for his policy and practice insight and Emma Wallace of Ipsos MORI for her advice and guidance in the development of the study.
About the authorsThe authors are: Pamela Bremner, Jamie Burnett, Fay Nunney and Mohammed Ravat of Ipsos MORI, and Dr Willm Mistral of Avon & Wiltshire Mental Health Trust & University of Bath.

The Joseph Rowntree Foundation has supported this project as part of its programme of research and innovative development projects, which it hopes will be of value to policy-makers, practitioners and service users. The facts presented and views expressed in this report are, however, those of the authors and not necessarily those of JRF.
A pdf version of this publication is available from the JRF website (www.jrf.org.uk). Further copies of this report, or any other JRF publication, can be obtained from the JRF website (www.jrf.org.uk/publications)
A CIP catalogue record for this report is available from the British Library.
All rights reserved. Reproduction of this report by photocopying or electronic means for non-commercial purposes is permitted. Otherwise, no part of this report may be reproduced, adapted, stored in a retrieval system or transmitted by any means, electronic, mechanical, photocopying, or otherwise without the prior written permission of the Joseph Rowntree Foundation.
© Pamela Bremner, Jamie Burnett, Dr Willm Mistral, Fay Nunney, Mohammed Ravat 2011 First published 2011 by the Joseph Rowntree Foundation
ISBN: 978-1-85935-830-6 (pdf)
Original design by Draught AssociatesProject managed and typeset by Cambridge Publishing Management Limited
Joseph Rowntree FoundationThe Homestead40 Water EndYork YO30 6WPwww.jrf.org.uk
www.jrf.org.uk


