
www.vtpi.org
250-360-1560
Todd Alexander Litman © 2015-2016 You are welcome and encouraged to copy, distribute, share and excerpt this document and its ideas, provided the author is
given attribution. Please send your corrections, comments and suggestions for improvement.
When Are Bus Lanes Warranted? Considering Economic Efficiency, Social Equity and Strategic Planning Goals
25 November 2016
By Todd Litman
Victoria Transport Policy Institute
Many cities are implementing bus lane networks to increased transport system efficiency and equity, but few are implementing them to the degree that is justified by their total long-term benefits.
Abstract This report describes a framework for determining when bus lanes are warranted based on economic efficiency, social equity and strategic planning objectives. Bus lanes increased urban transport system efficiency and equity by favoring higher value trips and more space-efficient modes over lower-value trips and space-intensive modes. Bus lanes can carry more passengers than general traffic lanes, and so increase total capacity (people per traffic lane), increase transit system operating efficiency, directly benefit bus passengers, cause travellers to shift from automobile to transit which reduces various transportation problems, and support more transit-oriented development. This paper examines how these impacts are considered in conventional planning, describes examples of bus lane planning and evaluation, and discusses ways to optimize their implementation. Much of this analysis also applies to other transit improvements, such as increased service frequency, and other managed lane types such as HOV and HOT lanes. This paper should be of interest to policy analysts, transport planners and engineers, and transit advocates.
A shorter version of this report was presented at the Threadbo 14 Conference
September 2015, Santiago, Chile

When Are Bus Lanes Warranted? Victoria Transport Policy Institute
2
“A developed country is not a place where the poor have cars. It's where the rich use public transportation.” ― Enrique Penalosa, Mayor of Bogota, Colombia
1. Introduction Cities are, by definition, places where many people and activities locate close together, so urban space, particularly road space, is always scarce and valuable. As a result, to be efficient and equitable urban roadway management must favor higher value trips and more space-efficient modes under congested conditions, so travellers will choose more efficient modes, for example, using buses and ridesharing (car- and vanpools) when commuting on congested corridors. There are several possible ways to favour higher value and space-efficient trips, including road pricing, or priority intersection treatments and dedicated lanes for certain vehicles such as freight trucks, buses and High Occupancy Vehicles (HOVs). This report focuses on bus lanes (Figure 1), and their variations such as HOV and High Occupant Tolls (HOT) lanes. Bus lanes can significantly increase transport system efficiency and equity; this study suggests that they are widely justified. However, few cities implement comprehensive bus lane networks, and many proposed bus lanes have been delayed, abandoned, or compromised (such as allowing lower occupant vehicles, motorcycles and alternative fuelled vehicles) due to inadequate benefit analysis and political opposition. Figure 1 Bus Lane Examples (Arbury 2010)
Curb Bus Lanes Center Bus Lanes
Arterial bus lanes can be located along the curb or center median.
This paper explores these issues. It discusses bus lane benefits and costs, examines how they are evaluated in conventional planning, provides guidance for identifying when bus lanes are justified, and describes ways to support their implementation. This is part of broader discussions concerning how best to improve public transit, efficiently manage road space, and evaluate transport system performance. Many of these conclusions apply to other transit improvements and roadway management strategies. This analysis should be of interest to policy analysts, transport planners and engineers, and transit advocates.

When Are Bus Lanes Warranted? Victoria Transport Policy Institute
3
2. Bus Lanes and Variations Bus lanes are roadway lanes dedicated to bus use. Variations include HOV lanes which accommodate buses and rideshare vehicles that carry a designated minimum number of passengers (often 2+ or 3+), and High Occupant Toll (HOT) lanes which accommodate buses, rideshare and toll-paying vehicles. These lanes sometimes accommodate other vehicle types including motorcycles, alternative fuelled vehicles, and freight trucks. Several current trends support bus lane development: many residents and communities want transit service improvements in order to respond to changing consumer demands, and to help achieve planning objectives such as reducing traffic and parking congestion, improving mobility options for non-drivers, and reducing traffic accidents and pollution emissions (Levinson and Krizek 2015). Bus lanes are a type of managed lanes (FHWA 2015), a transit improvement strategy (Kittleson & Associates 2013), a Bus Rapid Transit (BRT) feature (APTA 2010; ITDP 2013), and a component of Complete Streets planning (SGA 2015). Many cities are developing comprehensive rapid bus networks (Boyle 2013; Hook, Lotshaw and Weinstock 2013; Walker 2015), as illustrated in Figure 2. Urban planning often focuses on the efficiency and attractiveness of grade-separated rail transit while undervaluing grade-separated bus lanes. For example, although London famous for its subway system and congestion pricing, its bus network is a critical part of its transport system (TfL 2014). Figure 2 Examples of Comprehensive Bus Network Plans
Houston, Texas Transit Network Auckland Comprehensive Transit Network
Mexico City Transit Plan Los Angeles Frequent Bus Network
Many cities are developing comprehensive rapid bus networks. Their cost efficiency and effectiveness at attracting discretionary riders significantly increases if they include grade-separated bus lanes in congested areas.

When Are Bus Lanes Warranted? Victoria Transport Policy Institute
4
3. Bus Lane Impacts This section examines how bus lanes affect travel, and their overall benefits and costs.
Travel Impacts Under certain conditions, bus lanes can significantly increase bus travel speeds and reliability (Currie and Sarvi 2012; Boyle 2013). On congested roads, dedicated lanes can double or triple bus travel speeds (Figure 3), although, since only a minor portion of total but travel occurs under such conditions and congestion is just one of several causes of transit delay (bus travel requires time to access bus stops, wait for buses, dwell time loading and unloading passengers, plus intersection delay), by themselves bus lane may only reduce a small portion of total travel times. Figure 3 Relative Travel Speeds By Facility Type (Kittleson & Associates 2013)
Under typical congested urban conditions, curb bus lanes approximately double, and fully grade-separated busways (which eliminate stops at intersections) approximately triple, bus operating speeds.
Increasing transit travel speed and reliability tend to increase ridership (Handy, et al. 2013). Paulley, et al. (2006) estimate the elasticity of bus trips with respect to travel time is typically -0.4 to -0.6, so a 10% travel time savings typically increases ridership by 4-6%. This suggests that typical bus lanes that reduce total transit door-to-door travel times by 5-15% will by themselves increase urban-peak ridership 2-9%. Larger gains are possible if bus lanes are implemented in conjunction with other pro-transit policies such as other service improvements and incentives: ridership increases of 10-40% are often reported by Bus Rapid Transit programs (EMBARQ India 2009; Weinstock, et al. 2009). Currie and Sarvi (2012) used Melbourne, Australia data to model the transit ridership gains and automobile travel reductions provided by transit travel time savings. They found significant vehicle travel reductions from modest time savings (Figure 4). Figure 4 Transit Ridership Gains from Transit Travel Time Savings (Currie and Sarvi 2012)
Even modest transit travel time savings (less than 20%) can provide significant increases in transit ridership and reductions in automobile travel on affected corridors.
0%
20%
40%
60%
80%
100%
Mixed Traffic Semi-Exclusive(Curb Bus Lane)
Exclusive(Median Bus Lane)
Fully Grade-Separated Busway
Re
lati
ve T
rave
l Sp
eed
s

When Are Bus Lanes Warranted? Victoria Transport Policy Institute
5
Not all of the additional transit trips substitute for automobile travel; some of the new passengers would otherwise walk, bike or rideshare. On the other hand, high quality transit tends to have leverage effects; an increase in transit travel can provide a proportionately larger reduction in automobile travel if transit helps create more compact, walkable, transit-oriented neighborhoods where residents tend to own fewer automobiles, drive less and rely more on alternative modes, reducing additional automobile trips beyond just those that shift from automobile to transit on that route (ICF 2008; Litman 2015). Based on data from numerous bus priority projects, Harvey, Tomecki and Teh (2012) developed a Bus Priority Assessment Tool (BAT) that can predict the travel time savings, ridership gains, and automobile travel reductions from specific bus priority measures, and evaluate their ability to achieve various planning objectives. Benefits and Costs Table 1 categorizes various bus lane benefits and costs. By increasing travel speeds, bus lanes directly benefit bus passengers. They increase transit operating efficiency (more passenger-kilometers per bus-hour). Increased ridership increases fare revenues. To the degree that new transit trips displace automobile travel they reduce external costs including traffic and parking congestion, accident risk and pollution emissions. Bus lanes can be a catalyst for transit-oriented development, which, by reducing residents per capita vehicle travel, tends to provide additional indirect benefits. Bus lanes can also impose costs. Bus lanes increase construction and enforcement costs, complicate traffic operations, reduce general traffic capacity, and sometimes displace on-street parking. Some bus lanes, particularly high capacity BRT systems, require additional road space for stations, and wider sidewalks to improve pedestrian access. Table 1 Bus Lane Benefits and Costs (Litman 2015)
Category Improved Transit Service
Increased Transit Travel
Reduced Automobile Travel
Transit-Oriented Development (TOD)
Indicators Service Quality
(speed, comfort, etc.) Transit Ridership
(trips or mode share) Automobile Travel
Reductions Portion of Development in
TODs
Benefits
Improved transit operating efficiency
Improved bus passenger travel speed and reliability
Option value (value of having options that may sometime be useful)
Equity benefits (since existing users tend to be disadvantaged)
Direct benefits to new users
Increased fare revenue
Increased public fitness and health (by stimulating more walking or cycling trips)
Reduced traffic and parking congestion, and resulting facility cost savings
Consumer savings
Reduced chauffeuring burdens
Increased traffic safety
Energy conservation
Air and noise pollution reductions
Additional vehicle travel reductions (“leverage effects”), such as a shift to walking
Improved accessibility, particularly for non-drivers
Reduced infrastructure costs from more compact development
Farmland and habitat preservation
Costs
Additional construction, operation and enforcement costs
Reduced traffic capacity and more congestion in adjacent lanes
Reduced parking supply More crowded buses Reduced automobile business activity
Various problems associated with denser development
Bus lanes can have various benefits and costs that should be considered in evaluation. Some of these impacts are indirect and long-term, so their evaluation requires predictive modeling of travel and land development.

When Are Bus Lanes Warranted? Victoria Transport Policy Institute
6
Bus lanes increase travel options, reflecting the principle of consumer sovereignty. Without bus lanes urban travellers must choose between congested automobile or bus travel; with bus lanes they choose between congested automobile or uncongested bus travel, allowing travellers to choose the best option for each trip. Travellers who shift from driving to transit in response to bus lanes are generally better off overall (they gain consumer surplus), or they would not change mode.
Bus lanes can provide substantial safety benefits (Duduta, et al. 2014), an impact that is often overlooked or undervalued in conventional evaluations. Goh, et al. (2013) analyzed traffic accident data from Melbourne, Australia bus priority strategies. Their audit identified some safety concerns, such as potentially hazardous interactions where general traffic merges into curb bus lanes in order to make turns, plus greater pedestrian road-crossing distances. However, despite these risks they find that bus lanes provide statistically robust reductions in collisions overall. The city’s bus priority treatments reduced total accidents 14%, and fatal or serious accidents 31% (from 42 to 29 annual incidents). The authors conclude that these findings justify more bus priority measures. Similarly, Naznin, et al. (2015) found that tram signal priority measures reduced crashes by 13.9% and lane priority by 19.4%, including reductions in total and serious crashes as well as vehicle-, pedestrian-, and motorcycle-involved crashes.
Bus lane traffic congestion impacts can be difficult to quantify since congestion tends to maintain self-limiting equilibrium; urban-peak traffic volumes tend to increase to the point that congestion delays discourage any additional peak-period vehicle trips. As a result, marginal increases in roadway capacity or automobile trip reductions generally provide little long-term congestion reductions since the additional capacity is soon filled with latent demand. However, the quality of alternative modes affects the point of congestion equilibrium: if alternatives are poor, congestion can become severe before enough travellers change, but if alternatives are relatively fast and convenient travellers will be more willing to change. Congestion does not disappear, but is less severe than would otherwise occur (Aftabuzzaman, Currie and Sarvi 2011; Litman 2014). Even if bus lanes only shift a fewer percent of total travel from automobile to transit, this consists primarily of peak-period trips, which provides relatively large congestion reductions. For example, although Los Angeles has only 11% transit commute mode share, one study found that transit reduces regional congestion costs by 11% to 38% (Anderson 2013). These benefits depend on the magnitude of transportation system changes, including increases in bus speeds and resulting time and money savings, increases in ridership and reductions in automobile travel, plus changes in land use development patterns. Impacts on motorists depend on whether the bus lanes attract enough peak-period automobile trips to offset any reduction in general traffic capacity. Bus lane economic analysis therefore requires models that can predict these impacts, including the cumulative impacts of integrated transit service improvements and ridership incentives. Current transport models are poor at predicting such impacts and so tend to underestimate bus lane benefits (Brown and Paling 2014; Chen and Naylor 2011; Rodier and Spiller 2012). Bus lanes can help achieve social equity objectives (Darshini, Joshi and Datey 2013). They provide a fairer allocation of road space, so bus passengers receive their fair share of public road space and are not delayed by congestion caused by private automobile traffic, which reflects the principle of horizontal equity (people should bear the costs imposed by their activities). They also increase economic opportunity for physically, economically and socially disadvantaged people, which reflects the principle of vertical equity (public policies should help disadvantaged people).

When Are Bus Lanes Warranted? Victoria Transport Policy Institute
7
4. Transformative Potential of Bus Lane Networks A comprehensive bus lanes network can help cities achieve strategic goals by increasing transit ridership, reducing automobile travel and creating more multimodal transport systems and more compact, transit-oriented development, and illustrated in Figure 5. Figure 5 Potential Indirect Impacts from Transit Travel Time Savings (Currie and Sarvi 2012)
As bus lanes provide greater travel time savings, their indirect impacts increase. A comprehensive bus lane network can increase transit system operating efficiency, increase transit ridership, reduce automobile travel, and stimulate more compact, multimodal development where residents own fewer vehicles, drive less and rely more on walking, cycling and public transit.
Many communities are to various degrees, automobile-dependent, meaning that automobile travel is favoured over walking, cycling and public transit (Kodukula 2011). This creates a self-reinforcing cycle of increasing automobile travel and degraded walking, cycling and transit conditions. Many experts recommend policy reforms to create more multimodal cities, in order to achieve economic efficiency and social equity goals (ADB 2009; Boarnet 2013). This requires transport systems where rich and poor will use the most efficient mode for each trip: walking and cycling for local travel; transit when travelling on busy travel corridors; and automobiles only when they are most efficient overall. Until recently, efforts to create multimodal cities tended to focus on rail transit, but these are costly and require decades to fully develop. Many experts now recommend bus transit improvements, alone or in conjunction with rail transit, to create multimodal transport systems (Embarq 2013; Suzuki, Cervero and Iuchi 2013). An integrated bus lane network supported by other pro-transit policies can make public transit travel speeds competitive with automobile travel, giving travellers more reasons to choose transit. This creates a positive feedback cycle of improved transit services, more diverse transit ridership, more political support for pro-transit policies, and more transit-oriented development (Levinson 2015). Convenient and attractive transit services will attract more middle-class households to transit-oriented neighborhoods where they own fewer vehicles, drive less and rely more on walking, cycling and transit. However, these impacts and benefits can be difficult to predict; current travel models are not very sensitive to qualitative transit service improvements or the synergistic effects of multiple pro-transit policies (Chen and Naylor 2011), and conventional economic evaluation tends to overlook many benefits, such as the household savings, parking cost savings, public safety and health benefits that result from reduced automobile ownership (Litman 2015). As a result, conventional travel models tend to underestimate the full benefits of bus lane network development. The result is a burden-of-proof issue: how much evidence must transit-advocates provide to demonstrate that bus lanes will achieve their potential long-term benefits? Because motorists often bear the immediate costs (they have less roadway capacity) and are politically influential, the burden of proof is often very high, resulting in far smaller bus lane networks than is optimal considering all benefits.

When Are Bus Lanes Warranted? Victoria Transport Policy Institute
8
5. Factors Affecting Bus Lane Impacts and Benefits A key factor affecting bus lane benefits is the magnitude of travel time savings, which provide passenger benefits and reduces transit agency costs, particularly if this reduces the number of buses needed to provide a given level of service. Another key factor is the amount of travel shifted from automobile to bus. As mode shifts increase so will transit passenger time savings, congestion reductions on adjacent lanes, and other vehicle travel reduction benefits. A typical arterial lane can carry up to 800 vehicles per hour, so converting a general traffic lane into a bus lane will increase congestion in other lanes if fewer than 800 peak-period automobile drivers shift to transit, and will reduce congestion if more than 800 peak-period drivers shift. In addition to reducing traffic congestion on that roadway, automobile to transit mode shifts tend to reduce downstream traffic congestion, for example, reducing vehicle traffic on a highway can help reduce surface-street congestion. Bus lane development often causes only modest short-term mode shifts, since it takes time, often years, for travellers to fully adjust to these changes. As a result, automobile traffic congestion often increases initially, although over time this cost tends to decline, and benefits increase, as more travellers shift mode. In that situation, the evaluation should compare the short-term increase in motorist delay against long-term impacts and benefits. Many factors affect these shifts. In most situations, bus lanes can only save a minor portion of a trip’s total time, typically two to ten minutes in a thirty- to sixty-minute commute, which is less than the incremental access and waiting time required for public transit travel. Other factors affect transit mode choice including the transit service convenience and comfort, the price of fares, quality of walking and cycling, road and parking pricing, and the social acceptability of transit travel (Alam, Nixon and Zhang 2015). As a result, total impacts and benefits depend on the degree that other pro-transit policies (Table 2) are implemented with bus lanes. Table 2 Examples of Pro-Transit Policies (VTPI 2015)
Service Improvements Incentives Land Use Changes
Increased service which increases frequency and reduces crowding
Nicer vehicles
Nicer stations
Better user information
More convenient payment systems
Efficient road and parking pricing
Commute trip reduction programs
Fare reductions
Transit marketing and promotion
More compact and mixed development around frequent transit routes
Improved walking and cycling conditions
More affordable housing along frequent transit routes
Many pro-transit policies can encourage public transit ridership, which increases bus lane impacts and benefits.
Bus lane benefit analysis is affected by the quality of traffic models used to predict future traffic impacts. Conventional models are ineffective at evaluating many of these factors, particularly qualitative factors such as comfort and prestige (Rodier and Spiller 2012). In addition, many current models lack congestion feedback (they ignore the tendency of traffic congestion to reach equilibrium). As a result, they tend to underestimate the mode shifting, and exaggerate the intensity of congestion in general traffic lanes, caused by bus lane development.

When Are Bus Lanes Warranted? Victoria Transport Policy Institute
9
6. Evaluation Perspectives Bus lanes can be evaluated in various ways that lead to very different conclusions about their benefits and the conditions in which they are justified, as described below.
Traffic (Vehicle Travel)
Conventional planning tends to evaluate roadway performance based primarily on vehicle travel conditions using indicators such as traffic speeds, congestion delay and roadway level-of-service (LOS). This only justifies bus lanes if they cause enough peak-period drivers to shift to buses so that congestion declines on adjacent lanes, which typically requires shifts of 800 peak-period drivers on arterials and 2,000 drivers on urban freeways. Mobility (Person Travel)
Mobility reflects the travel speed of people, rather than vehicles. This support bus lanes if they provide net travel time savings, so bus passenger time savings more than offset any increase in motorists travel times. Economic Efficiency
Economic efficiency considers total economic benefits and costs. This justifies bus lanes if they provide net benefits, considering all impacts, including bus and automobile passenger travel time, transit operating costs, downstream congestion, parking costs, accident and pollution damages. Accessibility
Accessibility refers to people’s ability to reach desired services and activities, taking account both mobility (travel speed and costs) and travel distances required to reach destinations. This tends to justify bus lanes if they increase mobility or are a catalyst for more compact, mixed development. Social Equity
Horizontal equity assumes that people with similar needs and abilities should receive equal shares of public resources, which suggests that buses, should have priority over lower occupancy vehicles, since they use less road space per passenger-kilometer, and so impose less congestion than lower occupant vehicles. Vertical equity assumes that policies should favor disadvantaged people, and so tends to support bus lanes to the degree that they are used by people with disabilities and low incomes. Social equity objectives tend to justify bus lanes because they more fairly allocate road space and tend to benefit disadvantaged people. Strategic Planning Objectives
A basic principle of good planning is that individual, short-term decisions should support strategic, long-term goals. This tends to justify bus lanes, even if they increase traffic congestion in the short-run, if they help create more efficient transport systems, and so help achieve long-term goals.
Table 3 compares various bus lane evaluation perspectives. More comprehensive evaluation tends to justify more bus lane implementation. Table 3 Bus Lane Evaluation Perspectives
Perspective Planning Goal Performance Indicators
Vehicle traffic Maximize vehicle traffic speeds Vehicle travel speeds and delay, roadway LOS
Mobility Maximize passenger travel speeds Multimodal LOS (travel speed by various modes)
Accessibility Maximize people’s ability to reach desired services and activities
Time and money required to reach various services and activities (e.g., schools, jobs, shops, etc.)
Social equity People receive a fair share of public resources, such as road space
Degree that roadway management favors space-efficient and affordable modes (ridesharing and bus)
Economic Efficiency
Transport management favors higher value trips and more efficient modes.
Efficient pricing of congested facilities. Freight and HOV priority.
Strategic Planning
Individual, short-term decisions support strategic, long-term goals
Degree that roadway policies and planning reflect strategic goals.
Different perspectives reflect different assumptions concerning what type of roadway management is efficient and equitable, and how roadway performance should be evaluated.
When Are Bus Lanes Warranted? Victoria Transport Policy Institute
10
7. Bus Lane Warrants This section describes examples of existing bus lane warrants.
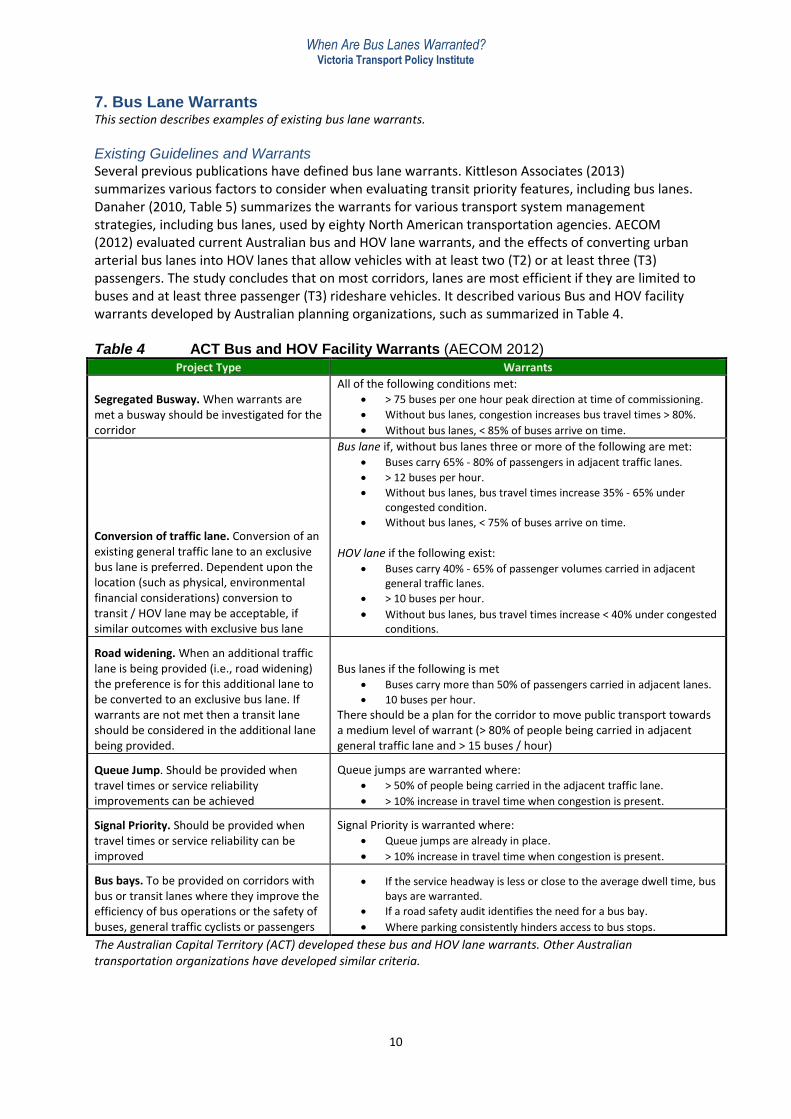
Existing Guidelines and Warrants Several previous publications have defined bus lane warrants. Kittleson Associates (2013) summarizes various factors to consider when evaluating transit priority features, including bus lanes. Danaher (2010, Table 5) summarizes the warrants for various transport system management strategies, including bus lanes, used by eighty North American transportation agencies. AECOM (2012) evaluated current Australian bus and HOV lane warrants, and the effects of converting urban arterial bus lanes into HOV lanes that allow vehicles with at least two (T2) or at least three (T3) passengers. The study concludes that on most corridors, lanes are most efficient if they are limited to buses and at least three passenger (T3) rideshare vehicles. It described various Bus and HOV facility warrants developed by Australian planning organizations, such as summarized in Table 4. Table 4 ACT Bus and HOV Facility Warrants (AECOM 2012)
Project Type Warrants
Segregated Busway. When warrants are met a busway should be investigated for the corridor
All of the following conditions met: > 75 buses per one hour peak direction at time of commissioning.
Without bus lanes, congestion increases bus travel times > 80%.
Without bus lanes, < 85% of buses arrive on time.
Conversion of traffic lane. Conversion of an existing general traffic lane to an exclusive bus lane is preferred. Dependent upon the location (such as physical, environmental financial considerations) conversion to transit / HOV lane may be acceptable, if similar outcomes with exclusive bus lane
Bus lane if, without bus lanes three or more of the following are met: Buses carry 65% - 80% of passengers in adjacent traffic lanes.
> 12 buses per hour.
Without bus lanes, bus travel times increase 35% - 65% under congested condition.
Without bus lanes, < 75% of buses arrive on time.
HOV lane if the following exist:
Buses carry 40% - 65% of passenger volumes carried in adjacent general traffic lanes.
> 10 buses per hour.
Without bus lanes, bus travel times increase < 40% under congested conditions.
Road widening. When an additional traffic lane is being provided (i.e., road widening) the preference is for this additional lane to be converted to an exclusive bus lane. If warrants are not met then a transit lane should be considered in the additional lane being provided.
Bus lanes if the following is met Buses carry more than 50% of passengers carried in adjacent lanes.
10 buses per hour.
There should be a plan for the corridor to move public transport towards a medium level of warrant (> 80% of people being carried in adjacent general traffic lane and > 15 buses / hour)
Queue Jump. Should be provided when travel times or service reliability improvements can be achieved
Queue jumps are warranted where: > 50% of people being carried in the adjacent traffic lane.
> 10% increase in travel time when congestion is present.
Signal Priority. Should be provided when travel times or service reliability can be improved
Signal Priority is warranted where: Queue jumps are already in place.
> 10% increase in travel time when congestion is present.
Bus bays. To be provided on corridors with bus or transit lanes where they improve the efficiency of bus operations or the safety of buses, general traffic cyclists or passengers
If the service headway is less or close to the average dwell time, bus bays are warranted.
If a road safety audit identifies the need for a bus bay.
Where parking consistently hinders access to bus stops.
The Australian Capital Territory (ACT) developed these bus and HOV lane warrants. Other Australian transportation organizations have developed similar criteria.

When Are Bus Lanes Warranted? Victoria Transport Policy Institute
11
Brown and Paling (2014) recommend the following special lane (truck, bus, HOV, etc.) warrants: Has project Benefit/Cost Ratio over 1.0, or Net Present Values over 0.
Increases monetized productivity (value of time and operating costs).
Increases total corridor person trips.
Special lanes (excluding truck lanes) carry more people than adjacent traffic lanes.
Raise level-of-service rating above D.
Bus stop volume-capacity ratio is less than 1.0 (along bus route as a proxy for reliability).
The Los Angeles Metropolitan Transportation Authority (LAMTA 2012) generally implements bus lanes on roads with the following features:
25 minimum one way peak hour bus volumes
1,000 minimum one way peak hour passenger volumes
15% minimum time savings per passenger-trip
At least 11, preferably 12 feet wide, and 16.5 feet wide for a shared bus/bike lane
Preferably continuous for at least five miles.
PPK (2000) recommends considering the following factors when determining bus lane warrants:
Person carrying capacity – the special vehicle lane should carry at least as many people as the adjacent traffic lane, irrespective of whether the general purpose lanes are operating at capacity.
Public transit operations – lane use should be restricted to ensure that buses operate efficiently and do not conflict with other vehicles or pedestrians.
Marketing – where minimum criteria cannot be met upon opening, a short-term programme to boost lane usage will be required along with regular performance reporting and monitoring.
Economic efficiency – the special vehicle lane should have a benefit-cost ratio of 1.0 or greater.
Auckland Transport (2011) developed warrants for special vehicle lanes based on the public transport service frequency, the hierarchy of the corridor in the public transport network, the level of service in the special vehicle lane, and the degree it supports the city’s strategic planning objectives. Currie, Sarvi and Young (2007) developed a framework for evaluating bus and tram priority projects (Figure 6), which considers a comprehensive range of impacts including public transport reliability and environmental benefits. They critique previous approaches, including a comparison of modelling methods and impacts considered in previous bus lane evaluation frameworks. They conclude that, even using comprehensive analysis, road-space reallocation is often difficult to justify where public transport usage is low and car usage high, and so often requires transit encouragement strategies. Figure 6 Bus Lane Evaluation Framework (Currie, Sarvi and Young 2007)
This figure summarizes a bus lane economic evaluation framework which considers various direct and indirect impacts.

When Are Bus Lanes Warranted? Victoria Transport Policy Institute
12
Bitzios Consulting (2004 and 2007) recommend that the factors below be consider when evaluating bus priority systems, and that bus priority treatments are sometimes justified, even if they currently carry fewer passengers than general traffic lanes, if that can cause automobile to bus mode shifts.
Bus passenger volumes relative to a general traffic lane. Bus frequency. Degree that bus service is delayed by congestion. On-time transit operation.
Prior to 2003, the Seoul Metropolitan Government considered bus lanes warranted on urban arterials with 1,800 passengers per hour for the Right Side (curb) bus lanes, and 4,500 passengers per hour for exclusive Left Side (median) bus lanes, or at least 60 to 120 buses per peak hour, but Kim (2003) argues that standard is excessive since it can lead to bus lanes being rejected on highly congested urban streets where low traffic speeds limit bus volumes. He suggests that bus lanes are warranted where they would maintain bus speeds above the speed of general traffic during peak periods (excluding bus stop dwell time), or at least roadway Level-Of-Service D. NCHRP Report 155, Bus Use of Highways: Planning and Design Guidelines, proposed the bus lane warrants summarized in Table 5. Table 5 Bus Lane Warrants (Levinson, Adams and Hoey 1975)
Treatment Minimum One-Way Peak-Hour Volume
Related Land Use and Transportation Factors
Buses Passengers
Bus streets or malls 80-100 3,200-4,000 Commercially oriented frontage.
Curb bus lanes, normal flow 50-80 2 000-3 200 Commercially oriented frontage.
Curb bus lanes, normal flow 30-40 1,200-1,600 At least 2 lanes available for other traffic in same direction.
Median bus lanes 60-90 2,400-3,600 At least 2 lanes available for other traffic in same direction; ability to separate vehicular turn conflicts from buses.
Contraflow bus lanes, short segments 20-30 800-1,200
Allow buses to proceed on normal route, turn around or bypass congestion on bridge approach.
Contraflow bus lanes, extended 40-60 1,600-2,400
At least 2 lanes available for other traffic in opposite direction. Signal spacing greater than 150-m intervals
A National Cooperative Highway Research Program report recommends these bus lane warrants.
Poole (2012) indicates that dedicated bus lanes may be justified on routes with ten or more buses per peak hour, but are inefficient. “Even with one-minute headways (60 buses per hour), an exclusive expressway lane can handle 1,600 vehicles per hour at uncongested LOS C conditions. Restricting that lane only to buses would mean wasting over 1,500 spaces each hour that could be occupied by other vehicles without congestion.” He therefore recommends HOT lanes on most routes. This indicates the wide range of possible bus lane warrants. The most restrictive (they require the most peak-period buses or transit passengers) only consider roadway traffic impacts and so only justify bus lanes that reduce congestion on other lanes. Less restrictive warrants (they require fewer buses or passengers to justify bus lanes) also recognize the value of bus passengers’ travel time, and so can justify bus lanes even if they increase general traffic delays, provided that total (bus and auto passenger) travel times decline, plus transit service efficiency gains and automobile travel reductions that reduce downstream congestion, parking costs, accidents and pollution emissions. The least restrictive (they require the fewest buses and transit passengers to justify bus lanes) also consider social equity objectives, such as improved mobility for disadvantaged travellers, and strategic goals, such as efforts to create more multimodal transport systems and transit-oriented development.

When Are Bus Lanes Warranted? Victoria Transport Policy Institute
13
Factors to consider when evaluating bus lanes are discussed below.
Travel Efficiency
Travel efficiency bases bus lane warrants on total passenger travel time. Since buses generally carry more passengers than automobiles, bus lanes are often justified if they reduce total passenger travel times, even if they reduce speeds in general traffic lanes. For example, if bus lanes cause 1,000 bus passengers to save 5 minutes per peak-hour trip, these lanes are justified even if, by increasing general traffic lane delays they cause 2 minutes of incremental delay to 2,000 automobile passengers, since the total transit passenger time savings (5,000 minutes) is larger than the total automobile passenger incremental delay (4,000 minutes). Some economists base travel time valuations on wages, which tends to reduce the value of bus travel time savings, but this is controversial and generally not applied in developed countries since the savings are primarily personal travel time, and so represent a transfer from lower- to higher-income travellers. Economic Efficiency
Comprehensive economic evaluation considers other bus lane benefits, besides travel time savings, such as transit efficiency gains, consumer financial savings, social equity objectives, plus various benefits from reduced automobile travel including traffic and parking congestion reductions, road and parking facility cost savings, and reduced accidents and pollution emissions. Considering these additional benefits, bus lanes may be justified even if they carry fewer passengers than a general traffic lane, if they provide net economic savings. Because these impacts are diverse and sometimes difficult to measure, comprehensive evaluation should describe, and as much as possible, quantify the impacts listed in Table 1 of this report, including possible long-term and indirect impacts provided by transit-oriented development. Analysis reports should describe impacts that are not quantified, and discuss how this affects results. For example, when comparing various potential congestion reduction strategies, economic analysis should note that bus lanes tend to achieve additional planning objectives, besides reducing congestion, as illustrated in the following table.
Table 6 Comparing Strategies
Planning Objective Roadway Expansions Flyovers Bus Lanes
Traffic congestion reduction
Parking congestion reduction
Roadway facility costs savings
Consumer savings and affordability
Increased traffic safety
Improved mobility options for non-drivers
Energy conservation
Pollution reduction
Strategic planning objectives (more compact, multimodal development)
Improved public fitness and health
Roadway expansions and intersection flyovers can reduce traffic congestion, but provide few other benefits, and to the degree that they induce additional vehicle travel, they can exacerbate problems such as parking problems, accidents and pollution emissions. Public transit improvements, such as bus lanes, tend to provide a greater range of benefits.
Consumer Sovereignty and Social Equity
Road space can be allocated based on a corridor’s peak-period mode share, so bus lanes are warranted if enough road users travel by bus. This responds to consumer demands (travellers who prefer to use transit, provided it is relatively fast) and ensures that non-drivers receive a fair share of public road space. For example, if buses carry 33% of peak-period passengers, it is

When Are Bus Lanes Warranted? Victoria Transport Policy Institute
14
efficient and fair to devote 33% of available road right-of-way to bus lanes. This analysis should consider corridor roadway capacity, including road lanes on parallel routes, so for example, if buses carry 33% of travel on a corridor that has three two-lane arterials, it would be appropriate to devote one of those roads to bus lanes. To the degree that disadvantaged people rely on bus transport, bus lanes may be justified with somewhat lower mode shares in order to help achieve vertical equity objectives. Strategic Planning Goals
Another way to define bus lane warrants is based on the degree that it helps support strategic goals, such as efforts to create more resource efficient and multimodal transport systems, and to encourage more compact development. Multimodal communities have most houses, jobs and major public services (schools, hospitals, recreation centers, etc.) located within a ten-minute walk from frequent public transit services. Bus lanes are therefore warranted wherever needed to create such a transit network.
This indicates that bus lanes are generally warranted where, after all economically-justified pro-transit policies are implemented, they would attract more than 800 peak-hour passengers (about 20 buses) on urban surface streets or 1,800 peak-hour passengers (about 40 buses) on grade-separated urban highways, since they carry more passengers than a general traffic lane, and provide additional benefits, including helping to achieve social equity objectives and strategic planning goals. Roadways with moderate transit demand and congestion may have HOV lanes which allow car- and vanpools in addition to buses, but not if this degrades bus travel speed or operating efficiency. The following factors can affect bus lane benefits and therefore their justification:
Current and latent bus travel demand, and therefore potential bus passenger volumes.
The portion of travelers who cannot drive (they lack a driver’s license or vehicle) and therefore the social equity benefits of improving public transit services.
The intensity of traffic congestion on affected corridors, and therefore the magnitude of travel time and transit operating cost savings provided by bus lanes.
The magnitude of automobile to transit mode shifts, and the range of benefits provided by urban automobile travel reductions, and therefore the total traffic reduction benefits.
Implementation costs, including construction and incremental operating costs (including increased traffic law enforcement), and increased congestion on general traffic lanes.
The degree that bus lanes are implemented in conjunction with other pro-transit policies that improve transit service quality and encourage transit use.
The degree that bus lanes help achieve strategic planning goals, including increasing public transit operating efficiencies and roadway network congestion reductions, reducing accidents and pollution emissions, achieving social equity objectives, transformational change to create more multimodal transport systems, and supporting transit-oriented development.

When Are Bus Lanes Warranted? Victoria Transport Policy Institute
15
5. Bus Lane Examples This section describes examples of both successful and unsuccessful bus lane projects.
Implementation Examples Brown and Paling (2014) and Harvey, Tomecki and Teh (2012) describe various examples of special travel lanes, including bus lanes, including information on the planning, design, operation and travel impacts of some of these projects. Bus Rapid Transit Programs There are many examples of successful Bus Rapid Transit (BRT) systems, as described in the BRT Database (www.brtdata.org) and other sources (Embarq 2013). The BRT Standard (ITDP 2012) identifies specific attributes that a bus system must have to be considered BRT, which generally includes bus lanes on congested roadways. Indian Cities Indore and New Delhi, India provide examples of BRT that failed due to incomplete analysis of their long-term benefits, and criticism by politically powerful groups (Bruno 2014). Local citizen organizations and media argued that dedicated bus lanes increase traffic congestion and risk. The government commissioned a study of BRT system impacts that considered a narrow range of benefits, for example, measuring vehicle traffic delay rather than passenger traffic delay, weighting values of travel time based on traveller incomes (which increases the value of cars and reduces the value of buses and bicycles), and evaluated performance and safety impacts based on public opinion rather than objective analysis (CSIR 2012). There was no discussion or analysis of the possibility of addressing the traffic problems by implementing more bus lanes and more pro-transit incentives in order to reduce total automobile traffic on the corridor (Hidalgo 2015). In 2015, the Bangalore Metropolitan Transport Corporation (BMTC) proposed developing dedicated lanes on 12 roads (Menezes 2015). BMTC officials argue that buses should receive priority over lower occupant vehicles. “It’s better to take the buses directly to another area through strait routes, while cars, auto-rickshaws and bikes should be given long routes. It helps in promoting public transport and decongestion in the core areas. The BMTC buses spend more time at traffic signals…Making a BMTC bus wait is like making 50-odd passengers wait,” he explained. Bus on Highway Shoulder Lanes (Freemark 2015) Several urban regions allow transit buses to operate on highway shoulders in order to avoid traffic congestion. The Minneapolis-St. Paul region has 300 miles of bus-on-shoulder service. This was introduced in 1991, and has been extended throughout the region, and now serves thousands of buses daily. Buses are authorized to use these lanes when traffic is moving slower than 35 mph. Pace, the Chicago region’s suburban bus operator, introduced bus-on-shoulder operations in 2011 thanks to a change in Illinois state law. The state Department of Transportation spent $9.5 million to upgrade 15 miles of highway from downtown Chicago to Plainfield. The service began as a pilot project with two existing routes—755 and 855. The benefits were immediate: on-time performance, for example, improved from 68% to nearly 95%. By mid-2013, the buses had roughly doubling their daily ridership, so Pace added new trips, including off-peak service. Ridership had continued to increase and in 2014 Pace added more service and divided the 855 into three routes—850, 851 and 855—to accommodate increased demand and simplify the route structure for new customers. These routes now provide 50 total trips daily, and ridership is now more than six times what it was in 2011. The pace of increase does not appear to be slowing. Though the total daily ridership on this corridor remains low compared to some of our region’s top-performing bus lines (about 1,200 daily riders, versus about 30,000 for the Chicago Transit Authority Ashland Avenue bus, for example), the rate of increase clearly demonstrates that reliability and speed improvements increase ridership.

When Are Bus Lanes Warranted? Victoria Transport Policy Institute
16
Highway shoulder bus lanes are also used in Seattle and Washington DC regions. Seattle HOV Lanes The HOV lanes on Interstate-5 through downtown Seattle is an example of failure because political pressure forced the Washington State Department of Transportation to allow 2+ vehicles (a car with just two occupants can use the lane). As a result, the HOV lane is often as congested as general traffic lanes (WSDOT 2015). Evaluation Examples Several studies have evaluated BRT system impacts and benefits (EMBARQ India 2009; Weinstock, et al. 2009), individual bus lanes (AECOM, 2012), and other bus priority treatments (Harvey, Tomecki and Teh, 2012). Many of these evaluate bus lanes based primarily on their direct traffic impacts (whether they reduced congestion on adjacent lanes) or total travel time (whether bus passenger travel time savings offset any increase in automobile travel time), and most evaluate individual bus lanes; few consider additional benefits, such as reduced downstream traffic congestion, parking cost savings, reduced accidents and pollution emissions from reduced automobile travel; and fewer use advanced traffic models to evaluate the total traffic impacts of integrated programs that include comprehensive bus lane networks supported by cost effective pro-transit policies.
When Are Bus Lanes Warranted? Victoria Transport Policy Institute
17
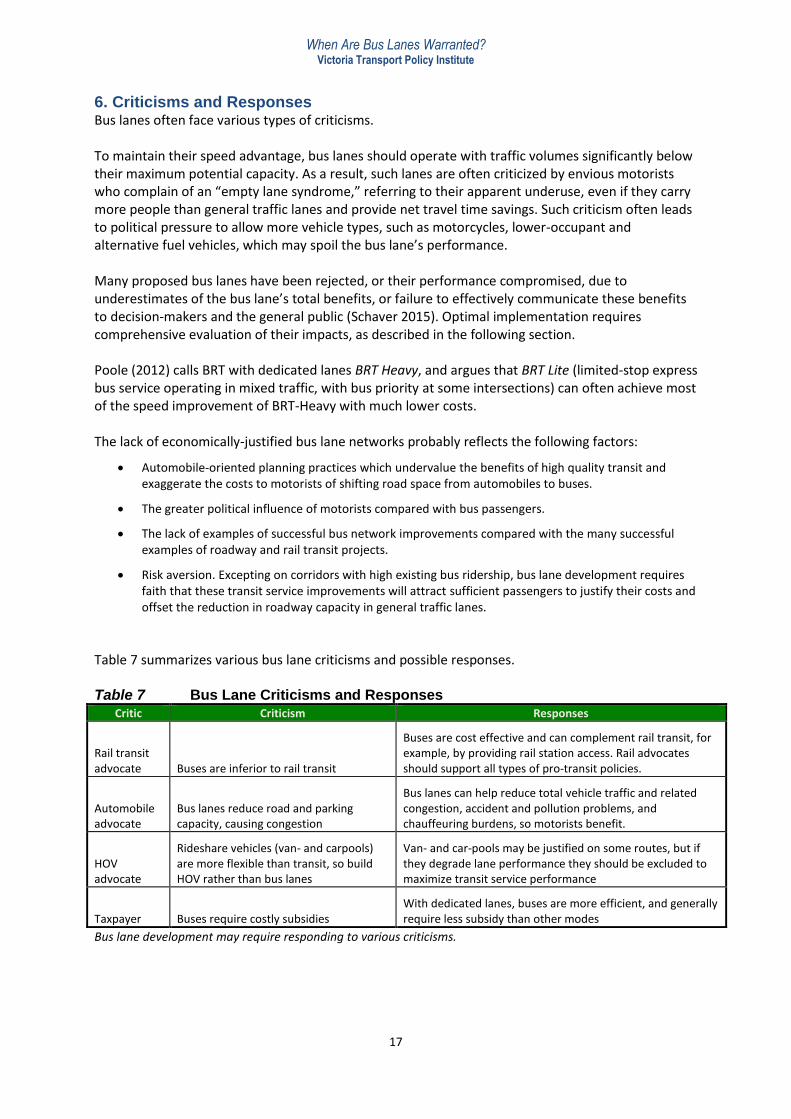
6. Criticisms and Responses Bus lanes often face various types of criticisms. To maintain their speed advantage, bus lanes should operate with traffic volumes significantly below their maximum potential capacity. As a result, such lanes are often criticized by envious motorists who complain of an “empty lane syndrome,” referring to their apparent underuse, even if they carry more people than general traffic lanes and provide net travel time savings. Such criticism often leads to political pressure to allow more vehicle types, such as motorcycles, lower-occupant and alternative fuel vehicles, which may spoil the bus lane’s performance. Many proposed bus lanes have been rejected, or their performance compromised, due to underestimates of the bus lane’s total benefits, or failure to effectively communicate these benefits to decision-makers and the general public (Schaver 2015). Optimal implementation requires comprehensive evaluation of their impacts, as described in the following section. Poole (2012) calls BRT with dedicated lanes BRT Heavy, and argues that BRT Lite (limited-stop express bus service operating in mixed traffic, with bus priority at some intersections) can often achieve most of the speed improvement of BRT-Heavy with much lower costs. The lack of economically-justified bus lane networks probably reflects the following factors:
Automobile-oriented planning practices which undervalue the benefits of high quality transit and exaggerate the costs to motorists of shifting road space from automobiles to buses.
The greater political influence of motorists compared with bus passengers.
The lack of examples of successful bus network improvements compared with the many successful examples of roadway and rail transit projects.
Risk aversion. Excepting on corridors with high existing bus ridership, bus lane development requires faith that these transit service improvements will attract sufficient passengers to justify their costs and offset the reduction in roadway capacity in general traffic lanes.
Table 7 summarizes various bus lane criticisms and possible responses. Table 7 Bus Lane Criticisms and Responses
Critic Criticism Responses
Rail transit advocate Buses are inferior to rail transit
Buses are cost effective and can complement rail transit, for example, by providing rail station access. Rail advocates should support all types of pro-transit policies.
Automobile advocate
Bus lanes reduce road and parking capacity, causing congestion
Bus lanes can help reduce total vehicle traffic and related congestion, accident and pollution problems, and chauffeuring burdens, so motorists benefit.
HOV advocate
Rideshare vehicles (van- and carpools) are more flexible than transit, so build HOV rather than bus lanes
Van- and car-pools may be justified on some routes, but if they degrade lane performance they should be excluded to maximize transit service performance
Taxpayer Buses require costly subsidies With dedicated lanes, buses are more efficient, and generally require less subsidy than other modes
Bus lane development may require responding to various criticisms.

When Are Bus Lanes Warranted? Victoria Transport Policy Institute
18
7. Conclusions Bus lanes can provide various benefits including operating efficiencies, passenger time savings, increased fare revenues, vehicle travel reduction benefits (reduced traffic and parking congestion, facility cost savings, traffic safety, energy conservation and pollution emission reductions), social equity objectives, plus support for strategic planning goals. Even people who never use buses enjoy many of these benefits. All of these impacts should be considered when evaluating bus lanes. Bus lanes are evaluated in various ways that can result in very different conclusions concerning their justification. A narrow perspective only considers direct traffic impacts, and so only justifies bus lanes if they attract enough drivers to reduce congestion on adjacent lanes. More comprehensive evaluation also considers other factors, including total travel time savings, total economic costs and benefits, social equity impacts, and support for strategic planning objectives such as development of more compact and multimodal communities (Figure 7). Comprehensive analysis considers the total, long-run results of bus lanes implemented as part of an integrated program of pro-transit policies. More comprehensive evaluation, better predictive models, a longer analysis period, and bus lanes implemented with complementary transport and land use policies tend to justify more bus lanes. Figure 7 Scope of Bus Lane Impact Analysis
Just
ific
atio
n f
or
Bu
s La
nes
Strategic Objectives – support for more compact, multimodal communities
Social equity benefits – benefits to economically-disadvantaged groups
Total costs and benefits – including changes in travel times, vehicle expenses, accidents and pollution emissions
Total travel time – changes in total (bus and other vehicle) passenger travel times
Traffic congestion – whether other congestion in other lanes increases or declines
More comprehensive evaluation which considers more impacts tends to justify more bus lanes.
This analysis indicates that bus lanes are generally warranted where, after all economically justified pro-transit policies are implemented and they are operating for at least a year, they carry more people during peak periods than adjacent general traffic lanes, and so result in total time savings. This typically means carrying more than 800 peak-hour passengers (about 20 buses) on surface streets or 1,800 peak-hour passengers (about 40 buses) on grade-separated highways. Bus lanes may be justified with lower ridership levels if they provide significant indirect benefits by reducing automobile travel or supporting strategic development objectives, such as creating more compact, multimodal communities. The following factors tend to increase the justifications for high quality transit, and therefore reduce the minimum bus ridership to warrant bus lanes.
More intense traffic congestion on a corridor, resulting in larger time and money savings.
More travelers who for any reason cannot own or operate an automobile.
More latent demand for high quality transit by discretionary travelers (people who would otherwise drive), and therefore larger mode shifts and vehicle travel reduction benefits.
Strategic targets for reducing downstream traffic and parking congestion, road and parking facility costs, accidents, fuel consumption or pollution emissions.
Complementary pro-transit policies and programs implemented with bus lanes.
Financial or geographic constraints which preclude roadway or subway expansion.
A strong desire for transformative policies to create more compact and multimodal communities.

When Are Bus Lanes Warranted? Victoria Transport Policy Institute
19
Here are guidelines for selecting urban roadway management strategies.
1. Where transit demand and congestion are low, bus travel can be encouraged with operational improvements, intersection priority strategies and traffic laws that require motorists to yield to buses entering the traffic flow.
2. Where transit demand and congestion are moderate, roadways should have HOV lanes, which accommodate buses and rideshare vehicles. As congestion increases the minimum number of rideshare vehicle passengers should increase.
3. Where transit demand and congestion are high, urban roadways should have bus lanes. Higher bus volumes justify Bus Rapid Transit features including center (median) lanes, attractive stations with rapid loading, and improved pedestrian and cycling access. Very high bus volumes can justify multiple bus lanes for express buses, and special highway ramps and intersection flyovers.
Current traffic models are poor at predicting the impacts of transit service quality improvements, and current economic evaluation practices tend to undervalue many transit benefits, which undervalues bus lanes. Bus lane development often increases congestion on adjacent lanes in the short term, although this usually declines over time as travellers respond to the transit service improvements, particularly if bus lanes are developed in conjunction with other pro-transit strategies. Although a single bus lane may provide only modest short-term benefits, an integrated bus lane network implemented with other pro-transit policies can be the fastest and most cost-effective way to transform automobile-dependent cities into multimodal metropolises where all types of travellers can choose the most efficient mode for each trip. Bus lane development faces obstacles, including conventional planning which undervalues public transit, rail transit advocates who undervalue buses, and automobile interests that resist road space reallocation to favor space-efficient modes, even if this increases efficient and equity overall. Creating a comprehensive bus lane network requires a more complete understanding of their potential long-term benefits. Transit users in general and bus passengers in particular tend to be politically disenfranchised. Many are youths, poor, people with disabilities, immigrants and visitors. This helps explain many decision-makers reluctance to implement economically-justified bus lanes. To build support for bus lane development advocates must effectively communicate the resulting benefits, demonstrate the cost efficiency of bus lanes compared with other transport system improvements, address concerns and criticisms, and build coalitions with interest groups that have reasons to support efficient and equitable urban transport, including transportation professionals, businesses interested in economic development, and social equity advocates who want to improve affordable travel modes. It can be useful to remind motorists that they may become transit users in the future, for example, if they lose their driving privileges or relocate to a more transit-oriented community, and so may themselves directly benefit from bus lanes.

When Are Bus Lanes Warranted? Victoria Transport Policy Institute
20
7. References ADB (2009), Changing Course: A New Paradigm for Sustainable Urban Transport, Asian Development Bank
(www.adb.org); at http://bit.ly/1g2YHNh. AECOM (2012), Transit Lane Warrants Study, Roads, ACT (www.tams.act.gov.au); at www.tams.act.gov.au/__data/assets/pdf_file/0005/397517/Transit_Lane_Study.pdf. Md Aftabuzzaman, Graham Currie and Majid Sarvi (2010), “Evaluating the Congestion Relief Impacts of Public Transport in Monetary Terms,” Journal of Public Transportation, Vol. 13, No. 1, pp. 1-24; at www.nctr.usf.edu/jpt/pdf/JPT13-1.pdf. Bhuiyan Alam, Hilary Nixon and Qiong Zhang (2015), Investigating The Determining Factors For Transit Travel Demand By Bus Mode In US Metropolitan Statistical Areas, Mineta Transportation Institute (http://transweb.sjsu.edu); at http://bit.ly/1I5Wx8m. Michael L. Anderson (2013), Subways, Strikes, and Slowdowns: The Impacts of Public Transit on Traffic Congestion, Working Paper No. 18757, National Bureau of Economic Research (www.nber.org); at www.nber.org/papers/w18757. Jeffrey Ang-Olson and Anjali Mahendra (2011), Cost/Benefit Analysis Of Converting A Lane For Bus Rapid Transit—Phase II Evaluation And Methodology, Research Results Digest 352, National Highway Research Program; at http://onlinepubs.trb.org/onlinepubs/nchrp/nchrp_rrd_352.pdf. APTA (2010), Bus Rapid Transit Service Design, American Public Transportation Association (www.apta.com); at www.apta.com/resources/standards/Documents/APTA-BTS-BRT-RP-004-10.pdf. J. Arbury (2011), Expanding Auckland’s Bus Lane Network, Transport Blog (http://transportblog.co.nz); at http://transportblog.co.nz/2011/08/21/expanding-aucklands-bus-lane-network-the-next-steps. Marlon G. Boarnet (2013), “The Declining Role Of The Automobile And The Re-Emergence Of Place In Urban Transportation: The Past Will Be Prologue,” Regional Science Policy & Practice, Special Issue: The New Urban World – Opportunity Meets Challenge, Vol. 5/2, June, pp. 237–253 (DOI: 10.1111/rsp3.12007). Daniel K. Boyle (2013), Commonsense Approaches for Improving Transit Bus Speeds A Synthesis of Transit Practice Consultant, TCRP Synthesis 110, Transit Cooperative Research Program, TRB (www.trb.org); at http://onlinepubs.trb.org/onlinepubs/tcrp/tcrp_syn_110.pdf. T. Brown and R. Paling (2014), Getting More From Our Roads: An Evaluation Of Special Vehicle Lanes On Urban Arterials, Research Report 557, NZ Transport Agency (www.nzta.govt.nz); at http://bit.ly/1h9E1TO. Lucien V. Bruno (2014), Contested Road Space: Public Narratives and Bus Rapid Transit in Indore, India, University of New Orleans; at http://scholarworks.uno.edu/cgi/viewcontent.cgi?article=2908&context=td. Chun-Hung Peter Chen and George A. Naylor (2011), “Development of a Mode Choice Model for Bus Rapid Transit in Santa Clara County, California,” Journal of Public Transportation, Vol. 14, No. 4 (www.nctr.usf.edu); at www.nctr.usf.edu/wp-content/uploads/2011/12/JPT14.4.pdf. CSIR (2012), Evaluating Bus Rapid Transit (BRT) Corridor Performance from Ambedkar Nagar to Mool Chand, Delhi, Central Road Research Institute (www.crridom.gov.in); at http://bit.ly/1PvnIw2. Graham Currie, Majid Sarvi and Bill Young (2007), “A New Approach to Evaluating On-Road Public Transport Priority Projects: Balancing the Demand for Limited Road Space,” TRANSPORTATION, Vol. 34, N. 4, pp. 413-428; summary at http://link.springer.com/article/10.1007%2Fs11116-006-9107-3.

When Are Bus Lanes Warranted? Victoria Transport Policy Institute
21
Graham Currie and Majid Sarvi (2012), “A New Model for the Secondary Benefits of Transit Priority,” Transportation Research Record 2276, Transportation Research Board (www.trb.org), pp 63–71; abstract at http://trrjournalonline.trb.org/doi/abs/10.3141/2276-08?journalCode=trr; results at www.wctrs-society.com/wp/wp-content/uploads/abstracts/rio/selected/2491.pdf. Alan R. Danaher (2010), Bus and Rail Transit Preferential Treatments in Mixed Traffic: A Synthesis of Transit Practice, TCRP Report 83, Transit Cooperative Research Program (www.tcrponline.org); at www.tcrponline.org/PDFDocuments/tsyn83.pdf. Nicolae Duduta, et al. (2014), Traffic Safety on Bus Priority Systems: Recommendations for Integrating Safety Into the Planning, Design, and Operations of Major Bus Routes, EMBARQ (www.embarq.org); at www.embarq.org/sites/default/files/Traffic-Safety-Bus-Priority-Corridors-BRT-EMBARQ-World-Resources-Institute.pdf. EC (2009), Reclaiming City Streets For People: Chaos Or Quality Of Life? European Commission Directorate-General For The Environment (www.ec.europa.eu/index_en.htm); at http://bit.ly/1lVvYtW. EMBARQ India (2009), Bus Karo: A Guidebook on Planning and Operations, EMBARQ India (www.embarq.org); at www.embarq.org/publication/bus-karo-guidebook-planning-operations. EMBARQ (2013), Social, Environmental And Economic Impacts Of BRT Systems: Bus Rapid Transit Case Studies from Around the World, EMBARQ (www.embarq.org); at http://bit.ly/1SXo5QF. FHWA (2015), Managed Lanes Website, Federal Highway Administration (www.fhwa.dot.gov); at http://ops.fhwa.dot.gov/freewaymgmt/managed_lanes.htm. Yonah Freemark (2015), Talking Transit: Bus on Shoulder Builds Pace Ridership, The Connector: The Blog of the Metropolitan Planning Council (www.metroplanning.org); at www.metroplanning.org/news/blog-post/7242. Kelvin Goh, et. al. (2013), “Road Safety Benefits from Bus Priority? – An Empirical Study,” Transportation Research Record 2352, Transportation Research Board (www.trb.org), pp. 41–49; summarized in www.ugpti.org/trb/truckandbus/meetings/2014/downloads/2014bus_priority.pdf. Susan Handy, Kristin Lovejoy, Steve Spears and Marlon G. Boarnet (2010), Draft Policy Brief on the Impacts of Transit Service Strategies Based on a Review of the Empirical Literature, Research on Impacts of Transportation and Land Use-Related Policies, California Air Resources Board (http://arb.ca.gov/cc/sb375/policies/policies.htm). M. Harvey, A. Tomecki and C. Teh (2012), Identify, Evaluate And Recommend Bus Priority Interventions, Research Report 506, New Zealand Transport Agency (http://nzta.govt.nz); at http://nzta.govt.nz/resources/research/reports/506/docs/506.pdf. Dario Hidalgo (2015), Learning from Delhi’s BRT Failure, and Looking to the City’s Future, The City Fix (http://thecityfix.com); at http://thecityfix.com/blog/learning-from-delhis-brt-failure-looking-citys-future-dario-hidalgo. Walter Hook, Stephanie Lotshaw and Annie Weinstock (2013), More Development for Your Transit Dollar: An Analysis of 21 North American Transit Corridors, Institute for Transportation and Development Policy (www.itdp.org): at http://bit.ly/1KYmURD. ICF (2008), The Broader Connection between Public Transportation, Energy Conservation and Greenhouse Gas Reduction, American Public Transportation Association (www.apta.com); at www.apta.com/research/info/online/documents/land_use.pdf. ITDP (2012), The BRT Standard, Institute for Transportation and Development Policy (www.itdp.org); at www.itdp.org/documents/BRT_Standard_12312.pdf.

When Are Bus Lanes Warranted? Victoria Transport Policy Institute
22
ITDP (2013), What is BRT?, Institute for Transportation and Development Policy (www.itdp.org); at www.itdp.org/library/standards-and-guides/the-bus-rapid-transit-standard/what-is-brt. Hyung Jin Kim (2003), “Performance Of Bus Lanes In Seoul – Some Impacts And Suggestions,” IATSS Research, Vol.27 No.2, pp. 36-45; at http://bit.ly/1DYy1rv. Kittleson & Associates (2013), Transit Capacity and Quality of Service Manual – Third Edition, TCRP Document 165, Transit Cooperative Research Program, TRB (www.trb.org); at www.trb.org/Main/Blurbs/169437.aspx. Santhosh Kodukula (2011), Raising Automobile Dependency: How to Break the Trend?, GIZ Sustainable Urban Transport Project (www.sutp.org); at www.sutp.org/dn.php?file=TD-RAD-EN.pdf. LAMTA (2012), Transit Service Policy, Los Angeles Metropolitan Transportation Authority (www.metro.net); at http://media.metro.net/images/service_changes_transit_service_policy.pdf. David Levinson (2015), Thoughts On Transit And Urban Form, The Transportationist (http://transportationist.org); at http://transportationist.org/2015/07/16/thoughts-on-transit-and-urban-form. David Levinson and Kevin Krizek (2015), The End of Traffic and Future of Transport, Kindle (http://davidlevinson.org/the-end-of-traffic-and-the-future-of-transport). Herb Levinson, C. L. Adams and W.F. Hoey (1975), Bus Use Of Highways: Planning And Design Guidelines, NCHRP 155; summary at http://trid.trb.org/view.aspx?id=40175. Todd Litman (2006), “Transportation Market Distortions,” Berkeley Planning Journal; issue theme Sustainable Transport in the United States: From Rhetoric to Reality? (www-dcrp.ced.berkeley.edu/bpj), Volume 19, 2006, pp. 19-36; at www.vtpi.org/distortions_BPJ.pdf. Todd Litman (2013), “The New Transportation Planning Paradigm,” ITE Journal (www.ite.org), Vo. 83, No. 6, pp. 20-28; at http://digitaleditions.sheridan.com/publication/?i=161624. Todd Litman (2014), Congestion Evaluation Best Practices, Paper 12, International Transportation Economic Development Conference, 9-11 April 2014, Dallas, Texas (https://tti.tamu.edu/conferences/ited2014); at www.vtpi.org/ITED_congestion.pdf. Todd Litman (2015), Evaluating Public Transit Benefits and Costs, Victoria Transport Policy Institute (www.vtpi.org); at www.vtpi.org/tranben.pdf. Managed Lanes Initiative (http://ops.fhwa.dot.gov/freewaymgmt/managed_lanes.htm), sponsored by the U.S. Federal Highway Administration, provides information on various highway lane management strategies. Darshini Mahadevia, Ruthul Joshi and Abhijit Datey (2013), Low-Carbon Mobility in India and the Challenges of Social Inclusion: Bus Rapid Transit (BRT) Case Studies in India, CEPT University Centre for Urban Equity (http://cept.ac.in/178/center-for-urban-equity-cue-), United Nations Environmental Program; at www.unep.org/transport/lowcarbon/Pdf's/BRT_Casestudies_India_fullreport.pdf. Naveen Menezes (2015), “BMTC Wants Dedicated Lanes For Buses On 12 Roads In Bengaluru,” Deccan Herald (www.deccanherald.com/content/508311/bmtc-wants-dedicated-lanes-buses.html). NACTO (2016), Transit Street Design Guide, National Association of City Transportation Officials (http://nacto.org); at http://nacto.org/transit-street-design-guide. Farhana Naznin, Graham Currie, Majid Sarvi & David Logan (2015): An Empirical Bayes Safety Evaluation of Tram/Streetcar Signal and Lane Priority Measures In Melbourne, Traffic Injury Prevention (DOI: 10.1080/15389588.2015.1035369).
When Are Bus Lanes Warranted? Victoria Transport Policy Institute
23
N. Paulley, et al. (2006), The Demand For Public Transport: The Effects Of Fares, Quality Of Service, Income And Car Ownership, Transport Policy, Vol. 13, No. 4, pp. 295-306; at http://eprints.whiterose.ac.uk/2034. Sean Rathwell and Maria King (2011), “Considerations for Median BRT on Arterial Roads,” ITE Journal (www.ite.org), Vol. 81, No. 1, January, pp. 44-48; http://trid.trb.org/view.aspx?id=1099061. Robert Poole (2012), Increasing Mobility in Southeast Florida: A New Approach Based on Pricing and Bus Rapid Transit, Reason Foundation (http://reason.org); at http://reason.org/files/mobility_southeast_florida.pdf. Caroline Rodier and Margot Spiller (2012), Model-based Transportation Performance: A Comparative Framework and Literature Synthesis, Report 11-09, Mineta Transportation Institute (www.transweb.sjsu.edu); at www.transweb.sjsu.edu/PDFs/research/2805-Model-based-transportation-performance.pdf. Paul Ryus, et al. (2015), A Guidebook on Transit-Supportive Roadway Strategies, Report 183, Transit Cooperative Research Program, TRB (www.trb.org); at www.trb.org/main/blurbs/173932.aspx. Zoe Schaver (2015), Rapid Bus Isn’t as Rapid as Everyone Hoped, Voice of San Diego (www.voiceofsandiego.org); at http://bit.ly/1DohZqx. SGA (2015), What Are Complete Streets?, Smart Growth America (www.smartgrowthamerica.org); at www.smartgrowthamerica.org/complete-streets/complete-streets-fundamentals/complete-streets-faq. Hiroaki Suzuki, Robert Cervero and Kanako Iuchi (2013 (www.worldbank.org); at http://elibrary.worldbank.org/doi/abs/10.1596/978-0-8213-9745-9. TRB (2013), Transit Capacity and Quality of Service Manual, Third Edition, Transportation Research Board (www.trb.org); at www.trb.org/main/blurbs/169437.aspx. TfL (2014), Mayor's Plans To Boost London’s Bus Services, Transport for London (https://tfl.gov.uk); at http://bit.ly/1HPxjbC. VTPI (2015), Online TDM Encyclopedia, Victoria Transport Policy Institute; at www.vtpi.org/tdm. Jarrett Walker (2011), Human Transit: How Clearer Thinking About Public Transit Can Enrich Our Communities And Our Lives, Island Press (http://islandpress.org/human-transit). Jarrett Walker (2015), Houston: Welcome To Your New Transit network, Human Transit (www.humantransit.org); at www.humantransit.org/houston. Annie Weinstock, et al. (2011), Recapturing Global Leadership in Bus Rapid Transit: A Survey of Select U.S. Cities, Institute for Transportation and Development Policy (www.itdp.org); at http://bit.ly/1II0F09. WSDOT (2015), Washington State Freeway HOV System, Washington State Department of Transportation (www.wsdot.wa.gov); at www.wsdot.wa.gov/hov. www.vtpi.org/blw.pdf


