Barcelona, Spain • October 29-31, 2013
© 2014Parker, Van Alstyne & Choudary
Webinar: Alternative business models around Distributed Energy Resources
Geoffrey ParkerDirector, Tulane Energy InstituteFellow, MIT Center for Digital [email protected], [email protected]@g2parker
The Rise of Networks and Platforms
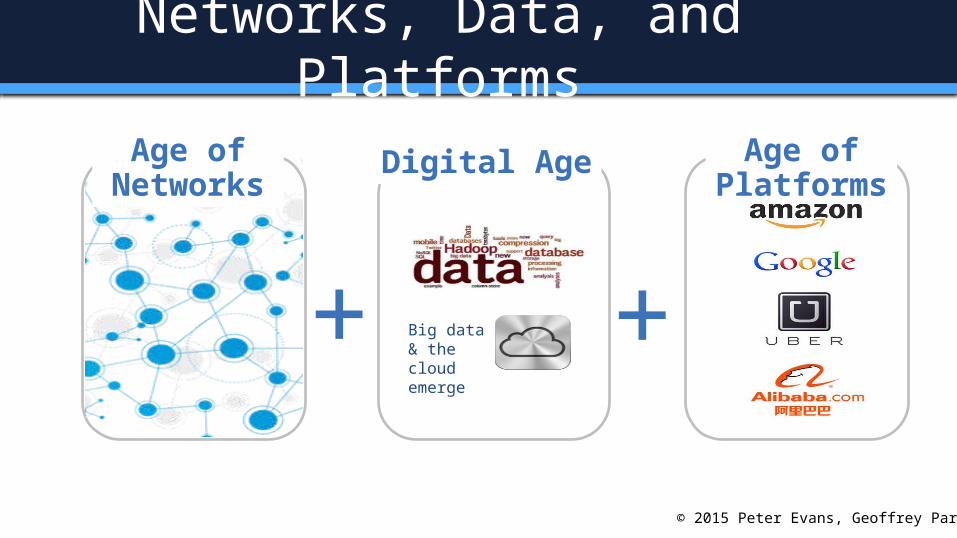
+ Big data & the cloud emerge
Digital Age Age of Platforms
+
Age of Networks
Networks, Data, and Platforms
© 2015 Peter Evans, Geoffrey Parker
Age of Networks
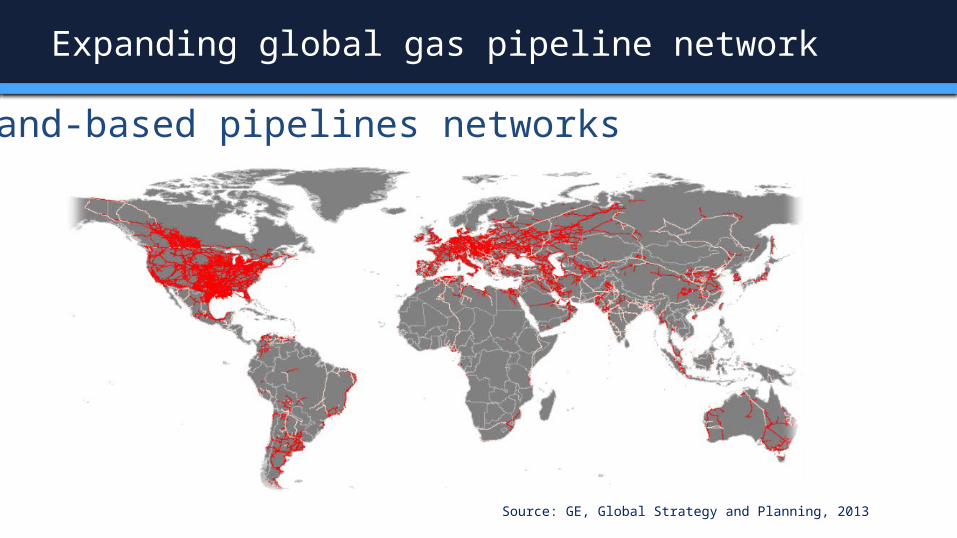
Source: GE, Global Strategy and Planning, 2013
Land-based pipelines networks
Expanding global gas pipeline network
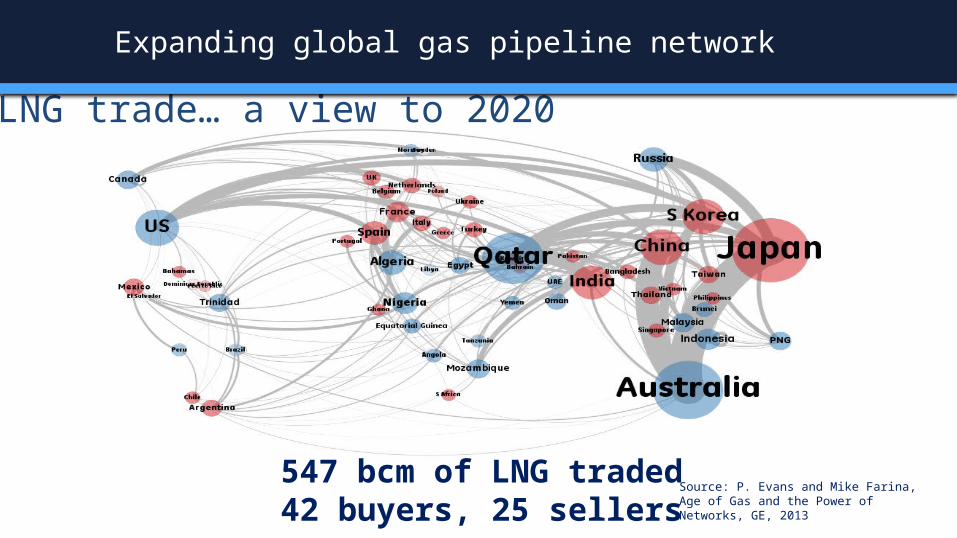
547 bcm of LNG traded42 buyers, 25 sellers
Source: P. Evans and Mike Farina, Age of Gas and the Power of Networks, GE, 2013
LNG trade… a view to 2020
Expanding global gas pipeline network
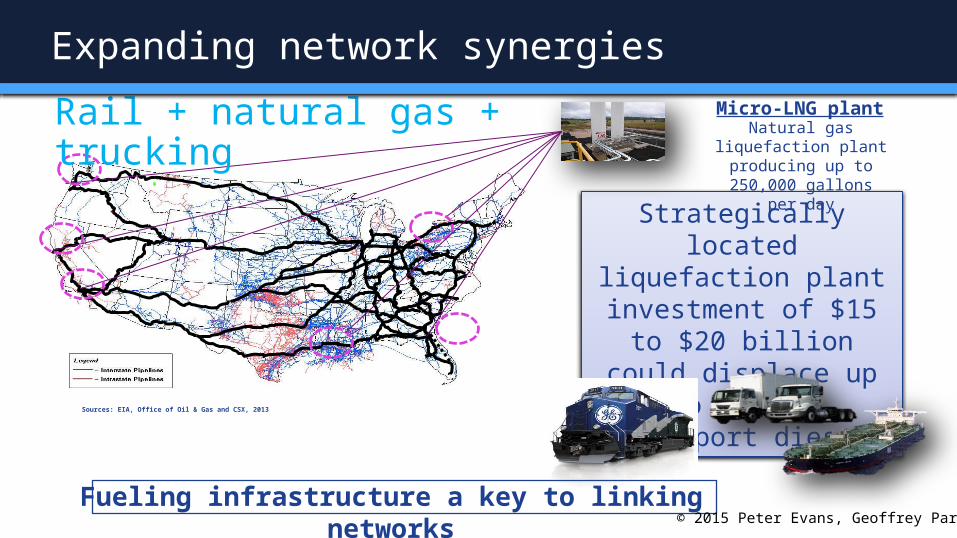
Strategically located liquefaction plant
investment of $15 to $20 billion could
displace up to 30% of transport diesel
Fueling infrastructure a key to linking networks
Micro-LNG plantNatural gas
liquefaction plant producing up to
250,000 gallons per day
Sources: EIA, Office of Oil & Gas and CSX, 2013
Rail + natural gas + trucking
Expanding network synergies
© 2015 Peter Evans, Geoffrey Parker

Meshed networks… integration of physical, digital and social
Electrical infrastructure
+Gas infrastructure +
Digital infrastructure@
Growing interconnections

Digital Age
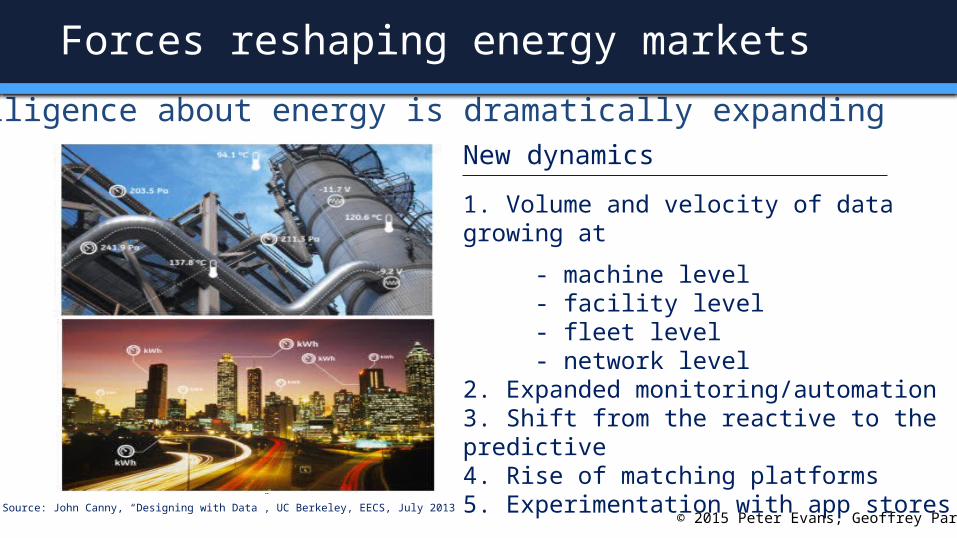
Intelligence about energy is dramatically expanding
Source: John Canny, “Designing with Data”, UC Berkeley, EECS, July 2013
New dynamics
1. Volume and velocity of data growing at
- machine level - facility level - fleet level - network level 2. Expanded monitoring/automation3. Shift from the reactive to the predictive 4. Rise of matching platforms5. Experimentation with app stores
Forces reshaping energy markets
© 2015 Peter Evans, Geoffrey Parker
10
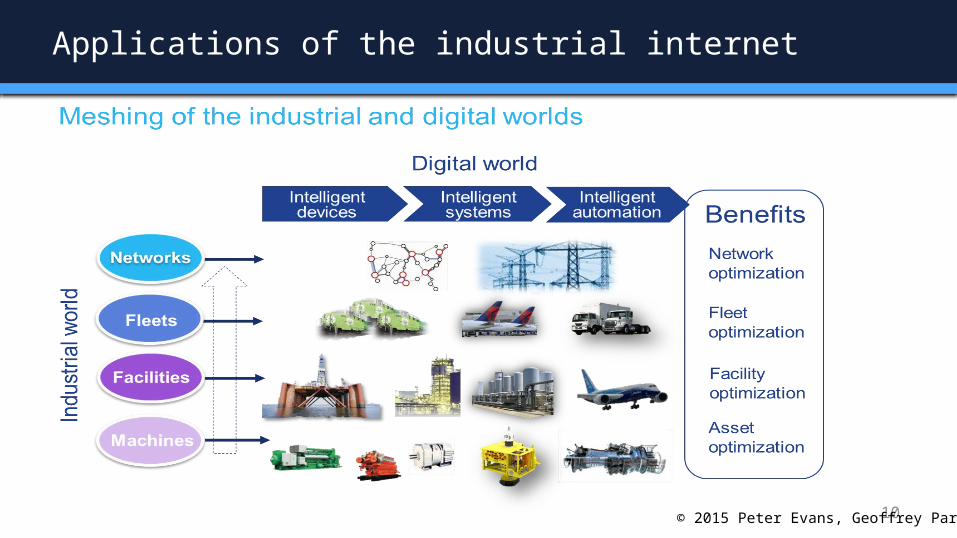
Applications of the industrial internet
© 2015 Peter Evans, Geoffrey Parker
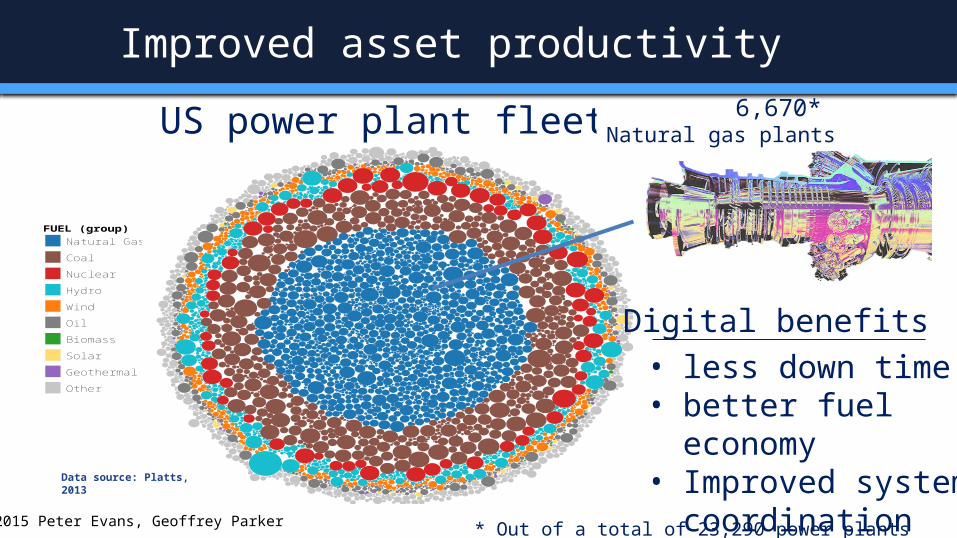
FUEL (group)
Natural Gas
Coal
Nuclear
Hydro
Wind
Oil
Biomass
Solar
Geothermal
Other
US power plant fleet
Data source: Platts, 2013
6,670* Natural gas plants
• less down time• better fuel economy• Improved system
coordination
Digital benefits
* Out of a total of 23,290 power plants
Improved asset productivity
© 2015 Peter Evans, Geoffrey Parker
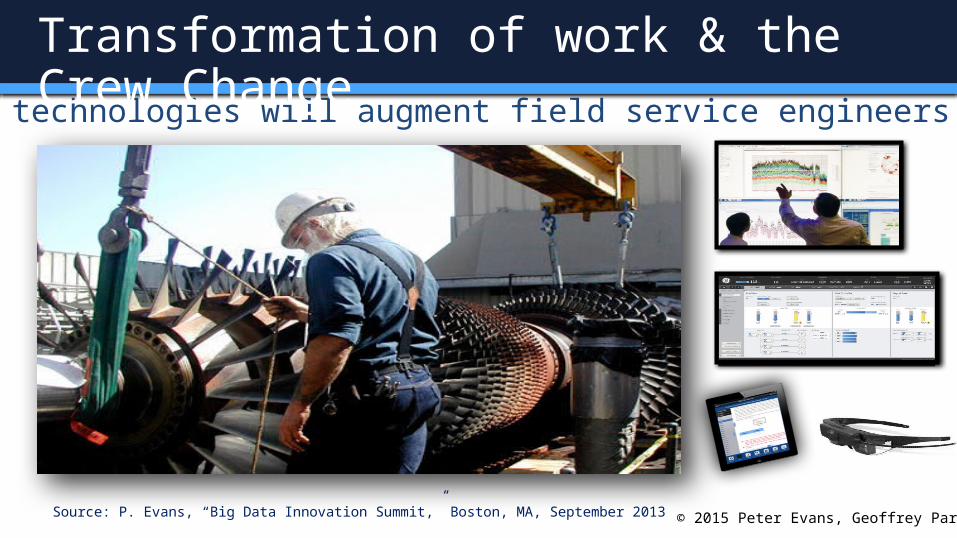
Digital technologies will augment field service engineers
Source: P. Evans, “Big Data Innovation Summit,” Boston, MA, September 2013
Transformation of work & the Crew Change
© 2015 Peter Evans, Geoffrey Parker
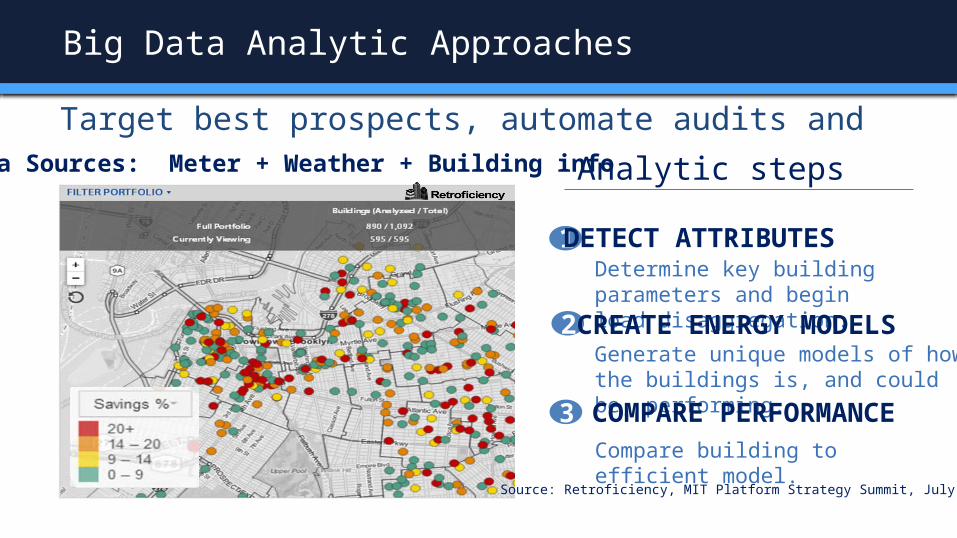
1Determine key building parameters and begin load disaggregation.
DETECT ATTRIBUTES
Generate unique models of how the buildings is, and could be, performing.
2 CREATE ENERGY MODELS
Compare building to efficient model.
3 COMPARE PERFORMANCE
Target best prospects, automate audits and track efficiency savingsData Sources: Meter + Weather + Building info
Source: Retroficiency, MIT Platform Strategy Summit, July 2014
Analytic steps
Big Data Analytic Approaches
Age of Platforms
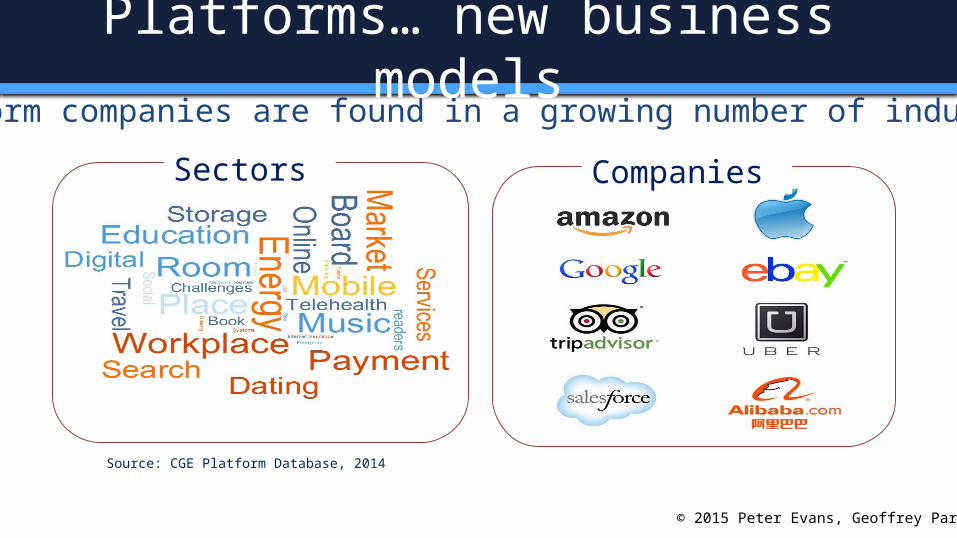
Platform companies are found in a growing number of industries
Source: CGE Platform Database, 2014
Companies Sectors
Platforms… new business models
© 2015 Peter Evans, Geoffrey Parker
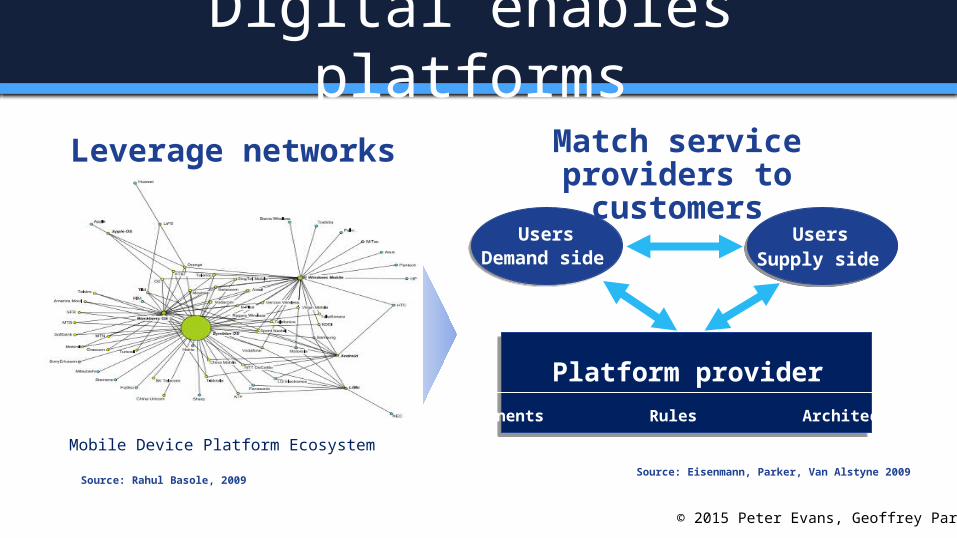
Platform providerComponents Rules Architecture
UsersDemand side
UsersSupply side
Match service providers to customers
Source: Eisenmann, Parker, Van Alstyne 2009
Leverage networks
Mobile Device Platform Ecosystem
Source: Rahul Basole, 2009
Digital enables platforms
© 2015 Peter Evans, Geoffrey Parker
17
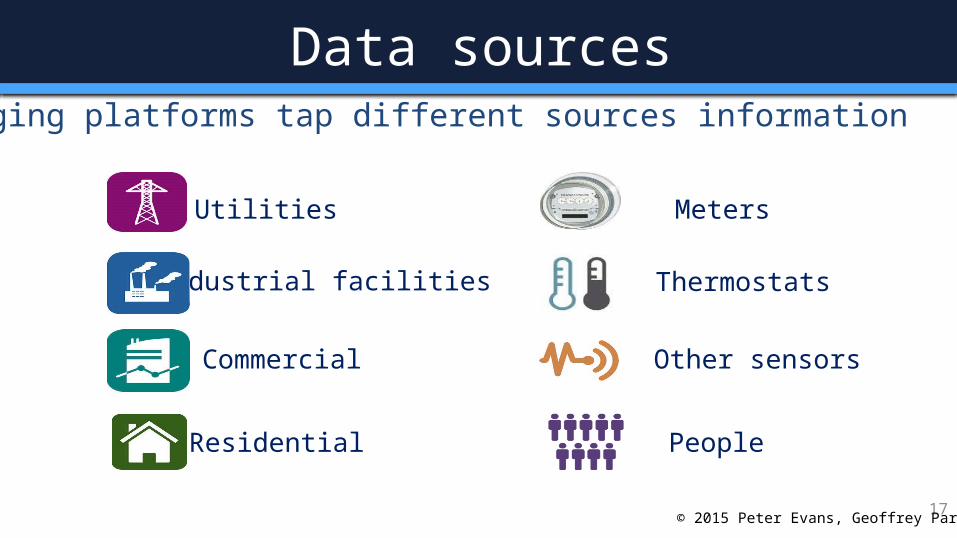
Utilities
Industrial facilities
Commercial
Residential
Emerging platforms tap different sources information
Meters
Other sensors
Thermostats
People
Data sources
© 2015 Peter Evans, Geoffrey Parker
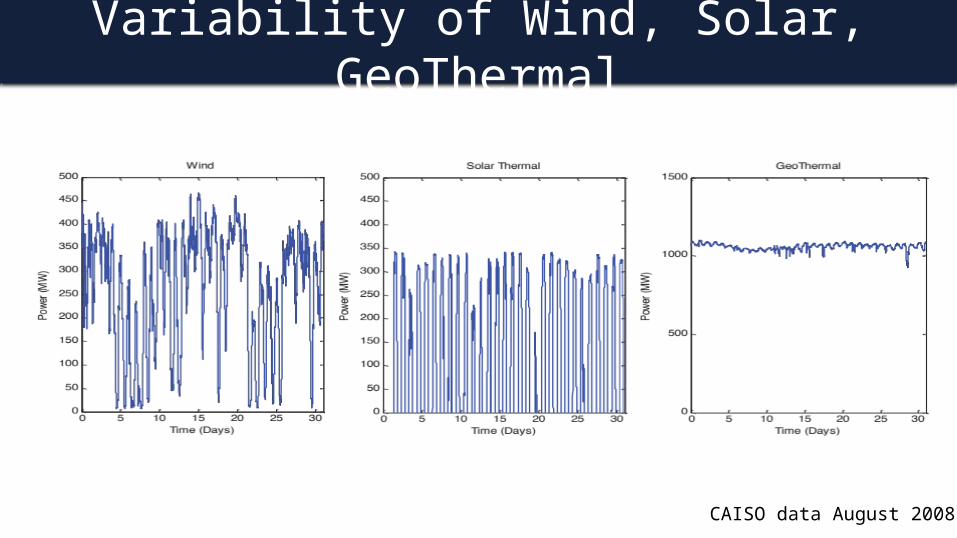
Variability of Wind, Solar, GeoThermal
CAISO data August 2008
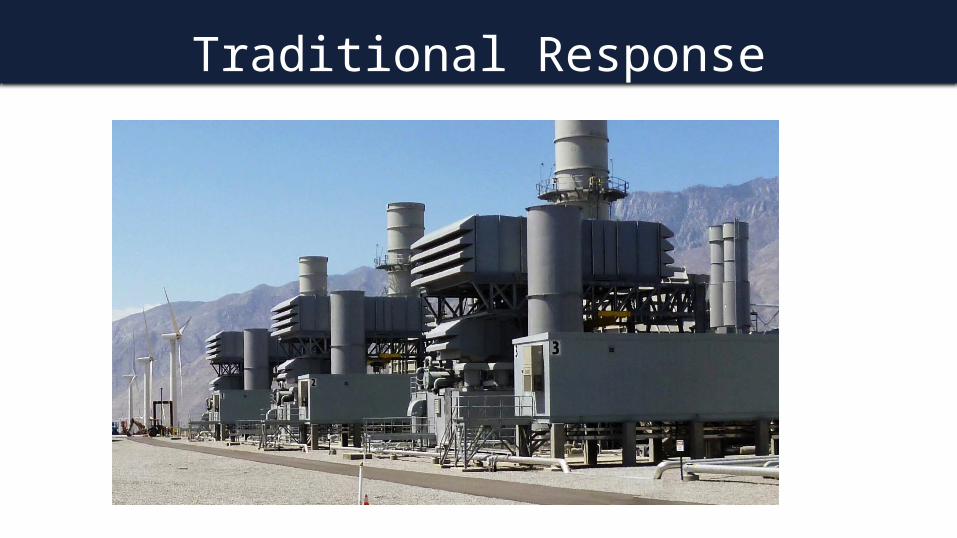
Traditional Response
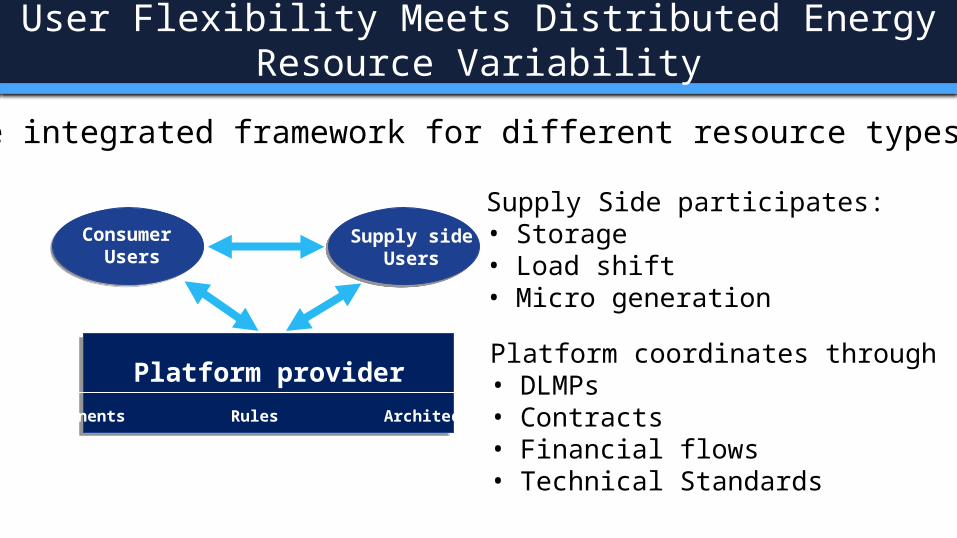
Platform providerComponents Rules Architecture
Consumer Users
Supply sideUsers
User Flexibility Meets Distributed Energy Resource Variability
Supply Side participates:• Storage• Load shift• Micro generation
Platform coordinates through• DLMPs• Contracts• Financial flows• Technical Standards
One integrated framework for different resource types
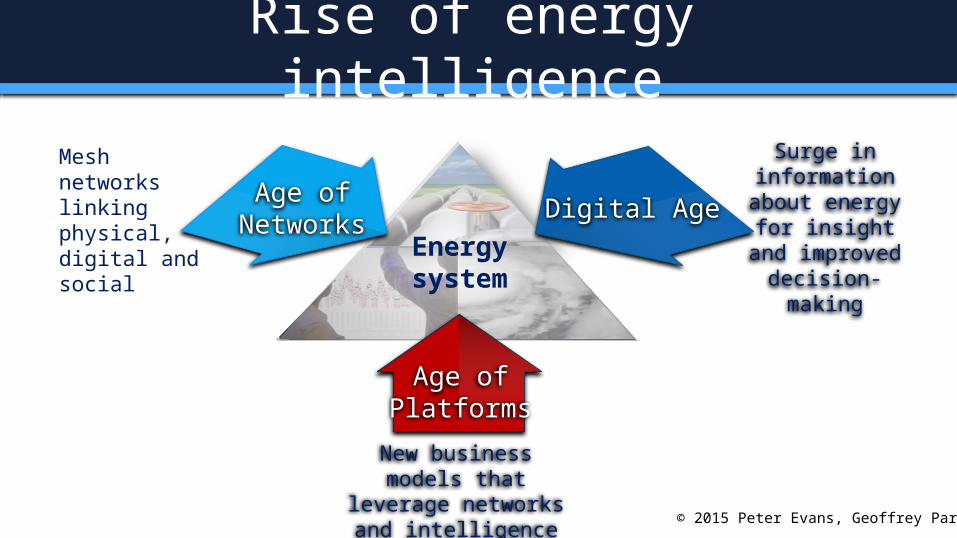
Age of Networks
Digital Age
Age of Platforms
New business models that leverage networks
and intelligence
Mesh networks linking physical, digital and social
Surge in information about energy for
insight and improved decision-making
Energy system
Rise of energy intelligence
© 2015 Peter Evans, Geoffrey Parker
Financing DER – Lessons from Home Solar
Webinar: Alternative Business Models for Distributed Energy Resources
April 30, 2015
Sierra PetersonDirector, Business Development
24
What We’ll Cover
1) Context on Clean Power Finance
2) U.S. Residential Solar Market Trends
3) Finance Products for Residential Solar
4) Does Solar’s Success Translate to Storage?
5) Mass Market Demand Drivers: Win on $/kWh
6) Transactive Energy Markets
Proprietary
25
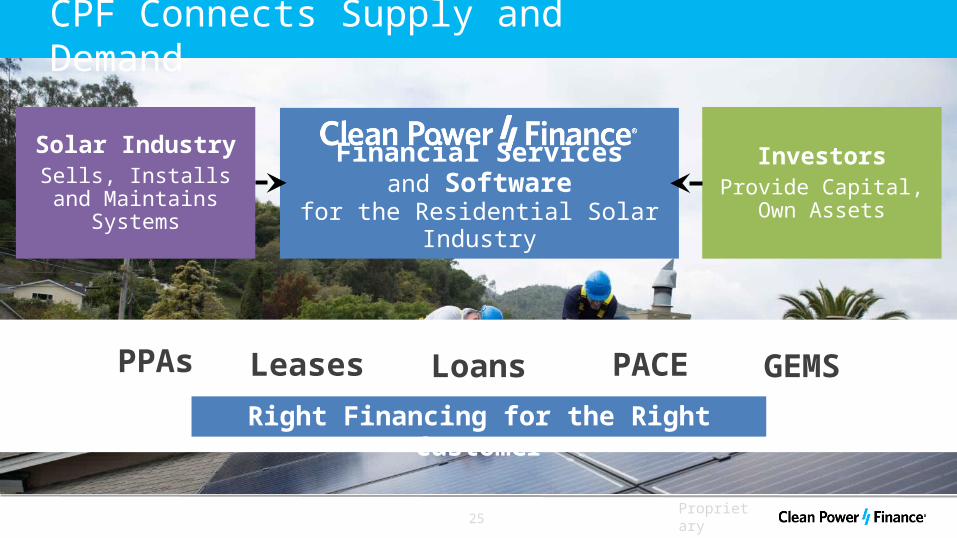
CPF Connects Supply and Demand
Right Financing for the Right Customer
Financial Servicesand Software
for the Residential Solar Industry
Solar IndustrySells, Installs and
Maintains Systems
InvestorsProvide Capital, Own
Assets
PPAs
Proprietary
Leases Loans PACE GEMS
26
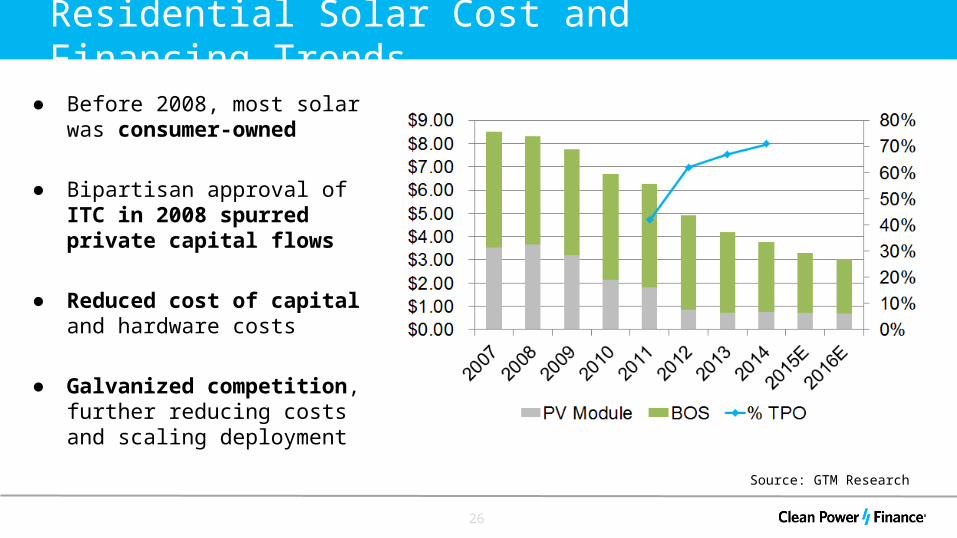
Residential Solar Cost and Financing Trends
● Before 2008, most solar was consumer-owned
● Bipartisan approval of ITC in 2008 spurred private capital flows
● Reduced cost of capital and hardware costs
● Galvanized competition, further reducing costs and scaling deployment
Source: GTM Research
27
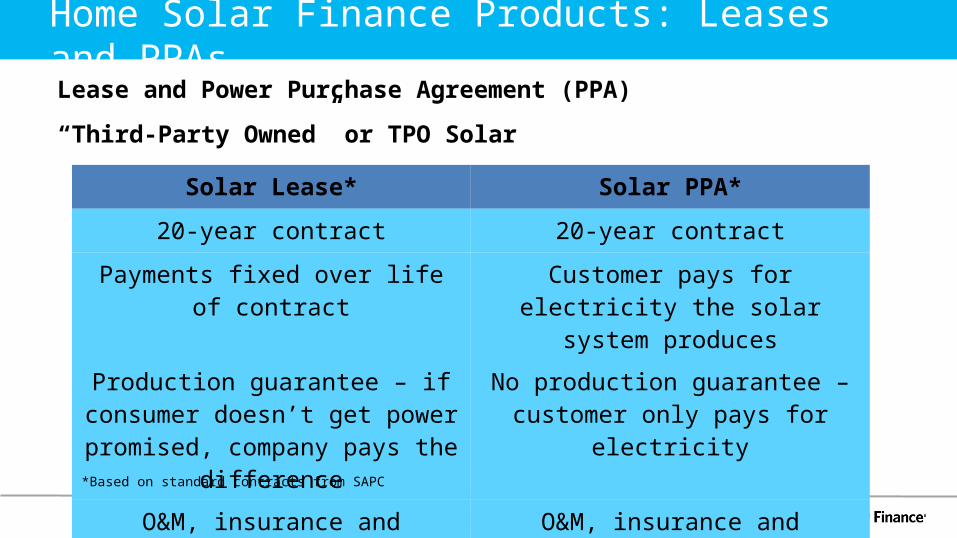
Home Solar Finance Products: Leases and PPAsLease and Power Purchase Agreement (PPA)
“Third-Party Owned” or TPO Solar
Solar Lease* Solar PPA*
20-year contract 20-year contract
Payments fixed over life of contract Customer pays for electricity the solar system produces
Production guarantee – if consumer doesn’t get power promised, company
pays the difference
No production guarantee – customer only pays for electricity
O&M, insurance and monitoring O&M, insurance and monitoring
*Based on standard contracts from SAPC
28
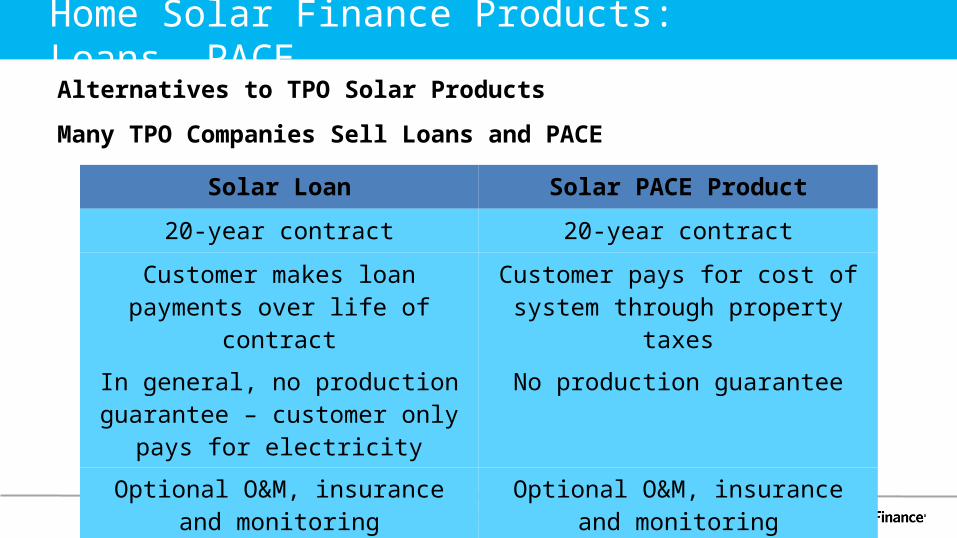
Home Solar Finance Products: Loans, PACE
Solar Loan Solar PACE Product
20-year contract 20-year contract
Customer makes loan payments over life of contract
Customer pays for cost of system through property taxes
In general, no production guarantee – customer only pays for electricity
No production guarantee
Optional O&M, insurance and monitoring
Optional O&M, insurance and monitoring
Alternatives to TPO Solar Products
Many TPO Companies Sell Loans and PACE
29
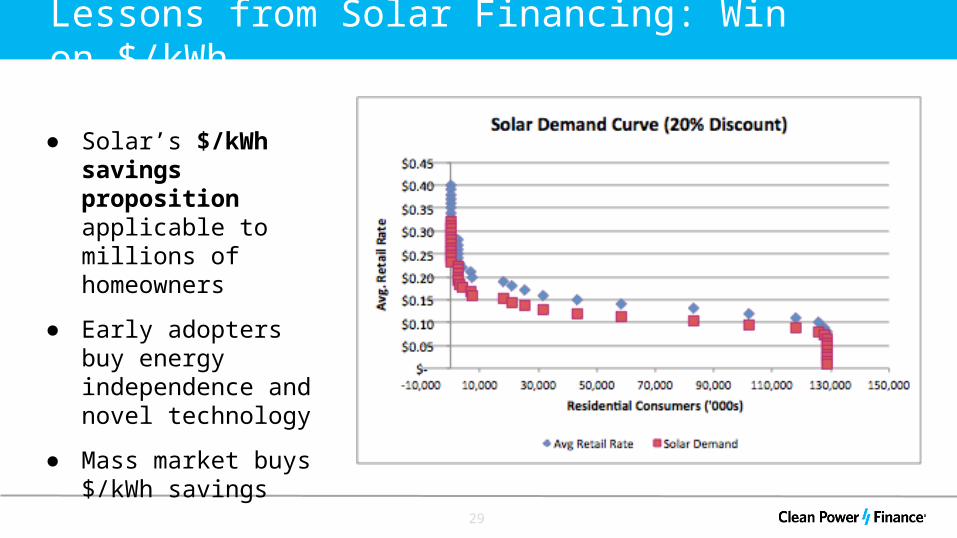
Lessons from Solar Financing: Win on $/kWh
● Solar’s $/kWh savings proposition applicable to millions of homeowners
● Early adopters buy energy independence and novel technology
● Mass market buys $/kWh savings
30
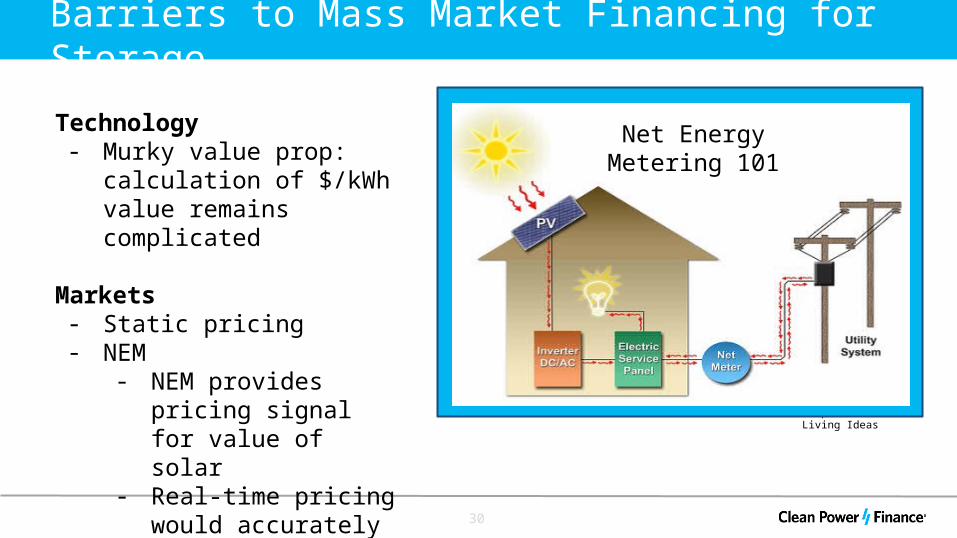
Barriers to Mass Market Financing for Storage
Technology- Murky value prop: calculation
of $/kWh value remains complicated
Markets- Static pricing- NEM
- NEM provides pricing signal for value of solar
- Real-time pricing would accurately value solar, storage, other DER
Graphic: Green Living Ideas
Net Energy Metering 101
31
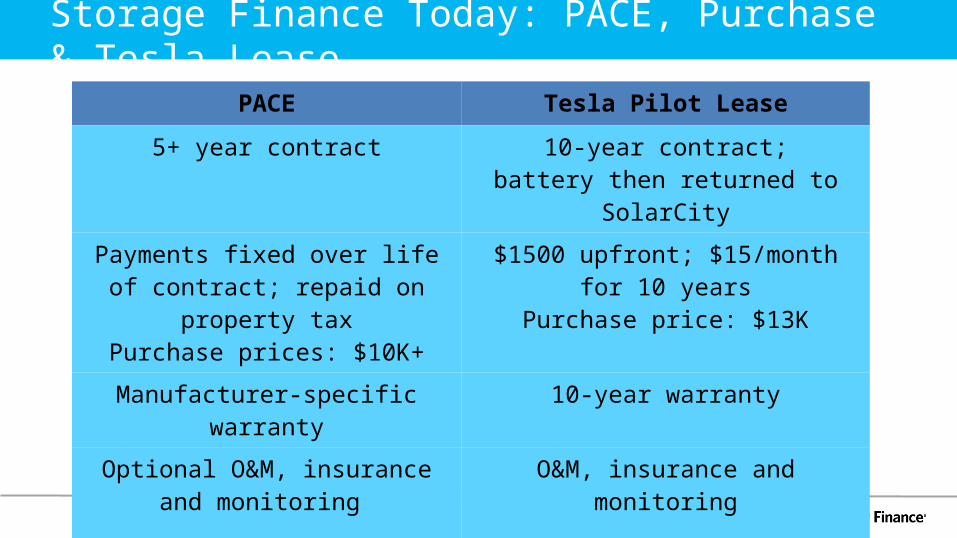
Storage Finance Today: PACE, Purchase & Tesla LeasePACE Tesla Pilot Lease
5+ year contract 10-year contract;battery then returned to SolarCity
Payments fixed over life of contract; repaid on property taxPurchase prices: $10K+
$1500 upfront; $15/month for 10 yearsPurchase price: $13K
Manufacturer-specific warranty 10-year warranty
Optional O&M, insurance and monitoring
O&M, insurance and monitoring
32
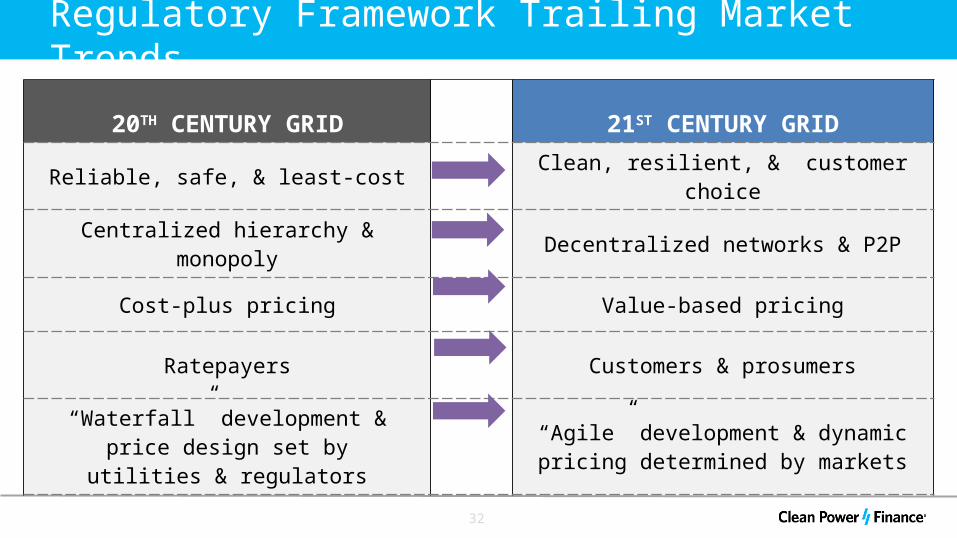
Regulatory Framework Trailing Market Trends
20TH CENTURY GRID 21ST CENTURY GRID
Reliable, safe, & least-cost Clean, resilient, & customer choice
Centralized hierarchy & monopoly Decentralized networks & P2P
Cost-plus pricing Value-based pricing
Ratepayers Customers & prosumers
“Waterfall” development & price design set by utilities & regulators
“Agile” development & dynamic pricing determined by markets
33
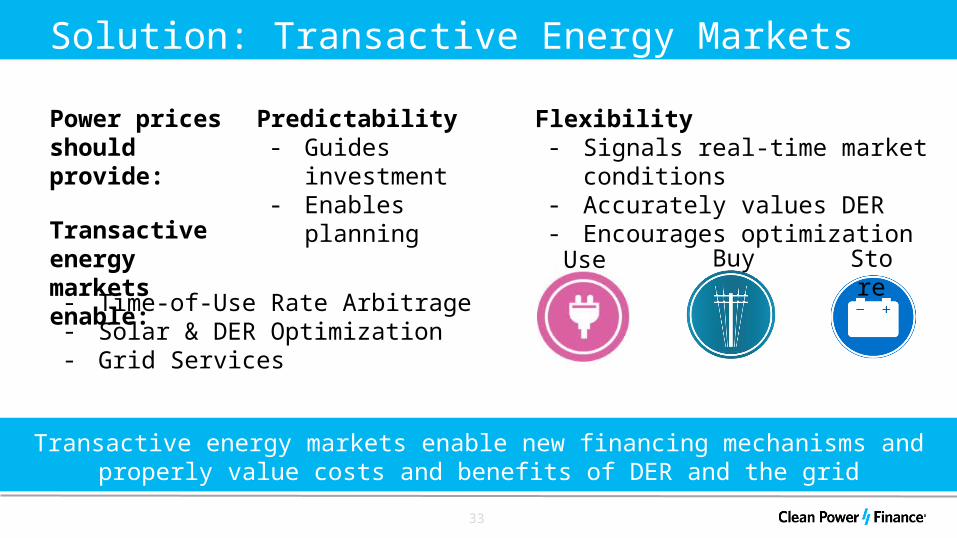
Solution: Transactive Energy Markets
Power prices should provide:
Transactive energy markets enable new financing mechanisms and properly value costs and benefits of DER and the grid
Flexibility- Signals real-time market conditions - Accurately values DER- Encourages optimization
Use Buy Store
Predictability - Guides investment - Enables planning
Transactive energy markets enable:
- Time-of-Use Rate Arbitrage- Solar & DER Optimization- Grid Services
34
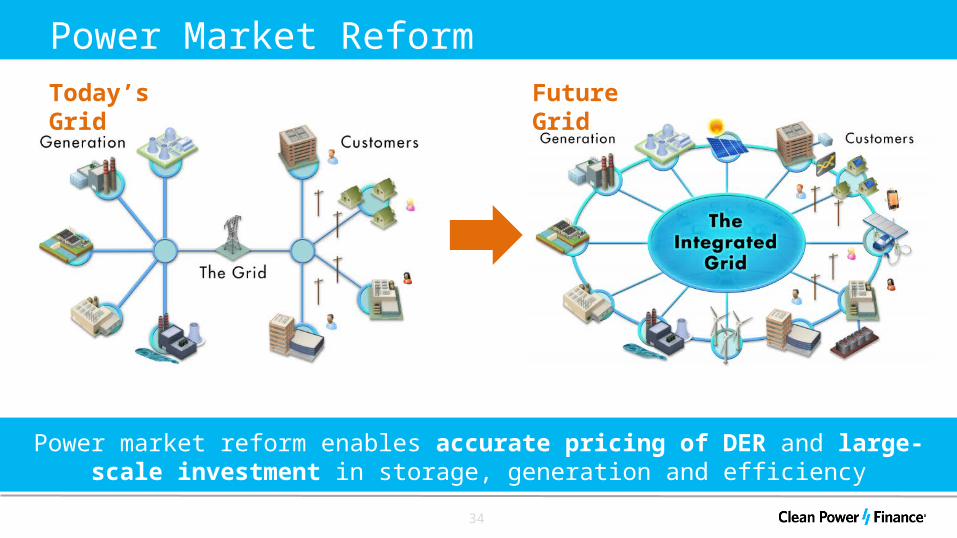
Power Market ReformToday’s Grid Future Grid
Power market reform enables accurate pricing of DER and large-scale investment in storage, generation and efficiency
36
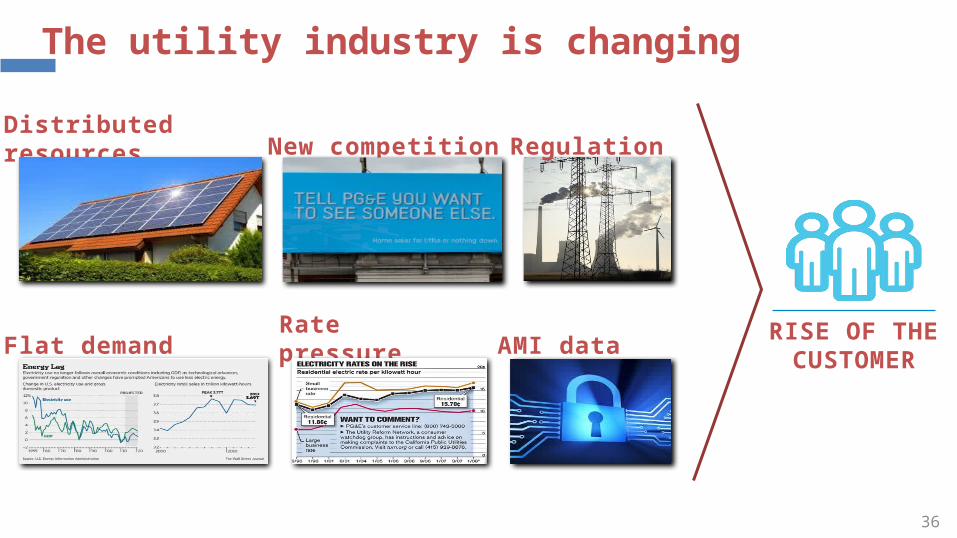
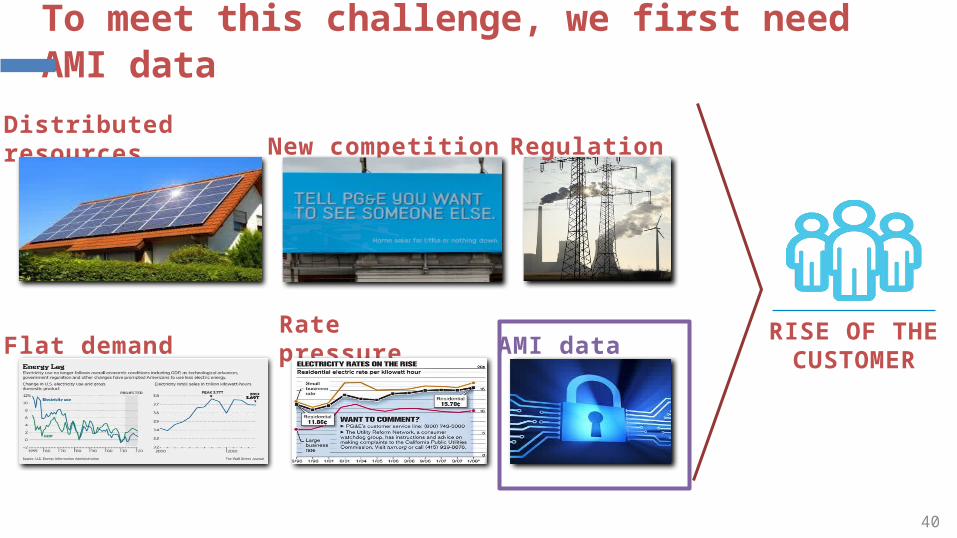
The utility industry is changing
New competition
Rate pressureFlat demand AMI data
Distributedresources Regulation
RISE OF THE
CUSTOMER
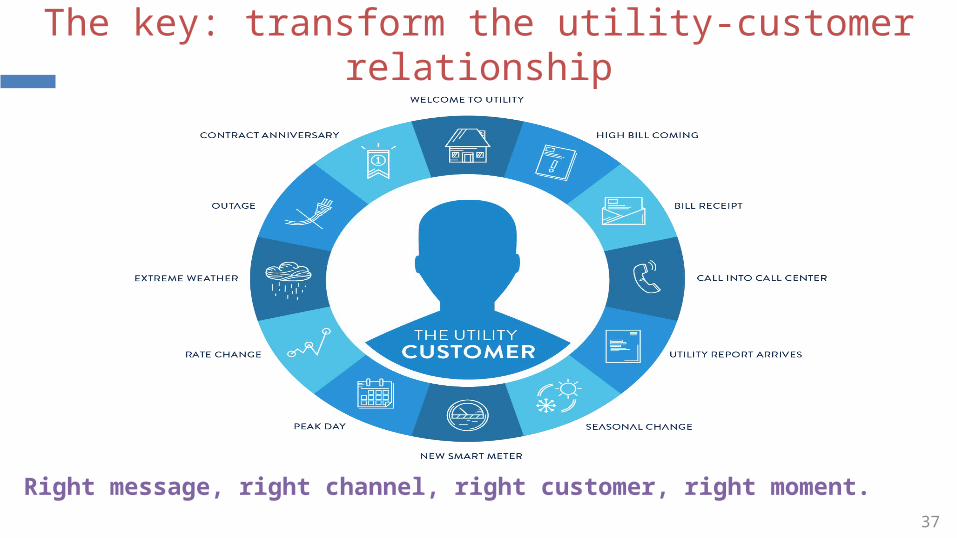
The key: transform the utility-customer relationship
37
Right message, right channel, right customer, right moment.
38
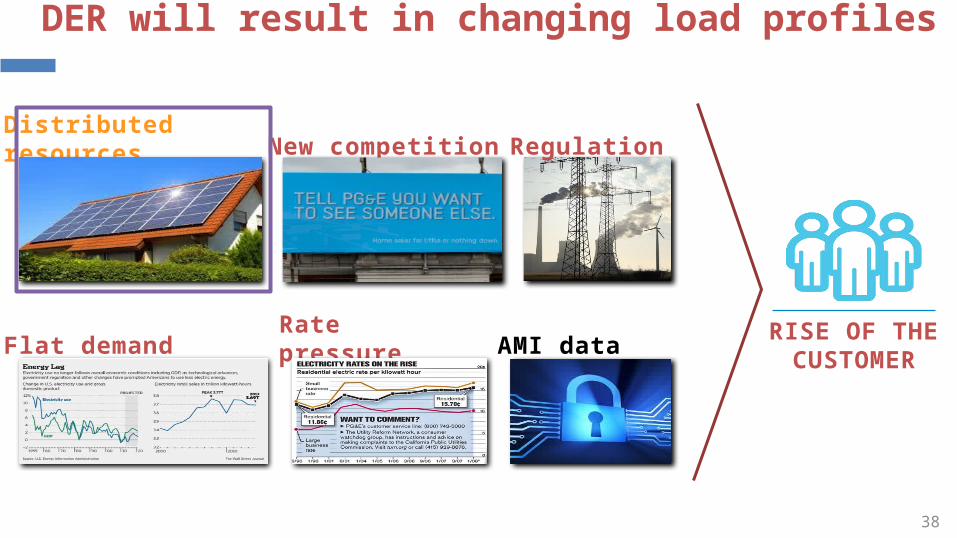
DER will result in changing load profiles
New competition
Rate pressureFlat demand AMI data
RISE OF THE
CUSTOMER
Distributedresources Regulation
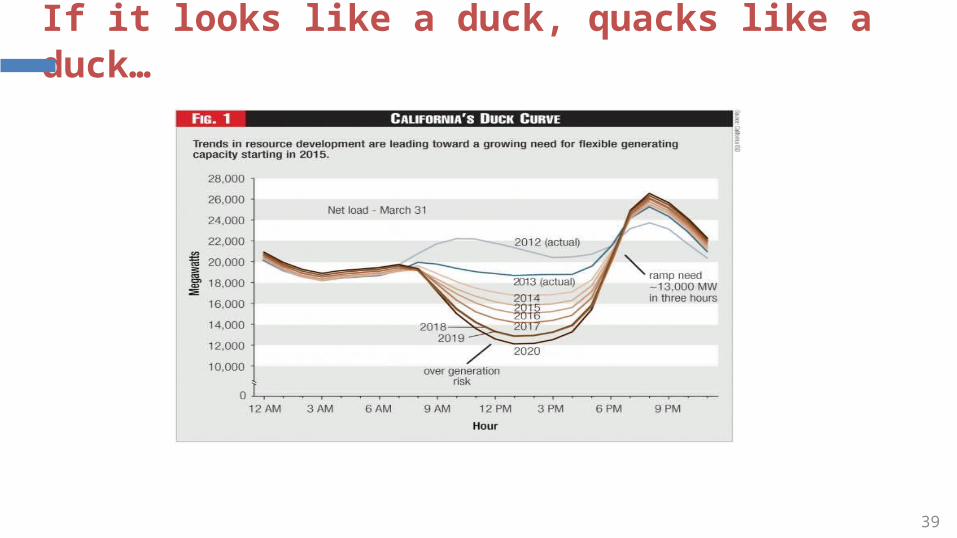
39
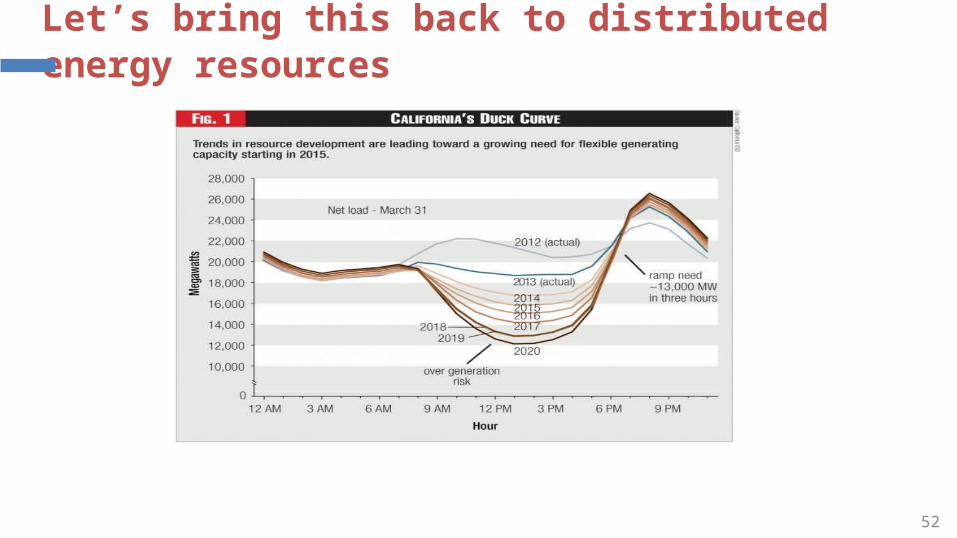
If it looks like a duck, quacks like a duck…
40
To meet this challenge, we first need AMI data
New competition
Rate pressureFlat demand AMI data
RISE OF THE
CUSTOMER
Distributedresources Regulation
41
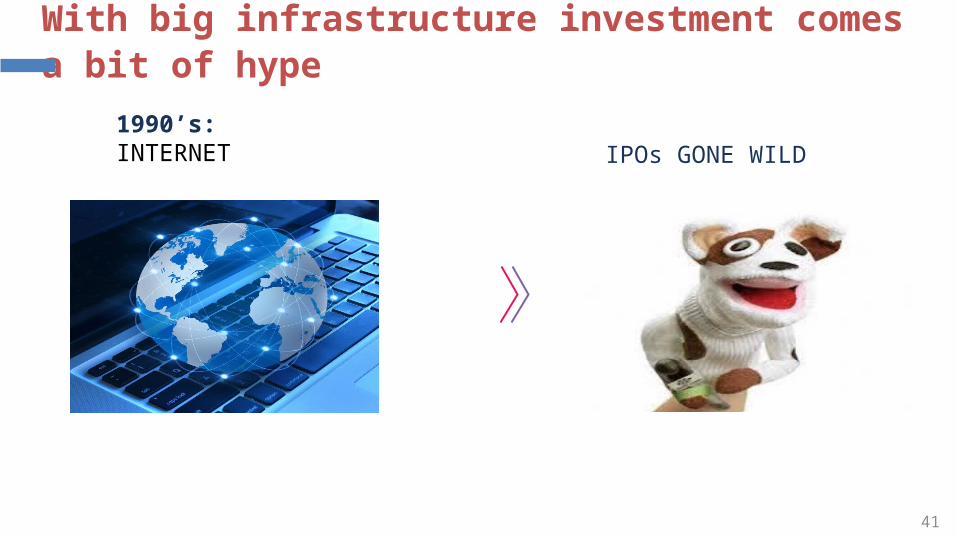
With big infrastructure investment comes a bit of hype
1990’s: INTERNET IPOs GONE WILD
42
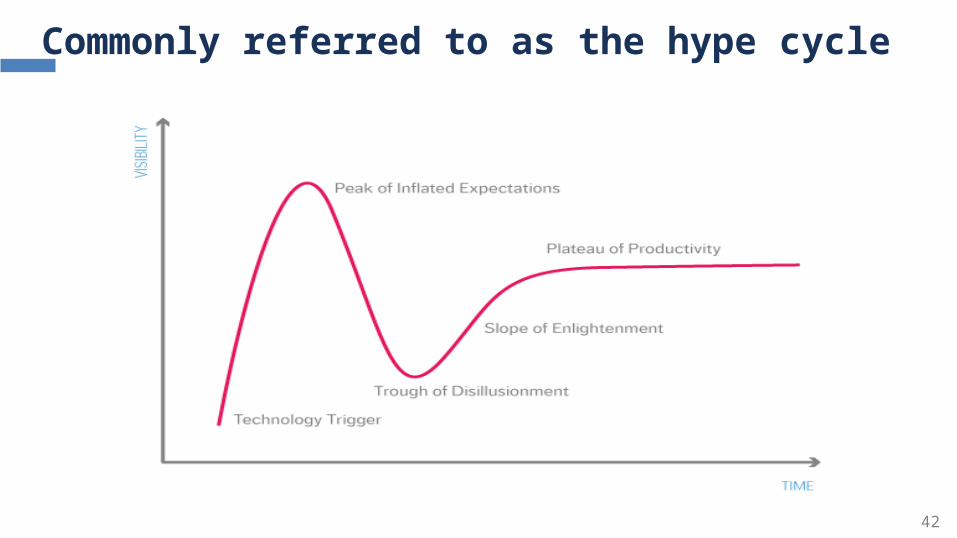
Commonly referred to as the hype cycle
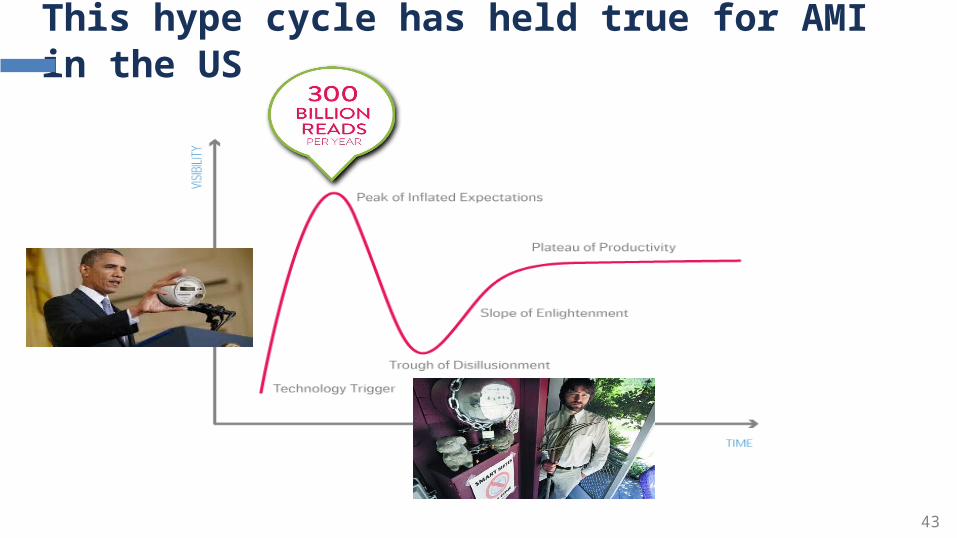
43
This hype cycle has held true for AMI in the US
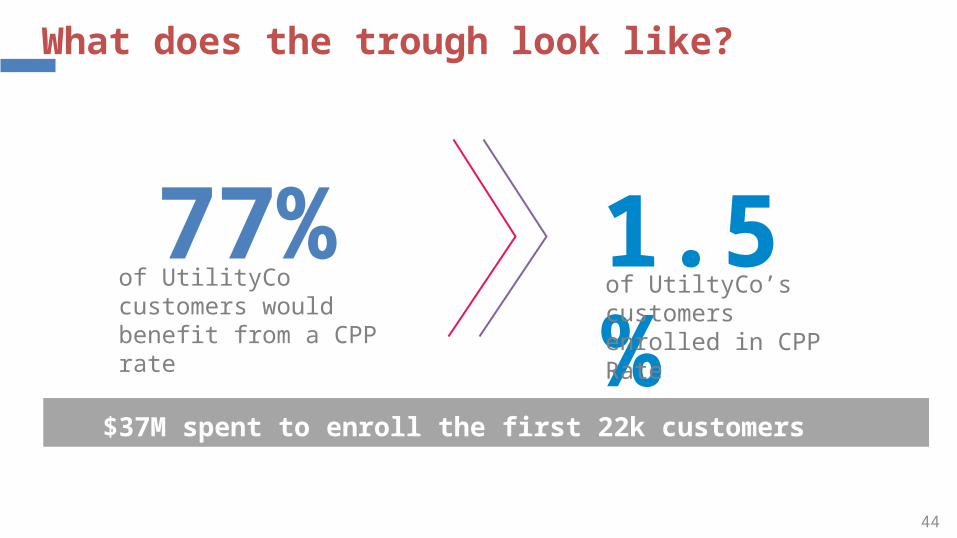
What does the trough look like?
44
$37M spent to enroll the first 22k customers
77%
of UtilityCo customers would benefit from a CPP rate
1.5%of UtiltyCo’s customers enrolled in CPP Rate
45
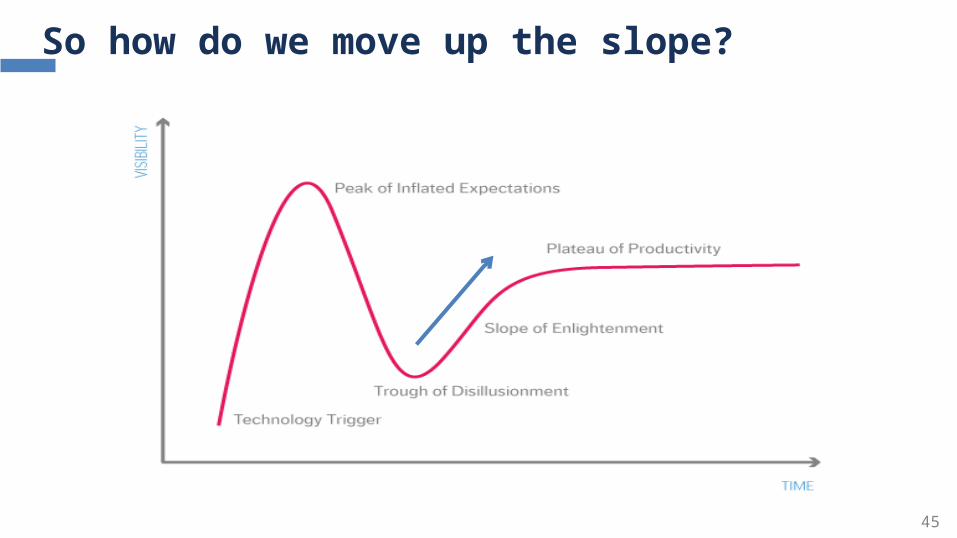
So how do we move up the slope?
46
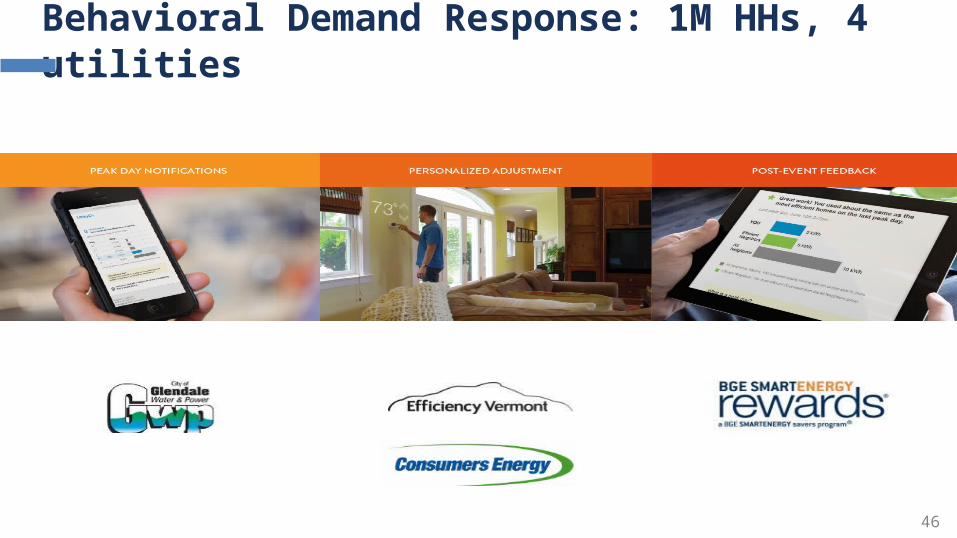
Behavioral Demand Response: 1M HHs, 4 utilities
47
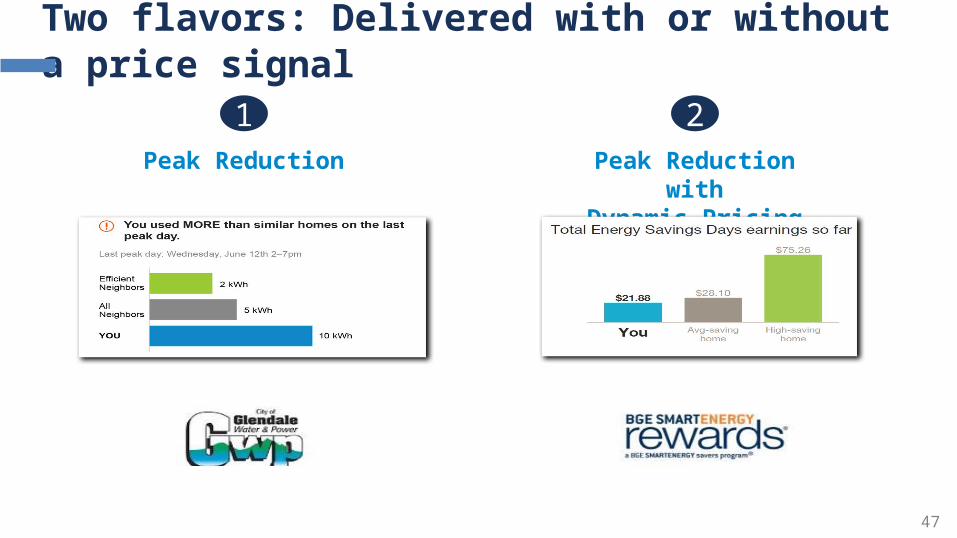
Two flavors: Delivered with or without a price signal
2Peak Reduction
withDynamic Pricing
1Peak Reduction
48
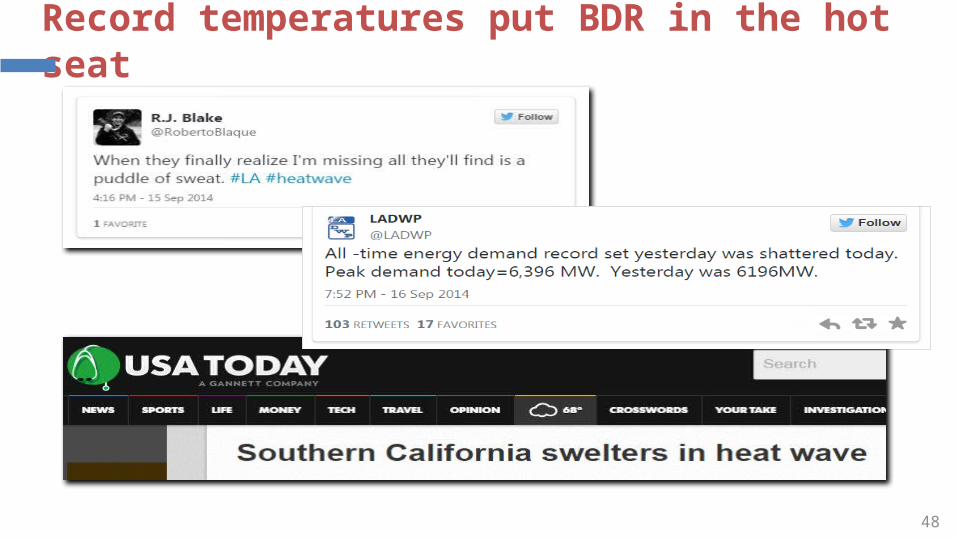
Record temperatures put BDR in the hot seat
49
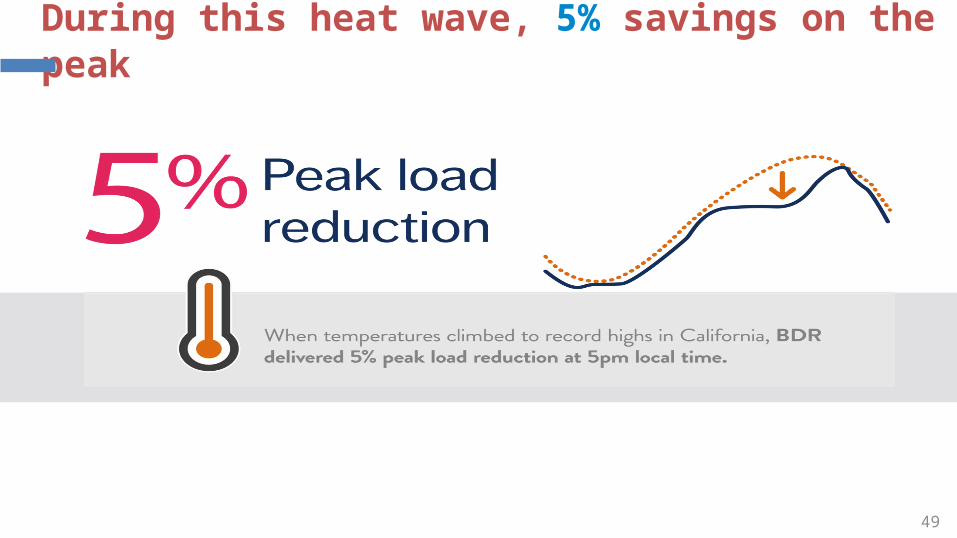
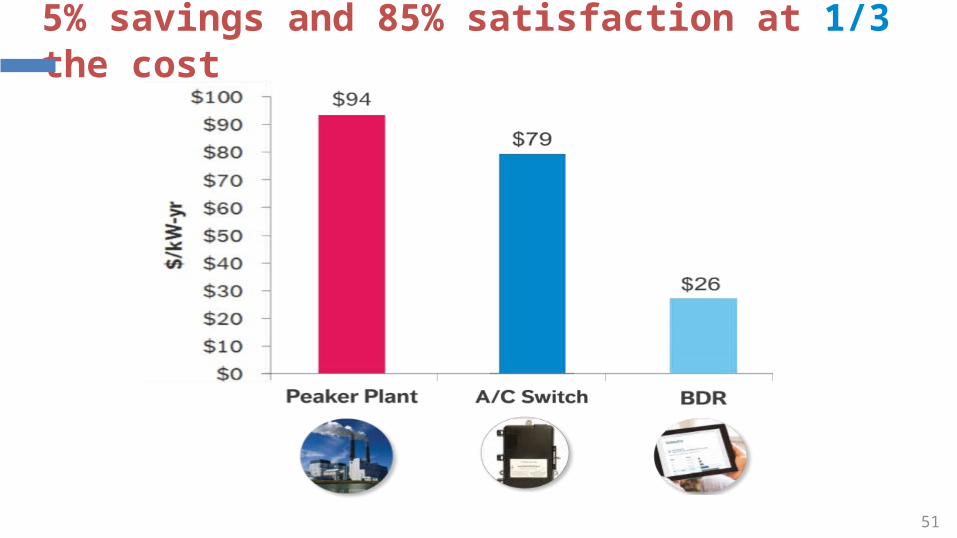
During this heat wave, 5% savings on the peak
50
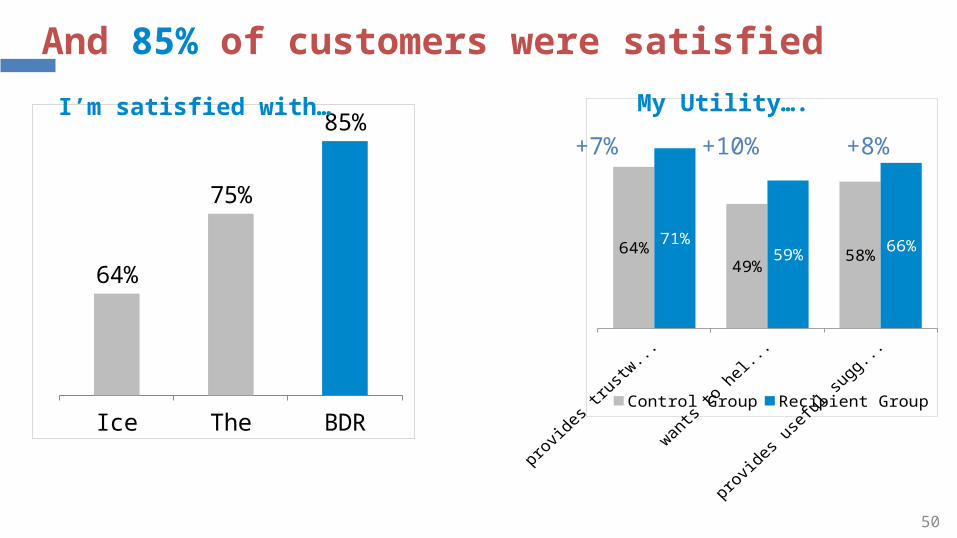
And 85% of customers were satisfied
Ice Cream The Beach BDR
64%
75%
85%
provides trustworthy EE
information
wants to help me save money
provides useful suggestions to save energy, lower bills
64%49%
58%71%
59% 66%
Control Group Recipient Group
+7% +10% +8%
My Utility….I’m satisfied with…
51
5% savings and 85% satisfaction at 1/3 the cost
52
Let’s bring this back to distributed energy resources
53
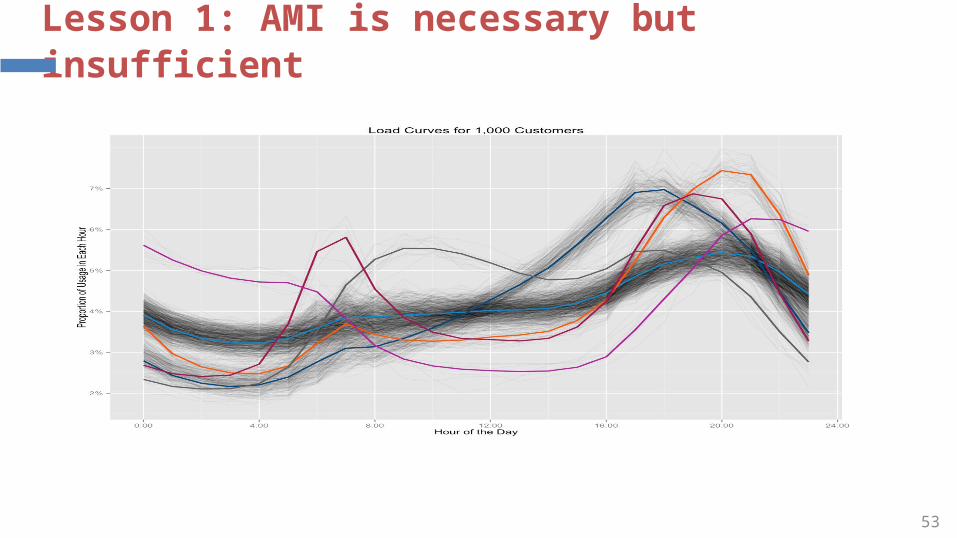
Lesson 1: AMI is necessary but insufficient
54
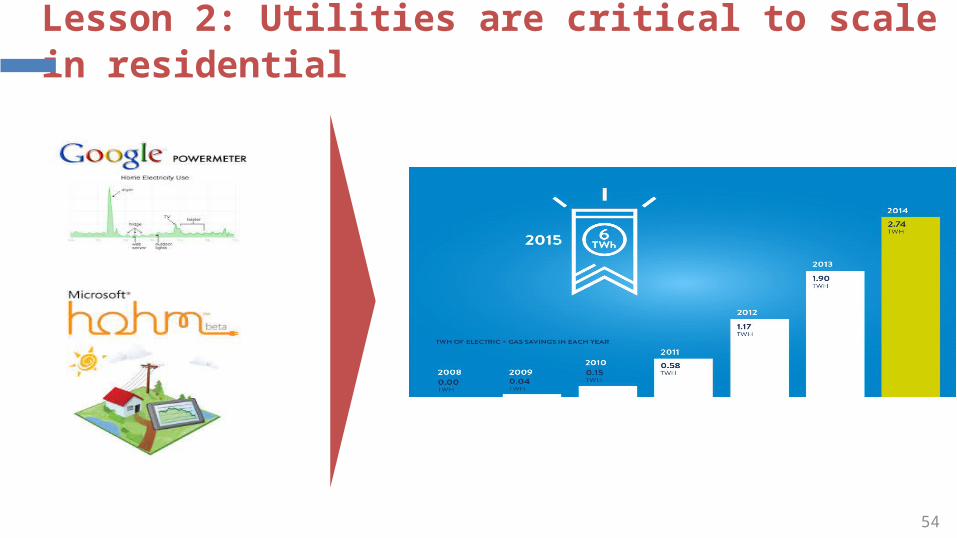
Lesson 2: Utilities are critical to scale in residential
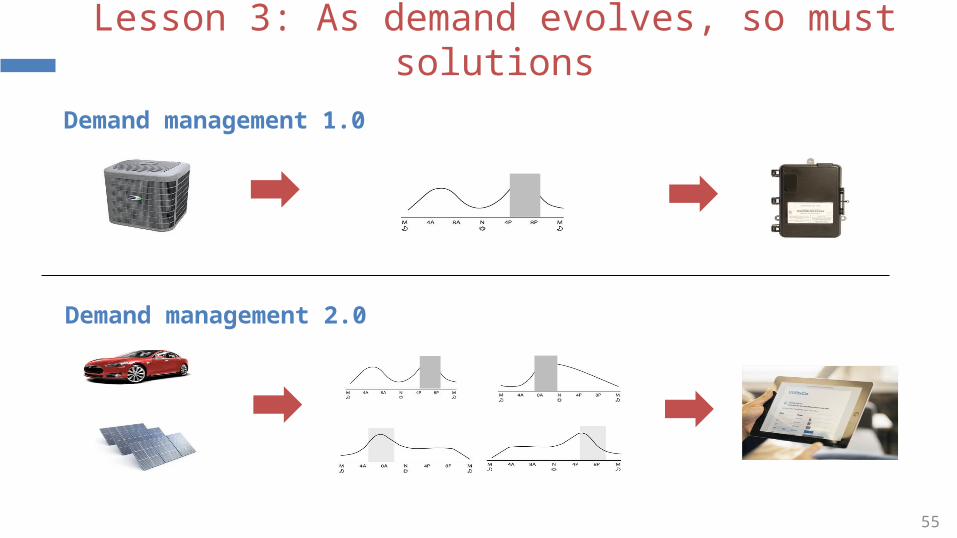
Lesson 3: As demand evolves, so must solutions
55
Demand management 1.0
Demand management 2.0
DNV GL © SAFER, SMARTER, GREENERDNV GL ©
Alternative Business Models for Distributed Energy Resources
56
Business Opportunities & Scenarios
DNV GL ©
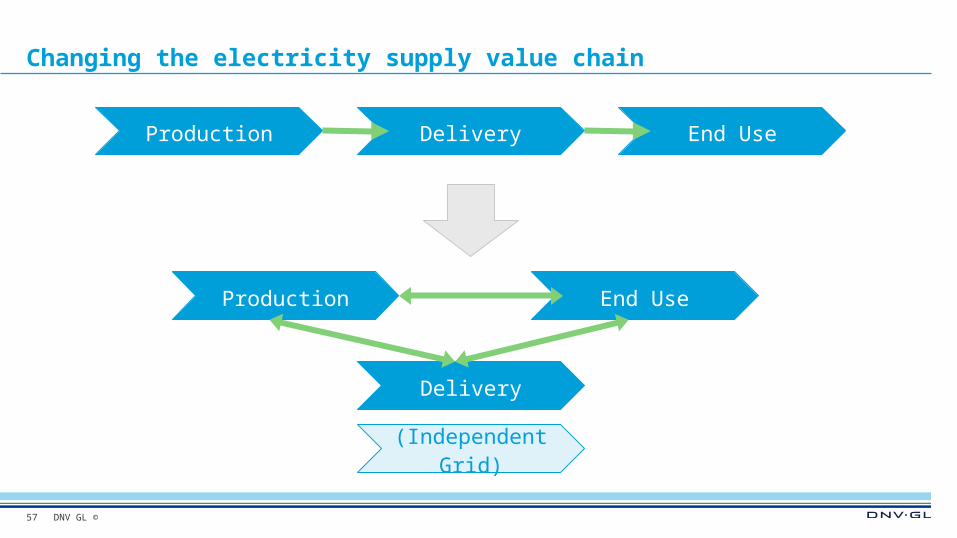
Changing the electricity supply value chain
57
Delivery End UseProduction
Delivery
End UseProduction
(Independent Grid)
DNV GL ©
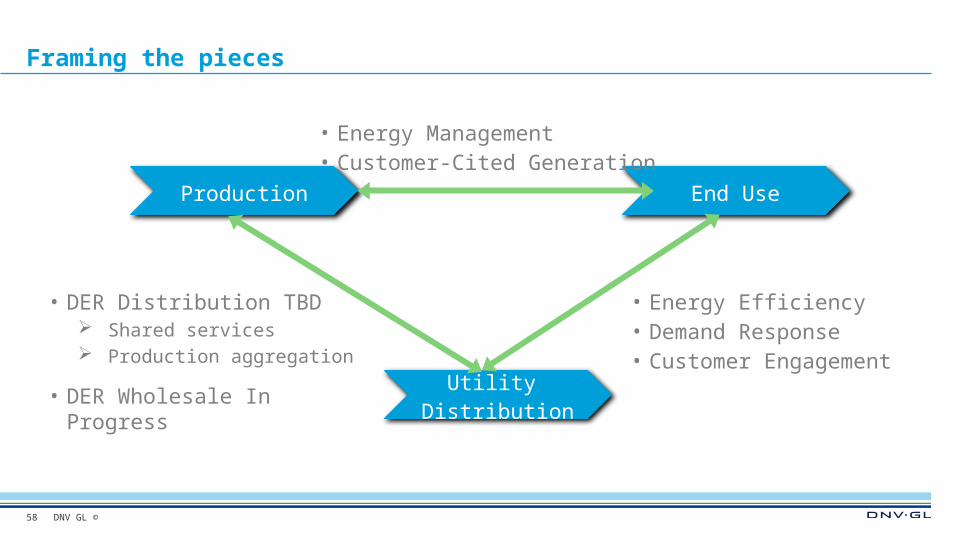
Framing the pieces
58
Utility Distribution
End UseProduction
• Energy Management• Customer-Cited Generation
• Energy Efficiency• Demand Response• Customer Engagement
• DER Distribution TBD Shared services Production aggregation
• DER Wholesale In Progress
DNV GL ©
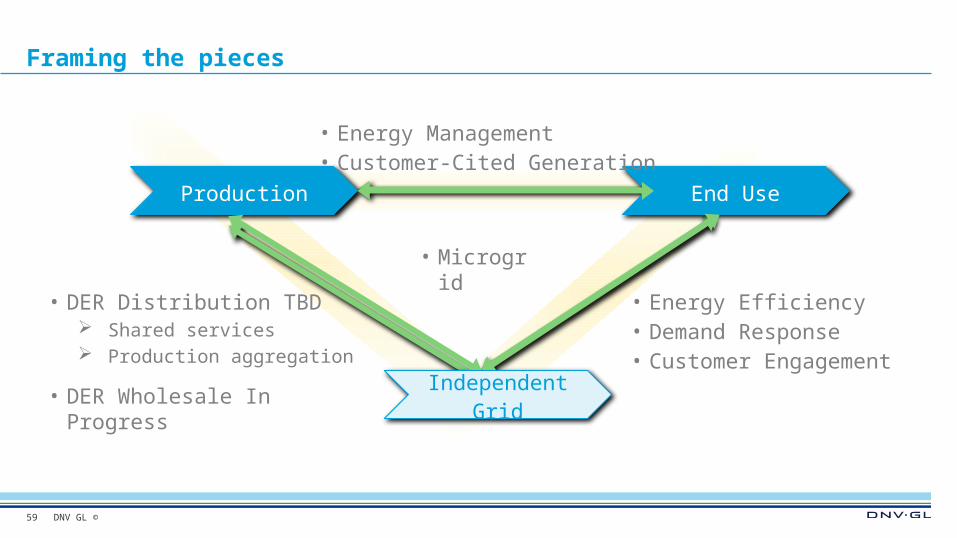
Framing the pieces
59
Utility Distribution
End UseProduction
• Energy Management• Customer-Cited Generation
• Energy Efficiency• Demand Response• Customer Engagement
• DER Distribution TBD Shared services Production aggregation
• DER Wholesale In ProgressIndependent
Grid
• Microgrid
DNV GL ©
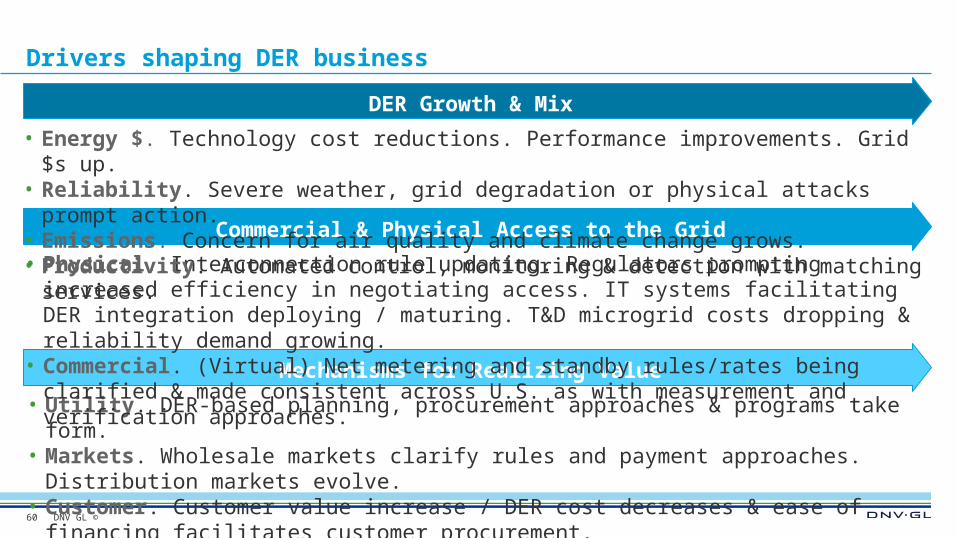
Drivers shaping DER business
• Utility. DER-based planning, procurement approaches & programs take form.• Markets. Wholesale markets clarify rules and payment approaches. Distribution
markets evolve. • Customer. Customer value increase / DER cost decreases & ease of financing
facilitates customer procurement. 60
DER Growth & Mix
Commercial & Physical Access to the Grid
Mechanisms for Realizing Value
• Physical. Interconnection rule updating. Regulators prompting increased efficiency in negotiating access. IT systems facilitating DER integration deploying / maturing. T&D microgrid costs dropping & reliability demand growing.
• Commercial. (Virtual) Net metering and standby rules/rates being clarified & made consistent across U.S. as with measurement and verification approaches.
• Energy $. Technology cost reductions. Performance improvements. Grid $s up.• Reliability. Severe weather, grid degradation or physical attacks prompt action.• Emissions. Concern for air quality and climate change grows. • Productivity. Automated control, monitoring & detection with matching services.
DNV GL ©
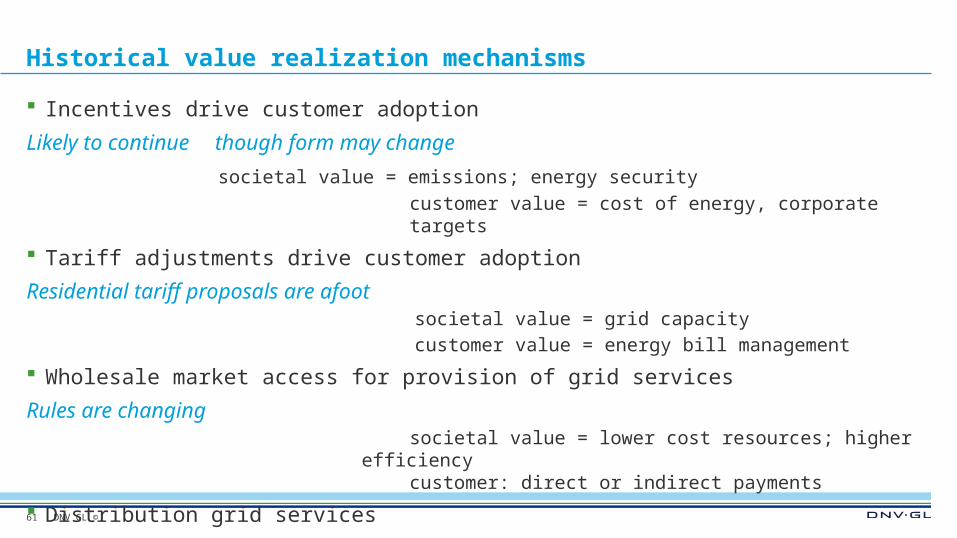
Historical value realization mechanisms
Incentives drive customer adoption
Likely to continue though form may change
societal value = emissions; energy securitycustomer value = cost of energy, corporate targets
Tariff adjustments drive customer adoption
Residential tariff proposals are afootsocietal value = grid capacity
customer value = energy bill management
Wholesale market access for provision of grid services
Rules are changingsocietal value = lower cost resources; higher
efficiencycustomer: direct or indirect payments
Distribution grid services
Increased regulator emphasis on DER & planning– Targeted DSM (e.g., ConEd) societal value = lower cost resources; higher efficiency
customer: direct or indirect payments; bill mgmt.
– Market mechanism (TBD, e.g., NY-REV)
61
DNV GL ©
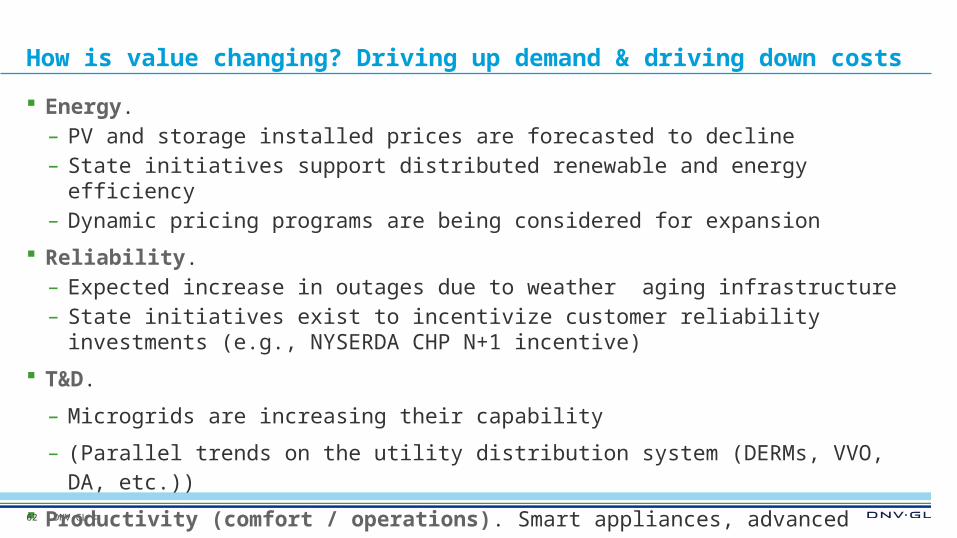
How is value changing? Driving up demand & driving down costs
Energy.– PV and storage installed prices are forecasted to decline– State initiatives support distributed renewable and energy efficiency– Dynamic pricing programs are being considered for expansion
Reliability. – Expected increase in outages due to weather aging infrastructure– State initiatives exist to incentivize customer reliability investments (e.g.,
NYSERDA CHP N+1 incentive)
T&D.
– Microgrids are increasing their capability
– (Parallel trends on the utility distribution system (DERMs, VVO, DA, etc.))
Productivity (comfort / operations). Smart appliances, advanced controls
Emissions. – Corporations are setting and working towards clean energy goals– By 2025, Millenials will make up 75 % of the workforce. The majority place a
priority on alternative energy over fossil fuels and support federal funding of renewables. Two-thirds see climate change as a real problem.
62
DNV GL ©
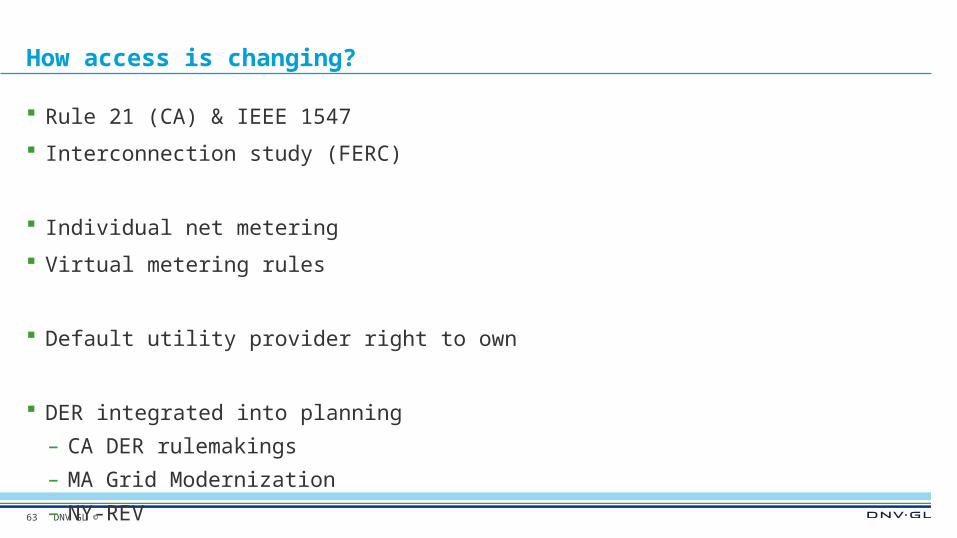
How access is changing?
Rule 21 (CA) & IEEE 1547
Interconnection study (FERC)
Individual net metering
Virtual metering rules
Default utility provider right to own
DER integrated into planning
– CA DER rulemakings
– MA Grid Modernization
– NY-REV
– MN (E21)
– etc.
63
DNV GL ©
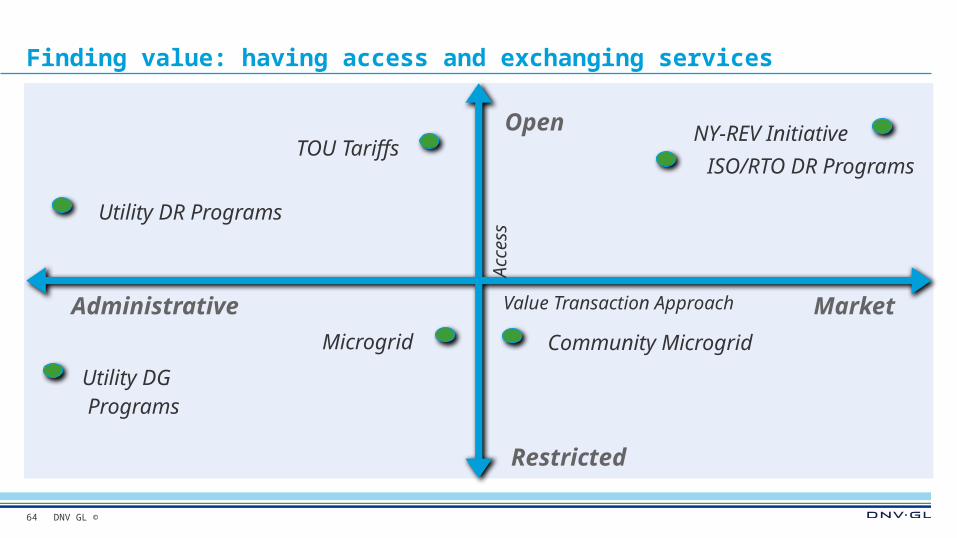
Finding value: having access and exchanging services
64
MarketAdministrative
Open
Restricted
Utility DR Programs
NY-REV Initiative
Utility DG Programs
Acc
ess
Value Transaction Approach
TOU Tariffs
Microgrid Community Microgrid
ISO/RTO DR Programs
DNV GL ©
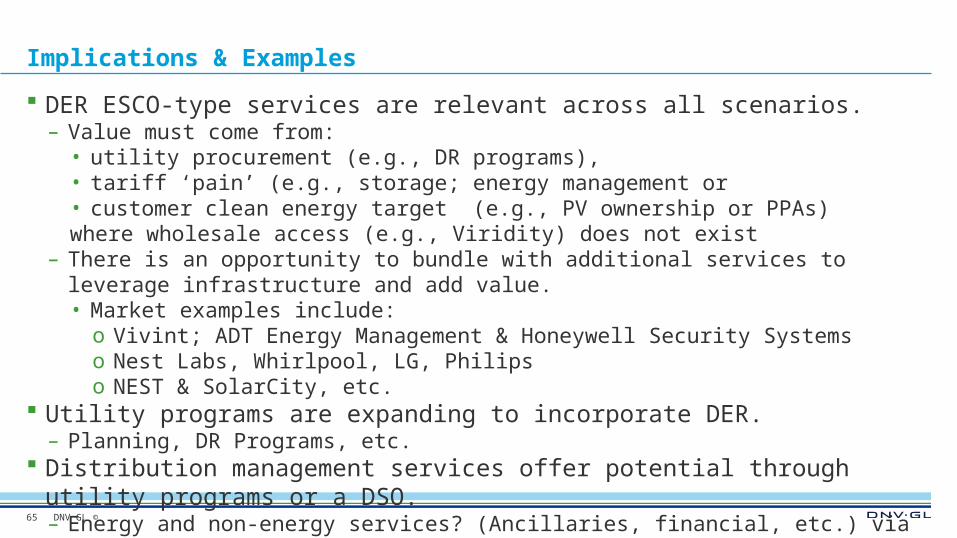
Implications & Examples
DER ESCO-type services are relevant across all scenarios.– Value must come from:
• utility procurement (e.g., DR programs), • tariff ‘pain’ (e.g., storage; energy management or • customer clean energy target (e.g., PV ownership or PPAs)where wholesale access (e.g., Viridity) does not exist
– There is an opportunity to bundle with additional services to leverage infrastructure and add value.• Market examples include: o Vivint; ADT Energy Management & Honeywell Security Systemso Nest Labs, Whirlpool, LG, Philipso NEST & SolarCity, etc.
Utility programs are expanding to incorporate DER.– Planning, DR Programs, etc.
Distribution management services offer potential through utility programs or a DSO. – Energy and non-energy services? (Ancillaries, financial, etc.) via DR, smart
inverters, etc. Microgrids & NY REV might conceptualize new services?
– Localized transactions, mini-ISO/RTO, forecasting, financial hedging, etc.
65
DNV GL ©
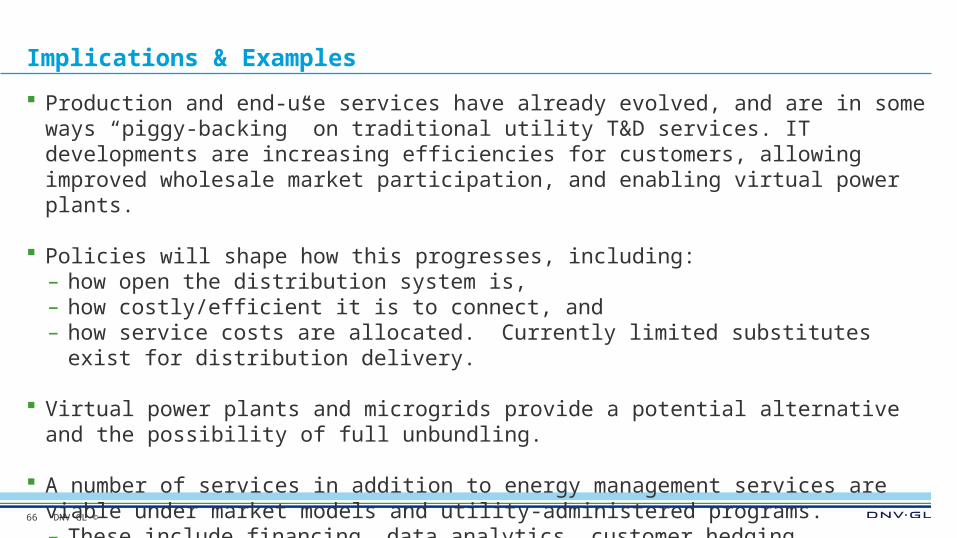
Implications & Examples
Production and end-use services have already evolved, and are in some ways “piggy-backing” on traditional utility T&D services. IT developments are increasing efficiencies for customers, allowing improved wholesale market participation, and enabling virtual power plants.
Policies will shape how this progresses, including: – how open the distribution system is, – how costly/efficient it is to connect, and – how service costs are allocated. Currently limited substitutes exist for
distribution delivery.
Virtual power plants and microgrids provide a potential alternative and the possibility of full unbundling.
A number of services in addition to energy management services are viable under market models and utility-administered programs. – These include financing, data analytics, customer hedging, building-related
services.
Several roles for utilities are feasible. (There is the potential that utilities will become the market operator or the customer).
66
DNV GL ©
SAFER, SMARTER, GREENER
www.dnvgl.com
Thank you
Access the on-demand webinar here.
67
Jessica [email protected]


