Download - Webcast 4Q14

RESULTS ANNOUNCEMENT
4th Quarter and
2014 Year End Results
__
Conference Call / Webcast
April, 23rd 2015
DISCLAIMER
FORWARD-LOOKING STATEMENTS:
DISCLAIMER
The presentation may contain forward-looking statements about future
events within the meaning of Section 27A of the Securities Act of 1933, as
amended, and Section 21E of the Securities Exchange Act of 1934, as
amended, that are not based on historical facts and are not assurances of
future results. Such forward-looking statements merely reflect the
Company’s current views and estimates of future economic circumstances,
industry conditions, company performance and financial results. Such
terms as "anticipate", "believe", "expect", "forecast", "intend", "plan",
"project", "seek", "should", along with similar or analogous expressions, are
used to identify such forward-looking statements. Readers are cautioned
that these statements are only projections and may differ materially from
actual future results or events. Readers are referred to the documents filed
by the Company with the SEC, specifically the Company’s most recent
Annual Report on Form 20-F, which identify important risk factors that
could cause actual results to differ from those contained in the forward-
looking statements, including, among other things, risks relating to general
economic and business conditions, including crude oil and other
commodity prices, refining margins and prevailing exchange rates,
uncertainties inherent in making estimates of our oil and gas reserves
including recently discovered oil and gas reserves, international and
Brazilian political, economic and social developments, receipt of
governmental approvals and licenses and our ability to obtain financing.
We undertake no obligation to publicly update or revise any forward-
looking statements, whether as a result of new information or future
events or for any other reason. Figures for 2015 on are estimates or
targets.
All forward-looking statements are expressly qualified in their entirety
by this cautionary statement, and you should not place reliance on any
forward-looking statement contained in this presentation.
NON-SEC COMPLIANT OIL AND GAS RESERVES:
CAUTIONARY STATEMENT FOR US INVESTORS
We present certain data in this presentation, such as oil and gas
resources, that we are not permitted to present in documents filed with
the United States Securities and Exchange Commission (SEC) under
new Subpart 1200 to Regulation S-K because such terms do not
qualify as proved, probable or possible reserves under Rule 4-10(a) of
Regulation S-X.
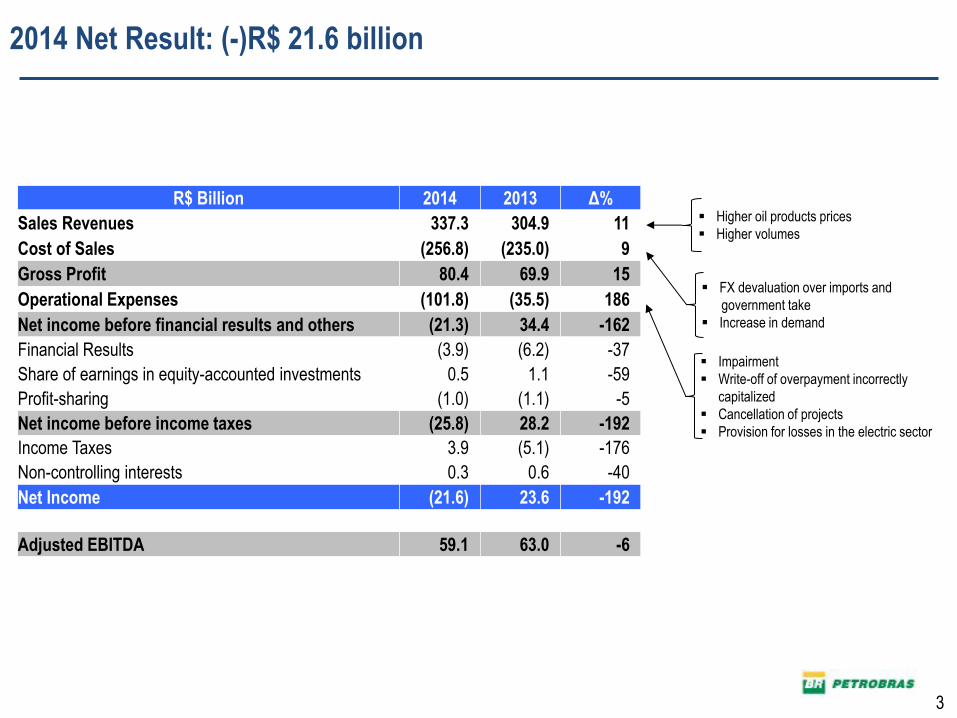
R$ Billion 2014 2013 Δ%
Sales Revenues 337.3 304.9 11
Cost of Sales (256.8) (235.0) 9
Gross Profit 80.4 69.9 15
Operational Expenses (101.8) (35.5) 186
Net income before financial results and others (21.3) 34.4 -162
Financial Results (3.9) (6.2) -37
Share of earnings in equity-accounted investments 0.5 1.1 -59
Profit-sharing (1.0) (1.1) -5
Net income before income taxes (25.8) 28.2 -192
Income Taxes 3.9 (5.1) -176
Non-controlling interests 0.3 0.6 -40
Net Income (21.6) 23.6 -192
Adjusted EBITDA 59.1 63.0 -6
FX devaluation over imports and
government take
Increase in demand
Impairment
Write-off of overpayment incorrectly
capitalized
Cancellation of projects
Provision for losses in the electric sector
Higher oil products prices
Higher volumes
2014 Net Result: (-)R$ 21.6 billion
3
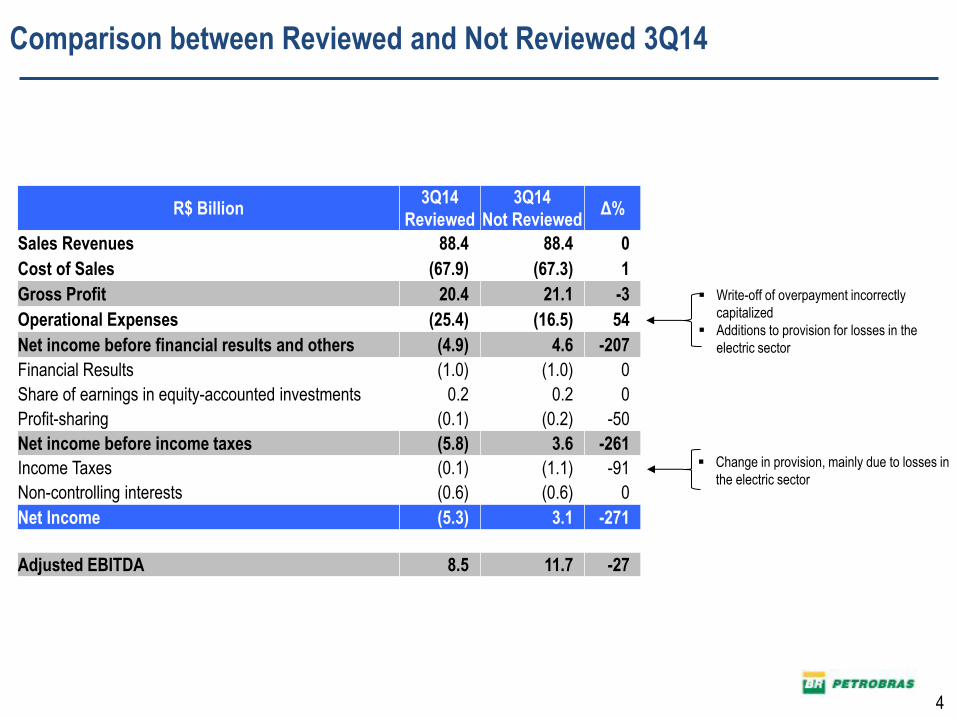
R$ Billion 3Q14
Reviewed
3Q14
Not Reviewed Δ%
Sales Revenues 88.4 88.4 0
Cost of Sales (67.9) (67.3) 1
Gross Profit 20.4 21.1 -3
Operational Expenses (25.4) (16.5) 54
Net income before financial results and others (4.9) 4.6 -207
Financial Results (1.0) (1.0) 0
Share of earnings in equity-accounted investments 0.2 0.2 0
Profit-sharing (0.1) (0.2) -50
Net income before income taxes (5.8) 3.6 -261
Income Taxes (0.1) (1.1) -91
Non-controlling interests (0.6) (0.6) 0
Net Income (5.3) 3.1 -271
Adjusted EBITDA 8.5 11.7 -27
Change in provision, mainly due to losses in
the electric sector
Write-off of overpayment incorrectly
capitalized
Additions to provision for losses in the
electric sector
Comparison between Reviewed and Not Reviewed 3Q14
4
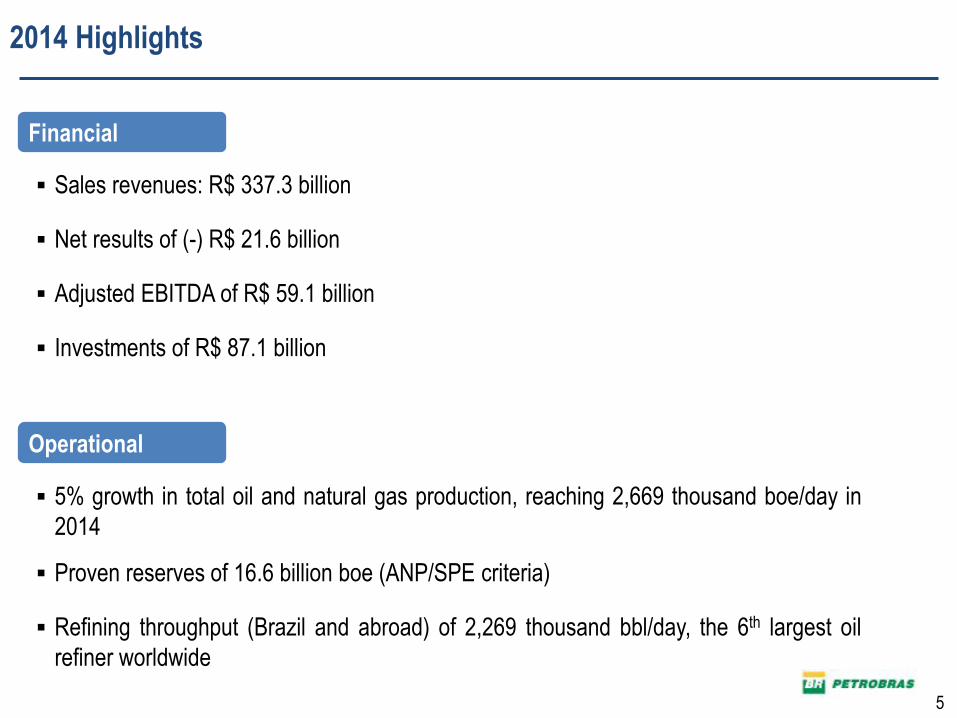
Financial
2014 Highlights
Sales revenues: R$ 337.3 billion
Net results of (-) R$ 21.6 billion
Adjusted EBITDA of R$ 59.1 billion
Investments of R$ 87.1 billion
5% growth in total oil and natural gas production, reaching 2,669 thousand boe/day in
2014
Proven reserves of 16.6 billion boe (ANP/SPE criteria)
Refining throughput (Brazil and abroad) of 2,269 thousand bbl/day, the 6th largest oil
refiner worldwide
5
Operational
2014 Highlights
6
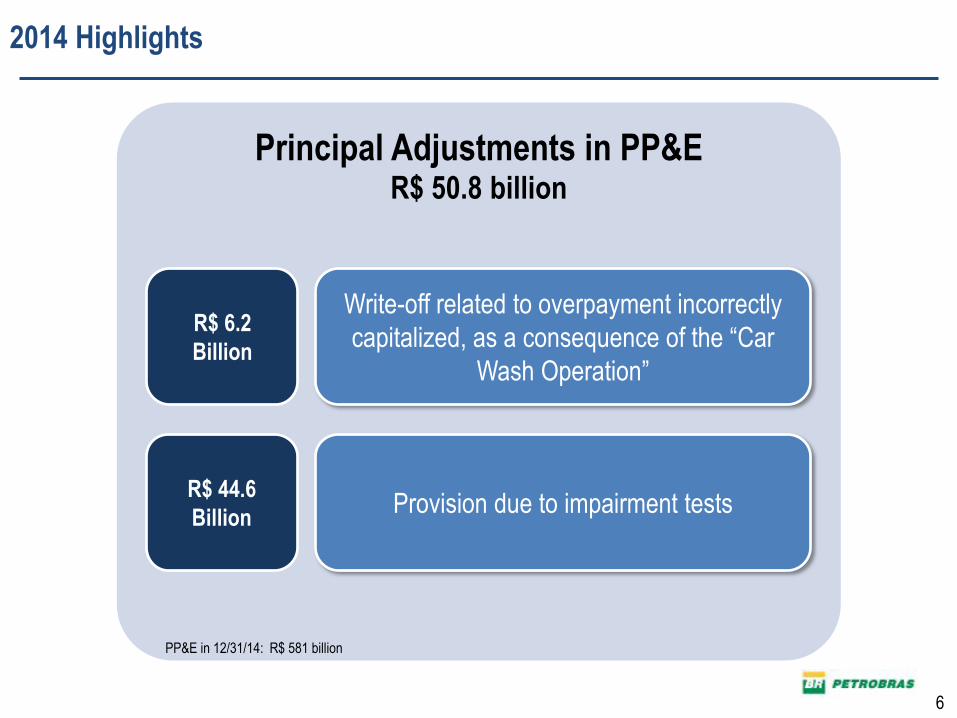
Principal Adjustments in PP&E R$ 50.8 billion
R$ 6.2
Billion
Write-off related to overpayment incorrectly
capitalized, as a consequence of the “Car
Wash Operation”
Provision due to impairment tests R$ 44.6
Billion
PP&E in 12/31/14: R$ 581 billion
7
Principal Adjustments in PP&E
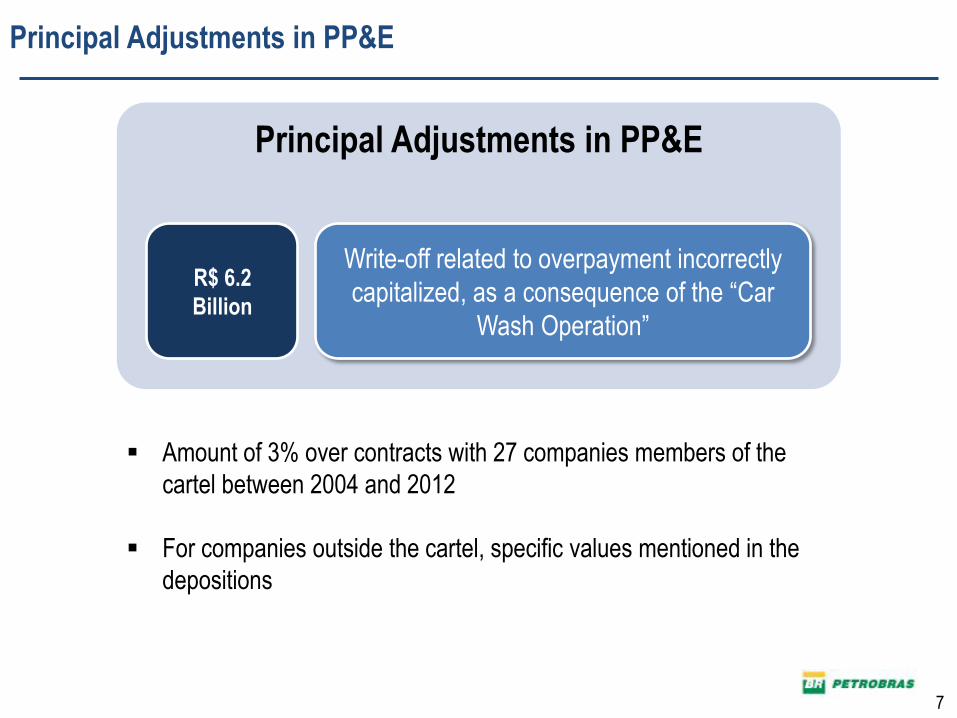
R$ 6.2
Billion
Write-off related to overpayment incorrectly
capitalized, as a consequence of the “Car
Wash Operation”
Amount of 3% over contracts with 27 companies members of the
cartel between 2004 and 2012
For companies outside the cartel, specific values mentioned in the
depositions
Principal Adjustments in PP&E
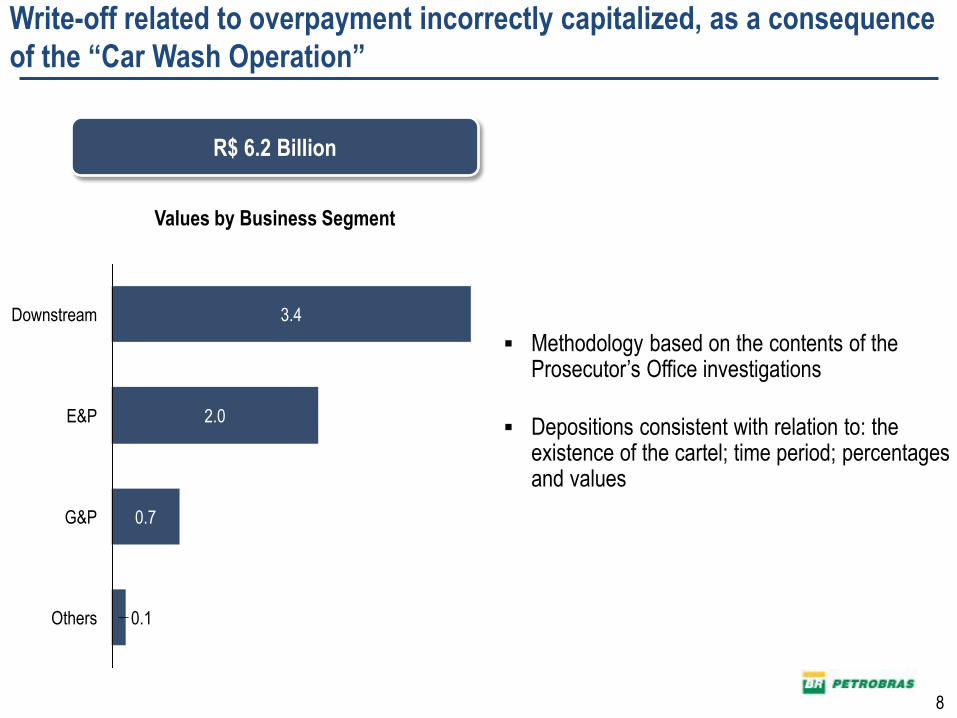
Methodology based on the contents of the Prosecutor’s Office investigations
Depositions consistent with relation to: the existence of the cartel; time period; percentages and values
Values by Business Segment
0.1
0.7 G&P
2.0
Others
E&P
Downstream 3.4
8
R$ 6.2 Billion
Write-off related to overpayment incorrectly capitalized, as a consequence
of the “Car Wash Operation”
9
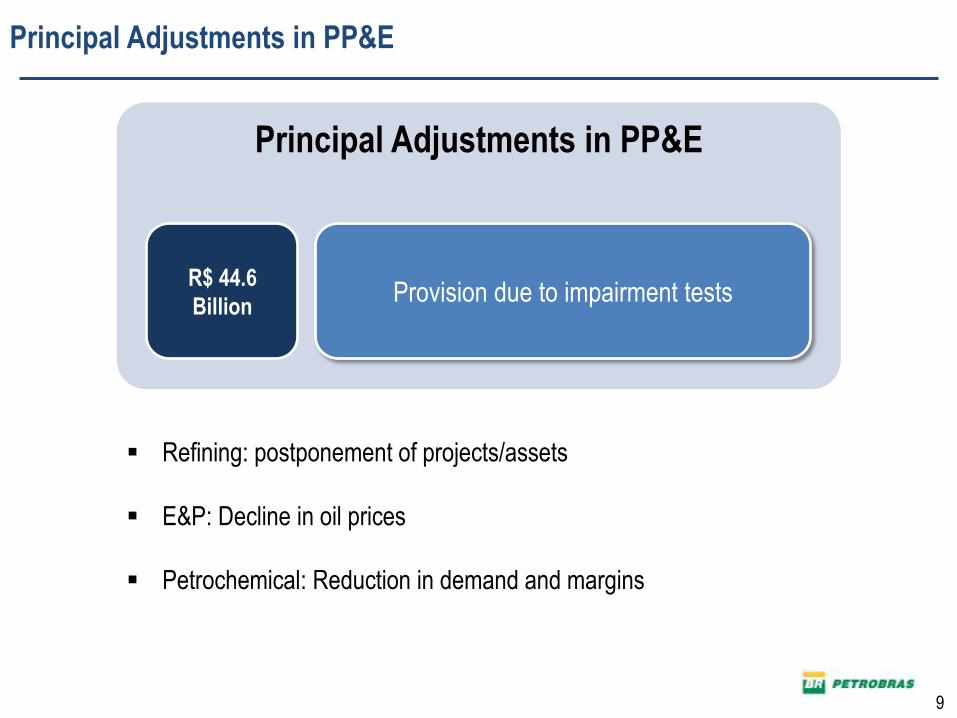
Principal Adjustments in PP&E
R$ 44.6
Billion Provision due to impairment tests
Refining: postponement of projects/assets
E&P: Decline in oil prices
Petrochemical: Reduction in demand and margins
Principal Adjustments in PP&E
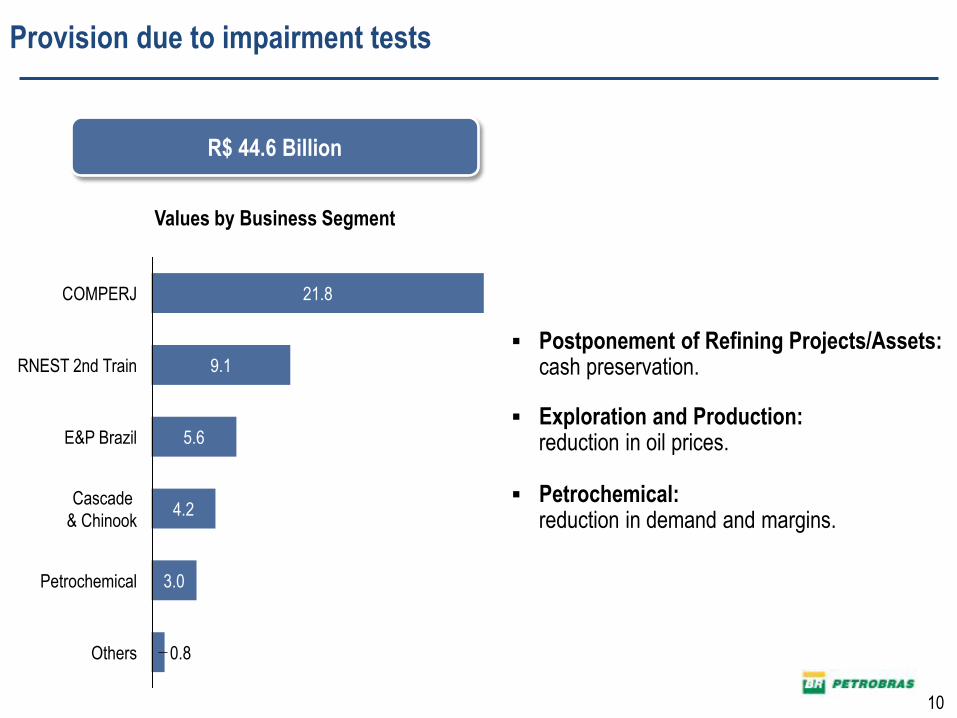
Postponement of Refining Projects/Assets: cash preservation.
Exploration and Production: reduction in oil prices.
Petrochemical:
reduction in demand and margins.
Others 0.8
Petrochemical 3.0
Cascade
& Chinook 4.2
E&P Brazil 5.6
RNEST 2nd Train 9.1
COMPERJ 21.8
10
Values by Business Segment
R$ 44.6 Billion
Provision due to impairment tests
11
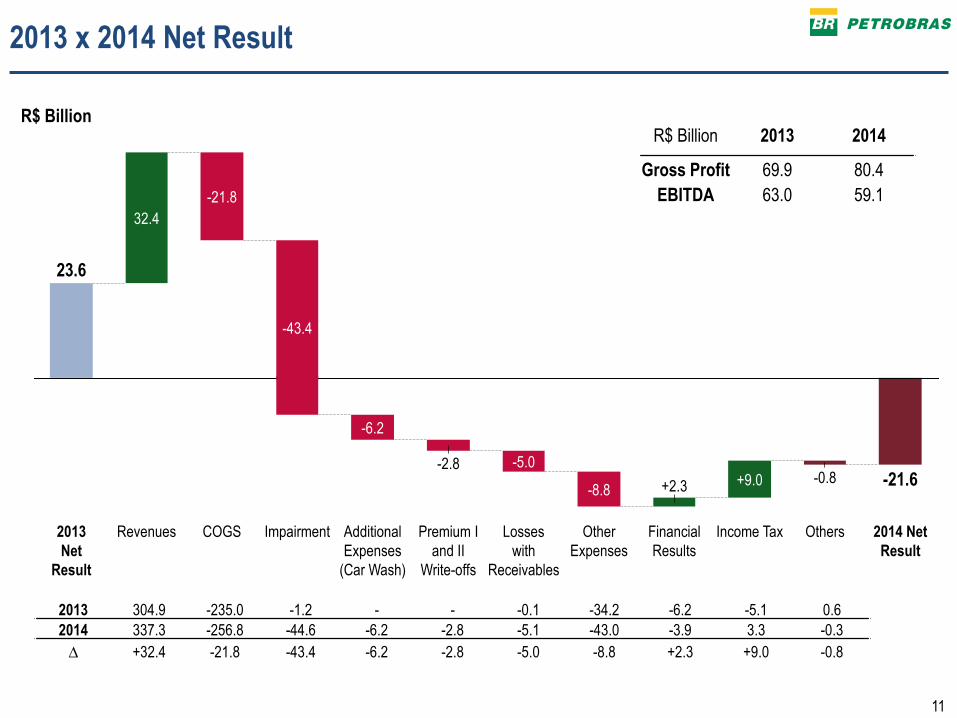
2013 x 2014 Net Result
R$ Billion
-21.6
Others
-0.8
Income Tax
+9.0
Financial
Results
+2.3
2014 Net
Result
Other
Expenses
-8.8
Losses
with
Receivables
-5.0
Premium I
and II
Write-offs
-2.8
Additional
Expenses
(Car Wash)
-6.2
Impairment
-43.4
COGS
-21.8
Revenues
32.4
2013
Net
Result
23.6
2013 304.9 -235.0 -1.2 - - -0.1 -34.2 -6.2 -5.1 0.6
2014 337.3 -256.8 -44.6 -6.2 -2.8 -5.1 -43.0 -3.9 3.3 -0.3
∆ +32.4 -21.8 -43.4 -6.2 -2.8 -5.0 -8.8 +2.3 +9.0 -0.8
R$ Billion 2013 2014
Gross Profit 69.9 80.4
EBITDA 63.0 59.1
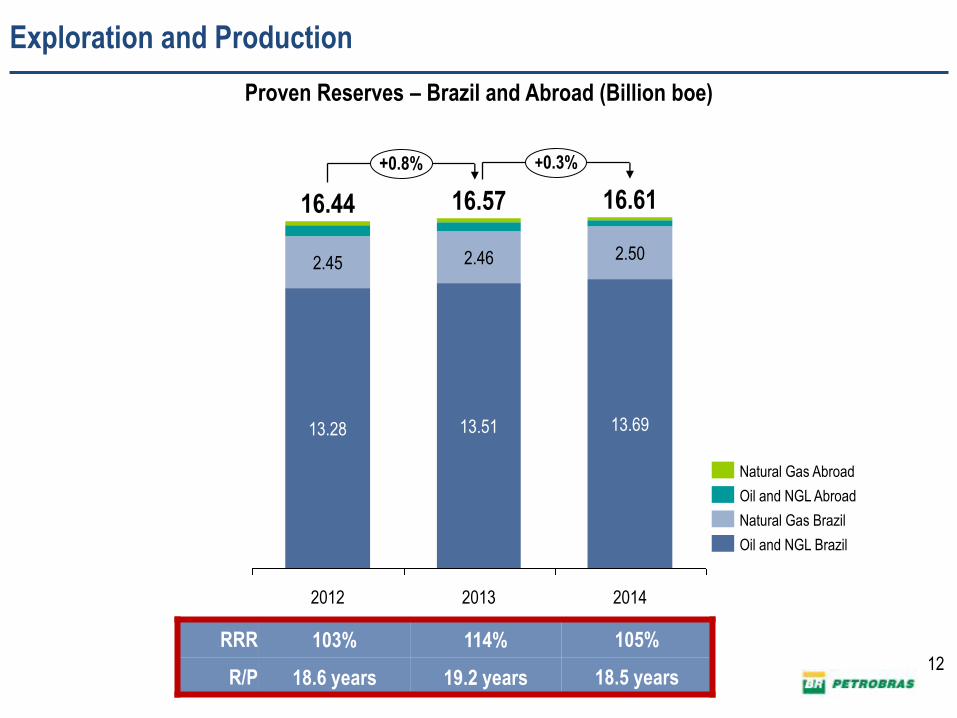
Proven Reserves – Brazil and Abroad (Billion boe)
Exploration and Production
+0.8% +0.3%
2014
16.61
13.69
2.50
2013
16.57
13.51
2.46
2012
16.44
13.28
2.45
Natural Gas Abroad
Natural Gas Brazil
Oil and NGL Brazil
Oil and NGL Abroad
12
RRR 103% 114% 105%
R/P 18.6 years 19.2 years 18.5 years
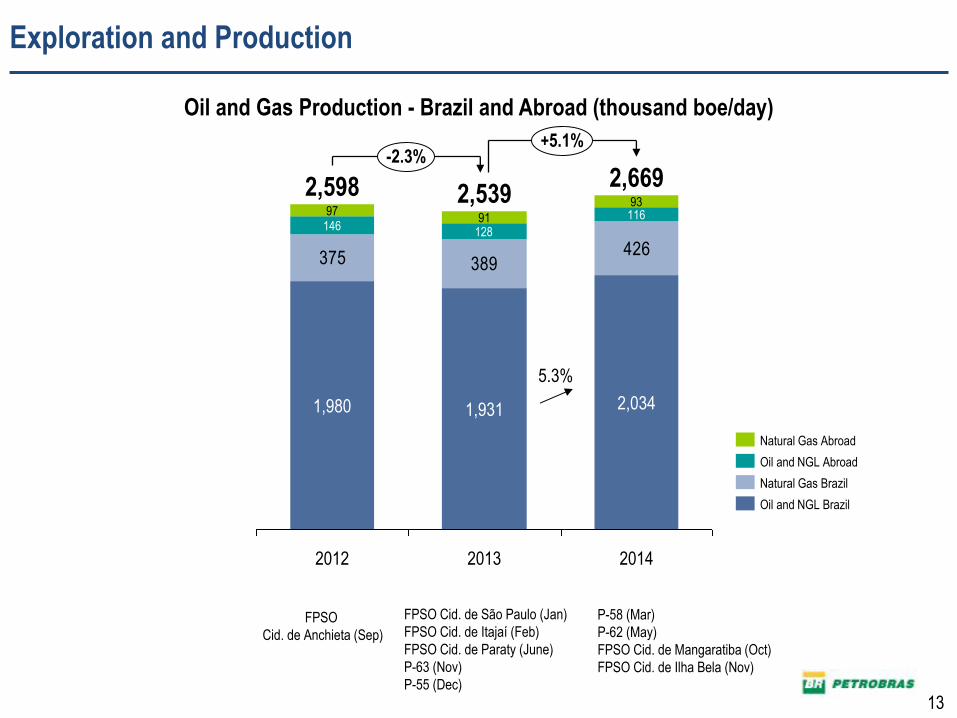
Exploration and Production
375 389426
146 128
1169793
2,034
2014
+5.1%
2013
1,931
-2.3%
2,669 2,539
91
2012
2,598
1,980
Oil and NGL Brazil
Natural Gas Brazil
Oil and NGL Abroad
Natural Gas Abroad
5.3%
Oil and Gas Production - Brazil and Abroad (thousand boe/day)
13
FPSO
Cid. de Anchieta (Sep)
FPSO Cid. de São Paulo (Jan)
FPSO Cid. de Itajaí (Feb)
FPSO Cid. de Paraty (June)
P-63 (Nov)
P-55 (Dec)
P-58 (Mar)
P-62 (May)
FPSO Cid. de Mangaratiba (Oct)
FPSO Cid. de Ilha Bela (Nov)
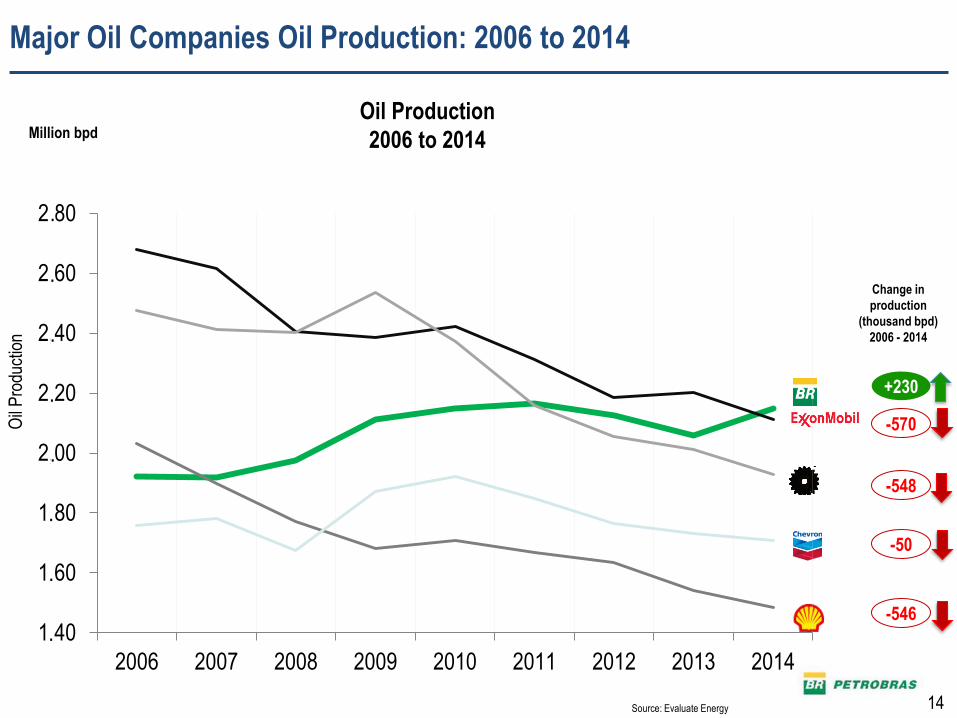
Million bpd
Source: Evaluate Energy
Change in
production
(thousand bpd)
2006 - 2014
Oil Production
2006 to 2014
Oil
Pro
duct
ion
+230
-570
-548
-50
-546 1,40
1,60
1,80
2,00
2,20
2,40
2,60
2,80
2006 2007 2008 2009 2010 2011 2012 2013 2014
Major Oil Companies Oil Production: 2006 to 2014
14
.
.
.
.
.
.
.
.
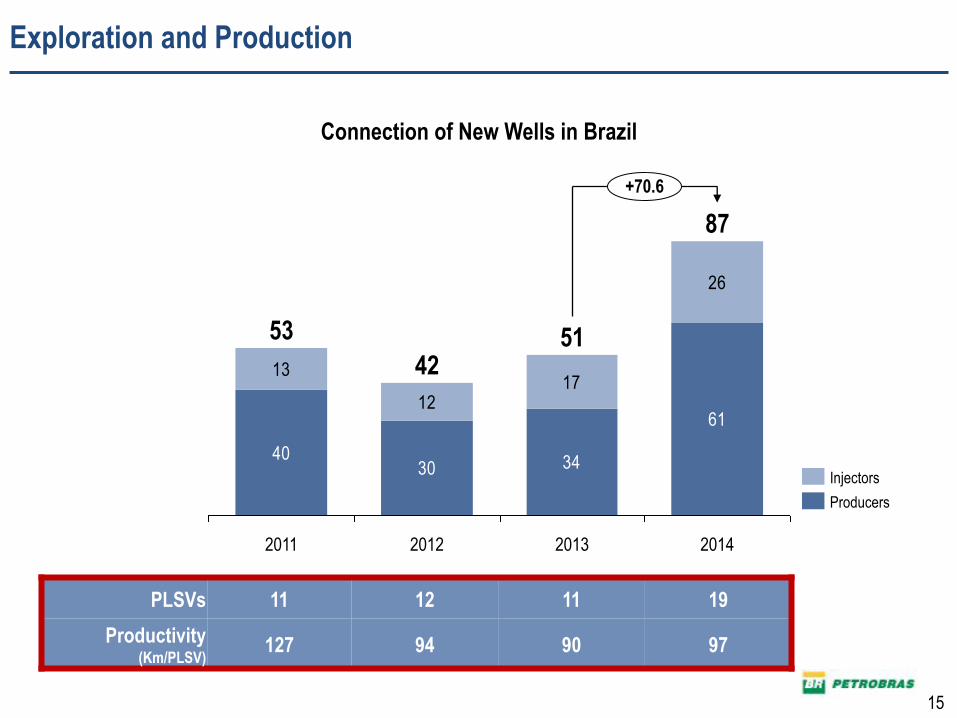
Exploration and Production
Connection of New Wells in Brazil
15
4030 34
61
13
1217
26
2014
87
+70.6
2013
51
2012
42
2011
53
Injectors
Producers
PLSVs 11 12 11 19
Productivity (Km/PLSV)
127 94 90 97
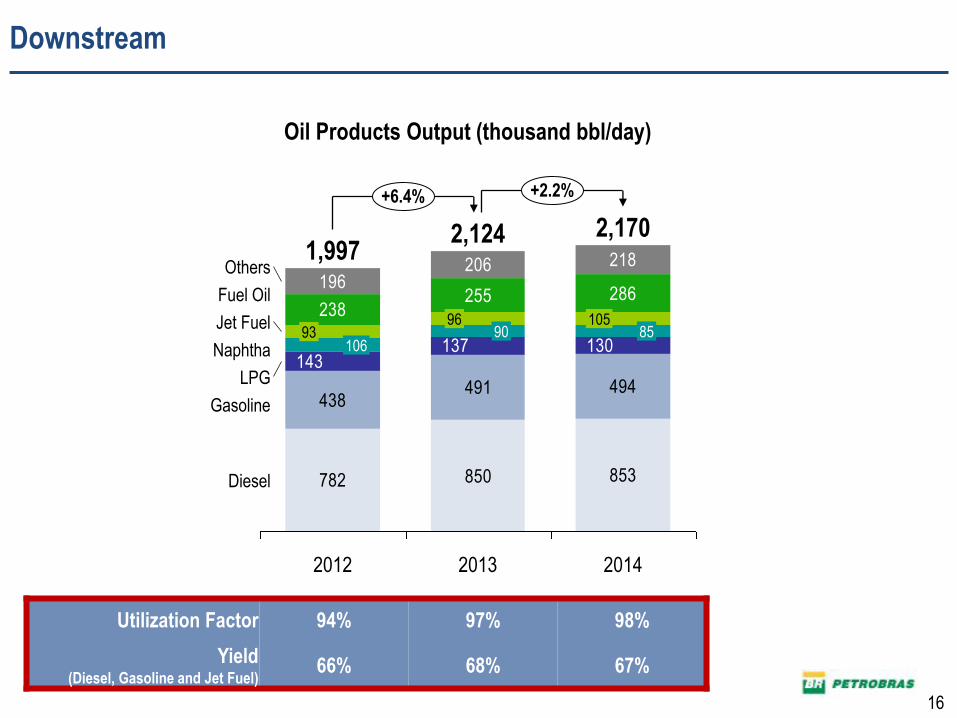
Downstream
782 850 853
438491 494
238255 286
196206 218
130137143
106 93
+6.4%
Gasoline
+2.2%
Diesel
90 96
2012
1,997
Jet Fuel
Fuel Oil
Others
2014
2,170
85 105
2013
2,124
Naphtha
LPG
Oil Products Output (thousand bbl/day)
16
Utilization Factor 94% 97% 98%
Yield (Diesel, Gasoline and Jet Fuel)
66% 68% 67%
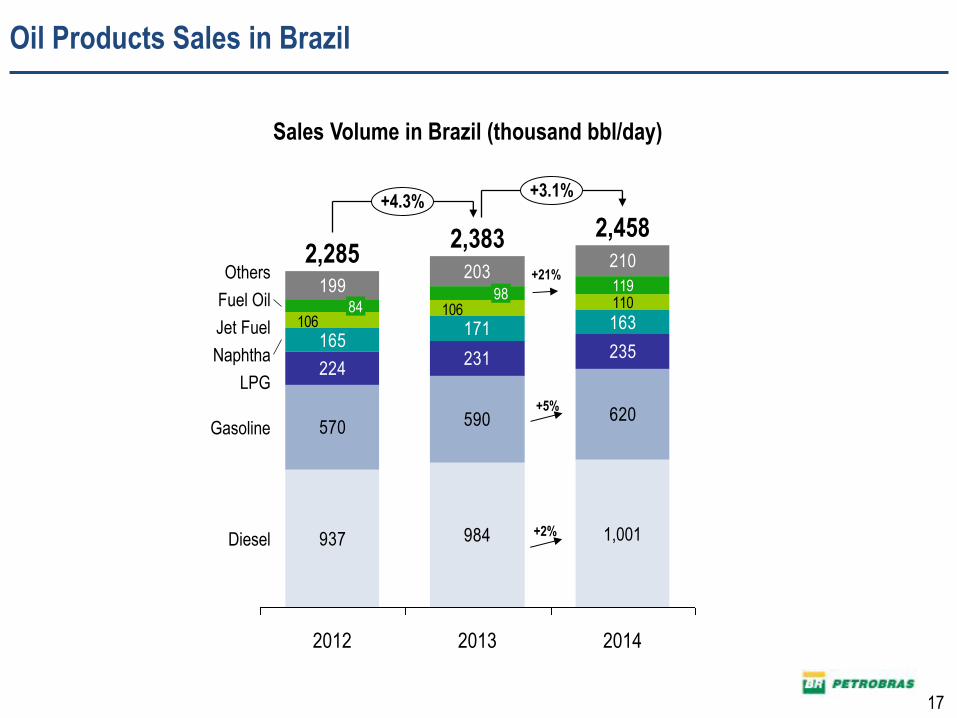
Oil Products Sales in Brazil
937 984
570 590 620
224231 235
165171 163
110199
203210
106106
119
+4.3% +3.1%
Diesel
Gasoline
LPG
Naphtha
Jet Fuel
Fuel Oil
Others
2014
2,458
1,001
2013
2,383
98
2012
2,285
84
+5%
+2%
+21%
Sales Volume in Brazil (thousand bbl/day)
17
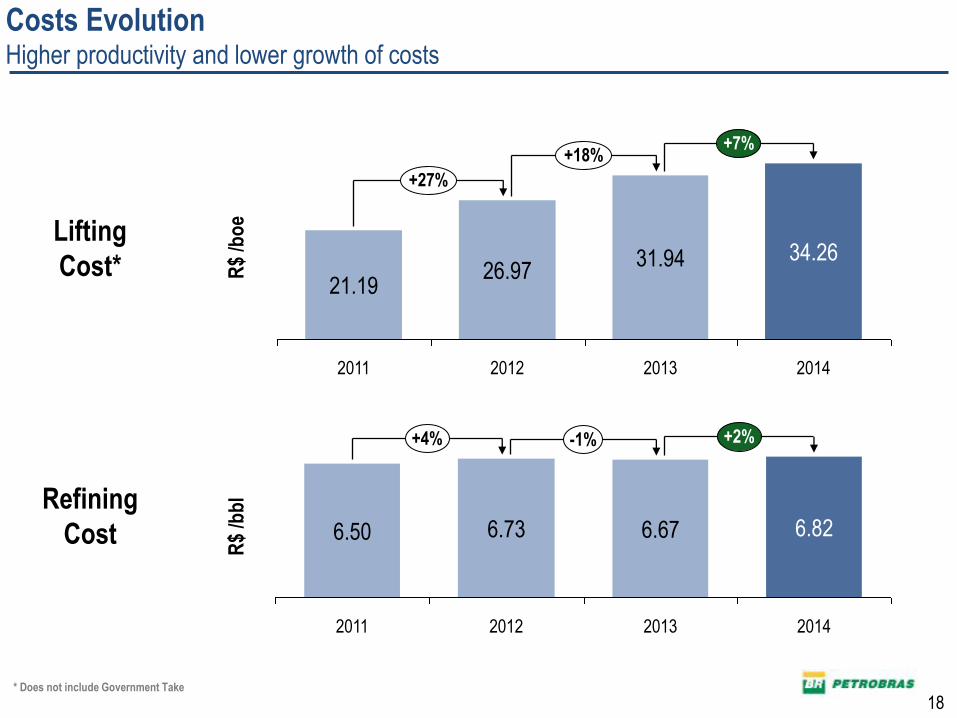
Costs Evolution Higher productivity and lower growth of costs
R$
/bb
l
-1% +4% +2%
2014
6.82
2013
6.67
2012
6.73
2011
6.50
Refining
Cost
R$
/bo
e
21.19
2014
+7%
+27%
34.26
2013
+18%
2012
26.97
2011
31.94 Lifting
Cost*
18 * Does not include Government Take
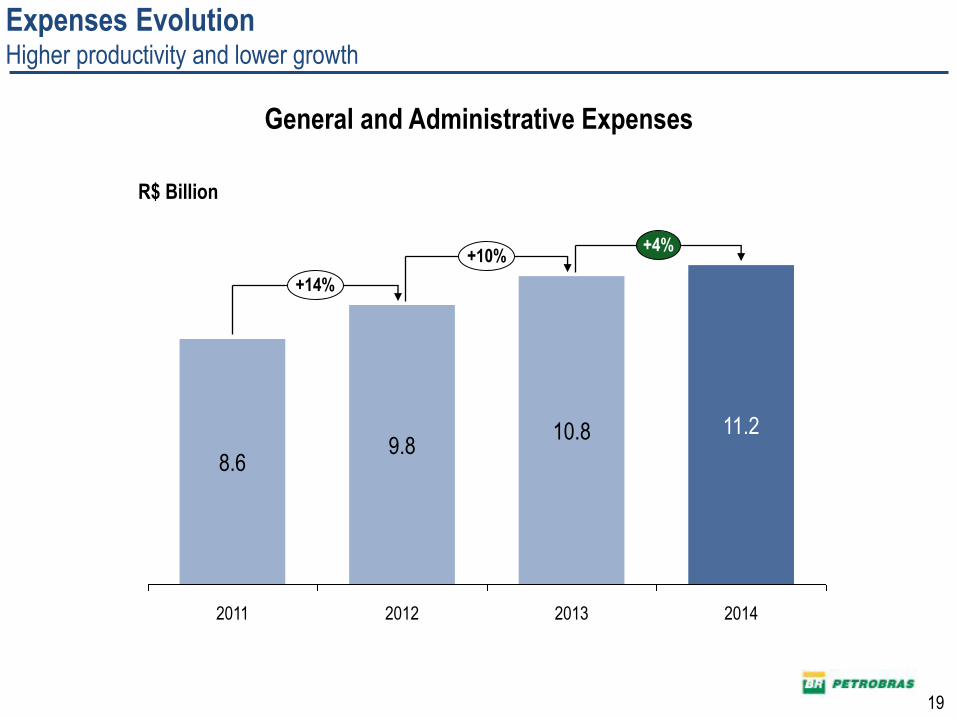
Expenses Evolution Higher productivity and lower growth
R$ Billion
9.8
+4%
11.2
2011 2014 2012
10.8
2013
+10%
+14%
8.6
General and Administrative Expenses
19
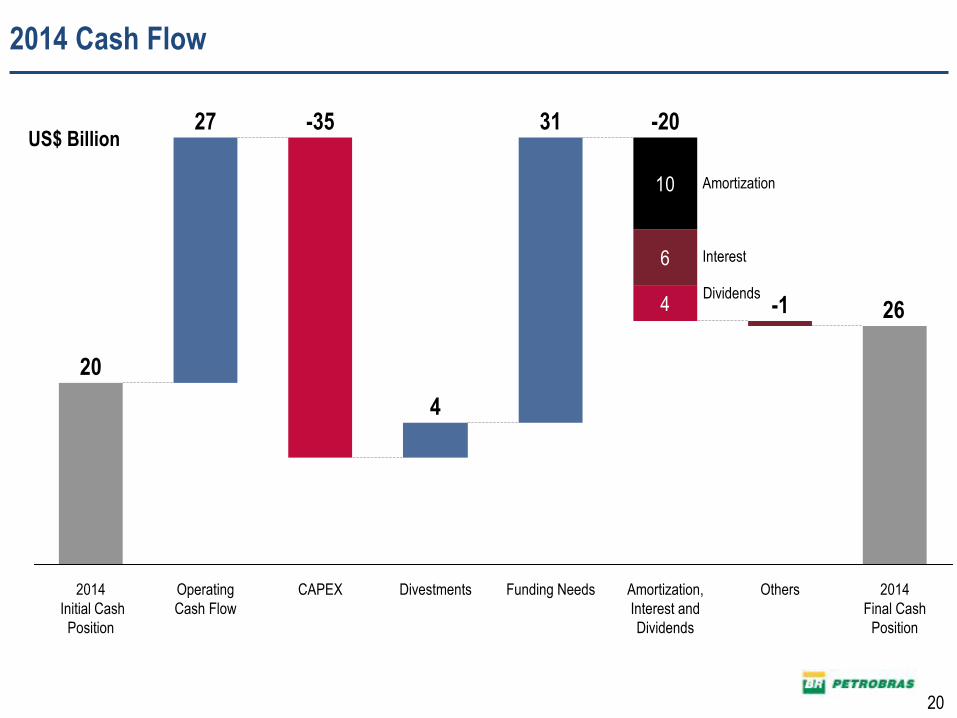
2014 Cash Flow
US$ Billion
26
31
4
27
20
4
6
10
2014
Final Cash
Position
Others Amortization,
Interest and
Dividends
-20
Funding Needs
-35
Divestments CAPEX Operating
Cash Flow
-1
2014
Initial Cash
Position
Amortization
Interest
Dividends
20
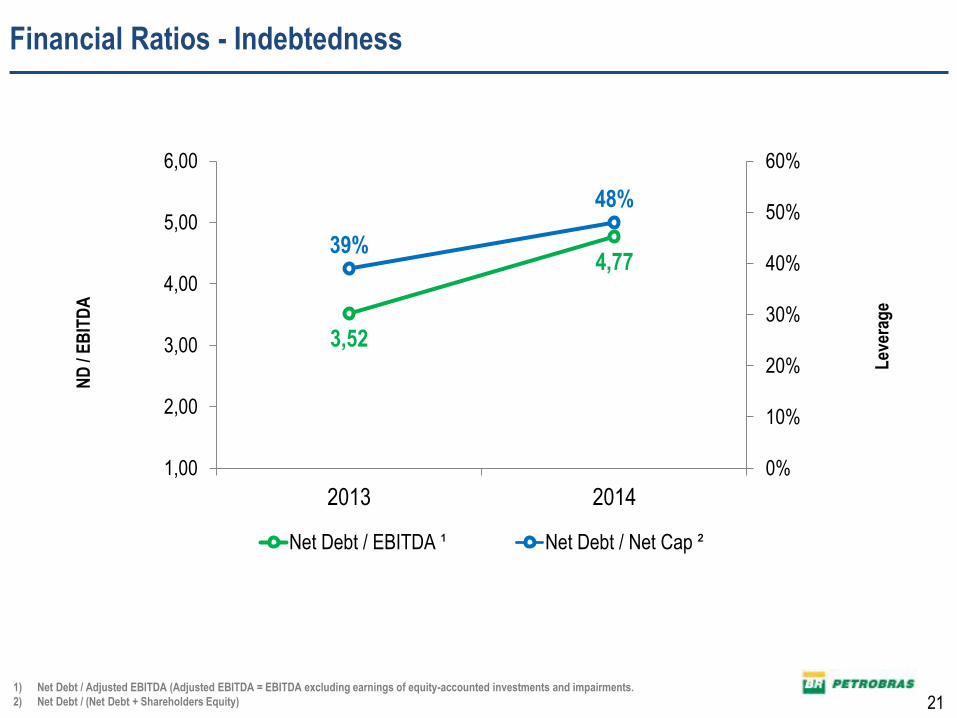
Financial Ratios - Indebtedness
Lev
erag
e
ND
/ E
BIT
DA
1) Net Debt / Adjusted EBITDA (Adjusted EBITDA = EBITDA excluding earnings of equity-accounted investments and impairments.
2) Net Debt / (Net Debt + Shareholders Equity)
3,52
4,77 39%
48%
0%
10%
20%
30%
40%
50%
60%
1,00
2,00
3,00
4,00
5,00
6,00
2013 2014
Net Debt / EBITDA ¹ Net Debt / Net Cap ²
21
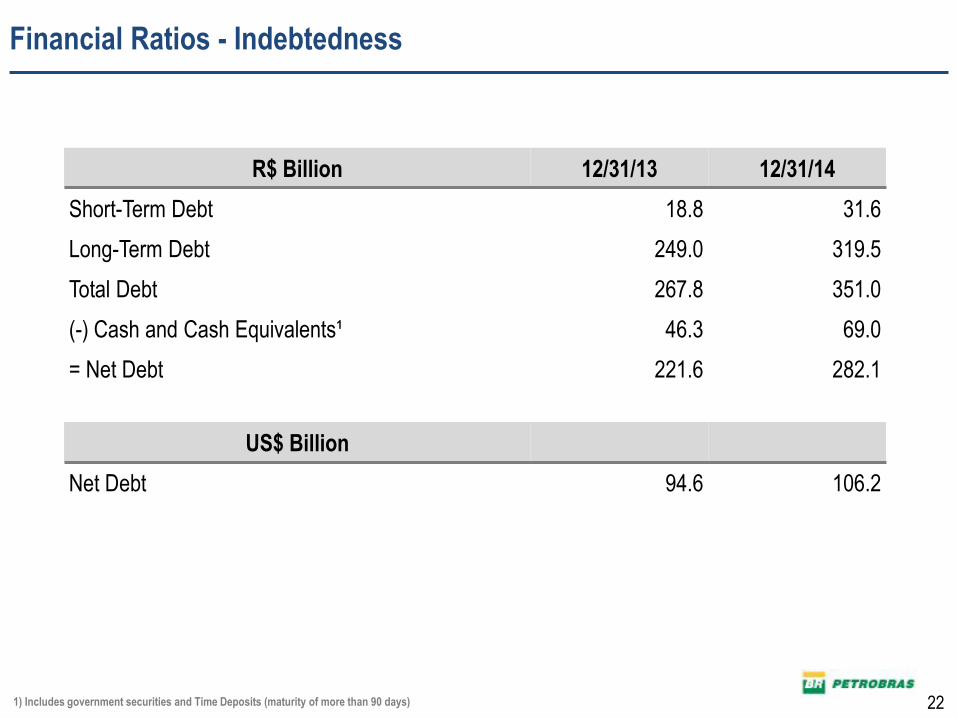
R$ Billion 12/31/13 12/31/14
Short-Term Debt 18.8 31.6
Long-Term Debt 249.0 319.5
Total Debt 267.8 351.0
(-) Cash and Cash Equivalents¹ 46.3 69.0
= Net Debt 221.6 282.1
US$ Billion
Net Debt 94.6 106.2
1) Includes government securities and Time Deposits (maturity of more than 90 days)
Financial Ratios - Indebtedness
22
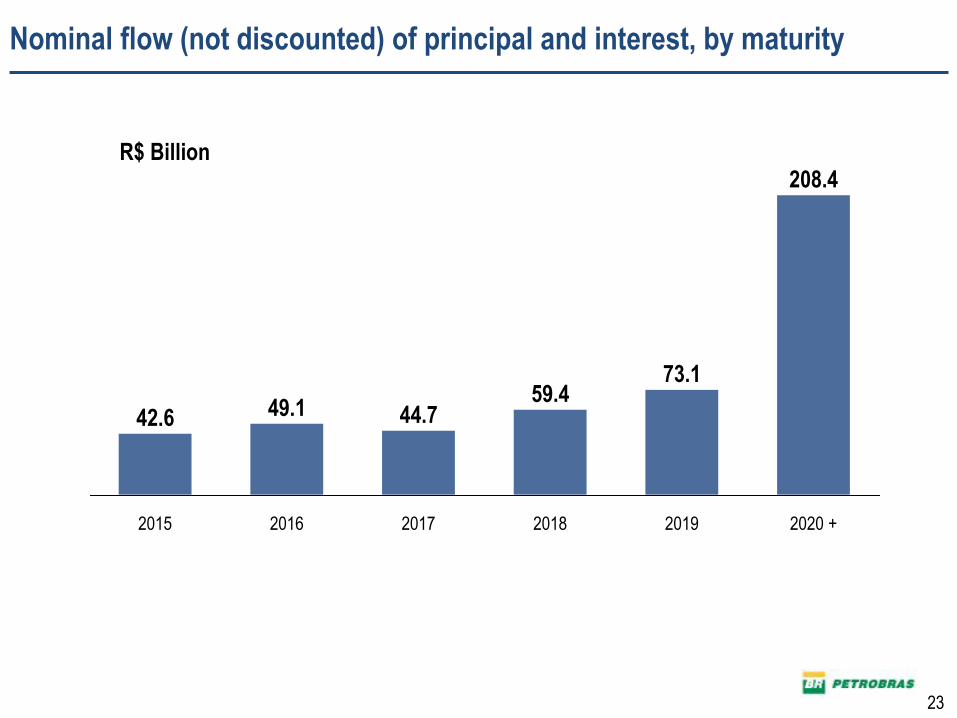
Nominal flow (not discounted) of principal and interest, by maturity
42.6
2015
73.1
2017 2018
44.7 49.1 59.4
2020 +
208.4
2019 2016
R$ Billion
23
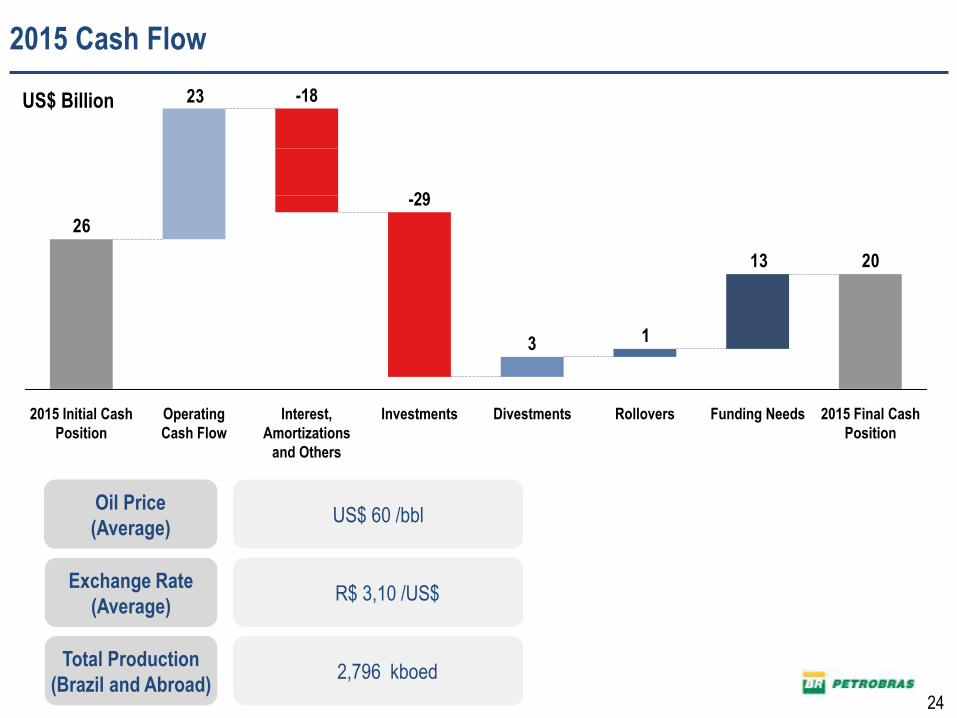
24
US$ Billion
US$ 60 /bbl
R$ 3,10 /US$
Oil Price
(Average)
Exchange Rate
(Average)
2013
13
23
26
Funding Needs Rollovers 2015 Final Cash
Position
Divestments 2015 Initial Cash
Position
Investments
-29
Interest,
Amortizations
and Others
-18
Operating
Cash Flow
2015 Cash Flow
2,796 kboed Total Production
(Brazil and Abroad)
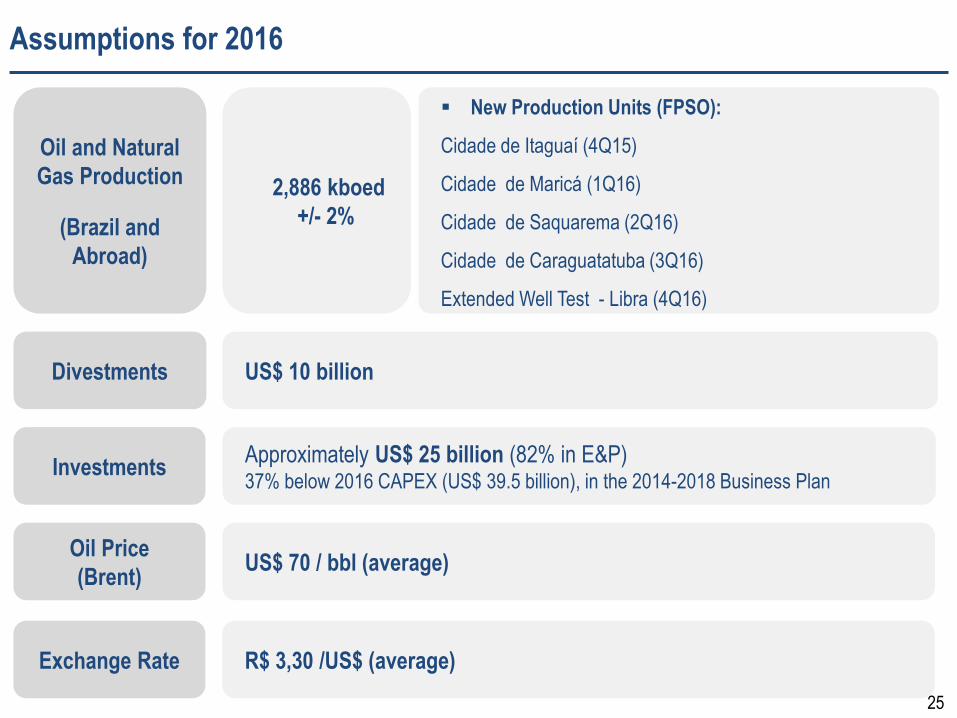
Assumptions for 2016
25
New Production Units (FPSO):
Cidade de Itaguaí (4Q15)
Cidade de Maricá (1Q16)
Cidade de Saquarema (2Q16)
Cidade de Caraguatatuba (3Q16)
Extended Well Test - Libra (4Q16)
Oil and Natural
Gas Production
(Brazil and
Abroad)
US$ 10 billion Divestments
Approximately US$ 25 billion (82% in E&P) 37% below 2016 CAPEX (US$ 39.5 billion), in the 2014-2018 Business Plan
Investments
2,886 kboed
+/- 2%
US$ 70 / bbl (average) Oil Price
(Brent)
R$ 3,30 /US$ (average) Exchange Rate
RESULTS ANNOUNCEMENT
4th Quarter and
2014 Year End Results
__
Information:
Investor Relations
+55 21 3224-1510


