Download - Waste Incineration

Municipal Solid Waste
Incineration
The World BankWashington, D.C.
WORLD BANK
TECHNICAL GUIDANCE REPORT

© 1999 The International Bank for Reconstructionand Development / THE WORLD BANK
1818 H Street, N.W.Washington, D.C. 20433, U.S.A.
All rights reservedManufactured in the United States of AmericaFirst printing August 1999
This report has been prepared by the staff of the World Bank. The judgments expressed do not necessari-ly reflect the views of the Board of Executive Directors or of the governments they represent.
The material in this publication is copyrighted. The World Bank encourages dissemination of its workand will normally grant permission promptly.
Permission to photocopy items for internal or personal use, for the internal or personal use of specificclients, or for educational classroom use, is granted by the World Bank, provided that the appropriate fee ispaid directly to the Copyright Clearance Center, Inc., 222 Rosewood Drive, Danvers, MA 01923, U.S.A., tele-phone 978-750-8400, fax 978-750-4470. Please contact the Copyright Clearance Center before photocopyingitems.
For permission to reprint individual articles or chapters, please fax your request with complete informa-tion to the Republication Department, Copyright Clearance Center, fax 978-750-4470.
All other queries on rights and licenses should be addressed to the World Bank at the address above orfaxed to 202-522-2422.
Cover photo by unknown
iii
Foreword v
PART 1 — ASSESSMENT 1
1 Introduction 3Methodology 3The Flow and Management of Municipal Solid Waste 4Incineration Project Summary 4
2 Waste as Fuel 9Key Issues 9Waste Generation and Composition 10Heating Value 11Waste Surveys/Forecasts 13
3 Institutional Framework 19Key Issues 19Waste Sector 20Energy Sector 21Incineration Plant Organization and Management 21
4 Incineration Plant Economics and Finance 25Key Issues 25Economics 25Financing 29Cost Benefit Assessment 31
5 The Project Cycle 33Key Issues 33Feasibility Phase 33Project Preparation Phase 33Project Implementation Phase 36Socio-Economic Aspects and Stakeholder Participation 37
References 41
Contents

iv Measuring Country Performance on Health
PART 2 — TECHNICAL 43
Technical Plant Overview 45
1 Plant Location 47Key Issues 47Site Feasibility Assessment 47
2 Incineration Technology 51Key Issues 51Pre-treatment of Waste 52Design and Layout of the Mass Burning Incineration System 54
3 Energy Recovery 59Key Issues 59Emergy Recovery Technology 59
4 Air Pollution Control 65Key Issues 65Volume and Composition of the Flue Gas 66Environmental Standards 67Air Pollution Control Technology 68APC Systems Overview 74Induced Draught Fan and Stack 74
5 Incineration Residues 77Key Issues 77Slag 77Grate Siftings 78Boiler and Fly Ash 79Residues from Dry and Semi-dry Flue Gas Treatment 79Sludges from Water Treatment 80Spent Adsorbent from Dioxin Filters 80Other Materials 80
6 Operation and Maintenance 83Key Issues 83Typical Plant Organization and Staffing 83Crucial Supplies and External Services 85Training of Workers, Codes of Practice, and Occupational Safety and Health 85
7 Environmental Impact and Occupational Health 87Key Issues 87Environmental Impact 87Occupational Safety and Health 90
References 93
Municipal Solid Waste Incineration Checklist 95

v
Foreword
Solid waste management is in crisis in many of theworld’s largest urban areas as populations attracted tocities continues to grow. This has led to ever increasingquantities of domestic solid waste while space for dis-posal decreases. Municipal managers are looking to thedevelopment of sanitary landfills around the peripheryof their cities as a first solution. However, siting andpreparation of a landfill requires the acquisition of largeareas as well as good day to day operation in order to min-imize potential negative environmental impacts.Another approach that has recently caught the attentionof decisionmakers is mass burn incineration similar tosystems found in the OECD countries. However, capitaland operating requirements for these plants are general-ly an order of magnitude greater than required for land-fills. Project developers armed with rosy financial fore-casts can be found in all corners of the globe encouragingmunicipal officials to consider incineration.
In order to assist local officials with developing costeffective strategies for dealing with solid waste manage-
ment, the World Bank has begun a program of provid-ing high level advice on approaches that are basicallyfinancially self supporting, socially and environmental-ly responsible. This Technical Guidance Report providesthe foundation for such a detailed evaluation of solidwaste incineration systems. A document for making amore preliminary assessment is the accompanyingDecision Maker’s Guide to Incineration of MunicipalSolid Waste.
This report should be used with caution since bothtechnical and financial feasibility are very site-specif-ic. Readers with general interest and technical spe-cialists will find this report useful in making theirassessments. A comprehensive solid waste manage-ment program may include several options phased inover a long period of time during which refuse quan-tities, constituents and the overall economic picturemay change significantly. This uncertainty and asso-ciated risks must be incorporated into the planningprocess.
Kristalina GeorgievaSector ManagerEnvironment and Social
Development Sector UnitEast Asia and Pacific RegionThe World BankWashington, DCUSA
Keshav VarmaSector ManagerUrban Development
Sector UnitEast Asia and Pacific RegionThe World BankWashington, DCUSA

The Report was made possible through the generoussupport of the Danish government. The report wasprepared by Mr. J. Haukohl, Mr. T. Rand and Mr. U.Marxen of Rambøll. Three people were instrumental inencouraging the preparation of these publications,Lars Mikkel Johannessen, currently with the Danishgovernment, Dr. Carl Bartone, Principal Environ-mental Specialist and Gabriel Boyer. The Task Manager
for this work was Jack Fritz, Environmental Engineer.The editors were Mellen Candage and Carol Levie ofGrammarians, Inc.
In addition to internal reviewers, we also thank theexternal peer reviewers for their time and comments,specifically Stephen Schwarz, PE of Malcolm Pirnie,Inc. and Anil Chatterjee, PE of Chatterjee andAssociates.
vi
Acknowledgments

vii
Abbreviations and Symbols

A Ash content per kg of dry sampleAPC Air pollution controlBO Build and operateBOO Build, own, and operateBOOT Build, own, operate, transferC Combustion fraction°C Degrees CelsiusCBA Cost benefit assessmentCHP Combined heat and powerDBO Design, build, and operateDC Direct currentDS Dry substanceEA Environmental assessmentEIA Environmental impact assessmentESP Electrostatic precipitatorEU European UnionGDP Gross domestic productGR Growth rateGWh Gigawatt hour
h HourHawf Ash and water free calorific valueHinf Lower (inferior) calorific valueHinf, overall Overall lower calorific valueHRD Human resource developmentHsup Upper (superior) calorific valueHsup,DS Superior calorific value of dry samplekcal KilocaloriesK KelvinKF Key figurekJ KilojoulekPa KilopascalLCV Lower calorific valueLOI Loss of ignitionLP Low pressurem MeterMCW Weight of condensed water per kg of dry
samplemg Milligrams
viii Municipal Solid Waste Incineration

1
PART 1ASSESSMENT


The Technical Guidance Report provides back-ground information for the Decision Makers’ Guideto Municipal Solid Waste (MSW) Incineration. TheReport focuses on large-scale incineration plantsfor large urban areas or intermunicipal coopera-tives. It does not address hazardous and infectiouswastes.
The Decision Makers’ Guide is a practical tool fora preliminary assessment of whether the key crite-ria for a solid waste incineration scheme are pre-sent.
The Technical Guidance Report provides decisionmakers and their advisers with more elaborate infor-mation on how to investigate and assess the degree towhich the key criteria are fulfilled. Hence, the Reportcomprises a comprehensive account of many aspectsof waste incineration. Part 1 of the Report providesinformation needed to assess the feasibility of MSWincineration. Part 2 covers technical aspects and theavailable technologies related to an MSW incinerationplant.
The Decision Makers’ Guide primarily addressesan audience at the political level, whereas theTechnical Guidance Report presumes some degreeof general technical knowledge. However, noexpertise within the field of waste incineration isrequired to understand the Technical GuidanceReport.
Finally, note that the Technical Guidance Report isfar from being a design manual for an MSW incinera-tion plant. The responsibility, the final feasibilityassessment and the consecutive design of such a plantmust be entrusted to experienced consultants and sup-pliers with an extensive track record in this complexsubject.
Methodology
The Technical Guidance Report is organized asfollows:
Part I
• Introduction• Waste as Fuel• Institutional Framework• Incineration Plant Economics and Finance• The Project Cycle
Part II
• Plant Location• Incineration Technology• Energy Recovery• Air Pollution Control• Incineration Residues• Operation and Maintenance• Environmental Impact and Occupational Health
Each chapter is standardized to make informationeasy to access, as follows:
• Key issues—Main points, critical issues, and deci-sions to be made.
• Key criteria—Key criteria are listed in order ofimportance, using the following symbols to empha-size priority:
✓ ✓ ✓ Mandatory✓ ✓ Strongly Advisable✓ Preferable
3
1 Introduction

If any mandatory key criteria are not expected to befulfilled, it is advisable to stop planning the solid wasteincineration plant.
• General principles—Elaboration of the general con-siderations.
The Technical Guidance Report is supplemented byan evaluation checklist for decision makers who areconsidering MSW incineration as part of their wastemanagement strategy.
Furthermore, as an introduction, the following twosections provide a brief overview of the flow and man-agement of municipal solid waste, objectives andapplicability of waste incineration, and the necessaryinstitutional framework.
The Flow and Management of MunicipalSolid Waste
Solid waste arises from human activities—domestic,commercial, industrial, agricultural, waste water treat-ment, and so on. If the waste is not properly handledand treated, it will have a negative impact on thehygienic conditions in urban areas and pollute the airand surface and ground water, as well as the soil andcrops.
A hygienic and efficient system for collection anddisposal of solid waste is therefore fundamental for anycommunity. Generally, the demands on the solid wastemanagement system increase with the size of the com-munity and its per capita income. Figure 1.1 shows thatthe final destination of waste is always a disposal site.Residues from waste treatment processes are returnedto the waste mainstream and end up in the landfill withuntreated waste. Hence, the backbone of any wastemanagement system is an efficient collection systemand an environmentally sound sanitary landfill.
The system’s resource recovery and recycling reflectthat solid wastes are materials and by-products withpotentially negative value for the possessor.Understanding what may be considered waste will thuschange with the circumstances of the possessor as wellas in time and place. Waste may be transformed into aresource simply by transportation to a new place or
through treatment. Such a transformation depends onthe costs involved and whether the economy is lookedupon as a private business, a national priority, or evenglobally.
Waste treatment involving mechanical plantsrequires large investments and operating costs. Hence,it should be only introduced after gaining profoundknowledge of the existing system and waste genera-tion—which is quite a challenge, except in a highlyorganized waste management system. The mostimportant factor in obtaining such information is thatthe waste is already disposed of in fully monitored andcontrolled landfills only.
Incineration Project Summary
MSW incineration is found at the most advanced levelof the waste disposal/treatment hierarchy: indiscrimi-nate dumping, controlled dumping, landfilling, sani-tary landfilling, and mechanical treatment (for exam-ple, composting and incineration). Additional envi-ronmental control is introduced at each level and thedisposal costs increase substantially. Introducingmechanical treatment of MSW entails a significantjump in technology and costs and is generally only fea-sible when all waste is already being disposed of in asanitary landfill established and operated according toDecision Makers’ Guide to Solid Waste Landfills, WB/1/.Even so, many things can cause the project to fail andleave society with a huge bill to pay.
Deciding to incinerate waste instead of, for instance,dumping it, takes careful consideration of the criteriafor success. In the mid 1980s, a number of EasternEuropean and Asian cities jumped directly from sim-ple dumping to MSW incineration. Any success was,however, questionable in many of these cities. In theformer Soviet Union, several plants were commis-sioned in the late 1970s and early 1980s. Unfortunately,some of these plants were never completed, others werediscontinued, and the rest are operating at reducedcapacity because of financial, managerial, and opera-tional shortcomings.
In Asia, there is limited experience with waste incin-eration outside the industrialized countries of Japan,Singapore, and Taiwan. A few plants in other places
4 Municipal Solid Waste Incineration

have experienced managerial, financial, or operationalproblems, including low calorific value of the waste dueto scavenging, precipitation, or the basic compositionof the generated waste.
The failure of MSW incineration plants is usuallycaused by one or more of the following:
• Inability or unwillingness to pay the full treatmentfee, which results in insufficient revenue to coverloan installments and operation and maintenancecosts
• Lack of convertible currency for purchase of spareparts
• Operation and maintenance failures (including lackof skilled workers)
• Problems with the waste characteristics and quan-tity
• Poor plant management• Inadequate institutional arrangements• Overly optimistic projections by vendors.
Objectives and Applicability of MSW IncinerationIn highly industrialized European countries, wasteincineration plants have been used increasingly overthe last 50 years, mainly because it has been more dif-ficult to find new sites for landfills in densely populat-
Introduction 5
FinalProduct
PrincipalTechnologies
Principal SolidWaste Activities
Production, trade, and consumption
RecyclingSortingSolid waste
Collection
Transfer stationsTransportation
Manual sorting
Recycling
Mechanical sortingTreatment (optional)
Soil improverComposting
EnergyIncineration
Scavenging Recycling
Land reclamationDisposal / landfill
Figure 1.1 Solid waste handling and treatment system components

ed areas. The public concern for the environmentalimpact of MSW incineration has, however, increasedsignificantly over the last 20 years—forcing the manu-facturers to develop, and the plants to install and oper-ate, high-cost advanced technology for pollution con-trol (especially air pollution).
Incineration of MSW does not completely elimi-nate, but does significantly reduce, the volume of wasteto be landfilled. The reductions are approximately 75percent by weight and 90 percent by volume. Theresidues arising from air pollution control (APC) are,however, environmentally problematic, as they presenta severe threat to ground and surface waters. Currenttechnology is supposed to dispose of such residues inhighly controlled sanitary landfills equipped withadvanced leachate collection and treatment measures,or in former underground mines to prevent leaching of
heavy metals and, for some APC residues, chlorides.Fear of pollution often brings MSW incinerationplants to the center of emotional public debate.
Incinerating solid waste fulfills two purposes in theadvanced waste management system. Primarily, itreduces the amount of waste for sanitary landfilling;and it uses waste for energy production (power or dis-trict heating). Hence, waste incineration plants aregenerally introduced in areas where the siting of sani-tary landfills is in conflict with other interests such ascity development, agriculture, and tourism.
Solid waste incineration is a highly complex technol-ogy, which involves large investments and high operat-ing costs. Income from sale of energy makes an impor-tant (and necessary) contribution to the total planteconomy, and, consequently, the energy market plays animportant role in deciding whether to establish a plant.
6 Municipal Solid Waste Incineration
Figure 1.2 Exploded view of typical MSW incineration facility (mass burning)

Several types of incineration technologies are avail-able today, and the most widely used is mass burningincineration—with a movable grate or, to a lesserextent, rotary kilns. Fluidized bed incineration is still atthe experimental stage and should therefore not yet beapplied. The mass burning technology with a movablegrate has been successfully applied for decades and wasdeveloped to comply with the latest technical and envi-ronmental standards. Mass burning incineration cangenerally handle municipal waste without pre-treat-ment on an as-received basis.
Mass burning technologies are generally applied forlarge-scale incineration of mixed or source-separatedmunicipal and industrial waste. Compared to movablegrates the rotary kiln incineration plants have a small-er capacity and are mostly used for special types ofwaste unsuitable for burning on a grate, such as vari-ous types of hazardous, liquid, and infectious waste.
Institutional Framework—OverviewWhen considering the construction of an incinerationplant, it is necessary to consult with many project stake-holders. The relevant stakeholders are usually authori-ties, the waste sector, community groups, and the ener-gy sector. A further subdivision of these stakeholdersappears below.
It is important to review possible local stakeholdersbased on the actual local conditions, political and
financial situation, and other current and plannedwaste treatment and disposal facilities.
The most important issue, financially, could begeneration of revenue from the sale of heat or power(or both), as well as the possibility of collecting feesfrom commercial, domestic, and public waste gener-ators.
Environmentally, important issues may be to definesuitable standards for flue gas emissions, quality anddisposal of solid outputs (slag, ash, and flue gas clean-ing residuals), as well as waste water in case a wet fluegas cleaning system is applied.
The most important question, institutionally,could be how to control the waste flow for optimumtreatment and utilization of the available waste treat-ment and disposal facilities; and how to ensure theinstitutional and managerial capacity required tooperate a multiple stringed waste management sys-tem.
Depending on local traditions and the level of envi-ronmental awareness, a special and transparent infor-mation campaign could be carried out for communitygroups and neighboring citizens.
The goals, strength, resources, and awareness of thestakeholders often differ among each other and withthose of the proposed incineration plant owner/oper-ator. Reaching a solution that is acceptable to all maybe difficult.
Introduction 7
Energy Sector
Power producersPower distribution companyIndustries selling heat/powerDistrict heating companyPower/energy consumers
Community
Environmental NGOs Nature/Wildlife NGOs Community groupsNeighboring citizensScavengers
Waste Incineration Plant
Waste Sector
Waste generatorsWaste recycling companies
Waste collection companiesOther treatment plants
Landfill operators
Authorities
Local/provincial government Urban/regional planningEnvironment authoritiesHealth authoritiesTraffic authorities
Figure 1.3 Typical MSW incineration project stakeholders


Key Issues
The successful outcome of a waste incineration projectfirst depends on fairly accurate data on the future wastequantities and characteristics that form the basis forthe design of the incineration plant.
Waste for incineration must meet certain basicrequirements. In particular, the energy content of thewaste, the so-called lower calorific value (LCV), mustbe above a minimum level. The specific composition ofthe waste is also important. An extreme waste compo-sition of only sand and plastics is not suitable for incin-eration, even though the average lower calorific valueis relatively high. Furthermore, in order to operate theincineration plant continuously, waste generationmust be fairly stable during the year.
Hence, the amount and composition of solid wastegenerated in the collection area for a potential inciner-ation plant, and possible seasonal variations, must bewell established before the project is launched. Wastecomposition depends on variables such as cultural dif-ferences, climate, and socio-economic conditions.Therefore, data usually cannot be transferred from oneplace to another.
All waste studies and forecasts must focus on thewaste ultimately supplied to the waste incinerationplant. Consequently, the effect of recycling activities(for example, scavengers) that change the compositionof the waste must always be considered.
In many developing countries, the domestic wastehas a high moisture or ash content (or both).Therefore, a comprehensive survey must be taken toestablish whether it is feasible to incinerate year-round,as seasonal variations may significantly affect the com-bustibility of the waste.
Waste from industries and the commercial sector(except for market waste) generally has a much highercalorific value than domestic waste. However, collec-tion of such wastes is often less organized or controlled,and delivery to an incineration plant can be difficult.Some types of waste, such as demolition waste andwaste containing certain hazardous or explosive com-pounds, are not suitable for incineration.
The waste composition may change in time becauseof either additional recycling or economic growth inthe collection area. Both changes can significantly alterthe amount of waste and its calorific value.
Key criteria✓ ✓ ✓ The average lower calorific value of the
waste must be at least 6 MJ/kg throughoutall seasons. The annual average lowercalorific value must not be less than 7 MJ/kg.
✓ ✓ Forecasts of waste generation and composi-tion are established on the basis of wastesurveys in the collection area for theplanned incineration plant. This task mustbe carried out by an experienced (and inde-pendent) institution.
✓ ✓ Assumptions on the delivery of com-bustible industrial and commercial waste toan incineration plant should be founded onan assessment of positive and negativeincentives for the various stakeholders touse the incineration facility.
✓ ✓ The annual amount of waste for incinerationshould not be less than 50,000 metric tons
9
2 Waste as Fuel

and the weekly variations in the waste supplyto the plant should not exceed 20 percent.
Waste Generation and Composition
The quantity and composition of solid waste dependon how developed the community is and the state of itseconomy. Industrial growth is an important tool forraising the per capita income and welfare of the popu-lation. In return, industrial growth and higher per capi-ta income generate more waste, which, if not properlycontrolled, causes environmental degradation.
Key figures for generation of municipal solid waste(MSW) appear in Table 2.1. MSW is collected by, or onthe order of, the authorities and commonly compriseswaste disposed of at municipal collection facilitiesfrom households, commercial activities, office build-ings, public institutions, and small businesses. Theactual definition of “municipal solid waste” may, how-ever, vary from place to place.
Urbanization and rapid growth of cities increase theamounts of waste generated in limited and densely
populated areas. This, in turn, may eliminate the pos-sibility of inexpensive disposal methods.
In more rural areas, crops and animal wastes areincreasing as pesticides and fertilizers are appliedmore often. However, many of these biodegradablematerials may be burned as fuel or easily convertedinto a soil conditioner and should not be regarded astrue waste.
10 Municipal Solid Waste Incineration
Table 2.1 Key figures—municipal solid waste (kg/capita/year)
Waste generation[kg/cap./year] Annual
Area Ref. Range Mean growth rate
OECD—total /2/ 263–864 513 1.9%North America /2/ 826 2.0%Japan /2/ 394 1.1%OECD—Europe /2/ 336 1.5%
Europe (32 countries) /3/ 150–624 345 n.a.8 Asian Capitals /4/ 185–1000 n.a. n.a.South and West Asia
(cities) /5/ 185–290 n.a. n.a.Latin America and
the Caribbean /6/ 110–365 n.a. n.a.
Domestic Waste Waste from household activities, including food preparation, cleaning, fuel burning, oldclothes and furniture, obsolete utensils and equipment, packaging, newsprint, and garden wastes.
In lower-income countries, domestic waste is dominated by food waste and ash. Middle- and higher-income countries have a larg-er proportion of paper, plastic, metal, glass, discarded items, and hazardous matter.
Commercial Waste Waste from shops, offices, restaurants, hotels, and similar commercial establishments; typi-cally consisting of packaging materials, office supplies, and food waste and bearing a close resemblance to domestic waste.
In lower-income countries, food markets may contribute a large proportion of the commercial waste. Commercial waste mayinclude hazardous components such as contaminated packaging materials.
Institutional Waste Waste from schools, hospitals, clinics, government offices, military bases, and so on. It issimilar to both domestic and commercial waste, although there is generally more packaging materials than food waste. Hospital andclinical waste include potentially infectious and hazardous materials. It is important to separate the hazardous and non-hazardouscomponents to reduce health risks.
Industrial Waste The composition of industrial waste depends on the kind of industries involved. Basically,industrial waste includes components similar to domestic and commercial source waste, including food wastes from kitchens andcanteens, packaging materials, plastics, paper, and metal items. Some production processes, however, utilize or generate hazardous(chemical or infectious) substances. Disposal routes for hazardous wastes are usually different from those for non-hazardous wasteand depend on the composition of the actual waste type.
Street Sweepings This waste is dominated by dust and soil together with varying amounts of paper, metal,and other litter from the streets. In lower-income countries, street sweepings may also include drain cleanings and domestic wastedumped along the roads, plant remains, and animal manure.
Construction and Demolition Waste The composition of this waste depends on the type of building materials, but typicallyincludes soil, stone, brick, concrete and ceramic materials, wood, packaging materials, and the like.

Generally, construction, demolition, and streetsweeping wastes are not suited for incineration.
The composition of the various types of MSW variesgreatly by climate and seasonal variations and thesocio-economy of the waste collection area.
In general, high-income areas generate more wastethan low- or middle-income areas. Thus, waste gener-ation and composition may differ greatly even withinthe same metropolis.
Waste collected in affluent areas is typically lessdense, as it contains more packaging and other lightermaterials and less ash and food waste. This is becausemore ready-made products are consumed and the foodprocessing takes place in the commercial/industrialsector.
The moisture is greater in lower-income areas due tothe water content of the food waste and smalleramounts of paper and other dry materials. Annualvariations in moisture content depend on climatic con-ditions such as precipitation and harvest seasons forvegetables and fruit.
Examples of the composition of waste from China,the Philippines, and European countries are presentedin Table 2.2.
Heating Value
Once ignited, the ability of waste to sustain a combus-tion process without supplementary fuel depends on a
number of physical and chemical parameters, of whichthe lower (inferior) calorific value (Hinf) is the mostimportant. The minimum required lower calorificvalue for a controlled incineration also depends on thefurnace design. Low-grade fuels require a design thatminimizes heat loss and allows the waste to dry beforeignition.
During incineration, water vapors from the com-bustion process and the moisture content of the fueldisperse with the flue gasses. The energy content of thewater vapors accounts for the difference between afuel’s upper and the lower calorific values.
The upper (superior) calorific value (Hsup) of a fuelmay, according to DIN 51900, be defined as the energycontent released per unit weight through total com-bustion of the fuel. The temperature of the fuel beforecombustion and of the residues (including condensedwater vapors) after combustion must be 25°C, and theair pressure 1 atmosphere. The combustion must resultin complete oxidation of all carbon and sulfur to car-bon- and sulfur dioxide respectively, whereas no oxi-dation of nitrogen must take place.
The lower calorific value differs from the uppercalorific value by the heat of condensation of the com-bined water vapors, which comes from the fuel’s mois-ture content and the hydrogen released through com-bustion.
The ash and water free calorific value (Hawf) express-es the lower calorific value of the combustible fraction(ignition loss of dry sample) as stated on page 12.
Waste as Fuel 11
Table 2.2 Composition of municipal wastes (percentage of wet weight)
% of waste Guangzhou, China, 8 districts Manila 22 European CountriesYear 1993 1997 1990Ref. /7/ /9/ /3/
Fraction Range Mean Mean Range Mean
Food and organic waste 40.1 – 71.2 46.9 45.0 7.2 – 51.9 32.4Plastics 0.9 – 9.5 4.9 23.1 2 – 15 7.5Textiles 0.9 – 3.0 2.1 3.5 n.a. n.a.Paper & cardboard 1.0 – 4.7 3.1 12.0 8.6 – 44 25.2Leather & rubber .. .. 1.4 n.a. n.a.Wood .. .. 8.0 n.a. n.a.Metals 0.2 – 1.7 0.7 4.1 2 – 8 4.7Glass 0.8 – 3.4 2.2 1.3 2.3 – 12 6.2Inerts (slag, ash, soil, etc.) 14.0 – 59.2 40.2 0.8 .. ..Others .. .. 0.7 6.6 – 63.4 24.0
Notes: n.a. = Not applicable.. = Negligible

As a rule of thumb, Hawf may be estimated at 20,000kJ/kg for ordinary MSW, except when the waste con-tains extreme amounts of a single material—such aspolyethylene—which has about double the energycontent.
Municipal waste is an inhomogeneous fuel that dif-fers greatly from conventional fossil fuels. Calculatingthe calorific value of MSW is, therefore, complex andmay lead to gross errors if done incorrectly. The repre-sentativeness of the samples analyzed is most critical,and variations must be accounted for.
Assuming that it is not possible to assess the fuelcharacteristics of a particular waste from test runs at an
existing waste incineration plant, more or less sophis-ticated evaluation methods may be applied.
A first indication may be obtained simply by estab-lishing the following three parameters (in percentageby weight):
A: Ash content (ignition residuals) C: Combustible fraction (ignition loss of dry
sample)W: Moisture of raw waste
The lower calorific value of a fuel may then be cal-culated from the following:
12 Municipal Solid Waste Incineration
Determination of Hawf
1. In a laboratory, the upper calorific value of the dry sample Hsup,DS is determined according to DIN 51900.2. Hawf is then determined according to the following formula:
Hawf = Hinf,DS / (1–A) * MCW * 2445 in kJ/kg,
where A is the ash content per kg dry sample and MCW is the weight of the condensed water per kg dry sample.
80
70
60
50
80 9070605040
C=25
%
302010
90 A=4-%
80
70
60
10
20
30
40
50
40
30
20
10
90
% Moisture (W)
% Combustible (C)% Ash (A)
W=50%
Figure 2.1 Tanner triangle for assessment of combustibility of MSW

Hinf = Hawf * C – 2445 * W in kJ/kg
Assuming that the waste has no dominant fractionwith an extremely low or high calorific value, the lowercalorific value may be obtained by applying an approx-imate value of 20,000 kJ/kg for Hawf:
Hinf ≅ 20,000 * B - 2445 * W in kJ/kg
The result may also be plotted in a Tanner triangle dia-gram to see where it falls within the shaded area indicat-ing a combustible fuel (Figure 2.1). The waste is theoreti-cally feasible for combustion without auxiliary fuel when:W < 50 percent, A < 60 percent, and C > 25 percent.
A more accurate way to assess the fuel quality of awaste is to divide it into characteristic components(organic waste, plastics, cardboard, inerts, and the like),determine the water content (%W), the ash content(%A) and the combustible matter (%C). The lowercalorific value for each component can be found in lab-oratory or literature values for Hawf for that compo-
nent. Finally, the overall lower calorific value and ashcontent are calculated as the weighted average for allcomponents.
Table 2.3 provides examples of the results of thissimple waste analysis, as well as the lower calorific valuedetermined as the weighted average of the heat valuefor characteristic components of the waste. The wastefrom Manila has the highest combustible content andcalorific value.
The method of calculating the calorific value as theweighted average of characteristic fractions of thewaste is further illustrated in Table 2.4.
See “Waste Survey,” page 17, for more accurate liter-ature values on Hawf.
Waste Surveys/Forecasts
Estimating the amount and composition of solidwaste requires in-depth knowledge of the waste col-lection area’s demographic and commercial/industri-
Waste as Fuel 13
Table 2.3 Fuel characteristics of municipal wastes
Guangzhou China8 districts-93 /7/ 5 districts-94 /8/ Philippines
Parameter Units Range Mean Mean Manila - 97 /9/
Combustible % 14.6 – 25.5 22.3 31.4 37.6Ash % 13.8 – 43.1 28.8 22.0 15.6Moisture % 39.2 – 63.5 48.9 46.6 46.7Lower calorific value kJ/kg 2555 – 3662 3359 5750 6800
Table 2.4 Example of calculation of lower calorific value from analysis of waste fractions and Hawf valuesfrom literature
Mass basis Fraction basis Calorific values% of Moisture Solids Ash Combustible Hawf Hinf
Fraction Waste W % TS% A% C% kJ/kg kJ/kg
Food and organic waste 45.0 66 34 13.3 20.7 17,000 1,912Plastics 23.1 29 71 7.8 63.2 33,000 20,144Textiles 3.5 33 67 4.0 63.0 20,000 11,789Paper & cardboard 12.0 47 53 5.6 47.4 16,000 6,440Leather and rubber 1.4 11 89 25.8 63.2 23,000 14,265Wood 8.0 35 65 5.2 59.8 17,000 9,310Metals 4.1 6 94 94.0 0.0 0 –147Glass 1.3 3 97 97.0 0.0 0 –73Inerts 1.0 10 90 90.0 0.0 0 –245Fines 0.6 32 68 45.6 22.4 15,000 2,584Weighted average 100.0 46.7 53.3 10.2 43.1 7,650

al structure. Reliable waste generation data and fore-casts are scarce in most countries. Data and key figuresare often related to the overall waste generation/dis-posal of large cities and municipalities. Significant dif-ferences will, however, exist between waste generationand composition in a city’s various zones such as itshigh or low income residential, commercial andindustrial areas.
Literature is available on key figures for waste gen-eration and composition. When properly selected andapplied, such data may be used for a preliminary assess-ment of the feasibility of various waste treatmentmethods. For design purposes, however, it is best toestablish and apply specific data for the area. It is rec-ommended that waste quantity and quality be sur-veyed year-round to monitor the seasonal variationboth in amounts and in waste characteristics. This maybe particularly important in regions with distincttourist seasons, high monsoon rains, and the like.
Waste ForecastsTo be economically feasible, waste incineration plantsmust have a life span of at least 15 to 20 years. Wastequantity and composition should be forecast over thelifetime of the incineration plant. A waste generationforecast requires a combination of data normally usedfor town planning purposes along with specific wastegeneration data.
Changes in waste composition will be influenced bygovernment regulations of issues such as recycling andthe overall economic development of society. However,possible development trends maybe obtained by study-ing the waste composition in different parts of the samemetropolis—for instance, in high-, medium-, and low-
income areas. Literature on investigations from similarsocieties may also be useful. Annual variations are like-ly to continue according to the present pattern.
As an example, the forecast for the domestic wastefor the year (n) may be calculated according to the for-mula below. Variables include the present population,the expected long-term annual growth, the most recentwaste generation key figure, and the foreseen increasein this figure.
Domestic waste = PP × (1+ GRPP)n × wc × (1+GRKF)n
PP is the present population, GR the growth rate and wcis the actual key figure, waste generation per capita.
If available, the per capita generation key figure (wc)should be determined by assessing reliable existingwaste data. If reliable data is not available, an accuratewaste survey should be carried out. An example of percapita generation key figures are shown in Table 2.6.
Waste SurveyIf reliable waste data and recordkeeping systems are notavailable, a waste survey should be used to generate sta-tistically significant results. The survey must consider alarge number of parameters selected according to theobjective of the study—for example, waste quantity orcomposition. Also, to detect seasonal variations, thesurvey should be performed all through the year.Generally, continuous reliable waste data recordingand recordkeeping are important for developing real-
14 Municipal Solid Waste Incineration
Table 2.5 Waste generation forecast parameters
Parameter Development trend
Population Growth/year (overall and by district)
Industrial employment/industrial area build up Growth/year
Commercial sector employment Growth/yearGross domestic product (GDP) Annual general prosperity
growthWaste generation key figures Growth/yearWaste composition Function of socio-economic
development
Table 2.6 Per Capita Generation Data for SelectedCountries
Estimated Domestic Waste GenerationCountry Year Ref. kg/capita/day
China general 1990–96 /10/ 0.5cities 1990–96 /10/ 0.8–1.2
USA 1990 /11/ 2.01985 /11/ 1.8
Japan 1990 /11/ 1.11985 /11/ 1.0
France 1990 /11/ 1.01985 /11/ 0.8
Denmark 1996 /12/ 1.51990 /12/ 1.0

istic waste management plans, monitoring the effectsof waste management strategies, and publicly control-ling waste flows and the performance of waste man-agement organizations.
The degrees of freedom are statistically reducedwhen the sampling point moves away from the originof the waste and towards the disposal site—that is,fewer samples are required to obtain the desired preci-sion of the data. In return, a number of systematicerrors may be introduced. For example, scavenging andother recycling activities will reduce weight and changethe composition of the waste. In developing countries,where there is much scavenging, the calorific value ofthe waste may be reduced considerably due to recoveryof wood, plastic, textiles, leather, cardboard, and paper.Plus, the weight of the waste may be influenced by cli-matic conditions on its way from the point of origin toultimate disposal. During dry seasons, weight is lostthrough evaporation, and precipitation during the wetseason may increase the weight.
Waste Quantity—Key Figures and Annual VariationFor well-organized waste management systems wheremost of the waste ends up in controlled landfills, long-term systematic weighing of the incoming waste willallow a good estimate of the key figures for waste gen-eration and the annual variation. Thus, landfills andother facilities receiving waste must have weighingbridges to produce reliable waste data.
To establish waste generation key figures, wastequantity should be registered systematically and fairlyaccurately. For every load, the collection vehicles mustsubmit information about the type of waste and its ori-gin. Further information about the district where thewaste was collected can be obtained from town plan-ning sources and the socio-economic aspects can con-sequently be included in the key figure calculations.Table 2.7 indicates how a waste collection area may be
divided into collection districts to reflect characteris-tics of waste generation.
In places with no waste registration records, typicaldistricts may be outlined according to Table 2.7. Then,the collected waste should be systematically weighed.The registration should continue for at least a full yearto detect any seasonal variations. Great care must betaken to ensure that no changes are introduced in thecollection districts, which could make the resultsambiguous.
Introducing a waste incineration plant will reducethe livelihood of landfill scavengers. They may move toa new place in front of the treatment plant, thus chang-ing the composition and calorific value of the waste. Itis important to assess the impact of such a change,according to the amount the scavengers remove at theexisting landfill.
Waste CompositionWaste composition varies with the waste type, thesocio-economic conditions of the collection area, andseasonal variations. Planning a comprehensive surveyof the composition of waste types therefore requiresinput from a town planner, a waste managementexpert, and a statistician.
The survey planners should do at least the following:
• Divide the waste collection area into zones accord-ing to land use.
• Subdivide land-use zones according to types ofwaste generated (see Table 2.6).
• Identify well-defined and representative waste col-lection districts for the types of waste.
• Choose one or more representative districts to sur-vey for each type of waste.
• Select the point of waste interception in such a waythat the waste will reflect what will reach a futuretreatment facility or incineration plant.
Waste as Fuel 15
Table 2.7 Waste types and collection districts
Waste type Collection District
Domestic High income Medium income Low incomeCommercial Shopping/office complexes Department stores MarketsIndustrial Large enterprises Medium industries Small industries

• Establish baseline data for the district (population,industry, trade, and such).
• Monitor the amount of waste generated in the dis-trict and the daily number of truck loads.
• Statistically assess the number of samples requiredto obtain a 95 percent confidence level on the wastecomposition. The distribution of the individualwaste component can be assumed to be Gaussian.However, there should never be less than 25 of eachtype of waste.
• Assess whether the seasonal variation necessitatesmore than one round of sampling (for example,summer/winter or wet/dry).
Executing the practical part of the waste composi-tion survey requires additional careful planning. Thephysical facilities must be prepared to protect the staffperforming the sorting and ensure that samples andresults remain representative. Sorting is best carriedout in well-vented buildings with concrete floors toensure that no waste is lost. The sorting station must befurnished with sorting tables, a screen, easy-to-clean-buckets or containers, and at least one scale. The logis-tics are summarized in Table 2.8.
Sorting waste to a reasonable degree of accuracyrequires that staff have advanced training. Thepickers must learn to recognize the different wastecategories—especially different types of plastics.They must empty cans, jars and bags before placingthem in containers. To ensure consistency, the sam-pling and sorting process must be controlled andsupervised by the same person throughout thewaste survey. Furthermore, all procedures, includ-ing laboratory analyses and methods of calculation,must be described in detail in a waste characteriza-tion manual.
Sorting categories should be based on the amount ofthe characteristic categories and their influence on thecalorific value. Table 2.9 presents some of the typicalcharacteristic categories. The recommended minimumnumber of categories are presented together withoptional subdivisions. Typical lower calorific values forthe ash and water free samples (Hawf) are given for eachtype of material. These values are approximate, andlaboratory measurements of Hawf should to a certainextent be applied to supplement and confirm or sub-stitute literature values when calculating the overallheat value of the waste.
16 Municipal Solid Waste Incineration
Table 2.8 Logistics and Principles of Sampling and Analysis of Waste Data
Sampling The collection vehicle from the representative collection district is intercepted according to the plan.Weighing The vehicle is weighed full and later empty resulting in the total weight. The waste volume is determined/ esti-
mated and the average density calculated.Subsampling Sometimes sorting of full truck loads is too time consuming. Preparing a representative subsample (perhaps
100 kg) often makes it possible to sort waste from more trucks and thereby makes the result more significant.However, preparing a representative subsample is not simple, and a detailed procedure for this routine mustbe prepared – for example, accounting for drained-off water.
Sorting The waste is unloaded on the floor of the sorting building. It is then spread in layers about 0.1 meter thick onsorting tables covered by plastic sheets. The waste is manually sorted according to the predetermined materialcategories. The leftover on the table is screened (with a mesh size of about 12 mm). The screen residues areagain sorted manually, and the rest is categorized as “fines.”This procedure is followed until the entire load or subsample – including floor sweepings – has been dividedinto the appropriate fractions.
Physical Analysis All fractions are weighed and the moisture content determined through drying after shredding at 105˚ C untila constant weight is obtained (about 2 hours). The moisture content is determined on representative samplesof all fractions on the day of collection.
Chemical Analysis The chemical analysis should be performed at a certified laboratory. The key parameters are ash content andcombustible matter (loss of ignition at 550˚ C for the dried samples) and Net Calorific Value for at least thefood and the fines fractions. Samples must be homogenized through proper repetitive mixing and grinding,and at least three analyses should be performed on each fraction to minimize analytical errors.
Data Processing The wet and dry weight waste composition are calculated together with the interval of confidence.

Ultimately, the waste survey allows a calculation ofthe average lower calorific value for each type of waste.
The formula for determining the lower calorificvalue (Hinf) for each type of waste is:
Hinf = Hawf * C/100 – 2445 * C (kJ/kg)
By weighting these individual Hinf for each type ofwaste with the percentage wet weight (M), the overalllower calorific value can be found by applying the fol-lowing formula.
Hinf, overall = M1/100 * Hinf,1 + M2/100 * Hinf,2 +. . . . +Mn/100 * Hinf,n
Waste Load Design Calculation
The waste survey and forecast will establish the expect-ed amount and composition of waste generated duringthe lifetime of the facility (for example, a 20-year peri-od). The actual volume of waste arriving at the incin-eration plant will depend on the efficiency of the col-lection system, together with negative and positiveincentives for supplying the waste to the plant. Themost negative incentive may be an increased gate feecompared to fee of landfilling.
Before deciding on the plant’s design capacity, it isrecommended to apply a factor for collection efficien-cy to the theoretical amounts. This is especially impor-tant for commercial and industrial waste, which mayinclude a larger proportion of materials suitable forrecovery and recycling.
Waste as Fuel 17
Table 2.9 Ash and Water Free Calorific Value (Hawf) for Selected Types of Waste
ComponentMain category Subcategories Hawf(mandatory) (optional) (MJ/kg)
Food scraps and vegetables 15–20 (to be analyzed in each case)Plastics Polyethylene (bottles, foil, etc.) 45
PVC (bottles, etc.) 15–25Polystyrene (wrapping) 40Polypropylene 45
Textiles 19Rubber and leather 20–25Paper Dry 16–19
Wet 16–19Cardboard Dry 16–19
Wet 16–19Wood and straw 19Other combustible *Metals 0Glass 0Bones 0Other non combustible 0Hazardous wastes *Fines (<12 mm mesh) 15
(to be analyzed in each case)
Note: * = Depends on chemical makeup of material.

The waste load on the incineration facility will consistof a combination of domestic, commercial, and indus-trial waste.
The basic load will, however, be domestic waste,which can be assumed to be supplied almost entirely tothe incineration plant.
Separate collection of waste with a high energy con-tent can theoretically increase the calorific value of thewaste fuel. However, this method is likely to fail in thepractical world due to a lack of efficient waste separa-
tion at the source and the additional cost involved inthe collection system. Incineration of waste from cer-tain areas (typically the more affluent ones) may, how-ever, be feasible.
Mechanical sorting is another way to raise theaverage calorific value before incineration. This istypically a step in the production of waste derivedfuel, and suitable technology is available, but it usu-ally isn’t used before mass burning because of addi-tional costs.
18 Municipal Solid Waste Incineration

Key Issues
The success of an MSW incineration plant depends asmuch on the institutional framework as on the wasteand technology. There are four main institutionalframework areas to consider: the waste sector, the orga-nization and management of the incineration plantitself, the energy sector, and the authorities responsiblefor control and enforcement.
The institutional framework for the waste sector andthe waste management system must be sufficientlydeveloped to ensure supply of the design waste flowand quality of waste for the life span of the incinerationplant. The waste sector must further design and oper-ate a controlled landfill for environmentally safe dis-posal of the incineration residues.
An organizational set-up that can administer theplant and support the waste incineration project sothat it becomes an integral part of the waste man-agement system is crucial. There should be a highdegree of interaction between the different parts ofthe waste management system and the waste incin-eration plant either through ownership or long-termagreements.
Incineration is significantly more costly thanusing landfills. The waste generators—that is, thepopulation and the commercial sector—must there-fore be willing to pay the additional cost, or else theremust be a subsidy scheme. Insofar as the operator/owner of the MSW incineration plant is supposed tocollect treatment charges, there must be ways toenforce this.
When ownership is private, there may be institu-tional borderline problems in the delivery of a suffi-cient quantity and quality of waste, the pattern andprice of sale of energy, or both.Waste flow must be con-
trolled, thus ensuring that it is delivered to the mostappropriate plant and, in particular, that indiscrimi-nate dumping is avoided. Waste flow can be controlledby a combination of tariff policy (including cross-sub-sidization via the tipping fee at the licensed facilities),enacting and enforcing waste management legislation,and a waste data and recordkeeping system.
Traditionally, the waste management sector isviewed as an undesirable place to work. In someregions, this has resulted in poorly managed waste ser-vices. Plus, it has been difficult to recruit and maintainqualified staff—for instance, in rapidly growingeconomies where the public sector cannot match thesalaries of private companies.
In particular, operating and maintaining wasteincineration requires a highly skilled and effectivemanagement—which means that new and skilledmanagers may have to be attracted. Existing staff willhave to be trained and capacity will have to be expand-ed. Also, it should be decided whether to involve theprivate sector in operation and maintenance. The nec-essary skills and education resemble the humanresource demands in the energy sector, for example,management of power plants.
To ensure proper and environmentally safe opera-tion, authorities responsible for control and enforce-ment must be on hand. These authorities must be inde-pendent of the owner and operator of the wasteincineration plant.
In general, incineration plants are influenced by anddepend on numerous legal, institutional, and socio-economic factors in the environment. To assess fullythe appropriateness of a proposed institutional frame-work, a comprehensive stakeholder analysis must beperformed for both the existing and projected situa-tions.
19
3 Institutional Framework

Key Criteria✓ ✓ ✓ A well-functioning solid waste manage-
ment system, including a properly engi-neered and controlled landfill, has been pre-sent for a number of years.
✓ ✓ ✓ Solid waste collection and transportation(domestic, commercial, and industrial) aremanaged by a limited number of well-regu-lated and controlled organizations.
✓ ✓ ✓ There are signed and approved letters ofintent or agreements for waste supply andenergy sale.
✓ ✓ ✓ Consumers and public authorities are ableand willing to pay for the increased cost ofwaste incineration.
✓ ✓ ✓ Authorities responsible for control, moni-toring, and enforcing operation are present.
✓ ✓ The authorities responsible for control,monitoring, and enforcement are indepen-dent of the ownership and operation of theplant.
✓ ✓ Skilled staff for plant operation are availableat affordable salaries. Otherwise, reliableoperation and/or maintenance contractsare in place either in the form of operationand service contracts or via BO/DBO/BOOT/BOO schemes.
✓ The waste management authority owns theincineration plant.
✓ Municipal guarantees cover any shortfalls inthe plant economy due to insufficient sup-ply or quality of waste.
Waste Sector
The waste sector includes public institutions and orga-nizations as well as private companies involved in col-
lection, transportation, and final disposal of all types ofsolid waste. Generally, collection of waste from house-holds and shops in residential areas is based on a pub-lic initiative. Large commercial centers, office com-plexes, and industries are, however, often required toarrange their own waste collection and disposal. Thus,there may be many operators involved in solid wastecollection and transportation.
A fully developed and controlled solid waste man-agement system is a precondition for establishing anMSW incineration plant. A functional managementsystem should have been in placefor at least a few yearsbefore implementing the incineration plant.
A well-functioning solid waste management systemensures that all domestic, commercial, and industrialwastes are collected, transported, and disposed of in ahygienic and environmentally safe manner at sanitarylandfills. Where such systems do not exist, the collec-tion is much less efficient, and a significant part of thewaste is likely to be disposed of through uncontrolleddumping.
If the waste management system is not fully con-trolled, increased incineration costs are likely to insti-gate more illegal waste disposal activities. The ultimateeffect may be that the supply to the plant becomesinsufficient in quantity or quality.
From waste generation to disposal, various kinds ofmore or less organized recycling activities take place.The commercial sector and the industries employ theirown staff to salvage materials to sell and recycle.Scavengers may be found at any stage of the handlingsystem. They search dust bins and containers close tothe point of origin of the waste dump sites. Disturbingthe waste flow by introducing solid waste treatmentfacilities may “force” the scavengers to shift their oper-ation from the end of the waste chain toward the begin-ning—thus changing the waste composition believedto be available.
The complexity of the waste management systemhas occasionally caused legal problems regarding theownership of the waste. The crucial question is: Whendoes waste change from private property to a publicnuisance or asset? If this is not clear from a legal pointof view, it is difficult to commit or ensure the supply ofwaste to the treatment facility. Thus, regulatorychanges may be necessary.
20 Municipal Solid Waste Incineration

Payment for services rendered is generally crucial inwaste management. Public health protection requireswaste to be collected and disposed of away from inhab-ited areas, but not all areas or sectors may be willing orable to pay for such services. The only secure way ofrecovering the costs is through mandatory servicecharges collected from the waste generators—possiblytogether with property taxes or service charges forwater and electricity.
Private waste operators serving trade and industryare likely to dispose of waste in the cheapest possibleway, even using an illegal method such as indiscrimi-nate dumping. Strict control and enforcement arerequired to prevent such activities.
Energy Sector
Incineration plants consume and generate largeamounts of energy and are therefore important playersin the local energy market—especially in relativelysmall communities. It is thus important to establishwhether an incineration plant for solid waste can beintegrated into the legal and institutional framework ofthe energy sector.
The energy sector is often heavily regulated.Concession to produce and sell electricity is generallygranted only to a limited number of public or privateoperators. An incineration plant established by anoth-er organization may therefore face opposition inobtaining necessary approval. Cooperation with exist-ing energy producers or consumers can therefore beuseful.
Prices of energy paid by consumers may be subsi-dized or taxed rather than based solely on productioncosts. The prices of energy from waste incineration maytherefore have to be fixed by the government—whichbrings up important political and socio-economic con-siderations. A high price resulting in a reduced gate feewill subsidize the waste sector, whereas a low price willfavor the energy consumers.
It is most feasible when the energy can be sold to asingle consumer for its own use or resale. The con-sumer may be a utility company with an existing dis-tribution network for district heating or power or alarge steam-consuming industrial complex.
The purpose of solid waste incineration plants is totreat waste and hence reduce the waste volume for dis-posal. The design and layout of an incineration plantare based on continuous operation at 100 percentload. In principle, the energy output will be almostconstant 24 hours a day. The waste energy can there-fore be regarded as a supplement to other fossil fuel-based energy sources that are operated at a load corre-sponding to the actual energy demand. Normally, theenergy produced from incineration plants is regardedas base load. Depending on the price pattern, the priceof the waste generated energy will reflect this base loadstatus.
To use all the energy produced, incineration plantsshould mainly be established in large energy networkswhere they can function as base load units with bothdiurnal and seasonal variation.
Incineration Plant Organization and Management
Ownership and OperationMSW incineration plant ownership and allocation ofoperational responsibility is of great importance.Different kinds of borderline problems may arisedepending on the model. These problems are related tosupply and quality of waste, as well as sale and distrib-ution of heat, or both—depending on whether theplant belongs within the waste sector, the energy sec-tor, or to a private operator.
Incineration plants belonging to the solid wastemanagement organization responsible for waste col-lection, transportation, treatment, and ultimate dis-posal generally experience few problems regarding thesupply of “fuel”or disposal of residuals. The main insti-tutional problems are related to the selling and distrib-uting energy.
Alternatively, the incineration plant may be locatedwithin the energy sector and belong to the power sup-ply companies. Here, there are no problems with sell-ing and distributing energy. However, there may beproblematic cultural differences between the energysector and the waste sector.
The energy sector is accustomed to a highly stan-dardized fuel quality and is not used to variations inquantity and quality of waste. Normally, energy pro-
Institutional Framework 21

ducers modulate the operational pattern according tothe energy demand. MSW incineration plants, howev-er, have to follow the pattern of supply rather thandemand. They must therefore accept variations inquantity and quality of the fuel and energy output. Anenergy sector-based incineration plant owner willtherefore try to exercise control over maximum andminimum waste supply and quality.
Privatization of incineration plants can includecombined ownership and operation or operation only.Fully privatized facilities may experience borderlineproblems towards both the waste management andenergy sectors. Establishing the necessary agreementsis complicated, and problems monitoring and control-ling the waste supply and energy sale will develop.
The borderline problems between the sectors mustbe solved through firm and irrevocable agreementsbefore plans are made to build the plant. Otherwise, thefeasibility of the plant is jeopardized.
Staff recruitment and maintenance may be crucialwhen deciding on the plant’s ownership. In boomingeconomies, the government often pays significantlysmaller salaries than the private sector. In return, thegovernment and other authorities often provide pen-sion schemes and greater job security than the privatesector.
This may make it difficult for the public sector toattract enough qualified staff. Staff trained at theplant’s expense may leave for better paying jobs. Theprivately owned and operated facilities can betterretain staff, since they can pay competitive salaries andincentives. Both private and publicly operated plantsmust, however, expect to have a continuous humanresource development (HRD) program to maintainstaff for plant operation and maintenance.
The organizational set-up and financial manage-ment system for the incineration plant can influenceplant upkeep and maintenance. Several special equip-ment spares and components may be available onlyfrom abroad. Because spending foreign currency canbe restricted or may require an extended approvalprocess, procuring emergency replacement parts maycause the plant to shut down for long periods of time.
It is preferable for the incineration plant to be aneconomic entity of its own, whether publicly or pri-vately owned and operated. This gives the plant man-
ager the freedom to acquire local spares and mainte-nance contracts quickly.
Waste incineration is significantly more costly thanwaste disposal in sanitary landfills, even after incorpo-rating the revenues from sale of energy. The addition-al costs can seldom be collected as a gate fee alone,because the waste might be taken and disposed of in anuncontrolled manner. The budget deficiency must becovered by general waste service charges, otherwise col-lected or compensated for through subsidies.
Waste management charges should generally be col-lected by an authority which holds sufficient legalpower to apply reprisals when payments are not made.Establishing new entities solely to collect incinerationfees is costly and must be accompanied by an allocationof enforcement power to collect overdue payments.
Tender Models for Waste Incineration PlantsTable 3.1 outlines the principal tender models andownership and management models for waste inciner-ation plants.
The traditional tender model is the multiple contractor single turnkey contract model. After commissioningthe plant, the client—typically the municipality, a groupof municipalities or a public waste management insti-tution—begins operating the plant.
These models ensure the most public control of ser-vice level, plant performance, plant finance, and tariffsetting. However, the client must bear the financial bur-den of the investment and acquire the managementand technical skills for implementing and operatingthe plant. A time-limited management and training(HRD) contract (about 1 or 2 years) must be includedin the scope of supply.
If the multiple contract model is applied, the divi-sion into lots must be limited and respect the naturalentities. The furnace and boiler, for instance, must bein one lot. However, unless the client has experiencedpersonnel with firm knowledge of procurement andwaste incineration skills, it is strongly advisable todivide the lots into no more than two main supplies:complete machinery and structural.
The operation contract has been applied wheremunicipalities wish to free resources from opera-tional duties or where it has been more economical tolet an experienced private contractor operate and
22 Municipal Solid Waste Incineration

23
Table 3.1 Applicable Tender and Contracting Models for Waste Incineration Plants
Tender Model Client’s Obligations Contractor’s Obligations Advantages Constraints
Multiple contracts
Single turnkey contract
Operation contract
Build Operate
Design Build Operate
Build OwnOperate Transfer
Build Own Operate
Financing. Function specifica-tions, tendering, project coordi-nation, and construction super-vision. Ownership andoperation.
Financing. Function specifica-tions, tendering, and client’ssupervision. Ownership andoperation.
Multiple or single turnkey con-tract. Ownership. Supply ofwaste.
Financing, function specifica-tions, tendering, and client’ssupervision. Ownership.Supply of waste.
Financing. Overall functionspecifications and tendering.Ownership. Supply of waste.
Overall function specificationsand tendering. Ownership aftertransfer. Supply of waste.
Overall function specificationsand tendering. Supply of waste.
Supply and detailed design ofindividual parts for the plant.
Responsible for all projectdesign, coordination, and pro-curement activities.
Operation of the completed andfunctional plant in a certain peri-od.
Detailed design, project manage-ment, contractor’s supervision,operation, and maintenance.
Detailed design, project manage-ment, supervision, operation,and maintenance. Ownership.
Financing, design, project man-agement, supervision, operation,and maintenance. Ownershipuntil transfer.
Financing, ownership, design,project management, supervi-sion, performance guarantees,operation, and maintenance.
Full client control of specifica-tions. Possible to create theoptimum plant based on mostfeasible plant components.
One contractor has the fullresponsibility for design, erec-tion, and performance.
Limited strain on the client’sorganization.
Contractor committed towell-functioning and effectivesolutions. Limited strain onclient’s resources.
Contractor committed towell-functioning and effectivesolutions. Limited strain onclient’s resources.
Contractor finances, con-structs, and operates the plantfor a period after which theplant is transferred to theclient. Very limited strain onclient’s resources.
Client does not need tofinance the project.Contractor committed towell-functioning and effectivesolutions. Very limited strainon client’s resources.
Absolute requirement for project managementand waste incineration skills in the client’sorganization.
Limited client control of choice of plant com-ponents.
Difficult for client to secure affordable tariffs,(put or pay contract), control finances, andmonitor the contractor’s performance and ser-vice level.
Difficult for client to secure affordable tariffs(put or pay contract), control finances, andmonitor the contractor’s performance and ser-vice level.
Difficult for client to secure affordable tariffs(put or pay contract), control finances, andmonitor the contractor’s performance and ser-vice level. Limited client control of choice ofplant components.
Difficult for client to secure affordable tariffs(put or pay contract), control finances, andmonitor the contractor’s performance and ser-vice level. Limited client control of choice ofplant components.
Difficult for client to secure affordable tariffs(put or pay contract), control finances, andmonitor the contractor’s performance and ser-vice level. Limited client control of choice ofplant components.

maintain the plant. It is also applicable where theclient has established a plant according to one of theaforementioned models but wants a different con-tractor—for example, a local company—to operatethe plant.
There are several variants for using private contrac-tors in designing, financing, and operating incinera-tion plants. In one common variant of privatization,supervision and control of private contractors is per-formed by highly skilled clients (municipalities/authorities). In particular, the client must have highlyskilled legal, contractual, and financial specialists to setup contracts for implementing, operating, owning, andfinancing incineration plants with private contractors.Detailed and professional contracts must be estab-lished to protect the client’s obligation to provide effi-cient, affordable, and environmentally sustainablewaste management services to the community.
In general, the client loses financial and technicalmaneuverability when entering into long-term servicecontracts with private contractors, but on the otherhand, financial resources and staff are liberated forother purposes. The client must also offer guaranteeson the supply of waste, sale of energy, and payments tothe contractor (put or pay contracts). The put or paycontracts are the contractor’s insurance againstincreased net treatment cost if major preconditionsfail—for example, minimum waste supply or calorificvalue of the waste. (For information on the conse-quences when preconditions fail, see chapter 4—par-ticularly Figure 4.4.)
The client will also be asked to issue guarantees forthe servicing of the loans used by the contractor tofinance building the plant.
Deciding whether to contract out the establishment,operation, financing, or ownership of incinerationplants to private contractors should not be taken light-ly. It is important to weigh consciously the advantagesand constraints of all options against the local condi-tions—in particular, the client’s creditworthiness andresources in terms of capital and staff skills, as well asthe actual legal framework for publicly monitoring andcontrolling a private contractor.
AuthoritiesAuthorities responsible for control, monitoring, andenforcement must be present to ensure proper plantoperation and compliance with the environmentalstandards against which the incineration plant wasapproved and intended. These authorities must beindependent of the ownership and operation of theplant.
About once a month, the plant management mustsubmit reports on the average flue gas emission values,amounts and composition of residues, flue gas reten-tion times, and other operational parameters (for moreinformation, see Part II). The report must clearly stateall exceeded limits and explain them.
Based on these reports, correspondence with theplant management, and inspections, the authoritiesmust take proper action if the plant is not operated inan environmentally safe way.
24 Municipal Solid Waste Incineration

Key Issues
Waste incineration involves high investment costs witha large share of foreign currency and high operatingand maintenance costs. Hence, the resulting net treat-ment cost per metric ton of waste incinerated is ratherhigh compared to the alternative (usually, landfilling).
Depending on the actual costs (which are sensitiveto the size of the plant) and revenues from the sale ofenergy, the net treatment cost per metric ton of wasteincinerated will normally range from US$25-$100 (in1998) with an average of about US$50. Depending onthe quality (for example, number of membrane layersand leachate treatment) of the actual landfill site, thenet cost of landfilling ranges from US$10-$40.
Thus, higher net treatment cost is a critical issuewhen considering implementing a waste incinerationplant. Financing can be done in terms of tipping fees, ageneral levy, public subsidies, and combinations there-of. However, the ability and willingness to pay shouldbe considered thoroughly to avoid the risk of uncon-trolled dumping or burning is latent.
Key Criteria✓ ✓ ✓ There is a stable planning environment (15
to 20 years) with relatively constant or pre-dictable prices for consumables, spare parts,disposal of residues, and sale of energy.Furthermore, the capital costs (large shareof foreign currency) can be predicted.
✓ ✓ ✓ Financing the net treatment cost mustensure a waste stream as intended in theoverall waste management system.Consequently, the waste incineration tipping
fee must be lower than (or at least, no greaterthan) the fee at the landfill. Willingness andability to pay must be addressed.
✓ ✓ ✓ Foreign currency is available for purchasingcritical spare parts.
✓ ✓ To be economically feasible, the capacity ofthe individual incineration lines should beat least 240 t/d (10 t/h). A plant should haveat least two individual lines.
✓ ✓ When surplus energy is to be used for dis-trict heating, the incineration plant must belocated near an existing grid to avoid costlynew transmission systems.
✓ If a regular market for the sale of hot water(district heating or similar) or steam is pre-sent, the plant should be based on the saleof heat only—both in terms of technicalcomplexity and economic feasibility. A cer-tain extent of cooling to the environmentduring the warm season may be preferableto costlier solutions.
Economics
The mass burning principle with a moving grate isapplied in the following economic analysis and esti-mate of the investment costs for the machinery. This isthe most widespread and well-tested technology forincinerating MSW. Furthermore, other technologiescannot be recommended for incineration of normalMSW (see Part II of this Guide).
25
4 Incineration Plant Economics and Finance

Investment CostsThe actual investment cost for a waste incineration plantdepends on a wide range of factors, especially the size(capacity) of the plant—the number of metric tons peryear or day and the corresponding lower calorific value ofthe waste. Low-capacity plants are relatively more expen-sive than high-capacity plants in terms of investment costper metric ton of capacity.
The machinery (and hence, the investment costs)depends on the type of energy production, ranging fromsimple cooling of all excess heat (no energy sale) to com-bined heat and power production.Furthermore,the equip-ment necessary for flue gas cleaning is to a great extentdetermined by the desired or required emission qualitylevel, which consequently influences the investment costs.
The investment costs as a function of the annual (anddaily) capacity for a typical new waste incineration plantare estimated in Figure 4.1. A lower calorific value of thewaste of 9 MJ/kg (2150 kcal/kg) is assumed as the designbasis. A higher calorific value will increase the actualinvestment costs and vice versa.
Furthermore, the following preconditions corre-sponding to a typical plant configuration in South andSoutheast Asia apply.
• Number of incineration lines.The minimum capacity ofeach incineration line is 240 t/d (10 t/h) and the max-imum is 720 t/d (30 t/h). There should be at least twoincineration lines—so plants should be at least approx-imately 500 t/d. When calculating the necessary dailycapacity based on the annual dimensioning waste vol-ume, an availability rate (number of operating hours ayear) of 7500 is presumed. Furthermore, 5 percentexcess capacity is presumed to cover conditions such asseasonal variations.
• Energy production. The plant produces steam primari-ly for electricity production but if it also is involved incombined heat and power production or sale of elec-tricity and steam,excess heat is cooled away.Hence, theplant is equipped with steam boilers, turbine units,andcondensing/cooling units.
• The total investment cost can be reduced by approxi-mately 30 percent if the plant is equipped for hot waterproduction only.
• Flue gas cleaning. The plant is equipped with dry orsemidry scrubbers and a subsequent electrostatic pre-cipitator or bag-house filter to exercise medium levelemission control.
The total investment cost can be reduced by approxi-mately 10 percent if the plant is equipped for compliancewith basic-level emission control.However, if the plant hasto comply with advanced-level emission control, the totalinvestment cost must increase approximately 15 percent.
In Figure 4.1, the average investment cost per dailycapacity in metric tons is calculated according to theaforementioned preconditions.
Normally,at least 50 percent of the investment costs forthe machinery part of the plant has to be covered by for-eign currency.
Operating and Maintenance CostsThe operating and maintenance costs comprise:
• Fixed operating costsCost of administration and salaries
• Variable operating costsCost of chemicals for the flue gas cleaning systemCost of electricity (if the plant is equipped with a steamturbine and a turbine/generator set, there will be a netproduction of electricity)Cost of water and handling of waste waterCost of residue disposal
• Maintenance costsCost to maintain the machinery (such as spare parts)Cost to maintain the buildings
26 Municipal Solid Waste Incineration
0
0 500 1000 1500 2000 2500
100 200 300 400 500 600 700 800
Figure 4.1 Investment Costs
0
50
100
150
200
250
300
350
0
30
1000
US$
/met
ric
ton/
day
Mill
ion
US$
Plant Capacity (metric tons/day)
Civil
Machinery
TotalInvestment/capacity
Plant Capacity (1000 metric tons of waste/year)
60
90
120
150
180
210

The fixed operating costs depend heavily on thenumber of employees, the percentage of skilled andunskilled workers and engineers, and the local salarylevel. The annual fixed operating costs for plants inSouth and Southeast Asia are estimated at 2 percent ofthe total investment.
The variable operating costs will to a certain extentdepend on the specific flue gas cleaning system. Butmore important, the actual cost of disposal of theresidues from the flue gas cleaning has a strong influ-ence on the variable operating costs. Based on a dis-posal cost of approximately US$100 per metric ton ofAPC (Air Pollution Control) residue and US$5 permetric ton of bottom ash reused or disposed of, theoverall variable operating costs are estimated at US$12per metric ton of waste incinerated.
According to customary practice, the annual mainte-nance costs are estimated at 1 percent of the investmentfor the civil works plus 2.5 percent of the investment forthe machinery.
Figure 4.2 presents the resulting annual operatingand maintenance costs. The figures are based on theactual amount of waste treated and the investment costdiscussed earlier. In addition, the annual capital costsand the total costs of incineration are indicated. Thefigure uses a real rate of interest of 6 percent and a plan-ning period of 15 years.
Sale of EnergyThe sale of energy is a significant element in the econ-omy of waste incineration. In extreme cases, theincome from energy sale can cover up to 80 percent to90 percent of the total costs. A figure around 40 percent
is average in Europe and North America, with wastehaving a lower calorific value in the range of 9 to 13MJ/kg.
However, it is important to remember that the mainpurpose of an incineration plant is treatment resultingin a volume reduction and in rendering the wasteharmless.
The potential energy production—and incomefrom energy sale—depends heavily on the energy con-tent (net calorific value) of the waste. In Table 4.1, rep-resentative energy production per metric ton of wasteincinerated is listed for heat production, electricityproduction, and combined heat and power production(see Part II of this guide for further information).Furthermore, the potential income from sale of energyis stated—based on a heat price of US$15/MWh and anelectricity price of US$35/MWh.
The specific energy demand must be taken into con-sideration—especially for heat production only. Unlessthe district heating network is relatively large, it is nor-mally necessary to cool off some of the produced heatin the summer period, thus reducing the annualincome from sale of heat.
If production and sale of process steam are part ofthe overall concept, this income must be evaluatedaccording to a specific sales agreement. The income interms of U.S. dollars per metric ton of steam supplieddepends especially on the pressure and temperature ofthe steam.
Calculation of Net Treatment CostThe net treatment cost (balanced tipping fee) can becalculated based on the estimates of costs and potentialincome from sale of energy. Using the preconditionsstated in the previous sections, the following figure canbe applied for a rough estimate of the net costs of wasteincineration.
The income from sale of energy is based on the lowercalorific value (LCV) of the waste of 9 MJ/kg. In casethe LCV is lower than 9 MJ/kg, the income from sale ofenergy is reduced, resulting in a higher net treatmentcost.
By assuming an annual amount of waste suitable forincineration per capita of 0.25 metric tons (0.7 kg/capi-ta/day), the resulting annual cost per capita can be esti-mated. Depending on the size of the plant, this cost will
Incineration Plant Economics and Finance 27
Figure 4.2 Costs of Incineration per Year
0.0
10.0
20.0
30.0
40.0
50.0
60.0
0
20
40
60
80
100
120
0 100 200 400 600300 500 700 800
0 500 1500
Total Costs
Capital Costs
O%M Costs
Total Costs/metric ton
Plant Capacity (metric ton/day)20001000 2500
Mill
ion
US$
/yea
r
US$
/met
ric
ton
Plant Capacity (1000 metric ton of waste a year)

normally be within the range of US$10-$20/capita/year. This is the treatment cost only anddoes not include the collection of waste, recycling sys-tems, and other waste services.
As an example, the economy for an MSW incinera-tion plant with an annual capacity of 300,000 metrictons of waste (approximately 1,000 metric tons/day) is
outlined in Example 4.1. Furthermore, the economicconsequences of failing preconditions (waste supplyand LCV) are analyzed.
The calculation of the net treatment cost in thisexample is based on a lower calorific value of the wasteof 9 MJ/kg. Furthermore, the incineration plant isdimensioned for an annual waste supply of 300,000metric tons. These preconditions together with theassumptions stated in the example result in an esti-mated net treatment cost of US$43/metric ton.
However, in case one or more of the critical precon-ditions fail (especially waste supply and/or calorificvalue of the waste), the incineration plant will be oper-ated “off design.” If the waste supply or the calorificvalue is lower than forecasted, the actual net treatmentcost may be severely influenced. Figure 4.5 graphicallydepicts the sensitivity of the calculated net treatmentcost.
The bold line in the figure shows the effect of a vary-ing waste supply on the net treatment cost. The graph
28 Municipal Solid Waste Incineration
Table 4.1 Energy Yield and Income from Energy
Heat value CHP Heat Only Power OnlyHinf Power Heat Income Heat Income Power IncomeMJ/kg MWh/t MWh/t US$/t MWh/t US$/t MWh/t US$/t
6 0.33 1.08 28 1.33 20 0.58 207 0.39 1.26 33 1.56 23. 0.68 248 0.44 1.44 37 1.78 27 0.78 279 0.50 1.63 42 2.00 30 0.88 31
10 0.56 1.81 47 2.22 33 0.97 34
Note: CHP 76 percent of yield as heat.
6 70.00
0.50
1.00
1.50
2.00
2.50
3.00
8 9 10 11
Figure 4.3 Estimated Income from Energy Sales and Recovery of Energy
Energy RecoveryEstimated Income from Energy Sales
Tota
l Yie
ld (M
Wh/
met
ric
ton)
Calorific Value of Waste (MJ/kg)
CHP Power only Heat onlyCHP Heat only Power only
0.0
10.0
20.0
30.0
40.0
50.0
60.0
6 7 8 9 10 11
Inco
me
(US$
/ton
)
Calorific Value (MJ/kg)
0.0
10.0
20.0
30.0
40.0
50.0
60.0
0 100 200 300 400 500 600 700 800
1,000 Metric Tons of Waste a Year
mill
ion
US$
/yea
r
0
10
20
30
40
50
60
70
800 500 1000 1500 2000 2500
Metric Tons/Day
US$
/met
ric
ton
Total Costs
Net Costs
Income
Net cost/metric ton
Figure 4.4 Net Treatment Cost

shows that if the actual waste supply is only 200,000metric tons/year (point B), the net treatment cost willincrease from US$43 to US$75/metric ton. If the wastesupply is lower than 200,000 metric tons/year, the plantcannot be operated continuously.
The high sensitivity of the net treatment cost is aconsequence of the different nature of the costs. Allfixed costs must be financed independently of the
amount of waste treated. Only the variable part of theoperating and maintenance cost will be reduced whenthe waste supply decreases, but at the same time, theincome from energy sale will decrease.
In case the calorific value of the actual waste sup-plied is only 6 MJ/kg (point B), the net treatment costwill increase from US$43 to US$53/metric ton.
This sensitivity analysis stresses the importance of athorough, reliable waste survey and forecast.
Financing
The primary sources of financing for incinerationplant facilities are free income from the user popula-tion, income from sale of energy and heat, and publicsubsidies. These financing forms are not mutuallyexclusive and are often used in combination.
Fee income from user population: Ideally, theannual net capital and operating costs of the plantare financed largely through user fees from house-holds and industry. Public commitments are nec-essary to allow the incineration facility autonomyin defining fee schedules, which again will allow
Incineration Plant Economics and Finance 29
Example 4.1 Calculation of Net Treatment Cost
Preconditions:
Capacity 300,000 t/y 960 t/d 40 t/h
Output– Bottom ash 75,000 t/year– APC residues 10,500 t/year– Electricity for sale 265 GWh
Investment 145.0 mill.
Annual capital costs (6% p.a., 15 years) 13.0 mill. 43 US$/metric ton
Annual operating cost– Administration and salaries 3.0 mill.– Electricity, lime, water, chemicals 2.0 mill.– Disposal of residues (100 US$/metric ton) 1.0 mill.– Disp/re-use of bottom ash (5 US$/metric ton) 0.4 mill.– Maintenance (machinery & civil) 3.0 mill. 9.4 mill. 31 US$/metric ton
Total annual costs 22.4 mill. 74 US$/ metric ton
Annual revenue energy sale (35 US$/MWh) 9.3 mill. 31 US$/ metric ton
Net cost 14.3 Mill. 43 US$/ metric ton
9 MJ/kg
6 MJ/kg (min. Calorific Value)
11 MJ/kgDesign Load
Min. Capacity
Max. Capacity
A
B
25.0
180000 200000 220000 240000 260000 280000 300000 320000 340000
35.0
45.0
55.0
65.0
75.0
85.0
Waste Supply (metric tons/year)
Net
Tre
atm
ent C
ost (
US$
/met
ric
ton)
Figure 4.5 Sensitivity of the Net Treatment Cost

the facility to be self-financing—that is, revenuesmust cover all operating and maintenance costs,including depreciation and financing expenses.
Household service fees are generally collectedtogether with taxes for other municipal servicesand are based on average waste amounts generatedby various categories of household (apartments,single-family homes, and so on). These service feesrepresent a reasonably secure income stream,depending on the local government’s success incollecting local taxes.
Gate or tipping fees are commonly used for largeindustrial customers, who pay a fee for wastedelivered directly to the incineration facility.There is a greater risk that waste will not be col-lected, which causes plant income to vary. “Stray”customers may seek alternative, less expensive,waste treatment through landfilling, or they ille-gally dump or burn waste. Controls must be inplace to ensure that sufficient volumes are deliv-ered to the facility to cover capital and operatingcosts. It is often necessary for local authorities tocommit to delivering acceptable minimum levelsof waste to the incineration facility before bankloans are financed.
Public controls or incentives are necessary to com-pel the customers to use the incineration facility.Measures may include directly billing industrialcustomers based on estimated waste generation asan alternative to gate fees; capping competinglandfills; equalizing costs through increased land-filling tipping fees or subsidised incineration fees;and fines for using landfill facilities, illegal dump-ing, and burning. The agreement of local govern-ment to set up and enforce controls is critical inevaluating project risk.
Income from sale of energy or heat: While the saleof energy or heat is not a necessary component ofan incineration plant, it can significantly reducenet annual facility expenditures. A stable demandfor plant-generated energy can in some cases becritical to securing plant financing, and agree-
ments for selling energy to distributors may be afinancing prerequisite.
Obviously, low-cost alternative energy sources in theregion decrease the value of energy sales by offset-ting annual costs. Additionally, an unstable energymarket makes forecasting of operating costs difficultand increases the risk of facility financing.
Public subsidies: Public subsidies in various formsfrom local government or donor organizations candecrease the user’s tariff burden. Subsidies mayinclude grant financing, favorable term loans forplant facilities, or general tax levies. Subsidies can befinanced from the budget or linked to environmen-tal taxes.
While fee subsidies generated by general tax leviestake the fiscal burden from the user population, theburden is placed on local government and may leadto inefficient plant operations. Fee subsidies mayreduce the management’s incentives to reduce costsand can erode professional management practices.
The financing structure must allow the facility to pro-vide a service which the consumer can and will pay for—the investment program is viable only to the extent thatit is also affordable. Generally, 3 percent to 4 percent ofthe household income is the maximum acceptable levelfor the waste fee by international development banks. Tohelp “sell” any increase in waste fees, they should coin-cide with a service improvement or reduced environ-mental impact.
In developing countries, it is recommended to surveythe population’s willingness and ability to pay as part ofthe financial and economic project evaluation. Such asurvey must be carefully designed to determine the actu-al and real incomes and expenditures of the waste gen-erators. There may be a considerable difference betweenofficial and actual incomes, as well as differences amonghousehold incomes. It may be necessary—and in somecountries also a tradition—to provide specific conces-sions to pensioners, soldiers, war veterans, the unem-ployed, students, and so on.
Average tariffs must be fixed at such a level that cashneeds are covered, including—where possible—an
30 Municipal Solid Waste Incineration

adequate self-financing margin, but the average tariffshould not exceed accepted affordability standards.Investments are not sustainable if the user populationfinds them unaffordable and seeks undesirable alterna-tives to waste handling and treatment.
The service population’s ability to pay for incinera-tion services is a key factor in determining plant sizeand treatment capacity. Long-term forecasts of house-hold income and the financial situation of local indus-tries are necessary to determine affordability.
Cost-Benefit Assessment
The estimate and calculations in this chapter draw theconclusion that the net treatment cost per metric ton ofwaste incinerated is normally at least twice the net costof the alternative controlled landfilling. At the sametime, when applying waste incineration, the economicrisk in case of project failure is high because of:
• The high investment cost and the need for foreigncurrency
• The complexity of the technical installations, whichrequires qualified and skilled staff, availability ofspare parts, and so on
• Special requirements in terms of quantity and com-position (for example, minimum net calorific value)
• The need for a comprehensive and mature waste man-agement system and institutional set-up in general
• Stable energy demand and prices.
By carrying out a cost-benefit assessment (CBA), thehigher net treatment cost (and higher risk) must be jus-tified for the specific waste incineration project beforeproceeding. The CBA should be performed in the fea-sibility phase (see chapter 5).
The outcome and content of the CBA stronglydepend on the local socio-economic environment.Some of the elements to be considered are:
• Waste transport distance• Land use and land reclamation• City development and tourism• Environmental impact of waste disposal (short and
long term)• Technology transfer and raise in the level of work-
ers’ education and skills• Local jobs• Sustainability of energy generation.
Sometimes political issues also play a major role indeciding whether to implement waste incineration—asmany countries would like to be identified with thistechnology.
If the CBA is negative, disposal of waste at well-engi-neered and well-operated landfills is an economicallyand environmentally sound and sustainable solution.Indeed, upgrading existing landfill capacity and quali-ty is often the better alternative.
Incineration Plant Economics and Finance 31


Key Issues
The project cycle for implementing a waste incinera-tion plant involves three main phases: feasibility, pro-ject preparation, and project implementation. Afterfinishing one phase, major political decisions have tobe made regarding whether to continue to the nextphase. The phases themselves contain a number ofminor steps also involving the decision makers.Figure 5.1 outlines the steps. The cumulative timefrom the project start is indicated after the durationof the individual steps. From the launch of the pro-ject idea, it takes approximately six years before theplant opens, assuming there are no delays.
Key Criteria✓ ✓ ✓ A skilled, independent consultant with
experience in similar projects should beemployed at the onset of the planning.
✓ ✓ ✓ The public perception of waste incinera-tion should be taken into consideration.The public should be involved in andinformed about all phases—but particu-larly the feasibility and project prepara-tion phases.
Feasibility Phase
The feasibility phase comprises a prefeasibility and afeasibility study. A political decision needs to bemade between them to determine whether it is worthprogressing to the more detailed investigations.
The main considerations of the feasibility phaseare presented in Figure 5.2. The content for the two
components is about the same. However, the pre-feasibility study will often be based mainly on exist-ing data and literature references. Hence, the pre-feasibility study may be regarded as only apreliminary assessment of the applicability of wasteincineration for the waste from the area in questionand of the existing institutional framework. Thefeasibility study requires an in-depth investigationof all the local preconditions and a sufficientlydetailed conceptual design of the entire plant,transmission systems, and necessary infrastructurefor a reliable economic assessment of the entireproject.
Developing an MSW incineration project requiresthe combined skills of a variety of experts, most ofwhom are not available locally. The project initiatorshould therefore consider hiring an independentconsultant to work closely together with local orga-nizations and staff. This consultant will offer experi-ence gained from similar projects and also act as amediator in case of conflicting local interests.
The feasibility report is a valuable tool for the deci-sion makers, not only when deciding whether to pro-ceed with the project but also in assessing the entireinstitutional framework. The ideas and proposalsoutlined in the feasibility phase will be transformedinto concrete project agreements and documents inthe following phase.
Project Preparation Phase
Project preparation is a highly political phase dur-ing which many fundamental decisions are made.The objectives are to ensure that the accepted ideasfrom the feasibility study materialize.
33
5 The Project Cycle

Project Implementation UnitThe amount of work the institution or agency devel-oping and implementing the project faces is so greatthat a dedicated organization/unit must be establishedfor the project. This Project Implementation Unit(PIU) and its attached independent consultants will
manage the project overall—including supervision andcommissioning.
The PIU may be dissolved when the plant is taken over bythe plant management organization,or it may become inte-grated therein, or—on a smaller scale—continue to super-vise the performance of an independent plant operator.
34 Municipal Solid Waste Incineration
Phase and Step
Prefeasibility Study
Feasibility Study
Political Decision
Establishment of anOrganization
Tender and FinancialEngineering
Preparation ofTender Documents
Political Decision
Award of Contract andNegotiations
Construction andSupervision
Commissioning andStartup
Operation andMaintenance
Purpose and Issues to Consider
Waste quantities, calorific values, capacity, siting, energysale, organization, costs, and financing
Waste quantities, calorific values, capacity, siting, energysale, organization, costs, and financing in detail
Decide on willingness, priority, and financing of incinerationplant and necessary organizations
Establishment of an official organization and aninstitutional support and framework
Detailed financial engineering, negotiation of loans or othermeans of financing, and selection of consultants
Reassessment of project, specifications, prequalification ofcontractors and tendering of documents
Decision on financial package, tendering of documents andprocedures in detail and final go-ahead
Prequalification of contractors. Tendering of documents. Selectionof most competitive bid. Contract negotiations.
Construction by selected contractor and supervision byindependent consultant
Testing of all performance specifications, settlements,commissioning, training of staff, and startup by constructor
Continuous operation and maintenance of plant. Continuous procurement of spare parts and supplies.
Duration
6 months
6 months
6 months
6 months
3 months
6 months
3 months
6 months
2 1/2 years
6 months
10–20 years
Political Decision Decide whether to investigate further or to abort the project 3 months
FeasibilityPhase
ProjectPreparation
Phase
ProjectImplementation
Phase
Figure 5.1 Generic Implementation Plan for Constructing a Waste Incineration Plant

The PIU and its consultants will be responsible fordeveloping:
• Waste supply agreement(s)• An energy sales agreement• An environmental assessment• An arrangement on the ultimate disposal of incin-
eration residues• Financing and loan agreements• Project tender documents
• Contracts• A plan to monitor construction activities• A plan to monitor plant acceptance tests and com-
missioning.
The degree of details of these individual documentsdepends on the selected tender model. If the plant is tobe established on the basis of multiple contracts, every-thing must be elaborated on in full detail and all theagreements must be signed.
The Project Cycle 35
Figure 5.2 Key Activities to be part of the Prefeasibility and the Feasibility Studies
Prefeasibility Study Feasibility Study
Waste collection area Land use and demographic information Land use and demographic information
Waste sector Stakeholder identification Stakeholder analysisExisting waste management system and Detailed system description and analysis
facilities (collection through disposal) SWOT analysisPreliminary SWOT assessment
Energy sector Stakeholder identification and assessment Stakeholder analysisInstitutional setup Institutional setupMarket evaluation Market analysis
Detailed information about energy generation and consumption pattern
Waste generation Waste generation forecast based on Waste surveycurrent data and literature values Revised waste generation forecast
Calorific value of waste Annual variation of surveyed waste calorific valueIncineration plant design load Plant design load and calorific value
Plant siting Identification of siting alternatives Selection of plant location
Plant design Tentative plant design Conceptual plant design• Furnace • Furnace• Energy recovery • Energy recovery• Flue gas cleaning • Flue gas cleaning• Building facilities • Building facilities• Mass balance • Mass balance• Staffing • Staffing
Cost estimates Investments InvestmentsOperating costs Operating costs Energy sale Energy saleCost recovery Cost recovery
Environmental assessment Preliminary EA Full EA according to OD4.01
Institutional framework Project organization Project organizationWaste supply Draft waste supply and energy sale agreementsEnergy sale Plant organization and managementPlant organization and management Tender model Training needs assessment HRD plan

If, on the other hand, the selected tender model isbased on BOT or BOO, it is necessary only to estab-lish functional demands and outline the responsibili-ties of the various stakeholders. Establishing stake-holder responsibilities is crucial in avoiding orhelping settle future claims. Claims may arise—forexample, regarding insufficient waste supply, energyconsumption, environmental performance, or loanservicing. Because of the size of the project, thefinancing institution is likely to ask the city or even thegovernment to cosign the loan financing the estab-lishment of the plant.
The PIU will supervise the contractors, regardlessof the tender model. It will check that projects aredesigned according to the proper specifications andthat the quality of work and materials is of the pre-scribed standard.
The PIU must thus possess managerial, technical,and financial expertise or engage independent con-sultants.
If the city responsible for the project developmentdecides to manage it on its own, the PIU will alsobecome involved in staff recruitment and trainingbefore startup.
Draft Agreements/ Letters of IntentThe project preparation phase eliminates any “killerassumptions”—which could cause the project tofail—before proceeding to the implementationphase.
To eliminate killer assumptions, the project mustbe redesigned technically, financially, and institution-ally. Borderline issues must be settled through irrevo-cable letters of intent or even finalized agreements.
Outstanding issues regarding the plant economymust be settled during the project preparation phase.The project financing must be decided, loans have tobe negotiated, and it must be clarified whether and onwhat conditions the client (city or government) isprepared to guarantee or cosign loans taken out by acontractor. Alternative systems for collecting the costsof incineration must be investigated. A feasible distri-bution between gate fees and city budget paymentmust be established based on an assessment of thewaste generators’ ability and willingness to pay (asdiscussed in chapter 4).
Political DecisionWhen all consequences of the project have been clari-fied to the extent possible, the PIU prepares a report forpolitical decisionmaking before entering the imple-mentation phase.
Project Implementation Phase
TenderingIndependently of the selected tender method, the ten-der process should always be carried out in two stages:prequalification of eligible contractors and tenderingamong those selected.
The PIU performs a tender evaluation, negotiatesamendments, and submits a tender report with recom-mendations to the political decision makers before anycontracts are closed.
Most countries have detailed procurement rulesensuring a fair and unbiased award of contract as wellas the best combination of cost and quality when pur-chasing services and equipment for the public.International development banks have establishedsimilar rules.
It is important to review the procurement rules care-fully, including the optimum tendering form (see Table3.1). To ensure the most cost-effective and operationalimplementation procedure, it is useful to review theavailability, competitiveness, and skills of local suppli-ers of equipment and services as well.
Construction, Erection, and CommissioningThe PIU tasks during construction, erection, and com-missioning will depend on the tender model. The tasksmay range from a simple financial control function toa detailed supervisory function.
For process plants, the commissioning will comprisenot only the scope of supply and quality of work, butalso a control that the functional demands are fulfilled.Seasonal variations in waste composition may requirefunctional controls during both periods with high andlow calorific values of the waste.
Final acceptance testing is essential. Other impor-tant issues include timely and adequate staff trainingand provision of operational support. However, themost important factor in establishing a cost-effective
36 Municipal Solid Waste Incineration

and efficiently operating plant is having skilled andinternationally experienced consultants to support theclient in specifying and supervising performance crite-ria and plant layout.
Staffing and TrainingEngaging staff must start from 6 to 12 months beforeplant commissioning. Key management, operational.and maintenance staff should be trained at similarplants for at least three to six months.
It is advantageous if the plant operation and main-tenance crews participate in the last part of the erectionand the commissioning so they can gain intimateknowledge of how the plant is built and functions.
Staff training programs must be initiated well beforestartup. This is often included in the services to bedelivered by the vendor or equipment supplier, undersupervision of an international waste incineration con-sultant or a corporate partner with long-term experi-ence in operating incineration plants.
Socio-Economic Aspects and StakeholderParticipation
StakeholdersAny changes made to the waste management system willhave a socio-economic impact—for example, on thoseindividuals, companies, and groups making a livingfrom waste management; citizens of neighboring areas;and nongovernmental organizations (NGOs). Possiblestakeholders and interest groups are shown in Figure 5.3.
Scavenging and Unofficial Economic ActivitiesIn developing countries, scavengers and unofficialrecycling companies are often important in the actualcollection, disposal, and recycling of waste. They mayinvolve low-income citizens, the city’s waste collectioncrews, and a number of small-scale waste recyclerslocated at or near the city dump, at waste transfer sta-tions, or along major roads leading to waste manage-ment facilities.
The Project Cycle 37
Figure 5.3 Typical Stakeholders for Construction of an Incineration Plant
Stakeholders Stakeholder InterestsPossible Stakeholder Influence
Scavengers Changed waste management may affect Scavengers’ activities may affect the properties and or eliminate their source of income. amounts of waste.
Community groups and Project may lead to adverse community Termination, delay, or change of projects due tonearby citizens impact – for example, traffic, noise, community protests.
visual impact, etc. Positive impacts could include work opportunities.
Nature NGOs Reduced impact of waste management Termination, delay, or change of projects due toon nature. NGO protests.
Environmental NGOs Reduced impact of waste management Termination, dela, or change of projects due toon the environment. NGO protests.
Neighbors Reduction of noise, dust, traffic loading, Termination, delay, or change of projects due to and visual impact. Impact on real neighbor protests.estate prices.
Collection and transportation Wish to maintain or expand the business. New requirements for sorting, containers, andcompanies vehicles.
Energy producers Opposition to purchase of energy from Barriers to sale of energy at local market prices.smaller external producers.
Waste generators Wish to maintain low waste management Opposition to large investments and increasedservice charges. service charges.
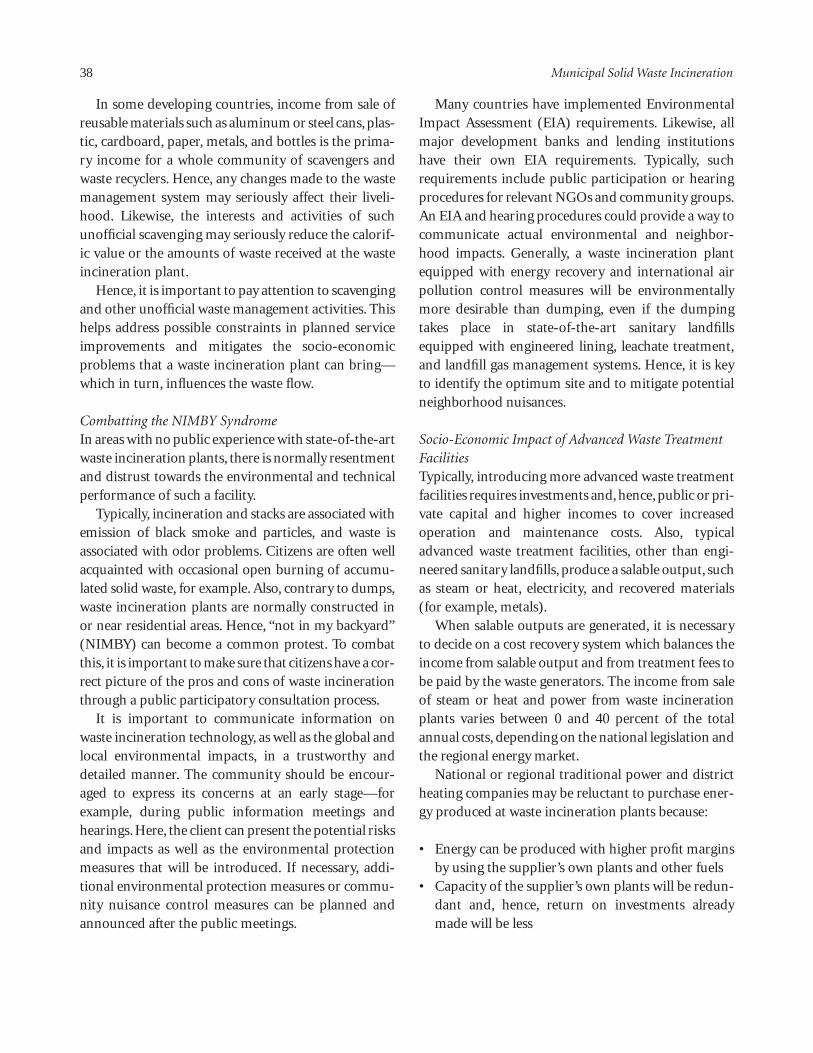
In some developing countries, income from sale ofreusable materials such as aluminum or steel cans, plas-tic, cardboard, paper, metals, and bottles is the prima-ry income for a whole community of scavengers andwaste recyclers. Hence, any changes made to the wastemanagement system may seriously affect their liveli-hood. Likewise, the interests and activities of suchunofficial scavenging may seriously reduce the calorif-ic value or the amounts of waste received at the wasteincineration plant.
Hence, it is important to pay attention to scavengingand other unofficial waste management activities. Thishelps address possible constraints in planned serviceimprovements and mitigates the socio-economicproblems that a waste incineration plant can bring—which in turn, influences the waste flow.
Combatting the NIMBY Syndrome In areas with no public experience with state-of-the-artwaste incineration plants, there is normally resentmentand distrust towards the environmental and technicalperformance of such a facility.
Typically, incineration and stacks are associated withemission of black smoke and particles, and waste isassociated with odor problems. Citizens are often wellacquainted with occasional open burning of accumu-lated solid waste, for example. Also, contrary to dumps,waste incineration plants are normally constructed inor near residential areas. Hence, “not in my backyard”(NIMBY) can become a common protest. To combatthis, it is important to make sure that citizens have a cor-rect picture of the pros and cons of waste incinerationthrough a public participatory consultation process.
It is important to communicate information onwaste incineration technology, as well as the global andlocal environmental impacts, in a trustworthy anddetailed manner. The community should be encour-aged to express its concerns at an early stage—forexample, during public information meetings andhearings. Here, the client can present the potential risksand impacts as well as the environmental protectionmeasures that will be introduced. If necessary, addi-tional environmental protection measures or commu-nity nuisance control measures can be planned andannounced after the public meetings.
Many countries have implemented EnvironmentalImpact Assessment (EIA) requirements. Likewise, allmajor development banks and lending institutionshave their own EIA requirements. Typically, suchrequirements include public participation or hearingprocedures for relevant NGOs and community groups.An EIA and hearing procedures could provide a way tocommunicate actual environmental and neighbor-hood impacts. Generally, a waste incineration plantequipped with energy recovery and international airpollution control measures will be environmentallymore desirable than dumping, even if the dumpingtakes place in state-of-the-art sanitary landfillsequipped with engineered lining, leachate treatment,and landfill gas management systems. Hence, it is keyto identify the optimum site and to mitigate potentialneighborhood nuisances.
Socio-Economic Impact of Advanced Waste TreatmentFacilitiesTypically, introducing more advanced waste treatmentfacilities requires investments and, hence, public or pri-vate capital and higher incomes to cover increasedoperation and maintenance costs. Also, typicaladvanced waste treatment facilities, other than engi-neered sanitary landfills, produce a salable output, suchas steam or heat, electricity, and recovered materials(for example, metals).
When salable outputs are generated, it is necessaryto decide on a cost recovery system which balances theincome from salable output and from treatment fees tobe paid by the waste generators. The income from saleof steam or heat and power from waste incinerationplants varies between 0 and 40 percent of the totalannual costs, depending on the national legislation andthe regional energy market.
National or regional traditional power and districtheating companies may be reluctant to purchase ener-gy produced at waste incineration plants because:
• Energy can be produced with higher profit marginsby using the supplier’s own plants and other fuels
• Capacity of the supplier’s own plants will be redun-dant and, hence, return on investments alreadymade will be less
38 Municipal Solid Waste Incineration

• The supplier is unwilling to rely on external energysuppliers
• Supply is not sufficiently stable or guaranteed • The incineration plant is not suitably located with-
in the current energy infrastructure system.
Therefore, national or regional legislation favoringenergy produced from solid waste (renewable energysource) is important for securing high income fromsale of energy from waste incineration plants. Such reg-ulating procedures have been introduced in practicallyall developed countries with waste incineration plants,thus forcing electricity and district heating companiesto purchase energy from waste incineration plants at aspecific price.
Affordability is particularly important in developingcountries.Citizens with low incomes may find it difficult
to pay the full cost of an advanced waste managementsystem. Surveys can be used to determine the actual levelof affordability. For example, differentiated service feescan be charged—for example, households with incomesbelow a certain threshold; households with incomesabove a certain threshold; private production compa-nies; private service companies; and public institutions.
A political decision should be made on how to dealwith waste generators who are unable to pay the fullservice fees. Service fees for less affluent waste genera-tors can be cross-subsidized by the public budget or themore affluent waste generators; or each low-incomewaste generator can be subsidized directly.
In any case, a suitable policy for collection of servicefees should correspond with an overall fee policy forother public services, such as water, sewage, heating,and power.
The Project Cycle 39


/1/ The World Bank. Decision Maker’s Guide to Solid Waste
Landfills.
/2/ OECD (Organisation for Economic Co-operation and
Development). 1991. The State of the Environment. Paris.
/3/ Eurostat ECSC-EC-EAEC. 1995. Europe’s Environment.
Statistical Compendium for the Dobris Assessment. Brussels,
Luxembourg.
/4/ APEC. June 1996. Environmental Priorities in Asia and Latin
America. Tasman Institute. .
/5/ MSW-management. Regional Overviews and Information
Sources—Asia. UNEP (United Nations Environment
Programme).
/6/ MSW-management. Regional Overviews and Information
Sources—Latin America and the Caribbean. UNEP.
/7/ Data obtained from pre-appraisal of Guangzhou solid waste
project. Draft preliminary findings. 1997.
/8/ DANIDA (Danish International Development Agency).
January 1995. Pre-appraisal Working Report II. Guangzhou
Solid Waste Project.
/9/ Manila Smokey Mountain Waste Incineration Project.
March 1997. Waste Characterisation Study—Final Results.
/10/ Haukohl, J., and T. Kristiansen. 1996. Waste Incineration.
WHO (World Health Organization).
/11/ The World Bank data. 1998. Communication by Mr. J.
Fritz.
/12/ Kaila, Dr. Juha. 1996. Waste Collection. WHO.
/13/ Statistical Yearbooks of Denmark Statistics, 1990-1998.
41
References


43
PART 2TECHNICAL


A typical incineration plant comprises the unit func-tions and processes shown in Figure 0.1 on the follow-ing page.
The components of the unit functions and process-es are briefly described as follows:
• Waste registration and control. For billing, moni-toring, and control purposes, the waste is declared,weighed, and registered after it enters the plant.
• Size reduction, sorting, and inspection of waste(optional). Depending on the type of waste and itsorigin, it may be necessary to reduce the size (forexample, of bulky waste), sort, and inspect all or partof the waste received.
• Unloading and hopper for waste. Waste is unloadedinto a bunker or hopper system. The storage capac-ity should allow for both daily and weekly variationsin the waste quantities and for mixing (homoge-nization) of the waste to be fed into the furnace.
• Feeding system. The homogenized waste is fed from thehopper into the furnace,normally by overhead cranes.
• Furnace. The waste is first dried, then ignited, fol-lowed by complete burning in a series of combus-
tion zones on the movable grate. Flue gases are com-pletely burned out in the after-burning chamber.
• Energy recovery system. Energy is recovered aspower, heat, or steam (or a combination thereof),depending on the local energy market.
• Ash and clinker removal system. The burned-outash and clinkers are collected and transported in aconveyor or pusher system. The ash and clinkers canbe sieved, sorted, and used for filling purposes, roadconstruction, or the like. Rejected ash and clinkersare disposed of in a sanitary landfill.
• Air pollution control (APC) system. The principalAPC systems are—depending on the desired levelof cleaning—electrostatic precipitators or bag-house filters for physical removal of dust and someheavy metals; additional chemical flue gas cleaningin dry/semidry scrubbers followed by fabric filtersor wet scrubbers for washing/spraying the flue gas;and additional NOx, or dioxin removal in specialfilters.
• Stack. The treated flue gas is finally emitted via thestack. The stack height depends on the local topog-raphy and prevailing meteorological conditions.
45
Technical Plant Overview


Key issues
A municipal solid waste (MSW) incineration plant is apublic service facility. The location should always bedetermined with respect to both economic and envi-ronmental issues. The environmental impact mustalways be assessed (see the chapter on EnvironmentalImpact and Occupational Health).
Properly constructed and operated, a waste inciner-ation plant will be comparable to a medium to heavyindustry in its environmental impact, potential publicnuisances, transport network requirements, and otherinfrastructure needs.
An MSW incineration plant will generate surplusenergy, which may be made available in the form ofheat or power depending on the demand of the localenergy market. In that respect, an MSW plant is com-parable to a fossil fuel power plant. It is further com-parable to a coal-fueled power plant in respect to fluegas emissions and solid residues from the combustionprocess and flue gas cleaning.
Therefore, a waste incineration plant should be closeto an existing fossil fuel power plant for the two plantsto enjoy mutual benefits from the service facilitiesneeded—or it could be adjacent to or part of a newpower plant.
Key Criteria✓ ✓ ✓ A controlled and well-operated landfill
must be available for disposing residues.
✓ ✓ In relation to the air quality in the site area,frequent and prolonged inversion and smogsituations are not acceptable.
✓ ✓ MSW incineration plants should be locatedin land-use zones dedicated to medium orheavy industry.
✓ MSW incineration plants should be locatedin industrial areas close to power plants.
✓ It should take no longer than one hour todrive a truck from the waste generation areato the plant.
✓ MSW incineration plants should be at least300 to 500 meters from residential zones.
✓ MSW incineration plants should be locatednear suitable energy consumers.
Site Feasibility Assessment
Siting the MSW incineration plant will generally takeplace when the demand for such a facility has beenestablished through waste surveys. The surveys willidentify the amount of waste, how it is collected ortransported, and provide information about the area tobe serviced—including the approximate location ofthe waste generation’s center of gravity.
The considerations when evaluating locations for awaste incineration plant are similar to the environ-mental impact assessments. The main difference is thatthe siting process considers a multitude of locations,then ranks them by applying existing information tothe variables. However, the environmental impact
47
1 Plant Location

assessment looks at a plant’s impact on the environ-ment in more detail—and often only after providingadditional and more dextailed information on both thesite and the plant.
The siting phase should deal with a number of top-ics—including proximity to the waste generation cen-ter, traffic and transport, air quality, noise impact,proximity to energy distribution networks, utilities,and landfill. If any such topic is irrelevant for a specif-ic location, this should nevertheless be noted.
Proximity to Waste Generation CenterLong-distance waste hauling is both costly and envi-ronmentally unsustainable (because of CO2 and NOxemissions). Therefore, waste incineration plantsshould be as close as possible to the center of gravity ofthe area delivering waste to the plant. This is even moreimperative if the plant also produces heat and will beconnected to a district heating network servicing thesame area.
Proximity to the waste center of gravity is importantfor using the collection vehicles and crews as efficient-ly as possible—that is, to minimize idle time on theroad. Extended transport time due to long distances ortraffic jams requires more vehicles and staff for collec-tion and transportation, or transfer of the waste to larg-er vehicles at transfer stations. Both solutions increasecosts.
Traffic and Transport Incineration plants attract heavy traffic, with waste andconsumables coming in and treatment residues goingout. The plant should therefore be near major roads orrailway lines (or, in special circumstances, rivers) thatallow heavy traffic.
A location close to the center of gravity of waste gen-eration minimizes collection vehicles’ idle time on theroad. Depending on the size of the plant and the col-lection vehicles, 100 to 400 trucks can arrive at the plantdaily. A traffic study may be required to minimize traf-fic jams and avoid wasting time.
Besides contributing to traffic congestion, the truckswill vibrate, emit dust, and generate noise. Waste trans-portation vehicles should therefore not pass throughresidential streets or other sensitive areas.
Air QualityWaste incineration plants equipped with a modernstandard flue gas cleaning system create little air pollu-tion or odor (see the chapter on Air Pollution Control).Therefore, siting seldom poses a problem with regardto air quality. The plants should, however, be locatedwith due respect to meteorological conditions—that is,in open areas where emissions will not normally betrapped. For example, plants should not be sited in nar-row valleys or areas prone to smog.
Waste emits odor during transportation and han-dling in the plant. However, using the bunker area ven-tilation air in the incineration process normally elimi-nates most odor.
NoiseMost noise will come from flue gas fans and the venti-lators used in cooling, which operate 24 hours a day.Ventilators are usually on the roof of the plant, whichmakes them particularly noisy. Handling the waste andresidues inside the plant may also emit noise.Transportation to and from the plant will create noise,particularly during the day.
Therefore, waste incineration plants should be atleast 300 to 500 meters away from residential areas tominimize the noise impact and to protect against odornuisances.
Proximity to Energy Distribution NetworksA waste incineration plant will generate surplus ener-gy. The recoverable energy is an important asset, as itcan be sold to bolster the plant’s income considerably.
The recovered energy can be used for heating, powergeneration, and process steam. It is normally most eco-nomical when the energy is used for heating and similarpurposes, as this is technically simpler in respect to theplant’s construction and operation.The demand for heat-ing may, however, be limited in terms of either the size ofthe distribution network or seasonal variations, thus cre-ating an excess which could be used for power production.
Regardless of the how the energy is used, it is impor-tant that the incineration plant be near the distributionnetwork so the plant’s delivery system can be connect-ed to an existing distribution network (thus avoidinghigh construction or operating costs).
48 Municipal Solid Waste Incineration

UtilitiesAn incineration plant demands the same kind of utili-ties as medium to heavy industries.
The heat generated in the combustion process isgenerally assumed to be used wisely in district heatingor power production. There will, however, be timeswhen cooling is needed, either as direct water coolingor via air coolers or cooling towers.
An incineration plant will also discharge wastewater, which will be polluted to a certain degreedepending on the slag cooling and the flue gas cleaningsystem (see the chapter on Air Pollution Control).Waste water generation is most significant with a wetflue gas cleaning system. Storm water will be dis-charged from the paved areas (although it may, to someextent, be collected and used for cooling purposesbefore discharge). If the plant has a wet flue gas clean-ing system, it must be located at a watercourse or nearpublic sewers with sufficient capacity to receive thewaste water discharge.
LandfillAlthough waste incineration significantly minimizesthe volume of waste for disposal, residues that have to
be disposed of in landfills will remain. These residuesconsist of bottom ash (slag) from the burned waste andfly ash and other residues from flue gas cleaning.Depending on the environmental and geotechnicaldemands, the bottom ash can be recycled for construc-tion purposes or disposed of with no special measures.In all circumstances, the plant must have access to aproperly designed and operated landfill for ultimateresidue disposal.
The residues from the flue gas cleaning techniqueswith acid gas removal are highly soluble and may causeground water pollution. Proper lining and coverage ofthe landfill can control this, together with treating theleachate to remove heavy metals before discharge. Evenafter treatment, the leachate will have a concentrationof salts and should be discharged somewhere with suf-ficient flow for a high degree of dilution.
Although the incineration plant should be relative-ly close to a landfill, the distance is not crucial, as theweight of the residues to be disposed of will equal about25 percent of the amount of the waste incinerated at theplant (depending on the ash content and the flue gascleansing technique), and the volume will reduce toabout 10 percent of the original waste.
Plant Location 49


Key Issues
The heart of an incineration plant is the combustion sys-tem—which can be divided into two broad categories:mass burning of “as-received” and inhomogeneouswaste,and burning of pretreated and homogenized waste.
For an overview of the different technologies andcombinations hereof, see diagram 3.1, “TechnologicalOverview.”
Mass burning of “as-received” and inhomogeneouswaste requires little or no pretreatment. Mass burningsystems are typically based on a moving grate.
Mass burn incineration with a movable grate incin-erator is a widely used and thoroughly tested technol-ogy. It meets the demands for technical performanceand can accommodate large variations in waste com-position and calorific value.A less common mass burn-ing alternative is the rotary kiln.
51
2 Incineration Technology
80%
80%
35%
75%
35–75%
20–25%
65–60%
0%
0-35%
80%
80%
35%
85%
0%
Fine ManualSorting
AutomaticSorting
Coarse MechanicalSorting
No Sorting
Mixing
Shredding
Moving Grate
Rotary Kiln
Fluidized Bed
Hot Water Boiler
Heat Only
Cooling TowerCondensing SteamTurbine
Back PressureTurbine
Condensing HeatExchanger
Combined Heatand Power
ExtractionTurbine
LP Steam Boiler
Steam Boiler
No Recovery
Power Only
Heat Exchangers
Steam Only
Combined Steamand Power
Sorting Homogenization Furnace Boiler Power Generation Heat Production End Use Recovery
EfficiencyEnergy ProductionIncinerationPretreatment EnergyRecovery
OverallRecovery
Diagram 3.1 Technological Overview

Burning pretreated and homogenized wasterequires size reduction, shredding, and manual sort-ing—or even production of “refuse-derived fuel,”which is a demanding complication. Therefore, theincineration technologies for burning pretreated andhomogenized waste are limited.
An alternative for burning pretreated and homoge-nized MSW may theoretically be a fluidized bed.However, the fluidized bed is a fairly new technologyand hence still limited in its use for waste incineration.It has a number of appealing characteristics in relationto combustion technique, but these have not been thor-oughly proven on MSW. The fluidized bed may be agood alternative and widely applied for special types ofindustrial waste (for example, in Japan).
When implementing an MSW incineration plant,the technology must be feasible and proven. At present,only the mass burning incinerator with a moveablegrate fulfills these criteria. Furthermore, suppliers withnumerous reference plants in successful operation fora number of years also in low- and middle-incomecountries (preferably) must be chosen.
The combustion system must be designed to hinderthe formation of pollutants, especially NOx, andorganic compositions such as dioxins. Appropriatemeasures to ensure an efficient combustion process(complete burnout of the bottom ashes and the fluegases, low dust content in the raw flue gas, and such)comprise a long flue gas retention time at high tem-perature with an appropriate oxygen content, inten-sive mixing and recirculation of flue gases, optimalsupply of combustion air below the grate and beforeinlet to the after-combustion chamber, and propermixing and agitation of the waste on the grate.
The content of CO and TOC (total organic carbonexcluding CO) in the raw flue gas (before inlet to theAPC system) is a good indicator of the efficiency of thecombustion process.
Key Criteria✓ ✓ ✓ The lower calorific value (LCV) of the waste
must be at least 6 MJ/kg throughout all sea-sons. The annual average LCV must not beless than 7 MJ/kg.
✓ ✓ ✓ The technology must be based on mass burntechnology with a moveable grate.Furthermore, the chosen (or proposed) sup-plier must have numerous reference plants insuccessful operation for a number of years.
✓ ✓ ✓ The furnace must be designed for stable andcontinuous operation and complete burn-out of the waste and flue gases (CO<50mg/Nm3, TOC<10 mg/Nm3).
✓ ✓ The annual amount of waste for incinerationshould be no less than 50,000 metric tons,and the weekly variations in the waste supplyto the plant should not exceed 20 percent.
Pretreatment of Waste
Depending on the quality of the waste and the inciner-ation system, sorting and homogenizing the wastebefore incineration may be necessary.
SortingThe waste may be sorted manually, automatically, ormechanically—or as a combination thereof.
Manual and advanced automatic sorting allowsthe waste to be divided intorecyclable materials, waste fortreatment, and waste which issuitable only for direct land-filling.
Advanced sorting processes,however, are time consumingand costly, take up a lot of space,and require special precautionsto ensure that the sorters do notsuffer any health problems as theresult of their work.
Coarse mechanical sortingmay not be sufficient for flu-idized bed incineration, but canbe used for mass burning incin-eration. It may be performed onthe reception hall floor.
52 Municipal Solid Waste Incineration
Fine ManualSorting
AutomaticSorting
Coarse MechanicalSorting

With a movable grate, the wastemay be burned without sorting,shred-ding,or drying.However,an overheadcrane typically removes inappropriatebulky waste from the pit through acoarse and simple sorting.
HomogenizationSome degree of waste homoge-nization is always necessary.
To control the energy inputand the combustion process,proper mixing of the waste isnecessary before incineration.For mass burn incineration, themixing is typically done by theoverhead crane in the pit.
A shredder may be used whenthere are large quantities ofbulky waste. For fluidized bedincineration, shredding is aminimum requirement and fur-ther pretreatment is necessary.
Moving Grate IncinerationThe conventional mass burn incinerator based on amoving grate consists of a layered burning on the gratetransporting material through the furnace.
An overhead crane feeds wasteinto the hopper, where it is trans-ported via the chute to the grate inthe furnace.On the grate, the wasteis dried and then burned at hightemperature with a supply of air.
The ash (including noncombustible fractions ofwaste) leaves the grate as slag/bottom ash through theash chute.
The following table shows the main advantages anddisadvantages of the moving grate.
The Grate The grate forms the bottom of the furnace. The mov-ing grate, if properly designed, efficiently transportsand agitates the waste and evenly distributes combus-tion air. The grate may be sectioned into individuallyadjustable zones, and the combustion air can usually bepreheated to accommodate variations in the lowercalorific value of the waste.
There are several different grate designs—includingforward movement, backward movement, doublemovement, rocking, and roller. Other alternatives maybe suitable as well.
The detailed design of the grate depends on themanufacturer, and its applicability should therefore becarefully evaluated for the actual waste composition.Moreover, the design of the grate must be well provenby the manufacturer by thorough experience and sev-eral relevant references.
The FurnaceThe walls in the furnace of the incinerator can berefractory lined or water-wall designed. Most water-wall furnaces operate with less excess air, which reducesthe volume of the furnace and size of the air pollutioncontrol equipment.
See page 54 for selected design criteria and layoutdata for mass burning incineration based on a movinggrate.
Rotary Kiln IncinerationThe mass burning incinerator based on a rotary kilnconsists of a layered burning ofthe waste in a rotating cylinder.The material is transportedthrough the furnace by the rota-tions of the inclined cylinder.
The rotary kiln is usuallyrefractory lined but can also beequipped with water walls.
Incineration Technology 53
No Sorting
Mixing
Shredding
Moving Grate
Advantages Disadvantages• No need for prior sorting or shredding. • Capital and maintenance costs are relatively high.• The technology is widely used and thoroughly tested for waste
incineration and meets the demands for technical performance.• It can accommodate large variations in waste composition and
calorific value.• Allows for an overall thermal efficiency of up to 85 percent.• Each furnace can be built with a capacity of up to 1,200 t/day
(50 metric tons/hour)
Rotary Kiln

The cylinder may be 1 to 5 meters in diameter and 8to 20 meters long. The capacity may be as low as 2.4t/day (0.1 t/hour) and up to approximately 480 t/day(20 t/hour).
The excess air ratio is well above that of the movinggrate incinerator and even the fluidized bed.Consequently, the energy efficiency is slightly lowerand may be up to 80 percent.
As the retention time of the flue gases is usually tooshort for complete reaction in the rotary kiln itself, thecylinder is followed by, and connected to, an after-burning chamber which may be incorporated in thefirst part of the boiler.
The rotary kiln may also be used in combinationwith a moveable grate—where the grate forms the igni-tion part and the kiln forms the burning-out section.This allows for a very low level of unburned material inthe slag. The slag leaves the rotary kiln through the ashchute.
Main advantages and disadvantages for the rotarykiln are as follows.
Advantages Disadvantages• No need for prior sorting • A less common technology
or shredding. for waste incineration.• Allows an overall thermal • Capital cost and mainte-
efficiency of up to 80 nance costs are relatively percent. high.
• Able to accommodate • The maximum capacity oflarge variations in waste each furnace is limited to composition and calorific approximately 480 t/day value. (20 t/hour).
Fluidized Bed IncinerationFluidized bed incineration is based on a principle where-by solid particles mixed with the fuel are fluidized by air.The reactor (scrubber) usually consists of a vertical refrac-tory lined steel vessel containing a bed of granular mate-rial such as silica sand, limestone, or a ceramic material.
The fluidized bed technologyhas a number of appealing charac-teristics in relation to combustiontechnique: reduction of dangeroussubstances in the fluidized bedreactor itself, high thermal effi-ciency, flexibility regarding multi-fuel input, and cost.
A main disadvantage of the fluidized bed for wasteincineration is the usually demanding process of pre-treating the waste before the fluidized bed so that itmeets the rather stringent requirements for size,calorific value, ash content, and so forth. Because of theheterogeneous composition of MSW, it can be difficultto produce a fuel that meets the requirements at anygiven point.
The main advantages and disadvantages of the flu-idized bed are listed below.
Advantages Disadvantages• Relatively low capital and • At present, not a common
maintenance costs due to nor thoroughly tested tech- a simple design concept. ology for MSW incineration.
• Allows a overall thermal • Relatively strict demands to efficiency of up to 90 size and composition of the percent. waste,which usually requires
• Suitable for a wide range thorough pre-treatment.of fuel and mixtures of fueland can handle liquid or solid waste either in combination or separately.
Design and Layout of the Mass BurningIncineration System
This section covers selected main design criteria andlayout data, particularly related to the mass burningincineration technology.
GrateThe grate has two principal purposes: to transport,mix, and level the “fuel”(waste), and to supply and dis-tribute primary combustion air to the layer of waste.
Various grate designs are available, usually charac-terized by the way they transport the “fuel”: slanting orhorizontal forward- and backward-pushing grates,roller grates, or rocking grates.
As the grate performance is important to the entireplant, the grate and grate design should be chosen care-fully. As a basic principle, the grate should in everyrespect be suitable for the specific waste the plant willtreat. The grate should be able to accommodate a greatvariation in calorific value and waste composition.
Moreover, in connection with selecting and dimen-sioning the grate, special attention should be given to
54 Municipal Solid Waste Incineration
Fluidized Bed

possible changes in the calorific value and waste com-position.
Regardless of the specific properties and varying“quality” of the waste, the grate should meet therequirements for waste capacity, operational reliability,combustion efficiency, and operation at partial load.
The grate should be designed for mass burning—that is, the waste, except for particularly bulky waste,should be fed into the furnace and combusted withoutany special preseparation or crushing.
The grate system should also be designed so thatwaste can be transported automatically from feeding toslag extraction without obstacles or clogging and with-out any manual intervention.
Division into Grate SectionsThe grate should be divided into individuallyadjustable sections. This division may be longitudinaland, in cases where the grate is very wide, it should bedivided into separate tracks. The number of grate sec-tions depend on several factors, including the gratetype, the waste composition, the required capacity, andthe requirements made for operation at partial loadand maximum load at varying calorific values.
Depending on the type of grate, the longitudinaldivision may vary from one to six sections—where thelowest number represents the backward pushing grateand the highest number represents the roller grate. Itshould be noted, however, that each roller is, in princi-ple, individually adjustable.
Some types of grates, including the different for-ward-pushing grates and the double motion overthrustgrates, typically require three or four individuallyadjustable grate sections to ensure optimal treatmentand combustion.
Grate Length, Grate WidthThe approximate dimensions of each type of grate canbe estimated based on the grate suppliers’ own recom-mendations or guidelines for thermal grate load(MW/m2), mechanical grate load (tonne/m2/h),mechanical grate width load (metric ton m/h), thermalgrate width load (MW/m), permissible length/widthratio, and so on.
One requirement should be a dimensioning whichensures an appropriate grate width in relation to the
thermal grate width load, and a grate length which—focusing on a good slag quality—allows for satisfacto-ry thermal final treatment of the slag in the furnace.
Moreover, a maximum of 65 to 70 percent of thelength of the grate must be applied as a drying andcombustion zone when operating in the design pointat nominal load.
The remaining part of the grate should always beavailable to ensure final combustion and completeburnout of the slag and the ash.
Air Supply Ensuring Optimum Grate PerformanceThe grate should be able to intensively agitate, mix, andlevel the waste layer to create the largest possible “fuel”surface and, thus, efficient drying, ignition, combus-tion, and final burnout of the slag/ash.
The variations in load and calorific values require aflexible primary air supply system in respect to both theamounts supplied and the supply spots—it should bepossible to change the extent and location of the dry-ing and primary combustion zones in relation to thewaste composition and the waste load.
Consequently, a number of adjustable air zonesshould be established under the grate—about four tosix, depending on the type of grate.
The primary combustion air should be supplied tothe waste layer through small slots in the front side ofthe grate bars or through 1- to 2-mm slots between thegrate bars.
Experience shows that, to ensure satisfactory air dis-tribution, the air supply area should be no more than 1.5to 2.0 percent of the total grate area. The air supply willtypically go through the slots at a rate of 10 to 15 m/sec.
FurnaceIn principle, the furnace and the secondary combus-tion chamber, the after-burning zone, should bedesigned to ensure a long retention and reaction timeof the flue gases at high temperatures. Most importantis the secondary combustion chamber, the first radia-tion pass of the boiler, which should be designed witha large volume and height so that all processes and reac-tions in the flue gas end before they reach the unpro-tected boiler walls.
Moreover, the size, volume, and geometry of the fur-nace should minimize the risk of slag deposits and ash
Incineration Technology 55

fouling on the furnace walls, which requires an ade-quately low thermal furnace load and as well as a lowrelative flue gas velocity in the furnace.
The flue gas velocity in the furnace should be main-tained at a level lower than 3.5 to 4.0 m/sec. It shouldbe possible to control the furnace temperature in sucha way to avoid undesired peaks. The furnace sectionsdepend to a great extent on the chosen flue gas flow,which may be the so-called mid-flow, co-flow, orcounter-flow principle.
The choice of flue gas flow in the primary combus-tion chamber depends to a great extent on the prevail-ing type of waste, the calorific value, and the specificgrate concept.
Another precondition for optimal furnace perfor-mance is the design of the secondary air supply system,which ensures effective mixing of the flue gases bothabove the waste layer and at the inlet to the secondarycombustion chamber or the first pass of the boiler.
The secondary air should be supplied through rowsof nozzles in the zones at the inlet to the secondarycombustion chamber, and possibly through rows ofnozzles in the furnace—depending on the furnace’sflue gas flow.
The furnace and the combustion control conceptshould be designed to recirculate flue gas to partiallyreplace secondary air to the furnace.
The furnace should be prepared for establishingstartup and auxiliary burners.
Flue Gas RecirculationEstablishing flue gas recirculation is part of the furnacedesign. After passing through the dust filter, part of theflue gas (20 to 30 percent) is limited and retainedthrough an insulated duct to the furnace. The recircu-lated flue gas is injected through separate nozzles in thefurnace and in the turbulence zone at the inlet to the sec-ondary combustion chamber, the first pass of the boiler.
Among its primary advantages, flue gas:
• Recirculates flue gas, which leads to a higher thermalefficiency, as the excess air and the oxygen contentcan be significantly reduced (efficiency can increaseabout 1 to 3 percent)
• Reduces NOx (20 to 40 percent when recirculating20 to 30 percent of the flue gas)
• Reduces the dioxin generation (connected with alow amount of excess air and a low oxygen content)
• Stabilizes or improves the flow and turbulence con-ditions—particularly at partial load
• Minimizes the risk of “bursts” in the secondarycombustion chamber, the first pass of the boiler
• Decreases the amount of flue gas entering the fluegas cleaning system.
Consequently, establishing flue gas recirculationhas operational, economic, and environmentaladvantages.
If flue gas is recirculated, all duct connections mustbe welded and a minimum of flex connections shouldbe used. Otherwise, there may be leaks, and any escap-ing flue gas is likely to cause corrosion.
Secondary Combustion Zone (After-Burning Chamber)The secondary combustion zone, which consists of thefirst part of the first radiation pass of the boiler, startsafter the last injection of secondary air or recirculatedflue gas.
Efficient turbulence of the flue gas at the inlet to thesecondary combustion zone should be ensured at anyload except at startup and shutdown.
According to standard legislation, including thedraft EU directive of 1997.04.24, the flue gas tempera-ture should be increased to a minimum of 850°C for atleast two seconds under the presence of at least 6 per-cent oxygen in the actual secondary combustion zone,even under the most adverse conditions.
Combustion Air Systems and FansSpecial attention should be given to the design andregulation of the combustion air systems, which pro-vide a excess air in the flue gas—to ensure a high com-bustion efficiency and avoid a reducing (corrosive)atmosphere, incomplete burnout of the flue gases, andrelated problems.
The primary air should be drawn from above thecrane slab in the waste pit and injected through thepressure side of the primary fan below the grate in atleast four to six air zones regulated automatically bymotorized dampers.
Intakes for the secondary air are situated at the top ofthe furnace or boiler—possibly in the waste pit—and
56 Municipal Solid Waste Incineration

should be supplied to the furnace and at the inlet to thefirst pass of the boiler (after-burning chamber) throughthree to five rows of nozzles (depending on the design).
The amount of secondary air supplied to each of therows of nozzles is regulated automatically by motorizeddampers.
An air preheater manufactured in a bare tube struc-ture should preheat the primary air at low calorific val-ues and with moist waste.
It should be possible to heat the primary air from10°C to approximately 145°C, depending on the wastecomposition and moisture content.
Incineration Technology 57


Key Issues
A main benefit of solid waste incineration is the possi-bility of reusing the waste as fuel for energy production.Waste incineration may thus both reduce methanegases at the landfill and substitute fossil fuel, reducingthe emission of greenhouse gases overall.
The flue gases carrying the energy released in a wasteincineration furnace have to be cooled in a boilerbefore entering the air pollution control system. Theboiler is also a necessary technical installation for ener-gy recovery. The feasible type of boiler, however,depends whether the energy is used for hot water fordistrict heating, process steam for various types ofindustries, or electricity.
For an overview of different technologies and com-binations of them, see Diagram 3.1.
The end use possibilities depend on the local energymarket conditions, including:
• Infrastructure for energy distribution—for exam-ple, the availability of a power grid and district heat-ing network
• Annual energy consumption pattern (the energyoutput from MSW incineration plants is fairly con-stant)
• Prices of the various types of energy and possibleagreements with the consumer(s).
The overall thermal efficiency of an MSW inciner-ation plant equipped for energy recovery depends onthe end use of the energy recovered. Production ofelectricity has a low thermal efficiency, but results inhigh-priced energy, whereas hot water for districtheating is considered inexpensive energy, but the over-all thermal efficiency is high, and the complexity and
the costs of the necessary technical installations arerelatively low.
Key Criteria✓ ✓ ✓ The flue gases from the furnace must be cooled
to 200˚C or lower in a boiler in order to applyavailable flue gas treatment technology.
✓ ✓ The plant economy should be optimizedthrough energy recovery and sale.
✓ ✓ Irrevocable agreements for energy sale (typeand quantity) should be in place before any finaldecision is made on the design of the energyrecovery section of an MSW incineration plant.
✓ ✓ When surplus energy is to be used for dis-trict heating, the incineration plant must belocated near an existing grid to avoid costlynew transmission systems.
✓ If there is a regular market for the sale of hotwater (district heating or similar),or if steam ispresent, the plant should be based on produc-tion of hot water or steam only.These configu-rations are normally preferable both in terms oftechnical complexity and economic feasibility.During the warm season, a certain extent ofcooling to the environment may be preferableto solutions demanding greater investments.
Energy Recovery Technology
See Diagram 3.1 for the most common technologies forenergy recovery.
59
3 Energy Recovery

Table 3.1 summarizes the efficiency of energy recov-ery for each use of energy with respect to the heat input.Assuming that the heat input is known, the efficiencynumbers can be used to compute the absolute amountof energy recovered and the revenues from the energysale.
Part I of this Technical Guidance Report discussesthe importance of the revenues from energy sale to theoverall economy of the plant .
Energy is released from the incineration and leavesthe furnace as flue gases at a temperature of approxi-mately 1,000-1,200˚C. The hot flue gases from theincineration must be cooled before they can be passedon to a flue gas cleaning system. The flue gases arecooled through a boiler, where the energy releasedfrom incineration is initially recovered as hot water orsteam.
As illustrated Diagram 3.1, the end use possibilitiesof power, district heating, or steam depend on the typeof boiler. The boilers are divided into three broad cat-egories, as follows:
• The hot water-producing boiler produces heat only(hot water). This boiler is also used if heat recoveryis not possible (cooling of the surplus heat).
• The low pressure (LP)-producing boiler producesLP steam only.
• The steam-producing boiler generates power andcombines power and process steam or heat.
The Hot Water BoilerThe hot water boiler is fairly simple to design, accom-modate in building arrangements, finance, operate,
and maintain. Technically, special attention must bepaid to the corrosive nature of the flue gases from wasteincineration.
Hot water (approximately110˚-160˚C) may be produced. Itcan be heated to higher temper-atures depending on the operat-ing pressure level of the boiler.
A boiler efficiency of up toapproximately 80 percent can be achieved. The recov-ery is limited by the temperature of the returning cool-ing water.
The Hot Water Boiler CircuitThe energy from the hot flue gases is via a hot waterboiler transferred to an internal circuit of water whichagain passes the energy to the end user circuit (districtheating system). The end user circuit is separated fromthe boiler circuit by heat exchangers.
The internal circuit for the transfer of energy via thehot water is illustrated in figure 3.1.
Hot Water ApplicationThe relatively low energy content of hot water limitsits uses. In temperate climates, it is commonly used indistrict heating systems to heat homes and publicbuildings.
When there is no beneficialuse for the waste generated ener-gy, a hot water boiler connectedto a cooling facility is the mosteconomical way to cool the fluegases before cleaning.
Cooling may take place through a number of well-known methods—including cooling towers, a fan-mounted air cooler (radiator),and heat exchangers using riveror sea water.
A cooling tower uses water asthe cooling medium and emitssteam. A heat exchanger requiresriver or sea water, and hot wateris led back to the recipient.
If cooling water is not avail-able, a fan-mounted air cooler can serve the purpose,although it is less energy-efficient. Moreover, an air
60 Municipal Solid Waste Incineration
Table 3.1 Summary of efficiencies in different energyrecovery systems
Energy utilization Recovery Overall efficiencya
Heat only Heat 80% 80%Steam only Steam 80% 80%Power only Power 35% 35%Combined steam Steam 0-75%
and power Power 0-35% 35-75%Combined heat Heat 60-65%
and power Power 20-25% 85%
a. Efficiencies defined as usably energy related to energy content (lowercalorific value) of the waste
Hot Water Boiler
Heat Only
Cooling Tower

cooler is less appropriate in hot environments, as thecooler dimensions increase with the ambient air tem-perature.
The Low-Pressure Steam BoilerIf a district heating network is not available and thereis a demand for process steam, a low-pressure boilermay be an alternative to the hotwater boiler.
The low-pressure boiler issimilar to the hot water boiler interms of complexity, accommo-dation in building arrangements,financing, operation, and main-tenance—although the designrequires more attention becausethe flue gases are so corrosive.
Depending on the operating pressure level of theboiler and the extent of superheating, the steam may beapproximately 120° to 250 °C.
A steam pressure of up to approximately 20 bar maybe relatively low. This allows for saturated steam atapproximately 210 °C. A certain amount of superheat-ing may be necessary, depending on the vicinity of theend users—as uses for low-pressure steam depend onits energy content. See Table 3.2 for relevant parame-ters for steam demand in various industries.
Cooling capacity must remain available, as thedemand for process steam may not be continuous.
Moreover, the industries with demands for processsteam should be located near the plant to preventextensive heat loss and eliminate the need for expensivepipelines. The risks related to supplying the steam to asingle or a few industrial facilities must be thoroughlyassessed.
A boiler efficiency of up to approximately 80 percentcan be achieved. The recovery is limited by the tem-perature of the water returned to the boiler.
The High-Pressure Steam BoilerA steam boiler requires more attention to design thanthe hot water-producing or LP steam boiler because ofthe highly corrosive nature of the flue gas. It alsorequires more attention to its operation and morespace.
Special attention must be paid to several character-istic of the steam boiler—including design andarrangement and steam parameters.
Design and ArrangementThe steam boiler is divided into one to three open radi-ation passes and a convection part.
After passing the radiation part, the flue gases enterthe convection heating surfaces. Here, they first passheat to the steam in the superheaters. Then, in theeconomizers, the flue gases are finally cooled to approx-imately 160° to 220 °C before being passed on to theflue gas cleaning system.
Energy Recovery 61
Boiler
Feed water pump
Feed water tank
Flue gas District heating system
Figure 3.1 Hot water boiler circuit
LP Steam Boiler

The radiation part of the boiler requires a room upto 30 to 40 meters in height.
The convection part of the boiler can be arrangedeither horizontally or vertically. The horizontalarrangement takes up approximately 20 meters morespace than the vertical arrangement in the longitudinaldirection. The arrangement of the convection sectioncan significantly affect building costs and should bedetermined as early as possible.
Horizontal layout
Vertical layout
Steam ParametersThe energy recovery from the steam boiler may bemore significant than that of the hot water or LP boil-er. However, there is a tradeoff between high recov-ery and reliability of the boiler because of the highlycorrosive nature of the flue gases.
The steam boiler must be designed to operatewith a waste furnace to avoid potential serious oper-ational problems such as erosion, corrosion, foul-
ing, short continuous operation periods, insuffi-cient availability, and extensive repair and mainte-nance.
The risk of corrosion and erosion can be reducedby observing a number of specific design criteria andby designing the boiler for moderate steam parame-ters (pressure and temperature). The waste-firedplant cannot be designed with steam parameters sim-ilar to those of traditional power plants fired withcoal, gas, or oil. This is because waste differs from fos-sil fuel, particularly in terms of the content of chlo-rine, which—combined with sulfur—may lead tohigh-temperature corrosion, even at relatively lowtemperatures.
Some combustion processes may, furthermore,have a risk of CO corrosion.
The corrosive nature of the flue gas from wasteincineration usually limits the steam parameters to amaximum temperature of approximately 400 °C and apressure of approximately 40 bar.
The temperature of the water returning to the boil-er (feed water) is maintained at a minimum of 125 to130 °C to limit the risk of low temperature corrosion inthe coldest part of the boiler.
The Steam CircuitThe energy recovery from a steam-producing boiler isconventionally known as the Rankine process. TheRankine process allows energy outputs in the form ofpower, steam, and combinations of power, steam, andhot water.
62 Municipal Solid Waste Incineration
Steam Boiler Steam Boiler
Boiler
Feed water pump
~Turbine Generator
Condenser
Feed water tank
Flue gas
District heatingwater or cooling
Process steam
Figure 3.2 The Rankine process

Energy Recovery 63
The energy from the hot flue gases is recoveredthrough the boiler and passed to the internal circuit ofsteam.
The steam energy may be converted to power by aturbine and generator set. The superheated and high-pressurized steam from the boiler expands in the steamturbine, which transforms the energy content of thesteam to kinematic energy, which is further trans-formed to electrical energy by the generator.
The excess heat of the low-pressure steam is con-verted to hot water within the heat exchanger (con-denser) and either passed to a district heating networkor cooled away.
Steam ApplicationElectrical Power Generation OnlyWhen producing electrical power only, it is possible torecover up to 35 percent of the available energy in thewaste as power. The surplus heat has to be cooled in acondenser or a cooling tower.
This option is attractive ifthe plant is situated far fromconsumers who demand orindustries that require processsteam.
When only power is pro-duced, a fully condensing tur-bine is used. The excess heat isproduced at such a low temperature in this condenserthat it is not attractive for recovery. The cooling medi-um is usually seawater or air.
Combined Heat and Power GenerationWhen producing a combination of heat and power, itis possible to use up to 85 per-cent of the energy of the waste.With a boiler designed for wasteincineration (moderate steamparameters), an output of elec-tricity of 20 to 25 percent andan output of heat of 65 to 60percent can be achieved.
When a combination ofpower and district heating isproduced, a so-called back pres-
sure turbine is used. The back pressure is determinedby the temperature and the flow of the coolant,which is usually water from a district heating net-work.
Combined Process Steam and Power GenerationWhen producing both process steam and power, theelectrical output may be foundsomewhere between the valuesfor power production only andcombined heat and power pro-duction—that is, between 35and 20 percent, depending onthe amount of process steamextracted from the turbine.
During this process, a mini-mum amount of the steam hasto pass all the way through theturbine. This means that at least10 percent of the low pressuresteam has to be cooled away.
When power and process steam are produced, anextraction turbine is used, which combines the twoaforementioned concepts. It may be operated as a fullycondensing turbine cooled by seawater or air and then,when needed, steam can be extracted from a bleed inthe turbine at relevant parameters (pressure and tem-perature).
To prevent extensive heat loss and avoid expensivepipelines, the industries that need process steamshould be located near the plant.
Table 3.2 Steam parameters for process steam in variousindustries
Industry Steam temperature
Breweries 150 to 250 °C Chemical industries 200 to 500 °C Sugar production 100 to 200 °C Paper industries 100 to 300 °C Wood industries 100 to 200 °C Concrete elements,
cement production 120 to 150 °C Absorption cooling 150 to 200 °C Food industries 150 to 200 °C Drying purposes
(e.g., sludge drying) 150 to 200 °C
Power Only
Combined Heat and Power
Combined Steamand Power

Energy Recovery Systems OverviewDiagram 3.1 gives an overview of equipment andprocesses for feasible energy recovery systems of MSWincineration facilities. It presents applicable combina-
tions of waste pretreatment, furnace type, boiler, andenergy recovery equipment. The diagram further com-pares the efficiency of energy recovery depending onend usage.
64 Municipal Solid Waste Incineration
80%
80%
35%
75%
35–75%
20–25%
65–60%
0%
0-35%
80%
80%
35%
85%
0%
Fine ManualSorting
AutomaticSorting
Coarse MechanicalSorting
No Sorting
Mixing
Shredding
Moving Grate
Rotary Kiln
Fluidized Bed
Hot Water Boiler
Heat Only
Cooling TowerCondensing SteamTurbine
Back PressureTurbine
Condensing HeatExchanger
Combined Heatand Power
ExtractionTurbine
LP Steam Boiler
Steam Boiler
No Recovery
Power Only
Heat Exchangers
Steam Only
Combined Steamand Power
Sorting Homogenization Furnace Boiler Power Generation Heat Production End Use Recovery
EfficiencyEnergy ProductionIncinerationPretreatment EnergyRecovery
OverallRecovery
Diagram 3.1 Technological Overview

Key Issues
Incinerating MSW generates large volumes of flue gases.The flue gases carry residues from incomplete combus-tion and a wide range of harmful pollutants. The pollu-tants and their concentration depend on the compositionof the waste incinerated and the combustion conditions.However, these gases always carry ash, heavy metals, anda variety of organic and inorganic compounds.
The pollutants are present as particles (dust) andgases such as HCl, HF, and SO2. Some harmful com-pounds such as mercury, dioxins, and NOx can be fullyremoved only through advanced and costly chemicaltreatment technologies.
Primary and secondary measures can help reduceemission of pollutants.
Primary measures—which are initiatives that actu-ally hinder the formation of pollutants, especially NOxand organic compositions such as dioxins—must beapplied as much as possible. Primary measures com-prise an efficient combustion process (long flue gasretention time at high temperature with an appropri-ate oxygen content, intensive mixing and recirculationof flue gases, and so forth—as discussed in theIncineration Technology chapter), preprecipitation ofashes in the boiler, and short flue gas retention time atintermediate temperatures. The content of CO andTOC (total organic carbon excluding CO) in the rawflue gas before inlet to the cleaning system is a goodindicator of the efficiency of the combustion process.
The air pollution control (APC) system compriseselectrostatic precipitators; bag house filters; dry, semi-dry, and wet acid gas removal systems; catalysts; and thelike. Some characteristics of the secondary measures
are that they precipitate, adsorb, absorb, or transformthe pollutants.
The selection of the APC system depends primarilyon the actual emission limits or standards, if any, andthe desired emission level. In this context, the differentAPC systems can be grouped as basic, medium, oradvanced emission control.
Basic emission control, which involves only reduc-ing the particulate matter, is simple to operate andmaintain, and the investment is minimal. At the sametime, a significant part of the most harmful substancesis also retained because dust particles (fly ash) and pol-lutants adsorbed on the surface of the particles can beremoved in efficient dust removal equipment like elec-trostatic precipitators. Basic emission control is a min-imum requirement.
When moving from basic to medium or advancedemission control, the increased efficiency must be eval-uated in the light of factors such as the increased com-plexity, the amount and types of residues, the invest-ment, and operating cost. The state-of-the-art flue gascleaning systems (advanced emission control)—applied in Europe and the United States—are quitecomplex, and the benefits in terms of reduced emissionsshould always be compared to other emission sources.
The figures in the APC Systems Overview show themost common flue gas cleaning techniques, possiblecombinations thereof, and the resulting emission ofpollutants.
Flue gas treatment generates residues in the form ofpartly soluble dry products or, if a wet system isapplied, of salty waste water requiring advanced treat-ment before being discharged to a recipient or even amunicipal sewage treatment facility.
65
4 Air Pollution Control

Key Criteria✓ ✓ ✓ The furnace must be designed for stable and
continuous operation and complete burn-out of the waste and flue gases (CO<50mg/Nm3, TOC<10 mg/Nm3).
✓ ✓ ✓ The flue gases from the furnace must becooled to 200 °C or lower in a boiler beforeflue gas treatment technology can beapplied.
✓ ✓ ✓ The flue gas treatment installation must becapable of removing dust at least as effi-ciently as a two-stage electrostatic precipita-tor (basic emission control, dust<30mg/Nm3).
✓ ✓ ✓ A controlled and well-operated landfillmust be available for residue disposal.
✓ Elimination of hydrogen chloride (HCl)from the flue gases should be considered.
Volume and Composition of the Flue Gas
As a rule of thumb, all fuels may be assumed to producea dry, stoichiometric flue gas quantity of 0.25 Nm3 perMJ. Stoichiometric means that the fuel is burned com-pletely with just the quantity of air needed for combus-tion. Consequently, the oxygen content in the resultingflue gas is zero. Moreover, the volume of the water vaporformed during the combustion is deducted.
The actual flue gas flow rate may be estimatedaccording to the formulas in box 4.1.
• Particulate pollutants: Fly ash, including the heavymetals of antimony (Sb), arsenic (As), cadmium(Cd), chromium (Cr), cobalt (Co), copper (Cu),lead (Pb), manganese (Mn), mercury (Hg), nickel(Ni), thallium (Tl), and vanadium (V).
• Gaseous pollutants: Hydrogen chloride (HCl),mainly from the combustion of PVC; sulfur dioxide(SO2) from combustion of sulfurous compounds;hydrogen fluoride (HF) from combustion of fluo-
66 Municipal Solid Waste Incineration
Box 4.1 Flue gas volumes
Calorific value: Hinf [MJ/kg]
Stoichiometric flue gas volume: Hinf x 0.25 [Nm3/kg] (dry, 0% O2)
Dry flue gas at y % O2: Hinf x 0.25 x (21/(21—y)) [Nm3/kg]
Wet flue gas at z % H2O: Hinf x 5.25 /(21—y) x (100/(100—z)) [Nm3/kg]
Actual flue gas volume at t ˚C: Hinf x 525 /(21—y) / (100—z) x (273 + t)/273 ≅
(273 + t)2Hinf
(21 – y) (11 – z); [m3/kg]
Example:Calorific value Hinf =8 MJ/kg, oxygen content y =11%, water vapor content z =15%, flue gas temperature t = 100 ˚C :
(273 + 100)Actual flue gas volume 2 x 8
(21 – 11) (100 – 15)≅ 7.0 ; [m3/kg]

rine compounds; and nitrogen oxides (NOx) frompart of the nitrogen in the waste and N2 in the air.
Some of the heavy metals evaporate in the combus-tion process, then condense to a varying degree on thesurface of the fly ash particles in the boiler section. Atthe exit of the boiler, part of each individual metal (par-ticularly Hg) may remain gaseous.
Table 4.2 shows international typical data on thecontent of pollutants in the raw flue gas from wasteincineration.
Environmental Standards
Different countries adhere to different environmentalstandards, including standards for emissions to theatmosphere. Such standards may be based on air qual-ity considerations only, in which case the air pollutionproblems are solved primarily by building tall stacks.
Other countries have emission standards that reflecteither what is deemed technically and economicallyfeasible in that country or what is considered state-of-the-art within emission control technology. But veryoften, countries where waste incineration is not com-mon have no emission standards that can be useddirectly. In this case, the emission limits must be fixedbased on an evaluation of other sources, an environ-mental assessment, and the complexity of the resultingAPC system.
Table 4.1 Emission control levels
Emission control-level parameters controlled
Basic Particles only—e.g., < 30 mg/Nm3.Medium Same standard for particle emission.
Additional standards for HCl, HF, SO2, and the heavy metals As, Cd, Cr, Cu, Pb, Mn, Hg,and Ni.
Advanced State-of-the-art emission control. Stricter standards for the medium-level parameters and supplementary control of NOx, the metals Sb, Co, Tl, and V, and dioxins.
The corresponding emission standards to be met arelisted in Table 4.2.
Emission standards are usually expressed in units ofconcentration—for example, in milligrams of the indi-vidual pollutant per cubic meter of flue gas. Since theflue gas volume varies with the composition, pressure,and temperature of the gas, the volume must relate toa reference or standard condition.
For waste incineration, the standard condition ismost often 0 °C (= 273 K), 101.3 kPa (= ~ 1 Atm.), 0%H2O, 11% O2. This standard condition is usedthroughout this report. Volumes corrected to 0 °C and101.3 kPa are named Standard or Normal cubic meters= Nm3.
The requirements for basic air emission control maybe met by a two-stage electrostatic precipitator (ESP).The ESP removes the dust physically in a dry state. Themedium and advanced levels may be fulfilled by eitherdry or a combination of dry and wet chemical methodsyielding dry solids and liquid waste streams, respec-tively.
The waste water from wet flue gas cleaning must betreated at the site in accordance with the local wastewater standards before being discharged to a sewer ordirectly into the final recipient. The presence of smallconcentrations of toxic materials in the salty wastewater requires sophisticated chemical treatment tech-nology to meet common standards. Additional solid
Air Pollution Control 67
Table 4.2 Raw flue gas concentrations and emission standards (mg/Nm3, dry, 11% O2)
Raw Emission standard Parameter flue gas Basic Medium Advanced
Particles 2000 30 30 10HCl 600 n.a. 50 10HF 5 n.a. 2 1SO2 250 n.a. 300 50NOx (as NO2) 350a n.a. n.a. 200Hg 0.3 n.a. n.a. 0.05Hg + Cd 1.8 n.a. 0.2 n.a.Cd + Tl 1.6 n.a. n.a. 0.05Ni + As 1,3 n.a. 1 n.a.Pb +Cr +Cu +Mn 50 n.a. 5 n.a.Sb +As +Pb +Cr
+Co +Cu +Mn +Ni +V 60 n.a. n.a. 0.5
Dioxinsb 3 n.a. n.a. 0.1
n.a.—Not applicable in the particular standard.a. Without any primary measures.b. Polychlorinated para-dibenzoe dioxins and furans, ng/Nm3 2,3,7,8-TCDD equivalents.

residues are formed during the waste water treatmentprocess.
The solid residues from the flue gas and water treat-ment processes are normally useless and must be land-filled, where they are exposed to rain water. The residuesare susceptible to a degree of leaching, depending onwhich flue gas treatment process was used. Therefore,the landfill must be located and designed with a view topreventing the leachate from polluting valuable groundwater reservoirs and any nearby surface water bodies.Some countries have design standards or minimumrequirements for landfills.
Properly designed controlled landfills for flue gasresidues include drainage systems for leachate collec-tion and treatment. The treatment facility will be sim-ilar to what is required at the incineration plant itself.
Because advanced flue gas treatment residues aresoluble, they should be disposed of where there is norisk of polluting ground water aquifers—for example,in old mines.
Air Pollution Control Technology
Basic Emission ControlIn basic emission control, only the particulate matter isreduced. The recommended emission limit value is 30mg/Nm3. The following types of particle or dust col-
lectors are commonly available, but only electrostaticprecipitators and fabric filters can meet the require-ments when applied alone:
• Mechanical collectors (cyclones and multi-cyclones)
• Wet scrubbers (such as Venturi scrubbers) • Fabric filters (bag house filters) • Electrostatic precipitators (ESPs)
Mechanical collectors (such as the cyclone) do noteffectively reduce the dust content of the flue gas to 150mg/Nm3 or below. Consequently, they are of interestonly as a component of a more advanced flue gas treat-ment system or as a secondary dust arrestor at hoppersand similar installations.
Wet scrubbers (Venturi scrubbers) and electric pre-cipitators) can be designed to fulfill a specified emis-sion limit value—for example, 100 mg/Nm3. Scrubbersare not practical as the first or only air pollution con-trol device, however, as the water applied will alsoremove most of the HCl present in the flue gas.Consequently, it will produce a dust laden corrosivewaste water stream with a pH value around 0.
Fabric filters inherently have a high cleaning effi-ciency, and—whether required or not—they willremove the particles to about 10 mg/Nm3. However,fabric filters working directly on the gases from the
68 Municipal Solid Waste Incineration
Box 4.2 Cyclone
Application • Dust collector
Emission level • 500 mg/Nm3
Advantages • Simple and robust• Inexpensive initial cost• Low operating and maintenance costs
Disadvantages • Efficiency too low with fine particles• Prone to wear
Working principle: The dust-laden gas enters tangentially and is brought to rotate. Centrifugal forces cause the dust particles to impinge on the wall and fall into the conical bottom, where they are removed. The treated flue gas leaves through the central outlet.
Box 4.3 Venturi scrubber
Application • Dust collector
Emission level • About 100 mg/Nm3,depending on design
Advantages • Inexpensive investment
Disadvantages • High operating and maintenance costs
• Prone to corrosion• Produces salty waste water
Working principle: The dust-laden gas accelerates through athroat (a Venturi), atomizing the water injected. The waterdroplets collect the dust particles, and the droplets are sub-sequently precipitated in something like a cyclonic settlingchamber.
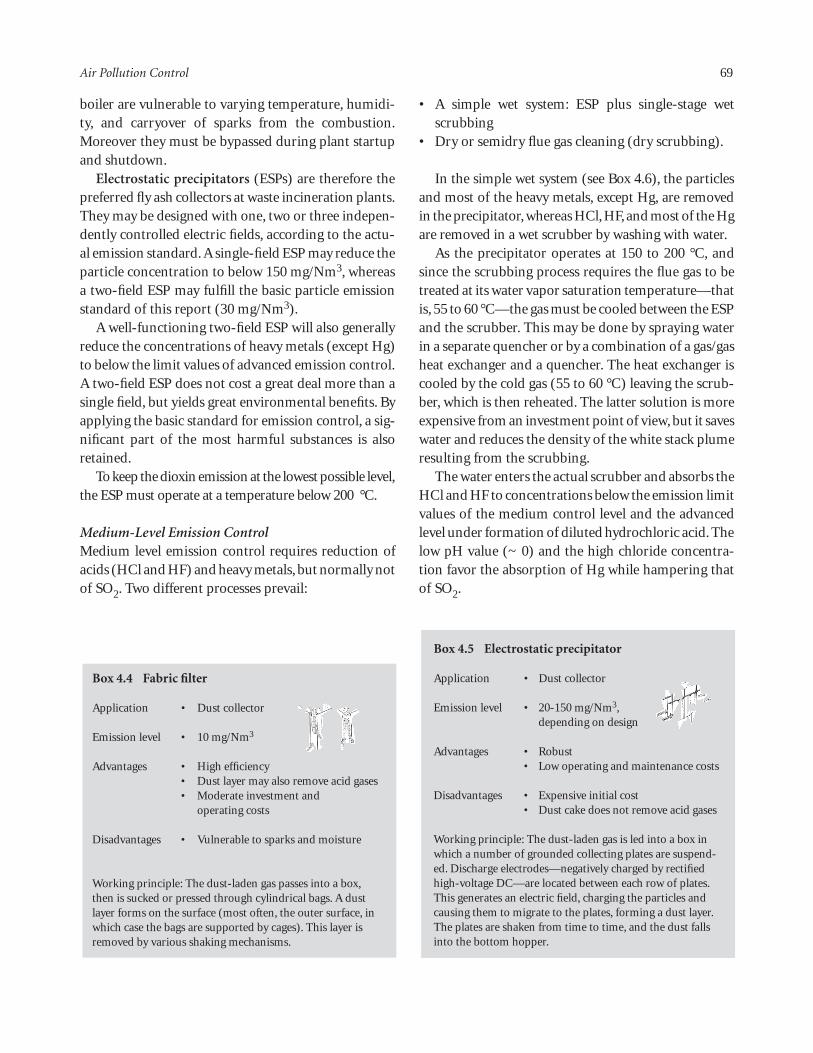
boiler are vulnerable to varying temperature, humidi-ty, and carryover of sparks from the combustion.Moreover they must be bypassed during plant startupand shutdown.
Electrostatic precipitators (ESPs) are therefore thepreferred fly ash collectors at waste incineration plants.They may be designed with one, two or three indepen-dently controlled electric fields, according to the actu-al emission standard. A single-field ESP may reduce theparticle concentration to below 150 mg/Nm3, whereasa two-field ESP may fulfill the basic particle emissionstandard of this report (30 mg/Nm3).
A well-functioning two-field ESP will also generallyreduce the concentrations of heavy metals (except Hg)to below the limit values of advanced emission control.A two-field ESP does not cost a great deal more than asingle field, but yields great environmental benefits. Byapplying the basic standard for emission control, a sig-nificant part of the most harmful substances is alsoretained.
To keep the dioxin emission at the lowest possible level,the ESP must operate at a temperature below 200 °C.
Medium-Level Emission Control Medium level emission control requires reduction ofacids (HCl and HF) and heavy metals, but normally notof SO2. Two different processes prevail:
• A simple wet system: ESP plus single-stage wetscrubbing
• Dry or semidry flue gas cleaning (dry scrubbing).
In the simple wet system (see Box 4.6), the particlesand most of the heavy metals, except Hg, are removedin the precipitator, whereas HCl, HF, and most of the Hgare removed in a wet scrubber by washing with water.
As the precipitator operates at 150 to 200 °C, andsince the scrubbing process requires the flue gas to betreated at its water vapor saturation temperature—thatis, 55 to 60 °C—the gas must be cooled between the ESPand the scrubber. This may be done by spraying waterin a separate quencher or by a combination of a gas/gasheat exchanger and a quencher. The heat exchanger iscooled by the cold gas (55 to 60 °C) leaving the scrub-ber, which is then reheated. The latter solution is moreexpensive from an investment point of view, but it saveswater and reduces the density of the white stack plumeresulting from the scrubbing.
The water enters the actual scrubber and absorbs theHCl and HF to concentrations below the emission limitvalues of the medium control level and the advancedlevel under formation of diluted hydrochloric acid. Thelow pH value (~ 0) and the high chloride concentra-tion favor the absorption of Hg while hampering thatof SO2.
Air Pollution Control 69
Box 4.4 Fabric filter
Application • Dust collector
Emission level • 10 mg/Nm3
Advantages • High efficiency• Dust layer may also remove acid gases• Moderate investment and
operating costs
Disadvantages • Vulnerable to sparks and moisture
Working principle: The dust-laden gas passes into a box,then is sucked or pressed through cylindrical bags. A dustlayer forms on the surface (most often, the outer surface, inwhich case the bags are supported by cages). This layer isremoved by various shaking mechanisms.
Box 4.5 Electrostatic precipitator
Application • Dust collector
Emission level • 20-150 mg/Nm3,depending on design
Advantages • Robust• Low operating and maintenance costs
Disadvantages • Expensive initial cost• Dust cake does not remove acid gases
Working principle: The dust-laden gas is led into a box inwhich a number of grounded collecting plates are suspend-ed. Discharge electrodes—negatively charged by rectifiedhigh-voltage DC—are located between each row of plates.This generates an electric field, charging the particles andcausing them to migrate to the plates, forming a dust layer.The plates are shaken from time to time, and the dust fallsinto the bottom hopper.

The water is recirculated until a certain chloridelevel is achieved, then it is passed on to the quencher.The chloride content is concentrated because of theevaporation. A constant bleed-off maintains thechloride concentration in the quencher and controlsthe addition of fresh water into the HCl scrubber.
The bleed-off contains the HCl, HF, and heavymetals removed in the scrubbing process. This efflu-ent must be neutralized—for example, by calcium
carbonate (CaCO3) to pH 2.5 and further to pH 8 to9 by hydrated lime (Ca(OH)2) or sodium hydroxide(NaOH). At pH 8 to 9, the heavy metals precipi-tate—Hg, however, only at the expense of a separatechemical, TMT 15—and are removed as a thinsludge (approximately 10 percent dry substance).This may either be further dewatered in a filter pressor used as it is for humidifying the fly ash from theESP.
70 Municipal Solid Waste Incineration
Box 4.6 Simple wet system
Application • Removal of particles, HCl, HF, and heavy metals
Efficiency • Medium control level
Legend:1. Furnace 2. Slag removal3. Boiler 4. ESP5. Quencher 6. Scrubber7. Stack
Advantages • Low consumption of chemicals• Most of the HCl neutralized with inexpensive CaCO3• Little formation of solid residues
Disadvantages • Waste water discharge• Risk of corrosion• Quencher and scrubber, and—if there is no reheating—ID fan and stack
pipe to be made of or lined with corrosion-resistant materials (plastics and rubber)• Dense white plume (if no reheating)

The treated water is discharged. It is essentially asolution of calcium chloride (CaCl2). Consequently, inthis process, the HCl removed leaves the incinerationplant with the waste water.
Dry and semidry flue gas cleaning systems (seeboxes 4.7 and 4.8) are very similar concepts. In bothsystems, the acid gases react with hydrated lime(Ca(OH)2). In this process, the gases are converted tosolid substances: calcium chloride, calcium sulfite/sul-
fate (CaSO3/CaSO4), and calcium fluoride (CaF2). Thereaction products are precipitated in a subsequent baghouse filter.
The difference between the two systems is that indry flue gas cleaning, the lime is injected in a solidform, whereas in semidry flue gas cleaning it is inject-ed in the form of an aqueous suspension. In dry sys-tems, water is sometimes also injected, althoughthrough separate nozzles. The water has a twofold pos-
Air Pollution Control 71
Box 4.7 Dry system
Application • Removal of particles, HCl, HF, and heavy metals
Efficiency • Medium control level
Legend:1. Furnace 2. Slag removal3. Boiler 4. Reactor5. Bag house filter 6. Stack
Advantages • No waste water• Less prone to corrosion• May be fairly easily adjusted to fulfill the requirements of the advanced
control level• Only visible plume in very cold weather
Disadvantages • Higher consumption of chemicals• Uses the relatively expensive Ca(OH)2• More solid residues• In medium control level, the SO2 concentration is also reduced

itive effect. It cools the flue gas, which in itselfenhances the reactions, and the increased concentra-tion of water vapor also favors the reactions. As theresulting CaCl2 is very hygroscopic (water absorbing),the flue gas temperature cannot, however, be reducedto less than 130° to 140°C, lest difficulties in the han-dling of the residue arise.
At this temperature, addition of lime in comparisonwith the stoichiometrically required consumption isnecessary, primarily in connection with dry flue gascleaning. The excess amount of lime then becomes partof the residue. It is standard to recirculate some of the
residue and lock out the rest to increase the use of thelime.
Ca(OH)2 is produced by slaking burned lime, CaO(which is in turn produced from limestone, CaCO3).In semidry flue gas cleaning, CaO can therefore bepurchased instead of Ca(OH)2, and the slaking/sus-pension can be carried out on the site in a singleprocess.
This solution may be economically attractivebecause CaO is less expensive than Ca(OH)2 andbecause a greater amount of the active component, Ca,is produced per metric ton of lime. On the other hand,
72 Municipal Solid Waste Incineration
Box 4.8 Semidry system with dioxin removal and SCR
Application • Removal of particles, HCl, HF, SO2, NOx, dioxins, and metals
Efficiency • Advanced control level
Legend:1. Furnace 2. Slag removal 3. Boiler4. Semidry reactor 5. Carbon injection 6. Bag house filter7. Heat exchanger 8. SCR 9. Stack
Advantages • No waste water• Less prone to corrosion• No visible plume
Disadvantages • Expensive NOx removal process• High consumption of chemicals and energy• More solid residues• Dioxins only adsorbed, not destroyed

a semidry system is usually more expensive than a drysystem.
The reactions between lime and the acid gases arenot affected by the simultaneous presence of fly ash.Therefore, the usual practice is to precipitate the ashtogether with the reaction products in the bag housefilter. This also removes the heavy metals, including Cd,to the emission limits of the advanced control level—except for Hg, which is just removed to fulfill the Cdplus Hg limit value of the medium level.
The process does not result in any effluent.Consequently, dry and semidry systems are less compli-cated than wet systems and require smaller investments.
Advanced Emission Control The emission limit values of the advanced control levelmay also be met by:
• Dry and semidry systems with increased consump-tion of chemicals
• Advanced wet systems combining ESP, gas/gas heatexchanger, two-stage scrubbing, and bag house filter.
In addition, NOx must be removed in a NOx reduc-tion system.
The treatment efficiencies of dry and semidry sys-tems towards HCl, HF, and SO2 depend on the additionof chemicals. Increasing the consumption of lime canhelp meet the emission limit values of the advancedcontrol level to these three pollutants. A completely drysystem will, however, need lime in excessive quantities.The Hg and dioxin limits may be fulfilled by addingactivated carbon to the lime.
The increased consumption of chemicals increasesthe production of residues correspondingly.
The advanced wet system differs from the simplesystems because it has an additional wet scrubber inwhich SO2 is reduced by reaction with a NaOH solu-tion or a CaCO3 suspension. Due to the excess oxygenin the flue gas, the reaction products are a sodium sul-fate (Na2SO4) solution and a gypsum (CaSO4,2H2O)suspension, respectively.
If NaOH is applied, the scrubber system must havean additional water treatment plant in which the sul-fate ions of the Na2SO4 solution are precipitated as
gypsum by Ca ions—for example, by mixing in theCaCl2 solution from the treatment of the water fromthe HCl removal. If CaCO3 is used, the gypsum isformed directly and may be removed as a sludge by set-tling or in a hydrocyclone and dewatered.
The gas from the SO2 scrubber is reheated in the gasor gas heat exchanger and led to a bag house filter. Beforethis, activated carbon or a mixture of lime and activatedcarbon is injected into the duct. Thus, the bags are pow-dered, and when the gas penetrates them, Hg and diox-ins are removed to concentrations below the limit valuesof the advanced control level. In addition, dust, HCl, HF,SO2, and the other heavy metals are further reduced.
None of these processes, however, has any effect onNOx. This constituent should first be controlled by pri-mary measures such as flue gas recirculation (see thechapter on Incineration Technology).
NOx may be further controlled by injection ofammonia (NH3), which selectively reduces NOx to freenitrogen and water vapor. Both of these gases are harm-less and leave the plant through the stack.
Two process variants are available: selective noncat-alytic reduction (SNCR) and selective catalytic reduc-tion (SCR). The chemical reactions are the same, butthe former requires a temperature around 900°C, whilethe latter is effective down to some 250°C. The SNCRrequires NH3 to be added in excess of the stoichiomet-ric consumption, whereas SCR may be run at stoichio-metric conditions.
Accordingly, SNCR is applied in the after-burningchamber of the furnace simply by injecting the NH3.Thesurplus NH3 passes with the flue gas to the air pollutioncontrol system. If this is wet, the surplus is quantitative-ly removed as ammonium chloride (NH4Cl), in the HClscrubber and is discharged with the treated waste water.
Dry and semidry flue gas treatment does not havethe same capacity to remove NH3. Therefore, a SCRsystem tends to be the best choice.
TheSCRprocessisusuallyappliedafterthewetscrub-bers, or after a dioxin filter in a wet system and after thebaghousefilter indryandsemidrysystems,respectively.Thisrequires thegas tobereheatedbyheatexchangeanda clean fossil fuel. Consequently, the SCR process isexpensive,both in investment and operating costs.
Box 4.8 shows a semidry system with SCR, and Box4.9 shows an advanced wet system with SNCR. Both
Air Pollution Control 73

may fulfill all of the emission limit values of theadvanced control level.
APC Systems Overview
Simplified diagrams for the various APC systems arepresented on the next few pages. They indicate the unitprocesses involved in obtaining basic, medium, andadvance air pollution control. The emitted fraction ofkey pollutants is indicated in bar charts.
Induced Draught Fan and Stack
An induced draught fan is needed to overcome thepressure drop across the flue gas treatment system andmaintain a certain underpressure in the furnace. Thisis normally placed at the rear of the flue gas treatmenttrain and is furnished with a silencer.
The flue gas is then passed into the stack, which mustbe of a certain height—depending on the emissioncontrol level applied and other factors (see the chapteron Environmental Impact and Occupational Health).
74 Municipal Solid Waste Incineration
Box 4.9 Advanced wet system with SNCR, limestone scrubber, and dioxin filter
Application • Removal of particles, HCl, HF, SO2, NOx, dioxins, and metals
Efficiency • Advanced control level
Legend:1. Furnace 2. Slag removal 3. Ammonia injection4. Boiler 5. ESP 6. Quencher7. Acid scrubber 8. Limestone scrubber 9. Adsorbent injection
10. Bag house filter 11. Stack
Advantages • Nearly stoichiometric consumption of chemicals• Inexpensive NOx removal process• SO2 removed with cheap CaCO3• Dioxins destroyed
Disadvantages • Expensive in investment costs• Waste water discharge (incl. NH4
+)• Quencher and scrubbers to be made of plastics• White plume in cold, humid weather

* Located in the After-Burning Chamber in the Boiler
Furnace/Boiler HCI, HF, SO2, and Heavy Metals NOx EmissionsDioxinsParticle/Dust
CollectorControl
Level
Basic
Basic
Medium
Medium
Medium
Medium
SCR
Dioxin Filter
2nd-StageScrubbing
1st-StageScrubbingESPFurnace/Boiler
Advanced
Figure 4.1 Wet air pollution control system with dioxin control
Air Pollution Control 75

Figure 4.2 Dry air pollution control system for incinerators
Furnace/Boiler Particle/DustCollector
HCI, HF, SO2,Heavy Metals and Dioxins
NOx Emissions ControlLevel
Furnace/Boiler
Furnace/Boiler
SemidrySeparator
Dry Separation Fabric Filter
SCR
Advanced
Medium
Medium
None
Fabric Filter withActivated Charcoal
DUST
HCI
SO2
NOx
HEAV
YM
ETAL
Ss
HF Hg DIOX
IN
DUST
HCI
SO2
NOx
HEAV
YM
ETAL
Ss
HF Hg DIOX
IN
DUST
HCI
SO2
NOx
HEAV
YM
ETAL
Ss
HF Hg DIOX
IN
DUST
HCI
SO2
NOx
HEAV
YM
ETAL
Ss
HF Hg DIOX
IN
100
75
50
25
0
100
75
50
25
0
100
75
50
25
0
100
75
50
25
0
76 Municipal Solid Waste Incineration

Key Issues
During the incineration process, most of the waste iscombusted and converted to harmless gases such ascarbon dioxide (CO2) and water vapor (H2O). Thesegases are discharged as a flue gas into the atmospherethrough the stack of the plant, together with surplusoxygen and the nitrogen of the combustion air. Inaddition, the flue gas contains various air pollutingcompounds, the concentration of which must bereduced (as explained in the chapter on Air PollutionControl).
However, part of the waste is incombustible and isremoved from the incineration furnace as slag, a solidresidue. The flue gas cleaning processes also produceresidues, either directly or by the subsequent treatmentof the spent scrubbing liquids, depending on the fluegas cleaning method applied.
Depending on the local circumstances, some of theslag may be used or recycled, but the flue gas treatmentresidues are normally useless and must be landfilled.
Landfilled materials are exposed to precipitation,which may dissolve the soluble components of the prod-ucts.Consequently, landfills for incinerator residues mustbe located, designed, and operated with consideration ofthe leaching properties of the individual residues.
Key Criteria✓ ✓ ✓ A controlled and well-operated landfill
must be available for residue disposal. Thelandfill must be large enough to receive theentire quantity of solid residual productsgenerated at the incineration plant
✓ ✓ ✓ The landfill must be located, designed, andoperated in such a way as to prevent water
pollution resulting from the leachate fromthe residues
✓ Scrap iron may be recovered for recycling bymagnetic separation of the slag
✓ By sorting or sieving the slag, a “syntheticgravel” fraction may be recovered for uti-lization.
✓ The dry residues should be prevented fromgenerating dust at the landfill site.
Slag
Formation and CompositionThe major waste product stream from incineration isthe slag (sometimes called bottom ash or clinker). Itamounts to 20 to 25 percent by weight of the wastecombusted (or more, if there is a high amount of ashor other noncombustible material in the waste), butonly to 5 to 10 percent by volume. Its main componentsare metals, glass, and mineral constituents of the waste,but some salts—particularly sodium chloride(NaCl)—may also be found. For additional informa-tion, see Table 5.1.
Ideally, the loss of ignition (LOI) at 550 oC of the slagshould be 0, but—depending on the combustion condi-tions (for example, grate length and waste-loading fac-tor)—LOIs of 2 to 5 percent by weight are common. TheLOI is mainly incompletely burned organic material.
The grain size distribution of the slag ranges fromabout 1 mm to the largest waste components (such asdiscarded refrigerators), which can be fed into the fur-nace.
77
5 Incineration Residues

RemovalThe slag is removed from the rear end of the grate bygravity, and normally falls into a water bath, which coolsthe slag. Some of the water evaporates and must bereplaced by fresh water to maintain the water level in thedeslagger. Thus, it is possible to operate this removalprocess in such a way that there is no waste waterstream. It may, however, be advantageous to wash theslag with more water, as this may dissolve and removesome of the salt. The spent water may then be used in amedium or advanced flue gas treatment process.
DisposalThe main disposal method is landfilling. The slag mayeither be landfilled as it is or pretreated in one of anumber of ways, depending on the requirements andthe degree of environmental control measures taken atthe landfill.
Pretreatment could be done through the washingprocess or various sorting processes. It is possible to usemagnets to recover the iron content of the slag, whichmay be sold or delivered to a steelworks. A sievingprocess can recover a gravel size fraction, which may beused as a road base material. Recovery and use of these
fractions reduce the amount to be landfilled and, thus,require less landfill capacity.
Normally, however, utilization possibilities developslowly, and it is advisable to have a landfill capacity cor-responding to the total slag quantity available beforecommissioning a new incineration plant.
When placing or using the slag in the natural envi-ronment it is, of course, important to prevent it frompolluting water bodies like ground or surface waterreservoirs. Thus, its leaching properties and especiallythe salt content must be considered.
Grate Siftings
A small part of the waste—0.1 to 2 percent, dependingon the grate design—is able to penetrate the primaryair openings of the grate elements and collects under-neath the grate. The material normally consists of veryfine particles and of molten plastics and metals with alow melting point—for example, lead (Pb).
In most cases, the material is mixed into the slag, butoccasionally it is re-introduced into the incineratorfurnace. Thus, the grate siftings are only seldom
78 Municipal Solid Waste Incineration
Table 5.1 Chemical composition of incinerator residues, indicative
Dry/semidry Wet plus Element Unit Slag Fly Ash plus fly ash fly ash
O g/kg 450 — — —Si g/kg 250 150 75 80Ca g/kg 75 100 250 150Fe g/kg 75 25 15 50Al g/kg 50 70 25 30C g/kg 50 — — —
Na g/kg 25 30 15 2K g/kg 15 35 25 5
Mg g/kg 10 15 10 75S g/kg 5 25 15 5
Cu g/kg 3 1.2 0.7 1.2Zn g/kg 2.5 30 15 30Cl g/kg 2 75 200 35Pb g/kg 1.5 10 10 10F mg/kg 500 — — —
Cr mg/kg 350 650 200 250Ni mg/kg 250 150 100 60As mg/kg 15 150 175 90Cd mg/kg 1.5 400 300 650Hg mg/kg 0.05 8 15 650

removed from the plant as a separate residue stream,but in this event the disposal method is landfilling.
Boiler and Fly Ash
Formation and CompositionThe finest, incombustible particles of the waste incin-erated pass with the flue gas out of the furnace and intothe boiler. Since the flue gas velocity in the boiler islower than in the furnace, some of the particles settle asboiler ash and are removed from the bottom hoppersof the boiler.
The finest particles, however, pass on to the flue gastreatment installation. When the flue gas cools in theboiler, various gaseous compounds—for example,evaporated heavy metals and their compounds, includ-ing zinc, lead, and cadmium chloride (ZnCl2, PbCl2and CdCl2), formed from hydrogen chloride (HCl) inthe flue gas—condense on the particles to form fly ash.
The fly ash is either collected alone, perhaps in anESP, or together with the reaction products of dry orsemidry flue gas treatment processes (see the chapteron Air Pollution Control). In either case, it is mostcommon to mix the boiler ash into the fly ash or thereaction product stream. This section considers themixture of boiler ash and fly ash.
This mixture amounts to 2 to 3 percent by weight ofthe original waste. It consists of inert, mineral particles,variably soluble salts (for example, NaCl), and heavymetal compounds (of which CdCl2 is readily soluble).The grain size is very fine; thus the ash is very dusty. Forfurther information, see Table 5.1.
RemovalThe ash is removed from the bottom hoppers of theboiler and the ESP and is transported in closed con-veyors to something such as a silo. When enough is col-lected, the ash is loaded into a tank truck and hauled toa landfill. Before this, it may be humidified by water orthe fresh sludge from the treatment of spent scrubberliquid to prevent it from generating dust at the landfill.An open truck may be used with slush, if a protectivetarpaulin is applied. Humidification increases theweight by around 30 percent.
Alternatively, the ash may go into big bags in a bigbag station and landfilled without being humidified.
DisposalBecause of its relatively high content of salts and heavymetals, the ash cannot be used for construction pur-poses, and so far, no industrial use is known for it.Consequently, the only disposal method is landfillingunder controlled conditions.
Residues from Dry and Semidry Flue GasTreatment
Formation and CompositionAs explained in the chapter on Air Pollution Control,dryand semidry flue gas treatment converts the acid gases ofHCl, HF and SO2 to the solid compounds CaCl2, CaF2,and CaSO3/CaSO4, respectively, through reaction withlime, Ca(OH)2. The lime must be added in excess.
Consequently, the treatment residue, which is col-lected in a bag filter, contains these compounds; and
Incineration Residues 79
Table 5.2 Maximum leaching of ions from incinerator residues, indicative
Concentration level Slag Fly ash and dry plus semidry product Wet product plus fly ash
Very higha Cl Cl, Ca, Na, K, Pb Cl, Na, KHighb SO4, Na, K, Ca Zn, SO4 SO4, CaMediumc Cu, Mo, Pb Cu, Cd, Cr, Mo MoLowd Mn, Zn, As, Cd, Ni, Se As As, Cr, ZnVery lowe Cr, Hg, Sn Hg Pb, Cd, Cu, Hg
a. Initial Concentration > 10 g/l.b. 0.1—10 g/l.c. 1—100 mg/l.d. 0.01—1 mg/l.e. < 0.01 mg/l.

since the fly ash is normally not collected before thelime injection, the residue also contains the ash. If acti-vated carbon is injected, this material, of course, alsoends up in the product.
The quantity depends mainly on the fly ash forma-tion rate and on the required reduction of the HCl andSO2 concentrations, but it is often 30 to 50 kg per met-ric ton of waste incinerated. See Table 5.1.
RemovalAs CaCl2 is highly hygroscopic and deliquescent attemperatures below 130 °C, the temperature in the baghouse filter should be at least 140 °C. The productshould be removed at once from the bottom hoppersof the bag filter, transported in a closed conveyor toperhaps a big bag station and placed in the bags imme-diately. The big bag station also usually receives theboiler ash.
DisposalThe reaction product is a composite material, and nopractical uses have been found for it. Consequently, itmust be landfilled. The landfill exposes it to rain waterwhich unfortunately dissolves the CaCl2 and to a slight(but important) degree, the surplus Ca(OH)2. The dis-solving Ca(OH)2 creates a pH of the leachate water ofabout 12. At this pH, Pb is readily soluble.Consequently, the leachate is alkaline and polluted byCaCl2 and Pb (see Table 5.2).
It is therefore immensely important that the leachateis kept from dissipating into any drinking waterresource. If possible, the product should be landfilledbelow ground—in an old salt mine or another water-tight cavity.
Sludges from Water Treatment
Formation and CompositionWhen the HCl and SO2 are removed from the flue gasby wet methods, one or two waste water streams areproduced. These must be treated as explained in thechapter on Air Pollution Control.
The treatment of the acid water results in the for-mation of a “hydroxide/TMT” sludge, approximately 1kg DS (dry substance) per metric ton of waste inciner-
ated (see Table 5.1). The raw, thin sludge, whenremoved from the settling tank, usually has a DS con-tent of 8 to 10 percent. Accordingly, it is liquid and easyto pump.
Wet removal of SO2 normally forms a gypsum(CaSO4,2H2O) sludge. The quantity depends on theSO2 removal rate, but a typical figure is 3 kg DS permetric ton of waste incinerated.
RemovalThe sludges may be used as they are for humidifyingthe boiler and fly ash and landfilled together with theseashes. However, as the water in the thin sludge containsCaCl2 in solution, additional chloride is mixed into theash. On the other hand, it is claimed that the leachingproperties of the mixture are better than that of the twoingredients separately.
Alternatively, the two sludges may be dewatered sep-arately or jointly in a filter press, on a vacuum filter, orin a centrifuge.
DisposalThe sludges are normally landfilled, and their leachingproperties are normally far better than those of the dryand semidry treatment residues.
In a few cases, the gypsum is recovered and used forindustrial purposes.
Spent Adsorbent from Dioxin Filters
The spent adsorbents from dioxin filters are usually fedback into the incinerator and combusted, thus destroy-ing the dioxins adsorbed. Or, they can be used to treatthe acid scrubber water ending up in the thin sludge.Consequently, they do not normally constitute a sepa-rate waste product stream to be disposed of outside theplant.
Other Materials
While the residual products are generated and mustbe removed continuously, other waste products areonly removed and disposed of from time to time—including:
80 Municipal Solid Waste Incineration

• Spent catalysts from SCR installations• Spent ion exchange resins from the preparation of
boiler water• Discarded refractory and other materials from
maintenance operations.
These materials are mostly landfilled.
Incineration Residues 81


Key Issues
Efficient and competent operation and maintenanceare the key to applying waste incineration technologysuccessfully and securing the optimum benefit of theinvestments made.
Such operation and maintenance require:
• Well-structured and well-managed plant organization • Trained and skilled employees, managers, and oper-
ating personnel at all levels • A plant economy with sufficient cash flow for procur-
ing local and imported spare parts and consumables• Efficient housekeeping and a clean and safe working
environment • Efficient record keeping, including specifications
and drawings of plant, machines, and other compo-nents; emission data; waste quantities and types;operating data (for example, temperatures, pres-sures, efficiencies, and consumption).
Key Criteria✓ ✓ ✓ Foreign currency is available for purchasing
critical spare parts.
✓ ✓ Skilled plant operation staff are available tothe plant owner at affordable salaries.Otherwise, reliable operation and/or main-tenance contracts must be in place in theform of operation and service contracts.
Typical Plant Organization and Staffing
There are several types of plant organization world-wide. The actual organization should reflect the skills
and capabilities of the employees as well as the pub-lic and legal demands and constraints to be managed.
Incineration plants typically staff 50 to 200 personsdepending on the size of the plant, the effectivenessand skills of its workers, whether subcontractors areused, and the division of responsibilities with otherwaste management organizations.
The actual number and division of departmentsshould be balanced according to the type of assign-ments, the size of the plant, and the number of work-ers. Furthermore, some or all of the operation andmaintenance tasks may be subcontracted to privatecontractors or the original supplier. Hence, the orga-nizational possibilities are manifold.
Ownership and Top ManagementWaste incineration plants are typically owned by oneof the following:
• The municipality/local government or a group ofmunicipalities/local governments
• The county/regional government• Private or public energy companies (for example,
power or district heating companies)• Private investors or a private investment associa-
tion• Suppliers, often in BOO or BOOT (build, own,
operate, transfer) arrangements
For the owners, the most important issues are toensure continued supply of the planned quality andquantity of waste; continued payment of tipping fees,revenues from energy sale and fulfilment of instal-ments on loans; and maintenance of the plant ingood operating conditions under qualified manage-ment.
83
6 Operation and Maintenance

The owners will normally be represented by a boardthat makes all crucial decisions based on sound rec-ommendations of the plant management.
Normally, one managing director will ultimately beresponsible for operating and maintaining the econo-my of the plant. Typically, the managing director will,in cooperation with the board, appoint a technicaldirector and a financial director for the plant’s day-to-day management.
It is important that the management group, whichconsists of the directors, have access to reliable and rel-evant operation and financial data for monitoring theoperation and the financial, technical, and environ-mental performance of the plant each day.
Departments of the PlantTypically, the plant will include the following depart-ments:
• Plant operations • Operation and maintenance • Public relations • Planning and forecasting • Finance • Personnel.
The actual organization, number of depart-ments, staffing, and division of responsibilitiesamong the departments may vary significantly.Also, plant management may choose to subcontractany of the following assignments to private compa-nies:
• Removal and transportation of ash, slag. and otherresidues
• Cleaning and housekeeping• Salary management and payment
84 Municipal Solid Waste Incineration
Financial Director
Technical Director
Economy andFinance
Salaries and Personnel
Plant OperationsOperation and
MaintenancePlanning and
Public Relations
Budgets andForecasts
Salaries Foreman Shift 1 RecordkeepingGuided plant
tours
Billing andClients
Personnel Affairs Foreman Shift 2 Routine O&M Waste Forecasts
Units
Financing Foreman Shift 7 WorkshopsWaste
Management Planning
Board
Board of Directors
Managing Director
Figure 6.1 Typical plant organization chart

• Operation and maintenance of specific units of theplant
• Periodic testing and analysis of effluents and emis-sions
• Specific planning and feasibility studies required forplant development.
Crucial Supplies and External Services
The following supplies and external services are crucialfor continued operation of the incineration plant:
• Continuous and steady high-voltage power supply• Water• Removal of residues (slag, ash and air pollution con-
trol residues)—that is, availability of an engineeredand sanitary landfill for residues
• Availability of spare parts—and sufficient local andforeign currency for purchasing spares
• Availability of consumables (such as lime, oil, andlubricants).
Typically, if the waste does not contain hazardouscompounds, the quality of the slag and ashes will allowfor recycling after sieving—for example, for roadfill.Hence, slag may be transported to a sorting area, reject-ed slag and ashes may be transported to a landfill, andAPC residues may go to secure landfill sections.
In any case, the residues should be transported bysuitable vehicles, in fully contained loads, thus avoid-
ing littering or spreading of dust. Such vehicles can bepurchased and operated by the plant, or the servicescan be subcontracted to a private company. It is impor-tant to make sure there is sufficient intermediate stor-age capacity and reliable and frequent transportation.
Training of Workers, Codes of Practice, andOccupational Safety and Health
The personnel or human resource developmentdepartments should be responsible for training work-ers. The skills and training courses in table 6.1 may berequired.
Codes of practices or documented work proceduresshould be prepared for all key plant activities and facil-ities. Furthermore, there should be contingency plansin case of accidents or equipment failure.
The documentation should instruct the workershow to operate the equipment, and what to do if it failsor in case of accidents. Such documents can be used innew employee orientation, as well as a reference sourcefor employees throughout the year.
Equipment suppliers should be required to submitwork procedures as part of the contract. Ideally, theseshould be used for preparing an integrated work pro-cedure for the entire plant. The integrated proce-dures should be available in the operator’s room andwith shift supervisors and other key personnel.Relevant excerpts should be placed at each machineor equipment.
Operation and Maintenance 85
Table 6.1 Required skills, education, and background for operating an incinerator
Employees Number Basic skills required Additional training courses required
Managing, financial, and Documented management skills (such as technical directors 3 previous experience and relevant education) Public utility management
Economists, accountants,and office clerks 6 Documented skills in economy, finance, Electronic information management
or accounting systemsPlant operators >14 Documented skills and certificates as Occupational safety and health (OSH),
chief facility operator or shift supervisors and plant operationCrane operators >7 Experience in machine operation Sorting and homogenization of waste
before feeding, and fire extinguishingShift supervisors >7 Good management and planning skills; OSH, first aid, and plant operation
long experience with plant operationMechanics >5 Qualified mechanics, qualified welders OSH and first aidElectricians >2 Qualified electricians OSH and first aidGeneral workers 30 Job-specific OSH and first aid


Key Issues
MSW incineration plants are generally located close todensely populated areas for economic reasons (e.g.,sale of energy, transport distance). Any negative envi-ronmental effects of the plant can influence a greatnumber of people. A combination of planning andtechnical measures is required to minimize suchimpacts.
Of the MSW incineration residues, only the slag canbe considered environmentally safe to reuse. The fluegas cleaning residues are much more soluble than theoriginal wastes and have to be disposed of in an appro-priately designed and operated controlled landfill toavoid negative impacts on ground or surface waters.
MSW incineration plants may have a negativeimpact on the air quality of a fairly large area. The wasteitself can create odor and dust in the immediate sur-roundings, and flue gases containing particles andvapors are spread over a larger area—reducing theoverall air quality if insufficiently treated.
Municipal solid waste may contain hazardous andinfectious matter (although it is not supposed to).Combined with the release of dust containing endo-toxins, this risks the health of those employed at thereception area of the incineration plant. Special pre-cautions have to be taken to minimize such risks.
Occupational health risk and protective measuresfor the rest of the plant are similar to those identifiedor required at places such as coal-fired power plants.
Key Criteria✓ ✓ ✓ The flue gas treatment installation must be
capable of removing dust at least as effi-ciently as a two-stage electrostatic precipita-
tor (basic emission control, dust<30mg/Nm3).
✓ ✓ ✓ A controlled and well-operated landfillmust be available for the disposal ofresidues.
✓ ✓ To avoid noise, dust, and odor in residentialareas, MSW incineration plants should belocated in land-use zones dedicated tomedium or heavy industry.
✓ ✓ The stack should be twice the height of thetallest building within 1.0 km, or at least 70meters high.
Environmental Impact
The environmental impact of the construction andoperation of an MSW incineration plant should beassessed according to the requirements laid down in theWorld Bank Operational Directive (OD) 4.01:Environmental Assessment. A waste incineration plantbelongs to category A in the OD—and therefore, a fullenvironmental assessment should be conducted.
The present guidelines do not substitute an envi-ronmental assessment carried out in accordance withOD 4.01, but describes the impacts to be expected froman incineration plant and a selection of measureswhich can be taken to remediate them.
A properly constructed and operated waste inciner-ation plant is expected to be comparable to medium toheavy industrial activities as far as environmentalimpact, transport requirements and other infrastruc-ture needs, and potential public nuisances.
87
7 Environmental Impact and Occupational Health

Because a waste incineration plants is similar tomedium to heavy industrial activities, it should belocated within a zone dedicated for industrial activities.Besides, because it is similar to a power plant in its ener-gy output and residues, it should be located near powerplants, especially those that are coal fired.
This section describes possible environmentalimpacts and the measures designed to reduce them(elaboratied on in the chapter on Plant Location).
NoiseNoise generated at incineration plants originates fromtransportation of waste and treatment residues to andfrom the plant, handling waste and residues within theplant premises, and noise emissions from the installedequipment.
Massive transportation of waste and residues willtake place on the roads near the plant. This can hardlybe avoided and is one reasons an incineration plantshould be located within an industrial zone or estatewell connected to the major roads of the waste catch-ment area. If the vehicles arriving at or leaving the plantare tempted to make shortcuts through residentialareas, forced routes for the trucks may have to be intro-duced.
Waste and residue handling comprises unloadingthe waste into a reception and storage pit and handlingand treating slag and flue gas cleaning residues from thecombustion process. Waste should be unloaded withina confined or semiconfined building to prevent stormwater from entering the pit and to keep wind fromspreading dust and lightweight wastes. Confinementwill also protect against noise emissions from theseactivities. Slag and fly ash should also be handled insidea building that protects against climate and emissionsof noise, odor, dust, and the like.
Internal traffic on the premises and the noisy activ-ities at ground level can be screened off by acousticscreens through soil barriers.
The main equipment installed at a waste incinera-tion plant includes the overhead crane that feeds thewaste into the hopper or furnace, the furnace withmoving grate, the slag collection and cooling system,the boiler, the flue gas cleaning equipment, fans, andventilators. Most of the equipment will be locatedinside the incinerator building, which muffles the noise
emission. It may be necessary to specify wall and ceil-ing structures with an appropriate sound reduction orabsorption index to keep noise from spreading via thebuilding itself, and to safeguard the working environ-ment in the buildings.
The draught fans and the flue gas fans are, togetherwith the stack, the most significant sources of noise inthe environment.Ventilators will often be located at thebuilding roof and therefore also produce noise in thesurroundings if not properly muffled. If the plant islocated close to residential areas, it may be necessary toprovide the ventilators with attenuators or acousticenclosures. This is quite expensive and further proofthat the plant should be located within an industrialarea.
Except for the traffic to and from the plant, all of thesources of noise can be assumed to operate for 24 hoursa day and seven days a week all year round. If the incin-eration is combined with a plant for recycling of cin-ders and slag for construction purposes, the necessarytreatment (mechanical sorting mainly) can be limitedto the day shift.
OdorsThe combustion process destroys all odor-emittingsubstances in the waste, and the slag and fly ash are ster-ile and odorless after cooling.
MSW incineration plant odor is thus emitted main-ly from handling and storing waste before combustion.The main sources are the unloading activities and thewaste storage pit. The pit or hopper serves as a bufferto equalize the feeding of the furnaces, and will thusalways contain a variable amount of waste. Some of thewaste may be in the pit for several days before being fedto the furnace. In this period, the putrescible waste willdegrade under anaerobic conditions—especially athigh ambient temperatures—and emit an unpleasantsmell.
The necessary handling of the waste in and aroundthe pit will create odor—and will make bacteria andtoxins airborne.
To avoid emitting foul air into the environment, thewaste pit and the feeding section of the plant hopperarea must be enclosed with roof and walls. The air forthe combustion process must be abstracted from thetop of this more or less open room (that is, from the
88 Municipal Solid Waste Incineration

crane or hopper deck) to generate an induced air flowinto the room and keep foul-smelling substances fromescaping.
Besides this, the unavoidable spillage must becleaned and the general area must be kept tidy. Thismust be specified in the staff training program and inthe plant’s operation manuals.
Air EmissionsAirborne pollutants from the combustion process areemitted through the stack. Assuming an optimal com-bustion process for complete destruction of particlesand gases, the applied flue gas cleaning and the heightof the stack are decisive for the resulting contributionto the air quality. The anticipated emissions, as a func-tion of cleaning technology, are described in detail inthe chapter on Air Pollution Control.
To reduce the pollution load on the atmospherefrom the combustion process, various measures can beapplied, as follows (described withan increasing degreeof complexity, cost, and efficiency).
A two-field electrostatic precipitator (ESP) is con-sidered the minimum requirement for flue gas clean-ing at an MSW incineration plant. The ESP will removethe dust from the flue gas to a level of 20 to 30 mg/Nm3.Most of the heavy metals adhering to the dust, such aslead, will be removed rather efficiently from the fluegas. The advantage of the ESP is that it is robust, inex-pensive to operate and may even function (as a settlingchamber)if the power supply is interrupted. It alsooperates at rather high flue gas temperatures and thusrequires limited cooling of the flue gas only.
A bag house filter will clean the flue gas better for thesmallest particles, and better remove heavy metals, thanthe ESP. The disadvantages of the bag house filter arethe cost of operation and the vulnerability—as the fluegas must be cooled before the filter to around 150°C,and there is a risk that sparks from the combustion willburn the bags. Thus, bag house filters require a flameand spark arrestor. Bag house filters are also vulnerablewhen the combustion starts and closes, as the flue gaswill be cool and moist and must bypass the bag filter.
Both an ESP and a bag house filter may be combinedwith various scrubbers in which dry or wet lime isinjected in the flue gas stream, thus further reducingthe content of dust and heavy metals (particularly mer-
cury, which is only poorly removed by dry filters). Thescrubbers will also remove the flue gas content of acidsubstances, including hydrogen fluoride (HF), hydro-gen chloride (HCl), and sulfuric acid (H2SO4). Anenvironmental drawback of the wet systems is the out-put of heavily polluted waste water, which requiresadvanced treatment to remove substances such asheavy metals before discharge.
The requirements for air pollution reduction mustdepend on the general environmental requirements ofthe country. There should be a reasonable relationbetween the requirements for municipal waste inciner-ators and the requirements for other industrialprocesses.
The stack height is decisive for the dilution of theflue gases in the environment. A minimum height isrequired to prevent the plume from reaching theground or entering tall buildings. This minimumheight will depend on the local atmospheric condi-tions, the topography (flat or hilly), and the height ofthe buildings within a radius of at least 1.0 km. Thestack height should be decided on the basis of com-puter modeling, and should never be less than 70meters.
Waste Generation and Access to LandfillIn the combustion process, the volume of the waste willbe reduced by approximately 90 percent and the weightby 70 to 75 percent. The output (residue) from the com-bustion process will mainly be bottom ash (slag), andthe boiler and fly ash will account for only a small per-cent of the waste incinerated.
In addition to the slag, boiler and fly ash, the plantmay generate residues from more advanced dry, semi-dry and wet flue gas cleaning processes. The amountand its environmental characteristics will depend onthe technology applied.
The slag from a well-operated waste incinerator willbe burnt out, with only a small amount of organicmaterial. Besides, the heavy metals in the slag, whichare normally leachable, will to some extent become vit-rified and thus insoluble. The slag may therefore beused as road construction material, reducing the land-fill capacity requirement.
The boiler and fly ash and other residues will, how-ever, need to be disposed of in a controlled landfill, as
Environmental Impact and Occupational Health 89

will the incombustible waste generated in the area. It istherefore absolutely necessary to have a well-engi-neered and operated landfill available for these types ofwaste.
Water SupplySupply of water is necessary for feed water to boilersand for various processes at an MSW incinerationplant: cleansing, slag cooling, flue gas scrubbers (ifimplemented), and staff sanitary purposes.
Slag cooling water has no quality requirements, sopolluted river water or ground watercan be used. Thewater consumption for slag cooling can be assumed tobe in the magnitude of 0.05 to 0.01 m3/metric ton ofwaste if state-of-the-art slag extractors are applied.
Water will also be used if flue gas scrubbers orsemi-dry reactors are installed. Drinking water quali-ty is not required for this process, but the water musthave a relatively low solid content, so lime can bediluted in it and sprayed through nozzles into the fluegas stream. The water consumption will depend onthe technology applied, ranging from about 0.1m3/metric ton of waste in the semidry absorptionprocess (which does not generate waste water) toabout 0.25 to 0.4 m3/metric tons of waste in the wetprocess (which generates 0.07 to 0.15 m3 of wastewater per metric ton).
Waste Water DischargeThe waste water generated from wet processes will havehigh concentrations of salt(mainly as chloride) andsoluble heavy metals. Cadmium can be assumed to bethe most important of these with regard to emissionlimits. The actual concentrations will depend on thecomposition of the combusted waste.
The recipient must therefore be relatively robust(that is, the discharge must be highly diluted). The levelof discharge will depend on the technology applied,ranging from almost none if water is only used for slagcooling (in which case, almost all of the water will evap-orate) to 0.3 m3/metric ton of waste if wet flue gasscrubbers are installed.
Aside from the waste water discharged from theprocesses at the incineration plant, cleaning water andstorm water will be discharged from the area. Thiswater can be assumed to be contaminated with waste
residues (spills) and thus have a relatively high concen-tration of organic substances—at the same level ashousehold effluents.
Occupational Safety and Health
Solid waste handling exposes staff to dust, microor-ganisms including gram-negative bacteria, fungi, andendotoxins, and gases and odor from biologicaldecomposition of the waste. MSW incineration plantsfurther involve a risk of exposure to combustion prod-ucts—for example, gases and particles at various stagesof the process and applied chemicals.
Combustion products can be inhaled or ingested.The incineration plant must be designed, operatedand maintained to minimize human exposure. Thisrequires application of a combination of permanentinstallations and personal protection equipment.
Airborne PollutionWorkers in the waste reception hall are exposed toexhaust fumes from the trucks delivering the waste.During any manual unloading, the engines should beturned off to minimize such exposure. The air qualityin the reception hall is also negatively influenced byodor, dust, and micro-organisms released duringunloading. Decomposition of waste in the pit/hopperfurther degrades the air quality. Prolonged storage oflarge volumes of waste may result in anaerobic condi-tions followed by depletion of oxygen and formation ofmethane.
Leaks in the furnace, flue gas, and duct systems willemit dust and flue gases inside the buildings. At the endof the plant, handling of slag, fly ash and lime used foradvanced flue gas treatment increases the amount ofsuspended matter in the air.
Generally, exposure to these health hazards must beminimized through proper design of buildings, equip-ment, and installations. The building layout shouldavoid direct connection between high-risk areas andpermanently staffed rooms. Surfaces must be easy toclean and designed to prevent deposition and accumu-lation of dust, especially in hard-to-reach places. Plentyof taps should be installed for washing and hosingdown floors (rather than sweeping).
90 Municipal Solid Waste Incineration

Environmental Impact and Occupational Health 91
Maintaining a slightly elevated air pressure in per-manently manned rooms (such as the crane operatorand control rooms), as well as offices, canteens, andkitchens, will reduce the dust and gases entering theseareas.
The operation manual for the plant must call forroutine checks for, and repair of, leaks in the equip-ment. Cleaning and maintenance can increase expo-sure and should be countered through application ofpersonal protection devices.
Masks for protection against micro-organisms (typeP3) should be used in the waste reception area. In dustyareas with concentrations of dust larger than 3mg/m3,type P2 masks should be applied.
HeatThe temperature in the furnace hall may be elevatedconsiderably above ambient temperature and evenbecome uncomfortable. Working in this area induces arisk of dizziness, sickness, visual disturbance, andheadaches.
The room temperature and heat radiation should bereduced through ventilation and insulating or coveringhot surfaces. Efficient ventilation consists of vents forexhaust of warm air from the ceiling above the furnacesand supply of fresh air through openings or forced ven-tilation vents.
Drinking water should be available throughout theplant.
VibrationsThe vibrations and sound pressure emitted fromnumerous machines and activities may reach a level ofconcern to occupational health and safety. Vibrationdampers should be applied whenever required. Noisyequipment such as turbines and compressors must beshielded or placed in special rooms with sound-absorb-ing cladding on the walls. Large ventilators should belocated where the noise level is of no concern orequipped with noise-reducing intake and outlet units.
In areas where the noise level exceeds 85 dB(A), earplugs or equivalently efficient protection should bemandatory.
ChemicalsThe Chemicals Convention /1/ should be followed—including assessing all applied hazardous chemicals inrespect to safe usage and taking necessary labor pro-tection measures.
Safety Data Sheets must be provided by the suppli-ers of hazardous chemicals. The employer shouldensure that all necessary precautions are taken.
Physiology Work stations should avoid torsion and bend-forwardpositions.Work must be executed in front of and close tothe body—that is, the level of the footbridges should beadjusted according to the level of the actual site of work.
Ergonomic strain caused by lifting, pulling, andpushing of heavy parts should be minimized throughlifts and cranes. The floors should be level, with suffi-cient slopes for drainage of cleaning water only.
Risk of AccidentsExperience shows that the main risks of accidents at anincineration plant are falls from great height (into thepit or down from the footbridges), collisions withtrucks transporting waste or residues, accidents atrotating equipment, scalding by hot water or steam,equipment failure, explosions, and fire.
Footbridges and elevated platforms must be equippedwith safety rails—if not, access must be restricted.
Running traffic must be separated from pedestrianswherever possible.
Machinery must be shielded against moving androtating parts—and should be unable to operate ifthese shields are not installed properly. Emergencystops must be installed in case of accidents.
Emergency response and evacuation plans must beestablished.


/1/ General Conference of the International Labor
Organization. 1990. Chemicals Convention.
/2/ Thomé-Kozmiensky, Karl Joachim.1994. Thermische abfall-
behandlung, zweite Auflage EF-Verlag Für energie- und
umwelttechnik GMBH. Berlin, Germany.
/3/ Chandler, A. John. September 1997.“Municipal solid waste
incineration technologies.” A presentation for the World
Bank Seminar on Waste Management by A.J.Chandler &
Associates Ltd. Ontario, Canada.
/4/ McCARTHY/RAMBØLL J.V. April 1998. Richmond Hill
Incinerator, Final Summary Report. Isle of Man Government.
/5/ RAMBØLL. September 1993. “Review of Taiwan Tender
Document & Plant Design Specification.” China Engineering
Consultants, Inc.
/6/ Dalager, S. U. Marxen, I.Nymann, T. Hulgaard. May 1998.
“Affaldsteknologi, Kapitel 4.2 Forbrænding: princip og
teknologi.” RAMBØLL, Denmark.
/7/ Hjelmar, O. 1996 “Disposal Strategies for Municipal Solid
Waste Incinerator Residues.” Journal of Hazardous Materials
/8/ International Ash Working Group : A.J. Chandler, T.T.
Eighmy, J. HartlénO. Hjelmar, D.S. Kosson, S.E. Sawell, H.A.
van der Sloot, J. Vehlow.1997. “Municipal solid waste incin-
erator residues.” Studies in Environmental Science 67,
Elsevier Science B.V., Amsterdam.
93
References


The checklist below is intended to serve two purposes:
First, the checklist is to be used in the planning process, when a decision is to be made on whether to build anincineration plant or not. A range of questions should be answered before the decision is made. These questionsare generally the ones in sections 1-5 below, plus the initial questions in sections 8-10.
Second, the checklist is intended for use in feasibility studies in relation to outline projects for incineration plants.In this context, all of the questions in the checklist should be answered and appropriate action taken.
The checklist is constructed as a simple table with options. Option A is the best and option D the poorest. Often,checking the item in column D will result in a “no-go” decision. Those questions deemed most crucial for the deci-sion (the “killer” answers) are shadowed in column D (and in some instances column C).
Throughout the checklist, LVC means Lower Calorific Value; MSW means Municipal Solid Waste, which includeswaste similar to MSW from commerce, trade, and industry; and SWM means Solid Waste Management.
PARAMETER A B C DExplanation
1. Waste as FuelWaste characteristics
Annual variation in characteristics
95
Municipal Solid Waste Incineration Checklist
A check in column Ameans that the condi-tions are close to opti-mal for establishing aMSW incinerationplant
A check in column Bmeans that althoughthe conditions are notoptimal, establishing aMSW incinerationplant could be consid-ered further
A check in column Cmeans that conditionsfor establishing a MSWincineration plant aredoubtful. Some (shad-owed) assumptionsmay be “killer” answers
A check in column Dmeans that conditionsfor establishing a MSWincinerator are poor.The shadowed answersare “killer” answers
The characteristicsof the waste arefully established bysampling andanalysis
The annual varia-tion is fully estab-lished by samplingand analysis
❑
❑
The characteristicsof the waste areassessed by repre-sentative samplingand analysis
The annual varia-tion is assessed byrepresentative sam-pling and analysis
❑
❑
The characteristicsof the waste areassessed from grabsamples and stan-dard data
The annual varia-tion is assessedfrom grab sampling
❑
❑
The characteristicsof the waste are notknown
Nothing is knownabout annual varia-tion
❑
❑
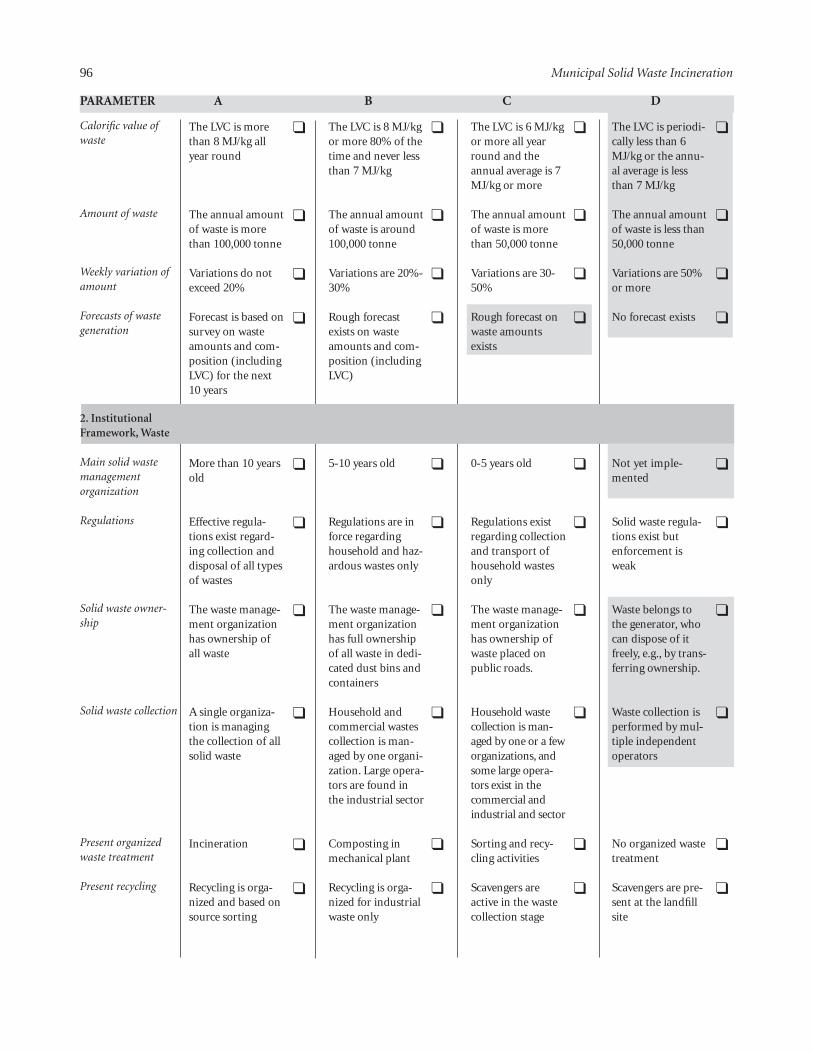
Calorific value ofwaste
Amount of waste
Weekly variation ofamount
Forecasts of waste generation
2. InstitutionalFramework, Waste
Main solid waste management organization
Regulations
Solid waste owner-ship
Solid waste collection
Present organizedwaste treatment
Present recycling
96 Municipal Solid Waste Incineration
PARAMETER A B C D
The LVC is morethan 8 MJ/kg allyear round
The annual amountof waste is morethan 100,000 tonne
Variations do notexceed 20%
Forecast is based onsurvey on wasteamounts and com-position (includingLVC) for the next10 years
More than 10 yearsold
Effective regula-tions exist regard-ing collection anddisposal of all typesof wastes
The waste manage-ment organizationhas ownership ofall waste
A single organiza-tion is managingthe collection of allsolid waste
Incineration
Recycling is orga-nized and based onsource sorting
❑
❑
❑
❑
❑
❑
❑
❑
❑
❑
The LVC is 8 MJ/kgor more 80% of thetime and never lessthan 7 MJ/kg
The annual amountof waste is around100,000 tonne
Variations are 20%-30%
Rough forecastexists on wasteamounts and com-position (includingLVC)
5-10 years old
Regulations are inforce regardinghousehold and haz-ardous wastes only
The waste manage-ment organizationhas full ownershipof all waste in dedi-cated dust bins andcontainers
Household andcommercial wastescollection is man-aged by one organi-zation. Large opera-tors are found inthe industrial sector
Composting inmechanical plant
Recycling is orga-nized for industrialwaste only
❑
❑
❑
❑
❑
❑
❑
❑
❑
❑
The LVC is 6 MJ/kgor more all yearround and theannual average is 7MJ/kg or more
The annual amountof waste is morethan 50,000 tonne
Variations are 30-50%
Rough forecast onwaste amountsexists
0-5 years old
Regulations existregarding collectionand transport ofhousehold wastesonly
The waste manage-ment organizationhas ownership ofwaste placed onpublic roads.
Household wastecollection is man-aged by one or a feworganizations, andsome large opera-tors exist in thecommercial andindustrial and sector
Sorting and recy-cling activities
Scavengers areactive in the wastecollection stage
❑
❑
❑
❑
❑
❑
❑
❑
❑
❑
The LVC is periodi-cally less than 6MJ/kg or the annu-al average is lessthan 7 MJ/kg
The annual amountof waste is less than50,000 tonne
Variations are 50%or more
No forecast exists
Not yet imple-mented
Solid waste regula-tions exist butenforcement isweak
Waste belongs tothe generator, whocan dispose of itfreely, e.g., by trans-ferring ownership.
Waste collection isperformed by mul-tiple independentoperators
No organized wastetreatment
Scavengers are pre-sent at the landfillsite
❑
❑
❑
❑
❑
❑
❑
❑
❑
❑

Present waste disposal
MSW incineratororganizational position
MWS incinerator ownership
MSW incineratorrights and duties
3. InstitutionalFramework, Energy
Energy buyer/ distributor
Availability ofdistribution networks
Incineration energy
4. Incineration PlantEconomy
Cost and expense sta-bility
Checklist 97
PARAMETER A B C D
All solid waste isdisposed of in con-trolled and well-operated landfills
The MSW incine-rator is an integrat-ed part of the SWMsystem
Owned by publicSWM company
The MWS incinera-tor is granted rightto receive all com-bustible waste andobliged to ensurethe necessarycapacity
One single public/private utility com-pany
District heating sys-tem and powerlines
All recovered heatcan at all times beutilized for districtheating purposes
Stable, predictableplant expenses andrevenues can beassumed
❑
❑
❑
❑
❑
❑
❑
❑
75% of all waste isdisposed of in con-trolled and well-operated landfills
The MSW incine-rator is an indepen-dent MSW treat-ment plant withclose formal rela-tions to the SWMsystem
Owned by public/private utility com-pany (power orheat production)
The MWS incinera-tor is granted rightto receive all com-bustible householdwaste and obligedto ensure the neces-sary capacity
One power compa-ny and one districtheating company
District heating sys-tem
Most recoveredenergy can be uti-lized for a combi-nation of powerand heat
Uncertainty aboutexpenses or rev-enues
❑
❑
❑
❑
❑
❑
❑
❑
Household waste isdisposed of in acontrolled andwell-operated land-fill
The MSW incine-rator is an indepen-dent MSW treat-ment plant withinformal relationsto the SWM system
Owned by privateSWM company
Many small powerand/or districtheating companies
Power lines
Some energy will beused for power gen-eration; theremaining will becooled off
Uncertainty aboutexpenses and rev-enues
❑
❑
❑
❑
❑
❑
❑
A significant part ofthe waste from allsectors is disposedof in uncontrolledor illegal dump-sites.
The MSW inciner-ator is an indepen-dent MSW treat-ment plant withoutlinks to the SWMsystem
Owned by privatelarge energy con-sumer, e.g., a largeindustry
The MSW incinera-tor is an enterprisewith no rights andduties in relation toMSW
Individual energysupply
Network to beestablished
A substantialamount of the sur-plus energy will becooled off
Severe cost and rev-enue instability
❑
❑
❑
❑
❑
❑
❑
❑

Waste supply stability
Current waste manage-ment charges
Incineration charges
Competitive charges
Energy saleagreement(s)
Budget
Cash flow
Foreign currency avail-ability
98 Municipal Solid Waste Incineration
PARAMETER A B C D
Long-term con-tracts on delivery ofall waste to inciner-ation plant; 100%capacity utilization
All costs of wastecollection and dis-posal are paid byusers
Costs of incinera-tion are covered bythe budget. Theauthorities charge awaste managementfee on householdsand commercialactivities
MSW incinerationtipping fee is small-er than the tippingfee for, e.g., landfill-ing
Government-approved agree-ment or firm con-tract available
Plant will have itsown budget andspecial privilegesregarding foreigncurrency procure-ment
Plant budget andrevenue allows forpurchase of neces-sary and sufficientspare parts andconsumables
Unrestricted accessto foreign currencyfor spare parts pur-chase
❑
❑
❑
❑
❑
❑
❑
❑
Contracts on wastedelivery correspon-ding to 80% ofplant capacity
Households pay awaste managementfee. A tipping fee iscollected fromother users of, e.g.,landfills
The incinerationplants collects a tip-ping fee, which cov-ers all costs
Agreement signedbut not yetapproved or con-tract agreed but notsigned
The plant will haveits own budget
❑
❑
❑
❑
❑
Contracts on wastedelivery correspon-ding to 60% ofplant capacity
Costs of wastemanagement ispaid partly by usersand partly from thepublic budget
The incinerationplant collects a tip-ping fee; remainingcosts are covered bythe public budget
MSW incinerationtipping fee is equalto or a little higherthan the tipping feefor, e.g., landfilling
Letter of intentavailable
Plant economy willbe part of a publicbudget
❑
❑
❑
❑
❑
❑
No or little wastesupply security
All costs are paidfrom the publicbudget
The incinerationplant must collectits own tipping feefrom individualusers
MSW incinerationtipping fee is con-siderably higherthan the tipping feefor, e.g., landfilling
No agreementreached
All expenses mustbe approved of inadvance by thefunding agency
Plant budget andrevenue do notallow for purchaseof necessary andsufficient spareparts and consum-ables
No access to foreigncurrency for spareparts purchase
❑
❑
❑
❑
❑
❑
❑
❑

5. Plant Localization
Air quality impact
Zoning of plant locality
Distance to residentialareas/zones
Main access roads
Distance to waste gener-ation center
Sufficient capacity pub-lic utilities (water,power, and sewers)
Connection point forsurplus energy is avail-able
6. IncinerationTechnology
Waste pretreatment
Furnace technology
Incinerator line capa-city
Number of incineratorlines
Checklist 99
PARAMETER A B C D
Windy area, inver-sions nonexistent
Heavy industry
> 500 meters
Existing majorroads thorough-fares
< 1/2 hour by truck
< 500 meters fromsite
< 1,000 metersform site
The waste can befed into the incin-erator “as received”after mixing inwaste pit
The incineratorconcept is based onmass burning prin-ciple
Each incineratorline has a capacitybetween 10 and 20tonne /hour
The MSW incinera-tion plants has twoor more incinera-tion lines
❑
❑
❑
❑
❑
❑
❑
❑
❑
❑
❑
Few inversions andsmog situations
Medium to heavyindustry
300-500 meters
Planned majorroads
1/2-1 hour by truck
500-1,000 metersfrom site
1,000-2,000 metersform site
Mechanical sortingout and crushing oflarge items is neces-sary
Each incineratorline has a capacityhigher than 20tonne /hour
❑
❑
❑
❑
❑
❑
❑
❑
❑
Occasional butshort inversion andsmog situations
Medium to heavyindustry
200-300 meters
Main roads
1 hour by truck
1,000-2,000 metersfrom site
2,000-3,000 metersfrom site
Manual sorting outand crushing oflarge items is neces-sary
The incineratorconcept is a rotat-ing kiln
Each incineratorline has a capacitybetween 6 and 10tonne /hour
The MSW incinera-tion plants has oneincineration line
❑
❑
❑
❑
❑
❑
❑
❑
❑
❑
❑
Frequent and pro-longed inversionand smog situa-tions
Light industry
< 200 meters
Local roads only
> 1 hour by truck
> 2,000 meters
> 3,000 meters
The waste needsextensive pretreat-ment (sorting,crushing, homoge-nizing) beforeincineration
The incineratorconcept is fluidizedbed or other tech-nology unproven inMSW combustion
Each incineratorline has a capacityof less than 6tonne/hour
❑
❑
❑
❑
❑
❑
❑
❑
❑
❑

Flue gas burnout
Startup and support burner
Supplier’s experience
7. Energy RecoveryFlue gas temperature after boiler
Energy recovery system
8. Incineration Residues
Landfill
Residue utilization
100 Municipal Solid Waste Incineration
PARAMETER A B C D
The flue gas is fullyburnt out in anafter-burner, result-ing in emissionconcentration ofCO < 50 mg/Nm3
TOC < 10 mg/Nm3
The furnace is pro-vided with burnersto heat the inciner-ator during start-upand keep afterburn-er temperatures upin case of lowcalorific value ofwaste
The supplier hasextensive experi-ence in MSWincineration andnumerous refer-ences
The flue gas tem-perature is below150-200oC to allowfor optimum ener-gy recovery andflue gas cleaning
The recovered ener-gy is converted tohot water for dis-trict heating or low-pressure steam forindustrial purposes
Controlled andwell- operatedlandfills exist for alltypes of wasteincluding haz-ardous waste
Most residues canbe utilized forindustrial or con-struction purposes
❑
❑
❑
❑
❑
❑
❑
The supplier hasgood experience inMSW incineration
The recovered ener-gy is converted tosteam for powerproduction orindustrial use andfor district heating
Controlled andwell- operatedlandfills exist exceptfor hazardouswastes
Slag can be utilizedin construction;flue gas cleaningresidues must belandfilled
❑
❑
❑
❑
The supplier hassome experience inMSW incineration
The recovered ener-gy is converted tosteam for powerproduction
Controlled andwell- operated land-fills exist for domes-tic waste. Extensionwith section forincinerationresidues feasible
No utilizationoptions for residues
❑
❑
❑
❑
The requirementsin A are not met
The furnace has nostartup and supportburners
The supplier has noexperience in MSWincineration
The flue gas tem-perature is above200˚C
The energy iscooled away
No controlled andwell-operated land-fills exist
❑
❑
❑
❑
❑
❑

9. Operation andMaintenance
Availability of staff
Salaries
Plant implementationorganization
Plant organization
Operation and maintenance manuals, training ofstaff, plant monitoring
10. EnvironmentalIssues
Environmental stan-dards
Environmentaladministration
Checklist 101
PARAMETER A B C D
Qualified staffavailable in suffi-cient numbers
The incinerationplant can pay mar-ket price salaries
A builder’s imple-mentationorganization isestablished withskilled staff andconsultants experi-enced in MSWincineration
A clear and well-structured plantmanagement orga-nization exists
The supplier or anindependentconsultant will pro-vide organizationalsetup, relevantmanuals, staff train-ing at all levels, andthe SMW organiza-tion will utilize it
Independent publicauthority responsi-ble for environ-mental permit,supervision, andenforcement
❑
❑
❑
❑
❑
❑
The authoritiesassign staff with thenecessary skills
Market pricesalaries are paid tomanagers andskilled staff.
A builder’s imple-mentationorganization isestablished withstaff and consul-tants
An outline plantmanagement orga-nization is draftedand approved
The supplier or anindependentconsultant will pro-vide organizationalsetup, relevantmanuals, stafftraining at all levels
Emission standardsfor incinerationplants at mediumlevel
Nearly independentpublic authorityresponsible forenvironmental per-mit, supervision,and enforcement
❑
❑
❑
❑
❑
❑
❑
An HRD organiza-tion is in place forstaff training
Incentives in addi-tion to the basicsalaries preventexcessive staff turnover
A builder’s imple-mentationorganization isestablished
An outline plantmanagement orga-nization is drafted
The suppler willprovide training ofstaff on manage-ment level
Emission standardsfor incinerationplants at basic level
❑
❑
❑
❑
❑
❑
Competition forqualified staff isfierce
The plant is unableto pay competitivesalaries for skilledstaff
No implementationorganization isestablished
No plant organiza-tion is established
None of the provi-sion under A willbe made
Emission standardsfor incinerationplants do not exist
The public authori-ty responsible forenvironmental per-mit, supervision,and enforcementowns the MSWincinerator
❑
❑
❑
❑
❑
❑
❑
(air pollution control included under this heading)

Flue gas treatment
Flue gas emission
Odor emission
Waste water discharge
Noise emissions
Monitoring
11. OccupationalHealth Issues
Building lay-out
Ventilation
102 Municipal Solid Waste Incineration
PARAMETER A B C D
The flue gas treat-ment plant meetsnational emissionstandards
Stack is sufficientlyhigh to avoidexceeding air ambi-ent standards
The plant is con-structed and oper-ated so that odorinconveniences donot appear
Waste water dis-charge meetsnational standards
Noise emission issufficiently muffledto avoid any incon-veniences in theneighborhood
A monitoring sys-tem for all relevantenvironmentalparameters is estab-lished
Same as B plus ade-quate emergencyaccess/exits. Laborprotection andphysiological mea-sures fully includedin the design
Same as B plusmaintenance of ele-vated pressure in allpermanent workstations and recre-ational rooms
❑
❑
❑
❑
❑
❑
❑
❑
The flue gas treat-ment plant meetsmedium emissionstandards withrespect to dust(<30mg/Nm3) andHCl (<50mg/Nm3)
Stack height resultsin few and minorinstances of exceed-ing air ambientstandards
The plant willresult in occasionalodor emissions inthe neighborhood
Noise emission willlead to minorinconveniences inthe neighborhood
A monitoring sys-tem for basic envi-ronmental parame-ters is established
Same as C plus sep-aration betweenroads for vehiclesand pedestrian pas-sages
Same as C plusadditional pointsource ventilationat critical places,e.g., where chemi-cals are handled
❑
❑
❑
❑
❑
❑
❑
The flue gas treat-ment plant meetsbasic emissionstandards withrespect to dust(<30mg/Nm3)
Stack height resultsin frequentinstances of exceed-ing ambient airstandards
The plant willresult in frequentodor emissions inthe neighborhood
Noise emission willlead to majorinconveniences inthe neighborhood
Separation betweenpermanently staffedrooms and produc-tion areas. Showersand dressing roomsfor staff
Forced ventilationin all rooms withfrequent work.Combustion air isdrawn from wastepit area
❑
❑
❑
❑
❑
❑
No flue gas treat-ment plant present
Flue gas is emittedfrom a low stackand causes majorinstances of exceed-ing ambient airstandards
The plant will causeunacceptable odoremissions in theneighborhood
Waste water is dis-charged untreatedand does not meetnational standards
Noise emission willlead to unaccept-able noise level inthe neighborhood
No monitoringforeseen to takeplace
Direct access fromfurnace hall, wastereception area tocontrol room
Ventilation of per-manent work sta-tions only
❑
❑
❑
❑
❑
❑
❑
❑

Mechanical plant
Manual ofoperation and safety
Checklist 103
PARAMETER A B C D
State-of-the-artequipment, e.g., lownoise and elaboratesafety measures
Same as B plus reg-ular emergencyresponse exercises
❑
❑
Low noise equip-ment with basicprotection devices
Same as C plusHRD organizationfor enforcement ofregulations andtraining of newstaff
❑
❑
Basic occupationalhealth and safetymeasures included
Basic manual exists;organizationalresponsibilitiesestablished at alllevels
❑
❑
Occupationalhealth and safetynot considered
No operation andsafety manual avail-able
❑
❑


