V E N T U R E C A P I T A L R E P O R T
Venture Capital Report U.S. | 4Q | 2017

V E N T U R E C A P I T A L R E P O R T
VENTURE CAPITAL REPORT
The following report presents Dow Jones VentureSource’s quarterly findings for U.S. venture capital fundraising, investment, valuation,
and liquidity. The included charts and graphs offer a comprehensive view of the trends currently affecting the venture capital market.
Highlights for 4Q 2017 include:
• U.S. venture capital fundraising decreased in amount invested while the number of funds increased;
• Venture capital investment in U.S. companies declined;
• Amount raised through Initial public offerings (IPOs) tripled in the fourth quarter of 2017, mergers and acquisitions (M&As) fell in comparison with the
previous quarter.
2
V E N T U R E C A P I T A L R E P O R T
VENTURE FUNDRAISING DECREASES IN THE U.S. DURING 4Q 2017
3
FUNDRAISING
U.S. VC Fundraising (2014– 2017) Based on multiple closings
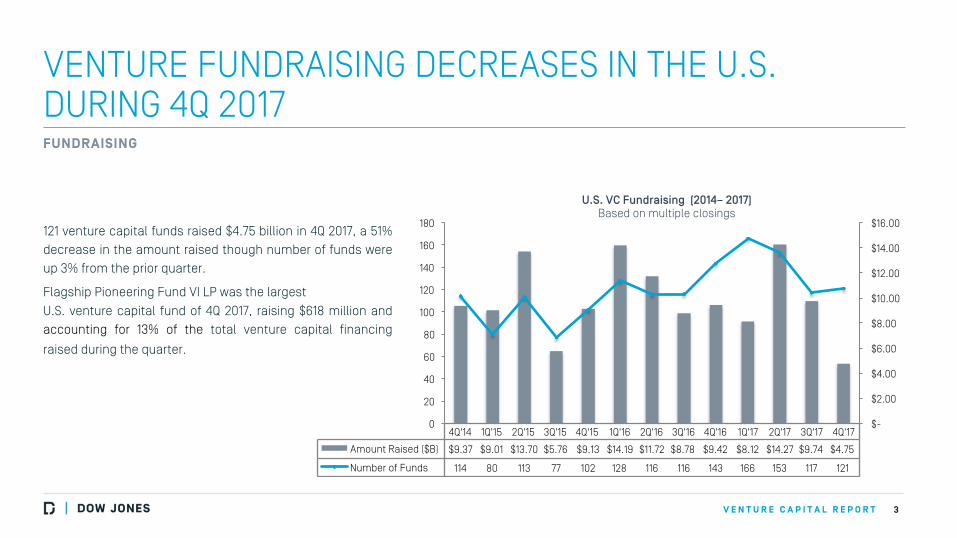
121 venture capital funds raised $4.75 billion in 4Q 2017, a 51%
decrease in the amount raised though number of funds were
up 3% from the prior quarter.
Flagship Pioneering Fund VI LP was the largest
U.S. venture capital fund of 4Q 2017, raising $618 million and
accounting for 13% of the total venture capital financing
raised during the quarter.
4Q'14 1Q'15 2Q'15 3Q'15 4Q'15 1Q'16 2Q'16 3Q'16 4Q'16 1Q'17 2Q'17 3Q'17 4Q'17
Amount Raised ($B) $9.37 $9.01 $13.70 $5.76 $9.13 $14.19 $11.72 $8.78 $9.42 $8.12 $14.27 $9.74 $4.75
Number of Funds 114 80 113 77 102 128 116 116 143 166 153 117 121
0
20
40
60
80
100
120
140
160
180
$-
$2.00
$4.00
$6.00
$8.00
$10.00
$12.00
$14.00
$16.00
V E N T U R E C A P I T A L R E P O R T
LARGEST VC FUNDS RAISED IN 4Q 2017
4
FUNDRAISING
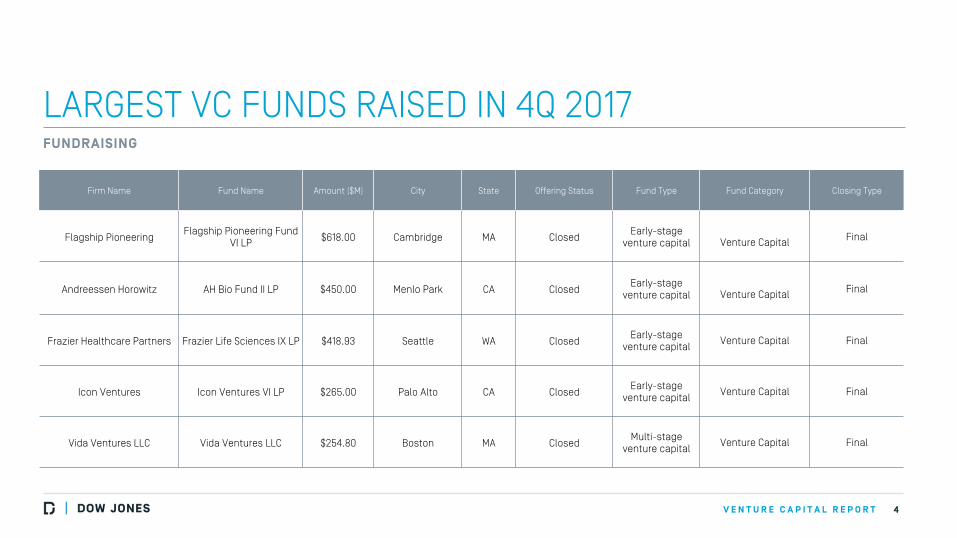
Firm Name Fund Name Amount ($M) City State Offering Status Fund Type Fund Category Closing Type
Flagship Pioneering Flagship Pioneering Fund
VI LP $618.00 Cambridge MA Closed Early-stage
venture capital
Venture Capital Final
Andreessen Horowitz AH Bio Fund II LP $450.00 Menlo Park CA Closed Early-stage
venture capital
Venture Capital Final
Frazier Healthcare Partners Frazier Life Sciences IX LP $418.93 Seattle WA Closed Early-stage
venture capital Venture Capital Final
Icon Ventures Icon Ventures VI LP $265.00 Palo Alto CA Closed Early-stage
venture capital Venture Capital Final
Vida Ventures LLC Vida Ventures LLC $254.80 Boston MA Closed Multi-stage
venture capital Venture Capital Final
V E N T U R E C A P I T A L R E P O R T
U.S. VENTURE INVESTMENT IN 4Q 2017 DECREASES
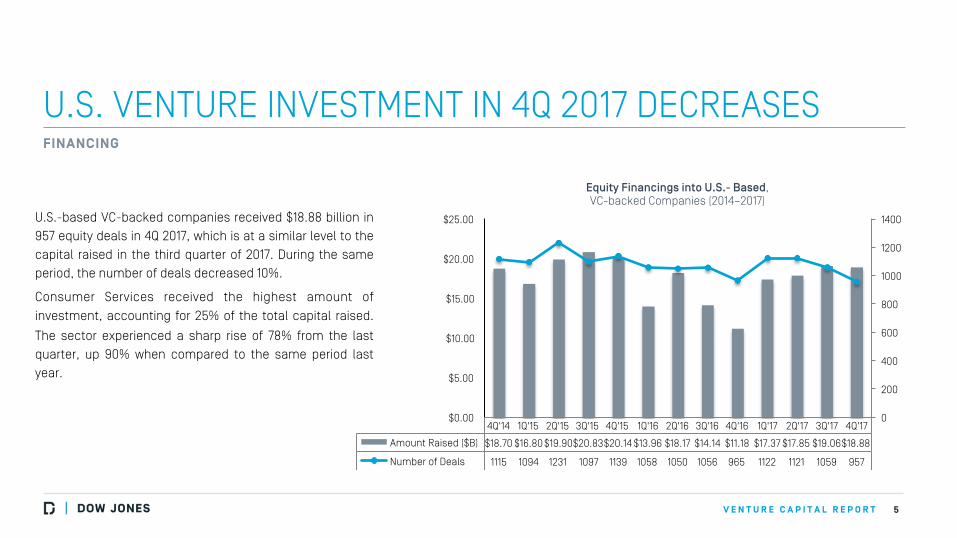
U.S.-based VC-backed companies received $18.88 billion in
957 equity deals in 4Q 2017, which is at a similar level to the
capital raised in the third quarter of 2017. During the same
period, the number of deals decreased 10%.
Consumer Services received the highest amount of
investment, accounting for 25% of the total capital raised.
The sector experienced a sharp rise of 78% from the last
quarter, up 90% when compared to the same period last
year.
5
FINANCING
Equity Financings into U.S.- Based, VC-backed Companies (2014–2017)
4Q'14 1Q'15 2Q'15 3Q'15 4Q'15 1Q'16 2Q'16 3Q'16 4Q'16 1Q'17 2Q'17 3Q'17 4Q'17
Amount Raised ($B) $18.70 $16.80 $19.90 $20.83 $20.14 $13.96 $18.17 $14.14 $11.18 $17.37 $17.85 $19.06 $18.88
Number of Deals 1115 1094 1231 1097 1139 1058 1050 1056 965 1122 1121 1059 957
0
200
400
600
800
1000
1200
1400
$0.00
$5.00
$10.00
$15.00
$20.00
$25.00
V E N T U R E C A P I T A L R E P O R T
Number of Deals
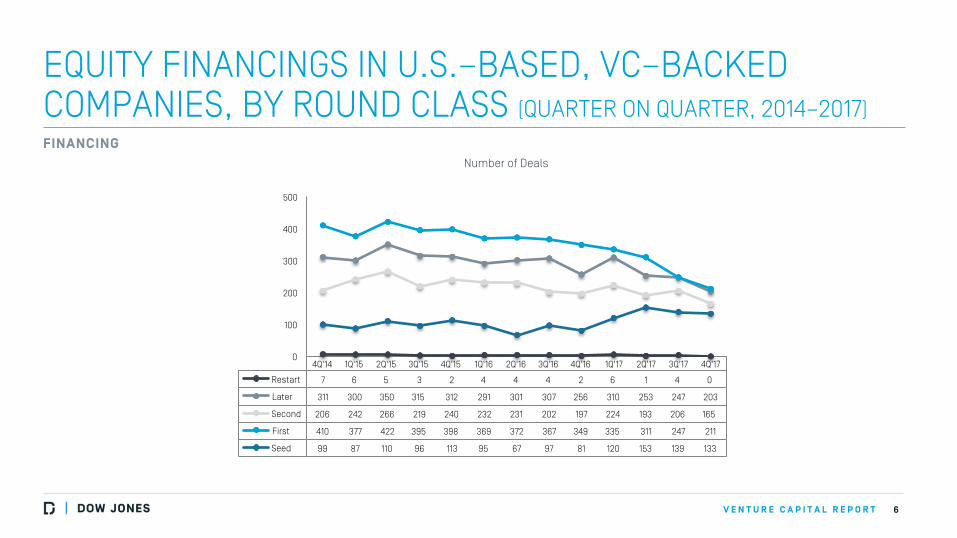
EQUITY FINANCINGS IN U.S.–BASED, VC–BACKED COMPANIES, BY ROUND CLASS (QUARTER ON QUARTER, 2014–2017)
6
FINANCING
4Q'14 1Q'15 2Q'15 3Q'15 4Q'15 1Q'16 2Q'16 3Q'16 4Q'16 1Q'17 2Q'17 3Q'17 4Q'17
Restart 7 6 5 3 2 4 4 4 2 6 1 4 0
Later 311 300 350 315 312 291 301 307 256 310 253 247 203
Second 206 242 266 219 240 232 231 202 197 224 193 206 165
First 410 377 422 395 398 369 372 367 349 335 311 247 211
Seed 99 87 110 96 113 95 67 97 81 120 153 139 133
0
100
200
300
400
500
V E N T U R E C A P I T A L R E P O R T
Amount Raised ($B)
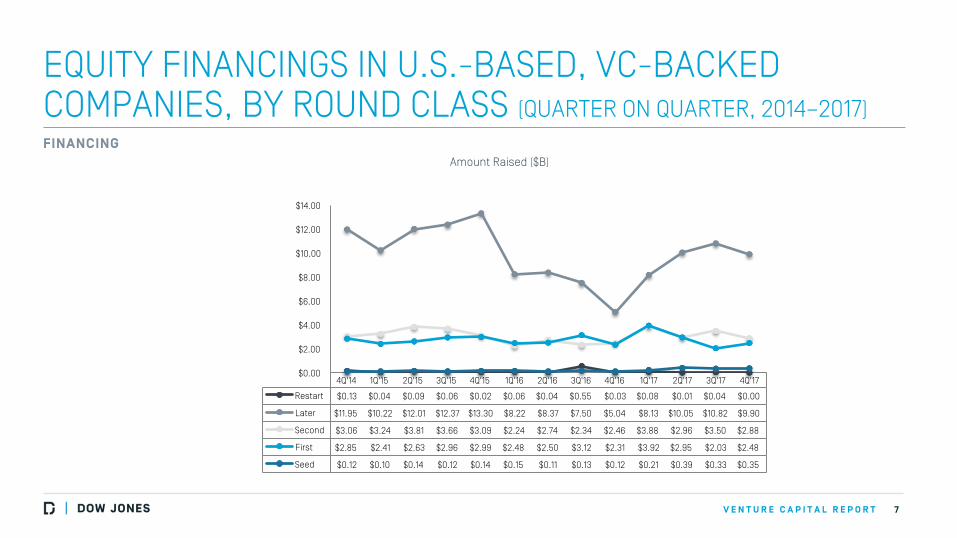
EQUITY FINANCINGS IN U.S.-BASED, VC-BACKED COMPANIES, BY ROUND CLASS (QUARTER ON QUARTER, 2014–2017)
7
FINANCING
4Q'14 1Q'15 2Q'15 3Q'15 4Q'15 1Q'16 2Q'16 3Q'16 4Q'16 1Q'17 2Q'17 3Q'17 4Q'17
Restart $0.13 $0.04 $0.09 $0.06 $0.02 $0.06 $0.04 $0.55 $0.03 $0.08 $0.01 $0.04 $0.00
Later $11.95 $10.22 $12.01 $12.37 $13.30 $8.22 $8.37 $7.50 $5.04 $8.13 $10.05 $10.82 $9.90
Second $3.06 $3.24 $3.81 $3.66 $3.09 $2.24 $2.74 $2.34 $2.46 $3.88 $2.96 $3.50 $2.88
First $2.85 $2.41 $2.63 $2.96 $2.99 $2.48 $2.50 $3.12 $2.31 $3.92 $2.95 $2.03 $2.48
Seed $0.12 $0.10 $0.14 $0.12 $0.14 $0.15 $0.11 $0.13 $0.12 $0.21 $0.39 $0.33 $0.35
$0.00
$2.00
$4.00
$6.00
$8.00
$10.00
$12.00
$14.00
V E N T U R E C A P I T A L R E P O R T
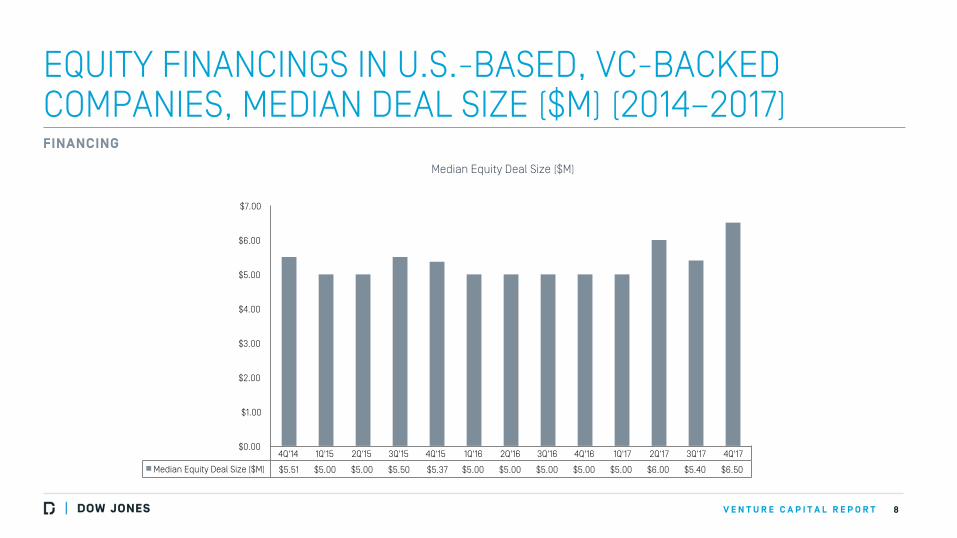
EQUITY FINANCINGS IN U.S.-BASED, VC-BACKED COMPANIES, MEDIAN DEAL SIZE ($M) (2014–2017)
8
FINANCING Median Equity Deal Size ($M)
4Q'14 1Q'15 2Q'15 3Q'15 4Q'15 1Q'16 2Q'16 3Q'16 4Q'16 1Q'17 2Q'17 3Q'17 4Q'17
Median Equity Deal Size ($M) $5.51 $5.00 $5.00 $5.50 $5.37 $5.00 $5.00 $5.00 $5.00 $5.00 $6.00 $5.40 $6.50
$0.00
$1.00
$2.00
$3.00
$4.00
$5.00
$6.00
$7.00
V E N T U R E C A P I T A L R E P O R T
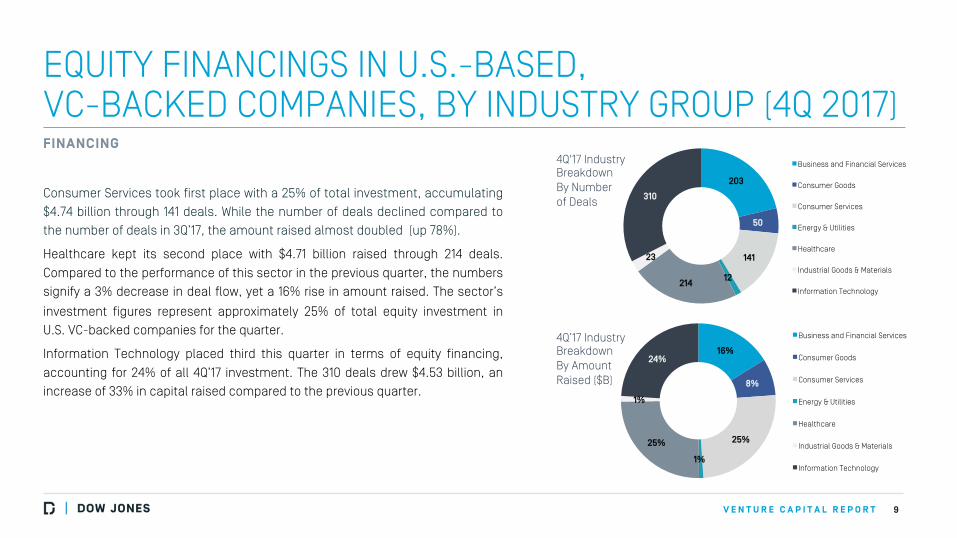
EQUITY FINANCINGS IN U.S.-BASED, VC-BACKED COMPANIES, BY INDUSTRY GROUP (4Q 2017)
Consumer Services took first place with a 25% of total investment, accumulating
$4.74 billion through 141 deals. While the number of deals declined compared to
the number of deals in 3Q’17, the amount raised almost doubled (up 78%).
Healthcare kept its second place with $4.71 billion raised through 214 deals.
Compared to the performance of this sector in the previous quarter, the numbers
signify a 3% decrease in deal flow, yet a 16% rise in amount raised. The sector’s
investment figures represent approximately 25% of total equity investment in
U.S. VC-backed companies for the quarter.
Information Technology placed third this quarter in terms of equity financing,
accounting for 24% of all 4Q’17 investment. The 310 deals drew $4.53 billion, an
increase of 33% in capital raised compared to the previous quarter.
9
FINANCING 4Q'17 Industry Breakdown By Number of Deals
4Q’17 Industry Breakdown By Amount Raised ($B)
203
50
141
12 214
23
310
Business and Financial Services
Consumer Goods
Consumer Services
Energy & Utilities
Healthcare
Industrial Goods & Materials
Information Technology
16%
8%
25%
1%
25%
1%
24%
Business and Financial Services
Consumer Goods
Consumer Services
Energy & Utilities
Healthcare
Industrial Goods & Materials
Information Technology
V E N T U R E C A P I T A L R E P O R T
TOP 4 DEALS INTO VC-BACKED COMPANIES (4Q 2017)
1 0
FINANCING
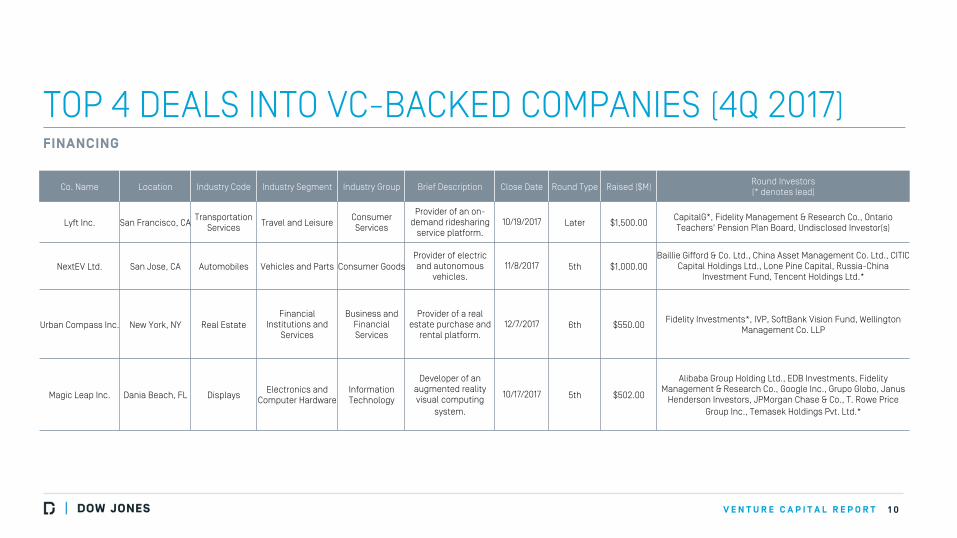
Co. Name Location Industry Code Industry Segment Industry Group Brief Description Close Date Round Type Raised ($M) Round Investors (* denotes lead)
Lyft Inc. San Francisco, CA Transportation
Services Travel and Leisure
Consumer Services
Provider of an on-demand ridesharing
service platform. 10/19/2017 Later $1,500.00
CapitalG*, Fidelity Management & Research Co., Ontario Teachers' Pension Plan Board, Undisclosed Investor(s)
NextEV Ltd. San Jose, CA Automobiles Vehicles and Parts Consumer Goods Provider of electric and autonomous
vehicles. 11/8/2017 5th $1,000.00
Baillie Gifford & Co. Ltd., China Asset Management Co. Ltd., CITIC Capital Holdings Ltd., Lone Pine Capital, Russia-China
Investment Fund, Tencent Holdings Ltd.*
Urban Compass Inc. New York, NY Real Estate Financial
Institutions and Services
Business and Financial Services
Provider of a real estate purchase and
rental platform. 12/7/2017 6th $550.00
Fidelity Investments*, IVP, SoftBank Vision Fund, Wellington Management Co. LLP
Magic Leap Inc. Dania Beach, FL Displays Electronics and
Computer Hardware Information Technology
Developer of an augmented reality visual computing
system.
10/17/2017 5th $502.00
Alibaba Group Holding Ltd., EDB Investments, Fidelity Management & Research Co., Google Inc., Grupo Globo, Janus
Henderson Investors, JPMorgan Chase & Co., T. Rowe Price Group Inc., Temasek Holdings Pvt. Ltd.*
V E N T U R E C A P I T A L R E P O R T
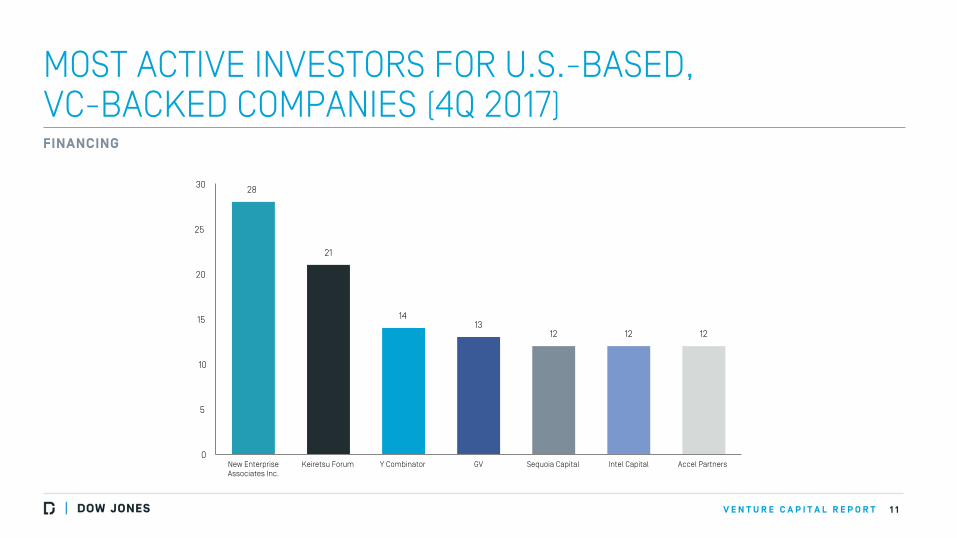
MOST ACTIVE INVESTORS FOR U.S.-BASED, VC-BACKED COMPANIES (4Q 2017)
1 1
FINANCING
28
21
14 13
12 12 12
0
5
10
15
20
25
30
New Enterprise Associates Inc.
Keiretsu Forum Y Combinator GV Sequoia Capital Intel Capital Accel Partners
V E N T U R E C A P I T A L R E P O R T
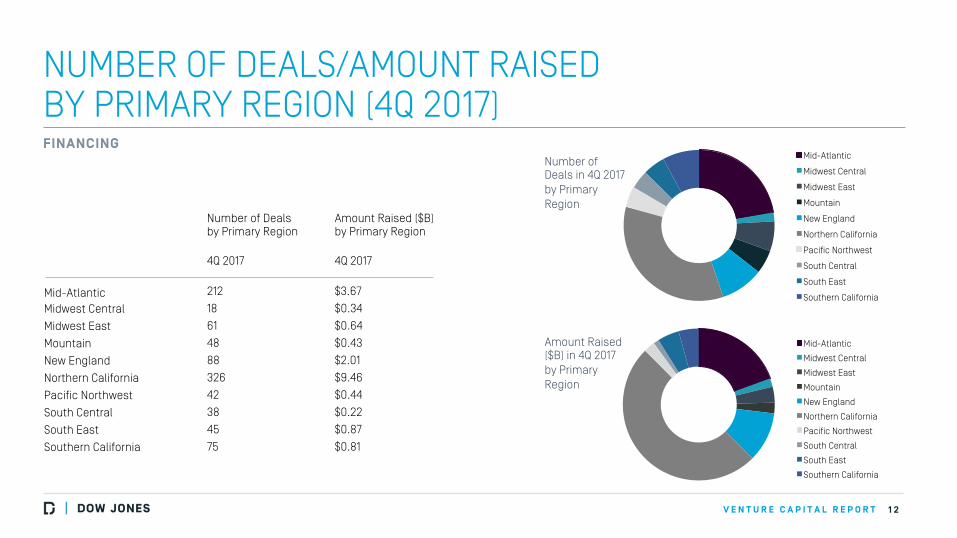
NUMBER OF DEALS/AMOUNT RAISED BY PRIMARY REGION (4Q 2017)
1 2
FINANCING Number of Deals in 4Q 2017 by Primary Region
Amount Raised ($B) in 4Q 2017 by Primary Region
Number of Deals by Primary Region 4Q 2017 212
18
61
48
88
326
42
38
45
75
Mid-Atlantic Midwest Central
Midwest East
Mountain
New England
Northern California
Pacific Northwest
South Central
South East
Southern California
Amount Raised ($B) by Primary Region 4Q 2017 $3.67
$0.34
$0.64
$0.43
$2.01
$9.46
$0.44
$0.22
$0.87
$0.81
Mid-Atlantic
Midwest Central
Midwest East
Mountain
New England
Northern California
Pacific Northwest
South Central
South East
Southern California
Mid-Atlantic
Midwest Central
Midwest East
Mountain
New England
Northern California
Pacific Northwest
South Central
South East
Southern California

V E N T U R E C A P I T A L R E P O R T
NUMBER OF DEALS/AMOUNT RAISED BY SUBREGION (4Q 2017)
1 3
FINANCING
Number of Deals by subregion 4Q 2017
Amount Raised ($B) by subregion 4Q 2017
Austin Metro 17 $0.11
Boston Metro 79 $1.97
Chicago Metro 26 $0.32 Dallas-Fort Worth 5 $0.05
Los Angeles Metro 39 $0.36
New York Metro 147 $2.41
Orange County 10 $0.04
Potomac 29 $0.66
San Diego Metro 22 $0.35
San Francisco Bay Area 327 $9.02
Seattle Metro 31 $0.29
Subregion Breakout Number of Deals
Subregion Breakout Amount Raised ($B)
17
79
26
5
39
147
10
29
22
327
31
Austin Metro
Boston Metro
Chicago Metro
Dallas-Fort Worth
Los Angeles Metro
New York Metro
Orange County
Potomac
San Diego Metro
San Francisco Bay Area
Seattle Metro
Number of Deals by Subregion
$0.11
$1.97
$0.32
$0.05
$0.36
$2.41
$0.04
$0.66
$0.35
$9.02
$0.29
Austin Metro
Boston Metro
Chicago Metro
Dallas-Fort Worth
Los Angeles Metro
New York Metro
Orange County
Potomac
San Diego Metro
San Francisco Bay Area
Seattle Metro
Amount Raised ($B) by subregion
V E N T U R E C A P I T A L R E P O R T
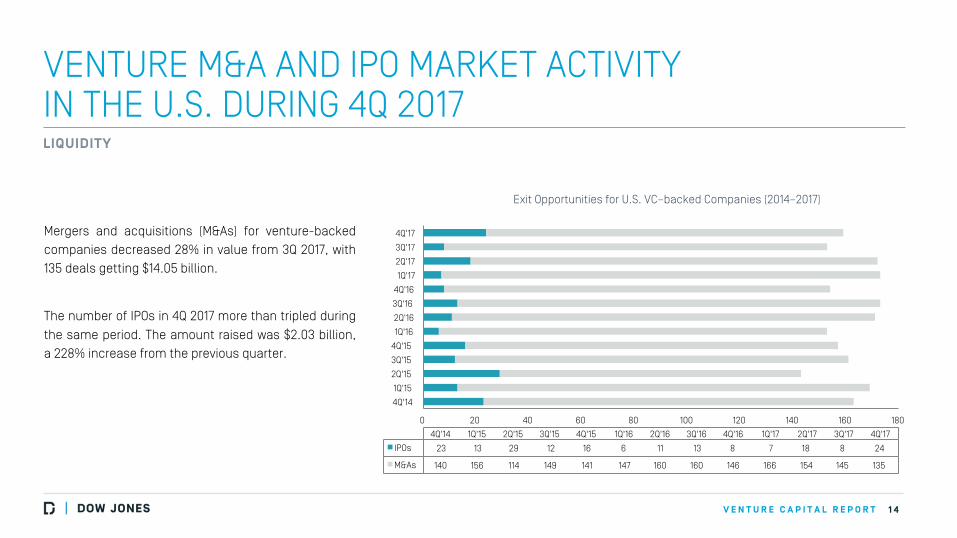
VENTURE M&A AND IPO MARKET ACTIVITY IN THE U.S. DURING 4Q 2017
Mergers and acquisitions (M&As) for venture-backed
companies decreased 28% in value from 3Q 2017, with
135 deals getting $14.05 billion.
The number of IPOs in 4Q 2017 more than tripled during
the same period. The amount raised was $2.03 billion,
a 228% increase from the previous quarter.
1 4
LIQUIDITY
Exit Opportunities for U.S. VC–backed Companies (2014–2017)
0 20 40 60 80 100 120 140 160 180
4Q'14
1Q'15
2Q'15
3Q'15
4Q'15
1Q'16
2Q'16
3Q'16
4Q'16
1Q'17
2Q'17
3Q'17
4Q'17
4Q'14 1Q'15 2Q'15 3Q'15 4Q'15 1Q'16 2Q'16 3Q'16 4Q'16 1Q'17 2Q'17 3Q'17 4Q'17
IPOs 23 13 29 12 16 6 11 13 8 7 18 8 24
M&As 140 156 114 149 141 147 160 160 146 166 154 145 135
V E N T U R E C A P I T A L R E P O R T
U.S. VC-BACKED M&As (2014-2017)
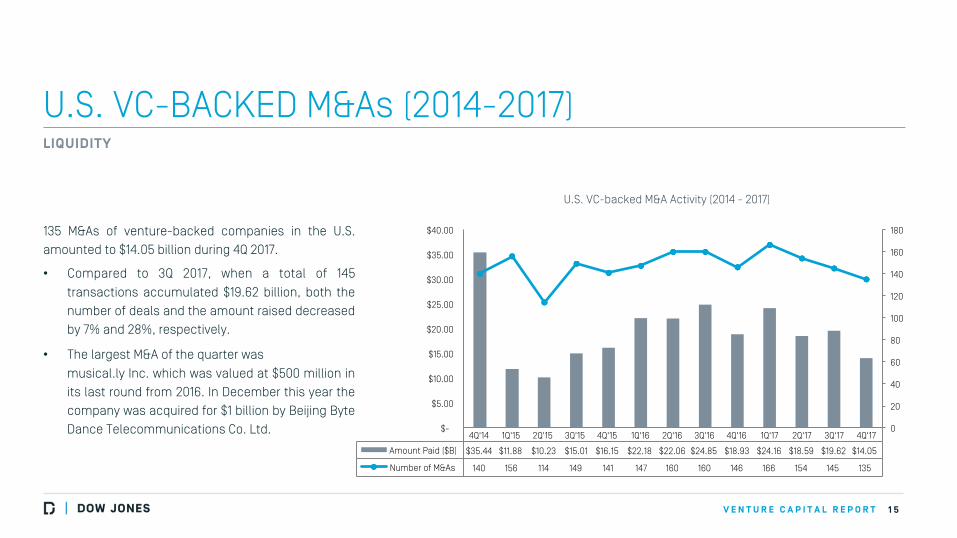
135 M&As of venture-backed companies in the U.S.
amounted to $14.05 billion during 4Q 2017.
• Compared to 3Q 2017, when a total of 145
transactions accumulated $19.62 billion, both the
number of deals and the amount raised decreased
by 7% and 28%, respectively.
• The largest M&A of the quarter was
musical.ly Inc. which was valued at $500 million in
its last round from 2016. In December this year the
company was acquired for $1 billion by Beijing Byte
Dance Telecommunications Co. Ltd.
1 5
LIQUIDITY
U.S. VC-backed M&A Activity (2014 - 2017)
4Q'14 1Q'15 2Q'15 3Q'15 4Q'15 1Q'16 2Q'16 3Q'16 4Q'16 1Q'17 2Q'17 3Q'17 4Q'17
Amount Paid ($B) $35.44 $11.88 $10.23 $15.01 $16.15 $22.18 $22.06 $24.85 $18.93 $24.16 $18.59 $19.62 $14.05
Number of M&As 140 156 114 149 141 147 160 160 146 166 154 145 135
0
20
40
60
80
100
120
140
160
180
$-
$5.00
$10.00
$15.00
$20.00
$25.00
$30.00
$35.00
$40.00
V E N T U R E C A P I T A L R E P O R T
TOP 3 U.S. M&As (4Q 2017)
1 6
LIQUIDITY
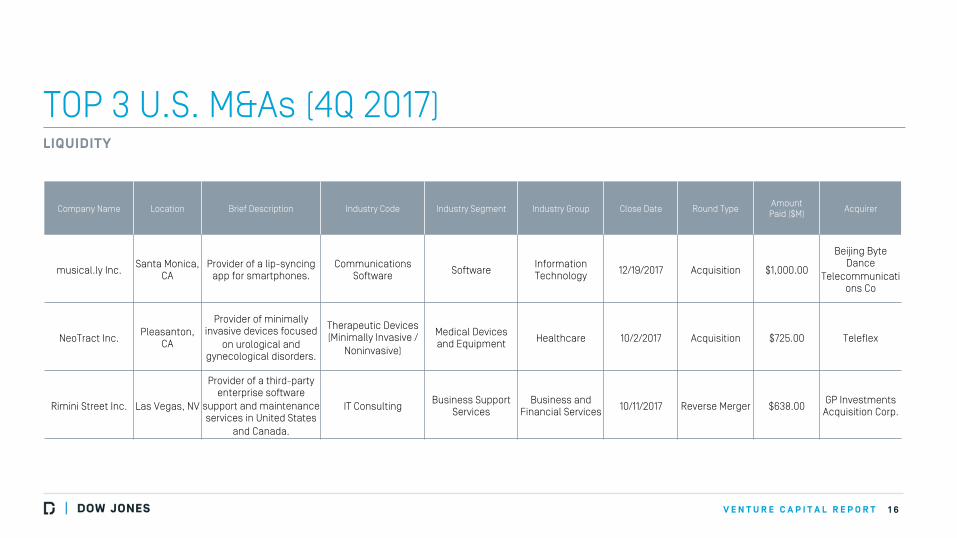
Company Name Location Brief Description Industry Code Industry Segment Industry Group Close Date Round Type Amount Paid ($M)
Acquirer
musical.ly Inc. Santa Monica,
CA Provider of a lip-syncing
app for smartphones. Communications
Software Software Information Technology 12/19/2017 Acquisition $1,000.00
Beijing Byte Dance
Telecommunications Co
NeoTract Inc. Pleasanton,
CA
Provider of minimally invasive devices focused
on urological and gynecological disorders.
Therapeutic Devices (Minimally Invasive /
Noninvasive)
Medical Devices and Equipment Healthcare 10/2/2017 Acquisition $725.00 Teleflex
Rimini Street Inc. Las Vegas, NV
Provider of a third-party enterprise software
support and maintenance services in United States
and Canada.
IT Consulting Business Support
Services Business and
Financial Services 10/11/2017 Reverse Merger $638.00 GP Investments
Acquisition Corp.
V E N T U R E C A P I T A L R E P O R T
U.S. VC-BACKED IPOs (2014-2017)
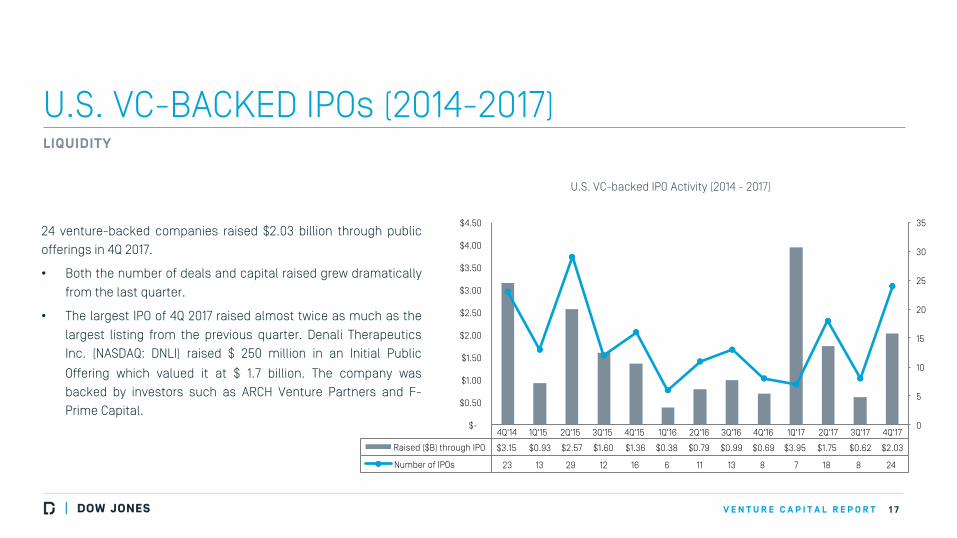
24 venture-backed companies raised $2.03 billion through public
offerings in 4Q 2017.
• Both the number of deals and capital raised grew dramatically
from the last quarter.
• The largest IPO of 4Q 2017 raised almost twice as much as the
largest listing from the previous quarter. Denali Therapeutics
Inc. (NASDAQ: DNLI) raised $ 250 million in an Initial Public
Offering which valued it at $ 1.7 billion. The company was
backed by investors such as ARCH Venture Partners and F-
Prime Capital.
1 7
LIQUIDITY
U.S. VC-backed IPO Activity (2014 - 2017)
4Q'14 1Q'15 2Q'15 3Q'15 4Q'15 1Q'16 2Q'16 3Q'16 4Q'16 1Q'17 2Q'17 3Q'17 4Q'17
Raised ($B) through IPO $3.15 $0.93 $2.57 $1.60 $1.36 $0.38 $0.79 $0.99 $0.69 $3.95 $1.75 $0.62 $2.03
Number of IPOs 23 13 29 12 16 6 11 13 8 7 18 8 24
0
5
10
15
20
25
30
35
$-
$0.50
$1.00
$1.50
$2.00
$2.50
$3.00
$3.50
$4.00
$4.50
V E N T U R E C A P I T A L R E P O R T
TOP 3 U.S. IPOs (4Q 2017)
1 8
LIQUIDITY
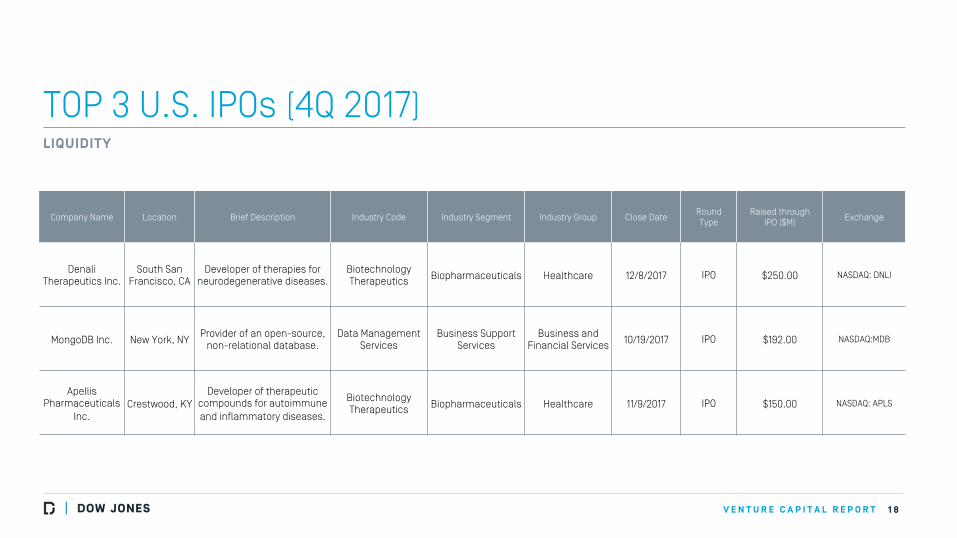
Company Name Location Brief Description Industry Code Industry Segment Industry Group Close Date Round Type
Raised through IPO ($M)
Exchange
Denali Therapeutics Inc.
South San Francisco, CA
Developer of therapies for neurodegenerative diseases.
Biotechnology Therapeutics Biopharmaceuticals Healthcare 12/8/2017 IPO $250.00 NASDAQ: DNLI
MongoDB Inc. New York, NY Provider of an open-source,
non-relational database. Data Management
Services Business Support
Services Business and
Financial Services 10/19/2017 IPO $192.00 NASDAQ:MDB
Apellis Pharmaceuticals
Inc. Crestwood, KY
Developer of therapeutic compounds for autoimmune and inflammatory diseases.
Biotechnology Therapeutics Biopharmaceuticals Healthcare 11/9/2017 IPO $150.00 NASDAQ: APLS

V E N T U R E C A P I T A L R E P O R T
ABOUT US
Dow Jones VentureSource helps venture capitalists, corporate development executives, investment bankers and service providers find deal and
partnership opportunities, perform comprehensive due diligence and examine trends in venture capital investment, fund-raising and liquidity. It
provides accurate, comprehensive data on venture-backed companies – including their investors and executives – in every region, industry and stage of
development throughout the world.
The investment figures included in this release are based on aggregate findings of Dow Jones' proprietary research and are contained in VentureSource.
This data was collected through surveys of professional firms, interviews with company executives, and from secondary sources. These venture capital
statistics cover equity investments into early stage, innovative companies and do not include companies receiving funding solely from corporate,
individual, and/or government investors. Figures contained throughout the report current at time of editorial but are subject to change without notice.
No statement herein is to be construed as a recommendation to buy or sell securities or to provide investment advice.
1 9
V E N T U R E C A P I T A L R E P O R T
ABOUT DOW JONES
Dow Jones is a global provider of news and business information, delivering content to consumers and organizations around the world across multiple
formats, including print, digital, mobile and live events. Dow Jones has produced unrivaled quality content for more than 125 years and today has one of
the world’s largest newsgathering operations globally. It produces leading publications and products including the flagship Wall Street Journal,
America’s largest newspaper by paid circulation; Factiva, Barron’s, MarketWatch, Financial News, DJX, Dow Jones Risk & Compliance, Dow Jones
Newswires, and Dow Jones VentureSource.
MEDIA CONTACT:
Colleen Schwartz 212.416.3583
2 0


![Early Stage Venture Capital Limited Partnerships (ESVCLP) · KTM Ventures Innovation Fund LP [ILP1600034 - NSW] Contact Target Investment Mr Martin Rogers KTM Ventures General Partner](https://cdn.vdocuments.mx/doc/165x107/5f0db6037e708231d43bb4a3/early-stage-venture-capital-limited-partnerships-esvclp-ktm-ventures-innovation.jpg)

