UR
BA
N S
OL
ID W
AST
E M
AN
AG
EM
EN
T
URBAN SOLID WASTE MANAGEMENTMunicipal Waste and its Management

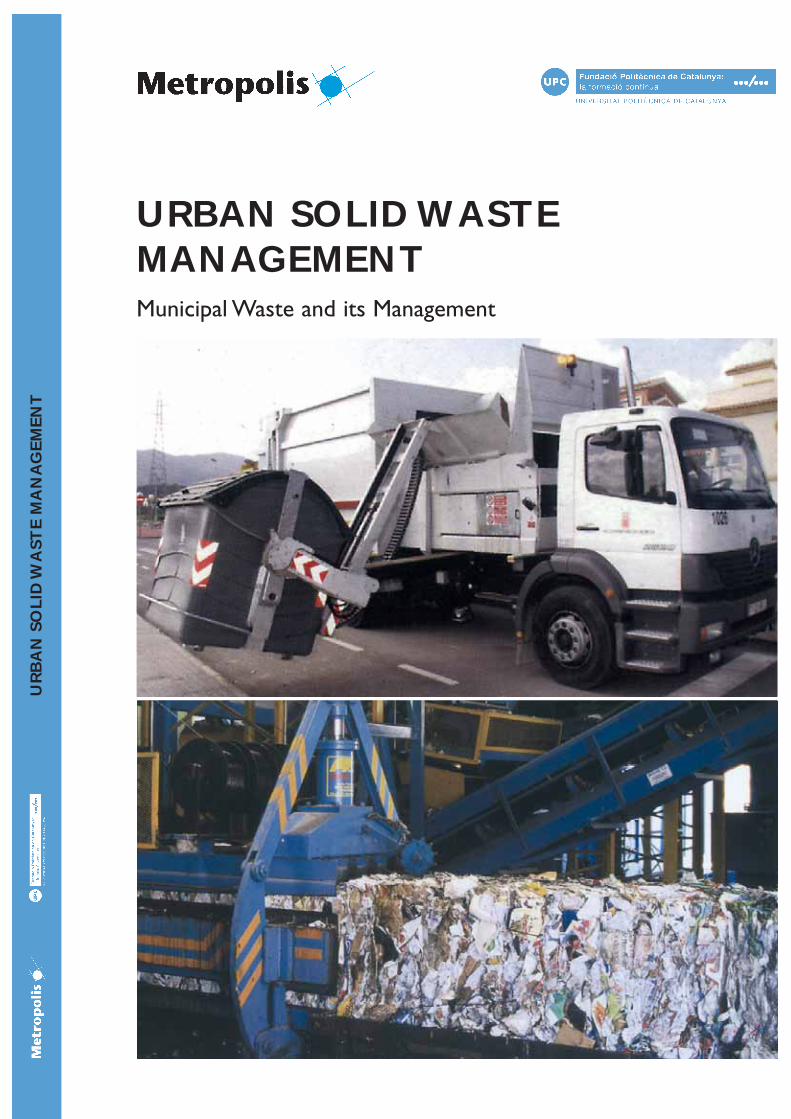
URBAN SOLID WASTEMANAGEMENT
Municipal Waste and its Management
Coordination:
Josep Maria Casas Sabata,
Polytechnic University of Barcelona (Spain)
Authors:
Josep Maria Casas Sabata, Polytechnic University of Barcelona (Spain)
Albert Torras, Barcelona Metropolitan Area Environment Department (Spain)
Enric Garriga Elies, Metropolitan Environment Organization, Barcelona (Spain)
Meritxell Martell, Polytechnic University of Barcelona (Spain)
Collaborators:
Teresa Sánchez, Quito City Council (Ecuador)
Graciela Gerola, CEAMSE, Buenos Aires (Argentina)
Joaquín Ayora, Secretariat of Ecology (Mexico)
Eduardo González, Jalisco State (Mexico)
Luciano Hernández, Directorate of Provincial Communal Services, Havana (Cuba)
Gonzalo Vargas, La Paz (Bolivia)
Barbarito Hernández, Directorate of Provincial Communal Services, Havana (Cuba)
Jean François Apoko, Brazzaville (Democratic Republic of the Congo)
Participating Cities:
Barcelona (Spain)
Buenos Aires (Argentina)
Quito and Cuenca (Ecuador)
Mexico City and Jalisco (Mexico)
Montreal (Canada)
Havana (Cuba)
Alexandria (Egypt)
La Paz (Bolivia)
With sponsorship of METROPOLIS:World Association of the Major Metropolises
© 2005,World Association of the Major Metropolises. MetropolisBarcelona City CouncilAvinyó 15 08002 Barcelona (Spain)[email protected]
Edición, March 2005
Graphic Design: Diario Grossi
Printing: Treballs Gràfics, SAPrinting on paper recycled
PRESENTATION
3
The world’s big cities confront the difficult challenge of the environ-mental management of their urban centers every day. Daily public, commer-cial and industrial life involves the challenge of properly managing municipalwaste to try to promote the reduction of waste production and make betteruse of recoverable fractions.
Metropolis Commission 3 has tried throughout its working life to pro-mote the sustainable management of resources and to provide member citieswith the expertise and instruments that the cities have been developing.Thetechnical assistance programs, seminars and exchanges have favored thisexchange.
We have now gathered all the technical issues and concrete experiencesinto this Waste Management Manual, so it may be used by local politiciansand technicians as a good practices guide. The aim was to design a trainingmanual that could contribute to environmental protection, waste manage-ment and the quality of life of our citizens.
Jose CuervoPresident, Commission 3 Metropolis
President of the Metropolitan Environment Organization for the Barcelona Metropolitan Area
Cities and people face the important duty of promoting sustainabilityin the broad sense of the word. The protection of the environment andresources and the wellbeing of our citizens are all part of this strategy.
Solidarity and international and inter-generational cooperation are valuesthat cities and associations like Metropolis should promote.
Commission 3 has dedicated a great deal of human and economicresources to promoting the exchange of knowledge, technology, experienceand training.
Training technicians and politicians with regard to waste managementhas been a cornerstone of the Commission’s work. With the participationand coordination of the Polytechnic University of Catalonia, we have pre-pared the Municipal Waste Management Manual to be an ongoing instru-ment that can be used by cities and their waste technicians.
The Manual not only attempts to explain the technical values of theefficient management of municipal waste, but also defend the values of envi-ronmental education and public participation in this process, along withrespect for clean technologies adapted to the realities and requirements of thedifferent countries, in accordance with their own cultures and languages.
Enric Garriga EliesTechnical Coordinator, Commission 3
4
PRESENTATION
INTRODUCTION
5
This Municipal Waste Management Manual is the result of the concernand activity of many people who work in the sector. Starting with theMetropolis Commission 3 training courses devoted to municipal waste manage-ment, we gathered together the material of most interest to the differentgroups at which it is aimed.The Manual is divided into five basic chapters:The Problem of Municipal Waste and How to Manage It;Waste Recycling,Composting and Methanization;Waste Incineration and Controlled Dumping;Legislation and Human and Financial Resources and Environmental Education,Communication and Public Participation.
With this material we aim to provide a support that will be useful to thecountries and cities that have yet to begin or that need to improve manage-ment in the vast field of waste. Using original situations that differed in terms ofeach country as the starting point, our aim was to work toward improved levelsof organization and management of municipal solid waste in a comprehensiveand sustainable manner. As a good practices guide, the Manual providesinformation on technologies, processes and methodologies successfullyapplied in other countries and which directly impact resource use, wasteassessment and the preservation of the environment.
Because the Manual was mainly prepared in Barcelona, it devotes mostattention to the waste-management program in place in Catalonia.The legis-lation and regulations set out herein also refer to those currently in force inCatalonia and should thus be complemented with those in force in eachcountry.
With the aim of providing plural visions and realities of other contexts,the Manual introduces practices in municipal solid waste management in anumber of Metropolis member cities, such as the states of Mexico and Jaliscoand the cities of Barcelona, Buenos Aires, Quito, Cuenca, Montreal, Calcutta,Alexandria and Havana.
Josep Maria Casas SabataCoordinator
Polytechnic University of CataloniaBarcelona, Spain
1. The Problem of Municipal Waste and How to Manage It. . . . . . . . . . . . . . . . . . . . . . . . . . . . . . . . . . . . . . . . . . . . . . . . . . . . . . . . . . . . 111.1. Introduction and Definition of Waste . . . . . . . . . . . . . . . . . . . . . . . . . . . . . . . . . . . . . . . . . . . . . . . . . . . . . . . . . . . . . . . . . . . . . . . . . . . . . . . . . . . . . . . . 111.2. Basic Regulations and Classifications. . . . . . . . . . . . . . . . . . . . . . . . . . . . . . . . . . . . . . . . . . . . . . . . . . . . . . . . . . . . . . . . . . . . . . . . . . . . . . . . . . . . . . . . . 121.3. Total Waste Generation and Sources . . . . . . . . . . . . . . . . . . . . . . . . . . . . . . . . . . . . . . . . . . . . . . . . . . . . . . . . . . . . . . . . . . . . . . . . . . . . . . . . . . . . . . . . . . 131.4. Municipal Household Waste or Urban Solid Waste (USW). . . . . . . . . . . . . . . . . . . . . . . . . . . . . . . . . . . . . . . . . . . . . . . . . . . . . . . . . . . . 14
1.4.1. Average Waste Composition . . . . . . . . . . . . . . . . . . . . . . . . . . . . . . . . . . . . . . . . . . . . . . . . . . . . . . . . . . . . . . . . . . . . . . . . . . . . . . . . . . . . . . . . . . 151.4.2. Waste Bag Characteristics . . . . . . . . . . . . . . . . . . . . . . . . . . . . . . . . . . . . . . . . . . . . . . . . . . . . . . . . . . . . . . . . . . . . . . . . . . . . . . . . . . . . . . . . . . . . . 161.4.3. Comprehensive Municipal Waste Management . . . . . . . . . . . . . . . . . . . . . . . . . . . . . . . . . . . . . . . . . . . . . . . . . . . . . . . . . . . . . . . . . 17
1.5. Waste Collection Systems. . . . . . . . . . . . . . . . . . . . . . . . . . . . . . . . . . . . . . . . . . . . . . . . . . . . . . . . . . . . . . . . . . . . . . . . . . . . . . . . . . . . . . . . . . . . . . . . . . . . . . . . 181.5.1. Containers in the Street, Close to Households . . . . . . . . . . . . . . . . . . . . . . . . . . . . . . . . . . . . . . . . . . . . . . . . . . . . . . . . . . . . . . . . . 181.5.2. Contribution Areas . . . . . . . . . . . . . . . . . . . . . . . . . . . . . . . . . . . . . . . . . . . . . . . . . . . . . . . . . . . . . . . . . . . . . . . . . . . . . . . . . . . . . . . . . . . . . . . . . . . . . . 211.5.3. Door-to-Door . . . . . . . . . . . . . . . . . . . . . . . . . . . . . . . . . . . . . . . . . . . . . . . . . . . . . . . . . . . . . . . . . . . . . . . . . . . . . . . . . . . . . . . . . . . . . . . . . . . . . . . . . . . . 211.5.4. Pneumatic Systems . . . . . . . . . . . . . . . . . . . . . . . . . . . . . . . . . . . . . . . . . . . . . . . . . . . . . . . . . . . . . . . . . . . . . . . . . . . . . . . . . . . . . . . . . . . . . . . . . . . . . . 22
1.6. Contribution Centers: Drop-off Centers or Green Points . . . . . . . . . . . . . . . . . . . . . . . . . . . . . . . . . . . . . . . . . . . . . . . . . . . . . . . . . . . . . 241.7. Waste Transfer Plants . . . . . . . . . . . . . . . . . . . . . . . . . . . . . . . . . . . . . . . . . . . . . . . . . . . . . . . . . . . . . . . . . . . . . . . . . . . . . . . . . . . . . . . . . . . . . . . . . . . . . . . . . . . . . . 251.8. Waste from Markets, Large Stores and Services . . . . . . . . . . . . . . . . . . . . . . . . . . . . . . . . . . . . . . . . . . . . . . . . . . . . . . . . . . . . . . . . . . . . . . . . . . . 261.9. The Treatment of Household Waste . . . . . . . . . . . . . . . . . . . . . . . . . . . . . . . . . . . . . . . . . . . . . . . . . . . . . . . . . . . . . . . . . . . . . . . . . . . . . . . . . . . . . . . . . . 261.10. Industrial Waste . . . . . . . . . . . . . . . . . . . . . . . . . . . . . . . . . . . . . . . . . . . . . . . . . . . . . . . . . . . . . . . . . . . . . . . . . . . . . . . . . . . . . . . . . . . . . . . . . . . . . . . . . . . . . . . . . . . . . 28
1.10.1. Diagram of the Industrial Waste Management Process . . . . . . . . . . . . . . . . . . . . . . . . . . . . . . . . . . . . . . . . . . . . . . . . . . . . . . . 291.10.2. Objectives of an Industrial Waste Management Program . . . . . . . . . . . . . . . . . . . . . . . . . . . . . . . . . . . . . . . . . . . . . . . . . . . . 291.10.3. The European Waste Catalogue . . . . . . . . . . . . . . . . . . . . . . . . . . . . . . . . . . . . . . . . . . . . . . . . . . . . . . . . . . . . . . . . . . . . . . . . . . . . . . . . . . . . . 311.10.4. Generation of Hazardous Waste in Europe . . . . . . . . . . . . . . . . . . . . . . . . . . . . . . . . . . . . . . . . . . . . . . . . . . . . . . . . . . . . . . . . . . . . . . . 321.10.5. The Center for Enterprises and the Environment (CEMA). . . . . . . . . . . . . . . . . . . . . . . . . . . . . . . . . . . . . . . . . . . . . . . . 321.10.6. The Sub-Products Waste Stock Exchange . . . . . . . . . . . . . . . . . . . . . . . . . . . . . . . . . . . . . . . . . . . . . . . . . . . . . . . . . . . . . . . . . . . . . . . 33
1.11. Primary Sector Waste: Agricultural, Forestry and Livestock Waste . . . . . . . . . . . . . . . . . . . . . . . . . . . . . . . . . . . . . . . . . . . . . . . . . . . 351.11.1. Composting and Biogas from Livestock Waste . . . . . . . . . . . . . . . . . . . . . . . . . . . . . . . . . . . . . . . . . . . . . . . . . . . . . . . . . . . . . . . . . . 371.11.2. Slurry Biogas Plant. . . . . . . . . . . . . . . . . . . . . . . . . . . . . . . . . . . . . . . . . . . . . . . . . . . . . . . . . . . . . . . . . . . . . . . . . . . . . . . . . . . . . . . . . . . . . . . . . . . . . . 38
1.12. Waste from the Mining and Construction Industries . . . . . . . . . . . . . . . . . . . . . . . . . . . . . . . . . . . . . . . . . . . . . . . . . . . . . . . . . . . . . . . . . . . . 381.12.1. Mining and Quarry Waste . . . . . . . . . . . . . . . . . . . . . . . . . . . . . . . . . . . . . . . . . . . . . . . . . . . . . . . . . . . . . . . . . . . . . . . . . . . . . . . . . . . . . . . . . . . . 381.12.2. Construction Waste . . . . . . . . . . . . . . . . . . . . . . . . . . . . . . . . . . . . . . . . . . . . . . . . . . . . . . . . . . . . . . . . . . . . . . . . . . . . . . . . . . . . . . . . . . . . . . . . . . . . . 39
1.13. Sanitary Waste and Its Management . . . . . . . . . . . . . . . . . . . . . . . . . . . . . . . . . . . . . . . . . . . . . . . . . . . . . . . . . . . . . . . . . . . . . . . . . . . . . . . . . . . . . . . . . . 411.13.1. Classification and Management of Sanitary Waste. . . . . . . . . . . . . . . . . . . . . . . . . . . . . . . . . . . . . . . . . . . . . . . . . . . . . . . . . . . . . . 421.13.2. Sanitary Waste Sterilization Plant . . . . . . . . . . . . . . . . . . . . . . . . . . . . . . . . . . . . . . . . . . . . . . . . . . . . . . . . . . . . . . . . . . . . . . . . . . . . . . . . . . . 42
1.14. Small Quantity Special Waste . . . . . . . . . . . . . . . . . . . . . . . . . . . . . . . . . . . . . . . . . . . . . . . . . . . . . . . . . . . . . . . . . . . . . . . . . . . . . . . . . . . . . . . . . . . . . . . . . . . 431.15. Radioactive or Nuclear Waste . . . . . . . . . . . . . . . . . . . . . . . . . . . . . . . . . . . . . . . . . . . . . . . . . . . . . . . . . . . . . . . . . . . . . . . . . . . . . . . . . . . . . . . . . . . . . . . . . . 451.16. Monitoring, Characterizing and Analyzing Waste. . . . . . . . . . . . . . . . . . . . . . . . . . . . . . . . . . . . . . . . . . . . . . . . . . . . . . . . . . . . . . . . . . . . . . . . . 46
1.16.1. Waste Sampling . . . . . . . . . . . . . . . . . . . . . . . . . . . . . . . . . . . . . . . . . . . . . . . . . . . . . . . . . . . . . . . . . . . . . . . . . . . . . . . . . . . . . . . . . . . . . . . . . . . . . . . . . . 461.16.2. Waste Analysis Methods. . . . . . . . . . . . . . . . . . . . . . . . . . . . . . . . . . . . . . . . . . . . . . . . . . . . . . . . . . . . . . . . . . . . . . . . . . . . . . . . . . . . . . . . . . . . . . . . 491.16.3. Waste Analysis . . . . . . . . . . . . . . . . . . . . . . . . . . . . . . . . . . . . . . . . . . . . . . . . . . . . . . . . . . . . . . . . . . . . . . . . . . . . . . . . . . . . . . . . . . . . . . . . . . . . . . . . . . . . 491.16.4. Leachate Analysis . . . . . . . . . . . . . . . . . . . . . . . . . . . . . . . . . . . . . . . . . . . . . . . . . . . . . . . . . . . . . . . . . . . . . . . . . . . . . . . . . . . . . . . . . . . . . . . . . . . . . . . . 511.16.5. Ecotoxicity . . . . . . . . . . . . . . . . . . . . . . . . . . . . . . . . . . . . . . . . . . . . . . . . . . . . . . . . . . . . . . . . . . . . . . . . . . . . . . . . . . . . . . . . . . . . . . . . . . . . . . . . . . . . . . . . 521.16.6. Limits on Waste and Leachates. . . . . . . . . . . . . . . . . . . . . . . . . . . . . . . . . . . . . . . . . . . . . . . . . . . . . . . . . . . . . . . . . . . . . . . . . . . . . . . . . . . . . . . 531.16.7. Experiences of the Barcelona Metropolitan Program on Municipal Waste . . . . . . . . . . . . . . . . . . . . . . . . . . . . . 541.16.8. Experiences in Calcutta (India). . . . . . . . . . . . . . . . . . . . . . . . . . . . . . . . . . . . . . . . . . . . . . . . . . . . . . . . . . . . . . . . . . . . . . . . . . . . . . . . . . . . . . 56
2. Waste Recycling, Composting and Methanization . . . . . . . . . . . . . . . . . . . . . . . . . . . . . . . . . . . . . . . . . . . . . . . . . . . . . . . . . . . . . . . . . . . . . . . 612.1. Waste Recovery . . . . . . . . . . . . . . . . . . . . . . . . . . . . . . . . . . . . . . . . . . . . . . . . . . . . . . . . . . . . . . . . . . . . . . . . . . . . . . . . . . . . . . . . . . . . . . . . . . . . . . . . . . . . . . . . . . . . 612.2. The Informal Sector in the Recovery of Materials (Scavengers) . . . . . . . . . . . . . . . . . . . . . . . . . . . . . . . . . . . . . . . . . . . . . . . . . . . . . 612.3. Recycling Paper and Cardboard . . . . . . . . . . . . . . . . . . . . . . . . . . . . . . . . . . . . . . . . . . . . . . . . . . . . . . . . . . . . . . . . . . . . . . . . . . . . . . . . . . . . . . . . . . . . . . . 622.4. Recycling Glass . . . . . . . . . . . . . . . . . . . . . . . . . . . . . . . . . . . . . . . . . . . . . . . . . . . . . . . . . . . . . . . . . . . . . . . . . . . . . . . . . . . . . . . . . . . . . . . . . . . . . . . . . . . . . . . . . . . . 622.5. Packaging and Bottling . . . . . . . . . . . . . . . . . . . . . . . . . . . . . . . . . . . . . . . . . . . . . . . . . . . . . . . . . . . . . . . . . . . . . . . . . . . . . . . . . . . . . . . . . . . . . . . . . . . . . . . . . . . 63
– Savings from Recycling . . . . . . . . . . . . . . . . . . . . . . . . . . . . . . . . . . . . . . . . . . . . . . . . . . . . . . . . . . . . . . . . . . . . . . . . . . . . . . . . . . . . . . . . . . . . . . . . . . . . . . . 652.6. Metals and Scrap Metal . . . . . . . . . . . . . . . . . . . . . . . . . . . . . . . . . . . . . . . . . . . . . . . . . . . . . . . . . . . . . . . . . . . . . . . . . . . . . . . . . . . . . . . . . . . . . . . . . . . . . . . . . . 662.7. Plastics and Tires . . . . . . . . . . . . . . . . . . . . . . . . . . . . . . . . . . . . . . . . . . . . . . . . . . . . . . . . . . . . . . . . . . . . . . . . . . . . . . . . . . . . . . . . . . . . . . . . . . . . . . . . . . . . . . . . . . . 662.8. Oils and Lubricants. . . . . . . . . . . . . . . . . . . . . . . . . . . . . . . . . . . . . . . . . . . . . . . . . . . . . . . . . . . . . . . . . . . . . . . . . . . . . . . . . . . . . . . . . . . . . . . . . . . . . . . . . . . . . . . . 692.9. Household and Electronic Equipment . . . . . . . . . . . . . . . . . . . . . . . . . . . . . . . . . . . . . . . . . . . . . . . . . . . . . . . . . . . . . . . . . . . . . . . . . . . . . . . . . . . . . . . 702.10. Vehicle Scrapping . . . . . . . . . . . . . . . . . . . . . . . . . . . . . . . . . . . . . . . . . . . . . . . . . . . . . . . . . . . . . . . . . . . . . . . . . . . . . . . . . . . . . . . . . . . . . . . . . . . . . . . . . . . . . . . . . . 712.11. Drugs and Laboratory Products . . . . . . . . . . . . . . . . . . . . . . . . . . . . . . . . . . . . . . . . . . . . . . . . . . . . . . . . . . . . . . . . . . . . . . . . . . . . . . . . . . . . . . . . . . . . . . . . 722.12. Composting Based on Waste and Sludge . . . . . . . . . . . . . . . . . . . . . . . . . . . . . . . . . . . . . . . . . . . . . . . . . . . . . . . . . . . . . . . . . . . . . . . . . . . . . . . . . . . . 722.13. Home Composters. . . . . . . . . . . . . . . . . . . . . . . . . . . . . . . . . . . . . . . . . . . . . . . . . . . . . . . . . . . . . . . . . . . . . . . . . . . . . . . . . . . . . . . . . . . . . . . . . . . . . . . . . . . . . . . . . 742.14. Methanization and Biogas . . . . . . . . . . . . . . . . . . . . . . . . . . . . . . . . . . . . . . . . . . . . . . . . . . . . . . . . . . . . . . . . . . . . . . . . . . . . . . . . . . . . . . . . . . . . . . . . . . . . . . . 742.15. Ecoparks . . . . . . . . . . . . . . . . . . . . . . . . . . . . . . . . . . . . . . . . . . . . . . . . . . . . . . . . . . . . . . . . . . . . . . . . . . . . . . . . . . . . . . . . . . . . . . . . . . . . . . . . . . . . . . . . . . . . . . . . . . . . . . 752.16. Cost Study . . . . . . . . . . . . . . . . . . . . . . . . . . . . . . . . . . . . . . . . . . . . . . . . . . . . . . . . . . . . . . . . . . . . . . . . . . . . . . . . . . . . . . . . . . . . . . . . . . . . . . . . . . . . . . . . . . . . . . . . . . . 75
2.16.1. Generation Costs . . . . . . . . . . . . . . . . . . . . . . . . . . . . . . . . . . . . . . . . . . . . . . . . . . . . . . . . . . . . . . . . . . . . . . . . . . . . . . . . . . . . . . . . . . . . . . . . . . . . . . . . . 752.16.2. Collection and Transport Costs . . . . . . . . . . . . . . . . . . . . . . . . . . . . . . . . . . . . . . . . . . . . . . . . . . . . . . . . . . . . . . . . . . . . . . . . . . . . . . . . . . . . . . 762.16.3.Treatment Costs. . . . . . . . . . . . . . . . . . . . . . . . . . . . . . . . . . . . . . . . . . . . . . . . . . . . . . . . . . . . . . . . . . . . . . . . . . . . . . . . . . . . . . . . . . . . . . . . . . . . . . . . . . . 762.16.4. Management and Control Costs . . . . . . . . . . . . . . . . . . . . . . . . . . . . . . . . . . . . . . . . . . . . . . . . . . . . . . . . . . . . . . . . . . . . . . . . . . . . . . . . . . . . . 76
2.17. Experience in Buenos Aires (Argentina) . . . . . . . . . . . . . . . . . . . . . . . . . . . . . . . . . . . . . . . . . . . . . . . . . . . . . . . . . . . . . . . . . . . . . . . . . . . . . . . . . . . . 782.18. Experience in Cuenca (Ecuador) . . . . . . . . . . . . . . . . . . . . . . . . . . . . . . . . . . . . . . . . . . . . . . . . . . . . . . . . . . . . . . . . . . . . . . . . . . . . . . . . . . . . . . . . . . . . . . 80
6
ÍNDEX
7
3. Waste Incineration and Controlled Dumping . . . . . . . . . . . . . . . . . . . . . . . . . . . . . . . . . . . . . . . . . . . . . . . . . . . . . . . . . . . . . . . . . . . . . . . . . . . . . . 853.1. Thermal Treatment of Waste . . . . . . . . . . . . . . . . . . . . . . . . . . . . . . . . . . . . . . . . . . . . . . . . . . . . . . . . . . . . . . . . . . . . . . . . . . . . . . . . . . . . . . . . . . . . . . . . . . . . 853.2. Calorific Value of Waste . . . . . . . . . . . . . . . . . . . . . . . . . . . . . . . . . . . . . . . . . . . . . . . . . . . . . . . . . . . . . . . . . . . . . . . . . . . . . . . . . . . . . . . . . . . . . . . . . . . . . . . . . . 863.3. Types of Incinerators . . . . . . . . . . . . . . . . . . . . . . . . . . . . . . . . . . . . . . . . . . . . . . . . . . . . . . . . . . . . . . . . . . . . . . . . . . . . . . . . . . . . . . . . . . . . . . . . . . . . . . . . . . . . . . 863.4. Incineration of Municipal Waste . . . . . . . . . . . . . . . . . . . . . . . . . . . . . . . . . . . . . . . . . . . . . . . . . . . . . . . . . . . . . . . . . . . . . . . . . . . . . . . . . . . . . . . . . . . . . . . 893.5. Incineration of Special Waste . . . . . . . . . . . . . . . . . . . . . . . . . . . . . . . . . . . . . . . . . . . . . . . . . . . . . . . . . . . . . . . . . . . . . . . . . . . . . . . . . . . . . . . . . . . . . . . . . . . 903.6. Incineration of Sanitary Waste . . . . . . . . . . . . . . . . . . . . . . . . . . . . . . . . . . . . . . . . . . . . . . . . . . . . . . . . . . . . . . . . . . . . . . . . . . . . . . . . . . . . . . . . . . . . . . . . . . 903.7. Legislation Governing Waste Incineration . . . . . . . . . . . . . . . . . . . . . . . . . . . . . . . . . . . . . . . . . . . . . . . . . . . . . . . . . . . . . . . . . . . . . . . . . . . . . . . . . . 913.8. From Dumps to Sanitary Landfills . . . . . . . . . . . . . . . . . . . . . . . . . . . . . . . . . . . . . . . . . . . . . . . . . . . . . . . . . . . . . . . . . . . . . . . . . . . . . . . . . . . . . . . . . . . . 923.9. Basic Principles of a Sanitary Landfill . . . . . . . . . . . . . . . . . . . . . . . . . . . . . . . . . . . . . . . . . . . . . . . . . . . . . . . . . . . . . . . . . . . . . . . . . . . . . . . . . . . . . . . . 933.10 Geological Bases and Preparation of the Controlled Dump Basin . . . . . . . . . . . . . . . . . . . . . . . . . . . . . . . . . . . . . . . . . . . . . . . . . . . 953.11. Dump Infrastructures . . . . . . . . . . . . . . . . . . . . . . . . . . . . . . . . . . . . . . . . . . . . . . . . . . . . . . . . . . . . . . . . . . . . . . . . . . . . . . . . . . . . . . . . . . . . . . . . . . . . . . . . . . . . . 983.12. Operating a Controlled Dump . . . . . . . . . . . . . . . . . . . . . . . . . . . . . . . . . . . . . . . . . . . . . . . . . . . . . . . . . . . . . . . . . . . . . . . . . . . . . . . . . . . . . . . . . . . . . . . 1013.13. Closing a Controlled Dump. . . . . . . . . . . . . . . . . . . . . . . . . . . . . . . . . . . . . . . . . . . . . . . . . . . . . . . . . . . . . . . . . . . . . . . . . . . . . . . . . . . . . . . . . . . . . . . . . . . 1013.14. Dump Management and Control in Post-Closure Period . . . . . . . . . . . . . . . . . . . . . . . . . . . . . . . . . . . . . . . . . . . . . . . . . . . . . . . . . . . . 1033.15. Dump Costs and Bonds . . . . . . . . . . . . . . . . . . . . . . . . . . . . . . . . . . . . . . . . . . . . . . . . . . . . . . . . . . . . . . . . . . . . . . . . . . . . . . . . . . . . . . . . . . . . . . . . . . . . . . . . 1043.16. Waste Admission Criteria . . . . . . . . . . . . . . . . . . . . . . . . . . . . . . . . . . . . . . . . . . . . . . . . . . . . . . . . . . . . . . . . . . . . . . . . . . . . . . . . . . . . . . . . . . . . . . . . . . . . . . 1053.17. Experience in State of Mexico . . . . . . . . . . . . . . . . . . . . . . . . . . . . . . . . . . . . . . . . . . . . . . . . . . . . . . . . . . . . . . . . . . . . . . . . . . . . . . . . . . . . . . . . . . . . . . . 1063.18. Experience in Quito (Ecuador) . . . . . . . . . . . . . . . . . . . . . . . . . . . . . . . . . . . . . . . . . . . . . . . . . . . . . . . . . . . . . . . . . . . . . . . . . . . . . . . . . . . . . . . . . . . . . . 108
4. Legislation. Human Resources and Financial Resources . . . . . . . . . . . . . . . . . . . . . . . . . . . . . . . . . . . . . . . . . . . . . . . . . . . . . . . . . . . . 1134.1. Legislation . . . . . . . . . . . . . . . . . . . . . . . . . . . . . . . . . . . . . . . . . . . . . . . . . . . . . . . . . . . . . . . . . . . . . . . . . . . . . . . . . . . . . . . . . . . . . . . . . . . . . . . . . . . . . . . . . . . . . . . . . . 113
4.1.1. European Directives . . . . . . . . . . . . . . . . . . . . . . . . . . . . . . . . . . . . . . . . . . . . . . . . . . . . . . . . . . . . . . . . . . . . . . . . . . . . . . . . . . . . . . . . . . . . . . . . . . . 1134.1.2. Legislation in Spain and the Autonomous Regions. . . . . . . . . . . . . . . . . . . . . . . . . . . . . . . . . . . . . . . . . . . . . . . . . . . . . . . . . . 1154.1.3. Legislation in Latin America: Argentina, Bolivia, Ecuador and Mexico . . . . . . . . . . . . . . . . . . . . . . . . . . . . . . . . 1174.1.4. African Legislation: Democratic Republic of the Congo . . . . . . . . . . . . . . . . . . . . . . . . . . . . . . . . . . . . . . . . . . . . . . . . . . 121
4.2. Human Resources. . . . . . . . . . . . . . . . . . . . . . . . . . . . . . . . . . . . . . . . . . . . . . . . . . . . . . . . . . . . . . . . . . . . . . . . . . . . . . . . . . . . . . . . . . . . . . . . . . . . . . . . . . . . . . . . 1224.2.1. Administration Personnel . . . . . . . . . . . . . . . . . . . . . . . . . . . . . . . . . . . . . . . . . . . . . . . . . . . . . . . . . . . . . . . . . . . . . . . . . . . . . . . . . . . . . . . . . . . . 1224.2.2. Waste Collection Company Personnel . . . . . . . . . . . . . . . . . . . . . . . . . . . . . . . . . . . . . . . . . . . . . . . . . . . . . . . . . . . . . . . . . . . . . . . . . . . 1234.2.3. Treatment Plant Staff. . . . . . . . . . . . . . . . . . . . . . . . . . . . . . . . . . . . . . . . . . . . . . . . . . . . . . . . . . . . . . . . . . . . . . . . . . . . . . . . . . . . . . . . . . . . . . . . . . 124
4.3. Financial Resources. . . . . . . . . . . . . . . . . . . . . . . . . . . . . . . . . . . . . . . . . . . . . . . . . . . . . . . . . . . . . . . . . . . . . . . . . . . . . . . . . . . . . . . . . . . . . . . . . . . . . . . . . . . . . . 1254.3.1. Property Tax . . . . . . . . . . . . . . . . . . . . . . . . . . . . . . . . . . . . . . . . . . . . . . . . . . . . . . . . . . . . . . . . . . . . . . . . . . . . . . . . . . . . . . . . . . . . . . . . . . . . . . . . . . . . . 1254.3.2. Waste Collection Rate . . . . . . . . . . . . . . . . . . . . . . . . . . . . . . . . . . . . . . . . . . . . . . . . . . . . . . . . . . . . . . . . . . . . . . . . . . . . . . . . . . . . . . . . . . . . . . . 1254.3.3. Metropolitan Rates for Waste Treatment . . . . . . . . . . . . . . . . . . . . . . . . . . . . . . . . . . . . . . . . . . . . . . . . . . . . . . . . . . . . . . . . . . . . . . . . 1264.3.4. Economic Contribution from the Packaging and Packaging Waste Act. . . . . . . . . . . . . . . . . . . . . . . . . . . . . . . . 1264.3.5. Economic Contribution from the Rates Act. . . . . . . . . . . . . . . . . . . . . . . . . . . . . . . . . . . . . . . . . . . . . . . . . . . . . . . . . . . . . . . . . . . 1274.3.6. Supranational Contributions . . . . . . . . . . . . . . . . . . . . . . . . . . . . . . . . . . . . . . . . . . . . . . . . . . . . . . . . . . . . . . . . . . . . . . . . . . . . . . . . . . . . . . . . 127
4.4. Experience in Jalisco (Guadalajara-Mexico) . . . . . . . . . . . . . . . . . . . . . . . . . . . . . . . . . . . . . . . . . . . . . . . . . . . . . . . . . . . . . . . . . . . . . . . . . . . . . . 1284.5. Experience in Montreal (Canada) . . . . . . . . . . . . . . . . . . . . . . . . . . . . . . . . . . . . . . . . . . . . . . . . . . . . . . . . . . . . . . . . . . . . . . . . . . . . . . . . . . . . . . . . . . . 130
5. Environmental Education, Communication and Public Participation. . . . . . . . . . . . . . . . . . . . . . . . . . . . . . . . . . . . . . . . . 1355.1. Environmental Education, Communication and Public Participation . . . . . . . . . . . . . . . . . . . . . . . . . . . . . . . . . . . . . . . . . . . . . 135
5.1.1. Social and Psychosocial Factors in Environmental Management . . . . . . . . . . . . . . . . . . . . . . . . . . . . . . . . . . . . . . . . . . 1355.1.2. Recent International Agreements. A New Vision. . . . . . . . . . . . . . . . . . . . . . . . . . . . . . . . . . . . . . . . . . . . . . . . . . . . . . . . . . . . 1355.1.3. Waste and Environmental Education . . . . . . . . . . . . . . . . . . . . . . . . . . . . . . . . . . . . . . . . . . . . . . . . . . . . . . . . . . . . . . . . . . . . . . . . . . . . . 1365.1.4. Inform, Educate and Participate . . . . . . . . . . . . . . . . . . . . . . . . . . . . . . . . . . . . . . . . . . . . . . . . . . . . . . . . . . . . . . . . . . . . . . . . . . . . . . . . . . . 137
5.2. Environmental Education and Awareness . . . . . . . . . . . . . . . . . . . . . . . . . . . . . . . . . . . . . . . . . . . . . . . . . . . . . . . . . . . . . . . . . . . . . . . . . . . . . . . . . . 1375.2.1. Education and Awareness, or Training . . . . . . . . . . . . . . . . . . . . . . . . . . . . . . . . . . . . . . . . . . . . . . . . . . . . . . . . . . . . . . . . . . . . . . . . . . . . . . 1375.2.2. Environmentalism in Schools and Society . . . . . . . . . . . . . . . . . . . . . . . . . . . . . . . . . . . . . . . . . . . . . . . . . . . . . . . . . . . . . . . . . . . . . . . . 138
5.2.2.1. Curricular Design and Across-the-Board Contents . . . . . . . . . . . . . . . . . . . . . . . . . . . . . . . . . . . . . . . . . . . . . . . 1385.2.2.2. Environmental Management in Schools . . . . . . . . . . . . . . . . . . . . . . . . . . . . . . . . . . . . . . . . . . . . . . . . . . . . . . . . . . . . . . 138
5.2.3. Educational Programs. Experiences . . . . . . . . . . . . . . . . . . . . . . . . . . . . . . . . . . . . . . . . . . . . . . . . . . . . . . . . . . . . . . . . . . . . . . . . . . . . . . . . . 1395.2.3.1. Specialized Centers . . . . . . . . . . . . . . . . . . . . . . . . . . . . . . . . . . . . . . . . . . . . . . . . . . . . . . . . . . . . . . . . . . . . . . . . . . . . . . . . . . . . . . . . . 1395.2.3.2. Publications and Campaigns . . . . . . . . . . . . . . . . . . . . . . . . . . . . . . . . . . . . . . . . . . . . . . . . . . . . . . . . . . . . . . . . . . . . . . . . . . . . . 139
5.3. Information and Communication . . . . . . . . . . . . . . . . . . . . . . . . . . . . . . . . . . . . . . . . . . . . . . . . . . . . . . . . . . . . . . . . . . . . . . . . . . . . . . . . . . . . . . . . . . . 1395.3.1. Information and Instruction . . . . . . . . . . . . . . . . . . . . . . . . . . . . . . . . . . . . . . . . . . . . . . . . . . . . . . . . . . . . . . . . . . . . . . . . . . . . . . . . . . . . . . . . . . 1405.3.2. Publicity and Marketing . . . . . . . . . . . . . . . . . . . . . . . . . . . . . . . . . . . . . . . . . . . . . . . . . . . . . . . . . . . . . . . . . . . . . . . . . . . . . . . . . . . . . . . . . . . . . . . 1405.3.3. New Technologies . . . . . . . . . . . . . . . . . . . . . . . . . . . . . . . . . . . . . . . . . . . . . . . . . . . . . . . . . . . . . . . . . . . . . . . . . . . . . . . . . . . . . . . . . . . . . . . . . . . . . . . 140
5.4. Public Participation . . . . . . . . . . . . . . . . . . . . . . . . . . . . . . . . . . . . . . . . . . . . . . . . . . . . . . . . . . . . . . . . . . . . . . . . . . . . . . . . . . . . . . . . . . . . . . . . . . . . . . . . . . . . . . 1415.4.1. Agents that Obstruct Participation. . . . . . . . . . . . . . . . . . . . . . . . . . . . . . . . . . . . . . . . . . . . . . . . . . . . . . . . . . . . . . . . . . . . . . . . . . . . . . . . 1425.4.2. Agents that Promote Participation . . . . . . . . . . . . . . . . . . . . . . . . . . . . . . . . . . . . . . . . . . . . . . . . . . . . . . . . . . . . . . . . . . . . . . . . . . . . . . . . 1425.4.3. Examples and Experiences . . . . . . . . . . . . . . . . . . . . . . . . . . . . . . . . . . . . . . . . . . . . . . . . . . . . . . . . . . . . . . . . . . . . . . . . . . . . . . . . . . . . . . . . . . 143
5.5. Experience in Havana (Cuba) . . . . . . . . . . . . . . . . . . . . . . . . . . . . . . . . . . . . . . . . . . . . . . . . . . . . . . . . . . . . . . . . . . . . . . . . . . . . . . . . . . . . . . . . . . . . . . . . 1445.6. Experience in Alexandria (Egypt) . . . . . . . . . . . . . . . . . . . . . . . . . . . . . . . . . . . . . . . . . . . . . . . . . . . . . . . . . . . . . . . . . . . . . . . . . . . . . . . . . . . . . . . . . . . 146
6. Bibliography . . . . . . . . . . . . . . . . . . . . . . . . . . . . . . . . . . . . . . . . . . . . . . . . . . . . . . . . . . . . . . . . . . . . . . . . . . . . . . . . . . . . . . . . . . . . . . . . . . . . . . . . . . . . . . . . . . . . . . . . . . . . 1516.1. Directory of waste technicians in Metropolis (Commission 3):. . . . . . . . . . . . . . . . . . . . . . . . . . . . . . . . . . . . . . . . . . . . . . . . . . . . . . 1516.2. Bibliography on Waste . . . . . . . . . . . . . . . . . . . . . . . . . . . . . . . . . . . . . . . . . . . . . . . . . . . . . . . . . . . . . . . . . . . . . . . . . . . . . . . . . . . . . . . . . . . . . . . . . . . . . . . . . . . 1526.3. Websites on Waste Matters . . . . . . . . . . . . . . . . . . . . . . . . . . . . . . . . . . . . . . . . . . . . . . . . . . . . . . . . . . . . . . . . . . . . . . . . . . . . . . . . . . . . . . . . . . . . . . . . . . . . . . 1526.4. Waste Sector Companies and Organizations. . . . . . . . . . . . . . . . . . . . . . . . . . . . . . . . . . . . . . . . . . . . . . . . . . . . . . . . . . . . . . . . . . . . . . . . . . . . . . . 152


URBAN SOLID WASTE MANAGEMENT
1.The Problem of Municipal Waste and How to Manage It
10
1. The Problem of Municipal Waste and How to Manage It. . . . . . . . . . . . . . . . . . . . . . . . . . . . . . . . . . . . . . . . . . . . . . . . . . . . . . . . . . . . 11
1.1. Introduction and Definition of Waste . . . . . . . . . . . . . . . . . . . . . . . . . . . . . . . . . . . . . . . . . . . . . . . . . . . . . . . . . . . . . . . . . . . . . . . . . . . . . . . . . . . . . . . . 11
1.2. Basic Regulations and Classifications. . . . . . . . . . . . . . . . . . . . . . . . . . . . . . . . . . . . . . . . . . . . . . . . . . . . . . . . . . . . . . . . . . . . . . . . . . . . . . . . . . . . . . . . . 12
1.3. Total Waste Generation and Sources . . . . . . . . . . . . . . . . . . . . . . . . . . . . . . . . . . . . . . . . . . . . . . . . . . . . . . . . . . . . . . . . . . . . . . . . . . . . . . . . . . . . . . . . . . 13
1.4. Municipal Household Waste or Urban Solid Waste (USW). . . . . . . . . . . . . . . . . . . . . . . . . . . . . . . . . . . . . . . . . . . . . . . . . . . . . . . . . . . . 14
1.4.1. Average Waste Composition . . . . . . . . . . . . . . . . . . . . . . . . . . . . . . . . . . . . . . . . . . . . . . . . . . . . . . . . . . . . . . . . . . . . . . . . . . . . . . . . . . . . . . . . . . 15
1.4.2. Waste Bag Characteristics . . . . . . . . . . . . . . . . . . . . . . . . . . . . . . . . . . . . . . . . . . . . . . . . . . . . . . . . . . . . . . . . . . . . . . . . . . . . . . . . . . . . . . . . . . . . . 16
1.4.3. Comprehensive Municipal Waste Management . . . . . . . . . . . . . . . . . . . . . . . . . . . . . . . . . . . . . . . . . . . . . . . . . . . . . . . . . . . . . . . . . 17
1.5. Waste Collection Systems. . . . . . . . . . . . . . . . . . . . . . . . . . . . . . . . . . . . . . . . . . . . . . . . . . . . . . . . . . . . . . . . . . . . . . . . . . . . . . . . . . . . . . . . . . . . . . . . . . . . . . . . 18
1.5.1. Containers in the Street, Close to Households . . . . . . . . . . . . . . . . . . . . . . . . . . . . . . . . . . . . . . . . . . . . . . . . . . . . . . . . . . . . . . . . . 18
1.5.2. Contribution Areas . . . . . . . . . . . . . . . . . . . . . . . . . . . . . . . . . . . . . . . . . . . . . . . . . . . . . . . . . . . . . . . . . . . . . . . . . . . . . . . . . . . . . . . . . . . . . . . . . . . . . . 21
1.5.3. Door-to-Door . . . . . . . . . . . . . . . . . . . . . . . . . . . . . . . . . . . . . . . . . . . . . . . . . . . . . . . . . . . . . . . . . . . . . . . . . . . . . . . . . . . . . . . . . . . . . . . . . . . . . . . . . . . . 21
1.5.4. Pneumatic Systems . . . . . . . . . . . . . . . . . . . . . . . . . . . . . . . . . . . . . . . . . . . . . . . . . . . . . . . . . . . . . . . . . . . . . . . . . . . . . . . . . . . . . . . . . . . . . . . . . . . . . . 22
1.6. Contribution Centers: Drop-off Centers or Green Points . . . . . . . . . . . . . . . . . . . . . . . . . . . . . . . . . . . . . . . . . . . . . . . . . . . . . . . . . . . . . 24
1.7. Waste Transfer Plants . . . . . . . . . . . . . . . . . . . . . . . . . . . . . . . . . . . . . . . . . . . . . . . . . . . . . . . . . . . . . . . . . . . . . . . . . . . . . . . . . . . . . . . . . . . . . . . . . . . . . . . . . . . . . . 25
1.8. Waste from Markets, Large Stores and Services . . . . . . . . . . . . . . . . . . . . . . . . . . . . . . . . . . . . . . . . . . . . . . . . . . . . . . . . . . . . . . . . . . . . . . . . . . . 26
1.9. The Treatment of Household Waste . . . . . . . . . . . . . . . . . . . . . . . . . . . . . . . . . . . . . . . . . . . . . . . . . . . . . . . . . . . . . . . . . . . . . . . . . . . . . . . . . . . . . . . . . . 26
1.10. Industrial Waste . . . . . . . . . . . . . . . . . . . . . . . . . . . . . . . . . . . . . . . . . . . . . . . . . . . . . . . . . . . . . . . . . . . . . . . . . . . . . . . . . . . . . . . . . . . . . . . . . . . . . . . . . . . . . . . . . . . . . 28
1.10.1. Diagram of the Industrial Waste Management Process . . . . . . . . . . . . . . . . . . . . . . . . . . . . . . . . . . . . . . . . . . . . . . . . . . . . . . . 29
1.10.2. Objectives of an Industrial Waste Management Program . . . . . . . . . . . . . . . . . . . . . . . . . . . . . . . . . . . . . . . . . . . . . . . . . . . . 29
1.10.3. The European Waste Catalogue . . . . . . . . . . . . . . . . . . . . . . . . . . . . . . . . . . . . . . . . . . . . . . . . . . . . . . . . . . . . . . . . . . . . . . . . . . . . . . . . . . . . . 31
1.10.4. Generation of Hazardous Waste in Europe . . . . . . . . . . . . . . . . . . . . . . . . . . . . . . . . . . . . . . . . . . . . . . . . . . . . . . . . . . . . . . . . . . . . . . . 32
1.10.5. The Center for Enterprises and the Environment (CEMA). . . . . . . . . . . . . . . . . . . . . . . . . . . . . . . . . . . . . . . . . . . . . . . . 32
1.10.6. The Sub-Products Waste Stock Exchange . . . . . . . . . . . . . . . . . . . . . . . . . . . . . . . . . . . . . . . . . . . . . . . . . . . . . . . . . . . . . . . . . . . . . . . 33
1.11. Primary Sector Waste: Agricultural, Forestry and Livestock Waste . . . . . . . . . . . . . . . . . . . . . . . . . . . . . . . . . . . . . . . . . . . . . . . . . . . 35
1.11.1. Composting and Biogas from Livestock Waste . . . . . . . . . . . . . . . . . . . . . . . . . . . . . . . . . . . . . . . . . . . . . . . . . . . . . . . . . . . . . . . . . . 37
1.11.2. Slurry Biogas Plant. . . . . . . . . . . . . . . . . . . . . . . . . . . . . . . . . . . . . . . . . . . . . . . . . . . . . . . . . . . . . . . . . . . . . . . . . . . . . . . . . . . . . . . . . . . . . . . . . . . . . . 38
1.12. Waste from the Mining and Construction Industries . . . . . . . . . . . . . . . . . . . . . . . . . . . . . . . . . . . . . . . . . . . . . . . . . . . . . . . . . . . . . . . . . . . . 38
1.12.1. Mining and Quarry Waste . . . . . . . . . . . . . . . . . . . . . . . . . . . . . . . . . . . . . . . . . . . . . . . . . . . . . . . . . . . . . . . . . . . . . . . . . . . . . . . . . . . . . . . . . . . . 38
1.12.2. Construction Waste . . . . . . . . . . . . . . . . . . . . . . . . . . . . . . . . . . . . . . . . . . . . . . . . . . . . . . . . . . . . . . . . . . . . . . . . . . . . . . . . . . . . . . . . . . . . . . . . . . . . . 39
1.13. Sanitary Waste and Its Management . . . . . . . . . . . . . . . . . . . . . . . . . . . . . . . . . . . . . . . . . . . . . . . . . . . . . . . . . . . . . . . . . . . . . . . . . . . . . . . . . . . . . . . . . . 41
1.13.1. Classification and Management of Sanitary Waste. . . . . . . . . . . . . . . . . . . . . . . . . . . . . . . . . . . . . . . . . . . . . . . . . . . . . . . . . . . . . . 42
1.13.2. Sanitary Waste Sterilization Plant . . . . . . . . . . . . . . . . . . . . . . . . . . . . . . . . . . . . . . . . . . . . . . . . . . . . . . . . . . . . . . . . . . . . . . . . . . . . . . . . . . . 42
1.14. Small Quantity Special Waste . . . . . . . . . . . . . . . . . . . . . . . . . . . . . . . . . . . . . . . . . . . . . . . . . . . . . . . . . . . . . . . . . . . . . . . . . . . . . . . . . . . . . . . . . . . . . . . . . . . 43
1.15. Radioactive or Nuclear Waste . . . . . . . . . . . . . . . . . . . . . . . . . . . . . . . . . . . . . . . . . . . . . . . . . . . . . . . . . . . . . . . . . . . . . . . . . . . . . . . . . . . . . . . . . . . . . . . . . . 45
1.16. Monitoring, Characterizing and Analyzing Waste. . . . . . . . . . . . . . . . . . . . . . . . . . . . . . . . . . . . . . . . . . . . . . . . . . . . . . . . . . . . . . . . . . . . . . . . . 46
1.16.1. Waste Sampling . . . . . . . . . . . . . . . . . . . . . . . . . . . . . . . . . . . . . . . . . . . . . . . . . . . . . . . . . . . . . . . . . . . . . . . . . . . . . . . . . . . . . . . . . . . . . . . . . . . . . . . . . . 46
1.16.2. Waste Analysis Methods. . . . . . . . . . . . . . . . . . . . . . . . . . . . . . . . . . . . . . . . . . . . . . . . . . . . . . . . . . . . . . . . . . . . . . . . . . . . . . . . . . . . . . . . . . . . . . . . 49
1.16.3. Waste Analysis . . . . . . . . . . . . . . . . . . . . . . . . . . . . . . . . . . . . . . . . . . . . . . . . . . . . . . . . . . . . . . . . . . . . . . . . . . . . . . . . . . . . . . . . . . . . . . . . . . . . . . . . . . . . 49
1.16.4. Leachate Analysis . . . . . . . . . . . . . . . . . . . . . . . . . . . . . . . . . . . . . . . . . . . . . . . . . . . . . . . . . . . . . . . . . . . . . . . . . . . . . . . . . . . . . . . . . . . . . . . . . . . . . . . . 51
1.16.5. Ecotoxicity . . . . . . . . . . . . . . . . . . . . . . . . . . . . . . . . . . . . . . . . . . . . . . . . . . . . . . . . . . . . . . . . . . . . . . . . . . . . . . . . . . . . . . . . . . . . . . . . . . . . . . . . . . . . . . . . 52
1.16.6. Limits on Waste and Leachates. . . . . . . . . . . . . . . . . . . . . . . . . . . . . . . . . . . . . . . . . . . . . . . . . . . . . . . . . . . . . . . . . . . . . . . . . . . . . . . . . . . . . . . 53
1.16.7. Experiences of the Barcelona Metropolitan Program on Municipal Waste . . . . . . . . . . . . . . . . . . . . . . . . . . . . . 54
1.16.8. Experiences in Calcutta (India). . . . . . . . . . . . . . . . . . . . . . . . . . . . . . . . . . . . . . . . . . . . . . . . . . . . . . . . . . . . . . . . . . . . . . . . . . . . . . . . . . . . . . 56
INDEX
11
Waste is anything generated as an unwanted consequence of human activity and,
in general, of any living thing. In order to survive, human beings must continually trans-
form certain products they have at their disposal into others that they can assimilate,
consequently generating a part that is waste.
Natural systems do not generate accumulated waste. The natural cycle of the
material is closed and chemical elements make and unmake a whole series of structures
without generating any type of waste that cannot be assimilated by nature itself.
It is human intervention that breaks this natural cycle of material, when man
wants to obtain goods he needs to progress and improve his quality of life. Man extracts
the raw materials and after processing and using them leaves behind a series of remains
that cannot be assimilated but which instead accumulate or are dumped in areas and
places often without any type of treatment.
The problem of increasing waste production is already a matter of world interest.
Reducing waste at the point where it is produced and recycling it are the best ways to
halt the increasing wave of the production of waste at all levels.
By 2050, the recycling sector and industries that use clean technologies will have
replaced today’s polluting industries.
The modern ‘throwaway’ society squanders so much energy and generates so
much CO2, acid rain, waste pollution and toxic waste that it is wiping itself out.
This is one of the grave aberrations that will have to be paid for in the future.
We must avoid all waste that is not essential. The future hierarchy of the use of
materials must eventually meet the following sequence: maximum use and reuse of mate-
rials; recycling to make new products; safe incineration, where necessary, to make the best
use of energy and, finally, dumping in safe and controlled garbage dumps.
The concept of waste is defined in different ways:
According to the OECD (Organisation for Economic Cooperation and
Development), waste is defined as: “materials generated in production and consumption activities
that do not have, in the context in which they are produced, any economic value”.
It defines urban solid waste as: “Waste generated in private households, businesses,
offices and services, as well as waste not classified as hazardous and which by its nature or com-
position could resemble the waste produced in the those places or activities”.
Urban waste is also considered to include: “Waste from the cleaning of public roads,
green areas, recreation areas and beaches. Dead domestic animals, as well as abandoned furniture,
tools and vehicles. Garbage waste from minor construction works and household repair work”.
1.1. Introduction andDefinition of Waste
1.THE PROBLEM OF MUNICIPAL WASTE AND HOW TO MANAGE IT
1.2. Basic Regulationsand Classifications
For the implementation of the course, we will use the following basic legislation:
European Community
1. Directive on Toxic and Hazardous Waste
78/EEC of 31-03-1978
2. Directive on Waste Dumping
91/190/EEC of 22-07-1991
3. Directive on the European Waste Catalogue
94/904/EEC and 2000/532/EC
Spain
4. Spanish Waste Act
10/1998 BOE 96 of 22-04-1998
5. Order on Waste Assessment and Elimination Operations and the
European Waste List
304/2002 BOE 43 of 19-02-2002
Catalonia
6. Catalan Waste Act
6/1993 DOGC 1776 of 28-07-1993
7. Acts Modifying the Above Act
15/2003 and 16/2003 DOGC 3915 of 01-07-2003
Act 6/1993 of 15 July 1993 (DOGC 1776,28-07-1993), regulating waste in Catalonia,
ends with the previously mentioned classification of household and industrial waste and the
differences according to the type of treatment that each requires, classifying it into three groups:
Special Waste:
Special waste is all waste included in the sphere of application of Directive
91/689/EC of 12 December.
It is basically waste that prior to Act 6/1993 was called industrial waste and which
includes organic solvents, ethers, organochlorine compounds, pesticides, industrial oils, creo-
sotes, salt and metal baths, cyanides, heavy metal compounds, PCBs and PCTs, dioxins, etc.
Non-Special Waste:
Non-special waste is waste not classified as special or inert. It includes plastic,
rubber, leather, textile packaging, etc.
Inert Waste:
Inert waste is that which, once dumped in a tip, does not undergo any significant
physical, chemical or biological transformation and which meets the legally determined
leaching criteria. It includes tiling waste, slag, scrap iron, gravel, etc.
12
U R B A N S O L I D W A S T E M A N A G E M E N T
M U N I C I P A L W A S T E A N D I T S M A N A G E M E N T
13
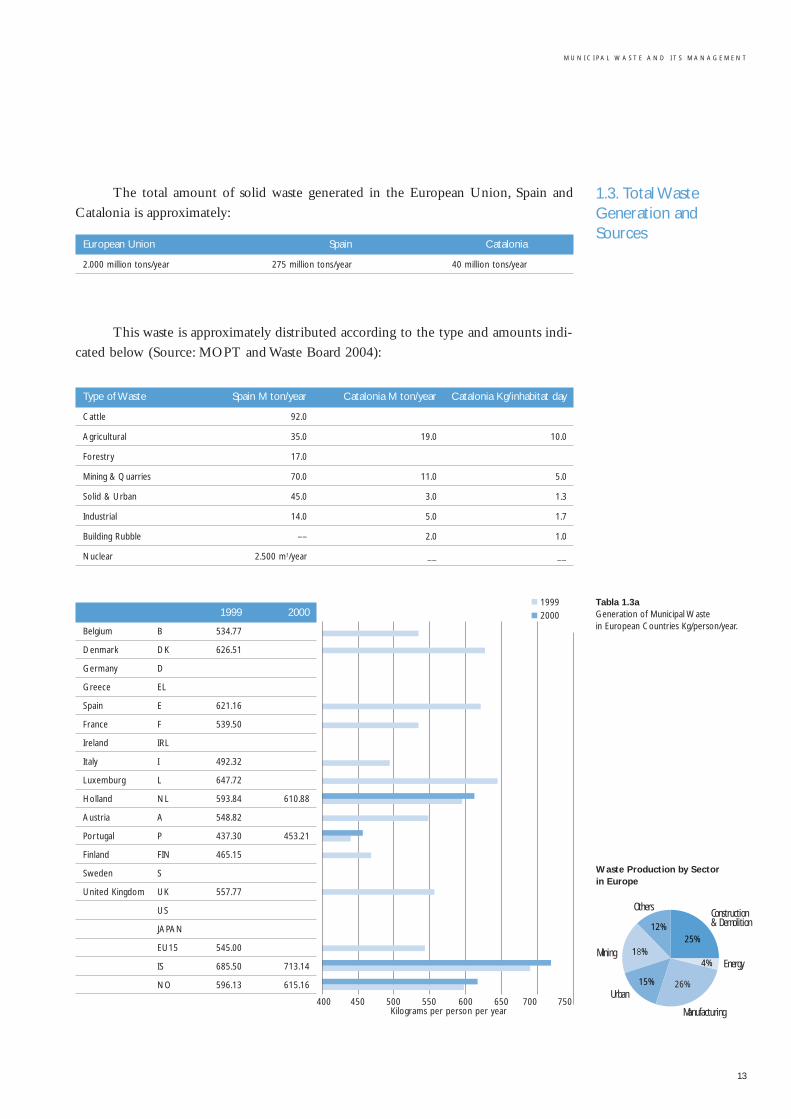
The total amount of solid waste generated in the European Union, Spain and
Catalonia is approximately:
This waste is approximately distributed according to the type and amounts indi-
cated below (Source: MOPT and Waste Board 2004):
1.3. Total WasteGeneration andSources
Tabla 1.3aGeneration of Municipal Waste in European Countries Kg/person/year.
Construction& Demolition
Energy
Urban
Mining
26%
18%
12%25%
4%
15%
Manufacturing
Others
1999 2000
Belgium B 534.77
Denmark DK 626.51
Germany D
Greece EL
Spain E 621.16
France F 539.50
Ireland IRL
Italy I 492.32
Luxemburg L 647.72
Holland NL 593.84 610.88
Austria A 548.82
Portugal P 437.30 453.21
Finland FIN 465.15
Sweden S
United Kingdom UK 557.77
US
JAPAN
EU15 545.00
IS 685.50 713.14
NO 596.13 615.16
400 450 500 550 600 650 700 750Kilograms per person per year
19992000
European Union Spain Catalonia
2.000 million tons/year 275 million tons/year 40 million tons/year
Type of Waste Spain M ton/year Catalonia M ton/year Catalonia Kg/inhabitat day
Cattle 92.0
Agricultural 35.0 19.0 10.0
Forestry 17.0
Mining & Quarries 70.0 11.0 5.0
Solid & Urban 45.0 3.0 1.3
Industrial 14.0 5.0 1.7
Building Rubble –– 2.0 1.0
Nuclear 2.500 m3/year __ __
Waste Production by Sector in Europe
1.4. MunicipalHousehold Waste or Urban Solid Waste(USW)
Municipal Household Waste
This is waste generated in private households, businesses, offices and services and
also waste not considered special waste and which, by its nature or composition, could
resemble the waste produced in the abovementioned places or activities.
Municipal waste is also considered to include:
• Waste from road-cleaning operations
• Waste from green areas
• Waste from recreation areas and beaches
• Dead household animals
• Abandoned furniture, tools and vehicles
• Waste and rubble from minor construction works and household repair work
The amount of urban solid waste (USW) generated depends on many parameters: stan-
dard of living, time of the year and populational movements (vacations, festivals,weekends,etc).
The United States produces the most household waste, with 800 kg/inhabitant/year.
The country that produces the most waste in Europe is Holland, with more than 500 kg/
inhabitant/year. In Spain, Catalonia produces the most waste, with 475 kg/inhabitant/year.
Garbage Bins
It shortly became a requirement to have two bins in the home, or one with two
compartments, to separate daily rubbish. One was for organic material (food scraps,
meat, fish, vegetables, fruit, peelings, shells, coffee grains, etc.), which could be trans-
formed into compost, and the other was for the most common types of inert materials
(inorganic products, pieces of glass, used tins, broken china, cartons, plastic, scraps of
metal, etc.), to be taken to the garbage dump or a selection plant.
Selective Collection
Containers appropriate for different types of materials, located in the street and,
wherever possible, close to people’s homes.There are different containers for paper/card-
board, glass, tin and, hopefully in the near future, plastic and cartons. Other waste, such as
batteries, surplus or expired medicine, clothes, etc., can be taken to specific collection sites.
Household Waste Requiring Specific Management
Some waste generated in the domestic sphere has characteristics requiring spe-
cific management:
• Glues and pastes
• Paint, varnish and solvents
• Insecticides and pesticides
• Household mineral oils
• Additives and other automotive fluids
• Medicines
14
U R B A N S O L I D W A S T E M A N A G E M E N T
• The recipients and containers
of the abovementioned materials
• Electrical and electronic waste
• Cleaning products
• Spent batteries and accumulators
M U N I C I P A L W A S T E A N D I T S M A N A G E M E N T
15
Commercial Waste
This is municipal waste generated by commercial activity, e.g., the hotel industry,
bars, markets, offices and services.
It also includes waste that originates in industry and which is considered to
resemble municipal waste.
The management of commercial waste is the responsibility of the person behind
the activity that generates it, who should manage the waste in line with the obligations
on waste holders or producers.
An authorized manager should be contacted so the waste can be recovered
(wherever possible), released to a clean point or dumped in a controlled tip.
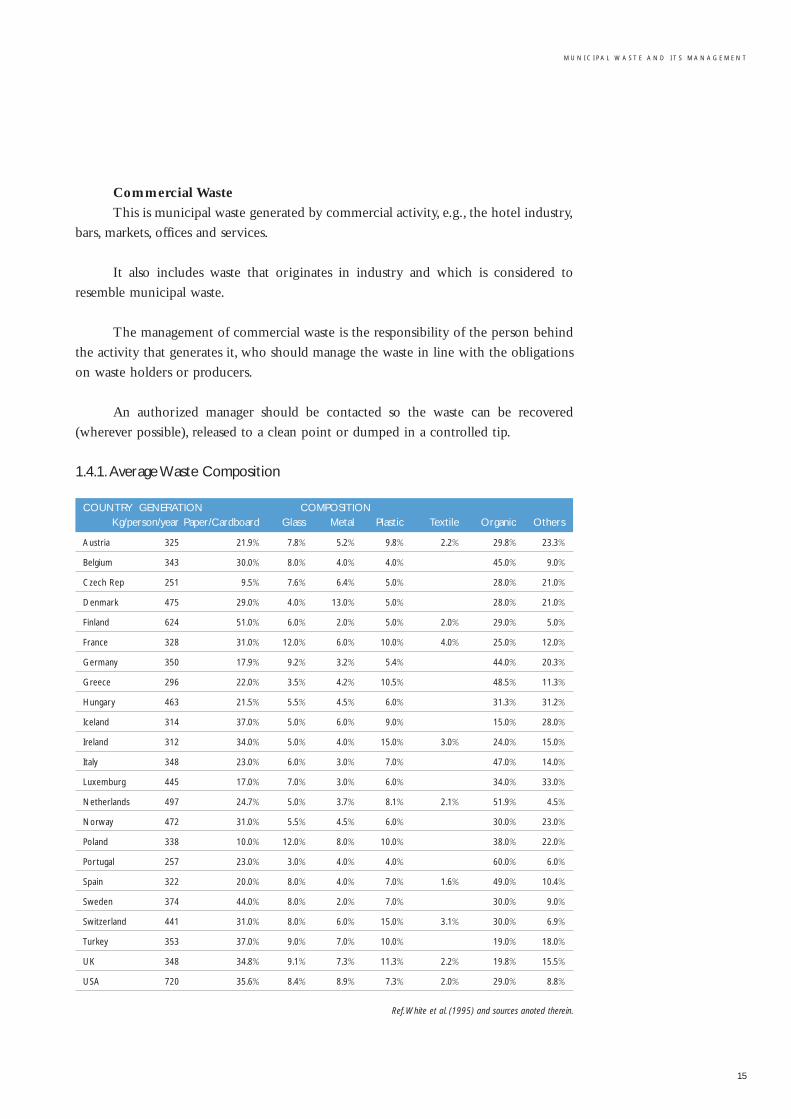
1.4.1. Average Waste Composition
COUNTRY GENERATION COMPOSITIONKg/person/year Paper/Cardboard Glass Metal Plastic Textile Organic Others
Austria 325 21.9% 7.8% 5.2% 9.8% 2.2% 29.8% 23.3%
Belgium 343 30.0% 8.0% 4.0% 4.0% 45.0% 9.0%
Czech Rep 251 9.5% 7.6% 6.4% 5.0% 28.0% 21.0%
Denmark 475 29.0% 4.0% 13.0% 5.0% 28.0% 21.0%
Finland 624 51.0% 6.0% 2.0% 5.0% 2.0% 29.0% 5.0%
France 328 31.0% 12.0% 6.0% 10.0% 4.0% 25.0% 12.0%
Germany 350 17.9% 9.2% 3.2% 5.4% 44.0% 20.3%
Greece 296 22.0% 3.5% 4.2% 10.5% 48.5% 11.3%
Hungary 463 21.5% 5.5% 4.5% 6.0% 31.3% 31.2%
Iceland 314 37.0% 5.0% 6.0% 9.0% 15.0% 28.0%
Ireland 312 34.0% 5.0% 4.0% 15.0% 3.0% 24.0% 15.0%
Italy 348 23.0% 6.0% 3.0% 7.0% 47.0% 14.0%
Luxemburg 445 17.0% 7.0% 3.0% 6.0% 34.0% 33.0%
Netherlands 497 24.7% 5.0% 3.7% 8.1% 2.1% 51.9% 4.5%
Norway 472 31.0% 5.5% 4.5% 6.0% 30.0% 23.0%
Poland 338 10.0% 12.0% 8.0% 10.0% 38.0% 22.0%
Portugal 257 23.0% 3.0% 4.0% 4.0% 60.0% 6.0%
Spain 322 20.0% 8.0% 4.0% 7.0% 1.6% 49.0% 10.4%
Sweden 374 44.0% 8.0% 2.0% 7.0% 30.0% 9.0%
Switzerland 441 31.0% 8.0% 6.0% 15.0% 3.1% 30.0% 6.9%
Turkey 353 37.0% 9.0% 7.0% 10.0% 19.0% 18.0%
UK 348 34.8% 9.1% 7.3% 11.3% 2.2% 19.8% 15.5%
USA 720 35.6% 8.4% 8.9% 7.3% 2.0% 29.0% 8.8%
Ref.White et al. (1995) and sources anoted therein.
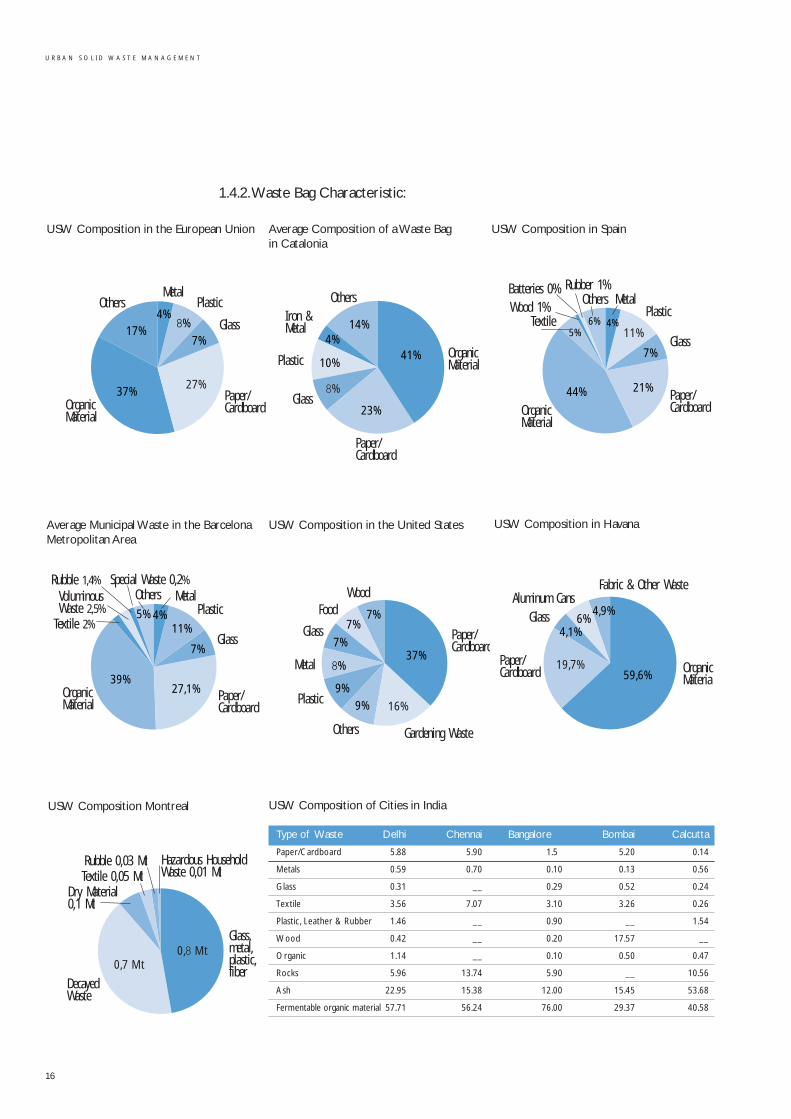
1.4.2.Waste Bag Characteristic:
16
U R B A N S O L I D W A S T E M A N A G E M E N T
MetalPlastic
Paper/ CardboardOrganic
Material
27%
17%4%
8%7%
37%
Glass
Others
USW Composition in the European Union
8%
4%14%
41%
23%
10%
Iron & Metal
Plastic
Paper/ Cardboard
Glass
Others
OrganicMaterial
Average Composition of a Waste Bag in Catalonia
MetalPlastic
Paper/ CardboardOrganic
Material
Glass
OthersBatteries 0%Wood 1%
Textile
Rubber 1%
11%5%4%
7%
21%44%
6%
USW Composition in Spain
MetalPlastic
Paper/ Cardboard
OrganicMaterial
4%11%
7%
39%
Glass
Others
27,1%
Textile 2%5%
VoluminousWaste 2,5%
Rubble 1,4% Special Waste 0,2%
Average Municipal Waste in the BarcelonaMetropolitan Area
Gardening Waste
FoodWood
16%
8%
7%
37%
9%9%
Others
7%
7%Paper/ Cardboard
Plastic
Metal
Glass
USW Composition in the United States
19,7%
6%4,9%
59,6%
4,1%
Aluminum Cans
Paper/ Cardboard
Glass
Fabric & Other Waste
OrganicMateria
USW Composition in Havana
DecayedWaste
Dry Material 0,1 Mt
Glass, metal,plastic, fiber
0,8 Mt0,7 Mt
Textile 0,05 Mt Rubble 0,03 Mt Hazardous Household
Waste 0,01 Mt
USW Composition Montreal
Type of Waste Delhi Chennai Bangalore Bombai Calcutta
Paper/Cardboard 5.88 5.90 1.5 5.20 0.14
Metals 0.59 0.70 0.10 0.13 0.56
Glass 0.31 __ 0.29 0.52 0.24
Textile 3.56 7.07 3.10 3.26 0.26
Plastic, Leather & Rubber 1.46 __ 0.90 __ 1.54
Wood 0.42 __ 0.20 17.57 __
Organic 1.14 __ 0.10 0.50 0.47
Rocks 5.96 13.74 5.90 __ 10.56
Ash 22.95 15.38 12.00 15.45 53.68
Fermentable organic material 57.71 56.24 76.00 29.37 40.58
USW Composition of Cities in India
M U N I C I P A L W A S T E A N D I T S M A N A G E M E N T
17
CLEAN POINT
SPECIAL WASTE NONSPECIAL WASTE
Fluorescent lights
HG vapor lights
Thermometers
Expired medicines
Surplus drugs
CFC homeappliaces
Tires
Radiographies
Photo films
Household oils
Industrial oils
Phitosanitary products
Car batteries
Ni/Cd batteries
Batteries
Button Batteries
Brakes liquids
Developing liquids
Toners
Paints
Enamels
Solvents
Cleaning products
Aerosols
Used clothes& shoes
Cans (Fe and Al)
Electrical wiring
Dry bread
Rubble,debris
Pruning and gardening waste
Paper / cardboard
Clear andcolored glass
Sparklingwine glass
Plastics
High-densitypolystyrene
Scrap-metal and metals
Wood and furniture
Textiles
1.4.3. Comprehensive Municipal Waste ManagementThe comprehensive management of municipal waste can be simplified in line with
the following diagram:
Comprehensive management includes the selective collection of different types
of waste that can be collected in areas known as ‘clean points’.
HOUSEHOLD WASTE
CONTRIBUTION AREACURBSIDE
SELECTIVECOLLECTION
DOOR TO DOOR
Organic
Rejectedmaterial
Paper/Cardboard
Glass
Packaging
Plastics
Cartons
Batteries
Drugs
Oils
Household
Voluminous
Paper/Cardboard
Used Furniture
Old Furniture
Old Tools
Industrial
1.5.Waste CollectionSystems
1.5.1. Containers in the Street, Close to HouseholdsSince the 1980s, containers have been the traditional method for collecting the
household and commercial waste generated by the public. This method represents a
major advance over the door-to-door collection that was carried out previously.
Containers are usually located within 50 meters of people’s homes.
The municipal evolution experienced by cities and the changes introduced
in the waste management model have, however, required the incorporation of sig-
nificant modifications to the container models used. The design has been grad-
ually modernized and the way of emptying them optimized to adapt to the char-
acteristics of the streets, the needs of the public and the new systems of selective
collection.
In areas with new buildings or already constructed buildings, where town-plan-
ning and economic conditions allow, it is even possible to bury the containers under-
ground or implement other waste collection systems.
Although most people have got used to using rubbish containers in the streets,
the difficulty in placing them in particular parts of a city or the trouble that cleaning
and collection operations may occasionally cause people have led to other systems also
being developed.
18
U R B A N S O L I D W A S T E M A N A G E M E N T
WHAT
TO DO WITH
OUR WASTE
WASTE BAG
OR CONTRIBUTION
AREASSELECTIVE
COLLECTION
DOOR
TO DOORCURBSIDES
GREEN POINTNon-Special Waste Special Waste
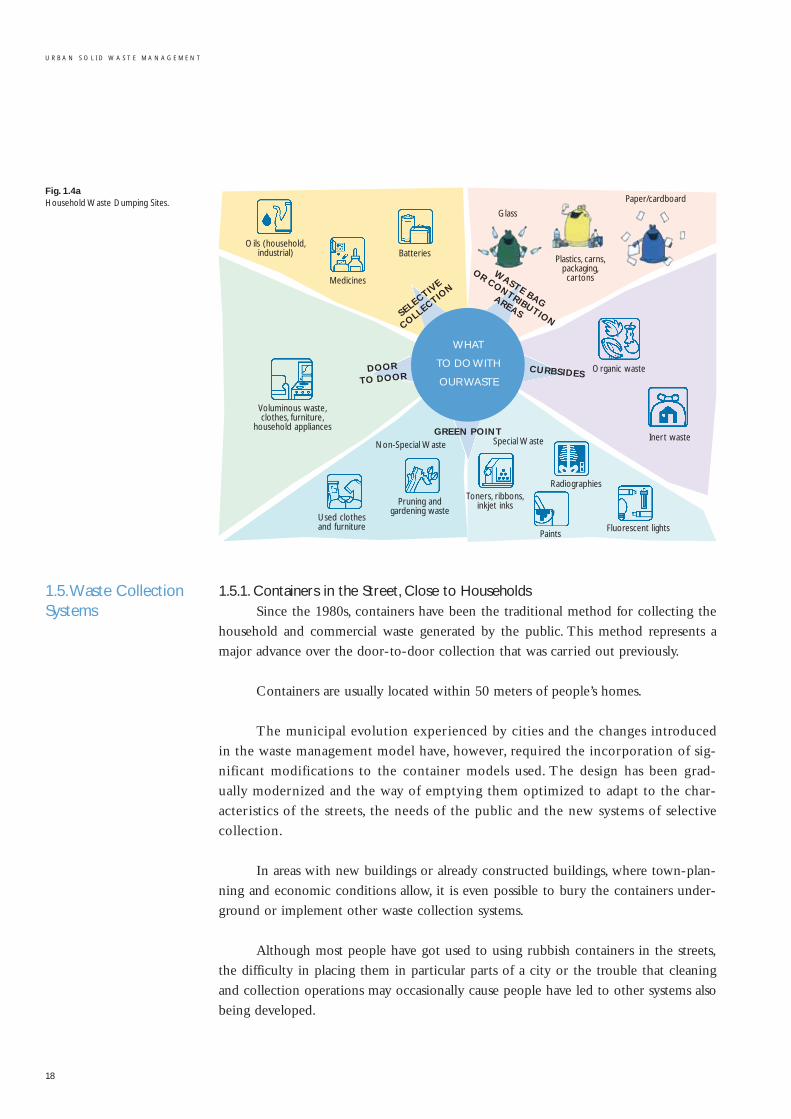
Fig. 1.4aHousehold Waste Dumping Sites.
Glass
Paper/cardboard
Plastics, carns,packaging,cartons
Organic waste
Inert waste
Toners, ribbons,inkjet inks
Radiographies
PaintsFluorescent lights
Pruning andgardening waste
Used clothesand furniture
Voluminous waste,clothes, furniture,
household appliances
Oils (household,industrial) Batteries
Medicines
M U N I C I P A L W A S T E A N D I T S M A N A G E M E N T
19
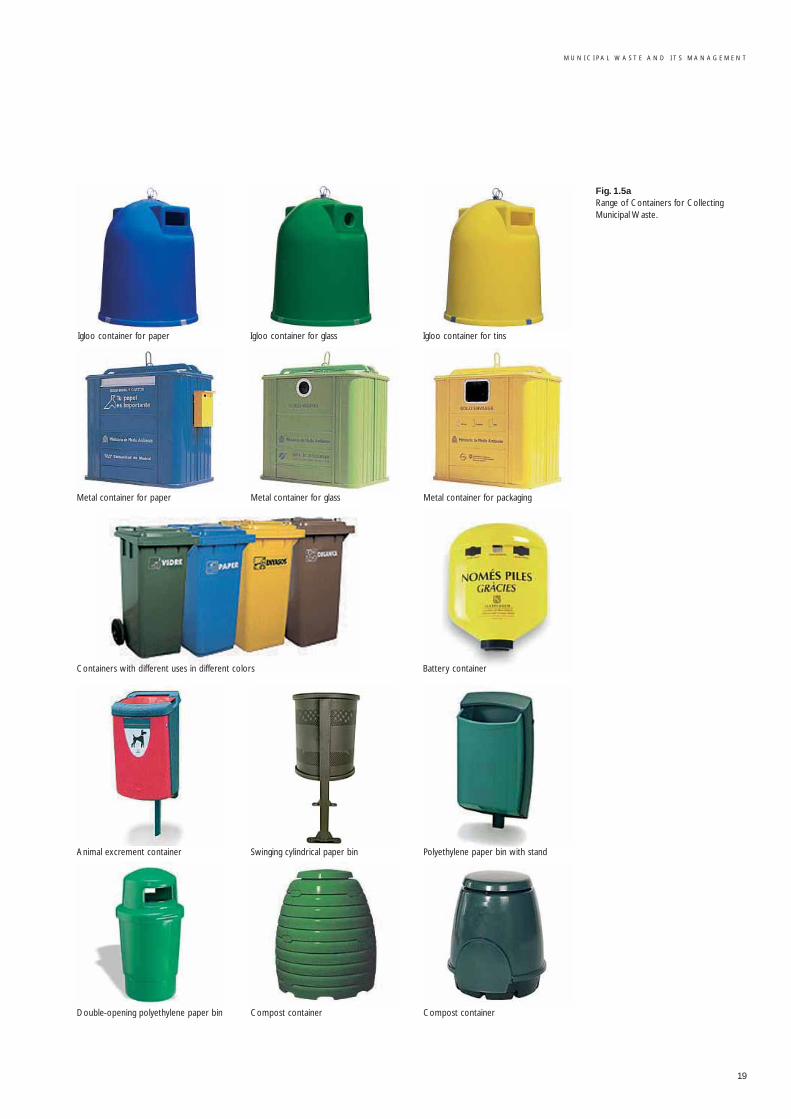
Fig. 1.5aRange of Containers for CollectingMunicipal Waste.
Igloo container for paper Igloo container for glass Igloo container for tins
Metal container for paper Metal container for glass Metal container for packaging
Containers with different uses in different colors Battery container
Animal excrement container Swinging cylindrical paper bin Polyethylene paper bin with stand
Double-opening polyethylene paper bin Compost container Compost container
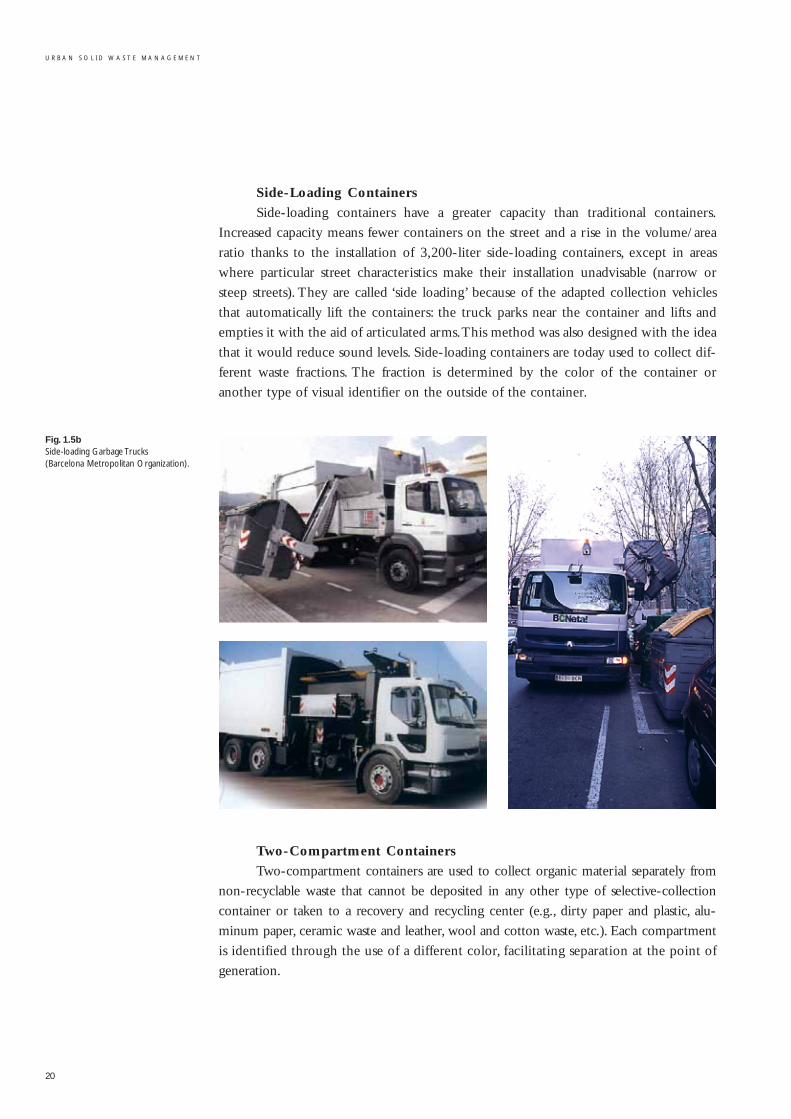
Side-Loading Containers
Side-loading containers have a greater capacity than traditional containers.
Increased capacity means fewer containers on the street and a rise in the volume/area
ratio thanks to the installation of 3,200-liter side-loading containers, except in areas
where particular street characteristics make their installation unadvisable (narrow or
steep streets). They are called ‘side loading’ because of the adapted collection vehicles
that automatically lift the containers: the truck parks near the container and lifts and
empties it with the aid of articulated arms.This method was also designed with the idea
that it would reduce sound levels. Side-loading containers are today used to collect dif-
ferent waste fractions. The fraction is determined by the color of the container or
another type of visual identifier on the outside of the container.
Two-Compartment Containers
Two-compartment containers are used to collect organic material separately from
non-recyclable waste that cannot be deposited in any other type of selective-collection
container or taken to a recovery and recycling center (e.g., dirty paper and plastic, alu-
minum paper, ceramic waste and leather, wool and cotton waste, etc.). Each compartment
is identified through the use of a different color, facilitating separation at the point of
generation.
20
U R B A N S O L I D W A S T E M A N A G E M E N T
Fig. 1.5bSide-loading Garbage Trucks (Barcelona Metropolitan Organization).
M U N I C I P A L W A S T E A N D I T S M A N A G E M E N T
21
The main advantage of this model is the reduction in the number of journeys the
garbage trucks have to make because the especially adapted vehicles can remove both
fractions at once.The system also makes it possible to reduce the number of containers
located on the street.
Two-compartment containers have so far been implemented as a pioneering
method in various areas of the cities of Barcelona, Hospitalet de Llobregat and Ripollet.
Collection of Organic Material in Containers
Some cities have chosen to collect organic material in containers exclusively for
this purpose.The containers are located next to the other containers and allow people
to deposit bags of previously selected organic waste fractions at the point of generation.
Simultaneous Collection in Colored Bags
Other cities have chosen to employ regular containers for collecting organic frac-
tions at the same time as other fractions. In order to differentiate between the two frac-
tions, people deposit organic waste in orange-colored bags and other waste in regular bags.
The bags with different fractions are collected by a single garbage truck and separated
according to their color, using an Optibag optical selection system at the Ecopark. Badalona
and Barcelona have put this collection system into practice.The Optibag consists of a sys-
tem of optical readers that distinguish the bag by its color.The Barcelona Ecopark uses this
separation system to perform a differentiated and more efficient treatment of organic waste.
Underground Containers
These containers make it possible to store waste underground, which has a num-
ber of advantages including gaining space on the street, reducing the visual impact and
noise and making a cleaner environment.
This system has been chosen by the city of Castellbisbal and is also applied in
various parts of Barcelona (Rambla de Prat, Santa Madrona Square, Vila de Madrid
Square, etc.). It is also being tried out across other points of the city.
1.5.2. Contribution AreasThese are areas located at a maximum of 150 meters from people’s homes.They
are usually placed at a ratio of 500 inhabitants/container.They include three containers
for collecting inert waste, e.g., paper/cardboard, glass and packaging. Igloo containers
are gradually being replaced by side-loading containers.
1.5.3. Door-to-DoorThis involves different fractions of household waste (previously left in containers
on the streets) being collected from people’s homes on particular days of the week.
The idea behind door-to-door collection is to facilitate separation at the point
of generation as much as possible and discourage non-participative attitudes, so that in
practice it becomes almost impossible to not collaborate in the separation of household
waste. In some areas with narrow streets that garbage trucks cannot access, it is the only
way to offer an effective service.
In 2002, the city of Tiana, in Catalonia, initiated a door-to-door collection system
with the goal of facilitating separation at the point of generation as much as possible and
the dumping of each fraction through an appropriate channel.The system led to a clean-
er city and made the public more aware of the problems of waste.
This new system makes it possible to recover up to 80% of waste, meaning Tiana
was able to present premium results with respect to metropolitan selective collection. In
the wake of this success, the city received various awards from the Department for the
Environment at the Generalitat of Catalonia in recognition of the activities that made
it possible to develop a better selective collection system.Torrelles de Llobregat began a
door-to-door collection system in January 2003.All the containers, except the ones for
glass, were removed from the public street and rubbish is now left in doorways at a par-
ticular time of the day. Organic material is collected three times a week, non-organic
material twice a week and paper once a week.The aim of removing the containers was
to make a cleaner, less smelly city that made optimal use of public roads. A further aim
was to stop containers from being moved around, something that households had been
long calling for.
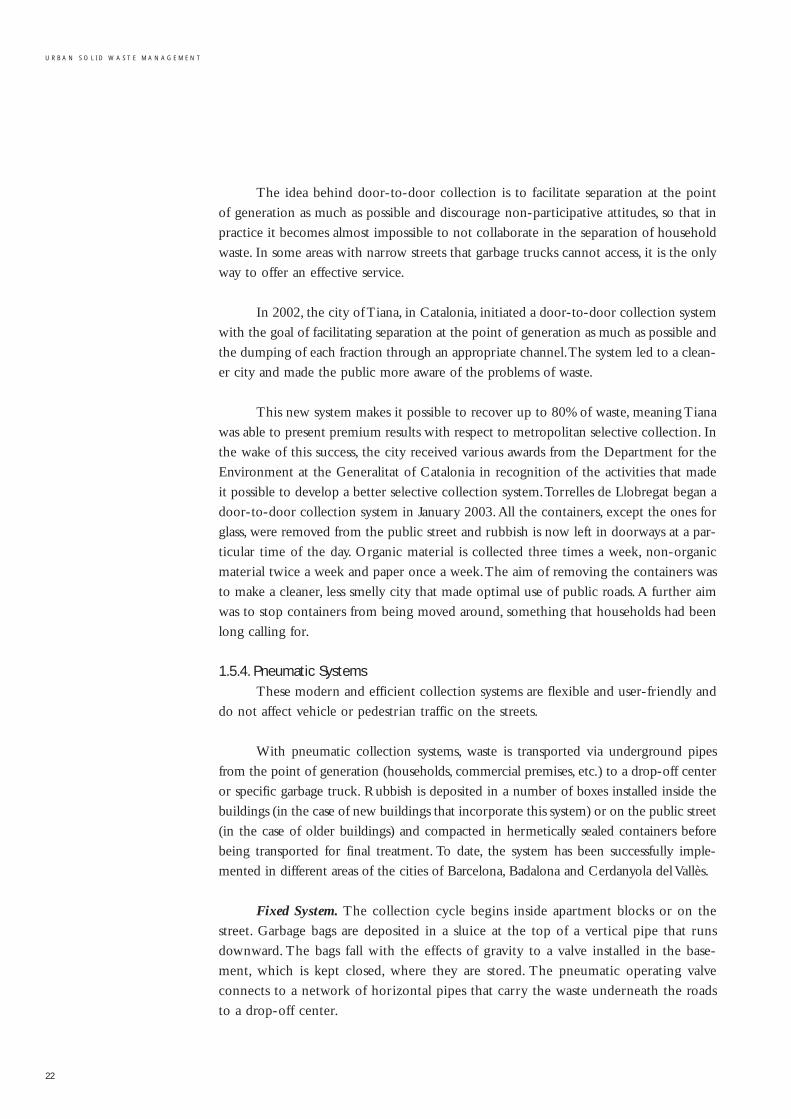
1.5.4. Pneumatic SystemsThese modern and efficient collection systems are flexible and user-friendly and
do not affect vehicle or pedestrian traffic on the streets.
With pneumatic collection systems, waste is transported via underground pipes
from the point of generation (households, commercial premises, etc.) to a drop-off center
or specific garbage truck. Rubbish is deposited in a number of boxes installed inside the
buildings (in the case of new buildings that incorporate this system) or on the public street
(in the case of older buildings) and compacted in hermetically sealed containers before
being transported for final treatment. To date, the system has been successfully imple-
mented in different areas of the cities of Barcelona, Badalona and Cerdanyola del Vallès.
Fixed System. The collection cycle begins inside apartment blocks or on the
street. Garbage bags are deposited in a sluice at the top of a vertical pipe that runs
downward. The bags fall with the effects of gravity to a valve installed in the base-
ment, which is kept closed, where they are stored. The pneumatic operating valve
connects to a network of horizontal pipes that carry the waste underneath the roads
to a drop-off center.
22
U R B A N S O L I D W A S T E M A N A G E M E N T
M U N I C I P A L W A S T E A N D I T S M A N A G E M E N T
23
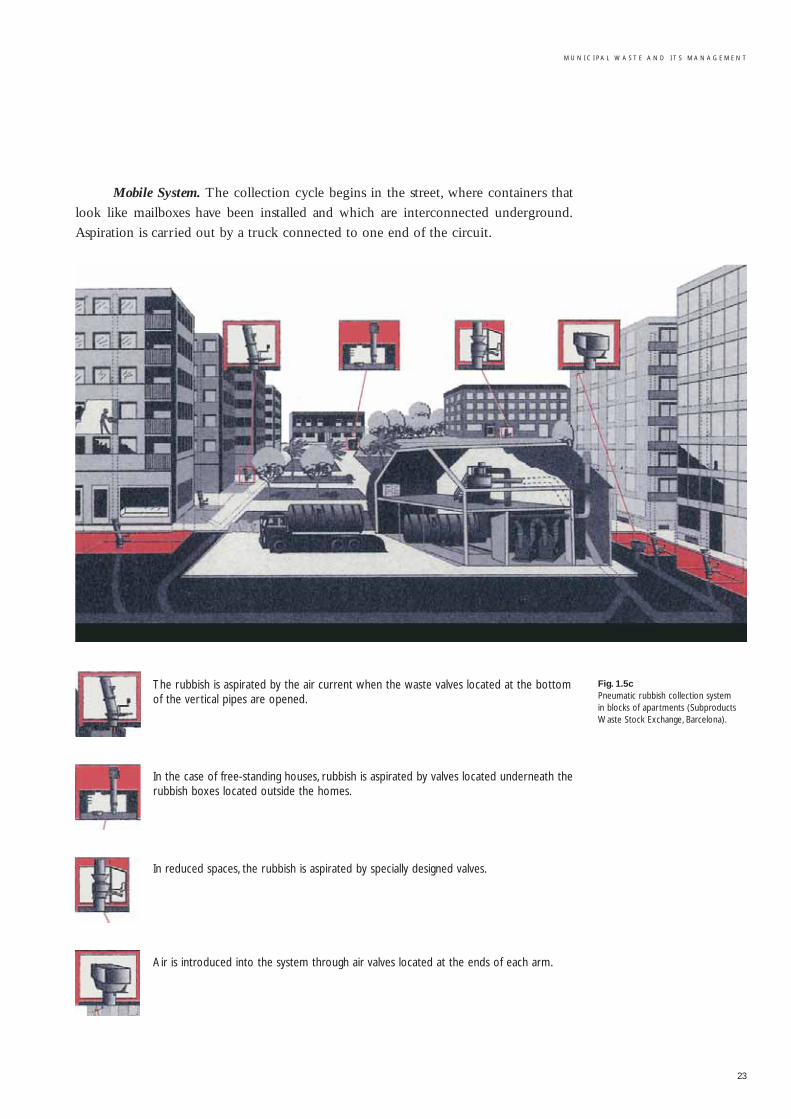
Mobile System. The collection cycle begins in the street, where containers that
look like mailboxes have been installed and which are interconnected underground.
Aspiration is carried out by a truck connected to one end of the circuit.
Fig. 1.5cPneumatic rubbish collection system in blocks of apartments (SubproductsWaste Stock Exchange, Barcelona).
The rubbish is aspirated by the air current when the waste valves located at the bottomof the vertical pipes are opened.
In the case of free-standing houses, rubbish is aspirated by valves located underneath therubbish boxes located outside the homes.
In reduced spaces, the rubbish is aspirated by specially designed valves.
Air is introduced into the system through air valves located at the ends of each arm.
1.6. ContributionCenters:Drop-off Centers or Green Points
Some municipal waste does not require a specific household-based collection
system of the type used for glass, paper, plastic, or, in some places, organic material.
However, the public may actively participate in selective collection for subsequent
recycling, reuse or appropriate treatment. This involves waste such as ink cartridges,
toners, consumer durables, electronic equipment, scrap iron and metals, motor oils,
tires and car batteries, batteries, clothes and shoes, paints, varnishes and fluorescent
bulbs, etc.
Recovery and recycling centers (also known as ‘Green Points’ or ‘Clean Points’)
are selective receiving and storage centers for selective waste not subject to household-
based collection.They reduce the amount of rubbish that will end up in controlled tips,
separate hazardous waste, prevent uncontrolled dumping and make the most of waste
that is potentially recyclable or reusable.
Management begins in the recovery and recycling centers, where material in a
good state is separated to be reused by groups who request it, and other material that is
potentially hazardous for health or for the environment is sent to treatment facilities.
The city of Barcelona has a mobile selective collection service called the Mobile
Green Point that consists of four garbage trucks that meet all the functions of a Green
Point. People can take their household waste to be distributed to the specific treatment
plants, either to recycle it or prevent it from polluting.
The city of Barcelona also has a number of Green Points in the neighborhoods.
These facilities meet the functions of recovery and recycling centers but are located
close to people’s homes, thus enabling people to take used material that can later be
reused or recycled.
The Green Points in the neighborhoods can also be used to resolve any question
about household waste management (clothes, accessories, household appliances, elec-
tronic equipment, computer equipment and aerosols) by approaching the staff that
works there.
Each recovery and recycling center is run by a local manager who has the col-
laboration of a joint logistics manager, in charge of transferring the material collected
in the different recovery and recycling centers to the specialized treatment centers.
The recovery and recycling center is just a temporary facility for the waste, which
will later continue the recycling process. The law that regulates waste in Catalonia
states that all municipalities of more than 5,000 inhabitants must have their own
recovery and recycling center. It is anticipated that there will be 42 up and running
across the metropolitan area by 2006 and that each town will also have at least one
such facility.
24
U R B A N S O L I D W A S T E M A N A G E M E N T
M U N I C I P A L W A S T E A N D I T S M A N A G E M E N T
25
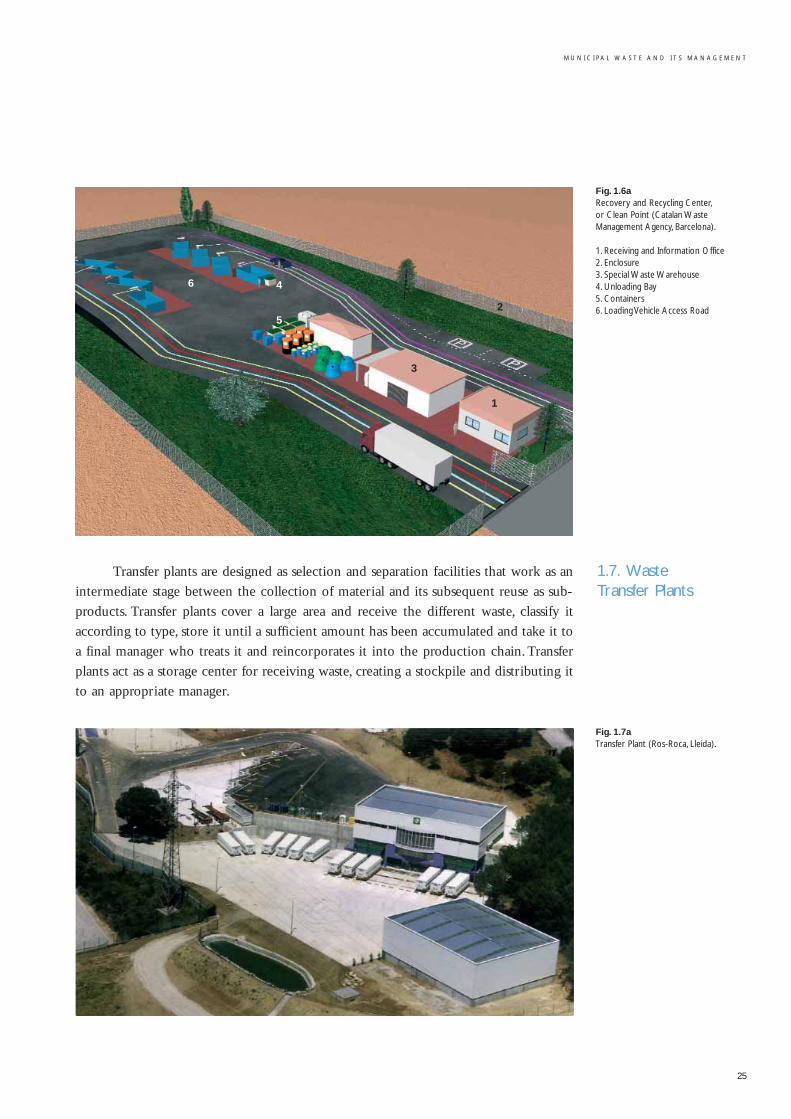
Transfer plants are designed as selection and separation facilities that work as an
intermediate stage between the collection of material and its subsequent reuse as sub-
products. Transfer plants cover a large area and receive the different waste, classify it
according to type, store it until a sufficient amount has been accumulated and take it to
a final manager who treats it and reincorporates it into the production chain. Transfer
plants act as a storage center for receiving waste, creating a stockpile and distributing it
to an appropriate manager.
Fig. 1.7aTransfer Plant (Ros-Roca, Lleida).
Fig. 1.6aRecovery and Recycling Center,or Clean Point (Catalan WasteManagement Agency, Barcelona).
1. Receiving and Information Office2. Enclosure3. Special Waste Warehouse4. Unloading Bay5. Containers6. Loading Vehicle Access Road
1
2
3
4
5
6
1.7. Waste Transfer Plants
1.8.Waste fromMarkets, Large Storesand Services
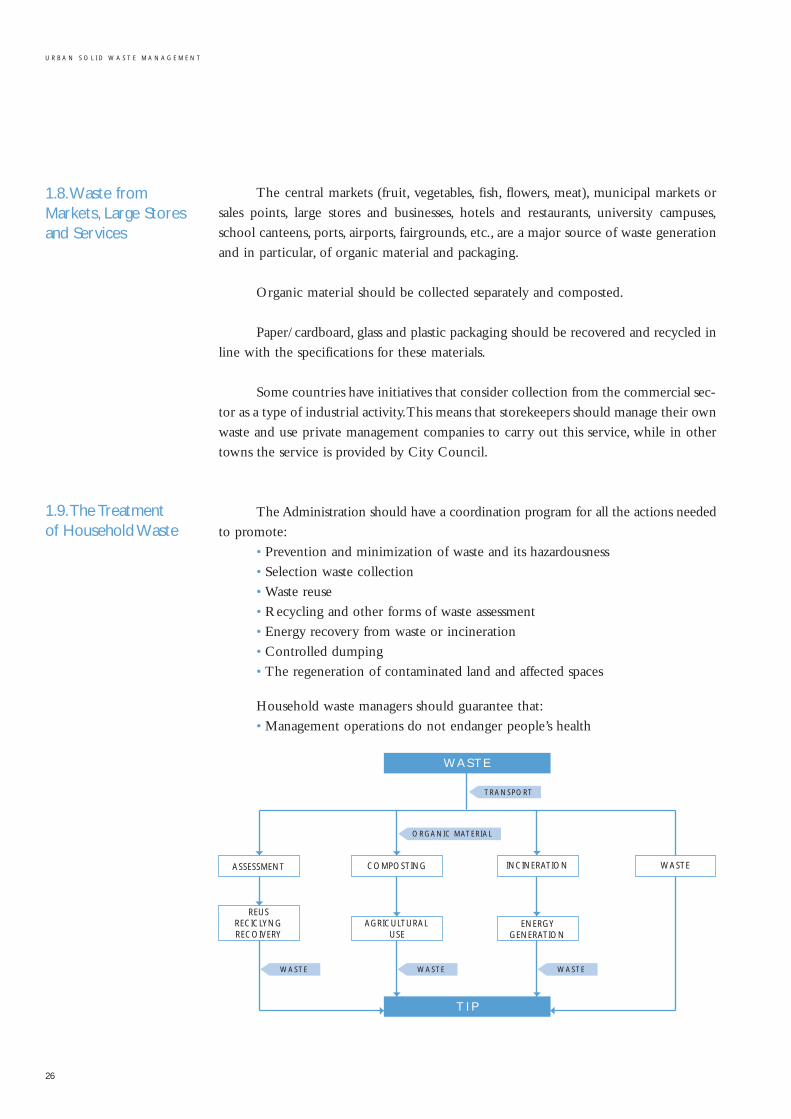
1.9.The Treatment of Household Waste
The central markets (fruit, vegetables, fish, flowers, meat), municipal markets or
sales points, large stores and businesses, hotels and restaurants, university campuses,
school canteens, ports, airports, fairgrounds, etc., are a major source of waste generation
and in particular, of organic material and packaging.
Organic material should be collected separately and composted.
Paper/cardboard, glass and plastic packaging should be recovered and recycled in
line with the specifications for these materials.
Some countries have initiatives that consider collection from the commercial sec-
tor as a type of industrial activity.This means that storekeepers should manage their own
waste and use private management companies to carry out this service, while in other
towns the service is provided by City Council.
The Administration should have a coordination program for all the actions needed
to promote:
• Prevention and minimization of waste and its hazardousness
• Selection waste collection
• Waste reuse
• Recycling and other forms of waste assessment
• Energy recovery from waste or incineration
• Controlled dumping
• The regeneration of contaminated land and affected spaces
Household waste managers should guarantee that:
• Management operations do not endanger people’s health
26
U R B A N S O L I D W A S T E M A N A G E M E N T
WA S T E
ASSESSMENT
REUSRECICLYNGRECOIVERY
AGRICULTURALUSE
COMPOSTING INCINERATION
ENERGYGENERATION
WASTE
T I P
TRANSPORT
ORGANIC MATERIAL
WASTE WASTEWASTE
M U N I C I P A L W A S T E A N D I T S M A N A G E M E N T
27
• Methods or procedures are not used that could harm the environment
• Methods do not lead to risk for the air, water, land, flora or fauna
• Methods do not bother people because of the noise or smell
• Methods do not affect the landscape or specially protected areas or elements
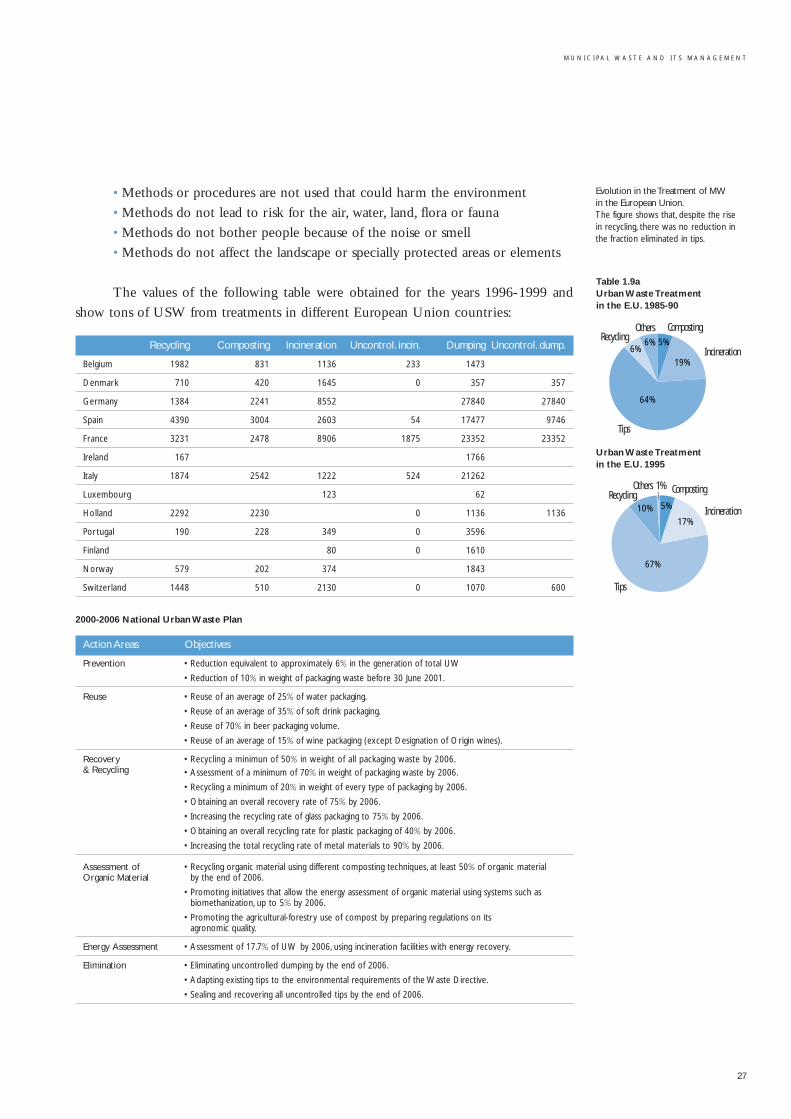
The values of the following table were obtained for the years 1996-1999 and
show tons of USW from treatments in different European Union countries:
Recycling Composting Incineration Uncontrol. incin. Dumping Uncontrol. dump.
Belgium 1982 831 1136 233 1473
Denmark 710 420 1645 0 357 357
Germany 1384 2241 8552 27840 27840
Spain 4390 3004 2603 54 17477 9746
France 3231 2478 8906 1875 23352 23352
Ireland 167 1766
Italy 1874 2542 1222 524 21262
Luxembourg 123 62
Holland 2292 2230 0 1136 1136
Portugal 190 228 349 0 3596
Finland 80 0 1610
Norway 579 202 374 1843
Switzerland 1448 510 2130 0 1070 600
2000-2006 National Urban Waste Plan
Action Areas Objectives
Prevention • Reduction equivalent to approximately 6% in the generation of total UW
• Reduction of 10% in weight of packaging waste before 30 June 2001.
Reuse • Reuse of an average of 25% of water packaging.
• Reuse of an average of 35% of soft drink packaging.
• Reuse of 70% in beer packaging volume.
• Reuse of an average of 15% of wine packaging (except Designation of Origin wines).
Recovery • Recycling a minimun of 50% in weight of all packaging waste by 2006.& Recycling • Assessment of a minimum of 70% in weight of packaging waste by 2006.
• Recycling a minimum of 20% in weight of every type of packaging by 2006.
• Obtaining an overall recovery rate of 75% by 2006.
• Increasing the recycling rate of glass packaging to 75% by 2006.
• Obtaining an overall recycling rate for plastic packaging of 40% by 2006.
• Increasing the total recycling rate of metal materials to 90% by 2006.
Assessment of • Recycling organic material using different composting techniques, at least 50% of organic material Organic Material by the end of 2006.
• Promoting initiatives that allow the energy assessment of organic material using systems such as biomethanization, up to 5% by 2006.
• Promoting the agricultural-forestry use of compost by preparing regulations on its agronomic quality.
Energy Assessment • Assessment of 17.7% of UW by 2006, using incineration facilities with energy recovery.
Elimination • Eliminating uncontrolled dumping by the end of 2006.
• Adapting existing tips to the environmental requirements of the Waste Directive.
• Sealing and recovering all uncontrolled tips by the end of 2006.
Table 1.9a Urban Waste Treatment in the E.U. 1985-90
Others
Incineration
Tips
5%
19%
6%
64%
CompostingRecycling
6%
Evolution in the Treatment of MW in the European Union.The figure shows that, despite the risein recycling, there was no reduction inthe fraction eliminated in tips.
Urban Waste Treatment in the E.U. 1995
5%
17%
67%
10%
Others 1%
Incineration
Tips
CompostingRecycling
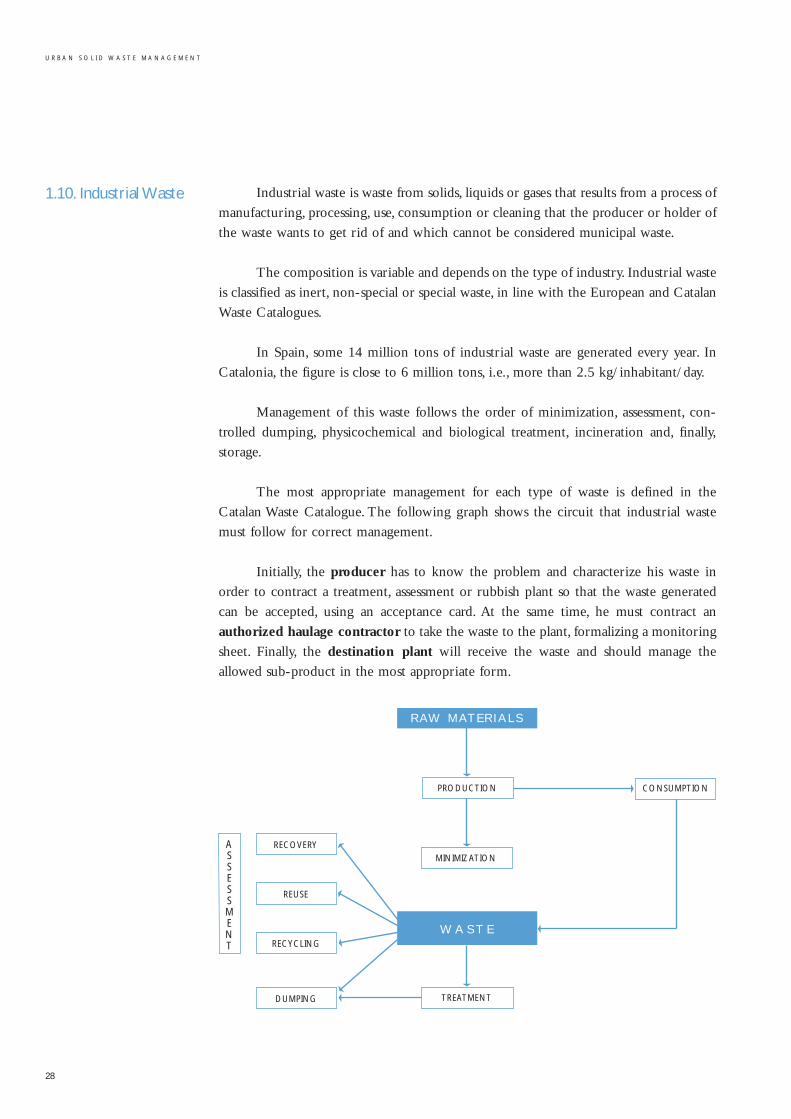
1.10. Industrial Waste Industrial waste is waste from solids, liquids or gases that results from a process of
manufacturing, processing, use, consumption or cleaning that the producer or holder of
the waste wants to get rid of and which cannot be considered municipal waste.
The composition is variable and depends on the type of industry. Industrial waste
is classified as inert, non-special or special waste, in line with the European and Catalan
Waste Catalogues.
In Spain, some 14 million tons of industrial waste are generated every year. In
Catalonia, the figure is close to 6 million tons, i.e., more than 2.5 kg/inhabitant/day.
Management of this waste follows the order of minimization, assessment, con-
trolled dumping, physicochemical and biological treatment, incineration and, finally,
storage.
The most appropriate management for each type of waste is defined in the
Catalan Waste Catalogue. The following graph shows the circuit that industrial waste
must follow for correct management.
Initially, the producer has to know the problem and characterize his waste in
order to contract a treatment, assessment or rubbish plant so that the waste generated
can be accepted, using an acceptance card. At the same time, he must contract an
authorized haulage contractor to take the waste to the plant, formalizing a monitoring
sheet. Finally, the destination plant will receive the waste and should manage the
allowed sub-product in the most appropriate form.
28
U R B A N S O L I D W A S T E M A N A G E M E N T
R AW M AT E R I A L S
CONSUMPTION
W A S T E
REUSE
PRODUCTION
MINIMIZATION
TREATMENT
RECOVERY
RECYCLING
ASSESSMENT
DUMPING
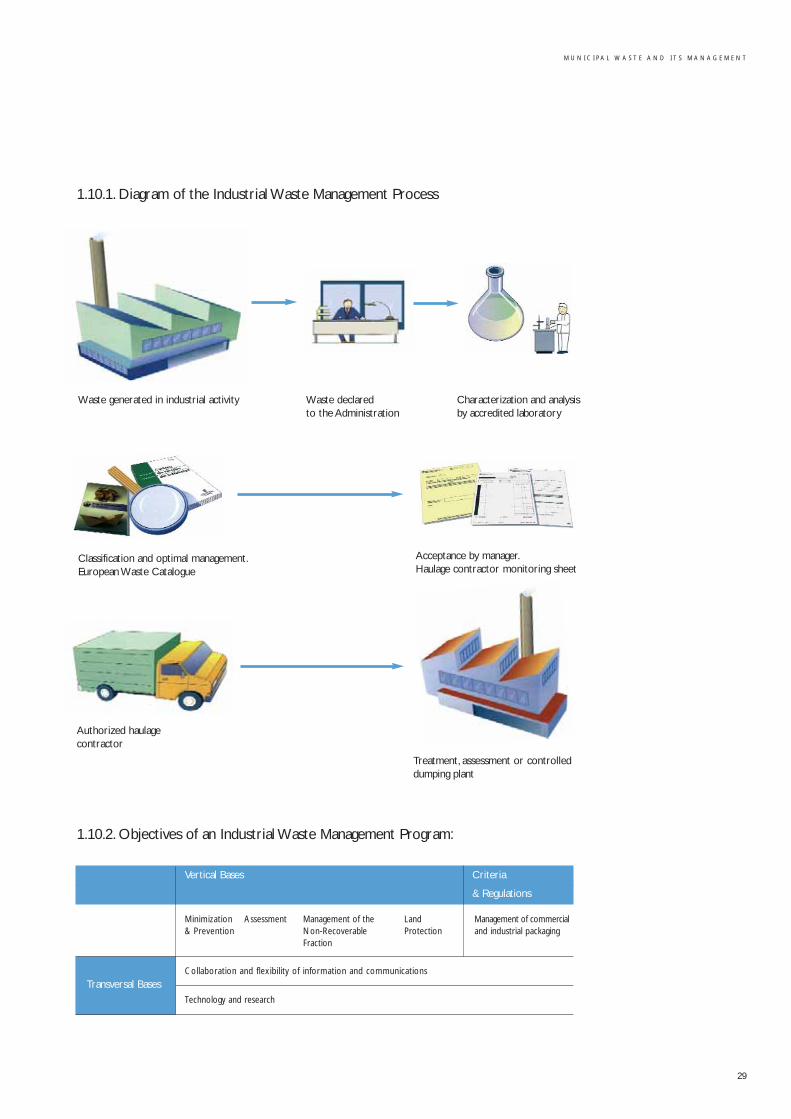
M U N I C I P A L W A S T E A N D I T S M A N A G E M E N T
29
Vertical Bases Criteria
& Regulations
Minimization Assessment Management of the Land Management of commercial& Prevention Non-Recoverable Protection and industrial packaging
Fraction
Collaboration and flexibility of information and communications
Technology and research
Waste generated in industrial activity Waste declared to the Administration
Characterization and analysisby accredited laboratory
Classification and optimal management.European Waste Catalogue
Acceptance by manager.Haulage contractor monitoring sheet
Authorized haulage contractor
Treatment, assessment or controlleddumping plant
1.10.1. Diagram of the Industrial Waste Management Process
Transversal Bases
1.10.2. Objectives of an Industrial Waste Management Program:
General Objectives:
• Minimize the generation of industrial waste both in terms of quantity and quality.
• Raise the amount of assessment of industrial waste and improve the activities of the assessment
sector and of obtained products.
• Reduce the amount of waste fractions earmarked for dumping and guarantee it is done in accor-
dance with the strictest possible safety conditions.
• Integrate the objectives in social awareness programs that involve the participation and collabo-
ration of the public, economic agents and all authorities of the Administration.
• Coordinate the program with joint and complementary actions to be included in the updating of
the municipal waste management program and establish, where necessary, the cooperation and
participation needed by local authorities.
• Improve industrial waste management and promote the new specific technologies considered
necessary to optimize this management.
• Incorporate instruments that make industrial waste management more flexible and that facilitate
improved management.
• Simplify the waste management model and facilitate its use in all industrial sectors, in particu-
lar SMEs, adopting new information technologies.
• Promote research and a network of technological innovation applied to the management field.
• Organize activities involving land protection and recovery of contaminated land.
• Promote the implementation of economic incentives favorable to improving industrial waste
management.
Local administrations with a special industrial waste treatment facility that con-
sists of
• A physicochemical treatment plant
• An incinerator
• Controlled dumping
should participate in the provision of the service, meeting the control and mo-
nitoring functions of the facility and make the most of social and economic activities
aimed directly at improving the quality of life of their citizens.
City councils can be the beneficiaries of an economic fund of a variable
nature, determined according to the facility system and the number of tons treated
per year.
30
U R B A N S O L I D W A S T E M A N A G E M E N T
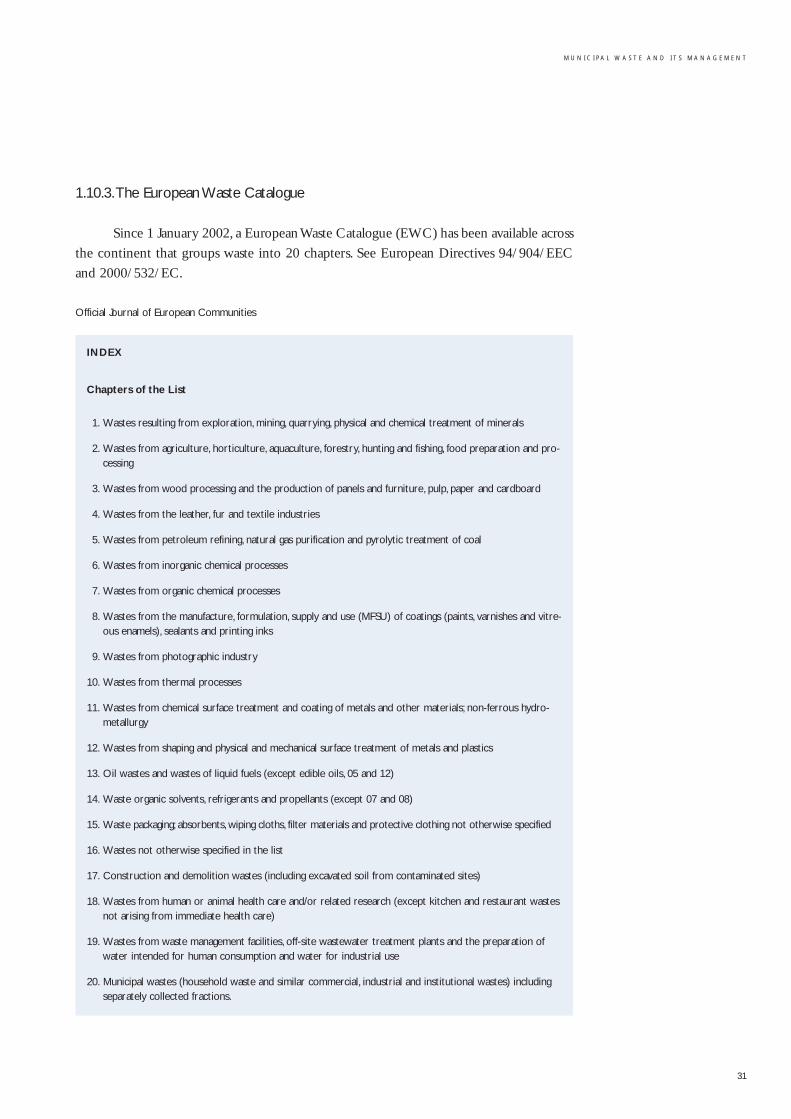
M U N I C I P A L W A S T E A N D I T S M A N A G E M E N T
31
1.10.3.The European Waste Catalogue
Since 1 January 2002, a European Waste Catalogue (EWC) has been available across
the continent that groups waste into 20 chapters. See European Directives 94/904/EEC
and 2000/532/EC.
Official Journal of European Communities
INDEX
Chapters of the List
1. Wastes resulting from exploration, mining, quarrying, physical and chemical treatment of minerals
2. Wastes from agriculture, horticulture, aquaculture, forestry, hunting and fishing, food preparation and pro-cessing
3. Wastes from wood processing and the production of panels and furniture, pulp, paper and cardboard
4. Wastes from the leather, fur and textile industries
5. Wastes from petroleum refining, natural gas purification and pyrolytic treatment of coal
6. Wastes from inorganic chemical processes
7. Wastes from organic chemical processes
8. Wastes from the manufacture, formulation, supply and use (MFSU) of coatings (paints, varnishes and vitre-ous enamels), sealants and printing inks
9. Wastes from photographic industry
10. Wastes from thermal processes
11. Wastes from chemical surface treatment and coating of metals and other materials; non-ferrous hydro-metallurgy
12. Wastes from shaping and physical and mechanical surface treatment of metals and plastics
13. Oil wastes and wastes of liquid fuels (except edible oils, 05 and 12)
14. Waste organic solvents, refrigerants and propellants (except 07 and 08)
15. Waste packaging; absorbents, wiping cloths, filter materials and protective clothing not otherwise specified
16. Wastes not otherwise specified in the list
17. Construction and demolition wastes (including excavated soil from contaminated sites)
18. Wastes from human or animal health care and/or related research (except kitchen and restaurant wastesnot arising from immediate health care)
19. Wastes from waste management facilities, off-site wastewater treatment plants and the preparation ofwater intended for human consumption and water for industrial use
20. Municipal wastes (household waste and similar commercial, industrial and institutional wastes) includingseparately collected fractions.
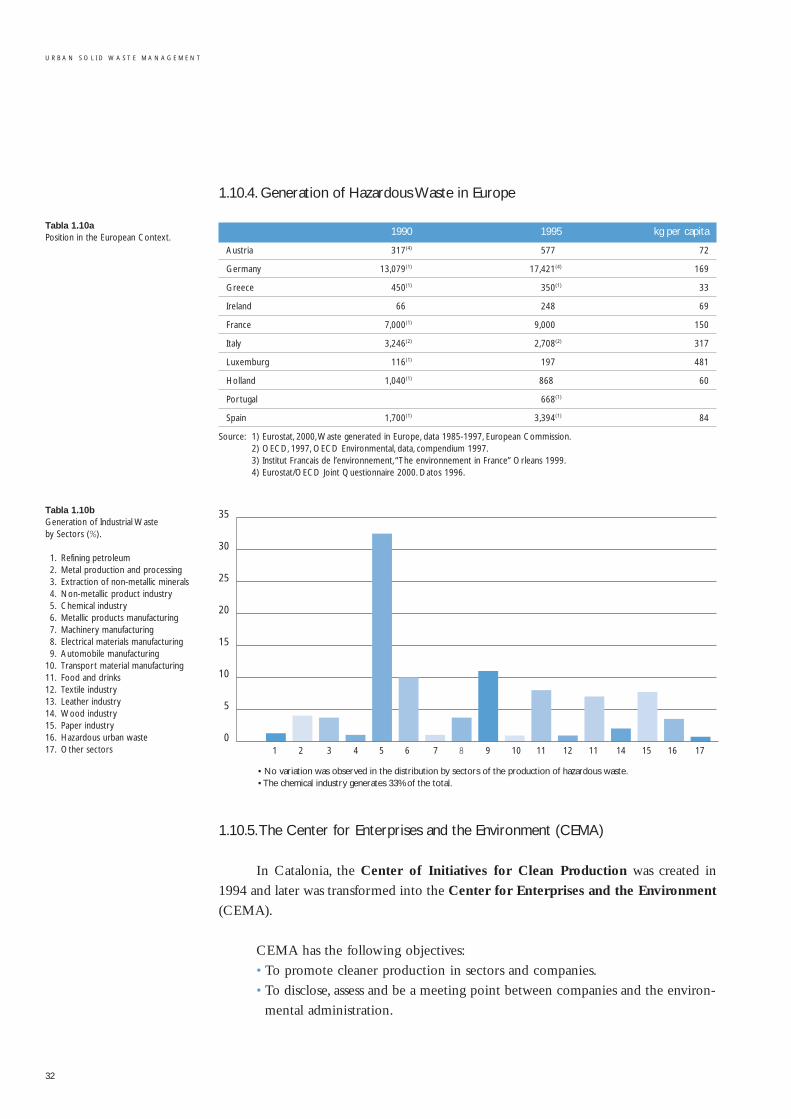
Tabla 1.10a Position in the European Context.
Tabla 1.10b Generation of Industrial Waste by Sectors (%).
1. Refining petroleum2. Metal production and processing3. Extraction of non-metallic minerals4. Non-metallic product industry5. Chemical industry6. Metallic products manufacturing7. Machinery manufacturing8. Electrical materials manufacturing9. Automobile manufacturing
10. Transport material manufacturing11. Food and drinks12. Textile industry13. Leather industry14. Wood industry15. Paper industry16. Hazardous urban waste17. Other sectors
1.10.4. Generation of Hazardous Waste in Europe
1990 1995 kg per capita
Austria 317(4) 577(4) 72
Germany 13,079(1) 17,421(4) 169
Greece 450(1) 350(1) 33
Ireland 66(4) 248(4) 69
France 7,000(1) 9,000(4) 150
Italy 3,246(2) 2,708(2) 317
Luxemburg 116(1) 197(4) 481
Holland 1,040(1) 868(4)) 60
Portugal 668(1)
Spain 1,700(1) 3,394(1) 84
Source: 1) Eurostat, 2000,Waste generated in Europe, data 1985-1997, European Commission.2) OECD, 1997, OECD Environmental, data, compendium 1997.3) Institut Francais de l’environnement, “The environnement in France” Orleans 1999.4) Eurostat/OECD Joint Questionnaire 2000. Datos 1996.
1.10.5.The Center for Enterprises and the Environment (CEMA)
In Catalonia, the Center of Initiatives for Clean Production was created in
1994 and later was transformed into the Center for Enterprises and the Environment
(CEMA).
CEMA has the following objectives:
• To promote cleaner production in sectors and companies.
• To disclose, assess and be a meeting point between companies and the environ-
mental administration.
32
U R B A N S O L I D W A S T E M A N A G E M E N T
0
5
10
15
20
25
30
35
1 2 3 4 5 6 7 8 9 10 11 12 11 14 15 16 17
• No variation was observed in the distribution by sectors of the production of hazardous waste.• The chemical industry generates 33% of the total.
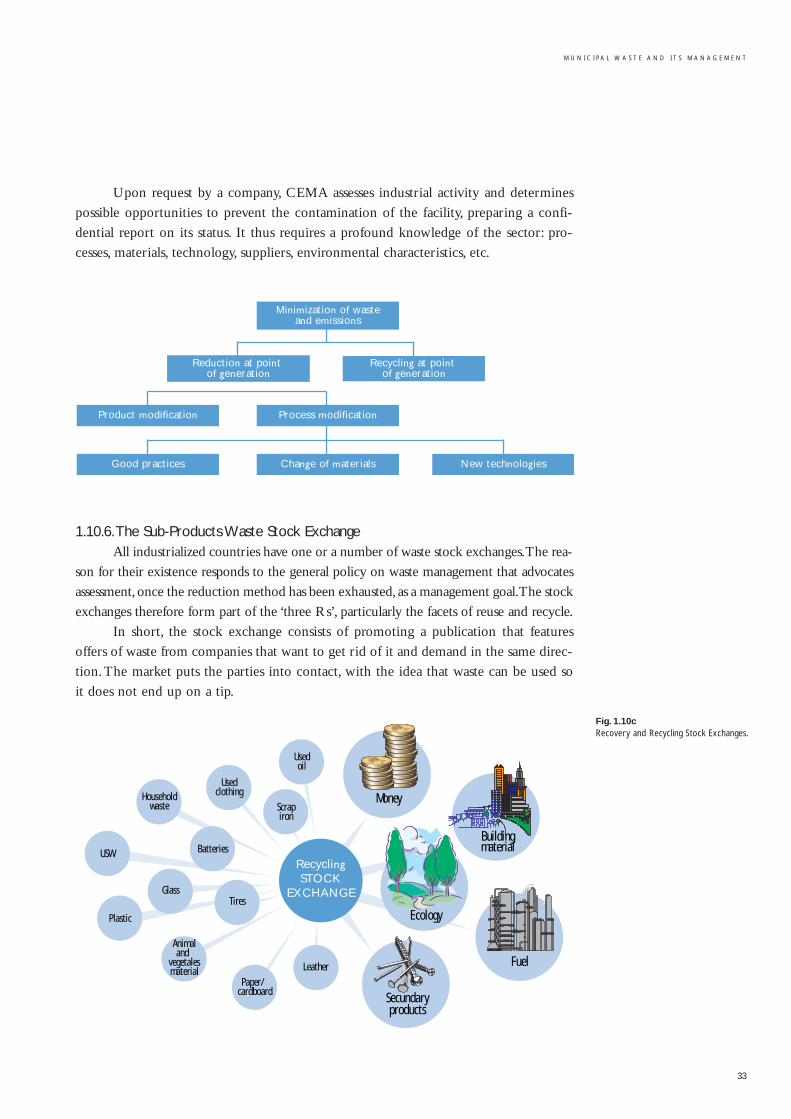
M U N I C I P A L W A S T E A N D I T S M A N A G E M E N T
33
Upon request by a company, CEMA assesses industrial activity and determines
possible opportunities to prevent the contamination of the facility, preparing a confi-
dential report on its status. It thus requires a profound knowledge of the sector: pro-
cesses, materials, technology, suppliers, environmental characteristics, etc.
1.10.6.The Sub-Products Waste Stock Exchange All industrialized countries have one or a number of waste stock exchanges.The rea-
son for their existence responds to the general policy on waste management that advocates
assessment, once the reduction method has been exhausted, as a management goal.The stock
exchanges therefore form part of the ‘three Rs’, particularly the facets of reuse and recycle.
In short, the stock exchange consists of promoting a publication that features
offers of waste from companies that want to get rid of it and demand in the same direc-
tion.The market puts the parties into contact, with the idea that waste can be used so
it does not end up on a tip.
Fig. 1.10c Recovery and Recycling Stock Exchanges.
Minimization of wasteand emissions
Reduction at point of generation
Change of materials
Process modification
Recycling at point of generation
New technologiesGood practices
Product modification
RecyclingSTOCK
EXCHANGE
Usedclothing
BatteriesUSW
Householdwaste
Tires
Animaland
vegetalesmaterial
Glass
Plastic
Paper/ cardboard
Usedoil
Scrapiron
Leather
Ecology
Buildingmaterial
Money
Fuel
Secundaryproducts
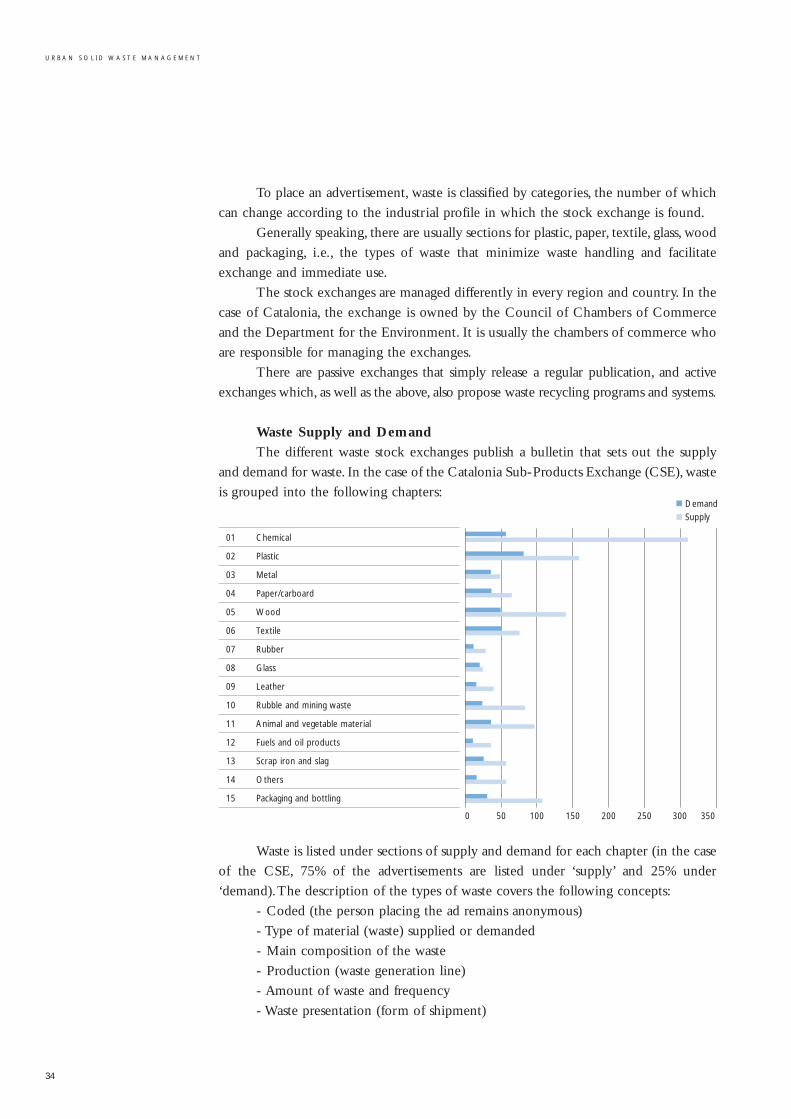
To place an advertisement, waste is classified by categories, the number of which
can change according to the industrial profile in which the stock exchange is found.
Generally speaking, there are usually sections for plastic, paper, textile, glass, wood
and packaging, i.e., the types of waste that minimize waste handling and facilitate
exchange and immediate use.
The stock exchanges are managed differently in every region and country. In the
case of Catalonia, the exchange is owned by the Council of Chambers of Commerce
and the Department for the Environment. It is usually the chambers of commerce who
are responsible for managing the exchanges.
There are passive exchanges that simply release a regular publication, and active
exchanges which, as well as the above, also propose waste recycling programs and systems.
Waste Supply and Demand
The different waste stock exchanges publish a bulletin that sets out the supply
and demand for waste. In the case of the Catalonia Sub-Products Exchange (CSE), waste
is grouped into the following chapters:
Waste is listed under sections of supply and demand for each chapter (in the case
of the CSE, 75% of the advertisements are listed under ‘supply’ and 25% under
‘demand).The description of the types of waste covers the following concepts:
- Coded (the person placing the ad remains anonymous)
- Type of material (waste) supplied or demanded
- Main composition of the waste
- Production (waste generation line)
- Amount of waste and frequency
- Waste presentation (form of shipment)
34
U R B A N S O L I D W A S T E M A N A G E M E N T
01 Chemical
02 Plastic
03 Metal
04 Paper/carboard
05 Wood
06 Textile
07 Rubber
08 Glass
09 Leather
10 Rubble and mining waste
11 Animal and vegetable material
12 Fuels and oil products
13 Scrap iron and slag
14 Others
15 Packaging and bottling
0 50 100 150 200 250 300 350
DemandSupply
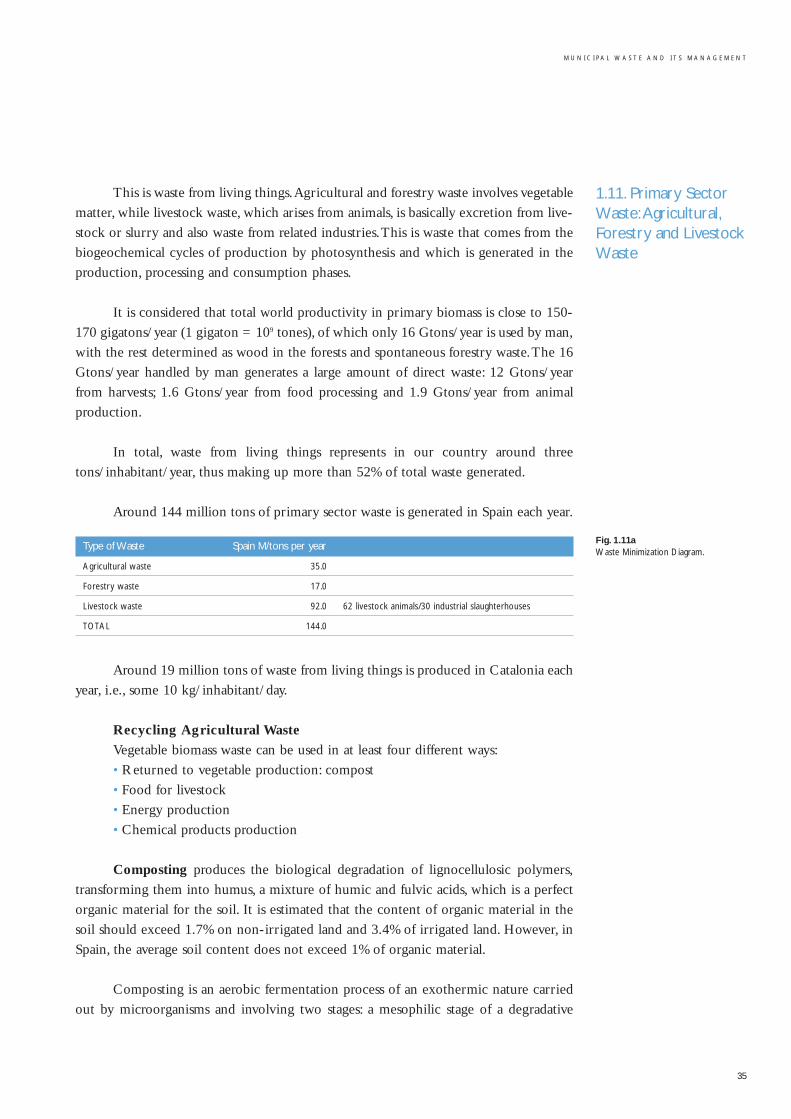
M U N I C I P A L W A S T E A N D I T S M A N A G E M E N T
35
This is waste from living things.Agricultural and forestry waste involves vegetable
matter, while livestock waste, which arises from animals, is basically excretion from live-
stock or slurry and also waste from related industries.This is waste that comes from the
biogeochemical cycles of production by photosynthesis and which is generated in the
production, processing and consumption phases.
It is considered that total world productivity in primary biomass is close to 150-
170 gigatons/year (1 gigaton = 109 tones), of which only 16 Gtons/year is used by man,
with the rest determined as wood in the forests and spontaneous forestry waste.The 16
Gtons/year handled by man generates a large amount of direct waste: 12 Gtons/year
from harvests; 1.6 Gtons/year from food processing and 1.9 Gtons/year from animal
production.
In total, waste from living things represents in our country around three
tons/inhabitant/year, thus making up more than 52% of total waste generated.
Around 144 million tons of primary sector waste is generated in Spain each year.
Type of Waste Spain M/tons per year
Agricultural waste 35.0
Forestry waste 17.0
Livestock waste 92.0 62 livestock animals/30 industrial slaughterhouses
TOTAL 144.0
Around 19 million tons of waste from living things is produced in Catalonia each
year, i.e., some 10 kg/inhabitant/day.
Recycling Agricultural Waste
Vegetable biomass waste can be used in at least four different ways:
• Returned to vegetable production: compost
• Food for livestock
• Energy production
• Chemical products production
Composting produces the biological degradation of lignocellulosic polymers,
transforming them into humus, a mixture of humic and fulvic acids, which is a perfect
organic material for the soil. It is estimated that the content of organic material in the
soil should exceed 1.7% on non-irrigated land and 3.4% of irrigated land. However, in
Spain, the average soil content does not exceed 1% of organic material.
Composting is an aerobic fermentation process of an exothermic nature carried
out by microorganisms and involving two stages: a mesophilic stage of a degradative
1.11. Primary SectorWaste:Agricultural,Forestry and LivestockWaste
Fig. 1.11aWaste Minimization Diagram.
nature and a maturing stage, where the oxidizing processes are strengthened and per-
fected and the product is stabilized. Compost also returns to the soil a good part of the
nutrients – nitrogen, phosphorous and potassium – contained in remains.
Food for livestock is common in the case of straw and the remains of wine,
olives and sugar beet, but can also come from some industrial crops, such as sunflowers,
cotton, peanuts and other forestry crops.
Other use options are to apply the crop remains of rice, tobacco or banana leaves
or cotton waste, used as an agricultural compound in the substrata of mushroom plan-
tations (champignons) and fast-production mushrooms.
Thermochemical Use of Forestry Remains:
• Pyrolysis, which involves decomposing organic matter in a poor and inert
atmosphere without oxygen.This results in wood charcoal, used as a reducer in
the metal industry and as a raw material in the manufacturing of activated car-
bon and as a source of energy.
• Gasification, i.e., the partial combustion of organic matter in a gas environ-
ment, adding an oxidant. This obtains town gas and synthesis gas (CO+H2) to
obtain organic compounds such as methanol, ammonia and certain hydrocar-
bons. It can activate gas turbines at 500ºC and combined cycles.
• Liquefaction, i.e., the conversion of the lignocellulosic matter in wood into a
mixture of organic liquid products, such as phenols and polysaccharides.
• Combustion. 6MW stations are proposed in Catalonia to obtain electrical
energy from the burning of wood waste.
• Cogeneration, i.e., electrical generation and making the most of heat at the
same time.Applications are limited because the exhaust gases leave at a relatively
low temperature (60-90ºC).
Livestock Waste: Slurry
This is mainly liquid excrement from pigs, cows and birds. It includes:
• Urine
• Solid excrement
• Food scraps
• Losses from troughs
• Bay cleaning water
There are 20 million pigs in Spain, six million in Catalonia.
Each pig produces 10 liters of slurry per day, representing more than four times
the pollutants of humans.
Excrement is called slurry if it contains up to 15% of dry material and manure if
it contains more than 30% of dry material.
36
U R B A N S O L I D W A S T E M A N A G E M E N T
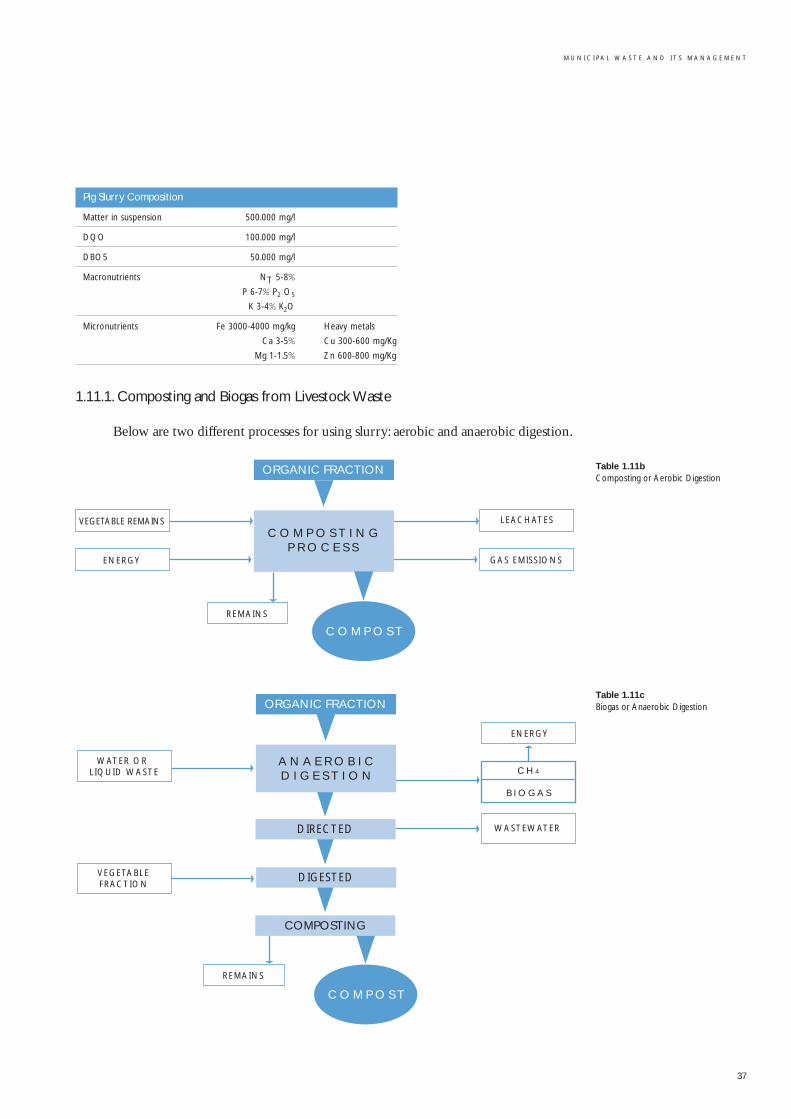
M U N I C I P A L W A S T E A N D I T S M A N A G E M E N T
37
Pig Slurry Composition
Matter in suspension 500.000 mg/l
DQO 100.000 mg/l
DBO5 50.000 mg/l
Macronutrients NT 5-8%
P 6-7% P2 O5
K 3-4% K2O
Micronutrients Fe 3000-4000 mg/kg Heavy metals
Ca 3-5% Cu 300-600 mg/Kg
Mg 1-1.5% Zn 600-800 mg/Kg
1.11.1. Composting and Biogas from Livestock Waste
Below are two different processes for using slurry: aerobic and anaerobic digestion.
Table 1.11b Composting or Aerobic Digestion
Table 1.11c Biogas or Anaerobic Digestion
ORGANIC FRACTION
LEACHATES
C O M P O S T I N GP R O C E S S
ENERGY
VEGETABLE REMAINS
REMAINS
GAS EMISSIONS
C O M P O S T
REMAINS
C O M P O S T
ORGANIC FRACTION
ENERGY
A N A E R O B I CD I G E S T I O N
VEGETABLEFRACTION
WATER OR LIQUID WASTE
WASTEWATERDIRECTED
DIGESTED
COMPOSTING
C H 4
B I O G A S
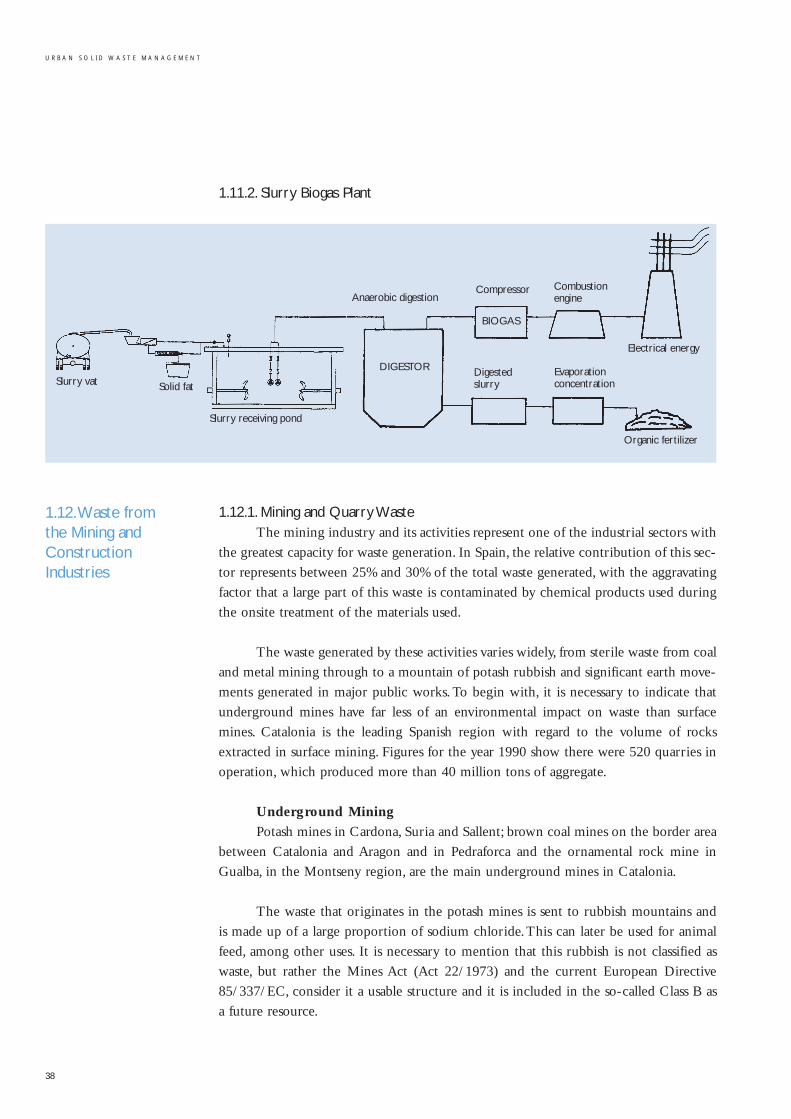
1.12.Waste from the Mining andConstructionIndustries
1.11.2. Slurry Biogas Plant
Anaerobic digestion
Compressor
Combustion engine
Electrical energy
Slurry vat Solid fat
BIOGAS
DIGESTOR
Slurry receiving pond
Digested slurry Evaporation concentration Organic fertilizer
1.12.1. Mining and Quarry WasteThe mining industry and its activities represent one of the industrial sectors with
the greatest capacity for waste generation. In Spain, the relative contribution of this sec-
tor represents between 25% and 30% of the total waste generated, with the aggravating
factor that a large part of this waste is contaminated by chemical products used during
the onsite treatment of the materials used.
The waste generated by these activities varies widely, from sterile waste from coal
and metal mining through to a mountain of potash rubbish and significant earth move-
ments generated in major public works. To begin with, it is necessary to indicate that
underground mines have far less of an environmental impact on waste than surface
mines. Catalonia is the leading Spanish region with regard to the volume of rocks
extracted in surface mining. Figures for the year 1990 show there were 520 quarries in
operation, which produced more than 40 million tons of aggregate.
Underground Mining
Potash mines in Cardona, Suria and Sallent; brown coal mines on the border area
between Catalonia and Aragon and in Pedraforca and the ornamental rock mine in
Gualba, in the Montseny region, are the main underground mines in Catalonia.
The waste that originates in the potash mines is sent to rubbish mountains and
is made up of a large proportion of sodium chloride.This can later be used for animal
feed, among other uses. It is necessary to mention that this rubbish is not classified as
waste, but rather the Mines Act (Act 22/1973) and the current European Directive
85/337/EC, consider it a usable structure and it is included in the so-called Class B as
a future resource.
38
U R B A N S O L I D W A S T E M A N A G E M E N T
Slurry vat Solid fat
Slurry receiving pond
DIGESTOR
Anaerobic digestion
Digestedslurry
Compressor Combustionengine
Evaporationconcentration
Electrical energy
Organic fertilizer
BIOGAS
M U N I C I P A L W A S T E A N D I T S M A N A G E M E N T
39
Coal mining produces deads and waste that can be used as the bases of highways,
in the manufacturing of ceramic materials, the construction of banks and as filling mate-
rial for the mining hole itself.
The ornamental rock sector generates little waste, and that which is produced is
introduced into the hole created during the mining process.
Open Air Mining
Catalonia is the leading community in Spain with regard to volume of rocks
extracted in surface mining, with more than 500 quarries and around 50 million tons
per year. Most of the aggregate goes to the construction and building industries,
although it is also widely used in civil works: roads, highways and freeways, railroads,
dams, etc.
When aggregate hardens in the air it is known as agglomerate and is used to make
cement, concrete, lime, plaster, ceramics and other materials.
The deads or waste generated in this activity is used to fill the holes left by the
materials themselves or as the bases for highways or for making banks.
The production of industrial rocks in Catalonia is distributed in line with the
following table:
Material Production TN/year
Construction aggregate 25,000,000
Lime and cement 13,000,000
Clay 2,500,000
Plaster 1,000,000
Chalk 850,000
Ornamental rock 600,000
Sand, glass 25,000
1.12.2. Construction Waste
Construction basically generates three types of waste: excavation waste, due to
the movements of earth and excavations of the land; waste from construction work
itself and the different operations involved with it; and, finally, waste from demolition
works.
In the near future, we should think about undertaking construction work with a
view to deconstruct, demolishing the work in a way that ensures most of the materials
involved can be used.
The law establishes that it is necessary to create recycling and treatment plants for
waste from construction, and to promote systems and techniques that can best recover
and market waste.
In Catalonia, the construction industry moves more than 2 million tons of waste
every year, around 1 kg/inhabitant/day.
The program anticipates recycling 65% of waste from the construction industry
by the end of the established period.
Decree 161/2001 regulates demolitions and other waste from construction and
Decree 1/1997 and European Directive 31/1999/EEC regulate adapting rubbish dumps
for the construction industry.
The Construction Waste Management Program anticipates a deployment of
infrastructure during this period as follows:
Infraestructures 2001 2006
Recycling plants 4 18
Transfer plants 3 64
Controlled dumps 41 69
The types of facilities needed to configure this integrated network are:
• Earth and rubbish dumps and monofills: the number of dumps in each
province must be the minimum needed to guarantee enough controlled dumping
capacity at a reasonable distance and with reasonable transport cost.
• Transfer plants: facilities for pouring construction waste with a basic logistical
function of reducing transportation and serving the areas furthest away from
each province’s dumps. It is anticipated that a function of gathering and pro-
cessing recyclable material shall be added in the medium term, and a system for
classifying and assessing construction waste from containers shall be added in
the long term.
• Recycling plants: mobile, semi-mobile and fixed plants, depending on pro-
ximity to large, medium and small urban centers and the volume of material
available to recycle each year. It is initially anticipated to expand recycling areas
within dumps and transfer areas, using mobile plants, and, beyond a particular
production volume, channeling the construction of industrial plants in the areas
that produce the most construction waste.
40
U R B A N S O L I D W A S T E M A N A G E M E N T
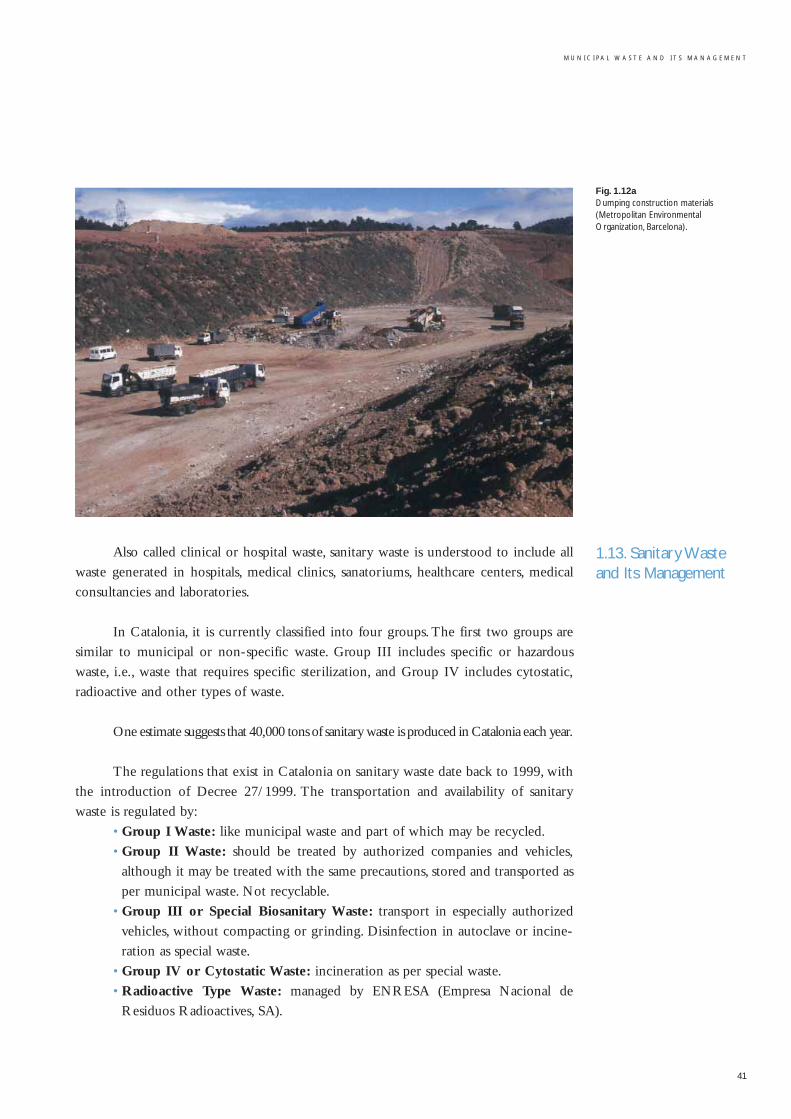
M U N I C I P A L W A S T E A N D I T S M A N A G E M E N T
41
Also called clinical or hospital waste, sanitary waste is understood to include all
waste generated in hospitals, medical clinics, sanatoriums, healthcare centers, medical
consultancies and laboratories.
In Catalonia, it is currently classified into four groups. The first two groups are
similar to municipal or non-specific waste. Group III includes specific or hazardous
waste, i.e., waste that requires specific sterilization, and Group IV includes cytostatic,
radioactive and other types of waste.
One estimate suggests that 40,000 tons of sanitary waste is produced in Catalonia each year.
The regulations that exist in Catalonia on sanitary waste date back to 1999, with
the introduction of Decree 27/1999. The transportation and availability of sanitary
waste is regulated by:
• Group I Waste: like municipal waste and part of which may be recycled.
• Group II Waste: should be treated by authorized companies and vehicles,
although it may be treated with the same precautions, stored and transported as
per municipal waste. Not recyclable.
• Group III or Special Biosanitary Waste: transport in especially authorized
vehicles, without compacting or grinding. Disinfection in autoclave or incine-
ration as special waste.
• Group IV or Cytostatic Waste: incineration as per special waste.
• Radioactive Type Waste: managed by ENRESA (Empresa Nacional de
Residuos Radioactives, SA).
Fig. 1.12aDumping construction materials(Metropolitan EnvironmentalOrganization, Barcelona).
1.13. Sanitary Wasteand Its Management
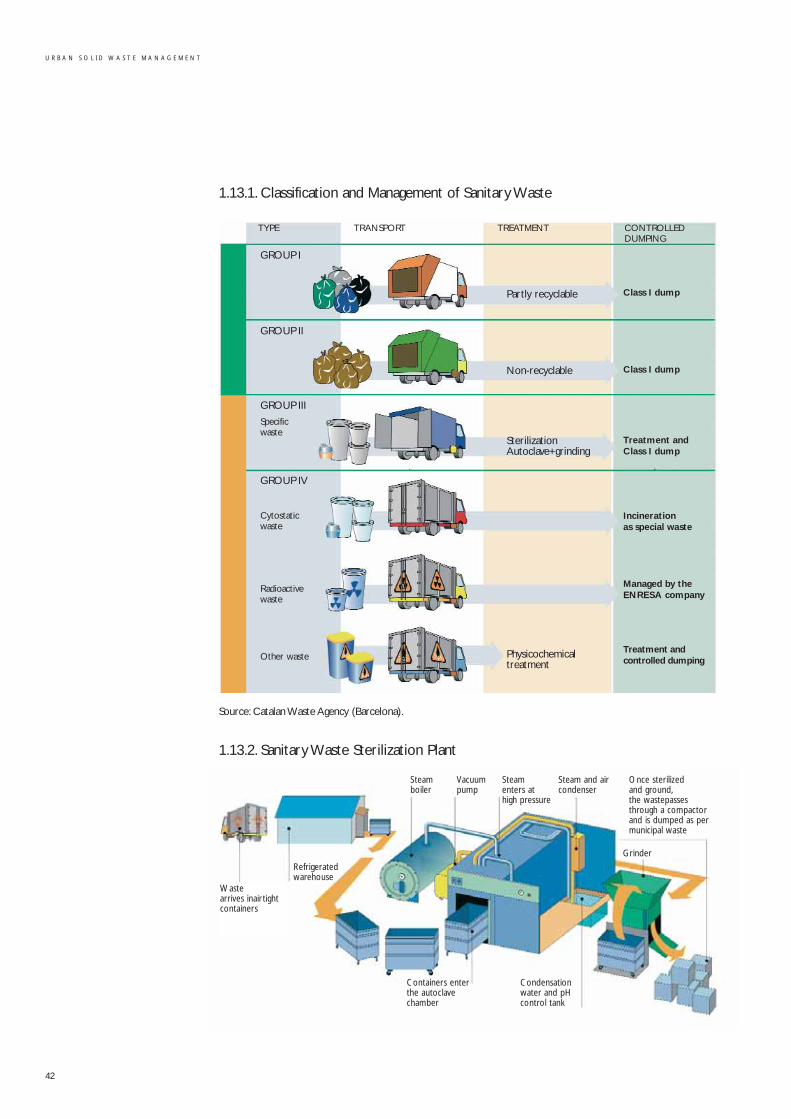
1.13.1. Classification and Management of Sanitary Waste
Source: Catalan Waste Agency (Barcelona).
1.13.2. Sanitary Waste Sterilization Plant
42
U R B A N S O L I D W A S T E M A N A G E M E N T
TYPE TRANSPORT TREATMENT CONTROLLEDDUMPING
GROUP I
GROUP II
GROUP III
Specificwaste
GROUP IV
Cytostatic waste
Radioactive waste
Other waste
Partly recyclable
Non-recyclable
SterilizationAutoclave+grinding
Physicochemicaltreatment
Class I dump
Class I dump
Treatment andClass I dump
Incineration as special waste
Managed by theENRESA company
Treatment andcontrolled dumping
Wastearrives inairtightcontainers
Refrigeratedwarehouse
Steamboiler
Vacuumpump
Steamenters athigh pressure
Steam and aircondenser
Containers enterthe autoclavechamber
Condensationwater and pHcontrol tank
Grinder
Once sterilizedand ground,the wastepassesthrough a compactorand is dumped as permunicipal waste
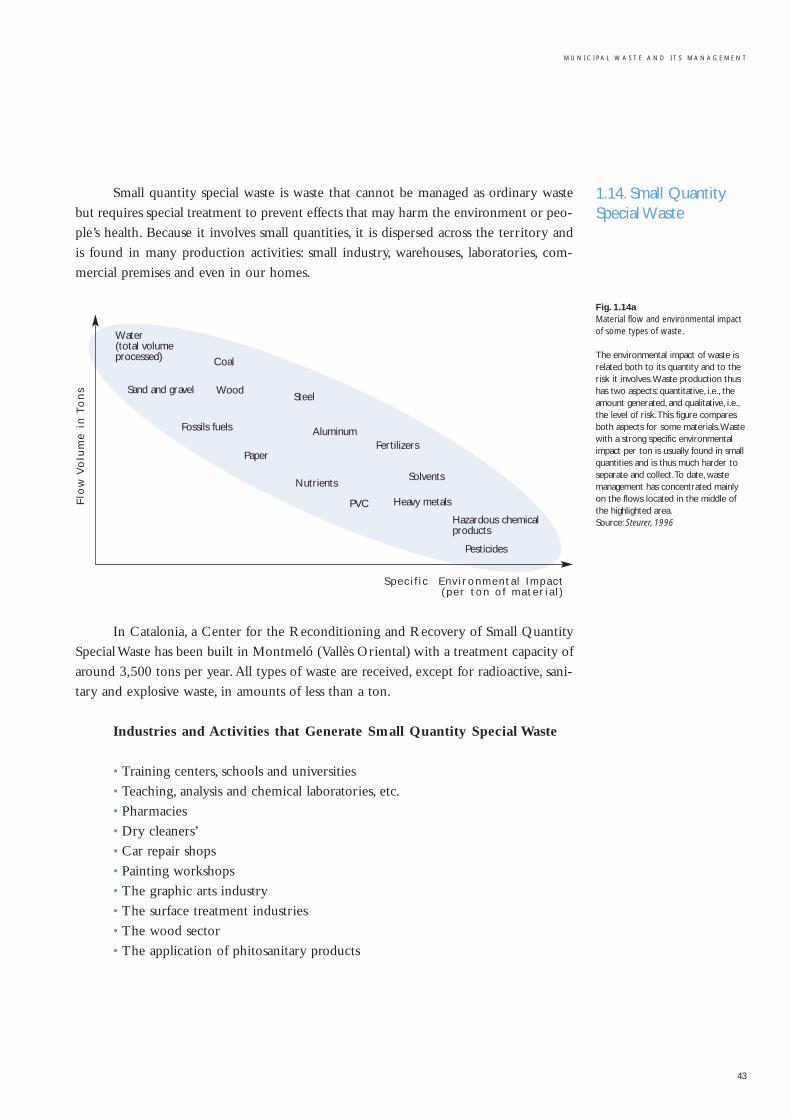
M U N I C I P A L W A S T E A N D I T S M A N A G E M E N T
43
Small quantity special waste is waste that cannot be managed as ordinary waste
but requires special treatment to prevent effects that may harm the environment or peo-
ple’s health. Because it involves small quantities, it is dispersed across the territory and
is found in many production activities: small industry, warehouses, laboratories, com-
mercial premises and even in our homes.
In Catalonia, a Center for the Reconditioning and Recovery of Small Quantity
Special Waste has been built in Montmeló (Vallès Oriental) with a treatment capacity of
around 3,500 tons per year. All types of waste are received, except for radioactive, sani-
tary and explosive waste, in amounts of less than a ton.
Industries and Activities that Generate Small Quantity Special Waste
• Training centers, schools and universities
• Teaching, analysis and chemical laboratories, etc.
• Pharmacies
• Dry cleaners’
• Car repair shops
• Painting workshops
• The graphic arts industry
• The surface treatment industries
• The wood sector
• The application of phitosanitary products
1.14. Small QuantitySpecial Waste
Fig. 1.14a Material flow and environmental impactof some types of waste.
The environmental impact of waste isrelated both to its quantity and to therisk it involves.Waste production thushas two aspects: quantitative, i.e., theamount generated, and qualitative, i.e.,the level of risk.This figure comparesboth aspects for some materials.Wastewith a strong specific environmentalimpact per ton is usually found in smallquantities and is thus much harder toseparate and collect.To date, wastemanagement has concentrated mainlyon the flows located in the middle ofthe highlighted area.Source: Steurer, 1996
Flo
w V
olu
me
in
To
ns
S p e c i f i c E n v i ro n m e n t a l I m p a c t( p e r t o n o f m a t e r i a l )
Water(total volumeprocessed) Coal
Fossils fuels
Sand and gravelSteel
Wood
Paper
Aluminum
NutrientsSolvents
Fertilizers
PVC Heavy metals
Pesticides
Hazardous chemicalproducts
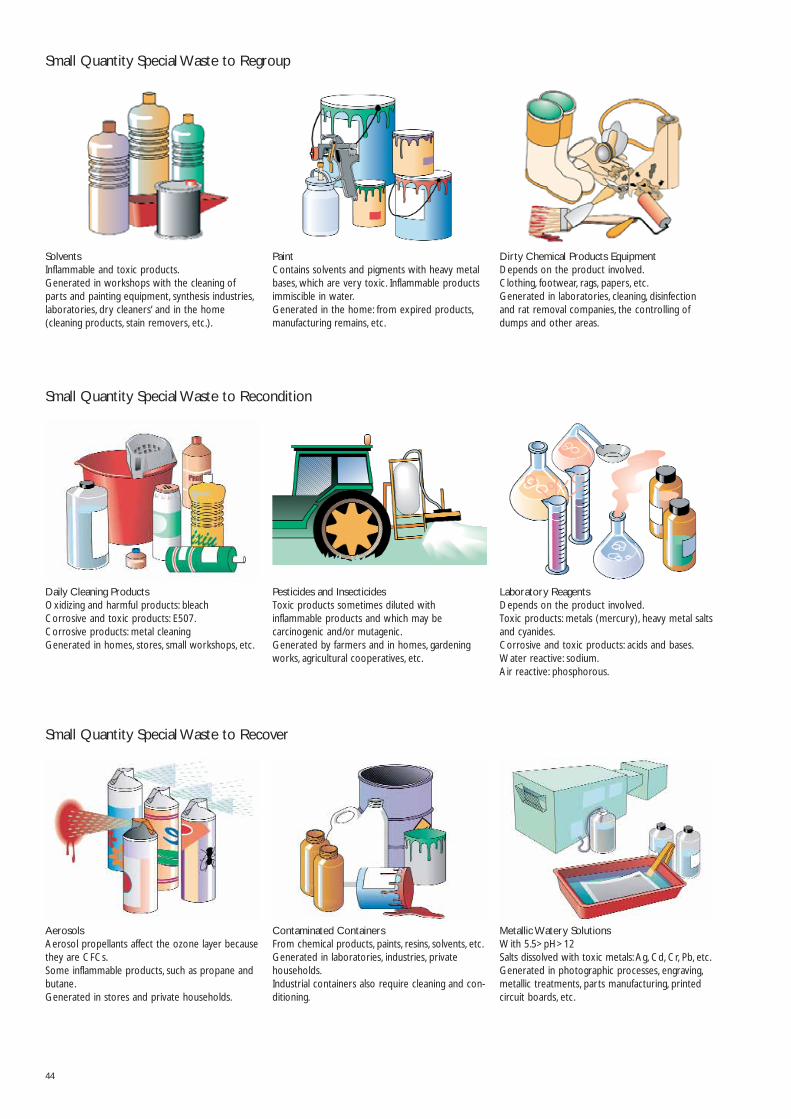
Small Quantity Special Waste to Regroup
44
Small Quantity Special Waste to Recondition
Small Quantity Special Waste to Recover
SolventsInflammable and toxic products.Generated in workshops with the cleaning ofparts and painting equipment, synthesis industries,laboratories, dry cleaners’ and in the home (cleaning products, stain removers, etc.).
PaintContains solvents and pigments with heavy metalbases, which are very toxic. Inflammable productsimmiscible in water.Generated in the home: from expired products,manufacturing remains, etc.
Dirty Chemical Products EquipmentDepends on the product involved.Clothing, footwear, rags, papers, etc.Generated in laboratories, cleaning, disinfectionand rat removal companies, the controlling ofdumps and other areas.
Daily Cleaning ProductsOxidizing and harmful products: bleachCorrosive and toxic products: E507.Corrosive products: metal cleaningGenerated in homes, stores, small workshops, etc.
Pesticides and InsecticidesToxic products sometimes diluted with inflammable products and which may be carcinogenic and/or mutagenic.Generated by farmers and in homes, gardeningworks, agricultural cooperatives, etc.
Laboratory ReagentsDepends on the product involved.Toxic products: metals (mercury), heavy metal saltsand cyanides.Corrosive and toxic products: acids and bases.Water reactive: sodium.Air reactive: phosphorous.
AerosolsAerosol propellants affect the ozone layer becausethey are CFCs.Some inflammable products, such as propane andbutane.Generated in stores and private households.
Contaminated ContainersFrom chemical products, paints, resins, solvents, etc.Generated in laboratories, industries, privatehouseholds.Industrial containers also require cleaning and con-ditioning.
Metallic Watery SolutionsWith 5.5>pH>12Salts dissolved with toxic metals: Ag, Cd, Cr, Pb, etc.Generated in photographic processes, engraving,metallic treatments, parts manufacturing, printedcircuit boards, etc.
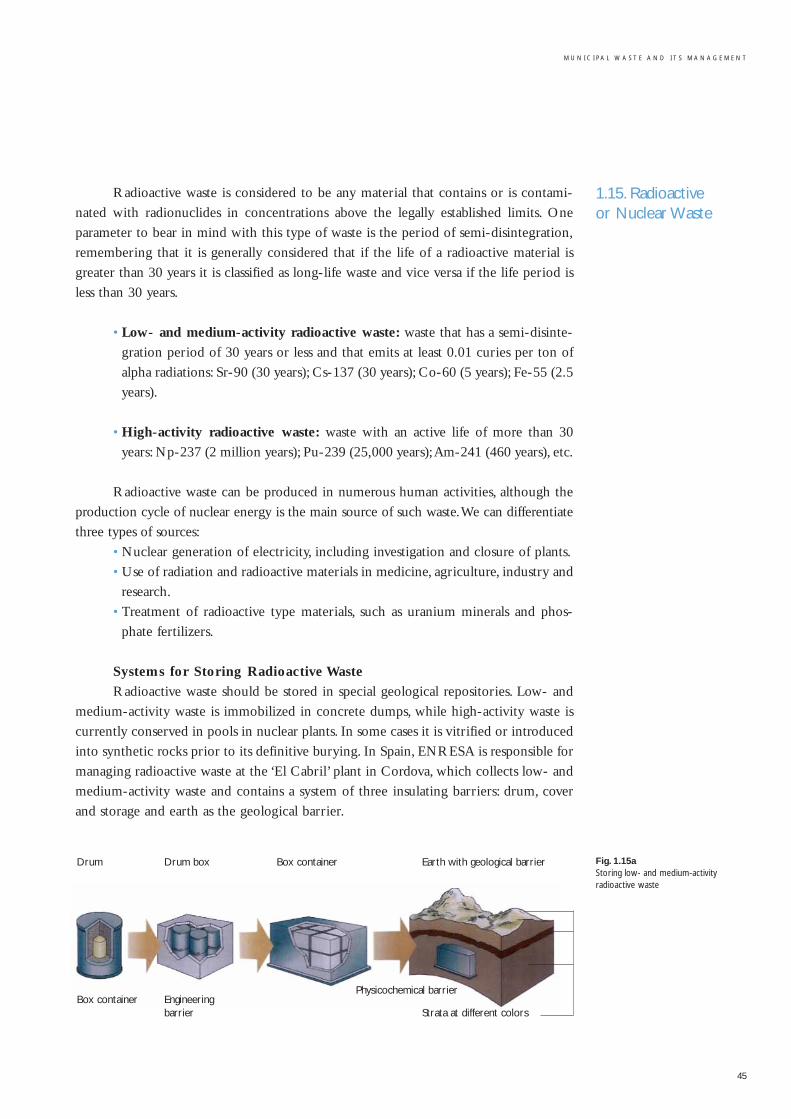
M U N I C I P A L W A S T E A N D I T S M A N A G E M E N T
45
Radioactive waste is considered to be any material that contains or is contami-
nated with radionuclides in concentrations above the legally established limits. One
parameter to bear in mind with this type of waste is the period of semi-disintegration,
remembering that it is generally considered that if the life of a radioactive material is
greater than 30 years it is classified as long-life waste and vice versa if the life period is
less than 30 years.
• Low- and medium-activity radioactive waste: waste that has a semi-disinte-
gration period of 30 years or less and that emits at least 0.01 curies per ton of
alpha radiations: Sr-90 (30 years); Cs-137 (30 years); Co-60 (5 years); Fe-55 (2.5
years).
• High-activity radioactive waste: waste with an active life of more than 30
years: Np-237 (2 million years); Pu-239 (25,000 years);Am-241 (460 years), etc.
Radioactive waste can be produced in numerous human activities, although the
production cycle of nuclear energy is the main source of such waste.We can differentiate
three types of sources:
• Nuclear generation of electricity, including investigation and closure of plants.
• Use of radiation and radioactive materials in medicine, agriculture, industry and
research.
• Treatment of radioactive type materials, such as uranium minerals and phos-
phate fertilizers.
Systems for Storing Radioactive Waste
Radioactive waste should be stored in special geological repositories. Low- and
medium-activity waste is immobilized in concrete dumps, while high-activity waste is
currently conserved in pools in nuclear plants. In some cases it is vitrified or introduced
into synthetic rocks prior to its definitive burying. In Spain, ENRESA is responsible for
managing radioactive waste at the ‘El Cabril’ plant in Cordova, which collects low- and
medium-activity waste and contains a system of three insulating barriers: drum, cover
and storage and earth as the geological barrier.
1.15. Radioactive or Nuclear Waste
Fig. 1.15aStoring low- and medium-activityradioactive waste
Drum Drum box Box container Earth with geological barrier
Box container Engineeringbarrier
Physicochemical barrier
Strata at different colors
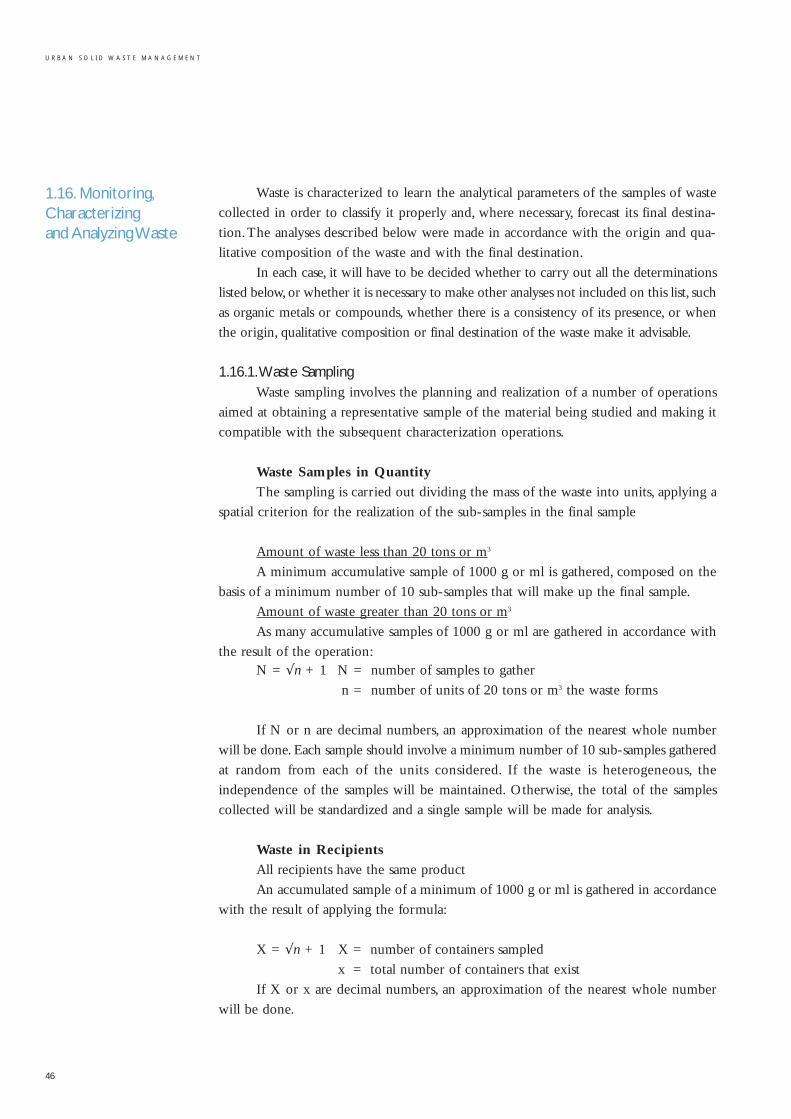
1.16. Monitoring,Characterizing and Analyzing Waste
Waste is characterized to learn the analytical parameters of the samples of waste
collected in order to classify it properly and, where necessary, forecast its final destina-
tion.The analyses described below were made in accordance with the origin and qua-
litative composition of the waste and with the final destination.
In each case, it will have to be decided whether to carry out all the determinations
listed below, or whether it is necessary to make other analyses not included on this list, such
as organic metals or compounds, whether there is a consistency of its presence, or when
the origin, qualitative composition or final destination of the waste make it advisable.
1.16.1.Waste SamplingWaste sampling involves the planning and realization of a number of operations
aimed at obtaining a representative sample of the material being studied and making it
compatible with the subsequent characterization operations.
Waste Samples in Quantity
The sampling is carried out dividing the mass of the waste into units, applying a
spatial criterion for the realization of the sub-samples in the final sample
Amount of waste less than 20 tons or m3
A minimum accumulative sample of 1000 g or ml is gathered, composed on the
basis of a minimum number of 10 sub-samples that will make up the final sample.
Amount of waste greater than 20 tons or m3
As many accumulative samples of 1000 g or ml are gathered in accordance with
the result of the operation:N = √n + 1 N = number of samples to gather
n = number of units of 20 tons or m3 the waste forms
If N or n are decimal numbers, an approximation of the nearest whole number
will be done. Each sample should involve a minimum number of 10 sub-samples gathered
at random from each of the units considered. If the waste is heterogeneous, the
independence of the samples will be maintained. Otherwise, the total of the samples
collected will be standardized and a single sample will be made for analysis.
Waste in Recipients
All recipients have the same product
An accumulated sample of a minimum of 1000 g or ml is gathered in accordance
with the result of applying the formula:
X = √n + 1 X = number of containers sampled
x = total number of containers that exist
If X or x are decimal numbers, an approximation of the nearest whole number
will be done.
46
U R B A N S O L I D W A S T E M A N A G E M E N T
M U N I C I P A L W A S T E A N D I T S M A N A G E M E N T
47
If the volume of waste contained in recipients exceeds 20 tons or m3, the same
procedure as described in the case of large-volume waste shall be applied.
Not all the recipients have the same product
It will be necessary to collect samples from all the containers, maintaining the
independence of each sample.
Obtaining Sub-Samples
If a number N of samples has to be collected, the total mass of the waste will be divi-
ded into n units,which shall be identical in size and/or volume, and collection will be from each
of the corresponding samples, as described for the amount of waste greater than 20 tons or m3.
This sample will be composed on the basis of a minimum of 10 sub-samples col-
lected at random from the whole of the volume of each unit considered. If the waste is
generated in a constant flow, the sub-sample will be preferably made with a time crite-
rion, instead of doing it on the waste dumped in a pile or container.
Sample Materials
For sampling waste with content in organic products, stainless steel, glass or
Teflon utensils will be used and the recipients will always be of glass. For sampling waste
of an inorganic nature, plastic, glass or Teflon utensils will be used and the recipients will
be of glass or plastic.When in doubt about the nature of the waste, stainless steel, glass
or Teflon utensils will be used, along with glass recipients.
Sampling Procedure
This will be influenced by the geometry of the waste or the recipients containing
it and limited by the possibilities of accessing the chosen sampling points. In general
terms, these can be classified as:
Piles: The sampling will be done with cannulas that penetrate the external sur-
face perpendicularly, preferably to the symmetry axis of the pile.The surface layer will
not be used.
Ponds: The sampling will be done preferably with cannulas that collect continuous
proof of the whole thickness of the waste.The surface layer will not be used.
Drums: If possible, continuous proof of the whole height of the drum will be
gathered.
Waste Flow: The whole of the width of the waste vein should be collected in
each sub-sample. In the event of doing analyzing a fraction of the latter, it is important
to make sure that the utensil used can comfortably collect the largest waste particles.
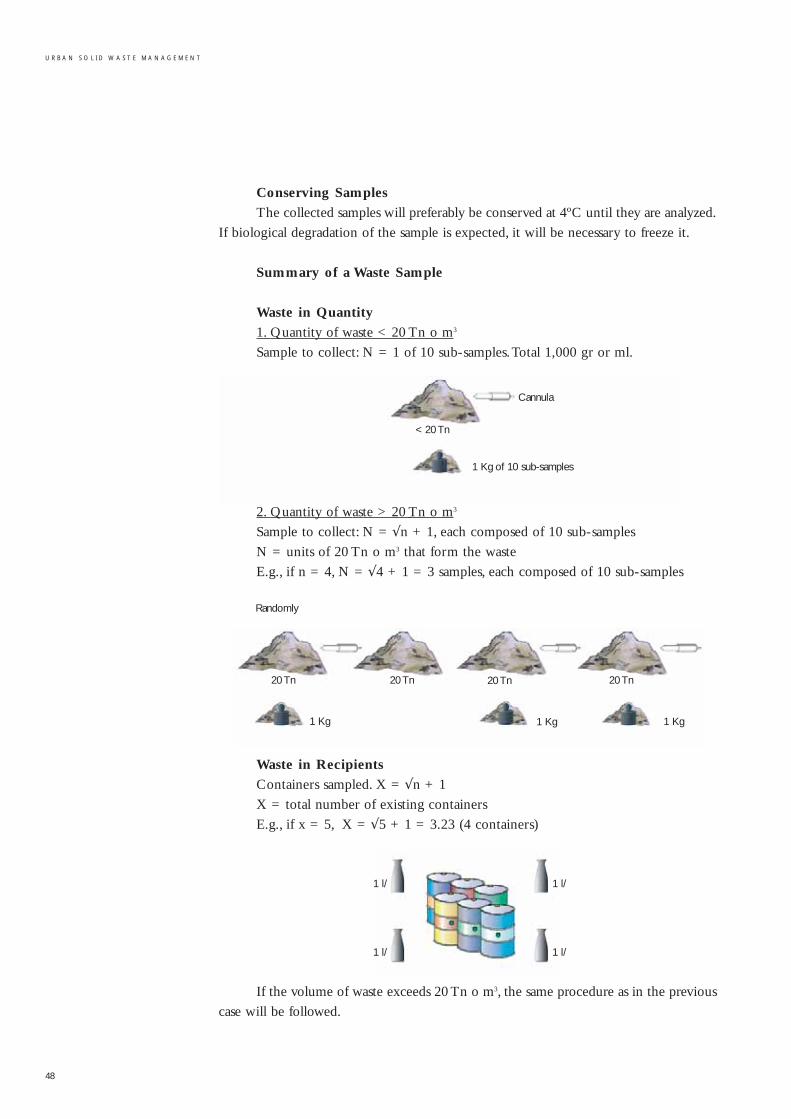
48
U R B A N S O L I D W A S T E M A N A G E M E N T
Conserving Samples
The collected samples will preferably be conserved at 4ºC until they are analyzed.
If biological degradation of the sample is expected, it will be necessary to freeze it.
Summary of a Waste Sample
Waste in Quantity
1. Quantity of waste < 20 Tn o m3
Sample to collect: N = 1 of 10 sub-samples.Total 1,000 gr or ml.
2. Quantity of waste > 20 Tn o m3
Sample to collect: N = √n + 1, each composed of 10 sub-samples
N = units of 20 Tn o m3 that form the waste
E.g., if n = 4, N = √4 + 1 = 3 samples, each composed of 10 sub-samples
Waste in Recipients
Containers sampled. X = √n + 1
X = total number of existing containers
E.g., if x = 5, X = √5 + 1 = 3.23 (4 containers)
If the volume of waste exceeds 20 Tn o m3, the same procedure as in the previous
case will be followed.
Cannula
< 20 Tn
1 Kg of 10 sub-samples
1 Kg 1 Kg 1 Kg
20 Tn 20 Tn 20 Tn 20 Tn
Randomly
1 l/
1 l/
1 l/
1 l/
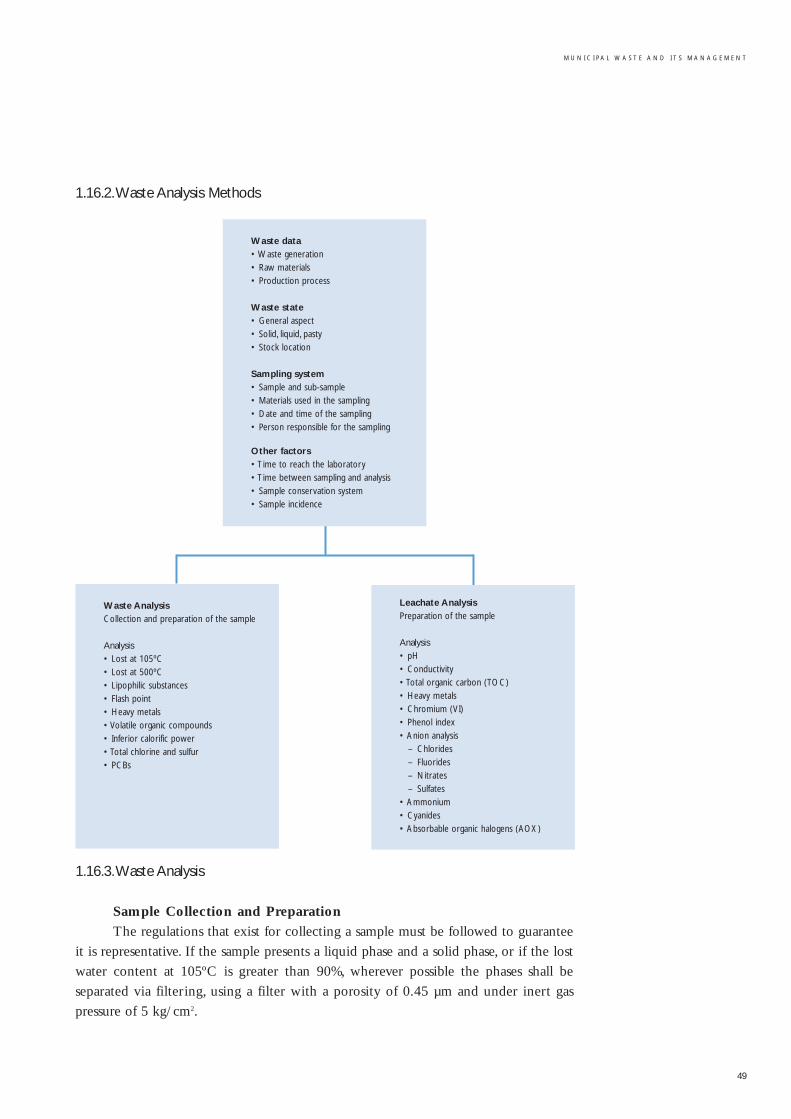
M U N I C I P A L W A S T E A N D I T S M A N A G E M E N T
49
1.16.2.Waste Analysis Methods
1.16.3.Waste Analysis
Sample Collection and Preparation
The regulations that exist for collecting a sample must be followed to guarantee
it is representative. If the sample presents a liquid phase and a solid phase, or if the lost
water content at 105ºC is greater than 90%, wherever possible the phases shall be
separated via filtering, using a filter with a porosity of 0.45 µm and under inert gas
pressure of 5 kg/cm2.
Waste data• Waste generation• Raw materials• Production process
Waste state• General aspect• Solid, liquid, pasty• Stock location
Sampling system• Sample and sub-sample• Materials used in the sampling• Date and time of the sampling• Person responsible for the sampling
Other factors• Time to reach the laboratory• Time between sampling and analysis• Sample conservation system• Sample incidence
Leachate AnalysisPreparation of the sample
Analysis• pH• Conductivity• Total organic carbon (TOC)• Heavy metals• Chromium (VI)• Phenol index• Anion analysis
– Chlorides– Fluorides– Nitrates– Sulfates
• Ammonium• Cyanides• Absorbable organic halogens (AOX)
Waste AnalysisCollection and preparation of the sample
Analysis• Lost at 105ºC• Lost at 500ºC• Lipophilic substances• Flash point• Heavy metals• Volatile organic compounds• Inferior calorific power• Total chlorine and sulfur• PCBs
If it is not possible to achieve the separation of phases as described, a previous
separation will be done by decantation and the liquid phase will then be filtered using
the same filtering system as indicated. The solid that results from this filtering will be
added to the solid obtained by decantation.
The massic proportions of each phase will be calculated and noted on the results
report, setting out the method followed in the separation of phases, and each phase will
be analyzed separately.
The leaching test will be done on the solid phase of the sample and all the ana-
lytical determinations described. The same analytical determinations will be done on
the liquid phase of the sample as were done on the leachate obtained from the solid
phase.
Lost at 105ºC
Desiccation at 105ºC and weighted until it is a constant weight.
Lost at 500ºC
Calcination at 500ºC and weighted until it is a constant weight.
Lipophilic Substances
Extraction with pentane, using a Soxhlet device; the solvent is later evaporated
from the extract and the waste obtained is weighed.
Flash Point:
Temperature at which vapor from the sample spontaneously alights in the
presence of a flame, in line with the Tag Closed Cup method adapted to solids (Method
ASTM D56/87)
Heavy Metals:
By atomic absorption and/or atomic emission by inductively coupled plasma
(ICP-AES) or plasma masses (ICP-EM), following digestion of the original sample with
irrigation water.
Volatile Organic Compounds:
Firstly a qualitative analysis is made using the head-space technique and gas chro-
matography with mass spectrometry (HS-GC-EM). Depending on the compounds
found, the most appropriate chromatographic technique for quantifying them is cho-
sen. (Methods EPA, SW-846,Vol. 1., Section B).
Inferior Calorific Power (ICP):
Determined using a Mahler-type calorimetric bomb
50
U R B A N S O L I D W A S T E M A N A G E M E N T
M U N I C I P A L W A S T E A N D I T S M A N A G E M E N T
51
Total Chlorine and Sulfur:
The analysis is done by ionic chromatography, after combustion of the sample
using a calorimetric bomb. (Method EPA 5050 SW-846).
PCBs:
The analysis is done by gas chromatography with capillary columns and an elec-
tron capture detector (ECD).
1.16.4. Leachate Analysis
Sample Preparation: Leaching Test:
The original structure of the sample used must be maintained as far as possible:
large particles (over 1cm) must be ground and homogenized.
Method DIN 38414-S4, with these clarifications:
Leaching with reagent water (resistivity of 18M Ohms at 25ºC, maximum TOC
level of 20 ug/l and free of particles and microorganisms). Use bottles of 8-10 cm in
neck diameter, which shall be kept closed during agitation.
Rotary agitation system and rotation speed of 2 turns per minute, over 24 hours.
Initial pH and conductivity levels are measured 15 minutes after agitation.After the leach-
ing trial, it is filtered using 0.45 um filters under a pressure of 5 kg/cm2 of inert gas.
Final pH and conductivity levels are measured after filtering.
pH:
By electrometry with the pH meter.
Conductivity:
By electrometry with the conductimeter.
Total Organic Carbon (TOC):
Determined by waste combustion at 900ºC measuring the CO2 content
obtained. (Method DIN 38409-H3-85; EPA 9060, SW-846).
Heavy Metals:
By atomic absorption and/or atomic emission by inductively coupled plasma
(ICP-AES) or plasma masses (ICP-EM), following digestion of the leachate if necessary.
Chromium (VI):
By absorption spectrophotometry, diphenylcarbazide method (Method DIN
38405-D24).
Phenol Index:
By absorption spectrophotometry,4-aminoantipyrine spectrometric method. (Method
standard ISO 6439-1990).
Anion Analysis:
Chlorides: Analysis by ionic chromatography.
Fluorides: Analysis by ionic chromatography or with a specific electrode.
(Standard Methods Edition 17, 1989, Method 4500F-C).
Nitrates: Analysis by ionic chromatography or by absorption spectrophotometry
(Method ISO 677-1983).
Sulfates: Analysis by ionic chromatography.
Ammonium:
By specific electrode. (Standard Methods Edition 17, 1989, Method 4500 NH3-F)
and/or absorption spectrophotometry (Method ISO 7150/1-1984).
Cyanides:
Absorption spectrophotometry after distillation (Standard Methods Edition 17,
1989, Method ISO 4500 CN-E).
Absorbable Halogenated Organic(AOX) Compounds:
By gas chromatography after concentration by purge and trap. (Method DIN
38409-H14-85; ISO DIS 9562).
1.16.5. EcotoxicityTo know the ecotoxicity of the leachates of a waste, a standard leaching test is
done along with some of the approved biotrials.
Daphnia Magna Test:
The beginning of the determination is based on the inhibition of the mobility of
the Daphnia Magna Strauss, a microcrustacean that is exposed to particular conditions.
In accordance with this trial, it is considered that waste is toxic if the leachate has an
average lethal concentration (C L50, i.e., 50% of the Daphnia Magna population is
immobilized) less than or equal to 750 mg/liter.
Microtox or Bioluminescence of the Photobacterium Phosphoreum Test:
Based on measuring the reduction of light emission from the microorganism
Photobacterium Phosphoreum in contact with toxins. The parameter measured is the
concentration in the leachate sample of the waste that, in contact with the bacteria,
reduces light emission to 50% (EC50), which corresponds to an inhibition of the respi-
ratory metabolism of 50%.
52
U R B A N S O L I D W A S T E M A N A G E M E N T
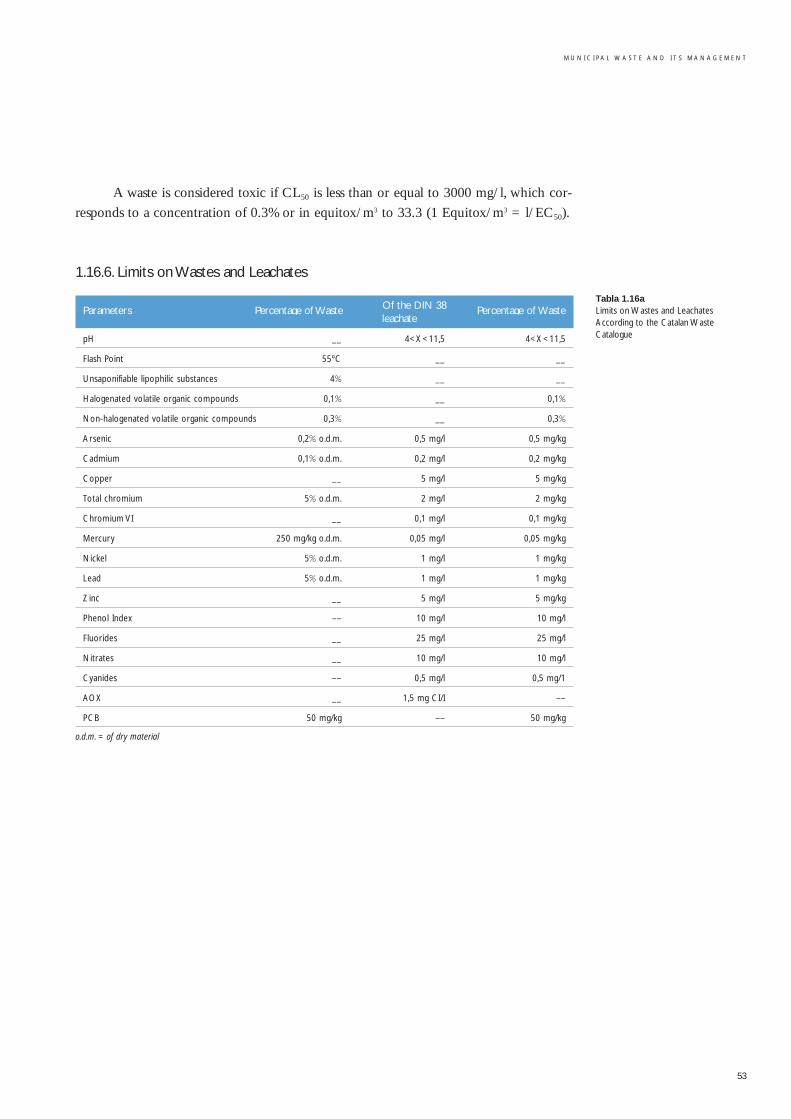
M U N I C I P A L W A S T E A N D I T S M A N A G E M E N T
53
Tabla 1.16aLimits on Wastes and LeachatesAccording to the Catalan WasteCatalogue
A waste is considered toxic if CL50 is less than or equal to 3000 mg/l, which cor-
responds to a concentration of 0.3% or in equitox/m3 to 33.3 (1 Equitox/m3 = l/EC50).
1.16.6. Limits on Wastes and Leachates
Parameters Percentage of Waste Of the DIN 38 Percentage of Waste leachate414-24
pH __ 4<X<11,5 4<X<11,5
Flash Point 55ºC __ __
Unsaponifiable lipophilic substances 4% __ __
Halogenated volatile organic compounds 0,1% __ 0,1%
Non-halogenated volatile organic compounds 0,3% __ 0,3%
Arsenic 0,2% o.d.m. 0,5 mg/l 0,5 mg/kg
Cadmium 0,1% o.d.m. 0,2 mg/l 0,2 mg/kg
Copper __ 5 mg/l 5 mg/kg
Total chromium 5% o.d.m. 2 mg/l 2 mg/kg
Chromium VI __ 0,1 mg/l 0,1 mg/kg
Mercury 250 mg/kg o.d.m. 0,05 mg/l 0,05 mg/kg
Nickel 5% o.d.m. 1 mg/l 1 mg/kg
Lead 5% o.d.m. 1 mg/l 1 mg/kg
Zinc __ 5 mg/l 5 mg/kg
Phenol Index –– 10 mg/l 10 mg/l
Fluorides __ 25 mg/l 25 mg/l
Nitrates __ 10 mg/l 10 mg/l
Cyanides –– 0,5 mg/l 0,5 mg/1
AOX __ 1,5 mg CI/I ––
PCB 50 mg/kg –– 50 mg/kg
o.d.m. = of dry material
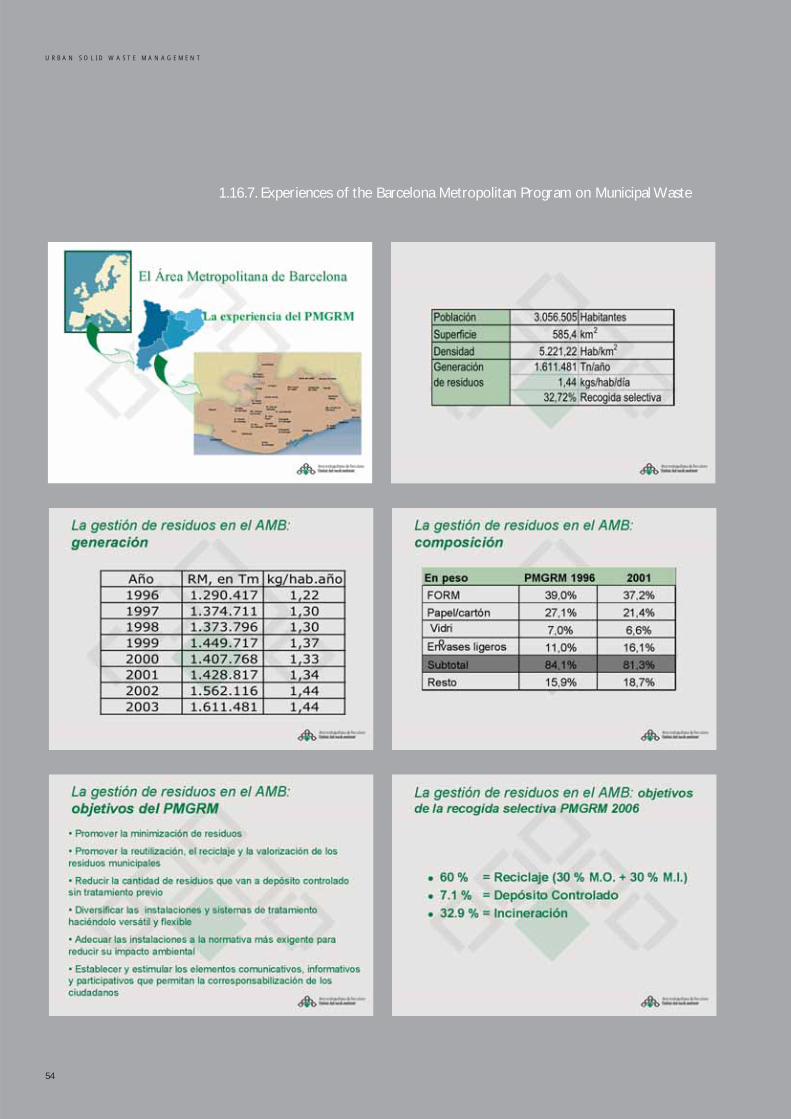
1.16.7. Experiences of the Barcelona Metropolitan Program on Municipal Waste
54
U R B A N S O L I D W A S T E M A N A G E M E N T
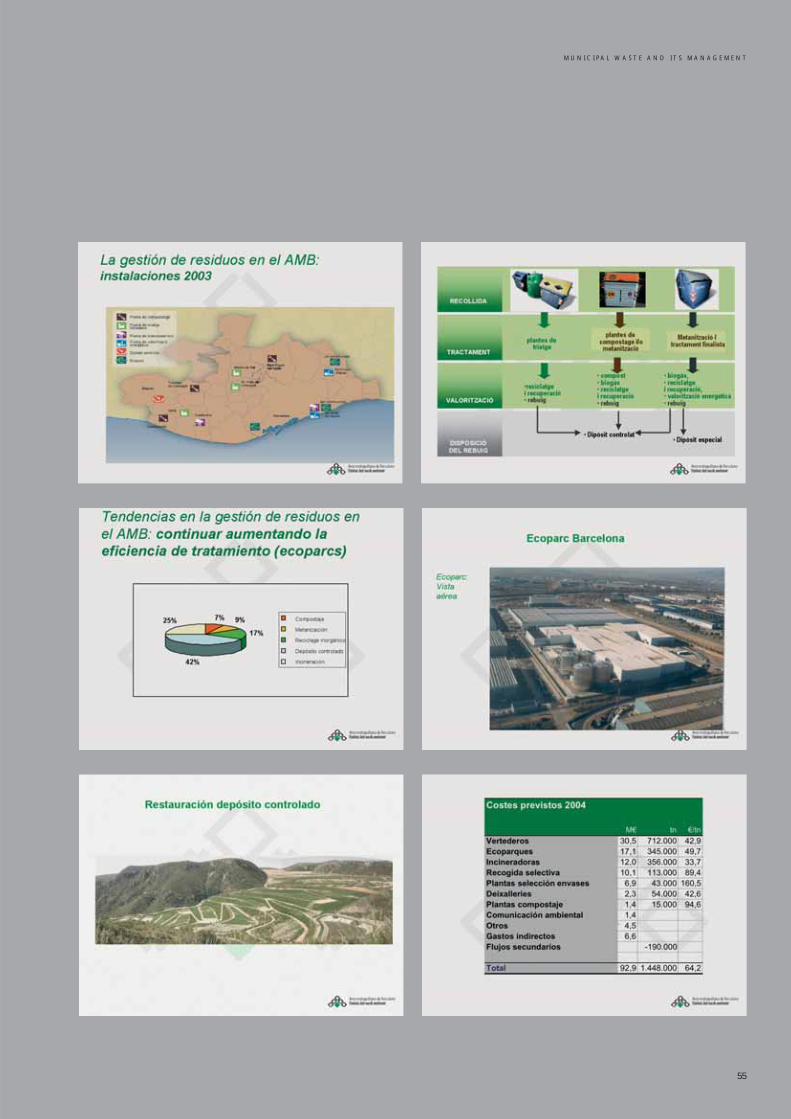
M U N I C I P A L W A S T E A N D I T S M A N A G E M E N T
55
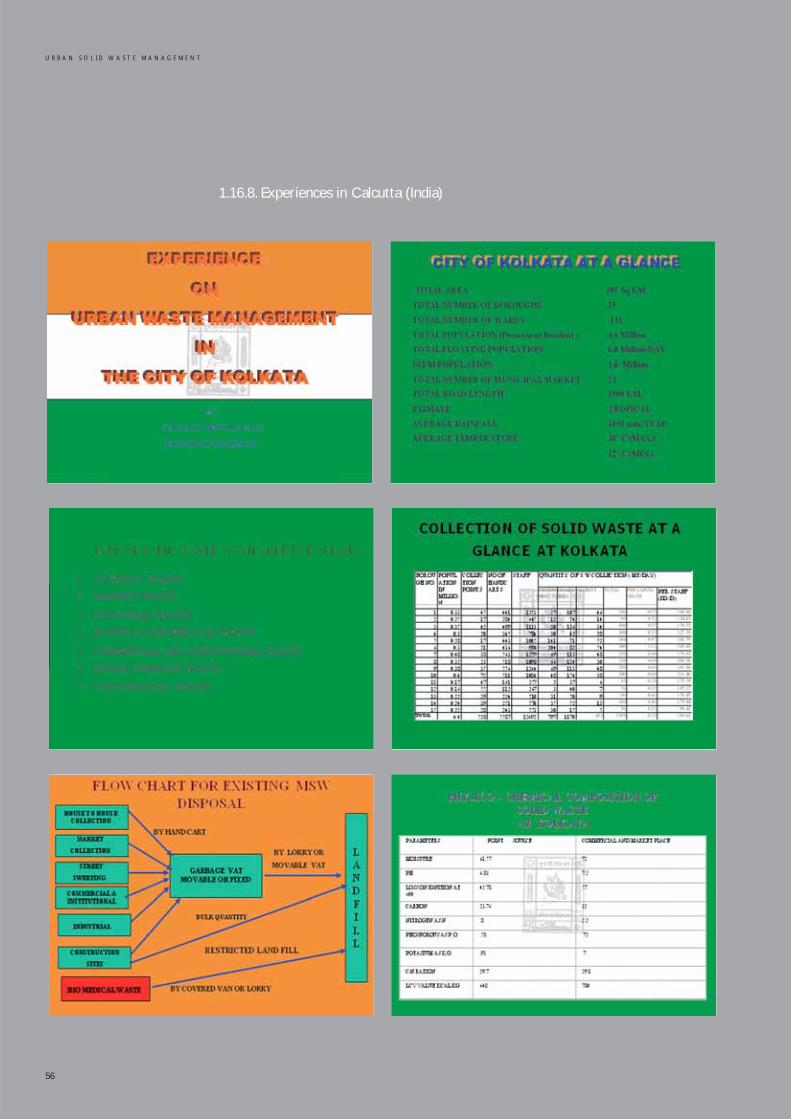
56
U R B A N S O L I D W A S T E M A N A G E M E N T
1.16.8. Experiences in Calcutta (India)
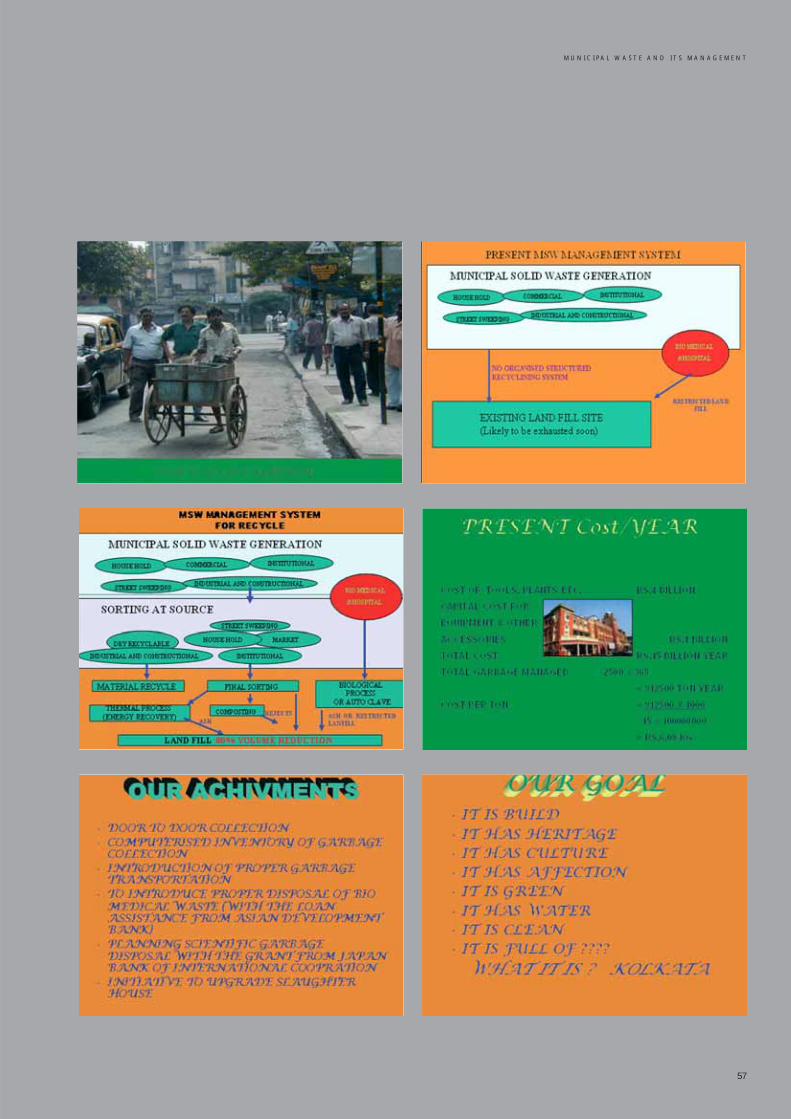
M U N I C I P A L W A S T E A N D I T S M A N A G E M E N T
57

58
URBAN SOLID WASTE MANAGEMENT
2.Waste Recycling,Composting and Methanization
60
2. Waste Recycling, Composting and Methanization . . . . . . . . . . . . . . . . . . . . . . . . . . . . . . . . . . . . . . . . . . . . . . . . . . . . . . . . . . . . . . . . . . . . . . . 61
2.1. Waste Recovery . . . . . . . . . . . . . . . . . . . . . . . . . . . . . . . . . . . . . . . . . . . . . . . . . . . . . . . . . . . . . . . . . . . . . . . . . . . . . . . . . . . . . . . . . . . . . . . . . . . . . . . . . . . . . . . . . . . . 61
2.2. The Informal Sector in the Recovery of Materials (Scavengers) . . . . . . . . . . . . . . . . . . . . . . . . . . . . . . . . . . . . . . . . . . . . . . . . . . . . . 61
2.3. Recycling Paper and Cardboard . . . . . . . . . . . . . . . . . . . . . . . . . . . . . . . . . . . . . . . . . . . . . . . . . . . . . . . . . . . . . . . . . . . . . . . . . . . . . . . . . . . . . . . . . . . . . . . 62
2.4. Recycling Glass . . . . . . . . . . . . . . . . . . . . . . . . . . . . . . . . . . . . . . . . . . . . . . . . . . . . . . . . . . . . . . . . . . . . . . . . . . . . . . . . . . . . . . . . . . . . . . . . . . . . . . . . . . . . . . . . . . . . 62
2.5. Packaging and Bottling . . . . . . . . . . . . . . . . . . . . . . . . . . . . . . . . . . . . . . . . . . . . . . . . . . . . . . . . . . . . . . . . . . . . . . . . . . . . . . . . . . . . . . . . . . . . . . . . . . . . . . . . . . . 63
– Savings from Recycling . . . . . . . . . . . . . . . . . . . . . . . . . . . . . . . . . . . . . . . . . . . . . . . . . . . . . . . . . . . . . . . . . . . . . . . . . . . . . . . . . . . . . . . . . . . . . . . . . . . . . . . 65
2.6. Metals and Scrap Metal . . . . . . . . . . . . . . . . . . . . . . . . . . . . . . . . . . . . . . . . . . . . . . . . . . . . . . . . . . . . . . . . . . . . . . . . . . . . . . . . . . . . . . . . . . . . . . . . . . . . . . . . . . 66
2.7. Plastics and Tires . . . . . . . . . . . . . . . . . . . . . . . . . . . . . . . . . . . . . . . . . . . . . . . . . . . . . . . . . . . . . . . . . . . . . . . . . . . . . . . . . . . . . . . . . . . . . . . . . . . . . . . . . . . . . . . . . . . 66
2.8. Oils and Lubricants. . . . . . . . . . . . . . . . . . . . . . . . . . . . . . . . . . . . . . . . . . . . . . . . . . . . . . . . . . . . . . . . . . . . . . . . . . . . . . . . . . . . . . . . . . . . . . . . . . . . . . . . . . . . . . . . 69
2.9. Household and Electronic Equipment . . . . . . . . . . . . . . . . . . . . . . . . . . . . . . . . . . . . . . . . . . . . . . . . . . . . . . . . . . . . . . . . . . . . . . . . . . . . . . . . . . . . . . . 70
2.10. Vehicle Scrapping . . . . . . . . . . . . . . . . . . . . . . . . . . . . . . . . . . . . . . . . . . . . . . . . . . . . . . . . . . . . . . . . . . . . . . . . . . . . . . . . . . . . . . . . . . . . . . . . . . . . . . . . . . . . . . . . . . 71
2.11. Drugs and Laboratory Products . . . . . . . . . . . . . . . . . . . . . . . . . . . . . . . . . . . . . . . . . . . . . . . . . . . . . . . . . . . . . . . . . . . . . . . . . . . . . . . . . . . . . . . . . . . . . . . . 72
2.12. Composting Based on Waste and Sludge . . . . . . . . . . . . . . . . . . . . . . . . . . . . . . . . . . . . . . . . . . . . . . . . . . . . . . . . . . . . . . . . . . . . . . . . . . . . . . . . . . . . 72
2.13. Home Composters. . . . . . . . . . . . . . . . . . . . . . . . . . . . . . . . . . . . . . . . . . . . . . . . . . . . . . . . . . . . . . . . . . . . . . . . . . . . . . . . . . . . . . . . . . . . . . . . . . . . . . . . . . . . . . . . . 74
2.14. Methanization and Biogas . . . . . . . . . . . . . . . . . . . . . . . . . . . . . . . . . . . . . . . . . . . . . . . . . . . . . . . . . . . . . . . . . . . . . . . . . . . . . . . . . . . . . . . . . . . . . . . . . . . . . . . 74
2.15. Ecoparks . . . . . . . . . . . . . . . . . . . . . . . . . . . . . . . . . . . . . . . . . . . . . . . . . . . . . . . . . . . . . . . . . . . . . . . . . . . . . . . . . . . . . . . . . . . . . . . . . . . . . . . . . . . . . . . . . . . . . . . . . . . . . . 75
2.16. Cost Study . . . . . . . . . . . . . . . . . . . . . . . . . . . . . . . . . . . . . . . . . . . . . . . . . . . . . . . . . . . . . . . . . . . . . . . . . . . . . . . . . . . . . . . . . . . . . . . . . . . . . . . . . . . . . . . . . . . . . . . . . . . 75
2.16.1. Generation Costs . . . . . . . . . . . . . . . . . . . . . . . . . . . . . . . . . . . . . . . . . . . . . . . . . . . . . . . . . . . . . . . . . . . . . . . . . . . . . . . . . . . . . . . . . . . . . . . . . . . . . . . . . 75
2.16.2. Collection and Transport Costs . . . . . . . . . . . . . . . . . . . . . . . . . . . . . . . . . . . . . . . . . . . . . . . . . . . . . . . . . . . . . . . . . . . . . . . . . . . . . . . . . . . . . . 76
2.16.3.Treatment Costs. . . . . . . . . . . . . . . . . . . . . . . . . . . . . . . . . . . . . . . . . . . . . . . . . . . . . . . . . . . . . . . . . . . . . . . . . . . . . . . . . . . . . . . . . . . . . . . . . . . . . . . . . . . 76
2.16.4. Management and Control Costs . . . . . . . . . . . . . . . . . . . . . . . . . . . . . . . . . . . . . . . . . . . . . . . . . . . . . . . . . . . . . . . . . . . . . . . . . . . . . . . . . . . . . 76
2.17. Experience in Buenos Aires (Argentina) . . . . . . . . . . . . . . . . . . . . . . . . . . . . . . . . . . . . . . . . . . . . . . . . . . . . . . . . . . . . . . . . . . . . . . . . . . . . . . . . . . . . 78
2.18. Experience in Cuenca (Ecuador) . . . . . . . . . . . . . . . . . . . . . . . . . . . . . . . . . . . . . . . . . . . . . . . . . . . . . . . . . . . . . . . . . . . . . . . . . . . . . . . . . . . . . . . . . . . . . . 80
INDEX
61
The term ‘recovery’ is used to designate management processes where the end aim
is to obtain a resource from waste, either through the extraction of materials, the replace-
ment of its original characteristics or by making the most of its calorific power, etc.
Within the general concept of recovery, there are different synonyms according
to the type of use to be made of the waste or the type of return to its processing cycle:
• Reutilization: When waste is used again in its original form for the same or for
a different use. For example: reusing packages, tires, solvents, etc.
• Recuperation: Extracting a resource from waste. For example: recuperation of
building materials, metal from batteries, electrical cables, from agriculture, to be
used as a charge in industrial processes, etc.
• Regeneration: When waste is partially or fully returned to its original qualities
so that it can be used in the same state before becoming waste. For example:
regeneration of mineral oils, solvents, acids, etc.
• Recycling: When waste is used in the manufacturing process of the same
product or a product with a similar function. For example: recycling of paper
and cardboard, plastic, textiles, glass, etc.
The work of scavengers, as people who work informally on rubbish tips are
known in different countries, undeniably provide society and its cities with a service of
great environmental importance. It may be that for them, the environmental question is
of secondary or no importance, but is a simple question of survival.
The activities developed in the so-called informal sector do not respect laws or work
regulations, or physical or social rights of workers. Although the service is not illegal, its
execution and commercialization are illegal as it does not meet labor laws. It is not a crime
to work on tips, but it is a crime to work outside of the legislative protection for workers.
The search for solutions to integrate the informal sector in MW management is
growing and experience has shown that this activity can be carried out in a more pro-
fessional and standardized manner.
Informal work should be incorporated into waste management:
• Because of the technical incompatibility of operations that feature subhuman
work conditions for scavengers.
• For safety reasons, because their presence in modern sanitary landfills should be avoided.
• Municipal authorities should seek ways of incorporating scavengers into the
process where by they can continue with their work after having been trained
in the use of modern technologies.
• Implementing selection collection to recover sub-products.
2.1.Waste Recovery
2.2.The InformalSector in the Recoveryof Materials(Scavengers)
2. WASTE RECYCLING, COMPOSTING AND METHANIZATION
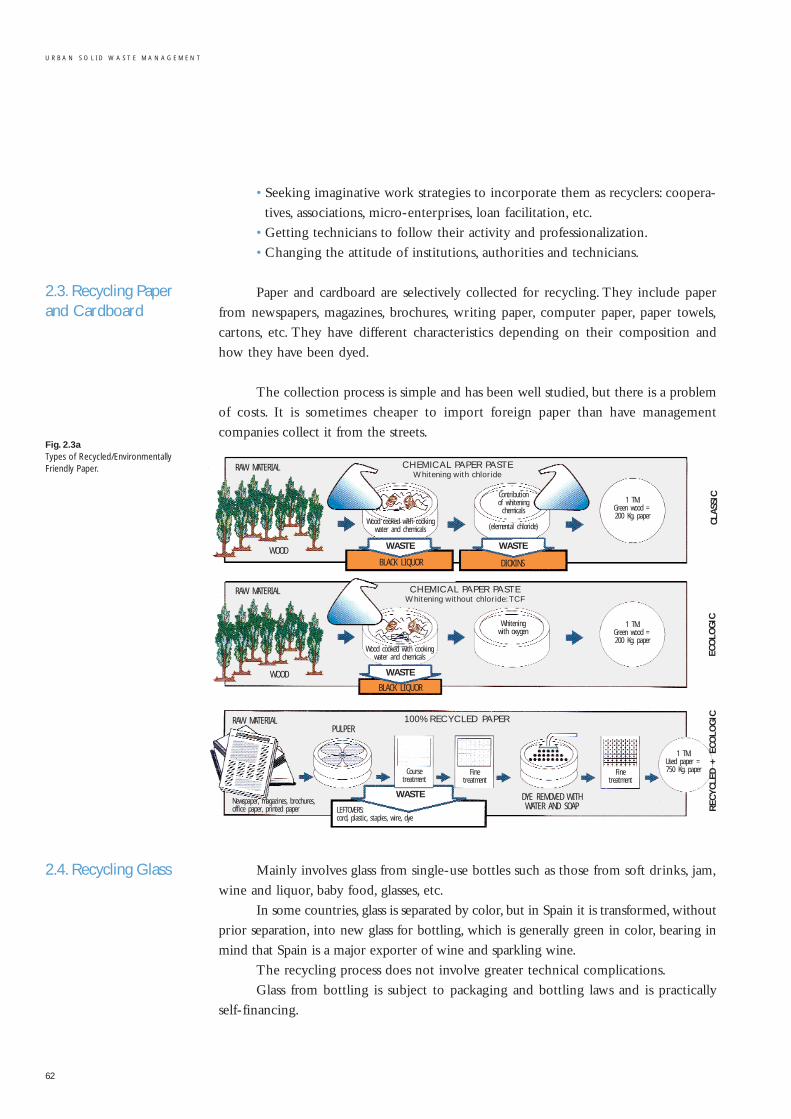
2.3. Recycling Paperand Cardboard
Fig. 2.3aTypes of Recycled/EnvironmentallyFriendly Paper.
2.4. Recycling Glass
• Seeking imaginative work strategies to incorporate them as recyclers: coopera-
tives, associations, micro-enterprises, loan facilitation, etc.
• Getting technicians to follow their activity and professionalization.
• Changing the attitude of institutions, authorities and technicians.
Paper and cardboard are selectively collected for recycling. They include paper
from newspapers, magazines, brochures, writing paper, computer paper, paper towels,
cartons, etc. They have different characteristics depending on their composition and
how they have been dyed.
The collection process is simple and has been well studied, but there is a problem
of costs. It is sometimes cheaper to import foreign paper than have management
companies collect it from the streets.
Mainly involves glass from single-use bottles such as those from soft drinks, jam,
wine and liquor, baby food, glasses, etc.
In some countries, glass is separated by color, but in Spain it is transformed, without
prior separation, into new glass for bottling, which is generally green in color, bearing in
mind that Spain is a major exporter of wine and sparkling wine.
The recycling process does not involve greater technical complications.
Glass from bottling is subject to packaging and bottling laws and is practically
self-financing.
62
U R B A N S O L I D W A S T E M A N A G E M E N T
CHEMICAL PAPER PASTEWhitening with chloride
CHEMICAL PAPER PASTEWhitening without chloride: TCF
CLAS
SIC
ECO
LOGIC
RAW MATERIAL
WASTE WASTE
RAW MATERIAL
WASTE
WOOD
WOOD
Contributionof whiteningchemicals
(elemental chloride)Wood cooked with cooking
water and chemicals
1 TM.Green wood = 200 Kg. paper
1 TM.Green wood =200 Kg. paper
Whiteningwith oxygen
Wood cooked with cookingwater and chemicals
BLACK LIQUOR
BLACK LIQUOR
DIOXINS
RAW MATERIAL 100% RECYCLED PAPERPULPER
DYE REMOVED WITHWATER AND SOAP
WASTENewspaper, magazines, brochures,office paper, printed paper LEFTOVERS:
cord, plastic, staples, wire, dye
Coursetreatment
Finetreatment
Finetreatment
1 TM.Used paper =750 Kg. paper
REC
YCL
ED +
ECO
LOGIC
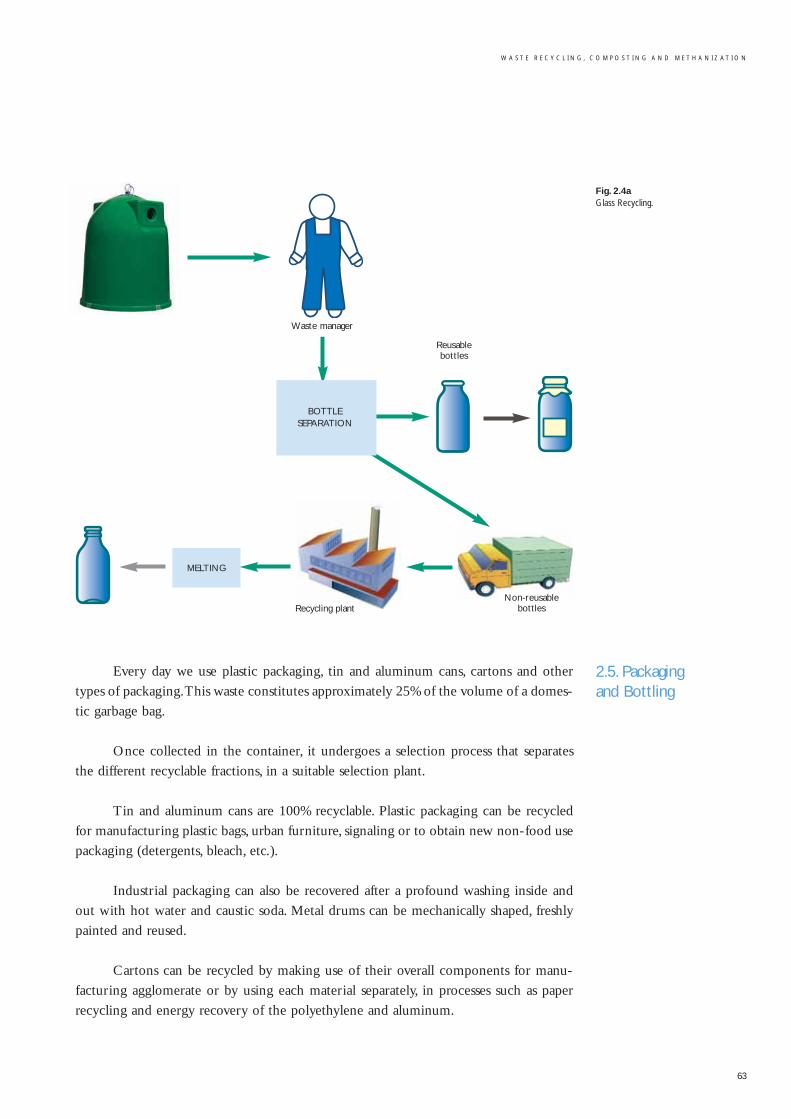
W A S T E R E C Y C L I N G , C O M P O S T I N G A N D M E T H A N I Z A T I O N
63
Every day we use plastic packaging, tin and aluminum cans, cartons and other
types of packaging.This waste constitutes approximately 25% of the volume of a domes-
tic garbage bag.
Once collected in the container, it undergoes a selection process that separates
the different recyclable fractions, in a suitable selection plant.
Tin and aluminum cans are 100% recyclable. Plastic packaging can be recycled
for manufacturing plastic bags, urban furniture, signaling or to obtain new non-food use
packaging (detergents, bleach, etc.).
Industrial packaging can also be recovered after a profound washing inside and
out with hot water and caustic soda. Metal drums can be mechanically shaped, freshly
painted and reused.
Cartons can be recycled by making use of their overall components for manu-
facturing agglomerate or by using each material separately, in processes such as paper
recycling and energy recovery of the polyethylene and aluminum.
Fig. 2.4a Glass Recycling.
2.5. Packaging and Bottling
Waste manager
BOTTLESEPARATION
Reusablebottles
Non-reusablebottlesRecycling plant
MELTING
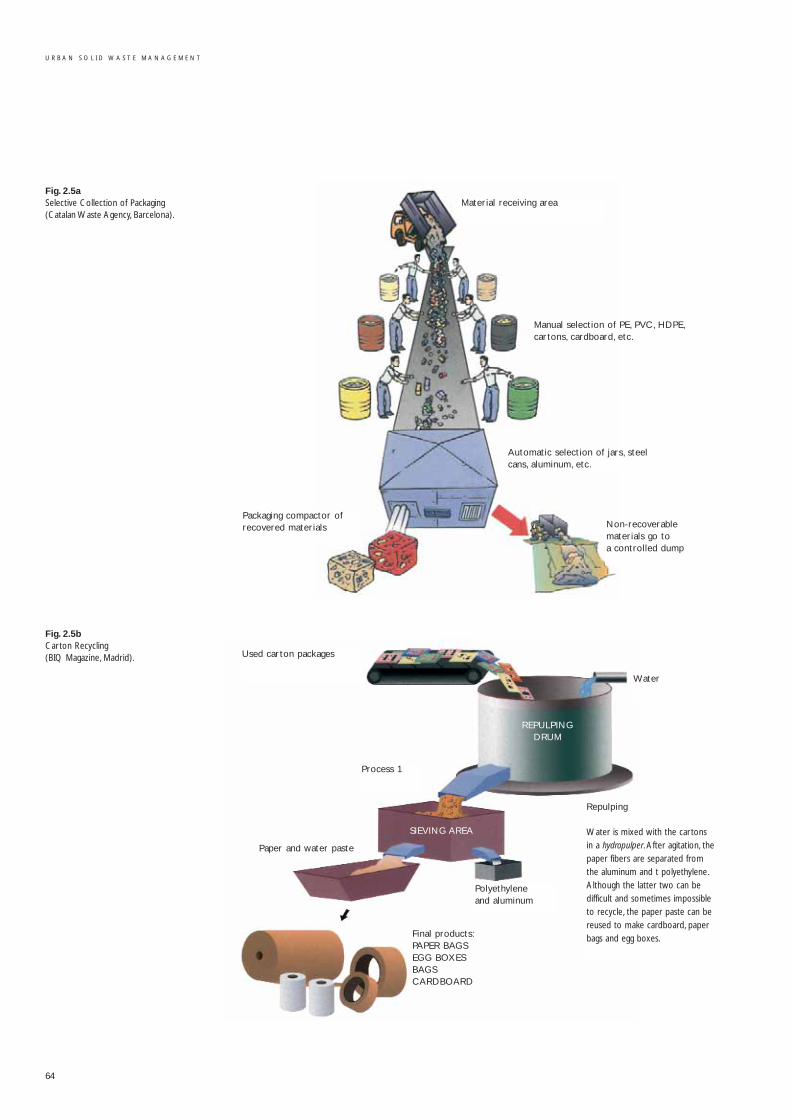
Fig. 2.5aSelective Collection of Packaging(Catalan Waste Agency, Barcelona).
Fig. 2.5b Carton Recycling(BIQ Magazine, Madrid).
64
U R B A N S O L I D W A S T E M A N A G E M E N T
Material receiving area
Manual selection of PE, PVC, HDPE,cartons, cardboard, etc.
Automatic selection of jars, steelcans, aluminum, etc.
Non-recoverable materials go to a controlled dump
Packaging compactor ofrecovered materials
Used carton packages
Water
REPULPINGDRUM
Process 1
Polyethyleneand aluminum
Paper and water paste
Final products:PAPER BAGSEGG BOXESBAGSCARDBOARD
SIEVING AREA
Repulping
Water is mixed with the cartonsin a hydropulper. After agitation, thepaper fibers are separated fromthe aluminum and t polyethylene.Although the latter two can bedifficult and sometimes impossibleto recycle, the paper paste can bereused to make cardboard, paperbags and egg boxes.
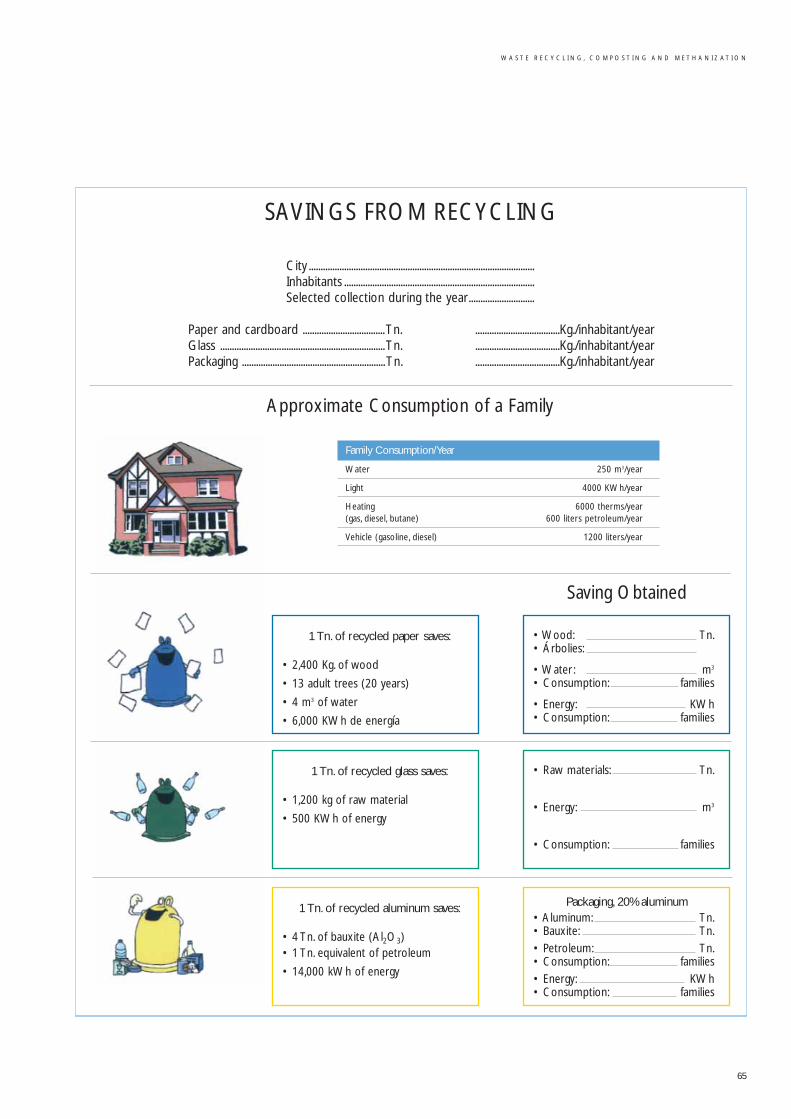
W A S T E R E C Y C L I N G , C O M P O S T I N G A N D M E T H A N I Z A T I O N
65
SAVINGS FROM RECYCLING
City ................................................................................................Inhabitants .................................................................................Selected collection during the year............................
Paper and cardboard ...................................Tn. ....................................Kg./inhabitant/yearGlass ......................................................................Tn. ....................................Kg./inhabitant/yearPackaging .............................................................Tn. ....................................Kg./inhabitant/year
Approximate Consumption of a Family
Family Consumption/Year
Water 250 m3/year
Light 4000 KWh/year
Heating 6000 therms/year (gas, diesel, butane) 600 liters petroleum/year
Vehicle (gasoline, diesel) 1200 liters/year
1 Tn. of recycled paper saves:
• 2,400 Kg. of wood
• 13 adult trees (20 years)
• 4 m3 of water
• 6,000 KWh de energía
1 Tn. of recycled glass saves:
• 1,200 kg of raw material
• 500 KWh of energy
1 Tn. of recycled aluminum saves:
• 4 Tn. of bauxite (Al2O3)• 1 Tn. equivalent of petroleum
• 14,000 kWh of energy
Saving Obtained
• Wood: Tn.• Árbolies:
• Water: m3
• Consumption: families
• Energy: KWh• Consumption: families
• Raw materials: Tn.
• Energy: m3
• Consumption: families
Packaging, 20% aluminum• Aluminum: Tn.• Bauxite: Tn.
• Petroleum: Tn.• Consumption: families
• Energy: KWh• Consumption: families
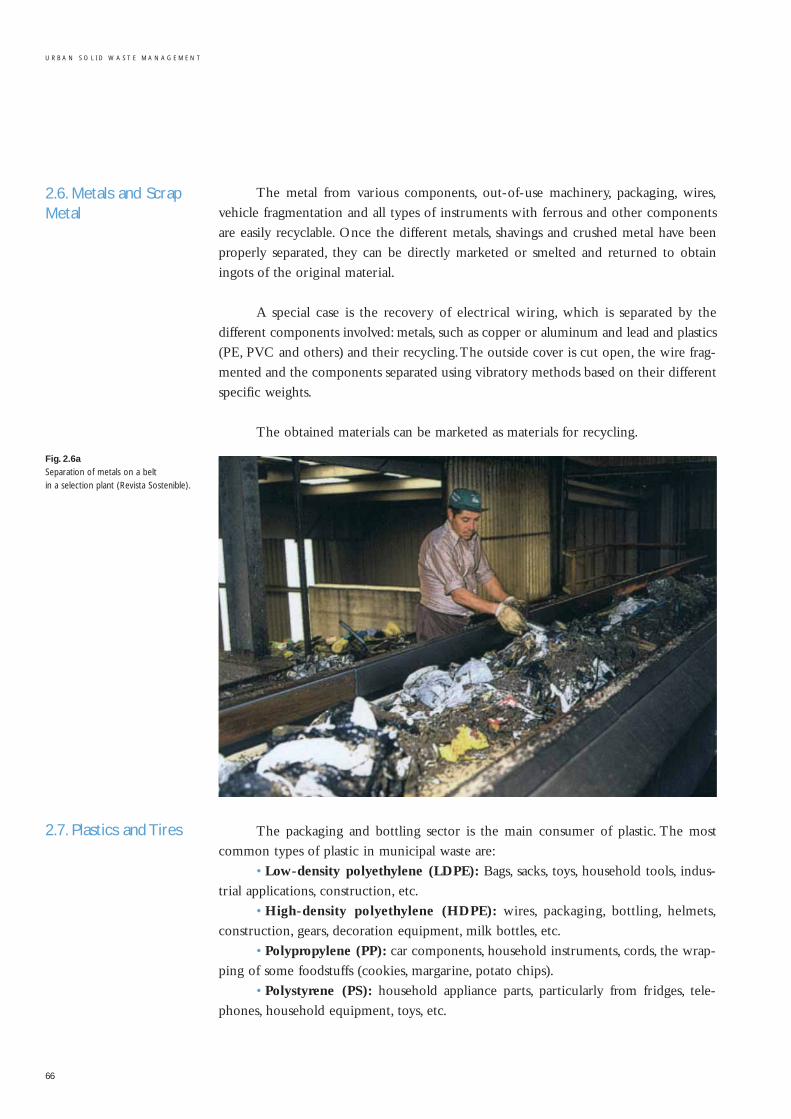
2.6. Metals and ScrapMetal
Fig. 2.6a Separation of metals on a belt in a selection plant (Revista Sostenible).
2.7. Plastics and Tires
The metal from various components, out-of-use machinery, packaging, wires,
vehicle fragmentation and all types of instruments with ferrous and other components
are easily recyclable. Once the different metals, shavings and crushed metal have been
properly separated, they can be directly marketed or smelted and returned to obtain
ingots of the original material.
A special case is the recovery of electrical wiring, which is separated by the
different components involved: metals, such as copper or aluminum and lead and plastics
(PE, PVC and others) and their recycling.The outside cover is cut open, the wire frag-
mented and the components separated using vibratory methods based on their different
specific weights.
The obtained materials can be marketed as materials for recycling.
The packaging and bottling sector is the main consumer of plastic. The most
common types of plastic in municipal waste are:
• Low-density polyethylene (LDPE): Bags, sacks, toys, household tools, indus-
trial applications, construction, etc.
• High-density polyethylene (HDPE): wires, packaging, bottling, helmets,
construction, gears, decoration equipment, milk bottles, etc.
• Polypropylene (PP): car components, household instruments, cords, the wrap-
ping of some foodstuffs (cookies, margarine, potato chips).
• Polystyrene (PS): household appliance parts, particularly from fridges, tele-
phones, household equipment, toys, etc.
66
U R B A N S O L I D W A S T E M A N A G E M E N T
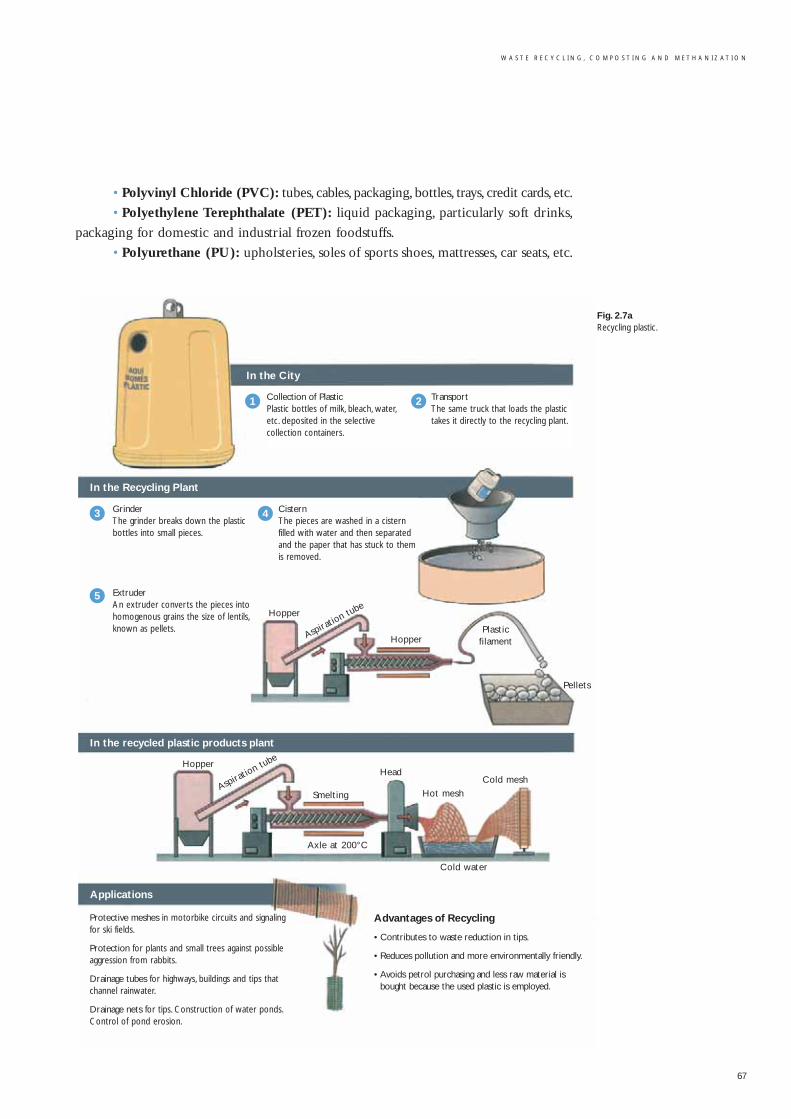
W A S T E R E C Y C L I N G , C O M P O S T I N G A N D M E T H A N I Z A T I O N
67
• Polyvinyl Chloride (PVC): tubes, cables, packaging, bottles, trays, credit cards, etc.
• Polyethylene Terephthalate (PET): liquid packaging, particularly soft drinks,
packaging for domestic and industrial frozen foodstuffs.
• Polyurethane (PU): upholsteries, soles of sports shoes, mattresses, car seats, etc.
Fig. 2.7aRecycling plastic.
Collection of PlasticPlastic bottles of milk, bleach, water,etc. deposited in the selective collection containers.
TransportThe same truck that loads the plastictakes it directly to the recycling plant.
In the City
In the Recycling Plant
In the recycled plastic products plant
Applications
GrinderThe grinder breaks down the plasticbottles into small pieces.
ExtruderAn extruder converts the pieces intohomogenous grains the size of lentils,known as pellets.
CisternThe pieces are washed in a cisternfilled with water and then separatedand the paper that has stuck to themis removed.
Aspiration tu
be
Hopper
Hopper
Plasticfilament
Pellets
1 2
5
3 4
Hopper
Aspiration tu
be
Smelting
Head
Hot mesh
Cold mesh
Cold water
Axle at 200°C
Protective meshes in motorbike circuits and signalingfor ski fields.
Protection for plants and small trees against possibleaggression from rabbits.
Drainage tubes for highways, buildings and tips thatchannel rainwater.
Drainage nets for tips. Construction of water ponds.Control of pond erosion.
Advantages of Recycling
• Contributes to waste reduction in tips.
• Reduces pollution and more environmentally friendly.
• Avoids petrol purchasing and less raw material isbought because the used plastic is employed.
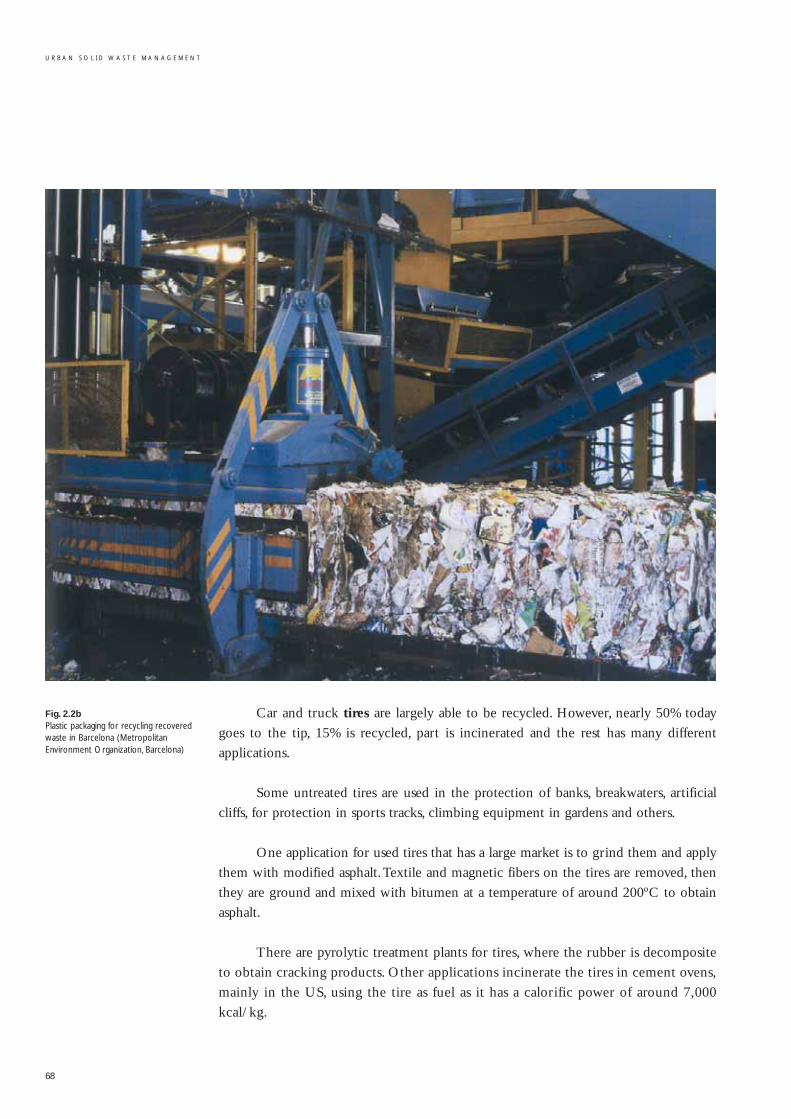
Fig. 2.2bPlastic packaging for recycling recoveredwaste in Barcelona (MetropolitanEnvironment Organization, Barcelona)
Car and truck tires are largely able to be recycled. However, nearly 50% today
goes to the tip, 15% is recycled, part is incinerated and the rest has many different
applications.
Some untreated tires are used in the protection of banks, breakwaters, artificial
cliffs, for protection in sports tracks, climbing equipment in gardens and others.
One application for used tires that has a large market is to grind them and apply
them with modified asphalt.Textile and magnetic fibers on the tires are removed, then
they are ground and mixed with bitumen at a temperature of around 200ºC to obtain
asphalt.
There are pyrolytic treatment plants for tires, where the rubber is decomposite
to obtain cracking products. Other applications incinerate the tires in cement ovens,
mainly in the US, using the tire as fuel as it has a calorific power of around 7,000
kcal/kg.
68
U R B A N S O L I D W A S T E M A N A G E M E N T
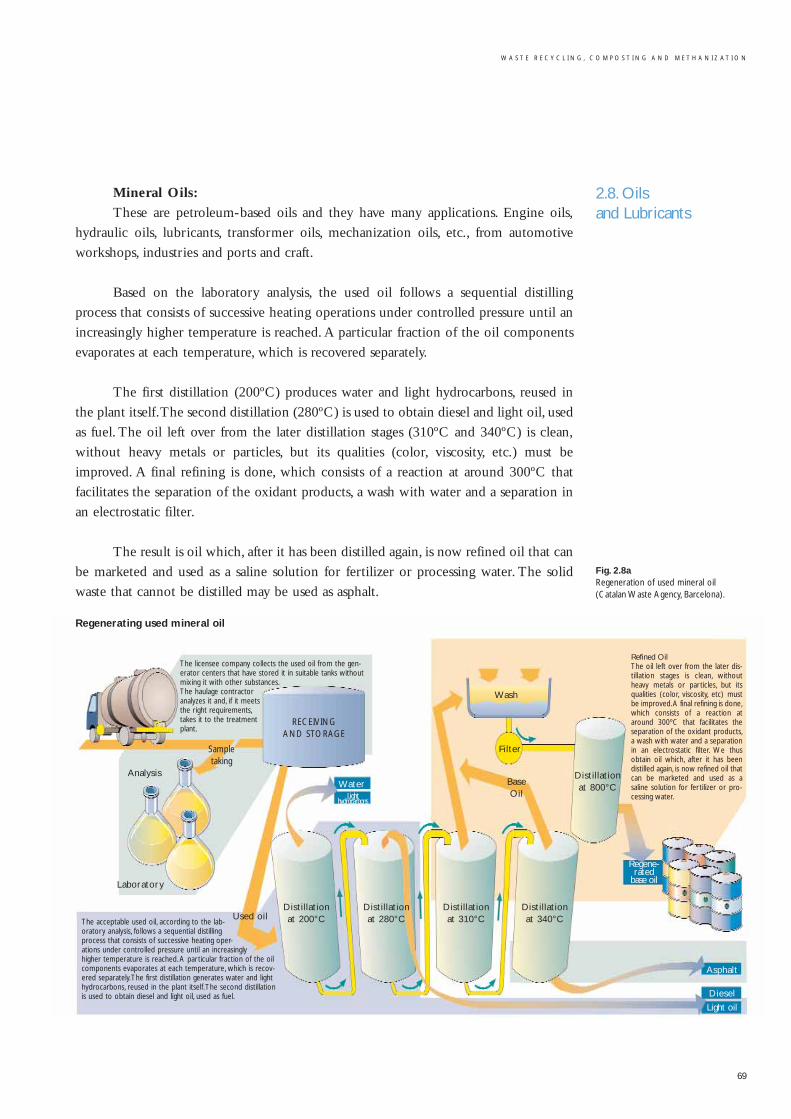
W A S T E R E C Y C L I N G , C O M P O S T I N G A N D M E T H A N I Z A T I O N
69
Mineral Oils:
These are petroleum-based oils and they have many applications. Engine oils,
hydraulic oils, lubricants, transformer oils, mechanization oils, etc., from automotive
workshops, industries and ports and craft.
Based on the laboratory analysis, the used oil follows a sequential distilling
process that consists of successive heating operations under controlled pressure until an
increasingly higher temperature is reached. A particular fraction of the oil components
evaporates at each temperature, which is recovered separately.
The first distillation (200ºC) produces water and light hydrocarbons, reused in
the plant itself.The second distillation (280ºC) is used to obtain diesel and light oil, used
as fuel. The oil left over from the later distillation stages (310ºC and 340ºC) is clean,
without heavy metals or particles, but its qualities (color, viscosity, etc.) must be
improved. A final refining is done, which consists of a reaction at around 300ºC that
facilitates the separation of the oxidant products, a wash with water and a separation in
an electrostatic filter.
The result is oil which, after it has been distilled again, is now refined oil that can
be marketed and used as a saline solution for fertilizer or processing water. The solid
waste that cannot be distilled may be used as asphalt.
2.8. Oils and Lubricants
Fig. 2.8aRegeneration of used mineral oil(Catalan Waste Agency, Barcelona).
Sampletaking
The licensee company collects the used oil from the gen-erator centers that have stored it in suitable tanks withoutmixing it with other substances.The haulage contractor analyzes it and, if it meets the right requirements,takes it to the treatment plant.
Analysis
Laboratory
RECEIVING AND STORAGE
Wash
Light oil
BaseOil
Used oil
Water
Filter
Distillationat 200°C
Distillationat 280°C
Distillationat 310°C
Distillationat 340°C
Distillationat 800°C
Regene-rated
base oil
Asphalt
Lighthydrocarbons
Diesel
Refined OilThe oil left over from the later dis-tillation stages is clean, withoutheavy metals or particles, but itsqualities (color, viscosity, etc) mustbe improved.A final refining is done,which consists of a reaction ataround 300ºC that facilitates theseparation of the oxidant products,a wash with water and a separationin an electrostatic filter. We thusobtain oil which, after it has beendistilled again, is now refined oil thatcan be marketed and used as asaline solution for fertilizer or pro-cessing water.
The acceptable used oil, according to the lab-oratory analysis, follows a sequential distilling process that consists of successive heating oper-ations under controlled pressure until an increasingly higher temperature is reached. A particular fraction of the oilcomponents evaporates at each temperature, which is recov-ered separately.The first distillation generates water and lighthydrocarbons, reused in the plant itself.The second distillationis used to obtain diesel and light oil, used as fuel.
Regenerating used mineral oil
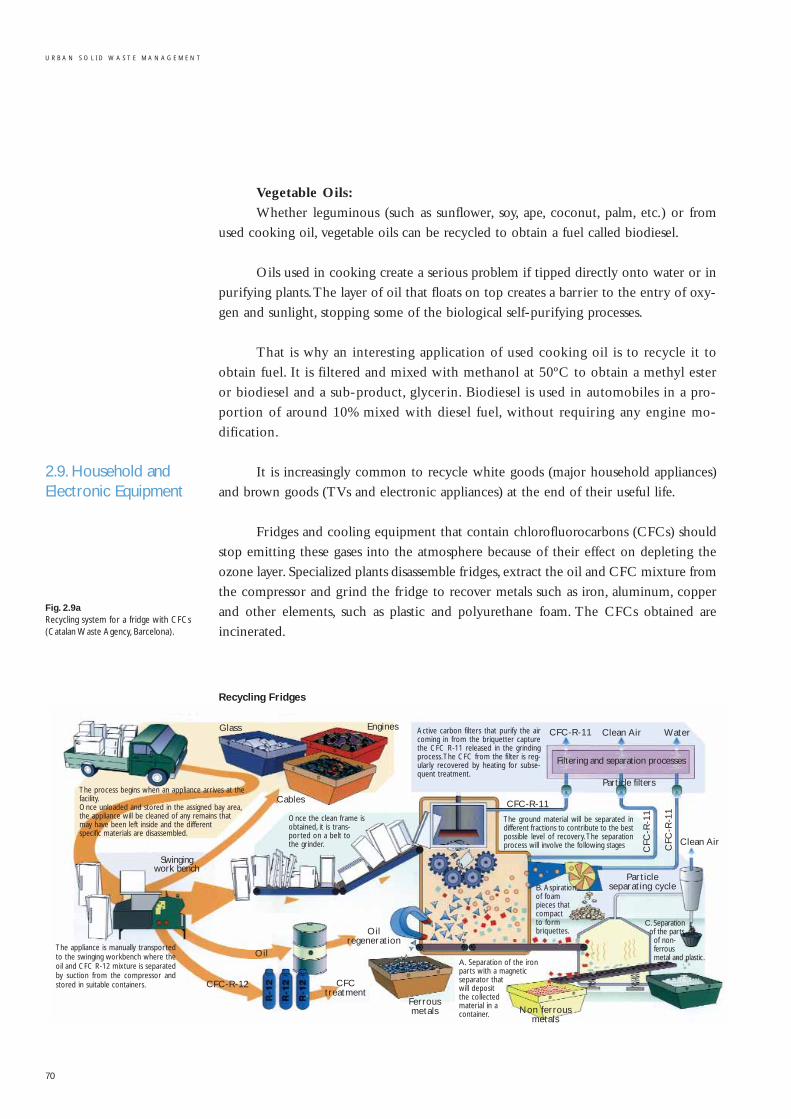
2.9. Household andElectronic Equipment
Fig. 2.9a Recycling system for a fridge with CFCs(Catalan Waste Agency, Barcelona).
Vegetable Oils:
Whether leguminous (such as sunflower, soy, ape, coconut, palm, etc.) or from
used cooking oil, vegetable oils can be recycled to obtain a fuel called biodiesel.
Oils used in cooking create a serious problem if tipped directly onto water or in
purifying plants.The layer of oil that floats on top creates a barrier to the entry of oxy-
gen and sunlight, stopping some of the biological self-purifying processes.
That is why an interesting application of used cooking oil is to recycle it to
obtain fuel. It is filtered and mixed with methanol at 50ºC to obtain a methyl ester
or biodiesel and a sub-product, glycerin. Biodiesel is used in automobiles in a pro-
portion of around 10% mixed with diesel fuel, without requiring any engine mo-
dification.
It is increasingly common to recycle white goods (major household appliances)
and brown goods (TVs and electronic appliances) at the end of their useful life.
Fridges and cooling equipment that contain chlorofluorocarbons (CFCs) should
stop emitting these gases into the atmosphere because of their effect on depleting the
ozone layer. Specialized plants disassemble fridges, extract the oil and CFC mixture from
the compressor and grind the fridge to recover metals such as iron, aluminum, copper
and other elements, such as plastic and polyurethane foam. The CFCs obtained are
incinerated.
70
U R B A N S O L I D W A S T E M A N A G E M E N T
The process begins when an appliance arrives at thefacility.Once unloaded and stored in the assigned bay area,the appliance will be cleaned of any remains that may have been left inside and the different specific materials are disassembled.
Recycling Fridges
The appliance is manually transportedto the swinging workbench where theoil and CFC R-12 mixture is separatedby suction from the compressor andstored in suitable containers.
Once the clean frame isobtained, it is trans-ported on a belt to the grinder.
Active carbon filters that purify the aircoming in from the briquetter capturethe CFC R-11 released in the grindingprocess.The CFC from the filter is reg-ularly recovered by heating for subse-quent treatment.
The ground material will be separated indifferent fractions to contribute to the bestpossible level of recovery. The separationprocess will involve the following stages
Engines
Cables CFC-R-11
Particle separating cycle
CFC
-R-1
1
Oil
CFC-R-11
CFC-R-12
Oilregeneration
CFCtreatment
Ferrousmetals Non ferrous
metals
Swinging work bench
Clean Air
Glass
Filtering and separation processes
Clean Air Water
Particle filters
CFC
-R-1
1
A. Separation of the iron parts with a magnetic separator that will deposit the collected material in a container.
B. Aspiration of foam pieces that compact to form briquettes.
C. Separation of the parts
of non-ferrous metal and plastic.
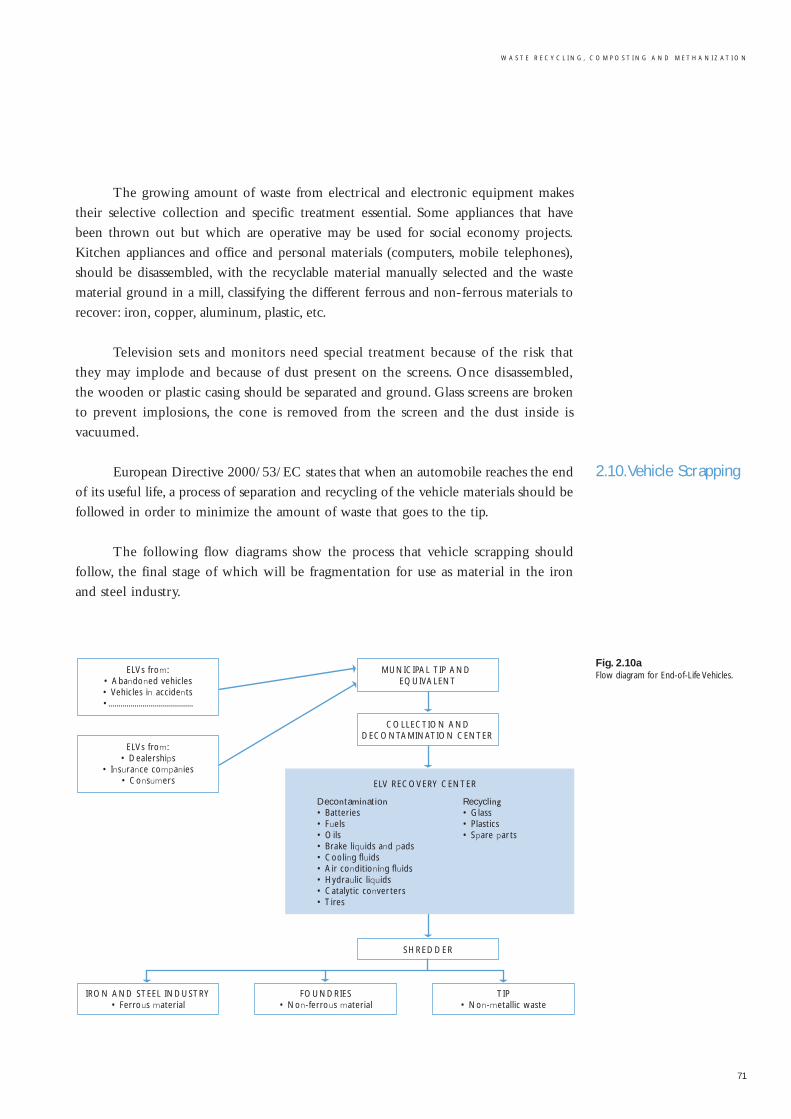
W A S T E R E C Y C L I N G , C O M P O S T I N G A N D M E T H A N I Z A T I O N
71
The growing amount of waste from electrical and electronic equipment makes
their selective collection and specific treatment essential. Some appliances that have
been thrown out but which are operative may be used for social economy projects.
Kitchen appliances and office and personal materials (computers, mobile telephones),
should be disassembled, with the recyclable material manually selected and the waste
material ground in a mill, classifying the different ferrous and non-ferrous materials to
recover: iron, copper, aluminum, plastic, etc.
Television sets and monitors need special treatment because of the risk that
they may implode and because of dust present on the screens. Once disassembled,
the wooden or plastic casing should be separated and ground. Glass screens are broken
to prevent implosions, the cone is removed from the screen and the dust inside is
vacuumed.
European Directive 2000/53/EC states that when an automobile reaches the end
of its useful life, a process of separation and recycling of the vehicle materials should be
followed in order to minimize the amount of waste that goes to the tip.
The following flow diagrams show the process that vehicle scrapping should
follow, the final stage of which will be fragmentation for use as material in the iron
and steel industry.
2.10.Vehicle Scrapping
Fig. 2.10aFlow diagram for End-of-Life Vehicles.
ELVs from:• Abandoned vehicles• Vehicles in accidents•..........................................
MUNICIPAL TIP AND EQUIVALENT
ELVs from:• Dealerships
• Insurance companies• Consumers
COLLECTION ANDDECONTAMINATION CENTER
Decontamination• Batteries• Fuels• Oils• Brake liquids and pads• Cooling fluids• Air conditioning fluids• Hydraulic liquids• Catalytic conver ters• Tires
Recycling• Glass• Plastics• Spare par ts
ELV RECOVERY CENTER
SHREDDER
IRON AND STEEL INDUSTRY• Ferrous material
TIP• Non-metallic waste
FOUNDRIES• Non-ferrous material
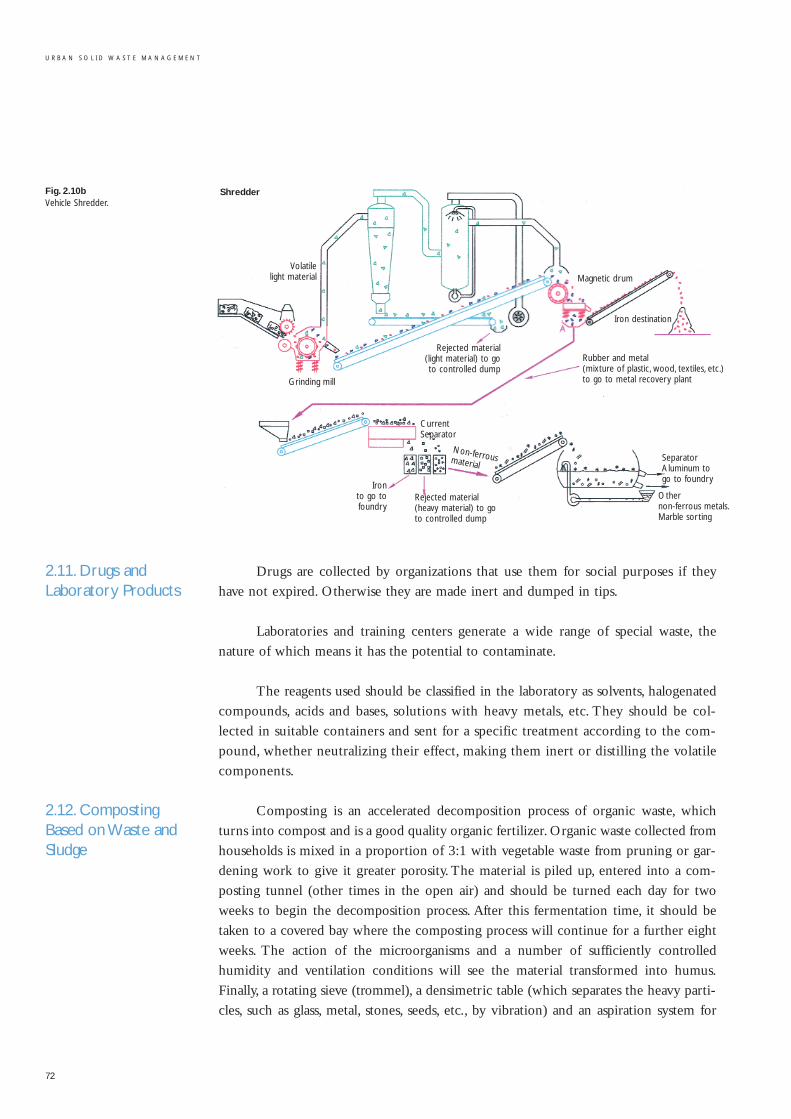
Fig. 2.10bVehicle Shredder.
2.11. Drugs andLaboratory Products
2.12. CompostingBased on Waste andSludge
Drugs are collected by organizations that use them for social purposes if they
have not expired. Otherwise they are made inert and dumped in tips.
Laboratories and training centers generate a wide range of special waste, the
nature of which means it has the potential to contaminate.
The reagents used should be classified in the laboratory as solvents, halogenated
compounds, acids and bases, solutions with heavy metals, etc. They should be col-
lected in suitable containers and sent for a specific treatment according to the com-
pound, whether neutralizing their effect, making them inert or distilling the volatile
components.
Composting is an accelerated decomposition process of organic waste, which
turns into compost and is a good quality organic fertilizer. Organic waste collected from
households is mixed in a proportion of 3:1 with vegetable waste from pruning or gar-
dening work to give it greater porosity. The material is piled up, entered into a com-
posting tunnel (other times in the open air) and should be turned each day for two
weeks to begin the decomposition process. After this fermentation time, it should be
taken to a covered bay where the composting process will continue for a further eight
weeks. The action of the microorganisms and a number of sufficiently controlled
humidity and ventilation conditions will see the material transformed into humus.
Finally, a rotating sieve (trommel), a densimetric table (which separates the heavy parti-
cles, such as glass, metal, stones, seeds, etc., by vibration) and an aspiration system for
72
U R B A N S O L I D W A S T E M A N A G E M E N T
Grinding mill
Non-ferrous material
Magnetic drum
Iron destination
Shredder
Volatile light material
Iron to go tofoundry
Rejected material (heavy material) to goto controlled dump
CurrentSeparator
Rubber and metal (mixture of plastic, wood, textiles, etc.)to go to metal recovery plant
Rejected material(light material) to goto controlled dump
SeparatorAluminum togo to foundry
Other non-ferrous metals.Marble sorting
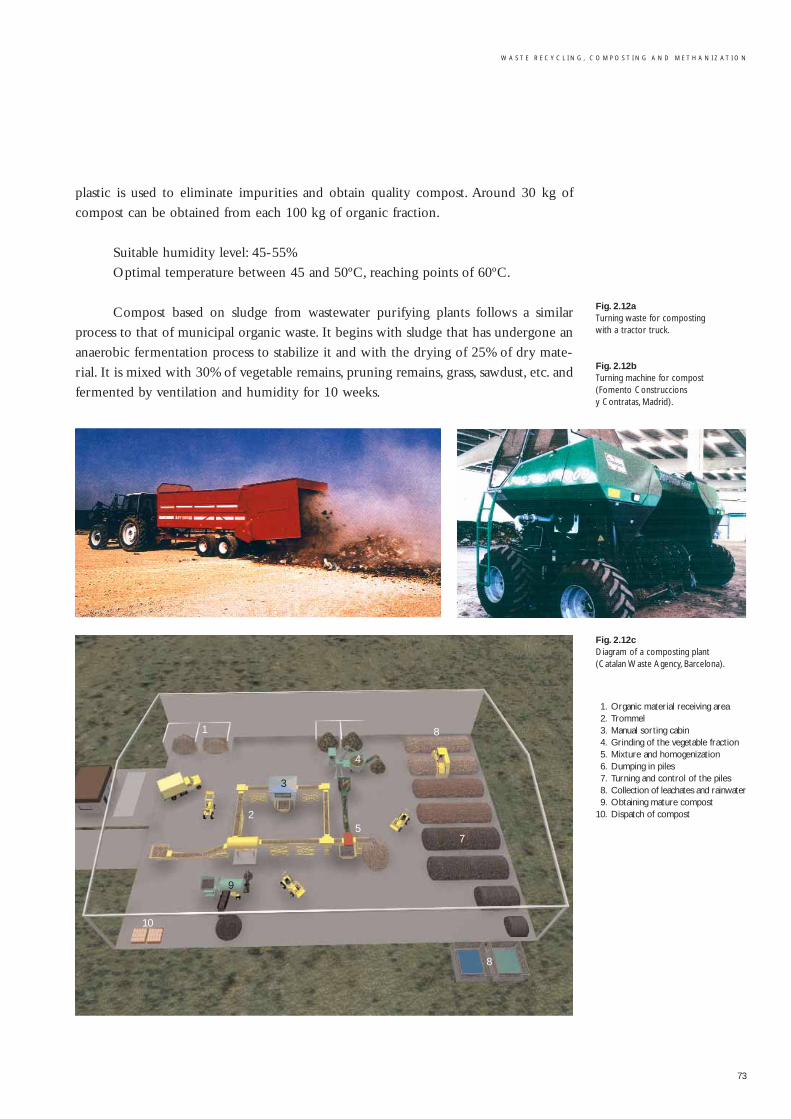
W A S T E R E C Y C L I N G , C O M P O S T I N G A N D M E T H A N I Z A T I O N
73
plastic is used to eliminate impurities and obtain quality compost. Around 30 kg of
compost can be obtained from each 100 kg of organic fraction.
Suitable humidity level: 45-55%
Optimal temperature between 45 and 50ºC, reaching points of 60ºC.
Compost based on sludge from wastewater purifying plants follows a similar
process to that of municipal organic waste. It begins with sludge that has undergone an
anaerobic fermentation process to stabilize it and with the drying of 25% of dry mate-
rial. It is mixed with 30% of vegetable remains, pruning remains, grass, sawdust, etc. and
fermented by ventilation and humidity for 10 weeks.
Fig. 2.12aTurning waste for composting with a tractor truck.
Fig. 2.12b Turning machine for compost (Fomento Construccions y Contratas, Madrid).
Fig. 2.12cDiagram of a composting plant (Catalan Waste Agency, Barcelona).
1. Organic material receiving area2. Trommel3. Manual sorting cabin4. Grinding of the vegetable fraction5. Mixture and homogenization6. Dumping in piles7. Turning and control of the piles8. Collection of leachates and rainwater9. Obtaining mature compost
10. Dispatch of compost
8
1 8
3
2
9
10
5
4
7
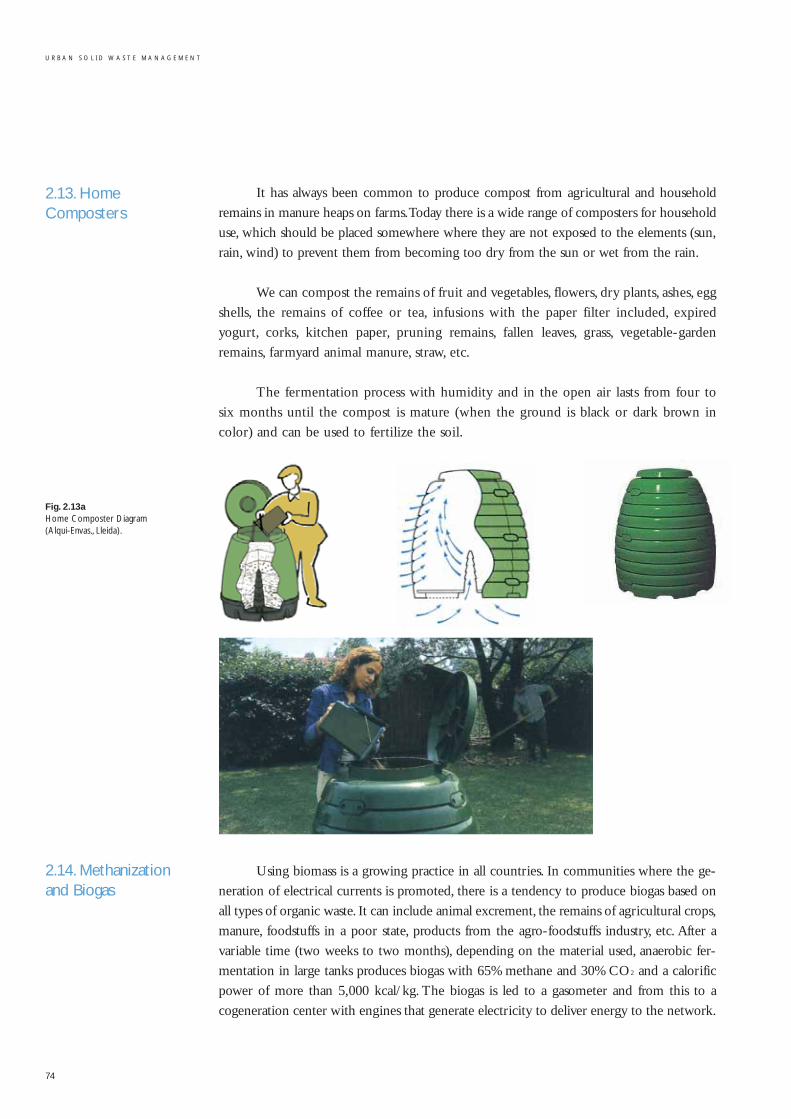
2.13. HomeComposters
Fig. 2.13aHome Composter Diagram (Alqui-Envas., Lleida).
2.14. Methanizationand Biogas
It has always been common to produce compost from agricultural and household
remains in manure heaps on farms.Today there is a wide range of composters for household
use, which should be placed somewhere where they are not exposed to the elements (sun,
rain, wind) to prevent them from becoming too dry from the sun or wet from the rain.
We can compost the remains of fruit and vegetables, flowers, dry plants, ashes, egg
shells, the remains of coffee or tea, infusions with the paper filter included, expired
yogurt, corks, kitchen paper, pruning remains, fallen leaves, grass, vegetable-garden
remains, farmyard animal manure, straw, etc.
The fermentation process with humidity and in the open air lasts from four to
six months until the compost is mature (when the ground is black or dark brown in
color) and can be used to fertilize the soil.
Using biomass is a growing practice in all countries. In communities where the ge-
neration of electrical currents is promoted, there is a tendency to produce biogas based on
all types of organic waste. It can include animal excrement, the remains of agricultural crops,
manure, foodstuffs in a poor state, products from the agro-foodstuffs industry, etc. After a
variable time (two weeks to two months), depending on the material used, anaerobic fer-
mentation in large tanks produces biogas with 65% methane and 30% CO2 and a calorific
power of more than 5,000 kcal/kg. The biogas is led to a gasometer and from this to a
cogeneration center with engines that generate electricity to deliver energy to the network.
74
U R B A N S O L I D W A S T E M A N A G E M E N T
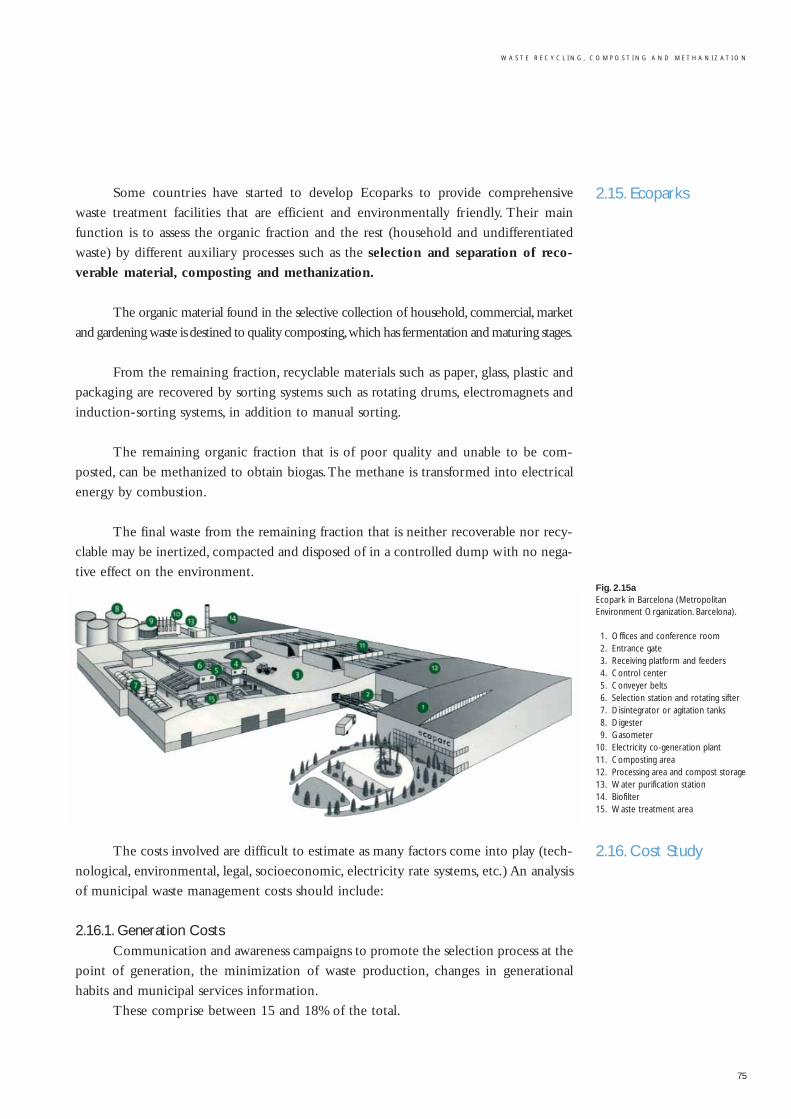
W A S T E R E C Y C L I N G , C O M P O S T I N G A N D M E T H A N I Z A T I O N
75
Some countries have started to develop Ecoparks to provide comprehensive
waste treatment facilities that are efficient and environmentally friendly. Their main
function is to assess the organic fraction and the rest (household and undifferentiated
waste) by different auxiliary processes such as the selection and separation of reco-
verable material, composting and methanization.
The organic material found in the selective collection of household, commercial, market
and gardening waste is destined to quality composting,which has fermentation and maturing stages.
From the remaining fraction, recyclable materials such as paper, glass, plastic and
packaging are recovered by sorting systems such as rotating drums, electromagnets and
induction-sorting systems, in addition to manual sorting.
The remaining organic fraction that is of poor quality and unable to be com-
posted, can be methanized to obtain biogas.The methane is transformed into electrical
energy by combustion.
The final waste from the remaining fraction that is neither recoverable nor recy-
clable may be inertized, compacted and disposed of in a controlled dump with no nega-
tive effect on the environment.
The costs involved are difficult to estimate as many factors come into play (tech-
nological, environmental, legal, socioeconomic, electricity rate systems, etc.) An analysis
of municipal waste management costs should include:
2.16.1. Generation CostsCommunication and awareness campaigns to promote the selection process at the
point of generation, the minimization of waste production, changes in generational
habits and municipal services information.
These comprise between 15 and 18% of the total.
2.15. Ecoparks
Fig. 2.15a Ecopark in Barcelona (MetropolitanEnvironment Organization. Barcelona).
1. Offices and conference room2. Entrance gate3. Receiving platform and feeders4. Control center5. Conveyer belts6. Selection station and rotating sifter7. Disintegrator or agitation tanks8. Digester9. Gasometer
10. Electricity co-generation plant11. Composting area12. Processing area and compost storage13. Water purification station14. Biofilter15. Waste treatment area
2.16. Cost Study
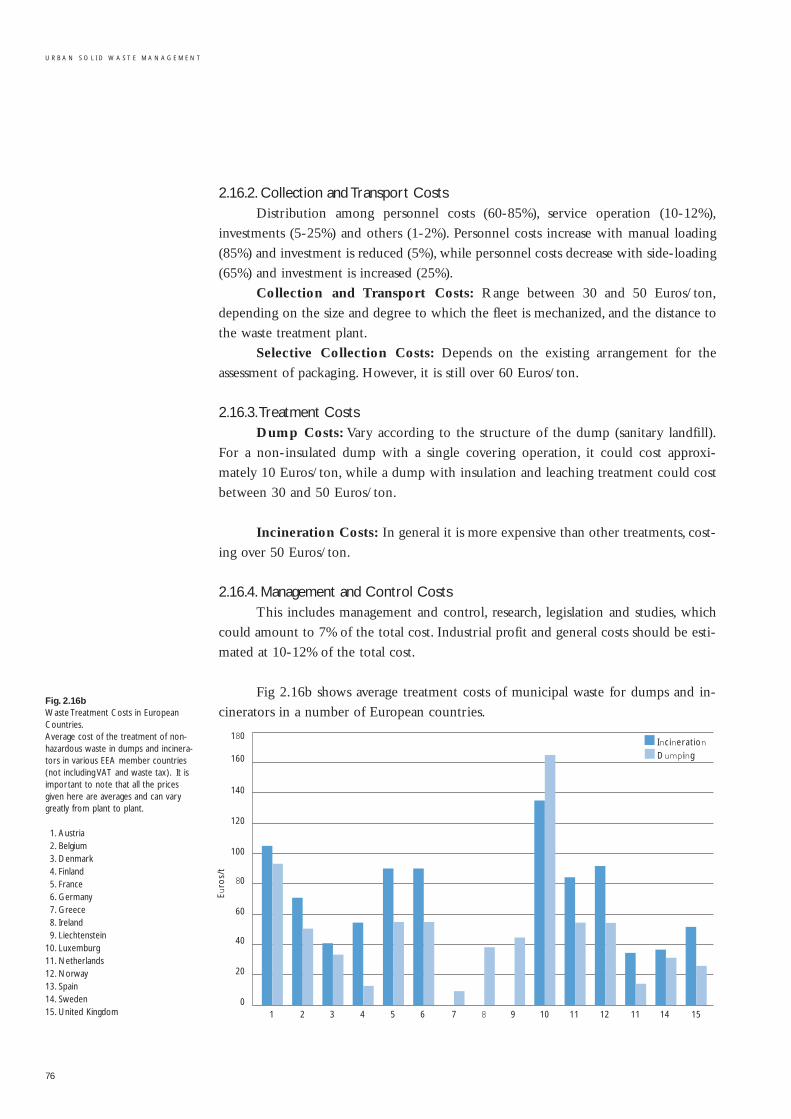
Fig. 2.16bWaste Treatment Costs in EuropeanCountries.Average cost of the treatment of non-hazardous waste in dumps and incinera-tors in various EEA member countries(not including VAT and waste tax). It isimportant to note that all the pricesgiven here are averages and can varygreatly from plant to plant.
1. Austria2. Belgium3. Denmark4. Finland5. France6. Germany7. Greece8. Ireland9. Liechtenstein
10. Luxemburg11. Netherlands12. Norway13. Spain14. Sweden15. United Kingdom
2.16.2. Collection and Transport CostsDistribution among personnel costs (60-85%), service operation (10-12%),
investments (5-25%) and others (1-2%). Personnel costs increase with manual loading
(85%) and investment is reduced (5%), while personnel costs decrease with side-loading
(65%) and investment is increased (25%).
Collection and Transport Costs: Range between 30 and 50 Euros/ton,
depending on the size and degree to which the fleet is mechanized, and the distance to
the waste treatment plant.
Selective Collection Costs: Depends on the existing arrangement for the
assessment of packaging. However, it is still over 60 Euros/ton.
2.16.3.Treatment CostsDump Costs: Vary according to the structure of the dump (sanitary landfill).
For a non-insulated dump with a single covering operation, it could cost approxi-
mately 10 Euros/ton, while a dump with insulation and leaching treatment could cost
between 30 and 50 Euros/ton.
Incineration Costs: In general it is more expensive than other treatments, cost-
ing over 50 Euros/ton.
2.16.4. Management and Control CostsThis includes management and control, research, legislation and studies, which
could amount to 7% of the total cost. Industrial profit and general costs should be esti-
mated at 10-12% of the total cost.
Fig 2.16b shows average treatment costs of municipal waste for dumps and in-
cinerators in a number of European countries.
76
U R B A N S O L I D W A S T E M A N A G E M E N T
0
20
40
60
80
100
120
140
1 2 3 4 5 6 7 8 9 10 11 12 11 14 15
160
180
Euro
s/t
IncinerationDump ing
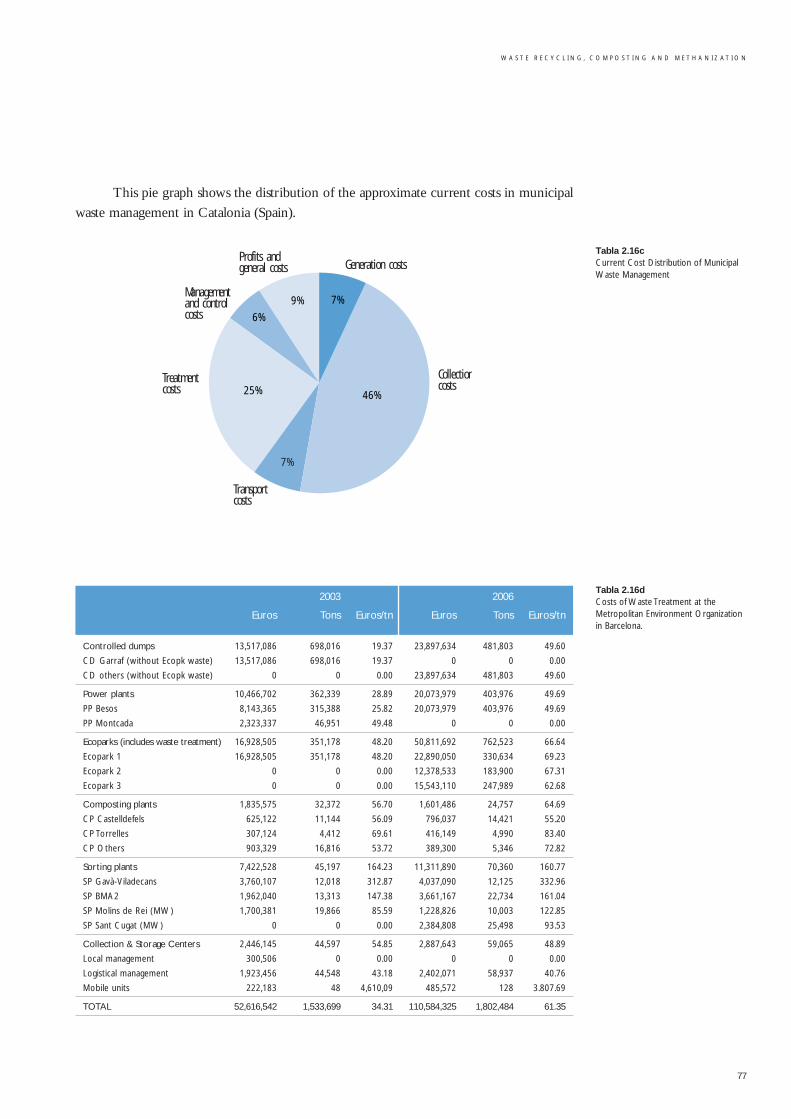
W A S T E R E C Y C L I N G , C O M P O S T I N G A N D M E T H A N I Z A T I O N
77
This pie graph shows the distribution of the approximate current costs in municipal
waste management in Catalonia (Spain).
2003 2006
Euros Tons Euros/tn Euros Tons Euros/tn
Controlled dumps 13,517,086 698,016 19.37 23,897,634 481,803 49.60
CD Garraf (without Ecopk waste) 13,517,086 698,016 19.37 0 0 0.00
CD others (without Ecopk waste) 0 0 0.00 23,897,634 481,803 49.60
Power plants 10,466,702 362,339 28.89 20,073,979 403,976 49.69
PP Besos 8,143,365 315,388 25.82 20,073,979 403,976 49.69
PP Montcada 2,323,337 46,951 49.48 0 0 0.00
Ecoparks (includes waste treatment) 16,928,505 351,178 48.20 50,811,692 762,523 66.64
Ecopark 1 16,928,505 351,178 48.20 22,890,050 330,634 69.23
Ecopark 2 0 0 0.00 12,378,533 183,900 67.31
Ecopark 3 0 0 0.00 15,543,110 247,989 62.68
Composting plants 1,835,575 32,372 56.70 1,601,486 24,757 64.69
CP Castelldefels 625,122 11,144 56.09 796,037 14,421 55.20
CP Torrelles 307,124 4,412 69.61 416,149 4,990 83.40
CP Others 903,329 16,816 53.72 389,300 5,346 72.82
Sorting plants 7,422,528 45,197 164.23 11,311,890 70,360 160.77
SP Gavà-Viladecans 3,760,107 12,018 312.87 4,037,090 12,125 332.96
SP BMA2 1,962,040 13,313 147.38 3,661,167 22,734 161.04
SP Molins de Rei (MW) 1,700,381 19,866 85.59 1,228,826 10,003 122.85
SP Sant Cugat (MW) 0 0 0.00 2,384,808 25,498 93.53
Collection & Storage Centers 2,446,145 44,597 54.85 2,887,643 59,065 48.89
Local management 300,506 0 0.00 0 0 0.00
Logistical management 1,923,456 44,548 43.18 2,402,071 58,937 40.76
Mobile units 222,183 48 4,610,09 485,572 128 3.807.69
TOTAL 52,616,542 1,533,699 34.31 110,584,325 1,802,484 61.35
Tabla 2.16cCurrent Cost Distribution of MunicipalWaste Management
Tabla 2.16dCosts of Waste Treatment at theMetropolitan Environment Organizationin Barcelona.
7%
6%
7%
46%25%
Generation costs
Collectioncosts
9%
Transportcosts
Treatmentcosts
Managementand control costs
Profits andgeneral costs
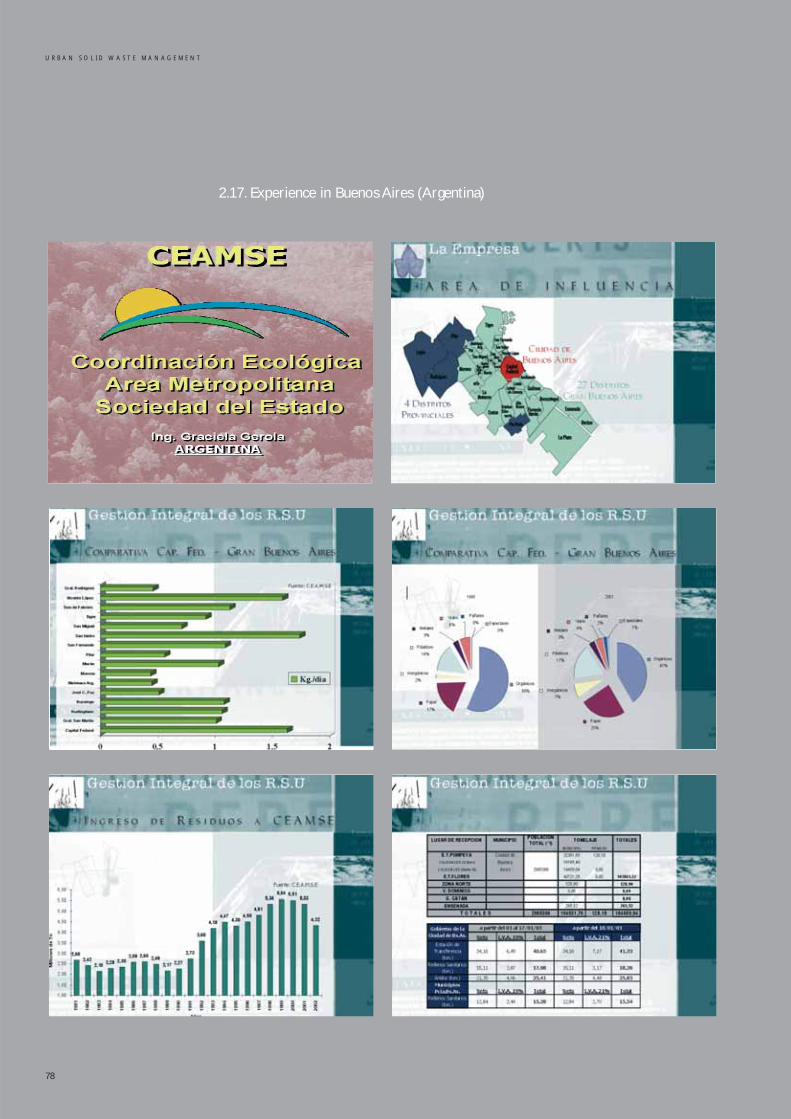
2.17. Experience in Buenos Aires (Argentina)
78
U R B A N S O L I D W A S T E M A N A G E M E N T
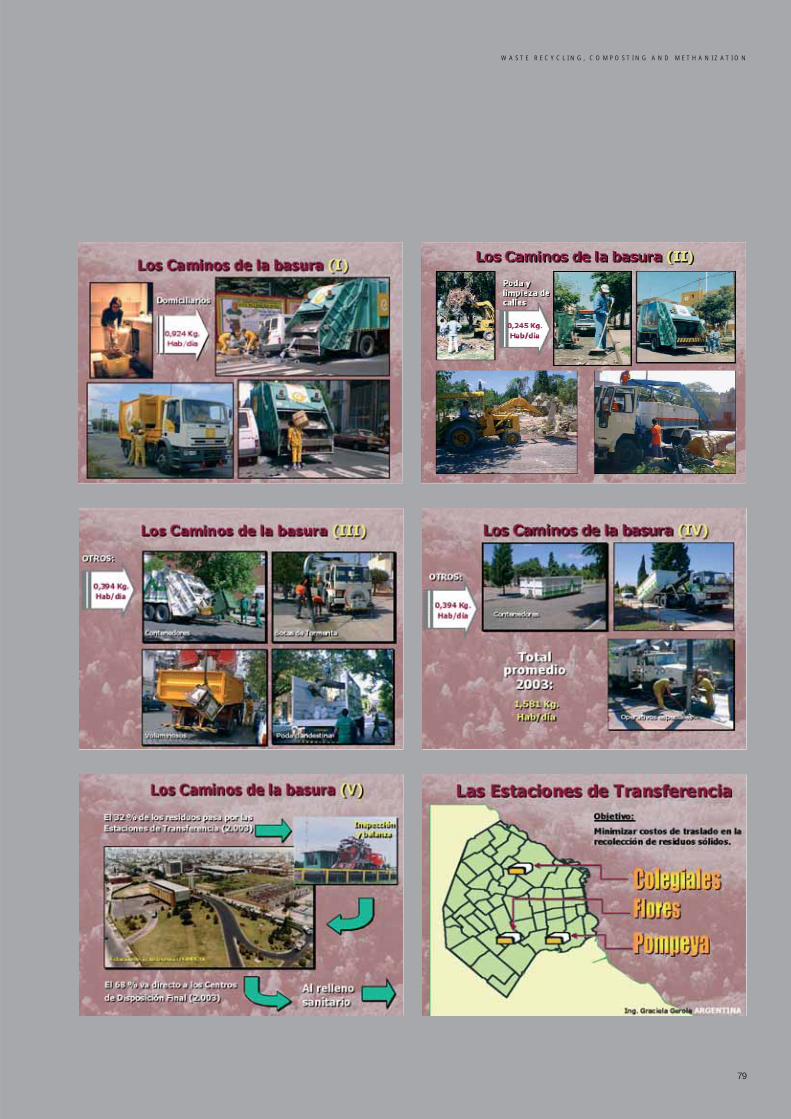
W A S T E R E C Y C L I N G , C O M P O S T I N G A N D M E T H A N I Z A T I O N
79
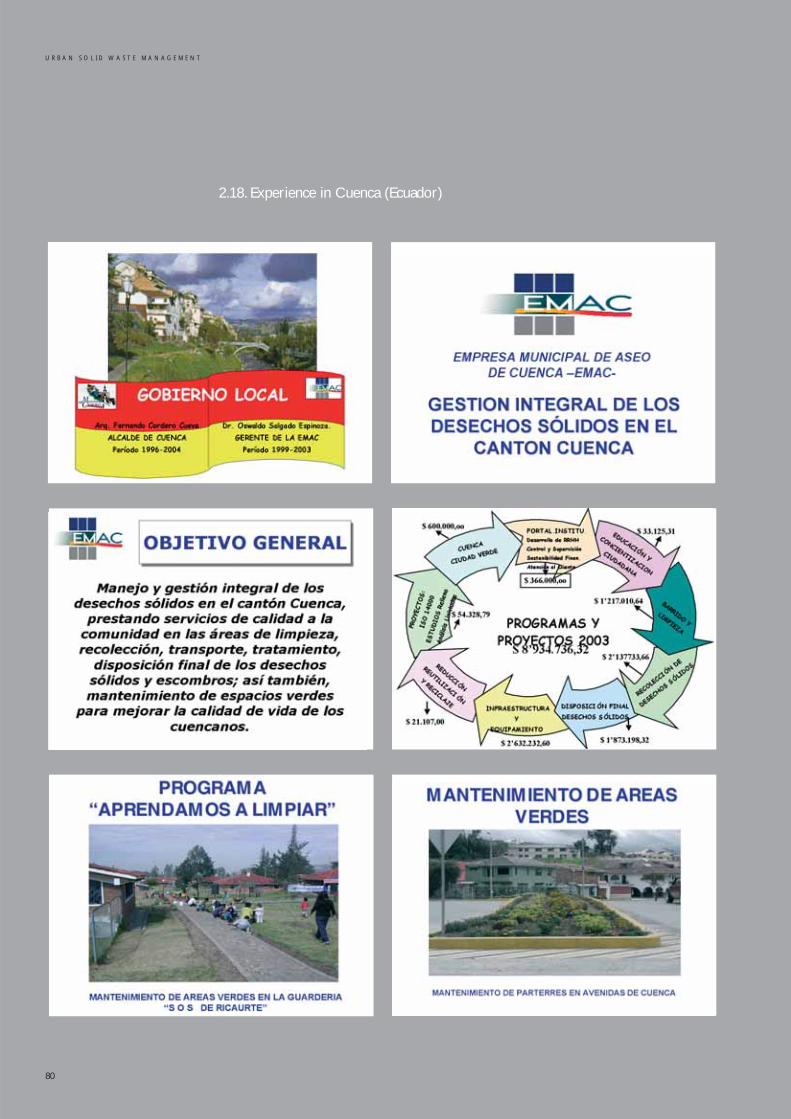
2.18. Experience in Cuenca (Ecuador)
80
U R B A N S O L I D W A S T E M A N A G E M E N T
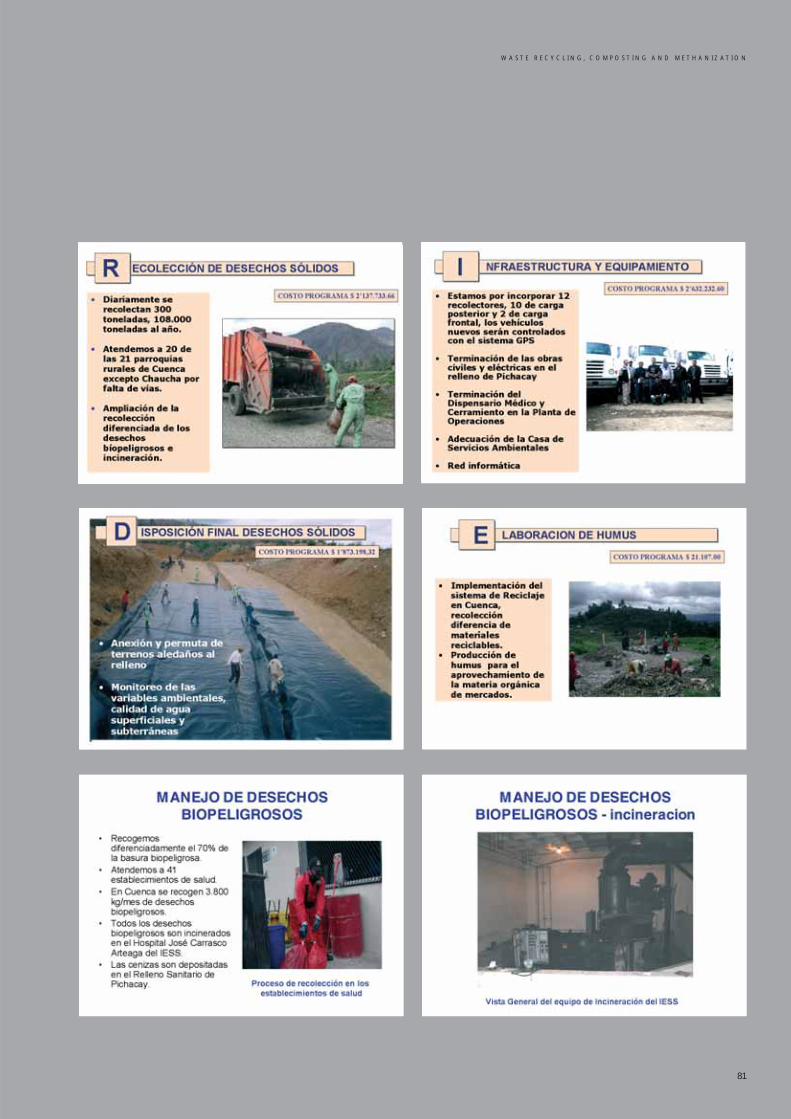
W A S T E R E C Y C L I N G , C O M P O S T I N G A N D M E T H A N I Z A T I O N
81

82
URBAN SOLID WASTE MANAGEMENT
3.Waste Incineration and Controlled Dumping
3. Waste Incineration and Controlled Dumping . . . . . . . . . . . . . . . . . . . . . . . . . . . . . . . . . . . . . . . . . . . . . . . . . . . . . . . . . . . . . . . . . . . . . . . . . . . . . . 85
3.1. Thermal Treatment of Waste . . . . . . . . . . . . . . . . . . . . . . . . . . . . . . . . . . . . . . . . . . . . . . . . . . . . . . . . . . . . . . . . . . . . . . . . . . . . . . . . . . . . . . . . . . . . . . . . . . . . 85
3.2. Calorific Value of Waste . . . . . . . . . . . . . . . . . . . . . . . . . . . . . . . . . . . . . . . . . . . . . . . . . . . . . . . . . . . . . . . . . . . . . . . . . . . . . . . . . . . . . . . . . . . . . . . . . . . . . . . . . . 86
3.3. Types of Incinerators . . . . . . . . . . . . . . . . . . . . . . . . . . . . . . . . . . . . . . . . . . . . . . . . . . . . . . . . . . . . . . . . . . . . . . . . . . . . . . . . . . . . . . . . . . . . . . . . . . . . . . . . . . . . . . 86
3.4. Incineration of Municipal Waste . . . . . . . . . . . . . . . . . . . . . . . . . . . . . . . . . . . . . . . . . . . . . . . . . . . . . . . . . . . . . . . . . . . . . . . . . . . . . . . . . . . . . . . . . . . . . . . 89
3.5. Incineration of Special Waste . . . . . . . . . . . . . . . . . . . . . . . . . . . . . . . . . . . . . . . . . . . . . . . . . . . . . . . . . . . . . . . . . . . . . . . . . . . . . . . . . . . . . . . . . . . . . . . . . . . 90
3.6. Incineration of Sanitary Waste . . . . . . . . . . . . . . . . . . . . . . . . . . . . . . . . . . . . . . . . . . . . . . . . . . . . . . . . . . . . . . . . . . . . . . . . . . . . . . . . . . . . . . . . . . . . . . . . . . 90
3.7. Legislation Governing Waste Incineration . . . . . . . . . . . . . . . . . . . . . . . . . . . . . . . . . . . . . . . . . . . . . . . . . . . . . . . . . . . . . . . . . . . . . . . . . . . . . . . . . . 91
3.8. From Dumps to Sanitary Landfills . . . . . . . . . . . . . . . . . . . . . . . . . . . . . . . . . . . . . . . . . . . . . . . . . . . . . . . . . . . . . . . . . . . . . . . . . . . . . . . . . . . . . . . . . . . . 92
3.9. Basic Principles of a Sanitary Landfill . . . . . . . . . . . . . . . . . . . . . . . . . . . . . . . . . . . . . . . . . . . . . . . . . . . . . . . . . . . . . . . . . . . . . . . . . . . . . . . . . . . . . . . . 93
3.10 Geological Bases and Preparation of the Controlled Dump Basin . . . . . . . . . . . . . . . . . . . . . . . . . . . . . . . . . . . . . . . . . . . . . . . . . . . 95
3.11. Dump Infrastructures . . . . . . . . . . . . . . . . . . . . . . . . . . . . . . . . . . . . . . . . . . . . . . . . . . . . . . . . . . . . . . . . . . . . . . . . . . . . . . . . . . . . . . . . . . . . . . . . . . . . . . . . . . . . . 98
3.12. Operating a Controlled Dump . . . . . . . . . . . . . . . . . . . . . . . . . . . . . . . . . . . . . . . . . . . . . . . . . . . . . . . . . . . . . . . . . . . . . . . . . . . . . . . . . . . . . . . . . . . . . . . 101
3.13. Closing a Controlled Dump. . . . . . . . . . . . . . . . . . . . . . . . . . . . . . . . . . . . . . . . . . . . . . . . . . . . . . . . . . . . . . . . . . . . . . . . . . . . . . . . . . . . . . . . . . . . . . . . . . . 101
3.14. Dump Management and Control in Post-Closure Period . . . . . . . . . . . . . . . . . . . . . . . . . . . . . . . . . . . . . . . . . . . . . . . . . . . . . . . . . . . . 103
3.15. Dump Costs and Bonds . . . . . . . . . . . . . . . . . . . . . . . . . . . . . . . . . . . . . . . . . . . . . . . . . . . . . . . . . . . . . . . . . . . . . . . . . . . . . . . . . . . . . . . . . . . . . . . . . . . . . . . . 104
3.16. Waste Admission Criteria . . . . . . . . . . . . . . . . . . . . . . . . . . . . . . . . . . . . . . . . . . . . . . . . . . . . . . . . . . . . . . . . . . . . . . . . . . . . . . . . . . . . . . . . . . . . . . . . . . . . . . 105
3.17. Experience in State of Mexico . . . . . . . . . . . . . . . . . . . . . . . . . . . . . . . . . . . . . . . . . . . . . . . . . . . . . . . . . . . . . . . . . . . . . . . . . . . . . . . . . . . . . . . . . . . . . . . 106
3.18. Experience in Quito (Ecuador) . . . . . . . . . . . . . . . . . . . . . . . . . . . . . . . . . . . . . . . . . . . . . . . . . . . . . . . . . . . . . . . . . . . . . . . . . . . . . . . . . . . . . . . . . . . . . . 108
84
INDEX
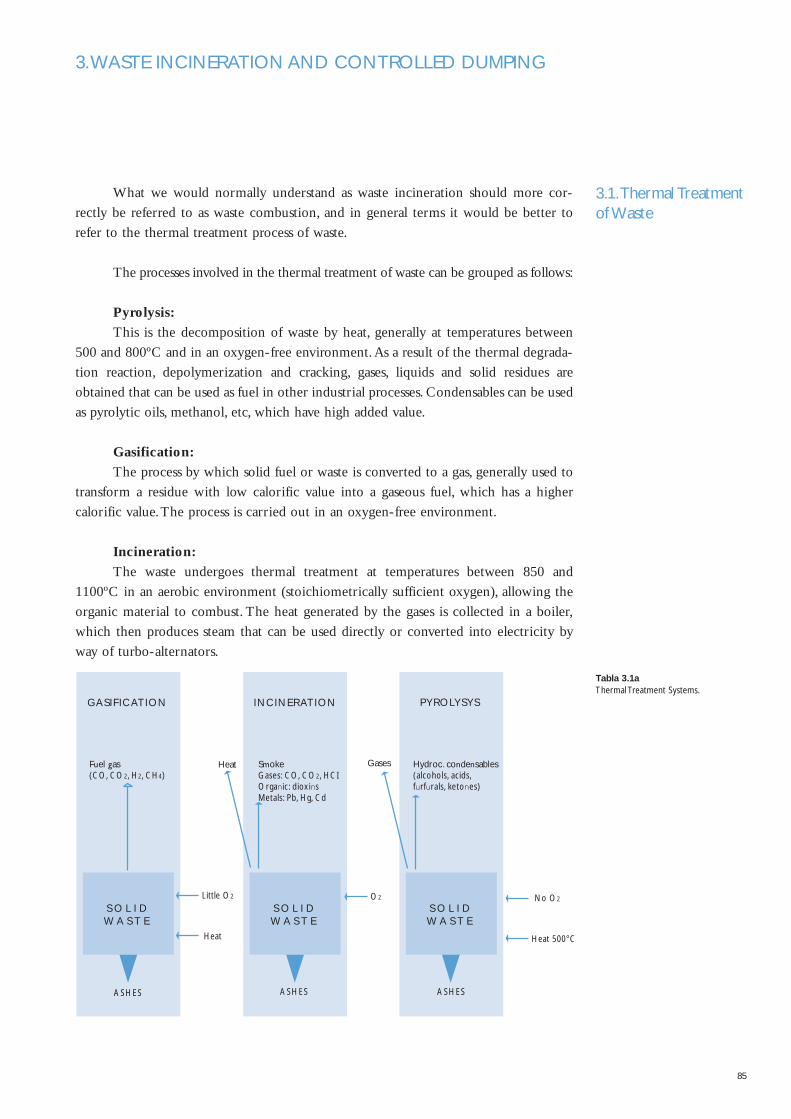
85
What we would normally understand as waste incineration should more cor-
rectly be referred to as waste combustion, and in general terms it would be better to
refer to the thermal treatment process of waste.
The processes involved in the thermal treatment of waste can be grouped as follows:
Pyrolysis:
This is the decomposition of waste by heat, generally at temperatures between
500 and 800ºC and in an oxygen-free environment.As a result of the thermal degrada-
tion reaction, depolymerization and cracking, gases, liquids and solid residues are
obtained that can be used as fuel in other industrial processes. Condensables can be used
as pyrolytic oils, methanol, etc, which have high added value.
Gasification:
The process by which solid fuel or waste is converted to a gas, generally used to
transform a residue with low calorific value into a gaseous fuel, which has a higher
calorific value.The process is carried out in an oxygen-free environment.
Incineration:
The waste undergoes thermal treatment at temperatures between 850 and
1100ºC in an aerobic environment (stoichiometrically sufficient oxygen), allowing the
organic material to combust. The heat generated by the gases is collected in a boiler,
which then produces steam that can be used directly or converted into electricity by
way of turbo-alternators.
3.1.Thermal Treatment of Waste
Tabla 3.1aThermal Treatment Systems.
3.WASTE INCINERATION AND CONTROLLED DUMPING
S O L I DW A S T E
ASHES
O2
Heat SmokeGases: CO, CO2, HCIOrganic: dioxinsMetals: Pb, Hg, Cd
ASHES
S O L I DW A S T E
Little O2
Heat
Fuel gas(CO, CO2, H2, CH4)
S O L I DW A S T E
ASHES
Hydroc. condensables(alcohols, acids, furfurals, ketones)
Gases
GASIFICATION INCINERATION PYROLYSYS
No O2
Heat 500°C
3.2. Calorific Value of Waste
3.3.Types of Incinerators
Combustion of a residue should generate sufficient thermal energy so that the
process propagates without the need for large quantities of extra fuel.This is why a low
calorific value is desired in order to maintain constant combustion.
High calorific value (HCV):
Obtained experimentally by burning fuel in a calorimetric bomb, where the
combustion products remain at room temperature and the steam produced condenses
whereby transferring the heat from the condensation (598 kcal/kg) to the water in the
calorimeter.
Low calorific value (LCV):
Calculated on the basis of the HCV and including the heat released by the con-
densation of the water.The LCV is the closest value to reality and represents the calo-
rific value of the fuel.
LCV = HCV – 5.98. H kcal/kg
LCV = HCV – 24.45. H kJ/kg
H = % water (moisture) content of residue.
If LCV is less than 2,200 kcal/kg, a pretreatment is required to concentrate the
waste into combustible components (dry, segregate, inerts, etc.). For a LCV between
2,000 and 8,500 kcal, the waste can be incinerated, sometimes with extra fuel to assist
the process (at the start). If the LCV is higher than 8,500 kcal/kg, the waste can be con-
sidered a fuel with regard to its calorific potential.
Depending on the type of waste to be incinerated, there are several types of fur-
naces available, some of which are:
Fixed Chamber Incinerator (Liquid Injection Incinerator):
Used only for liquid or gaseous waste that has a low content of inert material.
Can be used in small-sized plants that do not have continuous shifts, stopping the equip-
ment periodically to remove the inert substances from the chamber. Liquid waste is
pumped into the unit through spray nozzles, so that the small droplets react more readily
with oxygen.
Rotary Kiln Incinerator:
The main feature is the rotating cylinder that is lined with heat resistant material
inside. It turns slowly (at a rate of 1-5 revolutions an hour) and at a slight angle there-
by moving the waste around.The gases go to a post-combustion chamber to ensure that
the combustion is completed, while the ash and the inert material (slag) exit through
the end of the cylinder.
86
U R B A N S O L I D W A S T E M A N A G E M E N T
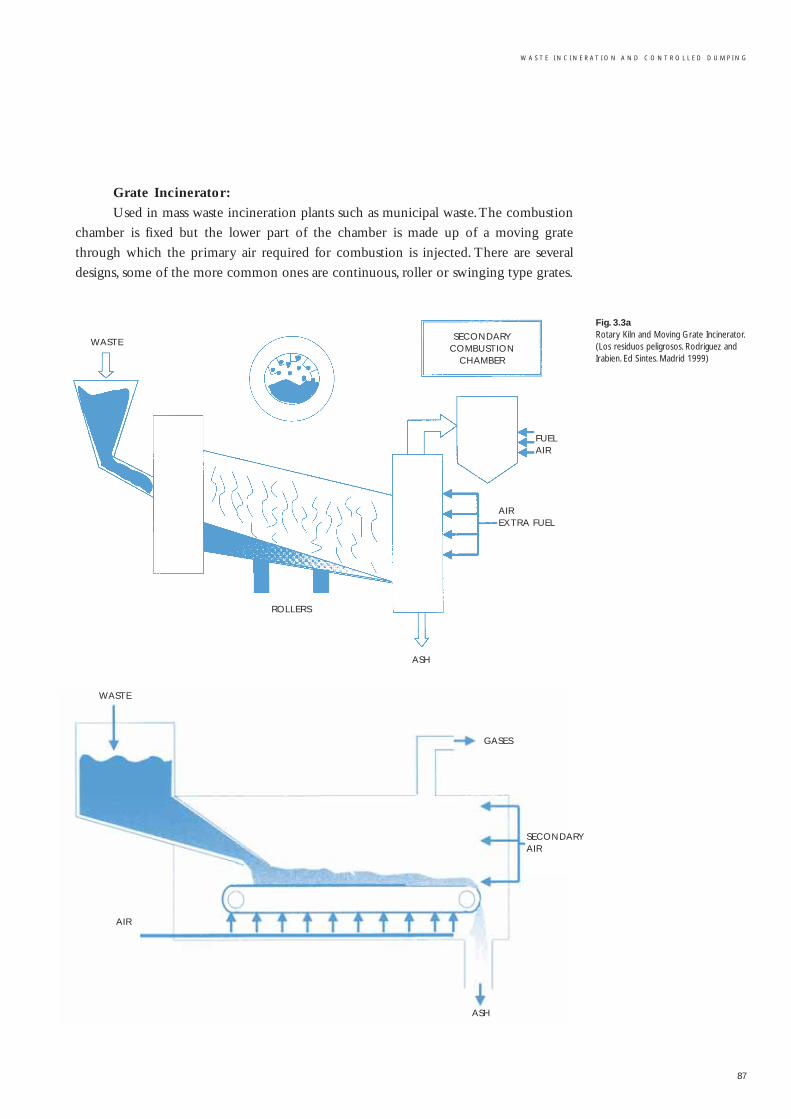
W A S T E I N C I N E R A T I O N A N D C O N T R O L L E D D U M P I N G
87
Grate Incinerator:
Used in mass waste incineration plants such as municipal waste.The combustion
chamber is fixed but the lower part of the chamber is made up of a moving grate
through which the primary air required for combustion is injected. There are several
designs, some of the more common ones are continuous, roller or swinging type grates.
Fig. 3.3aRotary Kiln and Moving Grate Incinerator.(Los residuos peligrosos. Rodriguez andIrabien. Ed Sintes. Madrid 1999)
WASTESECONDARY
COMBUSTIONCHAMBER
ROLLERS
ASH
FUELAIR
AIREXTRA FUEL
WASTE
ASH
SECONDARYAIR
GASES
AIR
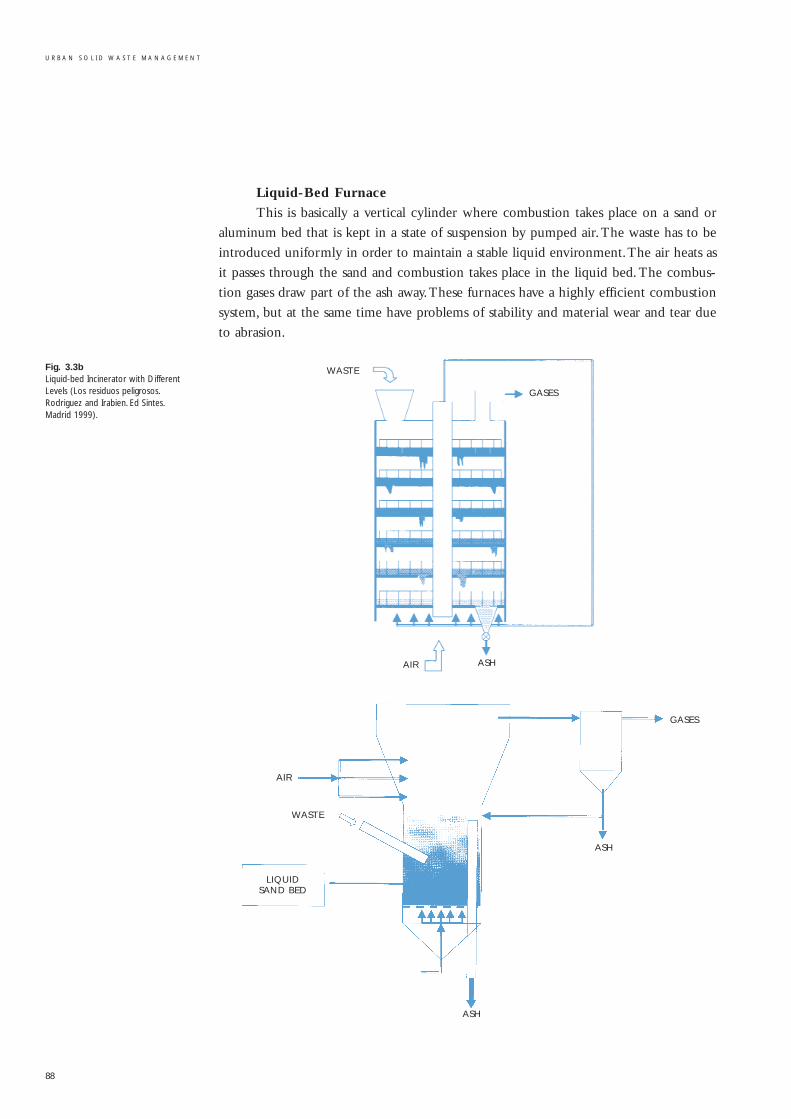
Fig. 3.3bLiquid-bed Incinerator with DifferentLevels (Los residuos peligrosos.Rodriguez and Irabien. Ed Sintes.Madrid 1999).
Liquid-Bed Furnace
This is basically a vertical cylinder where combustion takes place on a sand or
aluminum bed that is kept in a state of suspension by pumped air.The waste has to be
introduced uniformly in order to maintain a stable liquid environment.The air heats as
it passes through the sand and combustion takes place in the liquid bed. The combus-
tion gases draw part of the ash away.These furnaces have a highly efficient combustion
system, but at the same time have problems of stability and material wear and tear due
to abrasion.
88
U R B A N S O L I D W A S T E M A N A G E M E N T
WASTE
ASH
GASES
AIR
WASTE
ASH
GASES
AIR
ASH
LIQUIDSAND BED
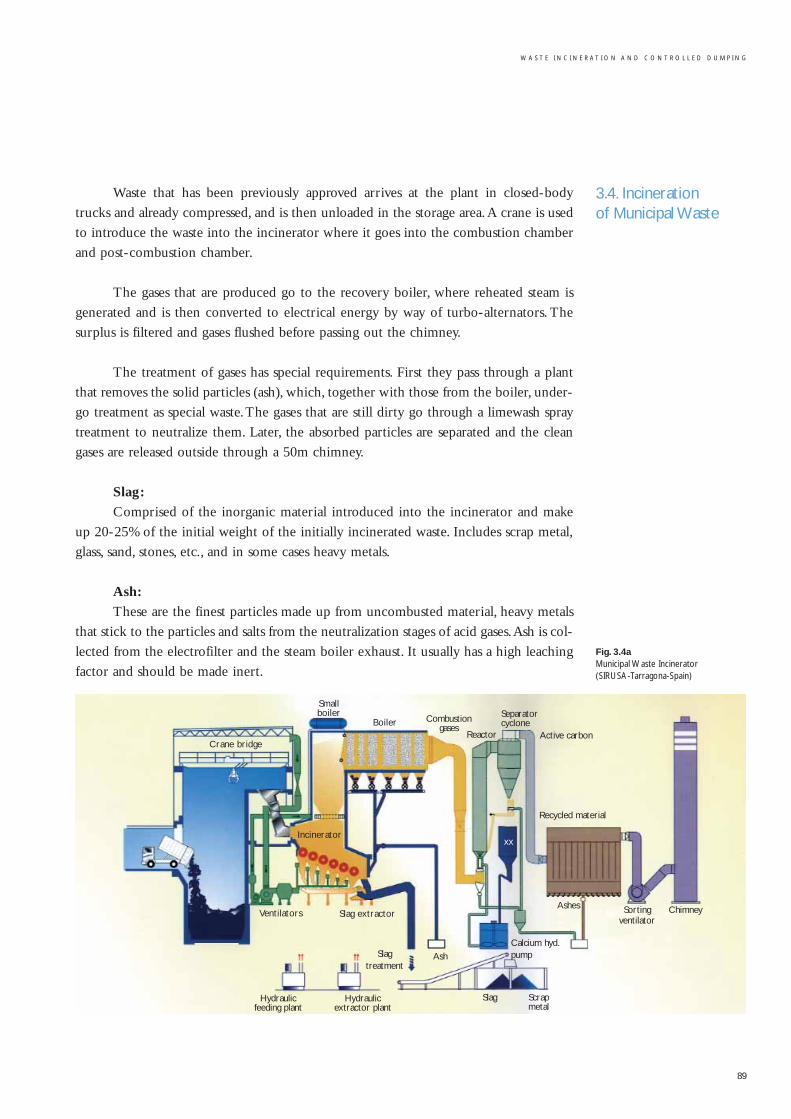
W A S T E I N C I N E R A T I O N A N D C O N T R O L L E D D U M P I N G
89
Waste that has been previously approved arrives at the plant in closed-body
trucks and already compressed, and is then unloaded in the storage area.A crane is used
to introduce the waste into the incinerator where it goes into the combustion chamber
and post-combustion chamber.
The gases that are produced go to the recovery boiler, where reheated steam is
generated and is then converted to electrical energy by way of turbo-alternators. The
surplus is filtered and gases flushed before passing out the chimney.
The treatment of gases has special requirements. First they pass through a plant
that removes the solid particles (ash), which, together with those from the boiler, under-
go treatment as special waste.The gases that are still dirty go through a limewash spray
treatment to neutralize them. Later, the absorbed particles are separated and the clean
gases are released outside through a 50m chimney.
Slag:
Comprised of the inorganic material introduced into the incinerator and make
up 20-25% of the initial weight of the initially incinerated waste. Includes scrap metal,
glass, sand, stones, etc., and in some cases heavy metals.
Ash:
These are the finest particles made up from uncombusted material, heavy metals
that stick to the particles and salts from the neutralization stages of acid gases.Ash is col-
lected from the electrofilter and the steam boiler exhaust. It usually has a high leaching
factor and should be made inert.
3.4. Incineration of Municipal Waste
Fig. 3.4aMunicipal Waste Incinerator(SIRUSA-Tarragona-Spain)
Crane bridge
Smallboiler
Boiler
Ventilators Slag extractor
Incinerator
Slag treatment
Hydraulicfeeding plant
Hydraulicextractor plant
Ash
Slag Scrapmetal
Combustiongases
Reactor Active carbon
Recycled material
xx
Calcium hyd.pump
Separatorcyclone
Ashes Sortingventilator
Chimney
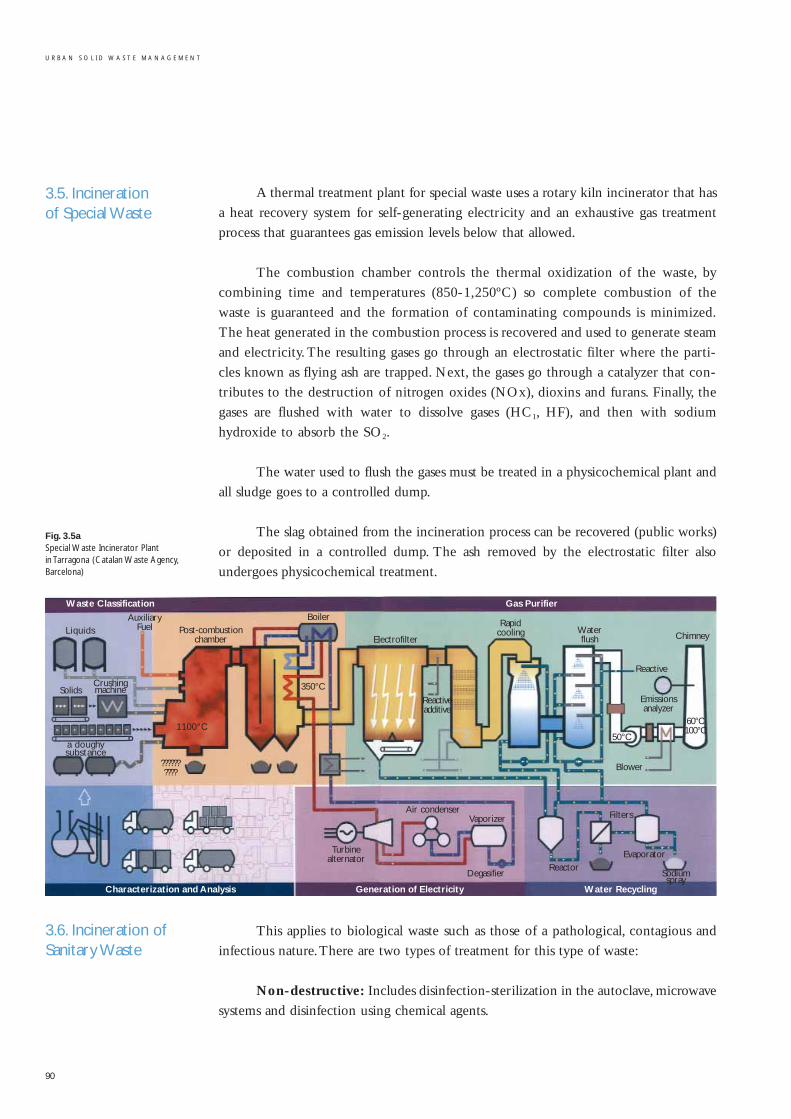
3.5. Incineration of Special Waste
Fig. 3.5aSpecial Waste Incinerator Plant in Tarragona (Catalan Waste Agency,Barcelona)
3.6. Incineration ofSanitary Waste
A thermal treatment plant for special waste uses a rotary kiln incinerator that has
a heat recovery system for self-generating electricity and an exhaustive gas treatment
process that guarantees gas emission levels below that allowed.
The combustion chamber controls the thermal oxidization of the waste, by
combining time and temperatures (850-1,250ºC) so complete combustion of the
waste is guaranteed and the formation of contaminating compounds is minimized.
The heat generated in the combustion process is recovered and used to generate steam
and electricity. The resulting gases go through an electrostatic filter where the parti-
cles known as flying ash are trapped. Next, the gases go through a catalyzer that con-
tributes to the destruction of nitrogen oxides (NOx), dioxins and furans. Finally, the
gases are flushed with water to dissolve gases (HC1, HF), and then with sodium
hydroxide to absorb the SO2.
The water used to flush the gases must be treated in a physicochemical plant and
all sludge goes to a controlled dump.
The slag obtained from the incineration process can be recovered (public works)
or deposited in a controlled dump. The ash removed by the electrostatic filter also
undergoes physicochemical treatment.
This applies to biological waste such as those of a pathological, contagious and
infectious nature.There are two types of treatment for this type of waste:
Non-destructive: Includes disinfection-sterilization in the autoclave, microwave
systems and disinfection using chemical agents.
90
U R B A N S O L I D W A S T E M A N A G E M E N T
Liquids
Solids
a doughy substance
Crushingmachine
1100°C
??????????
Post-combustionchamber
AuxiliaryFuel
Boiler
350°C
Electrofilter
Reactiveadditive
Rapidcooling Water
flush
Reactive
Chimney
Blower
50°C
60°C100°C
Emissionsanalyzer
Turbine alternator
Air condenserVaporizer
DegasifierReactor
Filters
Evaporator
Sodiumspray
Waste Classification Gas Purifier
Water RecyclingGeneration of ElectricityCharacterization and Analysis
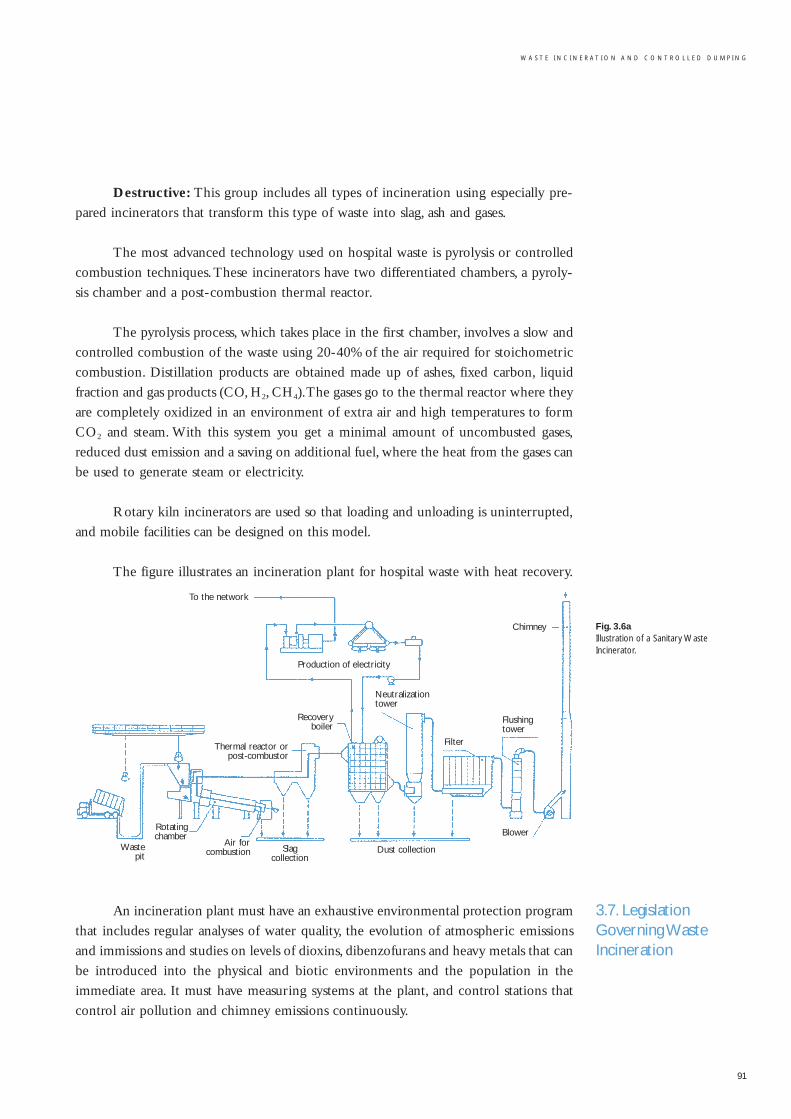
W A S T E I N C I N E R A T I O N A N D C O N T R O L L E D D U M P I N G
91
Destructive: This group includes all types of incineration using especially pre-
pared incinerators that transform this type of waste into slag, ash and gases.
The most advanced technology used on hospital waste is pyrolysis or controlled
combustion techniques.These incinerators have two differentiated chambers, a pyroly-
sis chamber and a post-combustion thermal reactor.
The pyrolysis process, which takes place in the first chamber, involves a slow and
controlled combustion of the waste using 20-40% of the air required for stoichometric
combustion. Distillation products are obtained made up of ashes, fixed carbon, liquid
fraction and gas products (CO, H2, CH4).The gases go to the thermal reactor where they
are completely oxidized in an environment of extra air and high temperatures to form
CO2 and steam. With this system you get a minimal amount of uncombusted gases,
reduced dust emission and a saving on additional fuel, where the heat from the gases can
be used to generate steam or electricity.
Rotary kiln incinerators are used so that loading and unloading is uninterrupted,
and mobile facilities can be designed on this model.
The figure illustrates an incineration plant for hospital waste with heat recovery.
An incineration plant must have an exhaustive environmental protection program
that includes regular analyses of water quality, the evolution of atmospheric emissions
and immissions and studies on levels of dioxins, dibenzofurans and heavy metals that can
be introduced into the physical and biotic environments and the population in the
immediate area. It must have measuring systems at the plant, and control stations that
control air pollution and chimney emissions continuously.
Fig. 3.6a Illustration of a Sanitary WasteIncinerator.
3.7. LegislationGoverning WasteIncineration
To the network
Chimney
BlowerRotatingchamber
Air forcombustion Slag
collectionDust collectionWaste
pit
Thermal reactor orpost-combustor
Recoveryboiler
Neutralizationtower
Filter
Flushingtower
Production of electricity
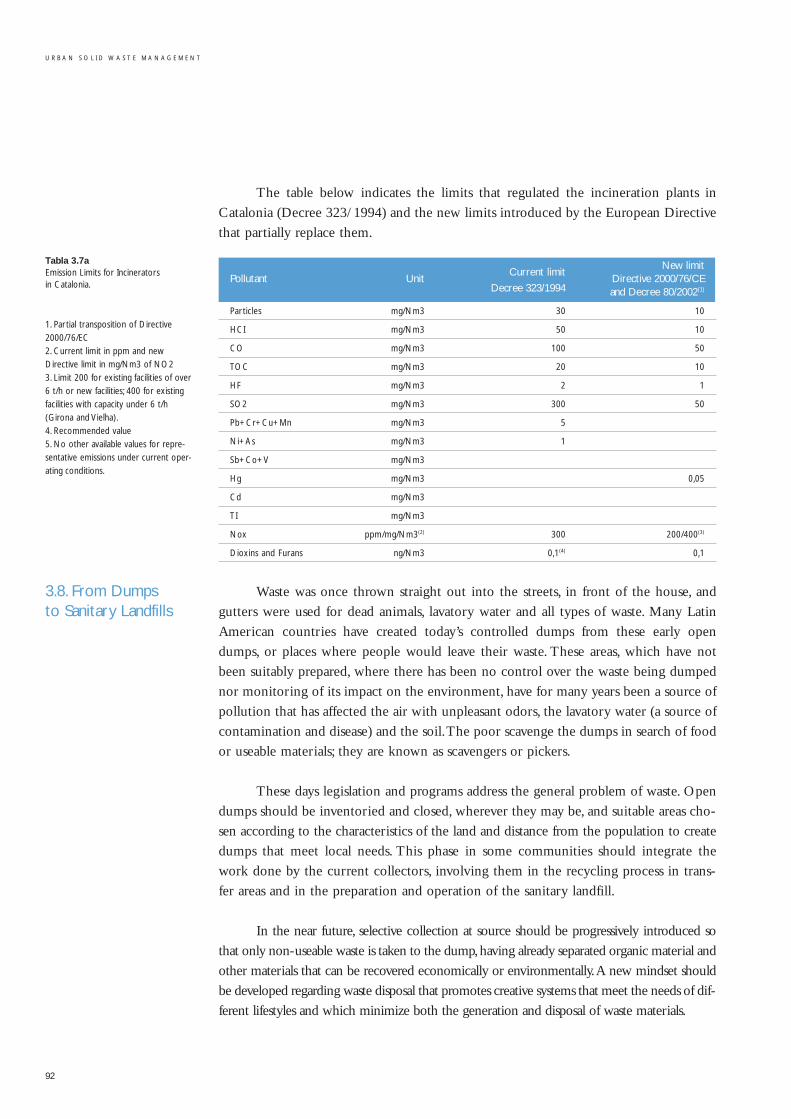
Tabla 3.7aEmission Limits for Incinerators in Catalonia.
1. Partial transposition of Directive2000/76/EC2. Current limit in ppm and newDirective limit in mg/Nm3 of NO23. Limit 200 for existing facilities of over6 t/h or new facilities; 400 for existingfacilities with capacity under 6 t/h(Girona and Vielha).4. Recommended value5. No other available values for repre-sentative emissions under current oper-ating conditions.
3.8. From Dumps to Sanitary Landfills
The table below indicates the limits that regulated the incineration plants in
Catalonia (Decree 323/1994) and the new limits introduced by the European Directive
that partially replace them.
Pollutant UnitCurrent limit
New limit
Decree 323/1994Directive 2000/76/CEand Decree 80/2002(1)
Particles mg/Nm3 30 10
HCI mg/Nm3 50 10
CO mg/Nm3 100 50
TOC mg/Nm3 20 10
HF mg/Nm3 2 1
SO2 mg/Nm3 300 50
Pb+Cr+Cu+Mn mg/Nm3 5
Ni+As mg/Nm3 1
Sb+Co+V mg/Nm3
Hg mg/Nm3 0,05
Cd mg/Nm3
TI mg/Nm3
Nox ppm/mg/Nm3(2) 300 200/400(3)
Dioxins and Furans ng/Nm3 0,1(4) 0,1
Waste was once thrown straight out into the streets, in front of the house, and
gutters were used for dead animals, lavatory water and all types of waste. Many Latin
American countries have created today’s controlled dumps from these early open
dumps, or places where people would leave their waste. These areas, which have not
been suitably prepared, where there has been no control over the waste being dumped
nor monitoring of its impact on the environment, have for many years been a source of
pollution that has affected the air with unpleasant odors, the lavatory water (a source of
contamination and disease) and the soil.The poor scavenge the dumps in search of food
or useable materials; they are known as scavengers or pickers.
These days legislation and programs address the general problem of waste. Open
dumps should be inventoried and closed, wherever they may be, and suitable areas cho-
sen according to the characteristics of the land and distance from the population to create
dumps that meet local needs. This phase in some communities should integrate the
work done by the current collectors, involving them in the recycling process in trans-
fer areas and in the preparation and operation of the sanitary landfill.
In the near future, selective collection at source should be progressively introduced so
that only non-useable waste is taken to the dump,having already separated organic material and
other materials that can be recovered economically or environmentally.A new mindset should
be developed regarding waste disposal that promotes creative systems that meet the needs of dif-
ferent lifestyles and which minimize both the generation and disposal of waste materials.
92
U R B A N S O L I D W A S T E M A N A G E M E N T
W A S T E I N C I N E R A T I O N A N D C O N T R O L L E D D U M P I N G
93
We will address controlled waste disposal facilities (sanitary landfills) for waste
that cannot be recovered or that comes from recovery or treatment operations.
Due to their potential to pollute, these areas must be conditioned to prevent any
contamination of soil, water resources or air.
Currently there are thoughts of recovering the energy produced by the biogas
released from the fermentation of organic material that is disposed, and depending on
the situation, the future possibility of extracting disposed materials in order to recover
them.
A controlled dump is a large chemical reactor where there is interaction
between the waste materials and rainwater, with processes that can last from seconds to
many decades, producing mineralized compounds (solids), leachates (liquids) and bio-
gas (gas).
The Disposal of Waste
Conventional systems involve spreading the new incoming waste over an area and
then covering it with a layer of soil, creating alternating layers.
Controlled dumps require insulation of the land below the waste layer, and clay
drainage areas and vegetable soil on top.They must be sealed at the end of their use-
ful lives.
Leachates
Leachates are the result of the reaction and dissolution of the soluble compounds
in the waste with the added water or the moisture contained in the waste itself.
To guarantee that the leachates do not pollute underground water resources, the
controlled dump must first be insulated and have in place a collection system for the
leachates, comprised of gravel or sand, for its subsequent treatment.
Clay makes good insulating material and, because of its characteristic chemical
composition, can also act as a filter to trap heavy metals. Other materials commonly
used for insulating are high-density polyurethane and bentonite.
Gases
The decomposition of organic matter produces gases such as nitrogen (N2), car-
bon dioxide (CO2), methane (CH4), and in smaller amounts, carbon monoxide (CO)
and others. In general there are gas drainage systems in place in the way of metallic tubes
filled with gravel or similar materials.There is also an energy recovery system that col-
lects the gas (biogas) and uses it to generate electricity.
3.9. Basic Principles of a Sanitary Landfill
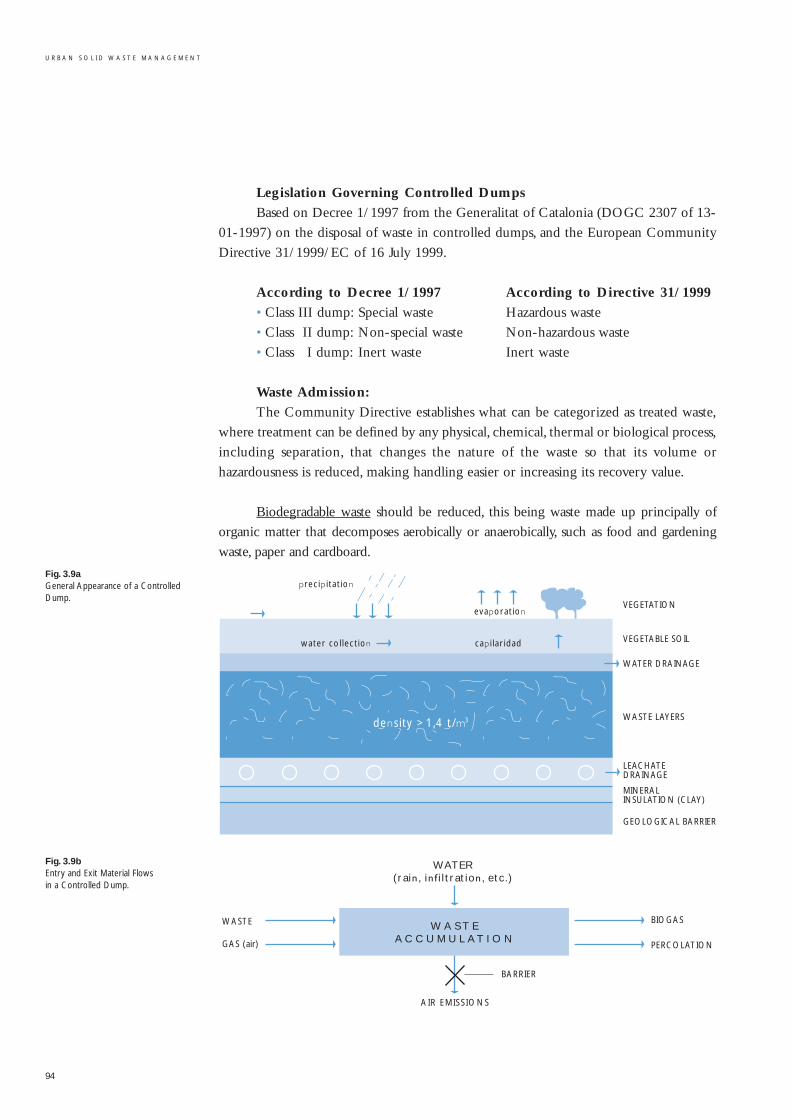
Fig. 3.9aGeneral Appearance of a ControlledDump.
Fig. 3.9bEntry and Exit Material Flows in a Controlled Dump.
Legislation Governing Controlled Dumps
Based on Decree 1/1997 from the Generalitat of Catalonia (DOGC 2307 of 13-
01-1997) on the disposal of waste in controlled dumps, and the European Community
Directive 31/1999/EC of 16 July 1999.
According to Decree 1/1997 According to Directive 31/1999
• Class III dump: Special waste Hazardous waste
• Class II dump: Non-special waste Non-hazardous waste
• Class I dump: Inert waste Inert waste
Waste Admission:
The Community Directive establishes what can be categorized as treated waste,
where treatment can be defined by any physical, chemical, thermal or biological process,
including separation, that changes the nature of the waste so that its volume or
hazardousness is reduced, making handling easier or increasing its recovery value.
Biodegradable waste should be reduced, this being waste made up principally of
organic matter that decomposes aerobically or anaerobically, such as food and gardening
waste, paper and cardboard.
94
U R B A N S O L I D W A S T E M A N A G E M E N T
VEGETATION
VEGETABLE SOIL
WATER DRAINAGE
WASTE LAYERS
LEACHATEDRAINAGE
MINERALINSULATION (CLAY)
GEOLOGICAL BARRIER
precip i tat ion
water col lection cap i lar idad
evaporation
3density >1,4 t/m
W A S T EA C C U M U L A T I O N
AIR EMISSIONS
BARRIER
WATER(ra in , inf i l trat ion , etc . )
WASTE
GAS (air) PERCOLATION
BIOGAS
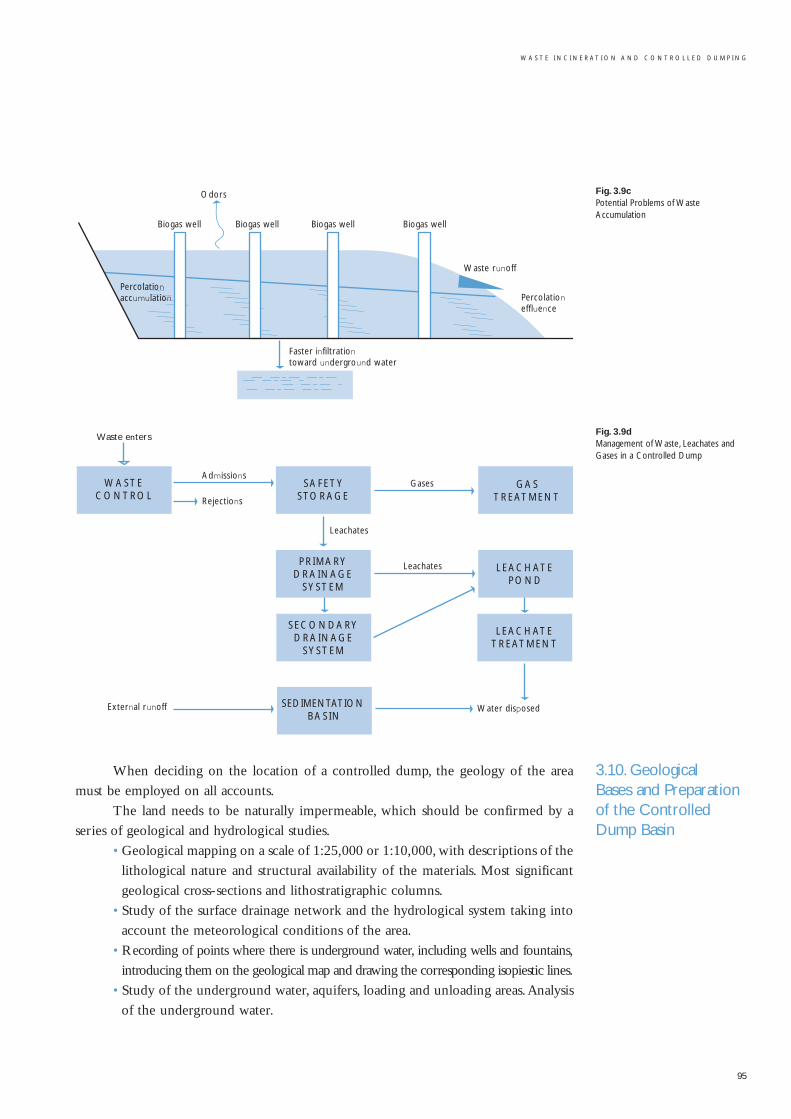
W A S T E I N C I N E R A T I O N A N D C O N T R O L L E D D U M P I N G
95
When deciding on the location of a controlled dump, the geology of the area
must be employed on all accounts.
The land needs to be naturally impermeable, which should be confirmed by a
series of geological and hydrological studies.
• Geological mapping on a scale of 1:25,000 or 1:10,000, with descriptions of the
lithological nature and structural availability of the materials. Most significant
geological cross-sections and lithostratigraphic columns.
• Study of the surface drainage network and the hydrological system taking into
account the meteorological conditions of the area.
• Recording of points where there is underground water, including wells and fountains,
introducing them on the geological map and drawing the corresponding isopiestic lines.
• Study of the underground water, aquifers, loading and unloading areas.Analysis
of the underground water.
Fig. 3.9cPotential Problems of WasteAccumulation
Fig. 3.9dManagement of Waste, Leachates andGases in a Controlled Dump
3.10. Geological Bases and Preparationof the ControlledDump Basin
WASTECONTROL
Waste enters
SAFETYSTORAGE
GASTREATMENT
PRIMARYDRAINAGE
SYSTEM
Rejections
AdmissionsGases
Leachates
LEACHATEPOND
Water disposed
Leachates
SECONDARYDRAINAGE
SYSTEM
LEACHATETREATMENT
SEDIMENTATIONBASIN
External runoff
Odors
Biogas well
Waste runoff
Percolationeffluence
Biogas wellBiogas wellBiogas well
Percolationaccumulation
Faster infiltrationtoward underground water
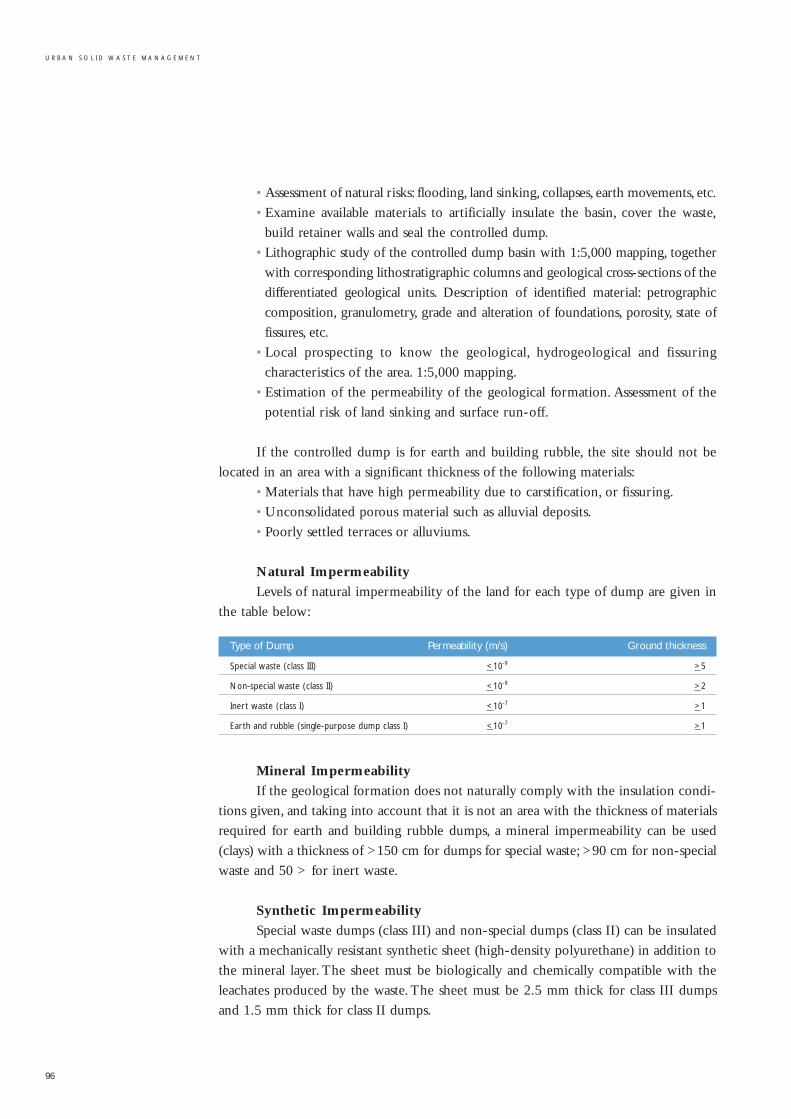
• Assessment of natural risks: flooding, land sinking, collapses, earth movements, etc.
• Examine available materials to artificially insulate the basin, cover the waste,
build retainer walls and seal the controlled dump.
• Lithographic study of the controlled dump basin with 1:5,000 mapping, together
with corresponding lithostratigraphic columns and geological cross-sections of the
differentiated geological units. Description of identified material: petrographic
composition, granulometry, grade and alteration of foundations, porosity, state of
fissures, etc.
• Local prospecting to know the geological, hydrogeological and fissuring
characteristics of the area. 1:5,000 mapping.
• Estimation of the permeability of the geological formation. Assessment of the
potential risk of land sinking and surface run-off.
If the controlled dump is for earth and building rubble, the site should not be
located in an area with a significant thickness of the following materials:
• Materials that have high permeability due to carstification, or fissuring.
• Unconsolidated porous material such as alluvial deposits.
• Poorly settled terraces or alluviums.
Natural Impermeability
Levels of natural impermeability of the land for each type of dump are given in
the table below:
Type of Dump Permeability (m/s) Ground thickness
Special waste (class III) <10-9 >5
Non-special waste (class II) <10-9 >2
Inert waste (class I) <10-7 >1
Earth and rubble (single-purpose dump class I) <10-7 >1
Mineral Impermeability
If the geological formation does not naturally comply with the insulation condi-
tions given, and taking into account that it is not an area with the thickness of materials
required for earth and building rubble dumps, a mineral impermeability can be used
(clays) with a thickness of >150 cm for dumps for special waste; >90 cm for non-special
waste and 50 > for inert waste.
Synthetic Impermeability
Special waste dumps (class III) and non-special dumps (class II) can be insulated
with a mechanically resistant synthetic sheet (high-density polyurethane) in addition to
the mineral layer. The sheet must be biologically and chemically compatible with the
leachates produced by the waste. The sheet must be 2.5 mm thick for class III dumps
and 1.5 mm thick for class II dumps.
96
U R B A N S O L I D W A S T E M A N A G E M E N T
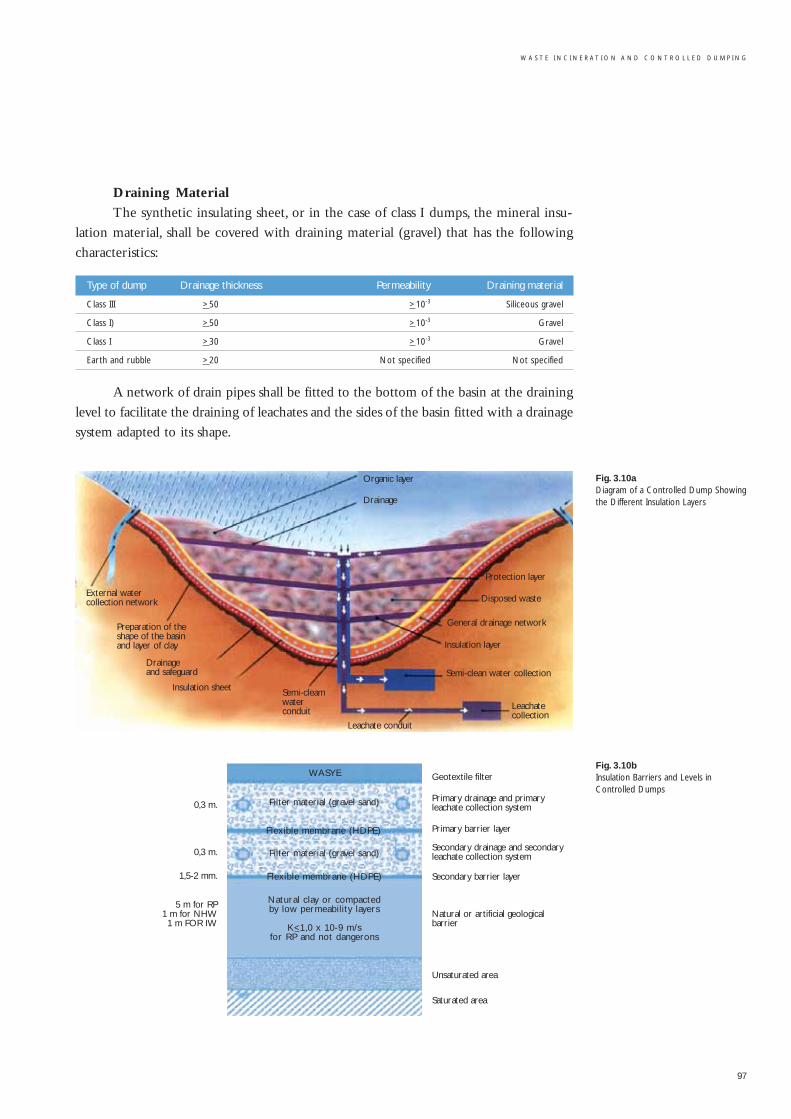
W A S T E I N C I N E R A T I O N A N D C O N T R O L L E D D U M P I N G
97
Draining Material
The synthetic insulating sheet, or in the case of class I dumps, the mineral insu-
lation material, shall be covered with draining material (gravel) that has the following
characteristics:
Type of dump Drainage thickness Permeability Draining material
Class III >50 >10-3 Siliceous gravel
Class I) >50 >10-3 Gravel
Class I >30 >10-3 Gravel
Earth and rubble >20 Not specified Not specified
A network of drain pipes shall be fitted to the bottom of the basin at the draining
level to facilitate the draining of leachates and the sides of the basin fitted with a drainage
system adapted to its shape.
Fig. 3.10a Diagram of a Controlled Dump Showingthe Different Insulation Layers
Fig. 3.10b Insulation Barriers and Levels inControlled Dumps
Organic layer
Drainage
External water collection network
Preparation of the shape of the basinand layer of clay
Drainage and safeguard
Insulation sheet Semi-cleamwater conduit
Leachate conduit
Leachatecollection
Semi-clean water collection
Protection layer
Disposed waste
General drainage network
Insulation layer
WASYE
Filter material (gravel sand)
Flexible membrane (HDPE)
Filter material (gravel sand)
Flexible membrane (HDPE)
Natural clay or compactedby low permeability layers
K<1,0 x 10⁻⁹ m/s for RP and not dangerons
Geotextile filter
Primary drainage and primaryleachate collection system
Primary barrier layer
Secondary drainage and secondaryleachate collection system
Secondary barrier layer
Natural or artificial geologicalbarrier
Unsaturated area
Saturated area
0,3 m.
0,3 m.
1,5-2 mm.
5 m for RP1 m for NHW1 m FOR IW
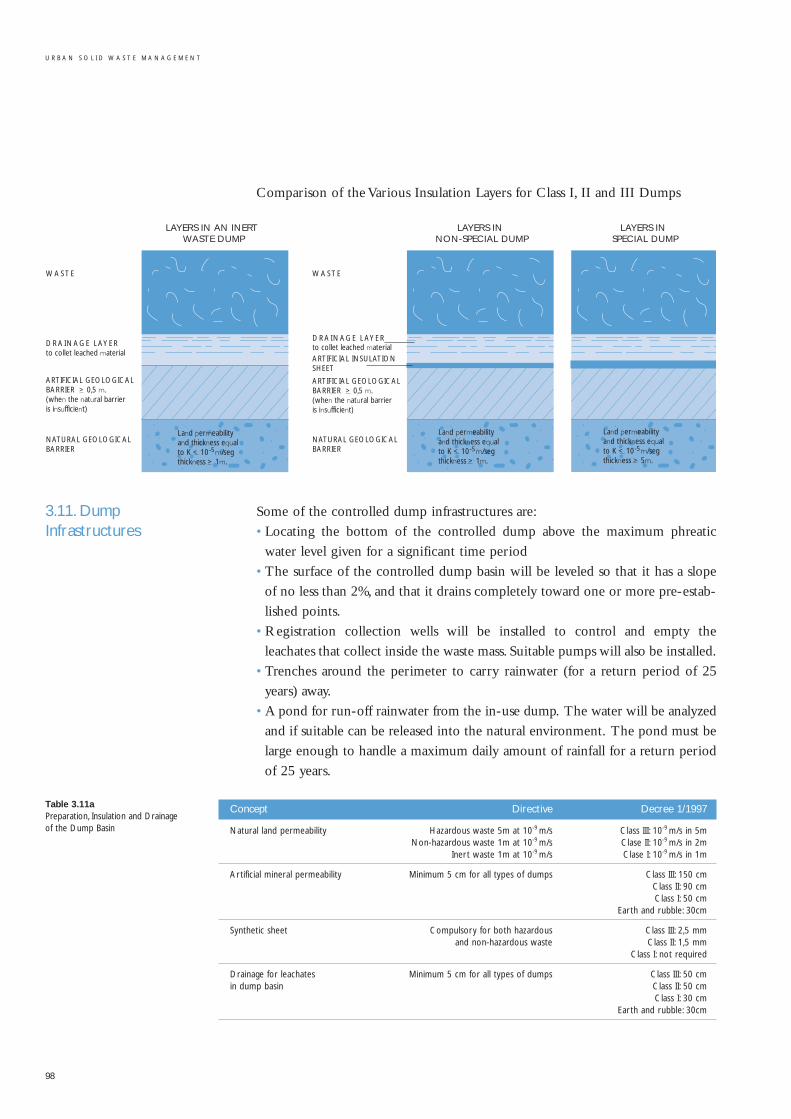
3.11. DumpInfrastructures
Table 3.11aPreparation, Insulation and Drainage of the Dump Basin
Comparison of the Various Insulation Layers for Class I, II and III Dumps
Some of the controlled dump infrastructures are:
• Locating the bottom of the controlled dump above the maximum phreatic
water level given for a significant time period
• The surface of the controlled dump basin will be leveled so that it has a slope
of no less than 2%, and that it drains completely toward one or more pre-estab-
lished points.
• Registration collection wells will be installed to control and empty the
leachates that collect inside the waste mass. Suitable pumps will also be installed.
• Trenches around the perimeter to carry rainwater (for a return period of 25
years) away.
• A pond for run-off rainwater from the in-use dump. The water will be analyzed
and if suitable can be released into the natural environment. The pond must be
large enough to handle a maximum daily amount of rainfall for a return period
of 25 years.
Concept Directive Decree 1/1997
Natural land permeability Hazardous waste 5m at 10-9 m/s Class III: 10-9 m/s in 5m Non-hazardous waste 1m at 10-9 m/s Clase II: 10-9 m/s in 2m
Inert waste 1m at 10-9 m/s Clase I: 10-9 m/s in 1m
Artificial mineral permeability Minimum 5 cm for all types of dumps Class III: 150 cmClass II: 90 cmClass I: 50 cm
Earth and rubble: 30cm
Synthetic sheet Compulsory for both hazardous Class III: 2,5 mmand non-hazardous waste Class II: 1,5 mm
Class I: not required
Drainage for leachates Minimum 5 cm for all types of dumps Class III: 50 cmin dump basin Class II: 50 cm
Class I: 30 cmEarth and rubble: 30cm
98
U R B A N S O L I D W A S T E M A N A G E M E N T
WASTE
DRAINAGE LAYERto collet leached material
ARTIFICIAL GEOLOGICALBARRIER > 0,5 m.(when the natural barrieris insufficient)
NATURAL GEOLOGICALBARRIER
WASTE
DRAINAGE LAYERto collet leached material
ARTIFICIAL GEOLOGICALBARRIER > 0,5 m.(when the natural barrieris insufficient)
NATURAL GEOLOGICALBARRIER
ARTIFICIAL INSULATIONSHEET
-5
Land permeability and thickness equal to K < 10 m/segthickness > 1m.
-5
Land permeability and thickness equal to K < 10 m/segthickness > 1m.
-5
Land permeability and thickness equal to K < 10 m/segthickness > 5m.
LAYERS IN AN INERT WASTE DUMP
LAYERS IN NON-SPECIAL DUMP
LAYERS IN SPECIAL DUMP
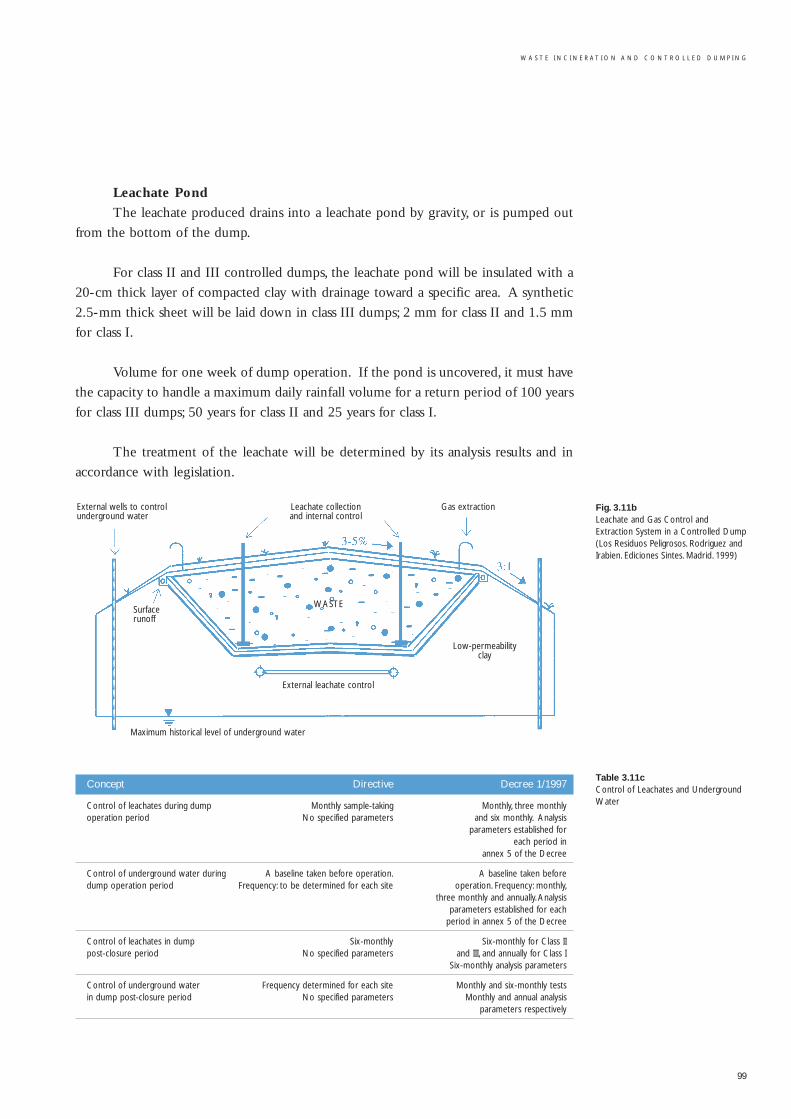
W A S T E I N C I N E R A T I O N A N D C O N T R O L L E D D U M P I N G
99
Leachate Pond
The leachate produced drains into a leachate pond by gravity, or is pumped out
from the bottom of the dump.
For class II and III controlled dumps, the leachate pond will be insulated with a
20-cm thick layer of compacted clay with drainage toward a specific area. A synthetic
2.5-mm thick sheet will be laid down in class III dumps; 2 mm for class II and 1.5 mm
for class I.
Volume for one week of dump operation. If the pond is uncovered, it must have
the capacity to handle a maximum daily rainfall volume for a return period of 100 years
for class III dumps; 50 years for class II and 25 years for class I.
The treatment of the leachate will be determined by its analysis results and in
accordance with legislation.
Concept Directive Decree 1/1997
Control of leachates during dump Monthly sample-taking Monthly, three monthlyoperation period No specified parameters and six monthly. Analysis
parameters established foreach period in
annex 5 of the Decree
Control of underground water during A baseline taken before operation. A baseline taken beforedump operation period Frequency: to be determined for each site operation. Frequency: monthly,
three monthly and annually. Analysisparameters established for each
period in annex 5 of the Decree
Control of leachates in dump Six-monthly Six-monthly for Class IIpost-closure period No specified parameters and III, and annually for Class I
Six-monthly analysis parameters
Control of underground water Frequency determined for each site Monthly and six-monthly testsin dump post-closure period No specified parameters Monthly and annual analysis
parameters respectively
Fig. 3.11b Leachate and Gas Control andExtraction System in a Controlled Dump(Los Residuos Peligrosos. Rodriguez andIrabien. Ediciones Sintes. Madrid. 1999)
Table 3.11cControl of Leachates and UndergroundWater
Maximum historical level of underground water
External leachate control
WASTE
Low-permeabilityclay
Gas extractionLeachate collection and internal control
External wells to controlunderground water
Surfacerunoff
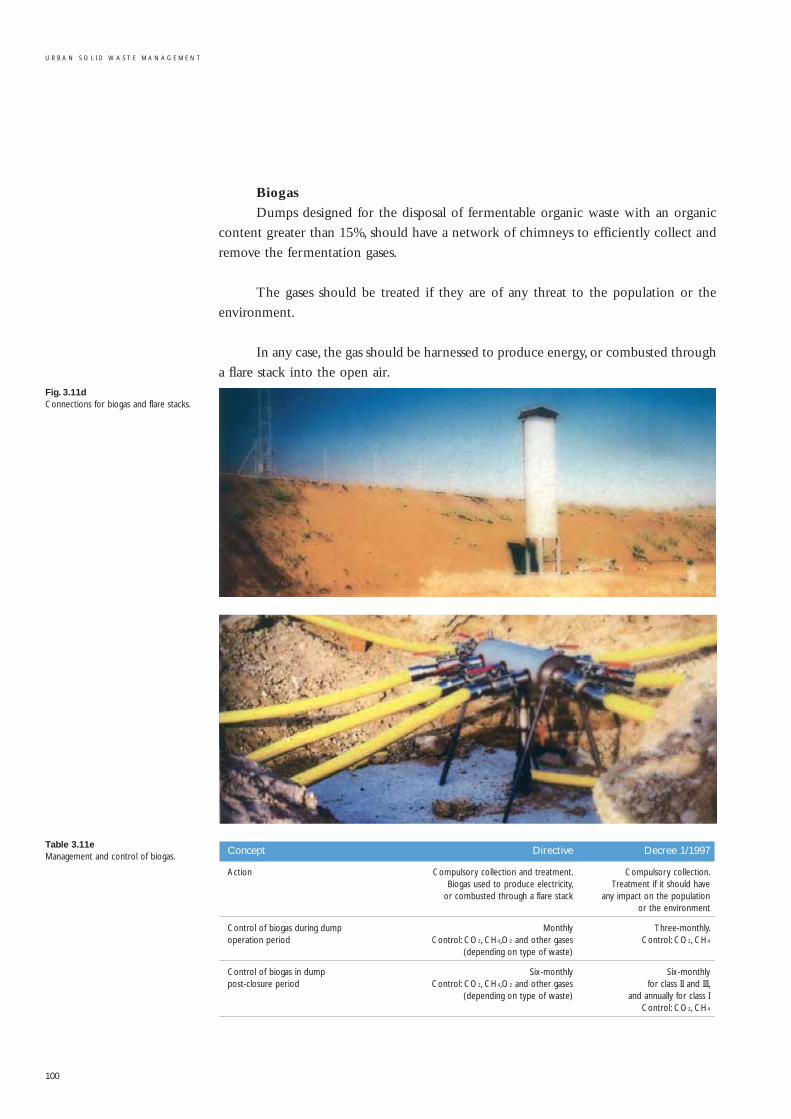
Fig. 3.11d Connections for biogas and flare stacks.
Table 3.11eManagement and control of biogas.
Biogas
Dumps designed for the disposal of fermentable organic waste with an organic
content greater than 15%, should have a network of chimneys to efficiently collect and
remove the fermentation gases.
The gases should be treated if they are of any threat to the population or the
environment.
In any case, the gas should be harnessed to produce energy, or combusted through
a flare stack into the open air.
100
U R B A N S O L I D W A S T E M A N A G E M E N T
Concept Directive Decree 1/1997
Action Compulsory collection and treatment. Compulsory collection.Biogas used to produce electricity, Treatment if it should have
or combusted through a flare stack any impact on the populationor the environment
Control of biogas during dump Monthly Three-monthly.operation period Control: CO2, CH4,O2 and other gases Control: CO2, CH4
(depending on type of waste)
Control of biogas in dump Six-monthly Six-monthlypost-closure period Control: CO2, CH4,O2 and other gases for class II and III,
(depending on type of waste) and annually for class IControl: CO2, CH4
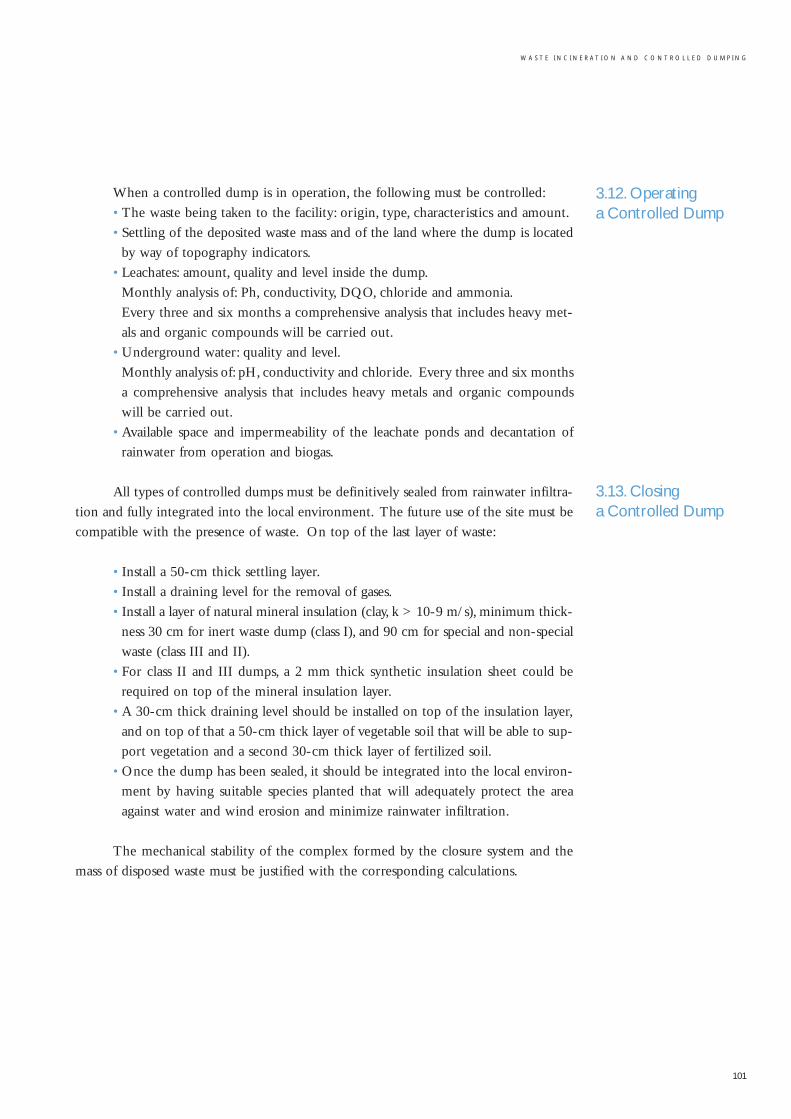
W A S T E I N C I N E R A T I O N A N D C O N T R O L L E D D U M P I N G
101
When a controlled dump is in operation, the following must be controlled:
• The waste being taken to the facility: origin, type, characteristics and amount.
• Settling of the deposited waste mass and of the land where the dump is located
by way of topography indicators.
• Leachates: amount, quality and level inside the dump.
Monthly analysis of: Ph, conductivity, DQO, chloride and ammonia.
Every three and six months a comprehensive analysis that includes heavy met-
als and organic compounds will be carried out.
• Underground water: quality and level.
Monthly analysis of: pH, conductivity and chloride. Every three and six months
a comprehensive analysis that includes heavy metals and organic compounds
will be carried out.
• Available space and impermeability of the leachate ponds and decantation of
rainwater from operation and biogas.
All types of controlled dumps must be definitively sealed from rainwater infiltra-
tion and fully integrated into the local environment. The future use of the site must be
compatible with the presence of waste. On top of the last layer of waste:
• Install a 50-cm thick settling layer.
• Install a draining level for the removal of gases.
• Install a layer of natural mineral insulation (clay, k > 10-9 m/s), minimum thick-
ness 30 cm for inert waste dump (class I), and 90 cm for special and non-special
waste (class III and II).
• For class II and III dumps, a 2 mm thick synthetic insulation sheet could be
required on top of the mineral insulation layer.
• A 30-cm thick draining level should be installed on top of the insulation layer,
and on top of that a 50-cm thick layer of vegetable soil that will be able to sup-
port vegetation and a second 30-cm thick layer of fertilized soil.
• Once the dump has been sealed, it should be integrated into the local environ-
ment by having suitable species planted that will adequately protect the area
against water and wind erosion and minimize rainwater infiltration.
The mechanical stability of the complex formed by the closure system and the
mass of disposed waste must be justified with the corresponding calculations.
3.12. Operating a Controlled Dump
3.13. Closing a Controlled Dump
Fig. 3.13a Closing a Controlled Dump
Fig. 3.13b General Appearance of a Sealed Dump(Conveco, Italy)
102
U R B A N S O L I D W A S T E M A N A G E M E N T
Possible biogas energy-recoveryinstallation
Vegetation, species adaptedto environment
Fertilized soil, 30 cmVegetable soil, 50 cm
Geotextile sheet
Draining layer, 30 cm
Synthetic sheet, HDPE
Compact clay barrier layer, 30 cmfor class I and 90 cm for classes IIand III.
Draining layer for gas collection
Sub-base, 50 cm
WASTE
Biogras extraction and flare stack installation
Biogas collectionnetwork
Biogas collectionnetwork
Leachate collectiontank
Top layer soil
Impermeablemembrane
Well for controlof water undermembrane
Sand
Membrane
Leachate drainage
Gravel
Membrane
Clay
Lowerdrainage
Leachate collection well
Drainage under membrane
Leachate drainagenetwork
Biogas collectionwells
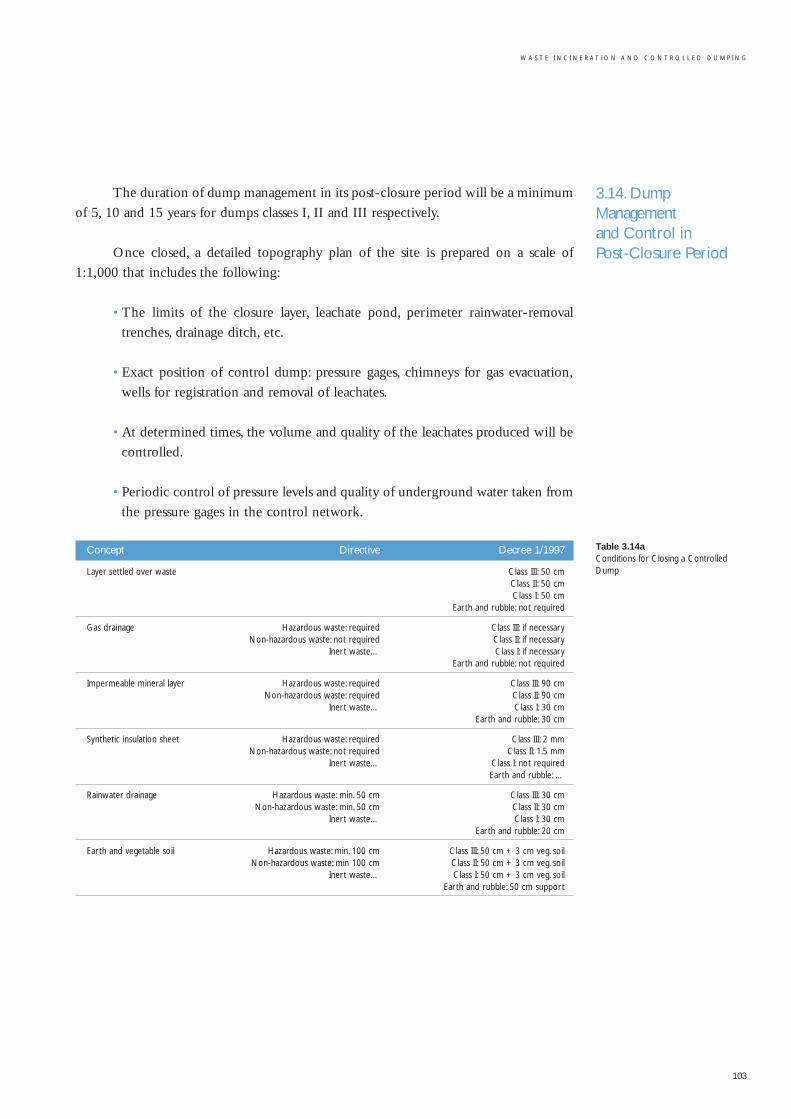
W A S T E I N C I N E R A T I O N A N D C O N T R O L L E D D U M P I N G
103
The duration of dump management in its post-closure period will be a minimum
of 5, 10 and 15 years for dumps classes I, II and III respectively.
Once closed, a detailed topography plan of the site is prepared on a scale of
1:1,000 that includes the following:
• The limits of the closure layer, leachate pond, perimeter rainwater-removal
trenches, drainage ditch, etc.
• Exact position of control dump: pressure gages, chimneys for gas evacuation,
wells for registration and removal of leachates.
• At determined times, the volume and quality of the leachates produced will be
controlled.
• Periodic control of pressure levels and quality of underground water taken from
the pressure gages in the control network.
Concept Directive Decree 1/1997
Layer settled over waste Class III: 50 cmClass II: 50 cmClass I: 50 cm
Earth and rubble: not required
Gas drainage Hazardous waste: required Class III: if necessaryNon-hazardous waste: not required Class II: if necessary
Inert waste… Class I: if necessaryEarth and rubble: not required
Impermeable mineral layer Hazardous waste: required Class III: 90 cmNon-hazardous waste: required Class II: 90 cm
Inert waste… Class I: 30 cmEarth and rubble: 30 cm
Synthetic insulation sheet Hazardous waste: required Class III: 2 mmNon-hazardous waste: not required Class II: 1.5 mm
Inert waste… Class I: not requiredEarth and rubble: …
Rainwater drainage Hazardous waste: min. 50 cm Class III: 30 cmNon-hazardous waste: min. 50 cm Class II: 30 cm
Inert waste… Class I: 30 cmEarth and rubble: 20 cm
Earth and vegetable soil Hazardous waste: min. 100 cm Class III: 50 cm + 3 cm veg. soilNon-hazardous waste: min 100 cm Class II: 50 cm + 3 cm veg. soil
Inert waste… Class I: 50 cm + 3 cm veg. soilEarth and rubble: 50 cm support
3.14. DumpManagement and Control in Post-Closure Period
Table 3.14a Conditions for Closing a ControlledDump
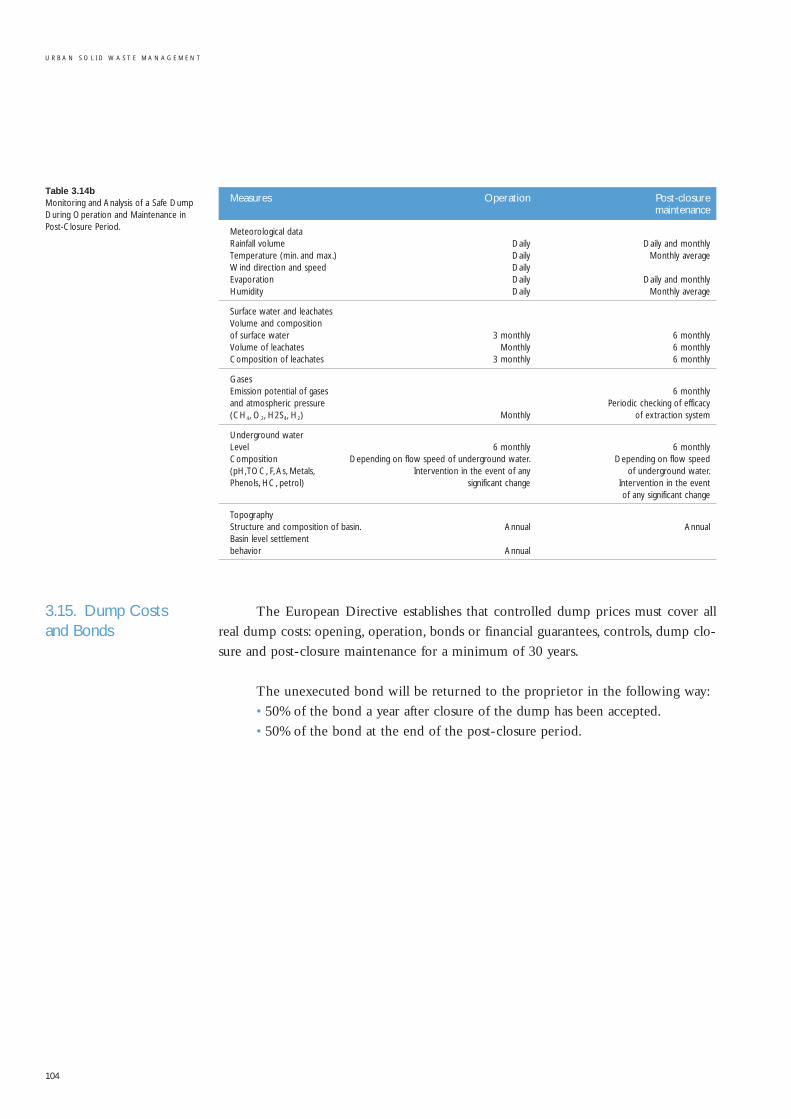
Table 3.14bMonitoring and Analysis of a Safe DumpDuring Operation and Maintenance inPost-Closure Period.
3.15. Dump Costs and Bonds
Measures Operation Post-closure maintenance
Meteorological dataRainfall volume Daily Daily and monthlyTemperature (min. and max.) Daily Monthly averageWind direction and speed DailyEvaporation Daily Daily and monthlyHumidity Daily Monthly average
Surface water and leachatesVolume and compositionof surface water 3 monthly 6 monthlyVolume of leachates Monthly 6 monthlyComposition of leachates 3 monthly 6 monthly
GasesEmission potential of gases 6 monthlyand atmospheric pressure Periodic checking of efficacy(CH4, O2, H2S4, H2) Monthly of extraction system
Underground waterLevel 6 monthly 6 monthlyComposition Depending on flow speed of underground water. Depending on flow speed(pH,TOC, F, As, Metals, Intervention in the event of any of underground water.Phenols, HC, petrol) significant change Intervention in the event
of any significant change
TopographyStructure and composition of basin. Annual AnnualBasin level settlementbehavior Annual
The European Directive establishes that controlled dump prices must cover all
real dump costs: opening, operation, bonds or financial guarantees, controls, dump clo-
sure and post-closure maintenance for a minimum of 30 years.
The unexecuted bond will be returned to the proprietor in the following way:
• 50% of the bond a year after closure of the dump has been accepted.
• 50% of the bond at the end of the post-closure period.
104
U R B A N S O L I D W A S T E M A N A G E M E N T
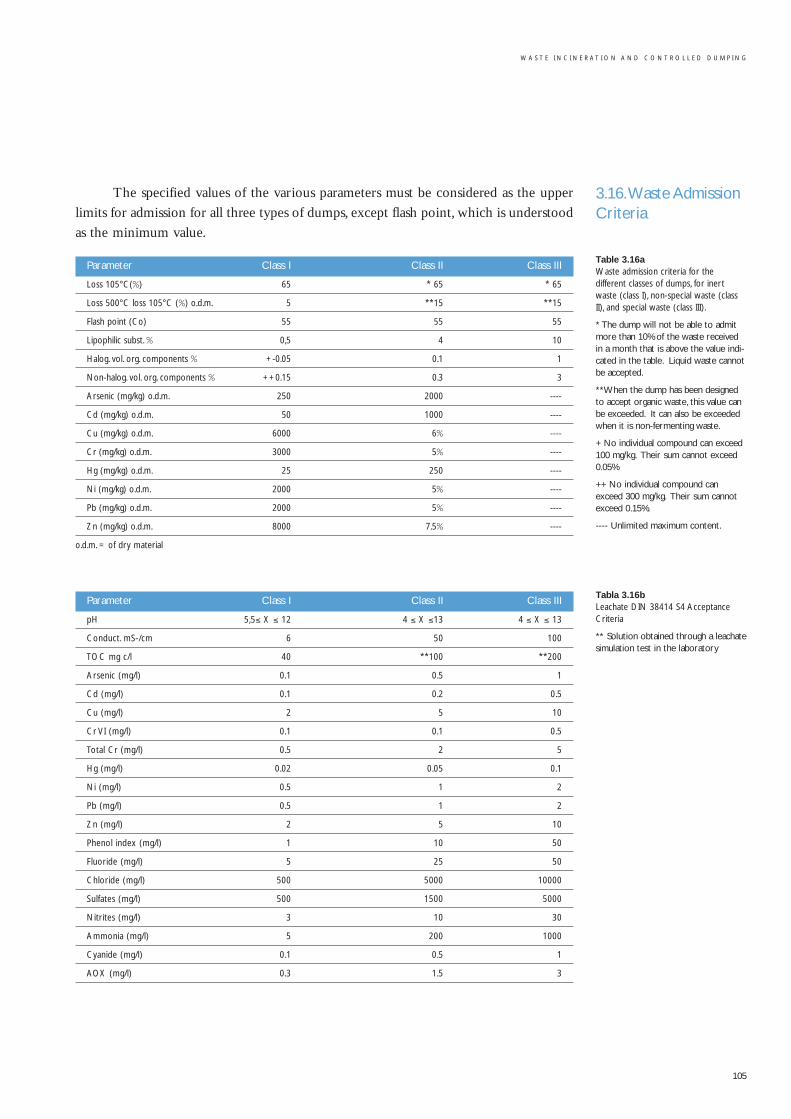
W A S T E I N C I N E R A T I O N A N D C O N T R O L L E D D U M P I N G
105
The specified values of the various parameters must be considered as the upper
limits for admission for all three types of dumps, except flash point, which is understood
as the minimum value.
Parameter Class I Class II Class III
Loss 105°C(%) 65 * 65 * 65
Loss 500°C loss 105°C (%) o.d.m. 5 **15 **15
Flash point (Co) 55 55 55
Lipophilic subst. % 0,5 4 10
Halog. vol. org. components % +-0.05 0.1 1
Non-halog. vol. org. components % ++0.15 0.3 3
Arsenic (mg/kg) o.d.m. 250 2000 ----
Cd (mg/kg) o.d.m. 50 1000 ----
Cu (mg/kg) o.d.m. 6000 6% ----
Cr (mg/kg) o.d.m. 3000 5% ----
Hg (mg/kg) o.d.m. 25 250 ----
Ni (mg/kg) o.d.m. 2000 5% ----
Pb (mg/kg) o.d.m. 2000 5% ----
Zn (mg/kg) o.d.m. 8000 7.5% ----
o.d.m. = of dry material
Parameter Class I Class II Class III
pH 5,5≤ X ≤ 12 4 ≤ X ≤13 4 ≤ X ≤ 13
Conduct. mS-/cm 6 50 100
TOC mg c/l 40 **100 **200
Arsenic (mg/l) 0.1 0.5 1
Cd (mg/l) 0.1 0.2 0.5
Cu (mg/l) 2 5 10
Cr VI (mg/l) 0.1 0.1 0.5
Total Cr (mg/l) 0.5 2 5
Hg (mg/l) 0.02 0.05 0.1
Ni (mg/l) 0.5 1 2
Pb (mg/l) 0.5 1 2
Zn (mg/l) 2 5 10
Phenol index (mg/l) 1 10 50
Fluoride (mg/l) 5 25 50
Chloride (mg/l) 500 5000 10000
Sulfates (mg/l) 500 1500 5000
Nitrites (mg/l) 3 10 30
Ammonia (mg/l) 5 200 1000
Cyanide (mg/l) 0.1 0.5 1
AOX (mg/l) 0.3 1.5 3
3.16.Waste AdmissionCriteria
Table 3.16a Waste admission criteria for the different classes of dumps, for inertwaste (class I), non-special waste (classII), and special waste (class III).
* The dump will not be able to admitmore than 10% of the waste receivedin a month that is above the value indi-cated in the table. Liquid waste cannotbe accepted.
**When the dump has been designedto accept organic waste, this value canbe exceeded. It can also be exceededwhen it is non-fermenting waste.
+ No individual compound can exceed100 mg/kg. Their sum cannot exceed0.05%
++ No individual compound canexceed 300 mg/kg. Their sum cannotexceed 0.15%.
---- Unlimited maximum content.
Tabla 3.16b Leachate DIN 38414 S4 AcceptanceCriteria
** Solution obtained through a leachatesimulation test in the laboratory
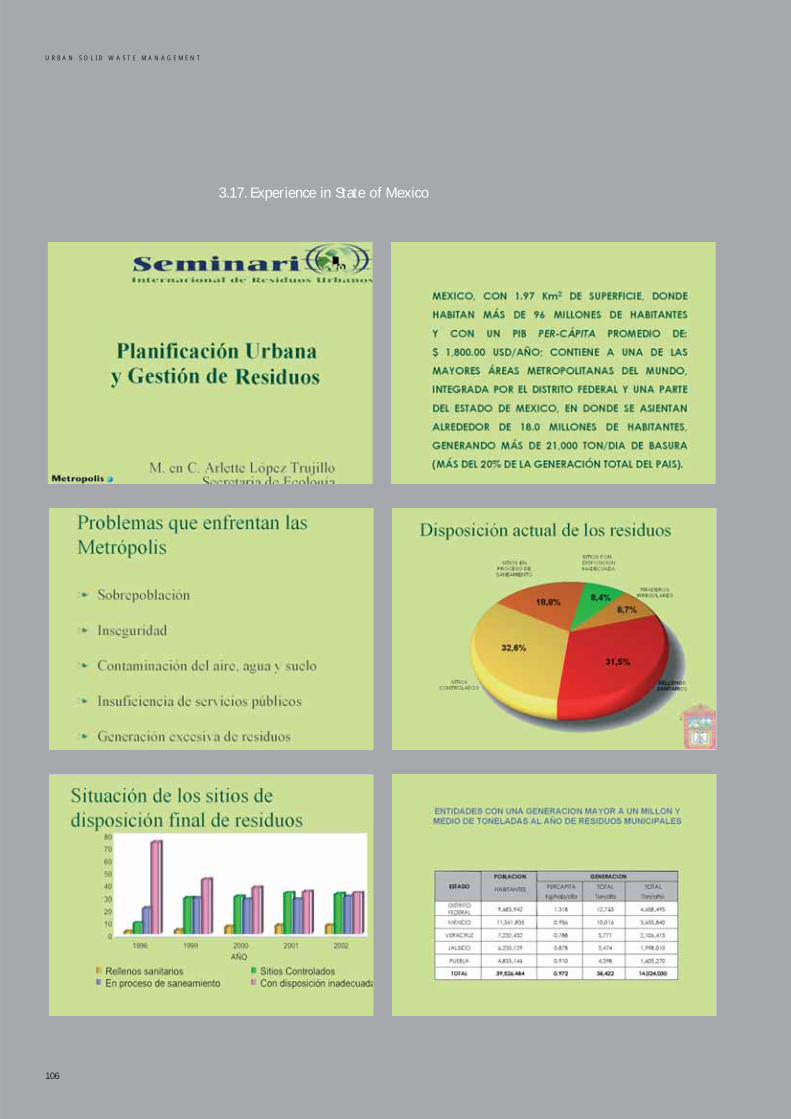
3.17. Experience in State of Mexico
106
U R B A N S O L I D W A S T E M A N A G E M E N T
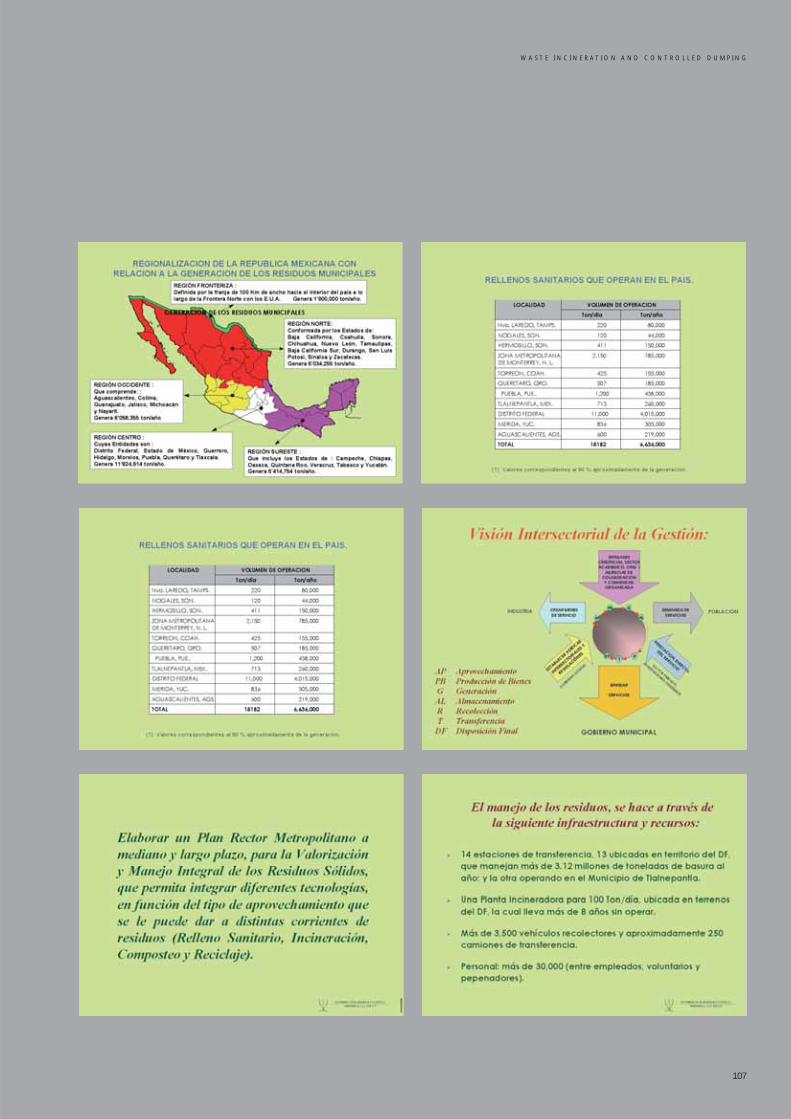
W A S T E I N C I N E R A T I O N A N D C O N T R O L L E D D U M P I N G
107
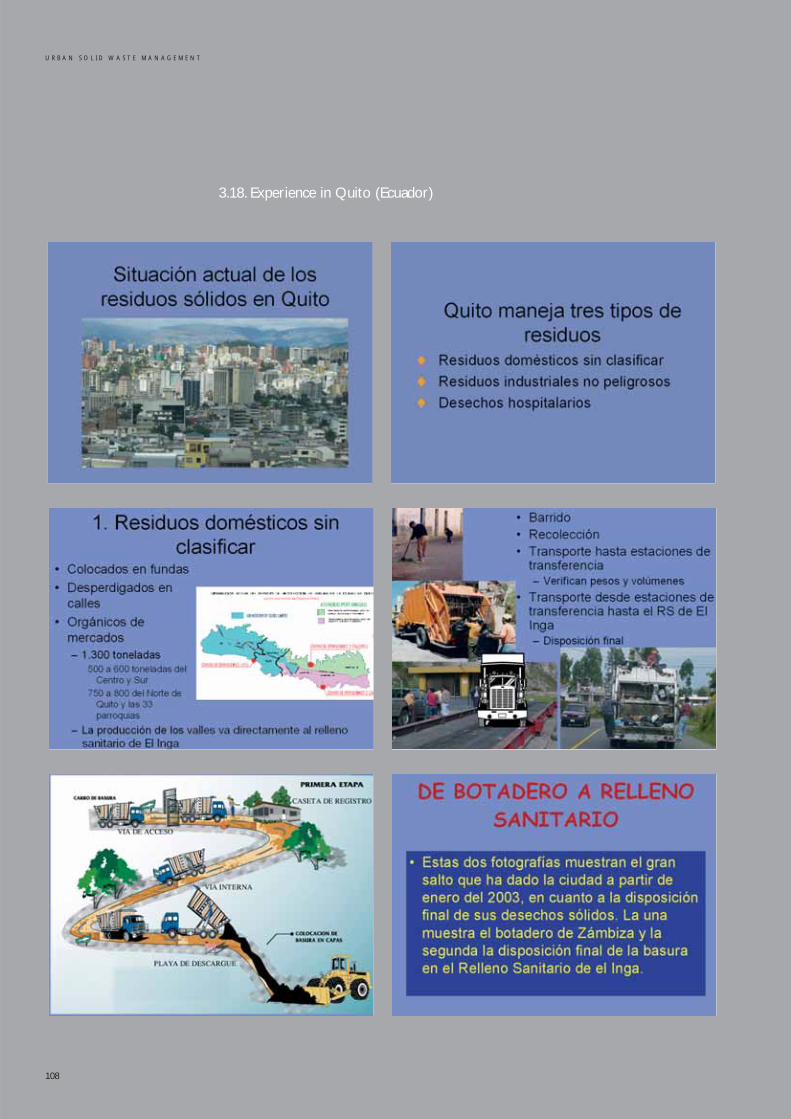
3.18. Experience in Quito (Ecuador)
108
U R B A N S O L I D W A S T E M A N A G E M E N T
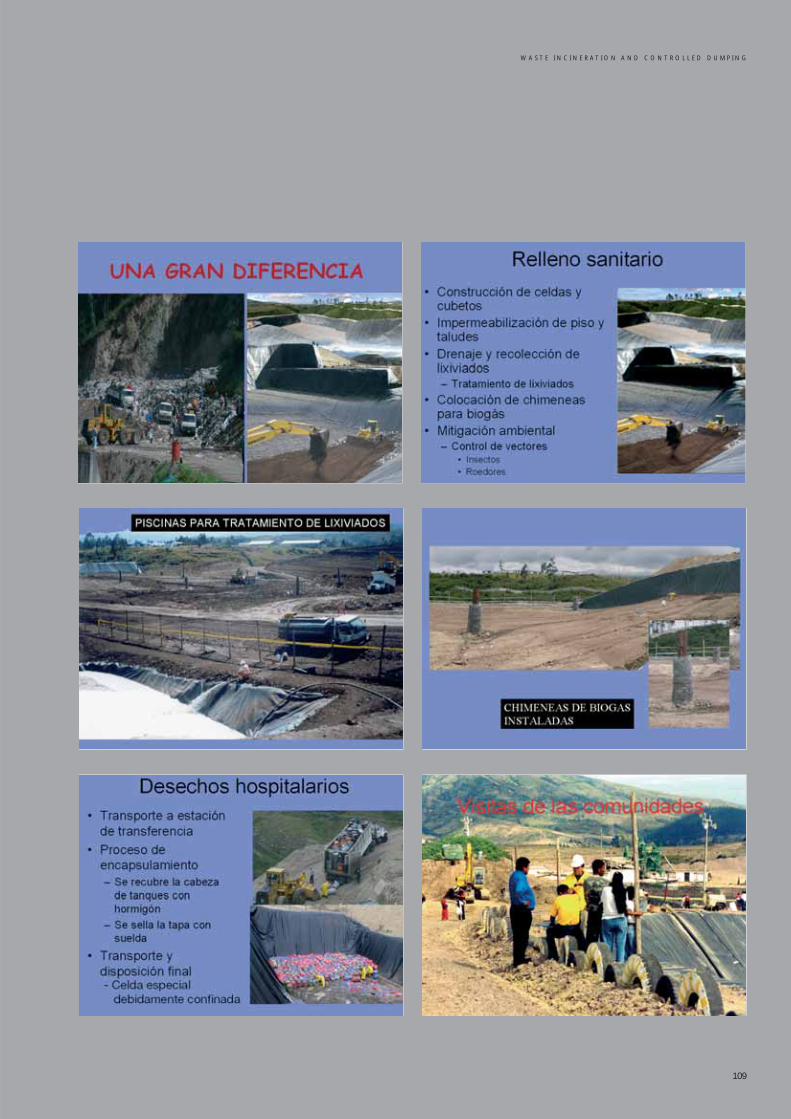
W A S T E I N C I N E R A T I O N A N D C O N T R O L L E D D U M P I N G
109

110
URBAN SOLID WASTE MANAGEMENT
4. Legislation, Human Resourcesand Financial Resources
4. Legislation. Human Resources and Financial Resources . . . . . . . . . . . . . . . . . . . . . . . . . . . . . . . . . . . . . . . . . . . . . . . . . . . . . . . . . . . . 113
4.1. Legislation . . . . . . . . . . . . . . . . . . . . . . . . . . . . . . . . . . . . . . . . . . . . . . . . . . . . . . . . . . . . . . . . . . . . . . . . . . . . . . . . . . . . . . . . . . . . . . . . . . . . . . . . . . . . . . . . . . . . . . . . . . 113
4.1.1. European Directives . . . . . . . . . . . . . . . . . . . . . . . . . . . . . . . . . . . . . . . . . . . . . . . . . . . . . . . . . . . . . . . . . . . . . . . . . . . . . . . . . . . . . . . . . . . . . . . . . . . 113
4.1.2. Legislation in Spain and the Autonomous Regions. . . . . . . . . . . . . . . . . . . . . . . . . . . . . . . . . . . . . . . . . . . . . . . . . . . . . . . . . . 115
4.1.3. Legislation in Latin America: Argentina, Bolivia, Ecuador and Mexico . . . . . . . . . . . . . . . . . . . . . . . . . . . . . . . . 117
4.1.4. African Legislation: Democratic Republic of the Congo . . . . . . . . . . . . . . . . . . . . . . . . . . . . . . . . . . . . . . . . . . . . . . . . . . 121
4.2. Human Resources. . . . . . . . . . . . . . . . . . . . . . . . . . . . . . . . . . . . . . . . . . . . . . . . . . . . . . . . . . . . . . . . . . . . . . . . . . . . . . . . . . . . . . . . . . . . . . . . . . . . . . . . . . . . . . . . 122
4.2.1. Administration Personnel . . . . . . . . . . . . . . . . . . . . . . . . . . . . . . . . . . . . . . . . . . . . . . . . . . . . . . . . . . . . . . . . . . . . . . . . . . . . . . . . . . . . . . . . . . . . 122
4.2.2. Waste Collection Company Personnel . . . . . . . . . . . . . . . . . . . . . . . . . . . . . . . . . . . . . . . . . . . . . . . . . . . . . . . . . . . . . . . . . . . . . . . . . . . 123
4.2.3. Treatment Plant Staff. . . . . . . . . . . . . . . . . . . . . . . . . . . . . . . . . . . . . . . . . . . . . . . . . . . . . . . . . . . . . . . . . . . . . . . . . . . . . . . . . . . . . . . . . . . . . . . . . . 124
4.3. Financial Resources. . . . . . . . . . . . . . . . . . . . . . . . . . . . . . . . . . . . . . . . . . . . . . . . . . . . . . . . . . . . . . . . . . . . . . . . . . . . . . . . . . . . . . . . . . . . . . . . . . . . . . . . . . . . . . 125
4.3.1. Property Tax . . . . . . . . . . . . . . . . . . . . . . . . . . . . . . . . . . . . . . . . . . . . . . . . . . . . . . . . . . . . . . . . . . . . . . . . . . . . . . . . . . . . . . . . . . . . . . . . . . . . . . . . . . . . . 125
4.3.2. Waste Collection Rate . . . . . . . . . . . . . . . . . . . . . . . . . . . . . . . . . . . . . . . . . . . . . . . . . . . . . . . . . . . . . . . . . . . . . . . . . . . . . . . . . . . . . . . . . . . . . . . 125
4.3.3. Metropolitan Rates for Waste Treatment . . . . . . . . . . . . . . . . . . . . . . . . . . . . . . . . . . . . . . . . . . . . . . . . . . . . . . . . . . . . . . . . . . . . . . . . 126
4.3.4. Economic Contribution from the Packaging and Packaging Waste Act. . . . . . . . . . . . . . . . . . . . . . . . . . . . . . . . 126
4.3.5. Economic Contribution from the Rates Act. . . . . . . . . . . . . . . . . . . . . . . . . . . . . . . . . . . . . . . . . . . . . . . . . . . . . . . . . . . . . . . . . . . 127
4.3.6. Supranational Contributions . . . . . . . . . . . . . . . . . . . . . . . . . . . . . . . . . . . . . . . . . . . . . . . . . . . . . . . . . . . . . . . . . . . . . . . . . . . . . . . . . . . . . . . . 127
4.4. Experience in Jalisco (Guadalajara-Mexico) . . . . . . . . . . . . . . . . . . . . . . . . . . . . . . . . . . . . . . . . . . . . . . . . . . . . . . . . . . . . . . . . . . . . . . . . . . . . . . 128
4.5. Experience in Montreal (Canada) . . . . . . . . . . . . . . . . . . . . . . . . . . . . . . . . . . . . . . . . . . . . . . . . . . . . . . . . . . . . . . . . . . . . . . . . . . . . . . . . . . . . . . . . . . . 130
112
INDEX
113
When we compare legislation for waste management in different countries we
find some similarities and quite a few differences. We can find vast differences in the
very organization of the States, and therefore in the distribution of responsibilities and
powers between the various levels of the public administration and private companies
that operate in the sector. We also find vast differences in the type of waste produced
and the economic systems that generate it. While some countries try to recover elec-
tronic waste (computers, cell phones, etc.) others try to eradicate the extreme poverty
that some citizens live in around the dumpsites.
Some of the decisions made, at least in Europe, go beyond national borders.
Given that the strictest limitations that environmental issues do not know limits as strict
as those of political boundaries, it would seem logical to try to come to an agreement
regarding the management of situations that could affect various countries.
Nevertheless, it is difficult to keep up with the change that legislation in this sec-
tor constantly undergoes. For example, it would have been hard to imagine a few years
ago that out-of-use vehicles and motor oils could be a waste problem. In this area, as
in many others, general legislation does not give any sort of regulation to the issue. On
the other hand, we have to take into account the constant increase in the amount of
waste being generated, which seems to be a worldwide problem as a result of the pop-
ulation increase and the ease with which we dispatch materials from one side of the
planet to the other in a matter of hours.
Making a detailed analysis of the legislation of all the member States of
Metropolis would be a field of work that greatly exceeds what is expected of this manual.
Nevertheless, as illustrations, we will highlight the legal constructions used in some
areas in the hope that they might be an example and a model to either imitate or
reject.
4.1.1. European DirectivesThe conceptual orientation that the European Parliament proposes, by way of
guiding the Member States, is aimed at promoting two main and complementary
ideas:
1. Separate waste by fractions that can be recycled. The need to incorporate in
the design of new products the obligation to think about their disassembly and
reutilization has been insisted upon in recent years.
2. Have alternative treatments to controlled dumps to avoid occupying the little
space there is.
Along these lines, there are the following documents:
– Directive 75/442/EEC (amended by 91/156/EEC) establishes the general
framework for Community policy-making regarding waste management.
4.1. Legislation
4. LEGISLATION, HUMAN RESOURCES AND FINANCIALRESOURCES
– Directive 99/31/EEC establishes the need to reduce the amount of waste dis-
posal in dumps, while directive 2000/76/EC refers to the incineration of
waste and the procedures to follow.
– The European Union Treaty of 1992 (Maastricht) establishes the precept of
promoting sustainable development.
– In the framework of the 5th EC Environmental Action Programme, Directive
94/62/EEC on Packaging and packaging waste indicates the orientation of
Spanish Act 11/1997 and those of the other Member States.
– The 6th EC Environmental Action Programme, “Environment 2010: Our
Future, Our Choice” (2001), proposes two very specific aims for the future:
significantly reducing the volume of generated waste and reducing elimination
in controlled dumps by 50% before 2050.
In recent years work has been carried out on various Directives:
– Directive 2002/96/EC on Waste Electrical and Electronic Equipment esta-
blishes that the manufacturers of these products must organize selective collec-
tion systems for old equipment so that they can be returned by their users free
of charge, thereby ensuring their recovery and correct treatment. The law is
expected to come into force across the States in 2005. This directive has been
developed through various decisions.
– Directive 2004/12/EC amending Directive 94/62/EC on packaging and
packaging waste.
– Directive 2000/53/EC establishes the procedure to follow when a vehicle has
reached the end of its useful life. On 27 February 2003, the Commission
made a decision regarding classification guidelines for vehicle components and
materials in order to simplify dismantling processes.
– Decision 2000/532/EC establishes the European waste list.
We would like to also highlight that as a result of the economic agreements in
the European Union, goods and people may move freely between countries. In prac-
tice, this also means that waste can move freely if agreements are made between coun-
tries. In such a globalized society we can come across some very surprising arrange-
ments. Spain, for instance, must import used paper to manufacture recycled carton to
make packaging (for shirts, biscuits and detergent powders) as its industry has the capacity
to treat more paper than it actually collects across the country. Once manufactured, the
recycled carton is distributed to various countries. It may be printed before or after
being dispatched abroad. We also find that some multinational companies manufacture
a product in one country while the packaging is manufactured in another, and the
goods are sold in a third country. A company that markets detergent may have the fac-
tory in Germany, buy the carton for the packaging in Spain and sell the product in
Holland.
114
U R B A N S O L I D W A S T E M A N A G E M E N T
L E G I S L A T I O N , H U M A N R E S O U R C E S A N D F I N A N C I A L R E S O U R C E S
115
4.1.2. Legislation in Spain and the Autonomous RegionsThe legislation in Spain governing waste is partly due to the transposition of the
European Directives. We must stress that Spain is organized into autonomous commu-
nities that in some cases have authority to legislate environmental matters. Obviously
these guidelines cannot go against the more general European or Spanish ones. They
can only establish how certain procedures are to be carried out, or establish new restric-
tions to certain practices.
The Autonomous Community of Catalonia has the brief for waste management,
and therefore the legislation covers the whole autonomous territory of Catalonia.
Catalonia occupies the NE corner of the Iberian Peninsula. It has a population of just
over six million people and an area of 32,000 km2. The gross disposable household
income (per capita) in 2002 was 12,356 euros according to the Instituto Nacional de
Estadistica (www.ine.es). During the same period the Spanish average was 11,016
euros.
The capital of Catalonia is the city of Barcelona that covers a very small area
(97.6 km2) and has 1.5 million inhabitants. This is almost a quarter of the entire popu-
lation of Catalonia.
Spanish Legislation
We would like to highlight three fundamental laws applicable across the territory:
– Act 7/1985 of the Basis for the Local System establishes the collection of waste
as a compulsory service in municipalities, regardless of their size: up to 5,000
inhabitants, from 5,000 to 50,000 inhabitants, and over. In actual fact, since 23
June 1813, the municipalities have been responsible for collecting household
waste. Municipalities with over 5,000 inhabitants must also guarantee the treat-
ment of the waste. Municipalities may group together and pool resources or
outsource the service together.
– Act 10/1998 of 21 April pertaining to waste establishes the basic direction and
obligations for municipalities and producers. Currently in Spain, selective col-
lection of waste is compulsory, in that waste cannot be collected in one con-
tainer where the different types of waste are mixed. On the basis of this law
comes the National Waste Plan (2000-2006), approved 7 January 2000.
– Act 11/1997 of 24 April pertaining to packaging and packaging waste, establishes
that packaging is the property of the producer or packer, and that users must
return these to the stores through a deposit-return system or through an integrated
management system.The municipality plays an important role in the integrated
system as it is responsible for street waste bins, emptying these and transferring
the waste to the recycling plants. The association of producers must be respon-
sible for the extra cost of the operation making economic contributions to the
municipality.
Autonomous Community of Catalonia
In the Autonomous Community of Catalonia, the role of the municipal adminis-
tration is reinforced through Act 8/1987 of Catalan Municipalities and Local Systems,
which establishes waste collection as a compulsory service in the municipalities.
Also worth highlighting:
– As a general guideline, Act 6/1993, which regulates waste management, and
amended by Act 15/2003. This basic regulation establishes the separation of
municipal waste and waste generated by businesses and economic activities.
Each business may choose to contract a private waste collection service, or pay
for the municipal service. It also establishes the obligation for municipalities to
organize selective collection of organic waste and provide a drop-off center
where people may leave hazardous or voluminous waste.
– Decree 201/1994 regulates the management of building rubble.
– Decree 1/1997 regulates the type of waste at the dump.
– Decree 277/1999 regulates sanitary waste
– Decree 92/1999 approves the Waste Catalogue
– Decree 217/1999 regulates the management of out-of-use or abandoned vehicles.
– Act 9/2000 regulates publicity material in Catalonia.The guidelines seek to avoid
an indiscriminate generation of publicity on paper distributed to people’s homes.
– Act 11/2000 regulates waste incineration.
– Act 16/2003 governs the funding of infrastructures and rates. This guideline,
implemented in 2004, establishes a rate of 10 euros per ton of waste at the con-
trolled dump. This rate is in addition to the amount paid to dump the waste
and is used to finance non-final treatment infrastructures such as composting
plants or ecoparks, which apply composting and methanization technology to
waste that has been previously segregated in households.
Municipal Bylaws and Metropolitan Management
Each municipality can organize their own waste collection service in accordance
with current guidelines. Normally each city hall prepares and approves environmental
bylaws that establish, as a minimum, the street cleaning and waste collection conditions.
Therefore they describe people’s responsibilities in these areas. The bylaws establish the
fractions and the schedule for waste collection. They also establish the type of bins or
bags that should be delivered to the authorized managers. The bylaws of Barcelona City
Hall can be looked up on the municipal web page (www.bcn.es) in .pdf format. The
environmental bylaws are usually found with the tax bylaws that establish the prices of
the services for citizens and businesses.
The city of Barcelona and the 32 municipalities that surround it decided to come
together to manage their waste. The organization Entitat Metropolitana de Serveis Hidràulics
i Tractament de Residus was created to manage the treatment facilities that were necessary
116
U R B A N S O L I D W A S T E M A N A G E M E N T
L E G I S L A T I O N , H U M A N R E S O U R C E S A N D F I N A N C I A L R E S O U R C E S
117
in order to apply the Metropolitan Program of Municipal Waste Management. This
program, with an application period between 1997 and 2006, establishes the fractions into
which waste is to be separated and the necessary plants to treat it. In 2004, 40 drop-off
centers, 2 ecoparks that include composting and methanization plants, 3 composting
plants, 2 incinerators, 1 packaging and packaging waste selection plant, and 1 dump that
is in the process of being closed.
The Entitat Metropolitana was created through Act 7/1987 of the conurbation of
Barcelona in order to offer services for municipal solid-waste management and waste-
water management in water-treatment plants. In total, over 1.5 million tons of waste
from three million citizens is treated each year.
4.1.3. Legislation in Latin America:Argentina, Bolivia, Ecuador and MexicoIn Argentina, the Constitution (reformed in 1994) establishes the rights and
responsibilities of citizens with regards to living in a healthy environment. Likewise, it
has created new environment protection institutions and establishes the right to infor-
mation regarding environmental protection. According to the National Constitution, it
is the nation’s responsibility to dictate minimal budget guidelines for environmental
protection, and it is the responsibility of the provinces to complement these without
altering local jurisdiction.
The legal constructions are based on two fundamental laws: (www.medioambiente.
gov.ar/mlegal), even though neither exclusively refers to municipal waste:
– General Environment Act No. 25,675, published 28 November 2002. The text
establishes general considerations regarding sustainable development, public
participation and environmental education.
– The law governing the Minimal Environmental Budget for Industrial Waste
and Service Activities No. 26,612, published 29 July 2002. This law comple-
ments the National Law for Hazardous Waste No. 24,051, approved December
1991, before the constitutional reform. The minimum budget legislation
expressly excludes municipal waste, which is to have its own guidelines. At the
time of preparing this manual, there was no knowledge of any general legisla-
tion that covers waste, or any particular law on municipal waste.
In the province of Buenos Aires, Decree-Law No. 9111/78 regulates the final dis-
posal of all types of waste (www.gob.gba.gov.ar/legislacion/) in the districts of the
metropolitan area. It establishes that the final disposal of the waste will be carried out
exclusively in sanitary landfills, and exclusively through the Cinturón Ecologico Area
Metropolitana Sociedad del Estado (CEAMSE). This organization is also the only official
technical advisory body for all the municipalities that comes under the law in relation
to urban cleaning and, especially, the final disposal of waste. It has banned burning or
incinerating waste, or any other system that has not been expressly authorized. Article
11 prohibits any type of waste recovery tasks, including what is known as ‘cirujeo’ or
scavenging, even on private property.
CEAMSE has the brief for the establishment of tariffs for waste treatment in its
sanitary landfills, and also for organizing environmental education campaigns that
address waste minimization and recycling (www.ceamse.gov.ar). The website also
contains projects and studies.
Act 20,284/73 classifies waste into six categories and only authorizes direct dis-
posal of degradable material or toxic waste at the Cinturón Ecológico. Other types of
waste must be treated first.
As an option, the collection companies offer special services to producers of large
amounts of organic waste and paper and cardboard, whereby supplying pig breeders
with organic material and the scarce paper recycling plants with paper.
Household waste collection costs are charged through the street sweeping, light-
ing and cleaning rates, and are charged according to size and activity of the business,
where a certain base category will be applied for the rate, if there is not a direct link
between the producing body (quality and quantity) of the waste and the cost of the
service.
Regarding hazardous waste, there is a register that lists hazardous producers and
operators on a national and municipal level that the city must adhere to. Hazardous
waste undergoes a different treatment.
Under resolution 115/95, the services must present a daily report on: out-of-
hours household waste, litter, industrial waste, out-of-hours street cleaning and flushing.
In 1998, the city collected 1,817,540 tons of waste, 55% corresponding to house-
hold urban solid waste, 14% street sweeping and the rest, 36%, belonged to big producers
such as supermarkets and restaurants. Currently it is estimated that 4,750 tons are
generated a day, which means that 1,710,000 tons are generated a year, a decrease that
can be explained by the drop in business activity and consumption.
Household waste collection in Buenos Aires is governed by Decree 1033/80
(DII 780 and Decree 613/982 D II 780). It establishes the time waste is to be deposited
on sidewalks as between 8 p.m. and collection time (Sundays to Fridays from 9 p.m. to
7 a.m.).
In Bolivia, waste legislation is supported by the Environment Act No. 1333 that
establishes in the first article the aim of preserving the environment and natural
118
U R B A N S O L I D W A S T E M A N A G E M E N T
L E G I S L A T I O N , H U M A N R E S O U R C E S A N D F I N A N C I A L R E S O U R C E S
119
resources by regulating human activities related to the natural environment. In 1996,
the Regulation of the Law through the Supreme Decree No 24,176 was approved. This
regulation gives the municipalities authority to carry out street-cleaning services either
directly or by outsourcing. In order to do this, each municipality must organize a spe-
cific unit responsible for the planning, administration and supervision of urban cleaning
and propose a rate to charge for the service.
The Municipalities Act No. 2028 establishes that the municipal government must
directly regulate, control and administer urban-cleaning services and the handling and
treatment of solid waste. It must therefore establish the necessary regulations and deter-
mine the rates for urban cleaning that will guarantee the sustainability and efficiency of
the service.
To standardize correct waste management, a series of Bolivian guidelines (NB)
were established, that go from NB 742 to NB 760 and NB 69,001 to NB 69,007. The
document NB 743, for example, establishes the procedure to determine the generation
of municipal solid waste. For more information you can refer to www.sias.gov.bo.
The city of La Paz, the capital of Bolivia, sits at 3600m above sea level and has a
population of approximately 800,000 inhabitants. It is estimated to generate about 500
tons of solid waste a day, mostly household waste (60%), the majority of which is col-
lected by an urban-cleaning company that operates in the center of the city and nine
smaller companies that operate in the peripheries.
Some of the most important points are:
– In December 2003 the municipal regulation for handling hazardous substances
was approved.
– During 2004 the regulation and manual for handling hospital waste was
prepared, as well as the project for comprehensive management of solid
waste.
City waste was disposed at the Mallasa Tip that covered an area of 30 hectares. It
was located in the southern end of La Paz municipality, 16 km from the urban center.
It started to operate in 1991 and the idea was it would remain in operation until 2017,
but it has now closed.The dump usually received about 500 tons a day of solid waste,
collected 24 hours a day by both the operating company servicing the urban center
(90% of the area) and the nine smaller companies servicing the remaining 10% with
street sweeping, waste collection and transport services in areas of the city with limited
vehicle access due to the steepness of the land. In April 2003, the Mayor of La Paz and
the Mallasa Environment Committee, in representation of the residents in the area,
signed a ‘Commitment Act’ where the municipal government committed to carrying
out a series of compensatory projects that would benefit the neighborhood and trans-
fer the dump to another site before 29 September 2004. The most up-to-date reports
available confirm this was carried out.
In the Republic of Ecuador, article 32 of the Constitution establishes the con-
trol the municipalities can establish over the territory to put into effect the right to
dwellings and the conservation of the environment.
The Municipal Systems Act (in article 163) gives the municipality the brief for
cleaning, collection and treatment services for garbage and waste from slaughterhouses,
market places, cemeteries and funeral services.
The Unified Text on Environmental Legislation, approved by Decree No. 3516
in 2003, declares the comprehensive management of solid waste as a national priority,
with shared responsibility across society.
Bylaw 100 regulates the stages of waste collection, sweeping, transport, transfer
and final disposal of solid waste. It establishes the mandatory nature of disposing waste
in sanitary landfills with an environmental license.
In the specific case of Quito where the population is 1.4 million people in an area
of 403,353 hectares, waste production is estimated at 250 kg per person per year. It is esti-
mated that the municipal service manages to collect around 85% of the waste produced.
The Constitution of Mexico also mentions environmental protection, and to re-
gulate waste management across the national territory, the Congress of the Union approved
the General Law of Prevention and Comprehensive Waste Management . It was published
in the official bulletin of the Federation on 8 October 2003 (www.cddhcu.gob.mx).
The text comprises 125 articles and 13 transitory articles. The legislation describes the
various levels of responsibility and defines the most important concepts.The responsibility
for comprehensive management (collection, transfer, treatment and final disposal) of
urban solid waste belongs to the municipalities (article 10) that can collaborate to carry
out the functions stipulated by the law. Waste is divided into three basic categories:
hazardous waste, urban waste and waste that requires special handling. Urban waste can
be sub-categorized into organic and non-organic in order to facilitate primary and secon-
dary segregation, in compliance with the State and Municipal Program (article 18). Waste
that requires special handling includes waste from big producers such as the building and
health industries, etc. The Law makes provisions for the creation of a national program
for the prevention and comprehensive management of waste and handling plans in order
to establish the best management modules. A minimum of 15 handling plans is antici-
pated. Articles 35 to 39 refer to social participation and the right to information. Article
125 clearly specifies that each person or social group can report a fact, act or omission that
could result in damage to the environment, natural resources or public health.
120
U R B A N S O L I D W A S T E M A N A G E M E N T
L E G I S L A T I O N , H U M A N R E S O U R C E S A N D F I N A N C I A L R E S O U R C E S
121
In order to prevent waste generation and carry out comprehensive handling, the
Law establishes a minimum of 12 obligations for municipalities and federal organiza-
tions that can be carried out according to their own regulations. Nevertheless, the
legislation, as a general framework, states that future official Mexican guidelines will
establish the details of comprehensive management. The guidelines will stipulate the
terms that will determine the location of sites and the design, construction and operation
of facilities for final waste disposal. They will also outline the situations where biogas
may be harnessed.
Federal organizations will establish the obligations the waste producers have,
making a distinction between big and small ones, and the obligations of special-handling
service companies. They can, if they consider it beneficial, prohibit leaving waste on the
street and in unauthorized areas, open-air incineration and the opening of new disposal
areas.
The municipalities will carry out the necessary measures to prevent the genera-
tion of urban solid waste, its recovery and comprehensive management, in consideration
of the producer’s obligations, the requirements of the service companies and the revenue
generated from delegating the comprehensive handling service (article 99).
4.1.4.African Legislation: Democratic Republic of the CongoThe management of solid waste in the Democratic Republic of the Congo,
whose capital is Brazzaville, poses a number of problems from a European perspective.
Within the legal framework, the country’s Constitution, approved on 20 January
2002, establishes the general principal of respect for the environment, especially refer-
ring to the accumulation, transport and incineration of toxic waste.
Before the Constitution, Act 3/91 on environmental protection prohibited dis-
posing of or abandoning waste in such a way that could give rise to disease, cause injury
to people or property, or produce unpleasant odors or discomfort. It also stipulated that
waste was to be disposed of in such a way that materials and energy could be recovered.
According to the law, the Local Collectives would be responsible for correct urban waste
removal. As a result they had to formulate management plans that would have to be
approved by the Ministry for the Environment. However, local experts acknowledged
that in July 2004 no plan had yet been approved, because the country had until recently
been immersed in a war.
In the capital, Brazzaville, the city is responsible for waste management. In order
to get management funds, Deliberation 08/77, later amended by Deliberation 03/99,
established a variable rate in accordance with producer type: apartments, workers, mar-
kets, hotels, restaurants, etc. Brazzaville has a population of over 1.3 million inhabitants.
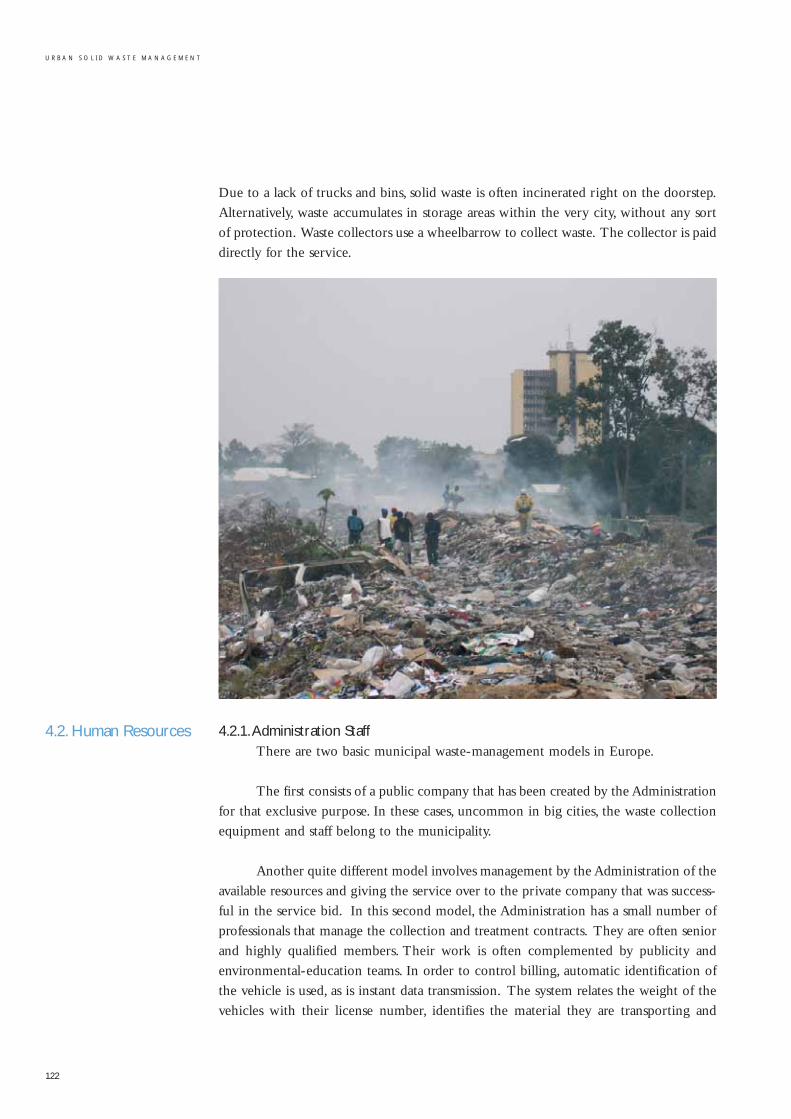
4.2. Human Resources
Due to a lack of trucks and bins, solid waste is often incinerated right on the doorstep.
Alternatively, waste accumulates in storage areas within the very city, without any sort
of protection. Waste collectors use a wheelbarrow to collect waste. The collector is paid
directly for the service.
4.2.1.Administration StaffThere are two basic municipal waste-management models in Europe.
The first consists of a public company that has been created by the Administration
for that exclusive purpose. In these cases, uncommon in big cities, the waste collection
equipment and staff belong to the municipality.
Another quite different model involves management by the Administration of the
available resources and giving the service over to the private company that was success-
ful in the service bid. In this second model, the Administration has a small number of
professionals that manage the collection and treatment contracts. They are often senior
and highly qualified members. Their work is often complemented by publicity and
environmental-education teams. In order to control billing, automatic identification of
the vehicle is used, as is instant data transmission. The system relates the weight of the
vehicles with their license number, identifies the material they are transporting and
122
U R B A N S O L I D W A S T E M A N A G E M E N T
L E G I S L A T I O N , H U M A N R E S O U R C E S A N D F I N A N C I A L R E S O U R C E S
123
carry out detailed studies regarding needs. There are also mixed procedures that com-
bine both models. A particular municipality, for example, could have the means to col-
lect household waste and give street sweeping or litter bin emptying tasks to the suc-
cessful company in the service bid. However, the trend is moving toward concentrating
all the different tasks in order to avoid confusion regarding the various duties. An
extreme, but real, example is who is responsible for a garbage bag that has been left next
to a full bin.
In the city of Barcelona, Spain, the current contract divides the city into four zones.
The companies contracted can choose to operate across the whole city or only in one
area. There are currently three companies responsible for waste collection and a fourth
that is responsible for emptying litter bins.The intention of the administrators is to create
competition between the companies and therefore improve the quality of the service.
Nonetheless, the Administration must guarantee that the services are indeed car-
ried out, and to do that they must have the necessary mechanisms to verify and control
activity. Sometimes an index of customer satisfaction is established through telephone
surveys. Other times quality indicators are based on customer complaints, which could
have repercussions on the price of the service.
4.2.2.Waste Collection Company StaffStaff from waste collection companies are linked to the contracts with the
Administration. Because waste collection contracts have a finite period (normally
between seven and ten years to amortize the investment made in machinery) work-
ers can change companies several times over their professional lives.
When a cleaning and waste-collection company gets a new contract, it must take
on the staff from the previously contracted company. This ensures the right of work-
ers, especially with regard to length of employment.Their category is based on the type
of task they perform: drivers and laborers, basically. They are generally unskilled and
have few professional prospects.A few problems have been detected regarding the inte-
gration of migrant staff from other countries. In few cases the waste collection staff are
the staff from the municipality.
The work is hard and there is a high rate of injury, turnover and substitutions.
There is a need for good personnel identification and stringent health control.
In Europe, the working conditions for the personnel in this sector are regulated
through collective agreements. As a general orientation, the working week cannot
exceed 40 hours per person, the company must supply uniforms, training and provide
medical check-ups for the workers. You can easily find collective agreements for the
various companies on the Internet.
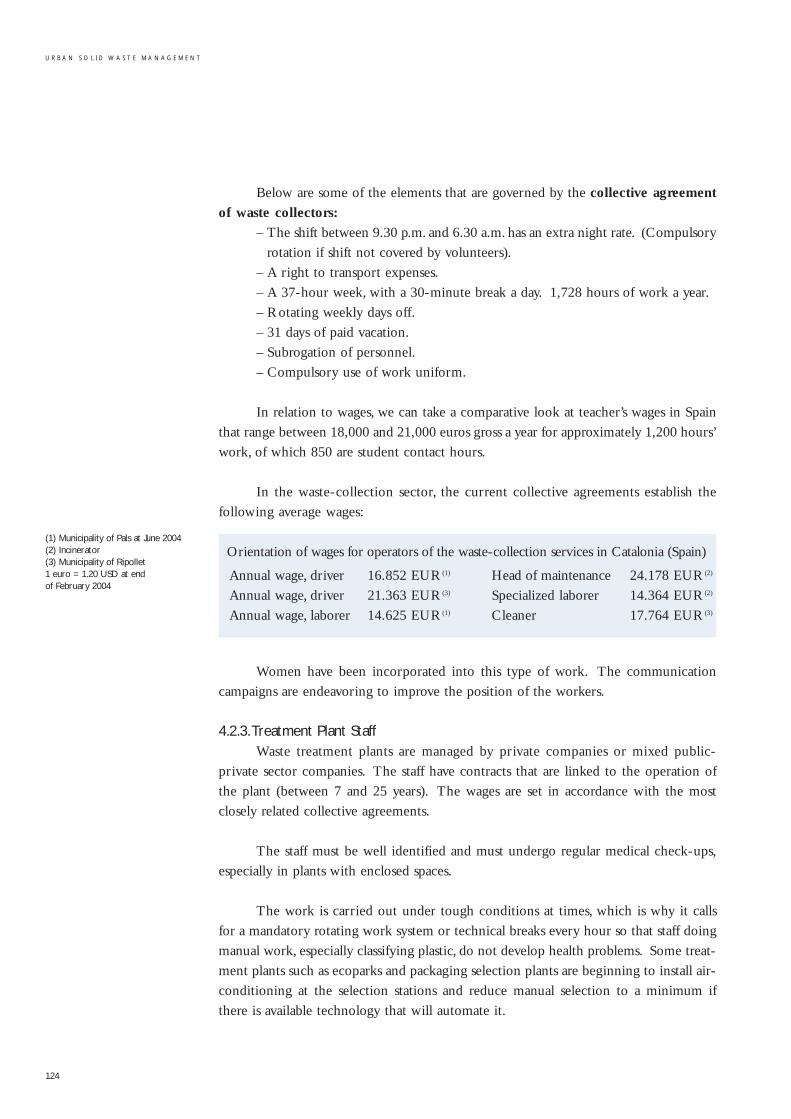
124
U R B A N S O L I D W A S T E M A N A G E M E N T
(1) Municipality of Pals at June 2004(2) Incinerator(3) Municipality of Ripollet1 euro = 1.20 USD at end of February 2004
Below are some of the elements that are governed by the collective agreement
of waste collectors:
– The shift between 9.30 p.m. and 6.30 a.m. has an extra night rate. (Compulsory
rotation if shift not covered by volunteers).
– A right to transport expenses.
– A 37-hour week, with a 30-minute break a day. 1,728 hours of work a year.
– Rotating weekly days off.
– 31 days of paid vacation.
– Subrogation of personnel.
– Compulsory use of work uniform.
In relation to wages, we can take a comparative look at teacher’s wages in Spain
that range between 18,000 and 21,000 euros gross a year for approximately 1,200 hours’
work, of which 850 are student contact hours.
In the waste-collection sector, the current collective agreements establish the
following average wages:
Orientation of wages for operators of the waste-collection services in Catalonia (Spain)
Women have been incorporated into this type of work. The communication
campaigns are endeavoring to improve the position of the workers.
4.2.3.Treatment Plant StaffWaste treatment plants are managed by private companies or mixed public-
private sector companies. The staff have contracts that are linked to the operation of
the plant (between 7 and 25 years). The wages are set in accordance with the most
closely related collective agreements.
The staff must be well identified and must undergo regular medical check-ups,
especially in plants with enclosed spaces.
The work is carried out under tough conditions at times, which is why it calls
for a mandatory rotating work system or technical breaks every hour so that staff doing
manual work, especially classifying plastic, do not develop health problems. Some treat-
ment plants such as ecoparks and packaging selection plants are beginning to install air-
conditioning at the selection stations and reduce manual selection to a minimum if
there is available technology that will automate it.
Annual wage, driver 16.852 EUR(1)
Annual wage, driver 21.363 EUR(3)
Annual wage, laborer 14.625 EUR(1)
Head of maintenance 24.178 EUR(2)
Specialized laborer 14.364 EUR(2)
Cleaner 17.764 EUR(3)
L E G I S L A T I O N , H U M A N R E S O U R C E S A N D F I N A N C I A L R E S O U R C E S
Nevertheless, management experience reveals the need to have someone responsible
for safety on behalf of the company and on behalf of the workers. Sometimes workers are
reticent about working with protective equipment such as helmets, gloves or facemasks.
Waste management, like almost all services provided by the municipality, has an
economic cost that must be met by the municipality. In some cases the citizens meet the
entire cost of the service, while in others the cost is distributed amongst the various
budgetary items.
In the case of Cuba, the public makes no contribution at all to the municipality
for waste collection. The management of the service forms part of the general state
budget that does not rely on public contribution. Only hotels because they generate
large volumes of waste are required to pay a certain amount for their waste service.
Below are some financing methods used to cover the economic costs of the
service.
4.3.1. Property Tax Some municipalities, such as Barcelona, use this tax as a means to collect revenue
from citizens. It includes various services that are compulsory: cleaning, lighting, waste
collection, etc. The city hall collects the tax either through a financial entity or directly.
The amount paid depends on the value of the property, which is calculated according to
parameters such as location, size, etc. In this case the citizens do not know what amount
corresponds to the waste-collection service. It is the proprietor’s responsibility to pay
this tax. If the property is leased to a third party, the tax is included in the rent.
4.3.2.Waste Collection RateSome city halls have decided to bring the waste collection issue into the open,
and charge the corresponding rate separately. This could come to $US30-40 a year per
family.
Since January 2003 in a small municipality of Catalonia, new methods are being
tried such as ‘pay to produce waste’, so that the rate is paid with the bags for the dif-
ferent fractions collected. Some bags are subsidized, while others carry a fine.The sys-
tem functions as a household door-to-door collection arrangement. A bag of waste can
cost $US0.60. Only waste in official waste bags is collected. A type of “waste tourism”
has been discovered where some citizens transport their waste to a neighboring munici-
pality in order to avoid paying for the service.
In some municipalities in the north of Italy, they have started to employ a pay-
ment system that uses cards with a magnetic strip that identifies the user. Street bins
4.3. FinancialResources
125
126
U R B A N S O L I D W A S T E M A N A G E M E N T
can only be opened with these cards that record information used to calculate the annual
rate the user will have to pay. The system allows the introduction of incentives. Taking
voluminous waste to a drop-off center, for example, can reduce the annual rate. The
method also has its detractors, who believe the system is a violation of individual rights
because of the amount of information the municipality has on the people.
In Quito, Ecuador, the waste collection rate is a proportional part of the elec-
tricity bill. There are virtually no cases of failure to pay because to do so could result
in having your electricity cut off. It is 10% of the amount billed for electricity. Some
drawbacks could be possible fluctuations linked to the price of electricity or substitu-
tion by another form of energy.
4.3.3. Metropolitan Rates for Waste Treatment This is a waste treatment rate that finances disposal, incineration or composting.
It is paid every three months in the water bill. It could amount to about $US30 per
family per year. It is collected by the Entitat Metropolitana de Serveis Hidráulics i
Tractament de Residus and destined directly to the treatment process.
In the Barcelona metropolitan area, 33 municipalities decided to have a common
waste-treatment system, so that each municipality is responsible for collecting waste and
the Entitat Metropolitana for management waste. The municipality collects the necessary
amount from the citizens for waste collection and street sweeping. The Entitat
Metropolitana, through the water bill collects the amount necessary for waste treatment.
This rate is reviewed annually. For more information: www.ema-amb.es. The citizens
pay according to the general consumption of drinking water in their dwellings and the
social level of their neighborhood.
4.3.4. Economic Contribution from the Packaging and Packaging Waste ActIn Spain,Act 11/1997 (which has equivalents in other EC countries) determines
that packaging belongs to the producers and not the consumers. Therefore, they have
the obligation to collect it using their own means or pay an amount to compensate for
the extra cost it incurs on the Administration. The law also includes an economic con-
tribution for matters concerning public environmental awareness campaigns.The Green
Dot is the logo used across Europe.
It is compulsory for all packagers who cannot show they have their own selective-
collection circuits.The amount to pay is usually proportional to the part of packaging
included in municipal waste.
In the case of paper and cardboard, it is calculated that 40% of collection involves
packaging. Management companies only contribute this proportion. The paper is sold
to the highest bidding company. It currently goes for 36 USD per ton.
127
L E G I S L A T I O N , H U M A N R E S O U R C E S A N D F I N A N C I A L R E S O U R C E S
Electronic Bibliography
Barcelona City Hall:www.bcn.es/neta(available in Spanish). Bylawswww.mediambient.bcn.es(only in Catalan).Entitat Metropolitana del MediAmbient: www.ema-amb.es(mostly in Catalan)Generalitat de Catalunya (CatalanGovernment): www.gencat.netGuidelines in http://unres.gencat.es(mostly in Catalan)Ministry for the Environment of Spain: www.mma.esEuropean UnionMunicipality of QuitoHavanaCEAMSE ArgentinaMexico
The agreement and regulation governing this area establishes different forms of
compensation according to the type of municipal structure (rural, semi-rural or urban).
4.3.5. Economic Contribution from the Rates ActIn 2004, a new Rates Act began in Catalonia (Spain) that taxes mass waste
dumping to fund the recycling of other waste. It is not applied directly to the public
but rather to the municipalities. Each ton of waste in the tip means 10 euros towards
paying for other treatments.
It is still too soon to evaluate the changes it may make. It is expected it will lead
to less production of undifferentiated waste and that not so many tons of material will
end up in the controlled tip.
4.3.6. Supranational ContributionsIn the case of Europe, there are types of supranational aid to reduce differences
between member states. Processes for choosing projects that require high levels of eco-
nomic contribution are held on a regular basis.The aid is usually for helping build new
facilities or closing obsolete ones such as old tips. In some cases the subsidies can be
more than 50% of the cost of a treatment plant.
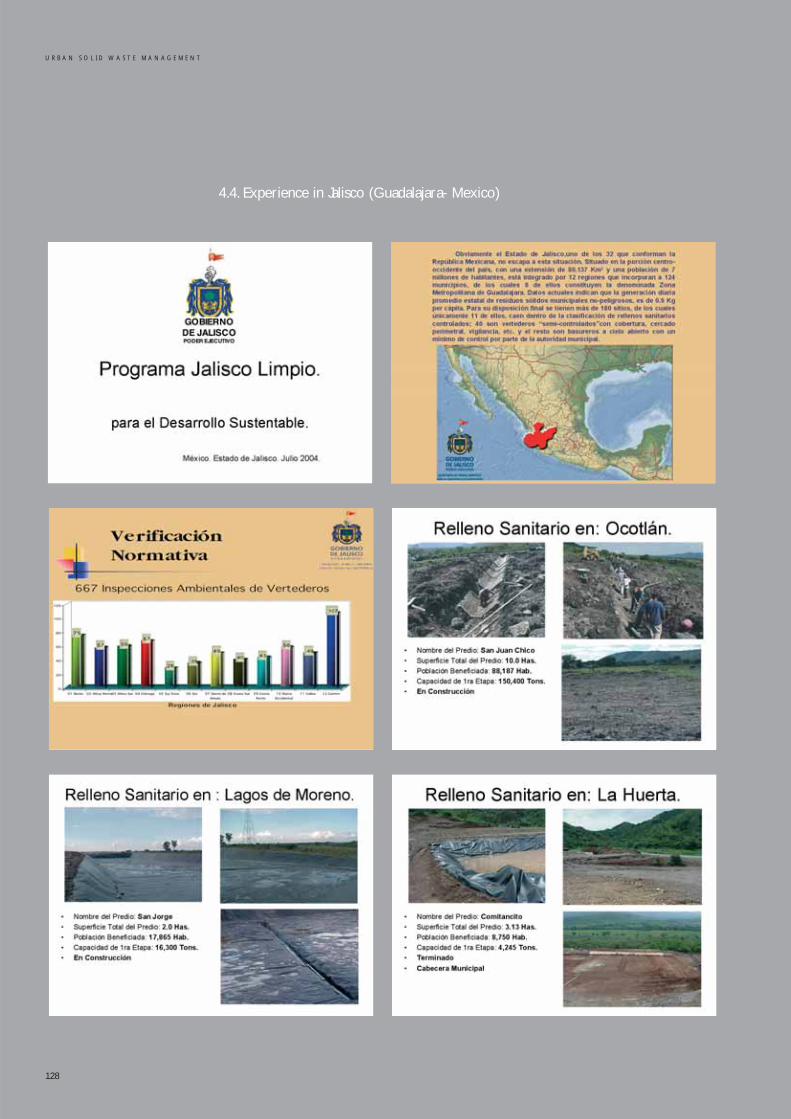
4.4. Experience in Jalisco (Guadalajara- Mexico)
128
U R B A N S O L I D W A S T E M A N A G E M E N T
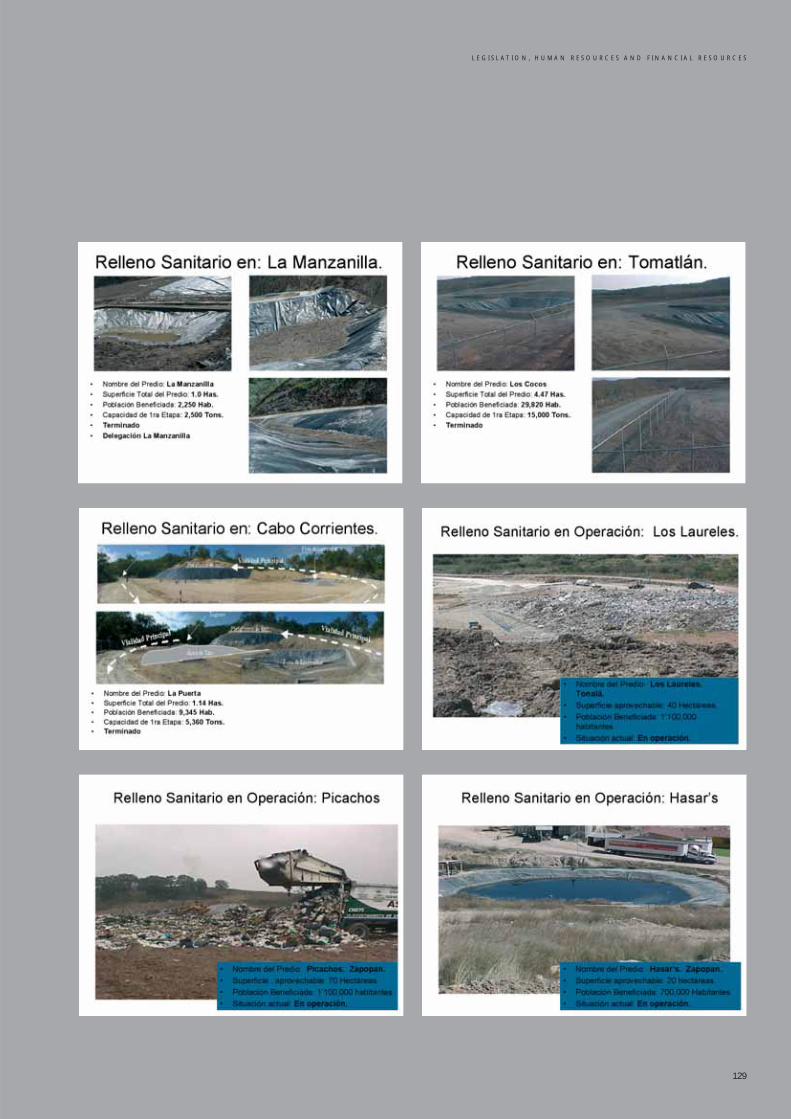
L E G I S L A T I O N , H U M A N R E S O U R C E S A N D F I N A N C I A L R E S O U R C E S
129
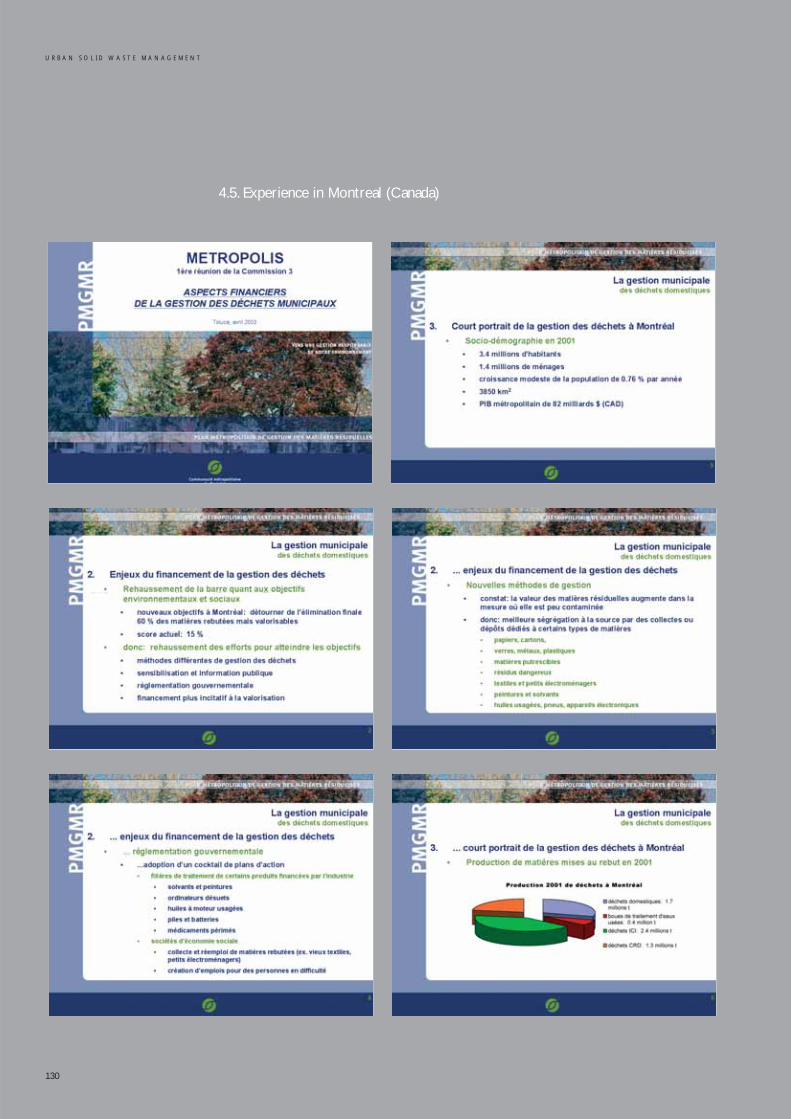
4.5. Experience in Montreal (Canada)
130
U R B A N S O L I D W A S T E M A N A G E M E N T
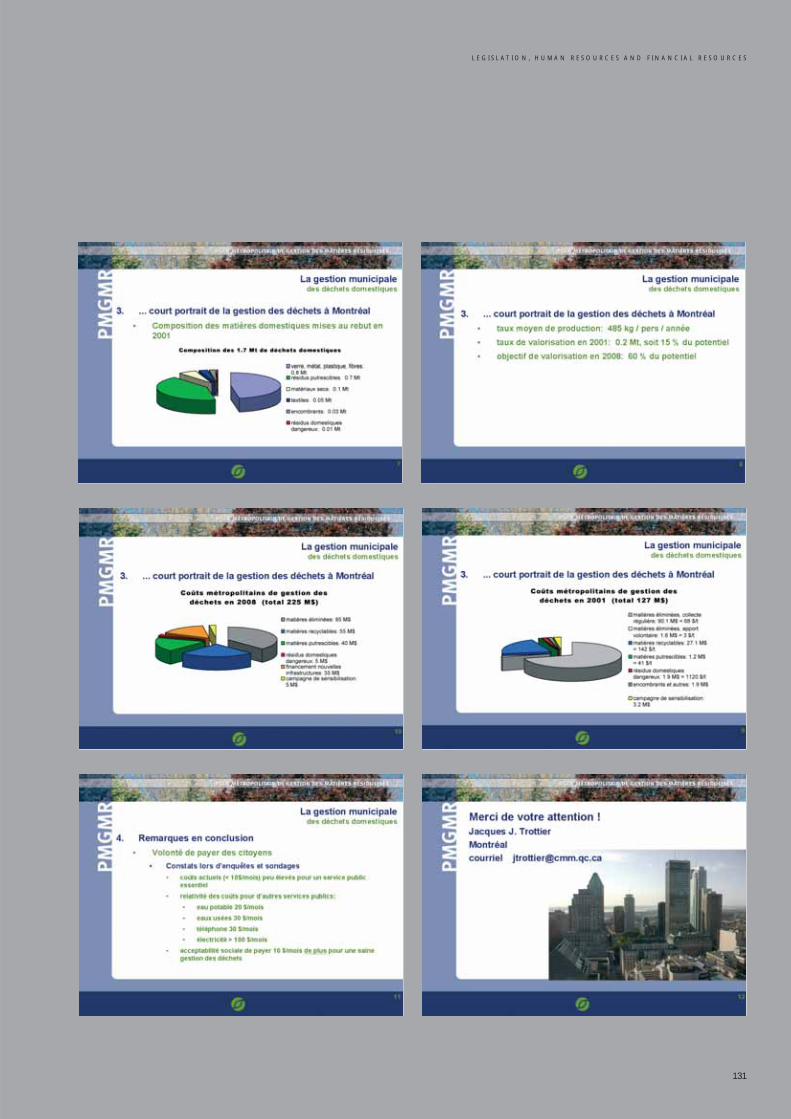
L E G I S L A T I O N , H U M A N R E S O U R C E S A N D F I N A N C I A L R E S O U R C E S
131

132
URBAN SOLID WASTE MANAGEMENT
5. Environmental Education,Communication and Public Participation
5. Environmental Education, Communication and Public Participation. . . . . . . . . . . . . . . . . . . . . . . . . . . . . . . . . . . . . . . . . 135
5.1. Environmental Education, Communication and Public Participation . . . . . . . . . . . . . . . . . . . . . . . . . . . . . . . . . . . . . . . . . . . . . 135
5.1.1. Social and Psychosocial Factors in Environmental Management . . . . . . . . . . . . . . . . . . . . . . . . . . . . . . . . . . . . . . . . . . 135
5.1.2. Recent International Agreements. A New Vision. . . . . . . . . . . . . . . . . . . . . . . . . . . . . . . . . . . . . . . . . . . . . . . . . . . . . . . . . . . . 135
5.1.3. Waste and Environmental Education . . . . . . . . . . . . . . . . . . . . . . . . . . . . . . . . . . . . . . . . . . . . . . . . . . . . . . . . . . . . . . . . . . . . . . . . . . . . . 136
5.1.4. Inform, Educate and Participate . . . . . . . . . . . . . . . . . . . . . . . . . . . . . . . . . . . . . . . . . . . . . . . . . . . . . . . . . . . . . . . . . . . . . . . . . . . . . . . . . . . 137
5.2. Environmental Education and Awareness . . . . . . . . . . . . . . . . . . . . . . . . . . . . . . . . . . . . . . . . . . . . . . . . . . . . . . . . . . . . . . . . . . . . . . . . . . . . . . . . . . 137
5.2.1. Education and Awareness, or Training . . . . . . . . . . . . . . . . . . . . . . . . . . . . . . . . . . . . . . . . . . . . . . . . . . . . . . . . . . . . . . . . . . . . . . . . . . . . . . 137
5.2.2. Environmentalism in Schools and Society . . . . . . . . . . . . . . . . . . . . . . . . . . . . . . . . . . . . . . . . . . . . . . . . . . . . . . . . . . . . . . . . . . . . . . . . 138
5.2.2.1. Curricular Design and Across-the-Board Contents . . . . . . . . . . . . . . . . . . . . . . . . . . . . . . . . . . . . . . . . . . . . . . . 138
5.2.2.2. Environmental Management in Schools . . . . . . . . . . . . . . . . . . . . . . . . . . . . . . . . . . . . . . . . . . . . . . . . . . . . . . . . . . . . . . 138
5.2.3. Educational Programs. Experiences . . . . . . . . . . . . . . . . . . . . . . . . . . . . . . . . . . . . . . . . . . . . . . . . . . . . . . . . . . . . . . . . . . . . . . . . . . . . . . . . . 139
5.2.3.1. Specialized Centers . . . . . . . . . . . . . . . . . . . . . . . . . . . . . . . . . . . . . . . . . . . . . . . . . . . . . . . . . . . . . . . . . . . . . . . . . . . . . . . . . . . . . . . . . 139
5.2.3.2. Publications and Campaigns . . . . . . . . . . . . . . . . . . . . . . . . . . . . . . . . . . . . . . . . . . . . . . . . . . . . . . . . . . . . . . . . . . . . . . . . . . . . . 139
5.3. Information and Communication . . . . . . . . . . . . . . . . . . . . . . . . . . . . . . . . . . . . . . . . . . . . . . . . . . . . . . . . . . . . . . . . . . . . . . . . . . . . . . . . . . . . . . . . . . . 139
5.3.1. Information and Instruction . . . . . . . . . . . . . . . . . . . . . . . . . . . . . . . . . . . . . . . . . . . . . . . . . . . . . . . . . . . . . . . . . . . . . . . . . . . . . . . . . . . . . . . . . . 140
5.3.2. Publicity and Marketing . . . . . . . . . . . . . . . . . . . . . . . . . . . . . . . . . . . . . . . . . . . . . . . . . . . . . . . . . . . . . . . . . . . . . . . . . . . . . . . . . . . . . . . . . . . . . . . 140
5.3.3. New Technologies . . . . . . . . . . . . . . . . . . . . . . . . . . . . . . . . . . . . . . . . . . . . . . . . . . . . . . . . . . . . . . . . . . . . . . . . . . . . . . . . . . . . . . . . . . . . . . . . . . . . . . . 140
5.4. Public Participation . . . . . . . . . . . . . . . . . . . . . . . . . . . . . . . . . . . . . . . . . . . . . . . . . . . . . . . . . . . . . . . . . . . . . . . . . . . . . . . . . . . . . . . . . . . . . . . . . . . . . . . . . . . . . . 141
5.4.1. Agents that Obstruct Participation. . . . . . . . . . . . . . . . . . . . . . . . . . . . . . . . . . . . . . . . . . . . . . . . . . . . . . . . . . . . . . . . . . . . . . . . . . . . . . . . 142
5.4.2. Agents that Promote Participation . . . . . . . . . . . . . . . . . . . . . . . . . . . . . . . . . . . . . . . . . . . . . . . . . . . . . . . . . . . . . . . . . . . . . . . . . . . . . . . . 142
5.4.3. Examples and Experiences . . . . . . . . . . . . . . . . . . . . . . . . . . . . . . . . . . . . . . . . . . . . . . . . . . . . . . . . . . . . . . . . . . . . . . . . . . . . . . . . . . . . . . . . . . 143
5.5. Experience in Havana (Cuba) . . . . . . . . . . . . . . . . . . . . . . . . . . . . . . . . . . . . . . . . . . . . . . . . . . . . . . . . . . . . . . . . . . . . . . . . . . . . . . . . . . . . . . . . . . . . . . . . 144
5.6. Experience in Alexandria (Egypt) . . . . . . . . . . . . . . . . . . . . . . . . . . . . . . . . . . . . . . . . . . . . . . . . . . . . . . . . . . . . . . . . . . . . . . . . . . . . . . . . . . . . . . . . . . . 146
134
ÍNDEX
5. ENVIRONMENTAL EDUCATION, COMMUNICATIONAND PUBLIC PARTICIPATION
135
5.1.1. Social and Psychosocial Factors in Environmental ManagementThere is no question that in the challenge that environmental management has
become for the Administration, institutions and citizens, especially in a globalized world
(which some people believe is on the verge of environmental collapse), it is not enough
to approach the problem from a strictly technical or technological perspective, but
rather a lot of attention must be given to the ‘human factor’.
Technology, economy, science, etc. shows us the way, the most efficient model for
solving our environmental problems. But behind the science there are people and the
complex world of psychology and sociology. Aspects such as learning, motivation,
changes of habits, etc. are vital not only to explain what is happening, but also how to
promote sustainability.
5.1.2. Recent International Agreements. A New Vision.In 1987, the Brundtland Report “Our Common Future”, not only advocated
sustainable development, but also stressed the need to guarantee effective participation
from the public in the adoption of decisions. Since The Earth Summit of Rio de Janeiro
in 1992, the representatives of the countries that attended continue to reiterate the
importance of public involvement in the processes of change and environmental pro-
tection. This concern has since been manifested in all environmental protest events and
declarations, in the 1994 Aalborg Charter, the Rio+5 and Rio+10 Summits, and in the
interesting process of Local Agendas 21 that emphasize the role of the cities and muni-
cipalities.
In fact it is chapter 28 of Local Agenda 21 that establishes the need to revitalize
democracy as a means of giving all collectives opportunities (indigenous communities,
women, youth, farmers, business people, scientists, unions, local administrations and
non-governmental organizations) to decide on the future of their community. Consequently,
with the inclusion of chapter 28 in Agenda 21, the international community acknowledges
the role of local authorities as the drivers of sustainability strategies. During the 2002
World Summit on Sustainable Development in Johannesburg, there was a session about
local government titled “Local Action Moves the World”. In this session a call was made
to all local governments to move from the agenda of sustainability to the action, through
Local Actions 21. The local authorities made a commitment to develop practical and
realistic development plans which they would implement through the programs of
Local Action 21 in order to meet their objectives.
The objectives set by Agenda 21 regarding waste refer to a change in production
and consumption habits so that waste production is reduced and minimization and recy-
cling increased. In other words, it strives toward a new culture leaving the old ‘throw-
away’ one behind. It does not consider waste to be the problem per se, but rather certain
consumption habits and our behavior as citizens and human beings.
5.1. EnvironmentalEducation,Communication andPublic Participation
The concept of sustainability, which is much more political and social, has opened
new avenues and promoted new strategies.There is no doubt a need for greater decision-
making, political willingness and more administrative resources in order to match
economic development and environmental respect with the population’s willingness.
5.1.3.Waste and Environmental EducationFirst of all, it is necessary to stress that the management and general issue of waste
today, whether industrial, business or household, and in particular municipal waste, has
become a serious problems for 21th century society. The problems have different levels
of seriousness depending on the culture and region of the planet in question, or on the
type of territorial, town-planning and human structure. Everywhere, however, the
increase in waste production and the wasting of raw materials and natural resources are
having devastating effects on the planet and it inhabitants.
To solve the problem it is important to analyze the causes, possible solutions, and
above all, the active agents in this process.
Until today, the general belief about environmental management and elements of
communication has been that technology can solve all problems, provide solutions to all
questions posed, that the issues to be solved are basically related to economic questions
and that it is enough that the public be informed so that the system continues to func-
tion. In other words, that we simply have to provide instructions and guidelines to
determine behavior in accordance with the programs established.
However, experience tends to show that that is not enough, and that grand
waste-management plans with millions spent on infrastructure and material can fail if at
the end of the chain, the main agent – the everyday citizen - does not understand their
role and does not become involved in the process, i.e., if he or she thinks it is not their
responsibility, for example, to segregate organic material, paper or glass.
What does the future hold? Above all, the observation that we are facing greater com-
plexity and seriousness in environmental problems.With the effects of globalization, the inter-
nationalization of the market, together with the general increase in emissions and other pol-
lutants,and waste production,we have to adopt new approaches to environmental management.
The growing complexity calls for greater involvement by all of society; with the
active and dedicated participation by citizens based on awareness and cooperation, and
management that is more socialized, democratic and involved.
It is vital that each citizen realizes his or her involvement along the lines defined
in the declaration of Rio ’92 and later included in the Local Agendas 21. We support
the promotion of radical democratization and the globalization of human movement.
136
U R B A N S O L I D W A S T E M A N A G E M E N T
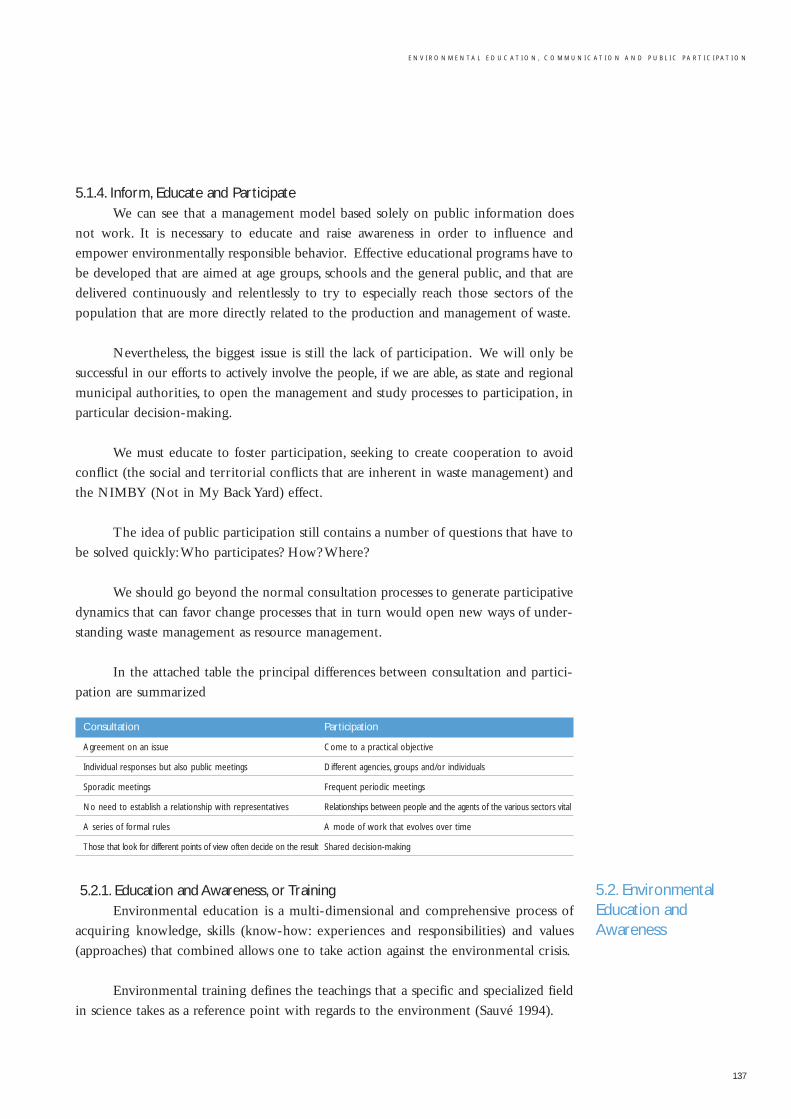
E N V I R O N M E N T A L E D U C A T I O N , C O M M U N I C A T I O N A N D P U B L I C P A R T I C I P A T I O N
137
5.1.4. Inform, Educate and ParticipateWe can see that a management model based solely on public information does
not work. It is necessary to educate and raise awareness in order to influence and
empower environmentally responsible behavior. Effective educational programs have to
be developed that are aimed at age groups, schools and the general public, and that are
delivered continuously and relentlessly to try to especially reach those sectors of the
population that are more directly related to the production and management of waste.
Nevertheless, the biggest issue is still the lack of participation. We will only be
successful in our efforts to actively involve the people, if we are able, as state and regional
municipal authorities, to open the management and study processes to participation, in
particular decision-making.
We must educate to foster participation, seeking to create cooperation to avoid
conflict (the social and territorial conflicts that are inherent in waste management) and
the NIMBY (Not in My Back Yard) effect.
The idea of public participation still contains a number of questions that have to
be solved quickly:Who participates? How? Where?
We should go beyond the normal consultation processes to generate participative
dynamics that can favor change processes that in turn would open new ways of under-
standing waste management as resource management.
In the attached table the principal differences between consultation and partici-
pation are summarized
Consultation Participation
Agreement on an issue Come to a practical objective
Individual responses but also public meetings Different agencies, groups and/or individuals
Sporadic meetings Frequent periodic meetings
No need to establish a relationship with representatives Relationships between people and the agents of the various sectors vital
A series of formal rules A mode of work that evolves over time
Those that look for different points of view often decide on the result Shared decision-making
5.2.1. Education and Awareness, or TrainingEnvironmental education is a multi-dimensional and comprehensive process of
acquiring knowledge, skills (know-how: experiences and responsibilities) and values
(approaches) that combined allows one to take action against the environmental crisis.
Environmental training defines the teachings that a specific and specialized field
in science takes as a reference point with regards to the environment (Sauvé 1994).
5.2. EnvironmentalEducation andAwareness
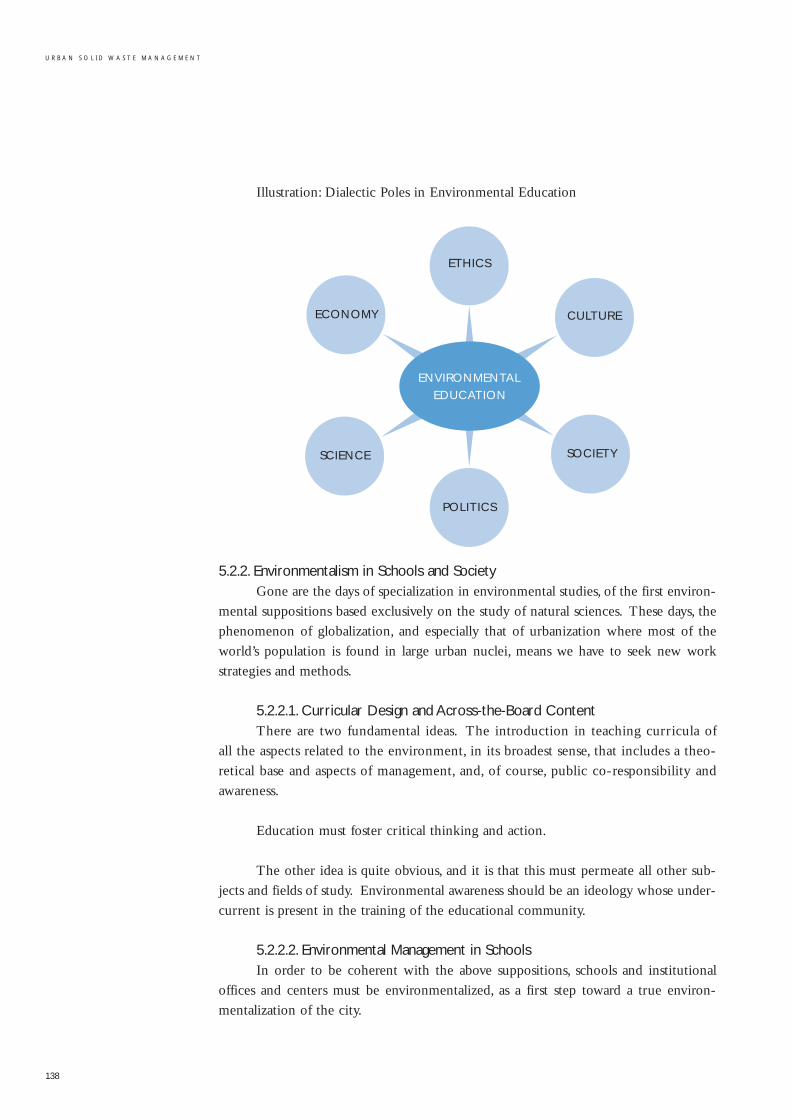
Illustration: Dialectic Poles in Environmental Education
5.2.2. Environmentalism in Schools and SocietyGone are the days of specialization in environmental studies, of the first environ-
mental suppositions based exclusively on the study of natural sciences. These days, the
phenomenon of globalization, and especially that of urbanization where most of the
world’s population is found in large urban nuclei, means we have to seek new work
strategies and methods.
5.2.2.1. Curricular Design and Across-the-Board ContentThere are two fundamental ideas. The introduction in teaching curricula of
all the aspects related to the environment, in its broadest sense, that includes a theo-
retical base and aspects of management, and, of course, public co-responsibility and
awareness.
Education must foster critical thinking and action.
The other idea is quite obvious, and it is that this must permeate all other sub-
jects and fields of study. Environmental awareness should be an ideology whose under-
current is present in the training of the educational community.
5.2.2.2. Environmental Management in SchoolsIn order to be coherent with the above suppositions, schools and institutional
offices and centers must be environmentalized, as a first step toward a true environ-
mentalization of the city.
138
U R B A N S O L I D W A S T E M A N A G E M E N T
ETHICS
CULTURE
SOCIETY
POLITICS
SCIENCE
ECONOMY
ENVIRONMENTALEDUCATION
E N V I R O N M E N T A L E D U C A T I O N , C O M M U N I C A T I O N A N D P U B L I C P A R T I C I P A T I O N
139
This means that schools must look at practicing what they preach and become
model examples. This means control over the building design to incorporate bioclimatic
elements, alternative energy, clean and non-contaminating materials and/or recycled
ones, non-toxic paint, etc.
It also means that schools and offices must provide the channels and mechanisms
for separate waste collection; organic, packaging, paper, etc, and its subsequent reuse or
recycling.
5.2.3. Educational Programs. Experiences.Some of these ideas have started to take hold. In Catalonia, the Generalitat is
promoting together with some municipalities “The Green School Network”, fostering
comprehensive sustainable management in schools.
www.mediambient.gencat.net/ciutadans/educacio_ambiental/escoles_verdes
5.2.3.1. Specialized CentersOther experiences involve the construction and activation of specialized centers
such as the Centers for Environmental Education, Centers for the Interpretation of
Nature, Nature Houses and Centers for the Promotion of Waste Management.
5.2.3.2. Publications and CampaignsThere are many experiences involving a multitude of informative and promo-
tional publications on a vast number of environmental issues and on the broad mosaic
that is waste management (Sharing the Future; Door-to-Door Campaign).
Seasonal campaigns in the different media, i.e., audiovisual, printed, etc, and espe-
cially group visits to waste treatment centers, usually give good results. A visit to a
dump or a composting plant gives the message loud and clear of the type of problems
we are facing.
Unlike environmental education, whose basic objective is to transmit values,
information and communication in principal aim to reach citizens with information or
practical guidelines that will help them carry out their responsibilities. In this case for
example, it would address the aim of the environmental treatment of waste, and what
the procedures for its separation are.
Information and communication activities that can be carried out include:
specific awareness campaigns, websites with an interactive consultation section, local
magazines and bulletins, radio and television programs, posters, exhibition of materials
and recycled products, visits to waste management facilities or workshops on home
composting or paper recycling.
5.3. Information and Communication
5.3.1. Information and InstructionWhen we talk about information we refer to the unidirectional transmission of
information and knowledge whose principal aim is to transmit data, objectives, results
and messages.
Instruction requires a change in attitude and habit, and through these changes it
seeks adaptation to the new management model, in this case, waste, i.e., separating
paper, organic material, going to collection centers or bins, etc.
5.3.2. Publicity and MarketingIn publicity and environmental management, in order to establish strategies that
will modify habits and behaviors making them more environmentally responsible, we
have to address four different areas in personal and group behavior patterns, in a coor-
dinated manner.
• Rationality
• Emotional, i.e., appealing to emotions associated with certain living conditions,
places and situations (real or imaginary). It could have positive or negative con-
notations.
• Functionality and commodity. All living things tend to adapt, but there is also
the law of ‘the path of least effort’.
• Belonging and social control. People need to belong, to be affiliated and feel a
part of something, which is the basis of their socialization. Their group of peers
and norms.
5.3.3. New TechnologiesIn today’s society, new technologies are gaining more ground and protagonism.
Primordially there is the phenomenon of the Internet that gives us quick access to large
amounts of information on virtually every subject and from virtually any part of the
world.With the help of the Internet and emails, we can be in constant contact with others
to interchange experiences, make consultations, etc.
Two clear examples are:
The website of Metropolis Commission 3:
http://topics.developmentgateway.org/urban/urbanwaste
and
The website of the Barcelona-based Metropolitan Environment Organization:
www.ema-amb.com
Both of these work on the basis of a virtual community, together with techni-
cians and experts that form part of these organizations, and on a different level with all
those people who are interested in environmental problems and waste management.
140
U R B A N S O L I D W A S T E M A N A G E M E N T
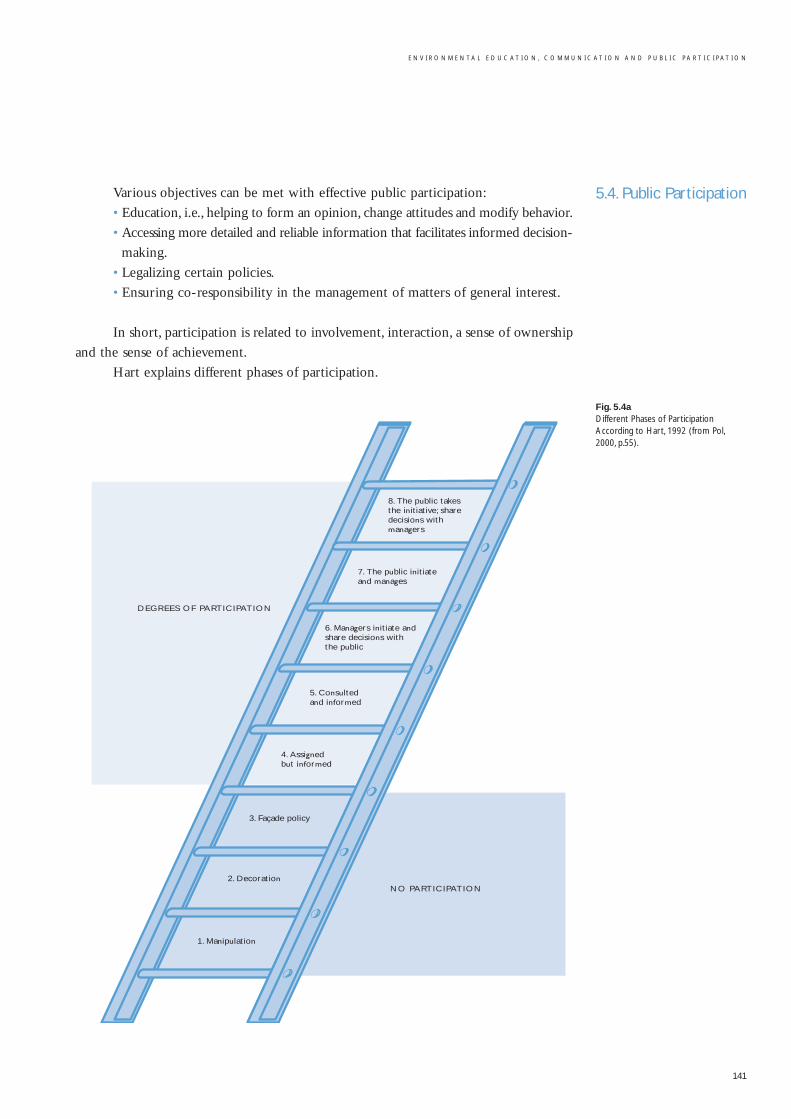
E N V I R O N M E N T A L E D U C A T I O N , C O M M U N I C A T I O N A N D P U B L I C P A R T I C I P A T I O N
5.4. Public Participation
Fig. 5.4a Different Phases of ParticipationAccording to Hart, 1992 (from Pol,2000, p.55).
141
8. The public takesthe initiative; sharedecisions with managers
7. The public initiateand manages
6. Managers initiate andshare decisions withthe public
5. Consultedand informed
4. Assignedbut informed
3. Façade policy
2. Decoration
1. Manipulation
DEGREES OF PARTICIPATION
NO PARTICIPATION
Various objectives can be met with effective public participation:
• Education, i.e., helping to form an opinion, change attitudes and modify behavior.
• Accessing more detailed and reliable information that facilitates informed decision-
making.
• Legalizing certain policies.
• Ensuring co-responsibility in the management of matters of general interest.
In short, participation is related to involvement, interaction, a sense of ownership
and the sense of achievement.
Hart explains different phases of participation.
Because society is increasingly more critical and reflective, traditional democratic
governments find it increasingly difficult to manage environmental issues efficiently.
This is why we need a government with more wide-ranging powers that will
involve different actors in a multidisciplinary network that uses new instruments and
takes on new roles to advance toward new waste management models that encompass
sustainability criteria. Technocratic alternatives, or those that base participation on the
lower levels of Hart’s ladder, do not reinforce democracy but rather worsen it. Many of
the decisions made in the area of waste management and that require a large degree of
technical consensus will not easily move toward social consensus if alternatives, costs,
benefits and the best available solutions from every aspect of sustainability are not put
on the table and widely discussed.
5.4.1.Agents That Obstruct ParticipationAmongst the agents that obstruct participation we find the tendency to take the
path of least effort, the NIMBY phenomenon, feelings of frustration and vulnerability,
lack of training, inaccessibility to decision-making bodies, the inhibition of responsibility,
a profit-orientated culture, contradictory messages by the mass media, lack of credibility
and prestige, no understanding of the channels of participation, etc.
We need to expand a little further on the NIMBY phenomenon, as it is be-
coming the most commonly adopted attitude when there is a proposal for waste facilities
near inhabited areas where certain projects end up being rejected by the people. This
attitude is often the result of the uncertainty regarding the true risks that certain activ-
ities involve, and a reflection of the mistrust people have of the Administration or of the
promoters of the project.The people that would be potentially affected by the activity
or facilities could think that they have to put up with the negative effects of an acti-
vity that benefits the rest of society. Therefore, social-perception studies on environ-
mental risks suggest that the NIMBY syndrome is a reaction with quite a complex
nature that is made up of fear of environmental and economic deterioration, mistrust of
industry and institutions, and feelings of victimization. Other concepts related to
NIMBY are LULU (locally unacceptable land use) and BANANA (Build Absolutely
Nothing at All Near Anybody).
Participative dynamics can help reduce these types of phenomenon; communication
of problems, examination of alternatives, explaining risks, creating a co-operative spirit and
sharing responsibility. This is why an accountable decision-making process is fundamental.
5.4.2.Agents That Promote ParticipationThese include feelings of attachment and identification with a place, and of
ownership. Identification with a place promotes responsibility, habits and lifestyles,
accessibility to real decision-making bodies and the possibility of having a part in deci-
142
U R B A N S O L I D W A S T E M A N A G E M E N T
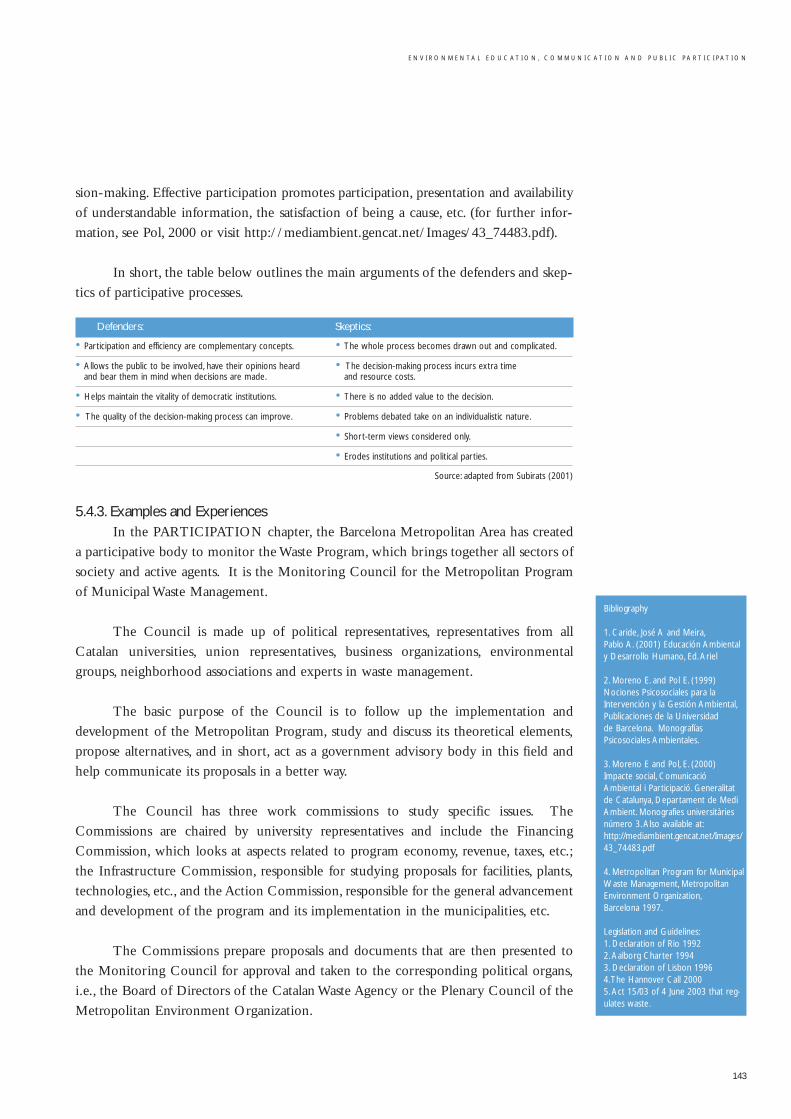
E N V I R O N M E N T A L E D U C A T I O N , C O M M U N I C A T I O N A N D P U B L I C P A R T I C I P A T I O N
143
sion-making. Effective participation promotes participation, presentation and availability
of understandable information, the satisfaction of being a cause, etc. (for further infor-
mation, see Pol, 2000 or visit http://mediambient.gencat.net/Images/43_74483.pdf).
In short, the table below outlines the main arguments of the defenders and skep-
tics of participative processes.
Defenders: Skeptics:
Source: adapted from Subirats (2001)
5.4.3. Examples and ExperiencesIn the PARTICIPATION chapter, the Barcelona Metropolitan Area has created
a participative body to monitor the Waste Program, which brings together all sectors of
society and active agents. It is the Monitoring Council for the Metropolitan Program
of Municipal Waste Management.
The Council is made up of political representatives, representatives from all
Catalan universities, union representatives, business organizations, environmental
groups, neighborhood associations and experts in waste management.
The basic purpose of the Council is to follow up the implementation and
development of the Metropolitan Program, study and discuss its theoretical elements,
propose alternatives, and in short, act as a government advisory body in this field and
help communicate its proposals in a better way.
The Council has three work commissions to study specific issues. The
Commissions are chaired by university representatives and include the Financing
Commission, which looks at aspects related to program economy, revenue, taxes, etc.;
the Infrastructure Commission, responsible for studying proposals for facilities, plants,
technologies, etc., and the Action Commission, responsible for the general advancement
and development of the program and its implementation in the municipalities, etc.
The Commissions prepare proposals and documents that are then presented to
the Monitoring Council for approval and taken to the corresponding political organs,
i.e., the Board of Directors of the Catalan Waste Agency or the Plenary Council of the
Metropolitan Environment Organization.
• Participation and efficiency are complementary concepts.
• Allows the public to be involved, have their opinions heardand bear them in mind when decisions are made.
• Helps maintain the vitality of democratic institutions.
• The quality of the decision-making process can improve.
• The whole process becomes drawn out and complicated.
• The decision-making process incurs extra time and resource costs.
• There is no added value to the decision.
• Problems debated take on an individualistic nature.
• Short-term views considered only.
• Erodes institutions and political parties.
Bibliography
1. Caride, José A and Meira,Pablo A. (2001) Educación Ambientaly Desarrollo Humano, Ed. Ariel
2. Moreno E. and Pol E. (1999)Nociones Psicosociales para laIntervención y la Gestión Ambiental,Publicaciones de la Universidad de Barcelona. MonografíasPsicosociales Ambientales.
3. Moreno E and Pol, E. (2000)Impacte social, ComunicacióAmbiental i Participació. Generalitatde Catalunya, Departament de MediAmbient. Monografies universitàriesnúmero 3. Also available at:http://mediambient.gencat.net/Images/43_74483.pdf
4. Metropolitan Program for MunicipalWaste Management, MetropolitanEnvironment Organization,Barcelona 1997.
Legislation and Guidelines:1. Declaration of Rio 19922. Aalborg Charter 19943. Declaration of Lisbon 19964.The Hannover Call 20005. Act 15/03 of 4 June 2003 that reg-ulates waste.
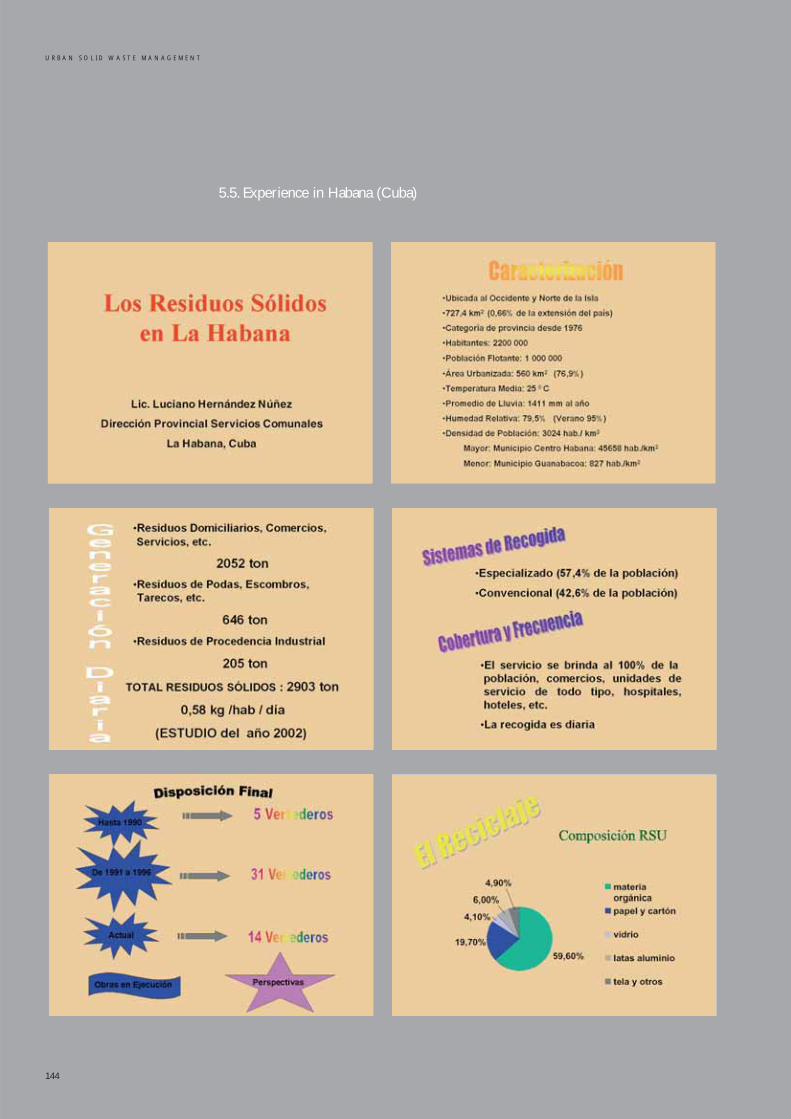
5.5. Experience in Habana (Cuba)
144
U R B A N S O L I D W A S T E M A N A G E M E N T
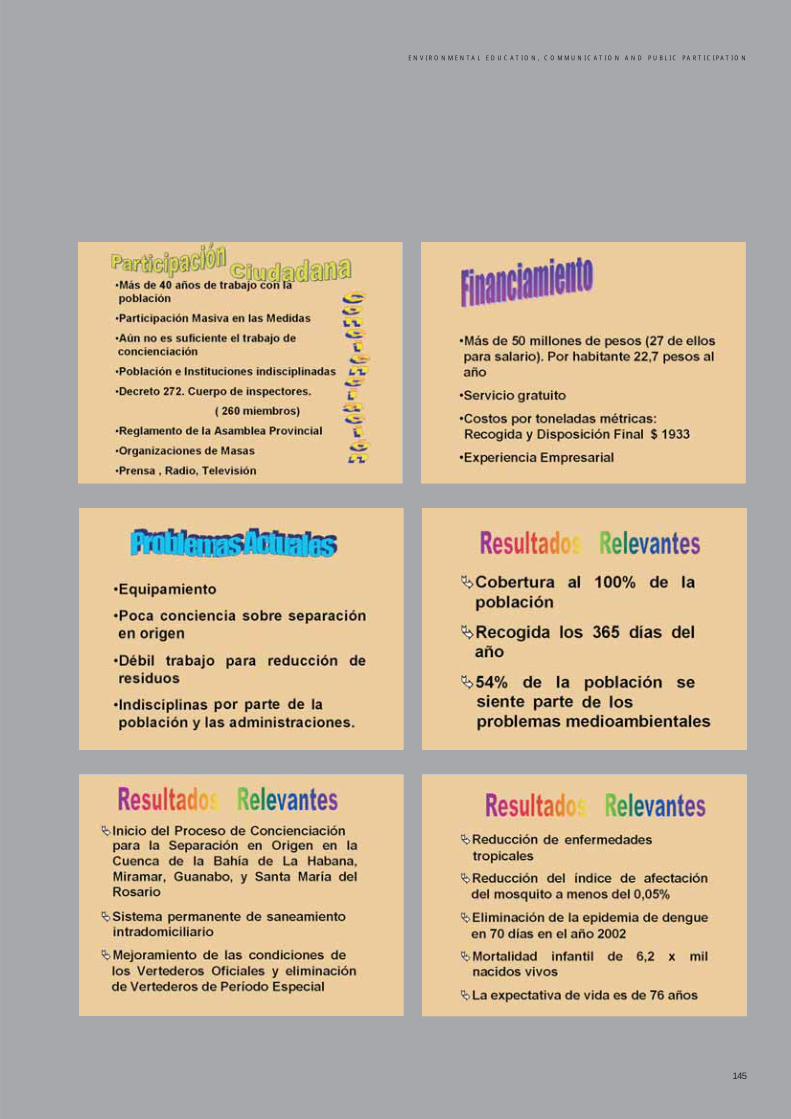
E N V I R O N M E N T A L E D U C A T I O N , C O M M U N I C A T I O N A N D P U B L I C P A R T I C I P A T I O N
145
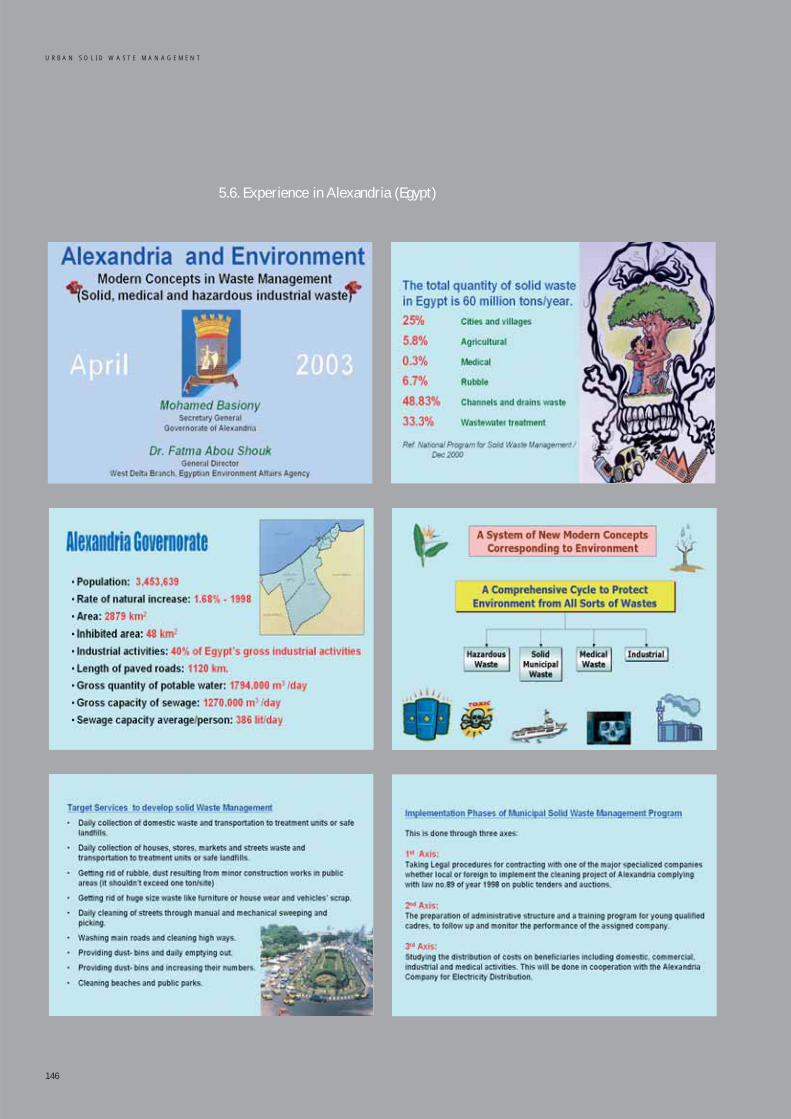
5.6. Experience in Alexandria (Egypt)
146
U R B A N S O L I D W A S T E M A N A G E M E N T
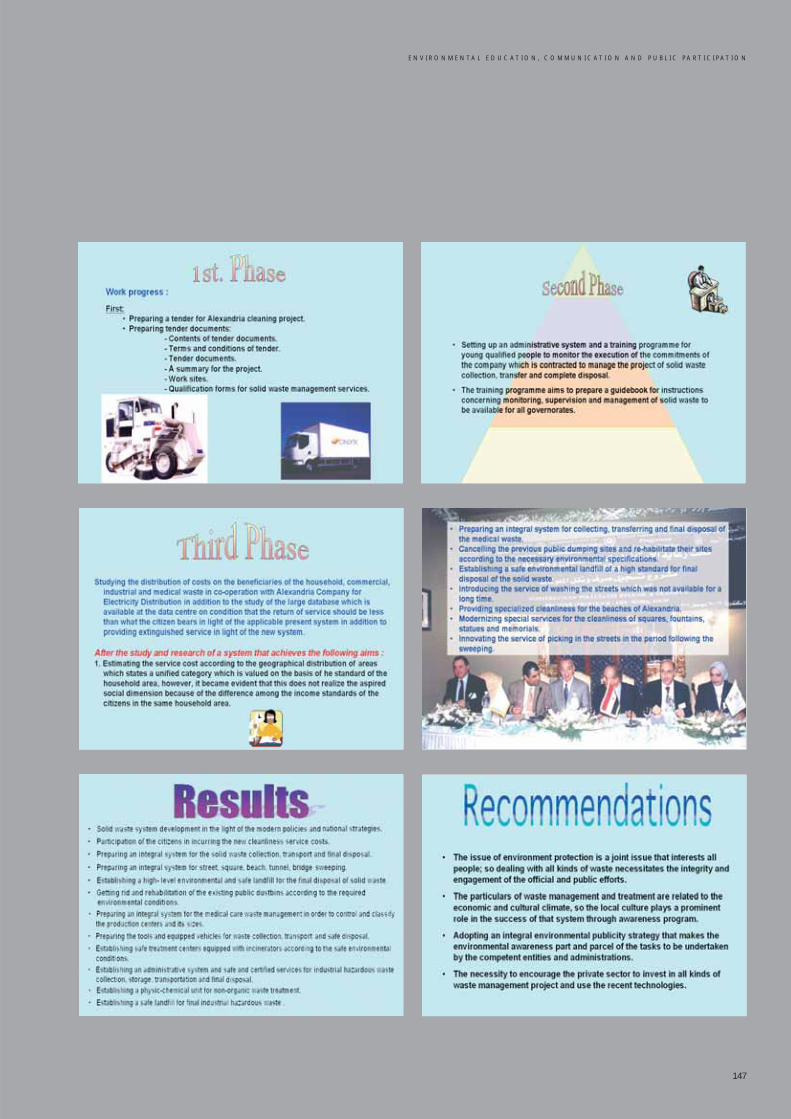
E N V I R O N M E N T A L E D U C A T I O N , C O M M U N I C A T I O N A N D P U B L I C P A R T I C I P A T I O N
147

148
URBAN SOLID WASTE MANAGEMENT
6. Bibliography,Websites and Waste Sector Companies
150
6. Bibliography, Websites and Waste Sector Companies . . . . . . . . . . . . . . . . . . . . . . . . . . . . . . . . . . . . . . . . . . . . . . . . . . . . . . . . . . . . . . . . . . 151
6.1. Directory of waste technicians in Metropolis (Commission 3):. . . . . . . . . . . . . . . . . . . . . . . . . . . . . . . . . . . . . . . . . . . . . . . . . . . . . . 151
6.2. Bibliography on Waste . . . . . . . . . . . . . . . . . . . . . . . . . . . . . . . . . . . . . . . . . . . . . . . . . . . . . . . . . . . . . . . . . . . . . . . . . . . . . . . . . . . . . . . . . . . . . . . . . . . . . . . . . . . 152
6.3. Websites on Waste Matters . . . . . . . . . . . . . . . . . . . . . . . . . . . . . . . . . . . . . . . . . . . . . . . . . . . . . . . . . . . . . . . . . . . . . . . . . . . . . . . . . . . . . . . . . . . . . . . . . . . . . . 152
6.4. Waste Sector Companies and Organizations. . . . . . . . . . . . . . . . . . . . . . . . . . . . . . . . . . . . . . . . . . . . . . . . . . . . . . . . . . . . . . . . . . . . . . . . . . . . . . . 152
INDEX
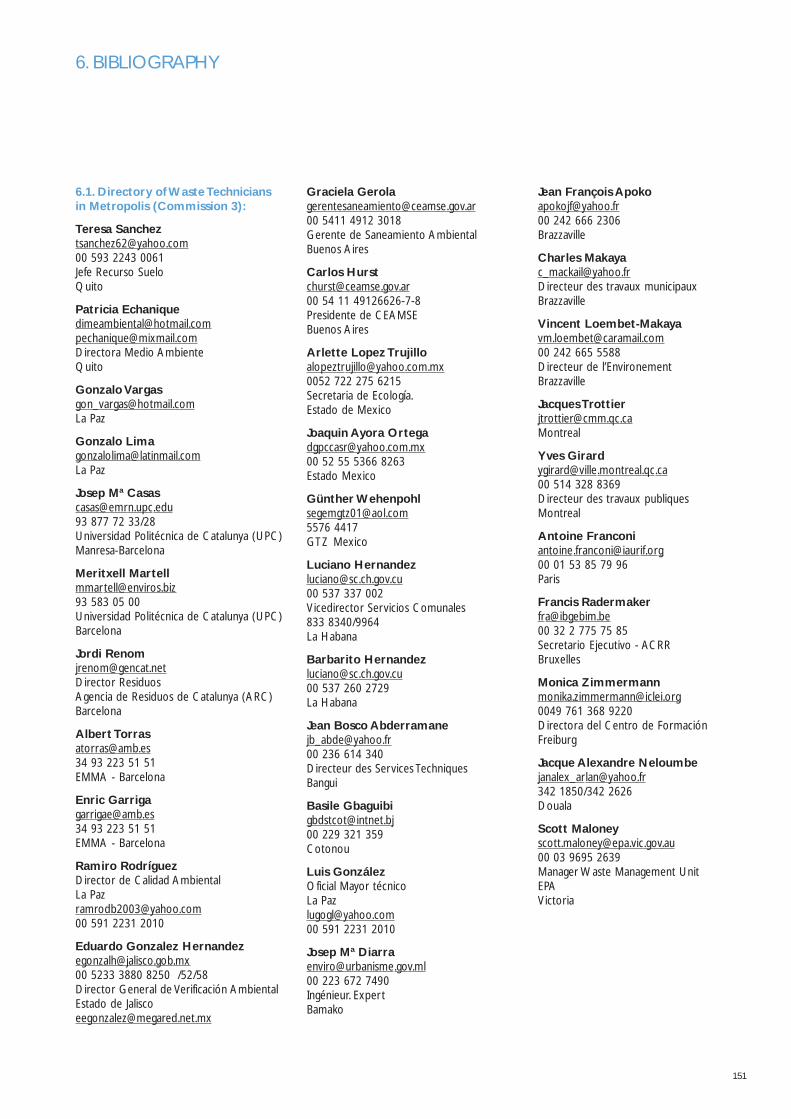
6. BIBLIOGRAPHY
151
6.1. Directory of Waste Technicians in Metropolis (Commission 3):
Teresa Sanchez [email protected] 593 2243 0061Jefe Recurso SueloQuito
Patricia Echanique [email protected]@mixmail.comDirectora Medio AmbienteQuito
Gonzalo Vargas [email protected] Paz
Gonzalo Lima [email protected] Paz
Josep Mª Casas [email protected] 877 72 33/28Universidad Politécnica de Catalunya (UPC)Manresa-Barcelona
Meritxell Martell [email protected] 583 05 00Universidad Politécnica de Catalunya (UPC)Barcelona
Jordi Renom [email protected] Residuos Agencia de Residuos de Catalunya (ARC)Barcelona
Albert Torras [email protected] 93 223 51 51EMMA - Barcelona
Enric Garriga [email protected] 93 223 51 51EMMA - Barcelona
Ramiro RodríguezDirector de Calidad AmbientalLa [email protected] 591 2231 2010
Eduardo Gonzalez Hernandez [email protected] 5233 3880 8250 /52/58 Director General de Verificación AmbientalEstado de Jalisco [email protected]
Graciela Gerola [email protected] 5411 4912 3018Gerente de Saneamiento AmbientalBuenos Aires
Carlos Hurst [email protected] 54 11 49126626-7-8Presidente de CEAMSEBuenos Aires
Arlette Lopez Trujillo [email protected] 722 275 6215Secretaria de Ecología.Estado de Mexico
Joaquin Ayora [email protected] 52 55 5366 8263Estado Mexico
Günther [email protected] 4417GTZ Mexico
Luciano [email protected] 537 337 002Vicedirector Servicios Comunales 833 8340/9964 La Habana
Barbarito [email protected] 537 260 2729La Habana
Jean Bosco [email protected] 236 614 340Directeur des Services TechniquesBangui
Basile Gbaguibi [email protected] 229 321 359Cotonou
Luis GonzálezOficial Mayor técnicoLa [email protected] 591 2231 2010
Josep Mª [email protected] 223 672 7490Ingénieur. ExpertBamako
Jean François Apoko [email protected] 242 666 2306Brazzaville
Charles Makaya [email protected] des travaux municipauxBrazzaville
Vincent Loembet-Makaya [email protected] 242 665 5588Directeur de l’EnvironementBrazzaville
Jacques Trottier [email protected]
Yves [email protected] 514 328 8369Directeur des travaux publiquesMontreal
Antoine Franconi [email protected] 01 53 85 79 96 Paris
Francis Radermaker [email protected] 32 2 775 75 85Secretario Ejecutivo - ACRRBruxelles
Monica Zimmermann [email protected] 761 368 9220Directora del Centro de FormaciónFreiburg
Jacque Alexandre Neloumbe [email protected] 1850/342 2626Douala
Scott [email protected] 03 9695 2639Manager Waste Management UnitEPAVictoria
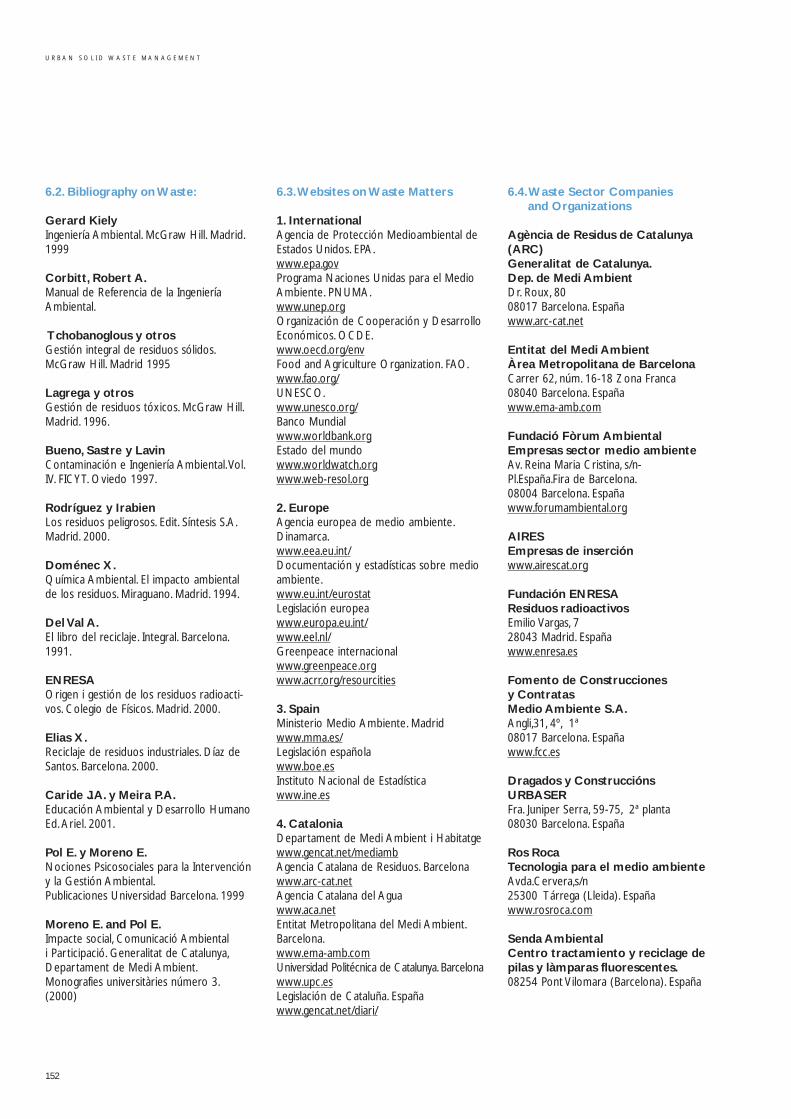
6.2. Bibliography on Waste:
Gerard KielyIngeniería Ambiental. McGraw Hill. Madrid.1999
Corbitt, Robert A.Manual de Referencia de la IngenieríaAmbiental.
Tchobanoglous y otrosGestión integral de residuos sólidos.McGraw Hill. Madrid 1995
Lagrega y otrosGestión de residuos tóxicos. McGraw Hill.Madrid. 1996.
Bueno, Sastre y LavinContaminación e Ingeniería Ambiental.Vol.IV. FICYT. Oviedo 1997.
Rodríguez y IrabienLos residuos peligrosos. Edit. Síntesis S.A.Madrid. 2000.
Doménec X.Química Ambiental. El impacto ambientalde los residuos. Miraguano. Madrid. 1994.
Del Val A.El libro del reciclaje. Integral. Barcelona.1991.
ENRESAOrigen i gestión de los residuos radioacti-vos. Colegio de Físicos. Madrid. 2000.
Elias X.Reciclaje de residuos industriales. Díaz deSantos. Barcelona. 2000.
Caride J.A. y Meira P.A.Educación Ambiental y Desarrollo HumanoEd. Ariel. 2001.
Pol E. y Moreno E.Nociones Psicosociales para la Intervencióny la Gestión Ambiental.Publicaciones Universidad Barcelona. 1999
Moreno E. and Pol E.Impacte social, Comunicació Ambiental i Participació. Generalitat de Catalunya,Departament de Medi Ambient.Monografies universitàries número 3.(2000)
6.3.Websites on Waste Matters
1. InternationalAgencia de Protección Medioambiental deEstados Unidos. EPA.www.epa.govPrograma Naciones Unidas para el MedioAmbiente. PNUMA.www.unep.orgOrganización de Cooperación y DesarrolloEconómicos. OCDE.www.oecd.org/envFood and Agriculture Organization. FAO.www.fao.org/UNESCO.www.unesco.org/Banco Mundialwww.worldbank.orgEstado del mundowww.worldwatch.orgwww.web-resol.org
2. EuropeAgencia europea de medio ambiente.Dinamarca.www.eea.eu.int/Documentación y estadísticas sobre medioambiente.www.eu.int/eurostatLegislación europeawww.europa.eu.int/www.eel.nl/Greenpeace internacionalwww.greenpeace.orgwww.acrr.org/resourcities
3. SpainMinisterio Medio Ambiente. Madridwww.mma.es/Legislación españolawww.boe.esInstituto Nacional de Estadísticawww.ine.es
4. CataloniaDepartament de Medi Ambient i Habitatgewww.gencat.net/mediambAgencia Catalana de Residuos. Barcelonawww.arc-cat.netAgencia Catalana del Aguawww.aca.netEntitat Metropolitana del Medi Ambient.Barcelona.www.ema-amb.comUniversidad Politécnica de Catalunya. Barcelonawww.upc.esLegislación de Cataluña. Españawww.gencat.net/diari/
6.4.Waste Sector Companies and Organizations
Agència de Residus de Catalunya(ARC)Generalitat de Catalunya.Dep. de Medi AmbientDr. Roux, 8008017 Barcelona. Españawww.arc-cat.net
Entitat del Medi AmbientÀrea Metropolitana de BarcelonaCarrer 62, núm. 16-18 Zona Franca08040 Barcelona. Españawww.ema-amb.com
Fundació Fòrum AmbientalEmpresas sector medio ambienteAv. Reina Maria Cristina, s/n-Pl.España.Fira de Barcelona.08004 Barcelona. Españawww.forumambiental.org
AIRESEmpresas de inserciónwww.airescat.org
Fundación ENRESAResiduos radioactivosEmilio Vargas, 728043 Madrid. Españawww.enresa.es
Fomento de Construcciones y ContratasMedio Ambiente S.A.Angli,31, 4º, 1ª08017 Barcelona. Españawww.fcc.es
Dragados y Construccións URBASERFra. Juniper Serra, 59-75, 2ª planta08030 Barcelona. España
Ros RocaTecnologia para el medio ambienteAvda.Cervera,s/n25300 Tárrega (Lleida). Españawww.rosroca.com
Senda AmbientalCentro tractamiento y reciclage depilas y làmparas fluorescentes.08254 Pont Vilomara (Barcelona). España
152
U R B A N S O L I D W A S T E M A N A G E M E N T
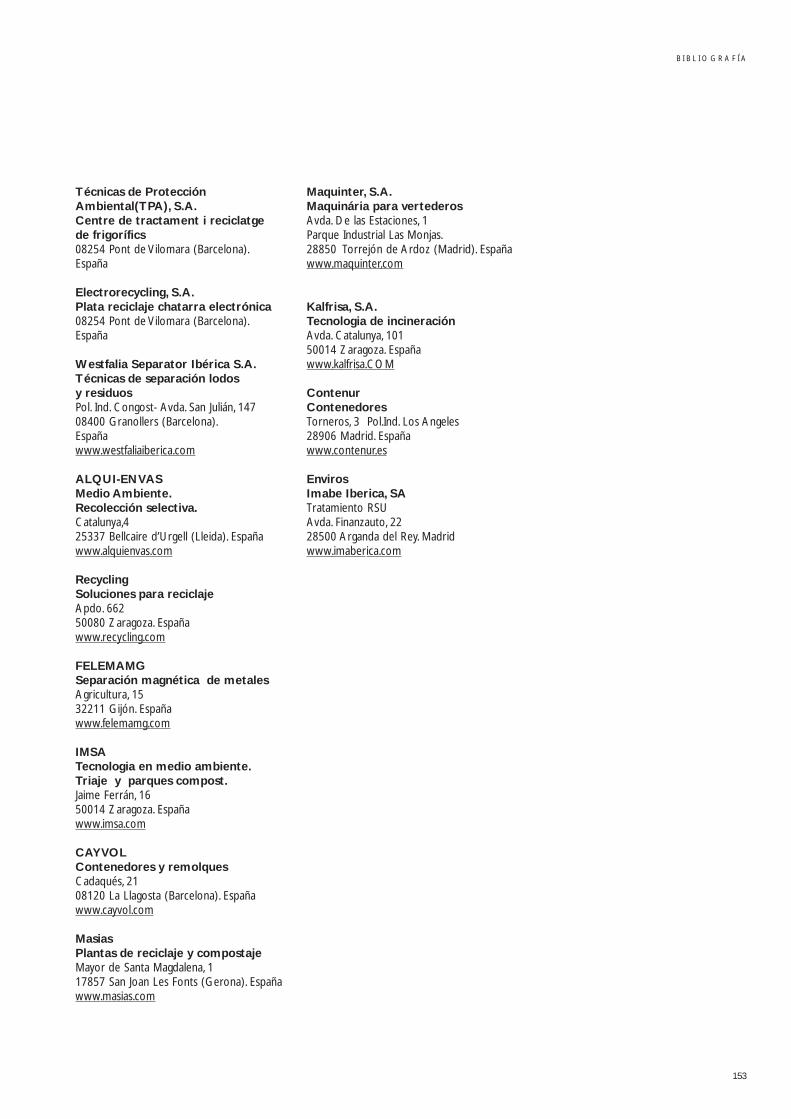
B I B L I O G R A F Í A
153
Técnicas de ProtecciónAmbiental(TPA), S.A.Centre de tractament i reciclatge de frigorífics08254 Pont de Vilomara (Barcelona).España
Electrorecycling, S.A.Plata reciclaje chatarra electrónica08254 Pont de Vilomara (Barcelona).España
Westfalia Separator Ibérica S.A.Técnicas de separación lodos y residuosPol. Ind. Congost- Avda. San Julián, 14708400 Granollers (Barcelona).Españawww.westfaliaiberica.com
ALQUI-ENVASMedio Ambiente.Recolección selectiva.Catalunya,425337 Bellcaire d’Urgell (Lleida). Españawww.alquienvas.com
RecyclingSoluciones para reciclajeApdo. 66250080 Zaragoza. Españawww.recycling.com
FELEMAMGSeparación magnética de metalesAgricultura, 1532211 Gijón. Españawww.felemamg.com
IMSATecnologia en medio ambiente.Triaje y parques compost.Jaime Ferrán, 1650014 Zaragoza. Españawww.imsa.com
CAYVOLContenedores y remolquesCadaqués, 2108120 La Llagosta (Barcelona). Españawww.cayvol.com
MasiasPlantas de reciclaje y compostajeMayor de Santa Magdalena, 117857 San Joan Les Fonts (Gerona). Españawww.masias.com
Maquinter, S.A.Maquinária para vertederosAvda. De las Estaciones, 1Parque Industrial Las Monjas.28850 Torrejón de Ardoz (Madrid). Españawww.maquinter.com
Kalfrisa, S.A.Tecnologia de incineración Avda. Catalunya, 10150014 Zaragoza. Españawww.kalfrisa.COM
ContenurContenedoresTorneros, 3 Pol.Ind. Los Angeles28906 Madrid. Españawww.contenur.es
EnvirosImabe Iberica, SATratamiento RSUAvda. Finanzauto, 2228500 Arganda del Rey. Madridwww.imaberica.com
MetropolisSecretariat GeneralCalle Avinyó, 1508002 Barcelona, EspañaTel. +34-935 429 460 Fax +34-935 429 [email protected]
Fundació Politècnica de CatalunyaEdifici VèrtexPlaça Eusebi Güell, 608034 Barcelona, EspañaTel. +34-934 017 751 Fax +34-934 017 757www.fpc.es


