
UNAUDITED CONDENSED CONSOLIDATED INTERIM FINANCIAL RESULTS FOR THE SIX MONTHS ENDED 31 AUGUST 2017
Key performance indicators
2016 2017
Revenue
39%2 451
3 401
Rm
2016 2017
Operating margin
11.9%16.5
11.9
%
2016 2017
Operating pro�t before non-operational items
R406m404
406
Rm
2016 2017
Headline earnings per share
(59%)411
170Cen
ts
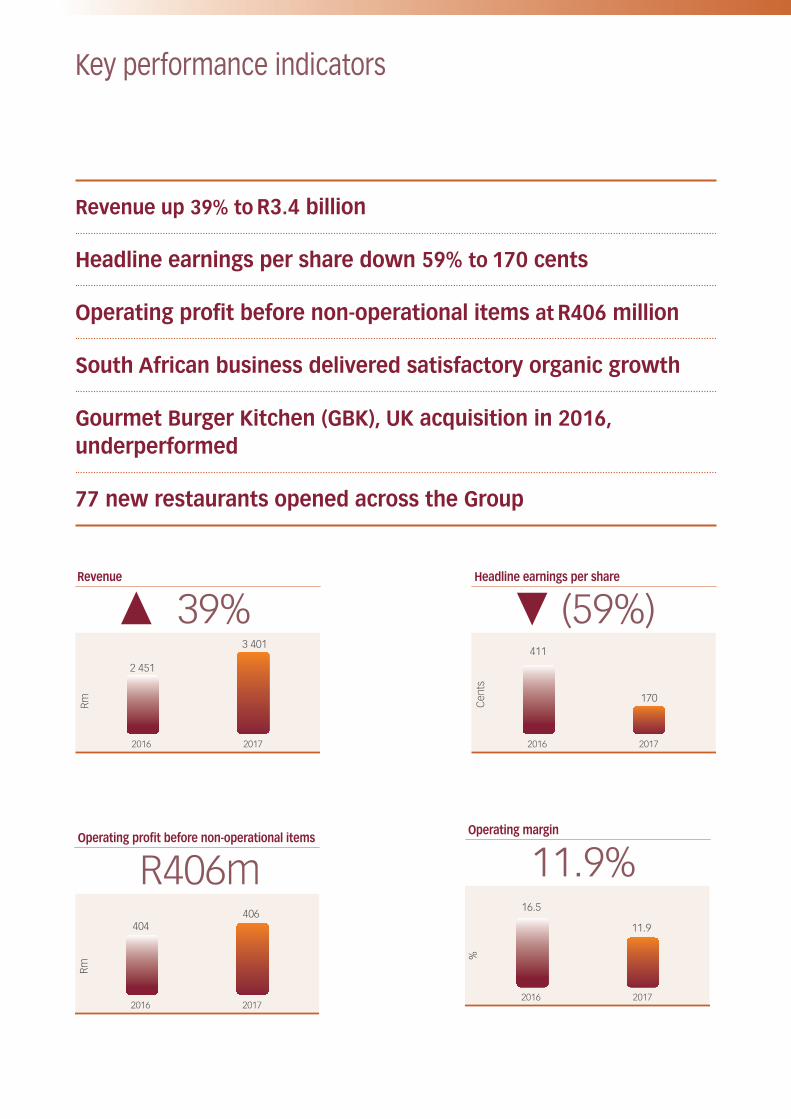
Revenue up 39% to R3.4 billion
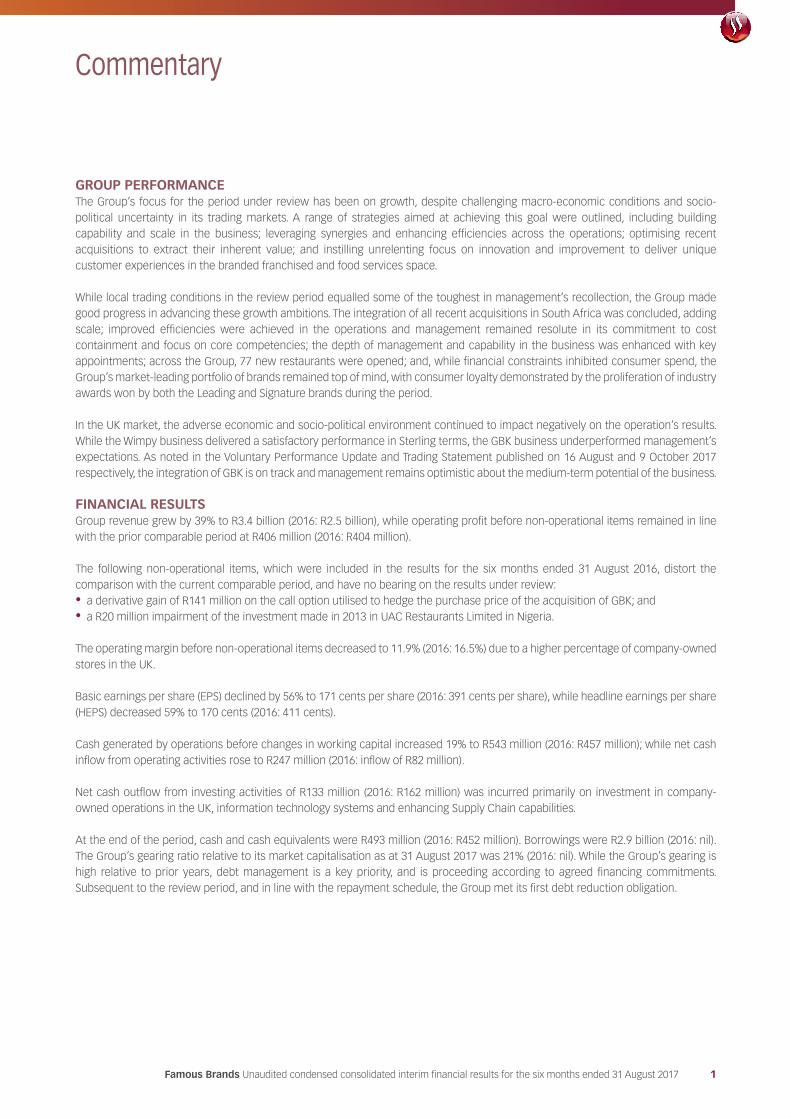
Headline earnings per share down 59% to 170 cents
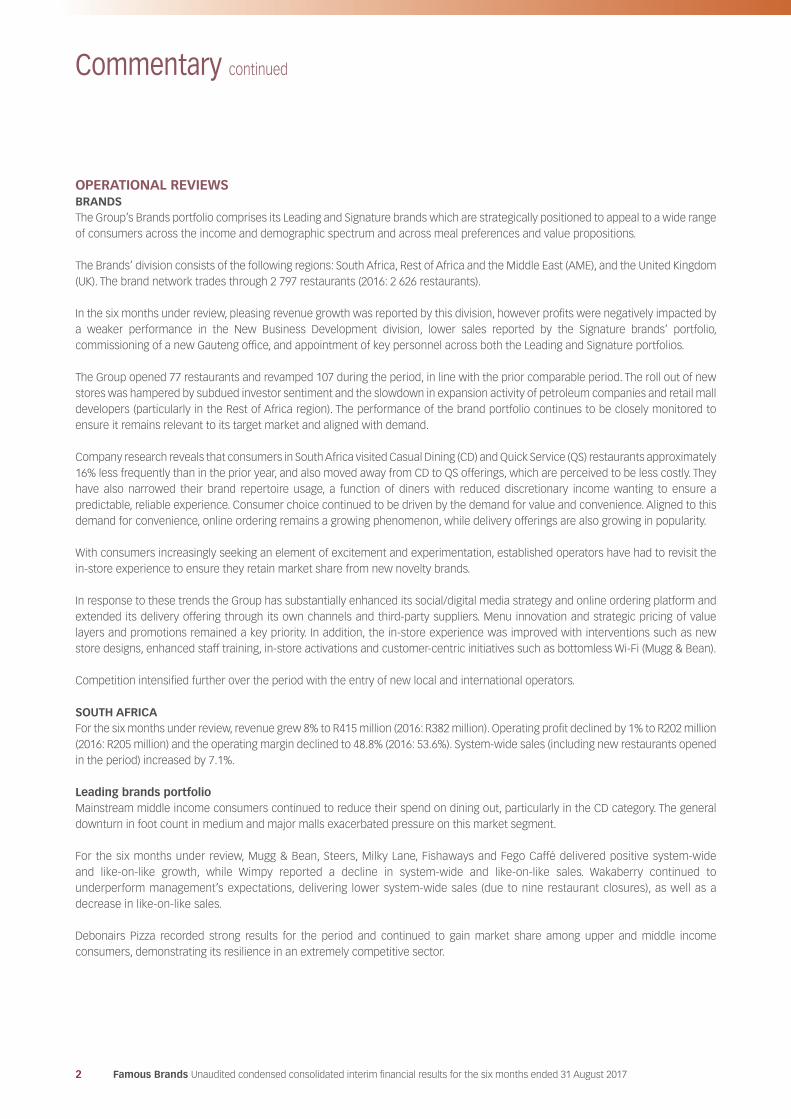
Operating profit before non-operational items at R406 million
South African business delivered satisfactory organic growth
Gourmet Burger Kitchen (GBK), UK acquisition in 2016, underperformed
77 new restaurants opened across the Group
Famous Brands Unaudited condensed consolidated interim financial results for the six months ended 31 August 2017 1
Commentary
GROUP PERFORMANCEThe Group’s focus for the period under review has been on growth, despite challenging macro-economic conditions and socio-political uncertainty in its trading markets. A range of strategies aimed at achieving this goal were outlined, including building capability and scale in the business; leveraging synergies and enhancing efficiencies across the operations; optimising recent acquisitions to extract their inherent value; and instilling unrelenting focus on innovation and improvement to deliver unique customer experiences in the branded franchised and food services space.
While local trading conditions in the review period equalled some of the toughest in management’s recollection, the Group made good progress in advancing these growth ambitions. The integration of all recent acquisitions in South Africa was concluded, adding scale; improved efficiencies were achieved in the operations and management remained resolute in its commitment to cost containment and focus on core competencies; the depth of management and capability in the business was enhanced with key appointments; across the Group, 77 new restaurants were opened; and, while financial constraints inhibited consumer spend, the Group’s market-leading portfolio of brands remained top of mind, with consumer loyalty demonstrated by the proliferation of industry awards won by both the Leading and Signature brands during the period.
In the UK market, the adverse economic and socio-political environment continued to impact negatively on the operation’s results. While the Wimpy business delivered a satisfactory performance in Sterling terms, the GBK business underperformed management’s expectations. As noted in the Voluntary Performance Update and Trading Statement published on 16 August and 9 October 2017 respectively, the integration of GBK is on track and management remains optimistic about the medium-term potential of the business.
FINANCIAL RESULTSGroup revenue grew by 39% to R3.4 billion (2016: R2.5 billion), while operating profit before non-operational items remained in line with the prior comparable period at R406 million (2016: R404 million).
The following non-operational items, which were included in the results for the six months ended 31 August 2016, distort the comparison with the current comparable period, and have no bearing on the results under review:• a derivative gain of R141 million on the call option utilised to hedge the purchase price of the acquisition of GBK; and• a R20 million impairment of the investment made in 2013 in UAC Restaurants Limited in Nigeria.
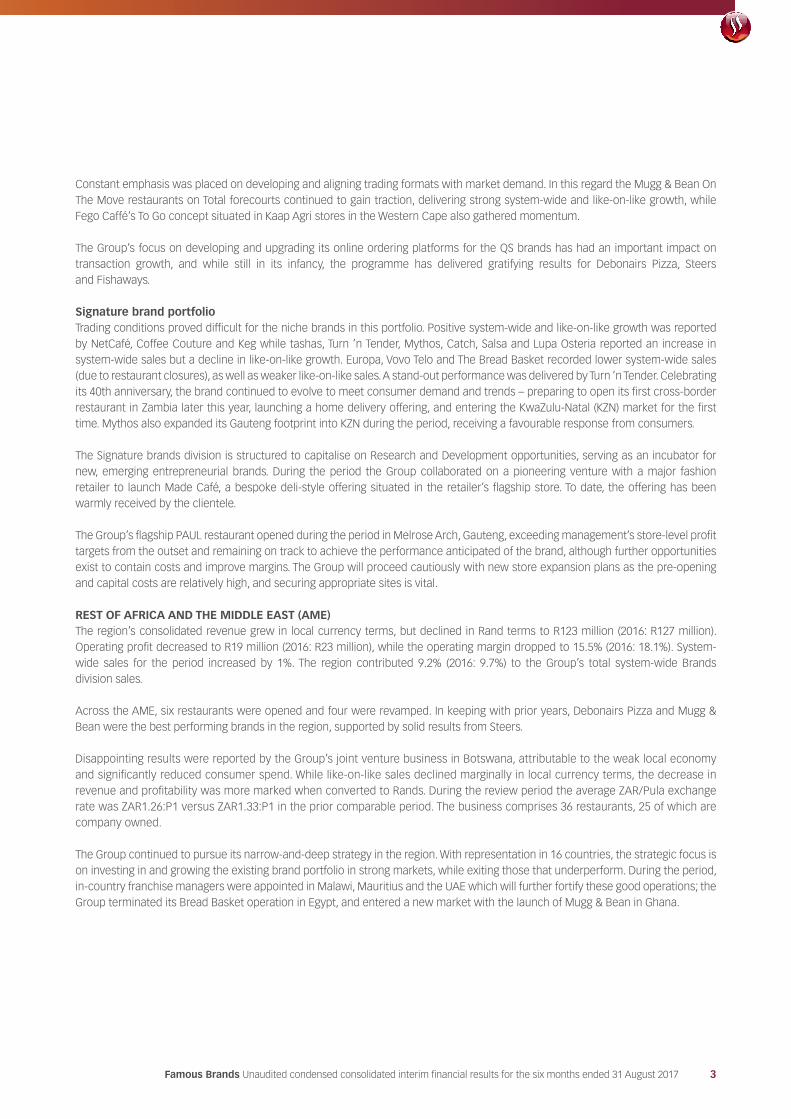
The operating margin before non-operational items decreased to 11.9% (2016: 16.5%) due to a higher percentage of company-owned stores in the UK.
Basic earnings per share (EPS) declined by 56% to 171 cents per share (2016: 391 cents per share), while headline earnings per share (HEPS) decreased 59% to 170 cents (2016: 411 cents).
Cash generated by operations before changes in working capital increased 19% to R543 million (2016: R457 million); while net cash inflow from operating activities rose to R247 million (2016: inflow of R82 million).
Net cash outflow from investing activities of R133 million (2016: R162 million) was incurred primarily on investment in company-owned operations in the UK, information technology systems and enhancing Supply Chain capabilities. At the end of the period, cash and cash equivalents were R493 million (2016: R452 million). Borrowings were R2.9 billion (2016: nil). The Group’s gearing ratio relative to its market capitalisation as at 31 August 2017 was 21% (2016: nil). While the Group’s gearing is high relative to prior years, debt management is a key priority, and is proceeding according to agreed financing commitments. Subsequent to the review period, and in line with the repayment schedule, the Group met its first debt reduction obligation.
2 Famous Brands Unaudited condensed consolidated interim financial results for the six months ended 31 August 2017
Commentary continued
OPERATIONAL REVIEWSBRANDS The Group’s Brands portfolio comprises its Leading and Signature brands which are strategically positioned to appeal to a wide range of consumers across the income and demographic spectrum and across meal preferences and value propositions.
The Brands’ division consists of the following regions: South Africa, Rest of Africa and the Middle East (AME), and the United Kingdom (UK). The brand network trades through 2 797 restaurants (2016: 2 626 restaurants).
In the six months under review, pleasing revenue growth was reported by this division, however profits were negatively impacted by a weaker performance in the New Business Development division, lower sales reported by the Signature brands’ portfolio, commissioning of a new Gauteng office, and appointment of key personnel across both the Leading and Signature portfolios.
The Group opened 77 restaurants and revamped 107 during the period, in line with the prior comparable period. The roll out of new stores was hampered by subdued investor sentiment and the slowdown in expansion activity of petroleum companies and retail mall developers (particularly in the Rest of Africa region). The performance of the brand portfolio continues to be closely monitored to ensure it remains relevant to its target market and aligned with demand.
Company research reveals that consumers in South Africa visited Casual Dining (CD) and Quick Service (QS) restaurants approximately 16% less frequently than in the prior year, and also moved away from CD to QS offerings, which are perceived to be less costly. They have also narrowed their brand repertoire usage, a function of diners with reduced discretionary income wanting to ensure a predictable, reliable experience. Consumer choice continued to be driven by the demand for value and convenience. Aligned to this demand for convenience, online ordering remains a growing phenomenon, while delivery offerings are also growing in popularity.
With consumers increasingly seeking an element of excitement and experimentation, established operators have had to revisit the in-store experience to ensure they retain market share from new novelty brands.
In response to these trends the Group has substantially enhanced its social/digital media strategy and online ordering platform and extended its delivery offering through its own channels and third-party suppliers. Menu innovation and strategic pricing of value layers and promotions remained a key priority. In addition, the in-store experience was improved with interventions such as new store designs, enhanced staff training, in-store activations and customer-centric initiatives such as bottomless Wi-Fi (Mugg & Bean).
Competition intensified further over the period with the entry of new local and international operators.
SOUTH AFRICAFor the six months under review, revenue grew 8% to R415 million (2016: R382 million). Operating profit declined by 1% to R202 million (2016: R205 million) and the operating margin declined to 48.8% (2016: 53.6%). System-wide sales (including new restaurants opened in the period) increased by 7.1%.
Leading brands portfolioMainstream middle income consumers continued to reduce their spend on dining out, particularly in the CD category. The general downturn in foot count in medium and major malls exacerbated pressure on this market segment.
For the six months under review, Mugg & Bean, Steers, Milky Lane, Fishaways and Fego Caffé delivered positive system-wide and like-on-like growth, while Wimpy reported a decline in system-wide and like-on-like sales. Wakaberry continued to underperform management’s expectations, delivering lower system-wide sales (due to nine restaurant closures), as well as a decrease in like-on-like sales.
Debonairs Pizza recorded strong results for the period and continued to gain market share among upper and middle income consumers, demonstrating its resilience in an extremely competitive sector.
Famous Brands Unaudited condensed consolidated interim financial results for the six months ended 31 August 2017 3
Constant emphasis was placed on developing and aligning trading formats with market demand. In this regard the Mugg & Bean On The Move restaurants on Total forecourts continued to gain traction, delivering strong system-wide and like-on-like growth, while Fego Caffé’s To Go concept situated in Kaap Agri stores in the Western Cape also gathered momentum.
The Group’s focus on developing and upgrading its online ordering platforms for the QS brands has had an important impact on transaction growth, and while still in its infancy, the programme has delivered gratifying results for Debonairs Pizza, Steers and Fishaways.
Signature brand portfolioTrading conditions proved difficult for the niche brands in this portfolio. Positive system-wide and like-on-like growth was reported by NetCafé, Coffee Couture and Keg while tashas, Turn ’n Tender, Mythos, Catch, Salsa and Lupa Osteria reported an increase in system-wide sales but a decline in like-on-like growth. Europa, Vovo Telo and The Bread Basket recorded lower system-wide sales (due to restaurant closures), as well as weaker like-on-like sales. A stand-out performance was delivered by Turn ’n Tender. Celebrating its 40th anniversary, the brand continued to evolve to meet consumer demand and trends – preparing to open its first cross-border restaurant in Zambia later this year, launching a home delivery offering, and entering the KwaZulu-Natal (KZN) market for the first time. Mythos also expanded its Gauteng footprint into KZN during the period, receiving a favourable response from consumers.
The Signature brands division is structured to capitalise on Research and Development opportunities, serving as an incubator for new, emerging entrepreneurial brands. During the period the Group collaborated on a pioneering venture with a major fashion retailer to launch Made Café, a bespoke deli-style offering situated in the retailer’s flagship store. To date, the offering has been warmly received by the clientele.
The Group’s flagship PAUL restaurant opened during the period in Melrose Arch, Gauteng, exceeding management’s store-level profit targets from the outset and remaining on track to achieve the performance anticipated of the brand, although further opportunities exist to contain costs and improve margins. The Group will proceed cautiously with new store expansion plans as the pre-opening and capital costs are relatively high, and securing appropriate sites is vital.
REST OF AFRICA AND THE MIDDLE EAST (AME)The region’s consolidated revenue grew in local currency terms, but declined in Rand terms to R123 million (2016: R127 million). Operating profit decreased to R19 million (2016: R23 million), while the operating margin dropped to 15.5% (2016: 18.1%). System-wide sales for the period increased by 1%. The region contributed 9.2% (2016: 9.7%) to the Group’s total system-wide Brands division sales.
Across the AME, six restaurants were opened and four were revamped. In keeping with prior years, Debonairs Pizza and Mugg & Bean were the best performing brands in the region, supported by solid results from Steers.
Disappointing results were reported by the Group’s joint venture business in Botswana, attributable to the weak local economy and significantly reduced consumer spend. While like-on-like sales declined marginally in local currency terms, the decrease in revenue and profitability was more marked when converted to Rands. During the review period the average ZAR/Pula exchange rate was ZAR1.26:P1 versus ZAR1.33:P1 in the prior comparable period. The business comprises 36 restaurants, 25 of which are company owned.
The Group continued to pursue its narrow-and-deep strategy in the region. With representation in 16 countries, the strategic focus is on investing in and growing the existing brand portfolio in strong markets, while exiting those that underperform. During the period, in-country franchise managers were appointed in Malawi, Mauritius and the UAE which will further fortify these good operations; the Group terminated its Bread Basket operation in Egypt, and entered a new market with the launch of Mugg & Bean in Ghana.
4 Famous Brands Unaudited condensed consolidated interim financial results for the six months ended 31 August 2017
Commentary continued
UAEDebonairs Pizza continued to deliver strong like-on-like sales growth despite subdued economic conditions and intense competition in the region. Management’s challenge remains to source suitable franchise partners to grow the brand’s footprint.
GBK’s Dubai and Saudi Arabia restaurants reported a significant slowdown in sales, and the restaurant in Oman was closed. The Master Licensee has subsequently replaced the former management team and a dedicated Franchise Manager has been appointed to the brand. These initiatives are expected to yield an improvement in GBK’s performance in the territory.
During the period, tashas expanded its presence in the region, opening two ‘classic’ restaurants (which conform with local custom), one in Abu Dhabi and the other in Dubai. Post the review period, the brand also launched its signature concept ‘The Flamingo Room’ in Dubai; this restaurant is licensed and offers entertainment, thereby affording the brand access to a new consumer market in the region.
UNITED KINGDOMOverviewFor the purposes of this report, and in order to present an accurate comparison with the prior corresponding period, the pre-existing Wimpy UK business is reported on separately from the GBK business, which was acquired effective 7 October 2016.
In the review period, like-on-like sales across the industry remained flat, failing to offset increased input costs. Over the past three months, food cost inflation accelerated from 2% to 8%, exceeding projections, and combined with higher labour and business rates, continued to pressure margins. Market experts opine that current industry like-on-like sales growth will probably be insufficient to deliver neutral margins in the year ahead, suggesting that growth in sales of between 3% and 6% will be required. In this environment, several under-capitalised competitors have already exited the market and it is anticipated that further consolidation in the industry is likely.
During the review period the average ZAR/GBP exchange rate was ZAR16.78:GBP1 versus ZAR20.51:GBP1 in the prior comparable period.
Wimpy UKRevenue in Rand terms reported for the period declined to R49 million (2016: R58 million), as a function of foreign currency translation. Operating profit decreased by 17% to R8 million (2016: R10 million), and the operating margin declined to 17.2% (2016: 17.6%).
While system-wide sales decreased due to the closure of two restaurants, the business reported like-on-like growth.
The introduction of a new restaurant design is anticipated to have a positive impact on the brand as it is rolled out, with five stores scheduled to undergo a comprehensive revamp over the next two quarters. To date, the first recently revamped restaurant continues to achieve significantly improved sales growth. Store openings for the period were behind budget, however new site prospecting is underway and discussions with existing franchise partners have been fruitful and augur well for growth prospects in the year ahead.
SteersThis brand has exited the market with the closure of its sole remaining store in September 2017.
GBKDuring the review period, GBK’s high-end consumer market shifted from dining casually and often to formally and occasionally, impacting negatively on sales. Furthermore, in the business’s niche category, the range of burger and non-burger offerings increased notably, affording consumers far wider choice than in the previous period.
While this best-in-class brand continues to lead the premium burger category and grew system-wide sales, like-on-like sales declined, reflecting the difficult trading conditions experienced in the period. For the 26 weeks to 27 August 2017, GBK's system-wide sales were 11.1% higher and like-on-like sales 3.2% lower (in Sterling terms) compared to the prior comparable period.
Famous Brands Unaudited condensed consolidated interim financial results for the six months ended 31 August 2017 5
Disappointingly, the business recorded a PBIT loss of GBP872 000 for the period. Higher input costs, significant store pre-opening costs and intensified price competition in the sector resulted in a decline in operating margin from 3.6% in the prior period to (2.1%).
While this poor result is primarily attributable to the prevailing economic and socio-political environment in the UK, a range of interventions are currently being implemented in the business which are anticipated to have a positive impact on future performance. These include intensified focus on the management of new restaurants opened, improved operational efficiencies and enhanced cost controls.
As at 31 August, GBK’s footprint comprised 103 restaurants, with seven restaurants opened during the review period. A flagship restaurant will open in December in Meadowhall Shopping Centre, Sheffield and management is optimistic that the offering is optimally aligned to the site and target market. In the current economic climate, the Board has resolved to curtail the opening of further restaurants in the short term given the high pre-opening capital costs, averaging GBP1 million per restaurant.
GBK’s operation in Ireland, which comprises five restaurants, continued to gain traction following two revamps during the period, while the addition of a new offering to the delivery platform served to grow online sales.
NEW BUSINESS DEVELOPMENT DIVISIONThis unit experienced a difficult six months, reporting lower revenue and profits for the period. This performance is attributable to the slower than anticipated roll out of new stores in the AME, (specifically in the Rest of Africa territories), based on limited economic growth in the region. In addition, increased investment was made in building capacity in the division to facilitate improved efficiencies and contain costs. Remedial steps have been taken to address the sub-standard results reported, with the business being separated into two independent divisions, namely Project Management and Design. The Design component was outsourced to a joint-venture partner, with effect from 1 September 2017, aimed at improving efficiencies and reducing costs in the operation. Management also anticipates that new store roll out and revamps in the second six months of the financial year will accelerate, thereby better leveraging capacity of these business units than occurred in the first six months.
SUPPLY CHAINThe Group’s integrated strategic Supply Chain division comprises its Logistics and Manufacturing operations, which are managed and measured independently. Combined revenue for the period increased by 12% to R2.1 billion (2016: R1.9 billion), while operating profit grew 3% to R221 million (2016: R215 million). The growth reported for the six months is primarily attributable to improved efficiencies and the integration of new business.
The operating margin declined to 10.5% (2016: 11.4%).
LOGISTICSThis division recorded a 10% increase in revenue to R1.8 billion (2016: R1.7 billion). Operating profit declined by 25% to R37 million (2016: R49 million), and the operating margin decreased to 2.0% (2016: 2.9%), primarily due to once-off costs associated with industrial action undertaken during the period (discussed in further detail in the Sustainability commentary).
The Long Meadow Distribution Centre, which warehouses bulk dry goods, was commissioned in September 2016 and reported results in line with management’s expectations. The facility has eased capacity constraints and improved efficiencies in the business. During the period, a satellite depot was also opened in Polokwane, which will be instrumental in enhancing efficiencies and containing costs.
Export sales to the AME region grew strongly in the period.
Capital expenditure of R3 million (2016: R10 million) was incurred on facility and fleet upgrades.
6 Famous Brands Unaudited condensed consolidated interim financial results for the six months ended 31 August 2017
MANUFACTURINGThis division reported another strong set of results derived from good volume growth, improved efficiencies and intensified cost containment in the operation. Revenue grew by 6% to R1.4 billion (2016: R1.3 billion), while operating profit rose by 11% to R184 million (2016: R166 million). The operating margin increased by 0.6% to 13.4% (2016: 12.8%).
Famous Brands’ Cheese Company, in particular, outperformed management’s expectations, while Famous Brands Meat Company also reported pleasing growth.
Lamberts Bay Foods, the Group’s French fries processing business acquired in August 2016, underwent rigorous review during the period. Management is satisfied with the turnaround achieved and anticipates further improvement in the operation’s performance.
Famous Brands Coega Concentrate tomato paste manufacturing plant remains the subject of continued development, with the key challenge being to establish a large, sustainable procurement supply. The business reported a loss of R11 million in the period, but management is heartened that ongoing interventions to ensure optimal utilisation of capacity and containment of costs will enable the business to attain profitability over the long-term and serve as an important component of the Group’s Supply Chain.
During the period, the Western Cape burger bun manufacturing facility was closed and the business outsourced to a specialist third-party vendor. This strategy will effect notable efficiencies and cost savings in the division.
Inventory levels were higher than normal at the end of the reporting period, a deliberate strategy aimed at ensuring price stability for the Group’s franchise partners over the upcoming peak season.
Capital expenditure of R20 million (2016: R80 million) was incurred on machinery, equipment and plant upgrades.
ASSOCIATESThe Group holds strategic stakes in the following entities: UACR Restaurants Limited (49%), By Word of Mouth (49.9%) and Sauce Advertising (35%).
UAC RESTAURANTS LIMITED (UACR)This Nigerian business, more popularly known as Mr Bigg’s, remains the subject of ongoing repair and consolidation. Trading conditions in Nigeria are extremely difficult, featuring high inflation, energy shortages, security risks and limited access to bank finance and foreign currency, which has severely hampered existing operators and further expansion plans. The network comprises 99 restaurants, with further consolidation likely should conditions continue to deteriorate. Through ongoing review and re-engineering of the business, and by building on the existing Debonairs Pizza platform in the region, UACR is well positioned to quickly capitalise on an upturn in the market.
BY WORD OF MOUTH PROPRIETARY LIMITEDDuring the period, this high-end commercial catering company experienced trading volatility as a result of the economic downturn and related decline in spend in premium-end entertaining.
When the Group acquired its stake in this company in December 2016 it noted that a key aspect of the partnership would be the opportunity to enter the home meal replacement retail sector, through high-end standalone stores supplying bespoke products created by the founder, Karen Short. The business will launch its new “Frozen for you” online and in-store offering in the first quarter of calendar year 2018.
SAUCE ADVERTISING The Group’s strategic stake in this below-the-line advertising agency is centred on enhancing marketing capabilities and leveraging marketing spend.
Commentary continued
Famous Brands Unaudited condensed consolidated interim financial results for the six months ended 31 August 2017 7
SUSTAINABILITYINFORMATION TECHNOLOGY During the review period, the Group concluded the implementation of its R50 million Enterprise Resource Planning system, on schedule and within budget. This new financial management and reporting system is designed to support the Group’s future growth, and will add significant value to the Finance, Logistics, Manufacturing and Procurement divisions.
PEOPLE DEVELOPMENTAt the year-end, it was noted that investment would be made in bolstering the human capital component and strengthening the depth of leadership structures across the business to align them with the Group’s growth ambitions. In this regard, key management appointments were made in the Finance, Manufacturing and New Business Development divisions. Furthermore, continued investment was incurred on training facilities and training and development initiatives for staff and franchisees to enhance capability and competence in the business.
INDUSTRIAL ACTION AND WAGE AGREEMENTDuring the review period the Group’s unionised Bargaining Unit members, represented by SCMAWU, undertook industrial action regarding wage increases. The strike was confined to the Logistics and Manufacturing divisions, and comprehensive work stoppage contingency plans limited severe disruption of operations. Regrettably, however, costs arose as a result of the strike, negatively impacting on margins in the Supply Chain. The three-week strike was resolved through constructive negotiations, and a market-related two-year wage agreement was concluded.
DIRECTORATEOn 29 September 2017, Mr RM Kgosana advised the Board that he wished to resign from his position as a non-executive director with immediate effect.
The Board would like to record its appreciation for his role as a director and Chairman of the Audit Committee, which was conducted with professionalism and dedication. As announced on the Stock Exchange News Service on 2 October 2017, Mr CH Boulle, a serving independent non-executive director, was appointed as the Interim Chairman of the Audit Committee.
LOOKING FORWARD BRANDS Management will continue to review and rationalise the brand portfolio and network footprint to ensure its offering is optimally aligned with market demand and core competencies. A further 130 restaurants are scheduled for opening by the end of the current financial year and 160 revamps are planned.
It is anticipated that the Group’s Leading brands will deliver stronger results in the second half of the year, benefiting from the holiday season, although the CD brands are expected to lag the general improvement.
Furthermore, the Board is of the opinion that GBK’s return to profitability will be achieved in the next financial year, however, the range of corrective measures implemented should expedite improved performance. The Board remains optimistic that the operation will add value to the Group in the medium term.
LOGISTICS The investment made in increasing capacity in this division during the review period will contribute to improved results in the future. Continued efforts will be made to contain costs and improve efficiencies to realise management’s expectations of the business.
8 Famous Brands Unaudited condensed consolidated interim financial results for the six months ended 31 August 2017
MANUFACTURING Pleasing performances were reported across the majority of the Group’s manufacturing and processing plants; these results will continue to improve as and when trading conditions improve and the front-end restaurant operation gains further momentum. Continued investment will be incurred to leverage additional efficiencies.
PROSPECTSThe operating environment in both the local and UK market is expected to remain testing, with prevailing conditions anticipated to persist for at least the next six months domestically and possibly longer in the UK. While the Group’s peak trading holiday season lies ahead, management does not foresee a significant improvement in consumer sentiment during this period. Accordingly, management’s challenge will be to leverage the market-leading position of its brands and prioritise strategies which will enable it to capitalise on all opportunities to capture disposable income.
Management remains receptive to prospective local acquisitions which align with the Group’s core competencies and which will further its goal to be the leading innovative branded franchised and food services business in South Africa and select international markets by 2020.
DIVIDEND AND ALLOCATION OF CAPITALFollowing the acquisition of a number of businesses in the 2017 financial year, undertaken to meet robust growth targets, the Group’s gearing is substantially higher than in prior years. Accordingly, the Board and management are reviewing the options available to ensure that the allocation of capital reserves optimises the return on investment for shareholders in the future. Such options include accelerated debt reduction, dividend payments and acquisitions. In the year-end announcement on 29 May 2017, it was stated that payment of dividends will resume in the 2018 financial year subject to future acquisitions and will be dependent on operational requirements. Accordingly, no interim dividend will be paid.
On behalf of the Board
SL Botha DP HeleIndependent Chairman Chief Executive Officer
Midrand30 October 2017
Commentary continued
Famous Brands Unaudited condensed consolidated interim financial results for the six months ended 31 August 2017 9
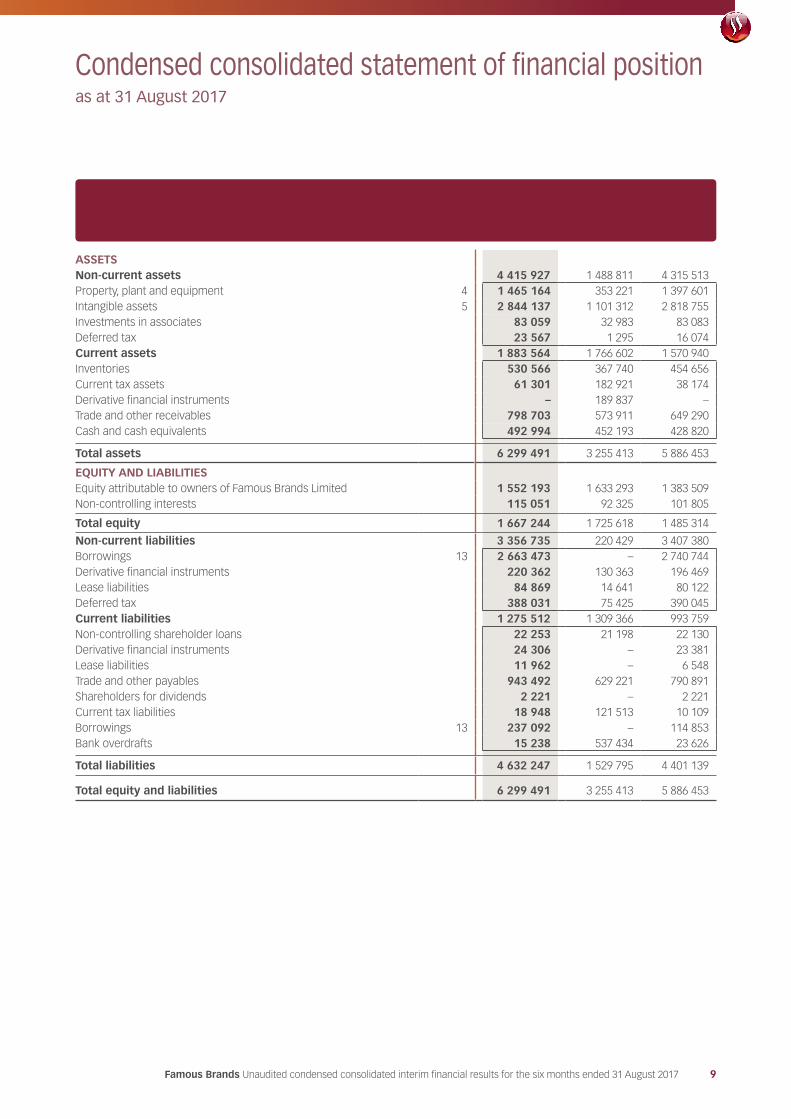
Condensed consolidated statement of financial positionas at 31 August 2017
Note
Unaudited 31 August
2017R000
Unaudited 31 August
2016R000
Audited 28 February
2017R000
ASSETSNon-current assets 4 415 927 1 488 811 4 315 513 Property, plant and equipment 4 1 465 164 353 221 1 397 601 Intangible assets 5 2 844 137 1 101 312 2 818 755 Investments in associates 83 059 32 983 83 083 Deferred tax 23 567 1 295 16 074 Current assets 1 883 564 1 766 602 1 570 940 Inventories 530 566 367 740 454 656 Current tax assets 61 301 182 921 38 174 Derivative financial instruments – 189 837 – Trade and other receivables 798 703 573 911 649 290 Cash and cash equivalents 492 994 452 193 428 820
Total assets 6 299 491 3 255 413 5 886 453
EQUITY AND LIABILITIESEquity attributable to owners of Famous Brands Limited 1 552 193 1 633 293 1 383 509 Non-controlling interests 115 051 92 325 101 805
Total equity 1 667 244 1 725 618 1 485 314
Non-current liabilities 3 356 735 220 429 3 407 380 Borrowings 13 2 663 473 – 2 740 744 Derivative financial instruments 220 362 130 363 196 469 Lease liabilities 84 869 14 641 80 122 Deferred tax 388 031 75 425 390 045 Current liabilities 1 275 512 1 309 366 993 759 Non-controlling shareholder loans 22 253 21 198 22 130 Derivative financial instruments 24 306 – 23 381 Lease liabilities 11 962 – 6 548 Trade and other payables 943 492 629 221 790 891 Shareholders for dividends 2 221 – 2 221 Current tax liabilities 18 948 121 513 10 109 Borrowings 13 237 092 – 114 853 Bank overdrafts 15 238 537 434 23 626
Total liabilities 4 632 247 1 529 795 4 401 139
Total equity and liabilities 6 299 491 3 255 413 5 886 453
10 Famous Brands Unaudited condensed consolidated interim financial results for the six months ended 31 August 2017
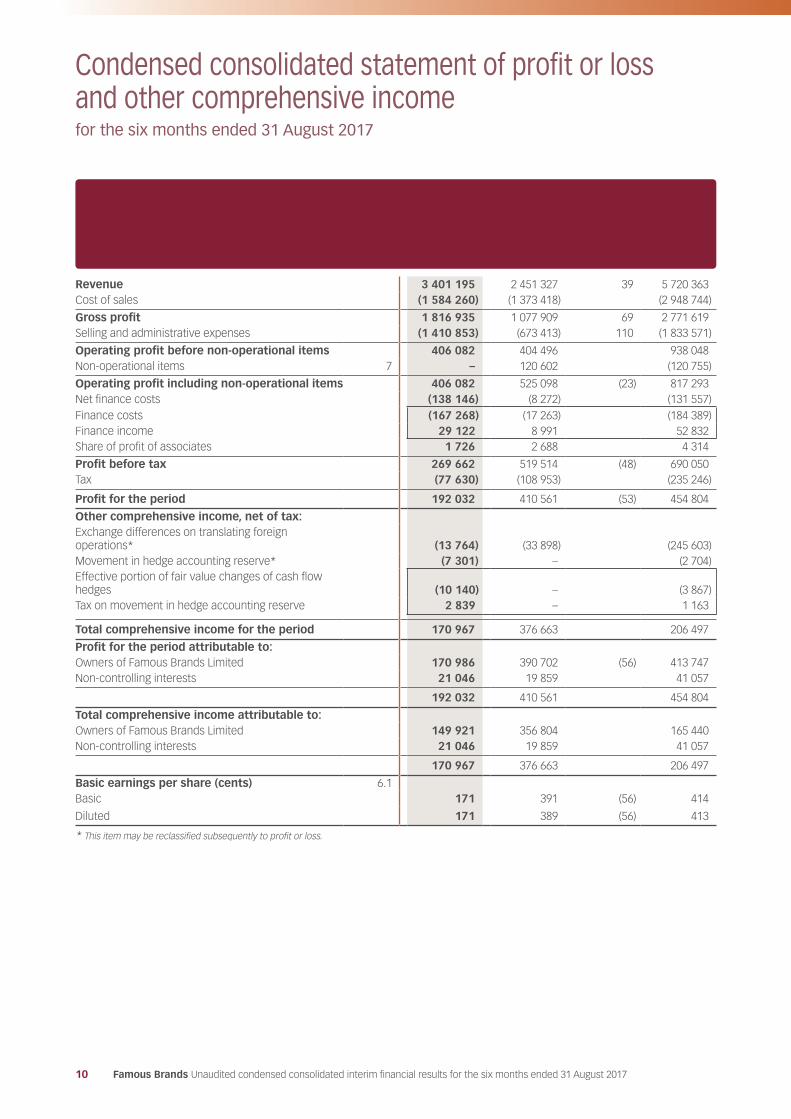
Condensed consolidated statement of profit or loss and other comprehensive incomefor the six months ended 31 August 2017
Note
Unaudited six months
ended31 August
2017R000
Unaudited six months
ended31 August
2016R000
%change
Audited year
ended28 February
2017R000
Revenue 3 401 195 2 451 327 39 5 720 363 Cost of sales (1 584 260) (1 373 418) (2 948 744)
Gross profit 1 816 935 1 077 909 69 2 771 619 Selling and administrative expenses (1 410 853) (673 413) 110 (1 833 571)
Operating profit before non-operational items 406 082 404 496 938 048 Non-operational items 7 – 120 602 (120 755)
Operating profit including non-operational items 406 082 525 098 (23) 817 293 Net finance costs (138 146) (8 272) (131 557)Finance costs (167 268) (17 263) (184 389)Finance income 29 122 8 991 52 832 Share of profit of associates 1 726 2 688 4 314
Profit before tax 269 662 519 514 (48) 690 050 Tax (77 630) (108 953) (235 246)
Profit for the period 192 032 410 561 (53) 454 804
Other comprehensive income, net of tax:Exchange differences on translating foreign operations* (13 764) (33 898) (245 603)Movement in hedge accounting reserve* (7 301) – (2 704)Effective portion of fair value changes of cash flow hedges (10 140) – (3 867)Tax on movement in hedge accounting reserve 2 839 – 1 163
Total comprehensive income for the period 170 967 376 663 206 497
Profit for the period attributable to:Owners of Famous Brands Limited 170 986 390 702 (56) 413 747 Non-controlling interests 21 046 19 859 41 057
192 032 410 561 454 804
Total comprehensive income attributable to:Owners of Famous Brands Limited 149 921 356 804 165 440 Non-controlling interests 21 046 19 859 41 057
170 967 376 663 206 497
Basic earnings per share (cents) 6.1Basic 171 391 (56) 414
Diluted 171 389 (56) 413
* This item may be reclassified subsequently to profit or loss.
Famous Brands Unaudited condensed consolidated interim financial results for the six months ended 31 August 2017 11
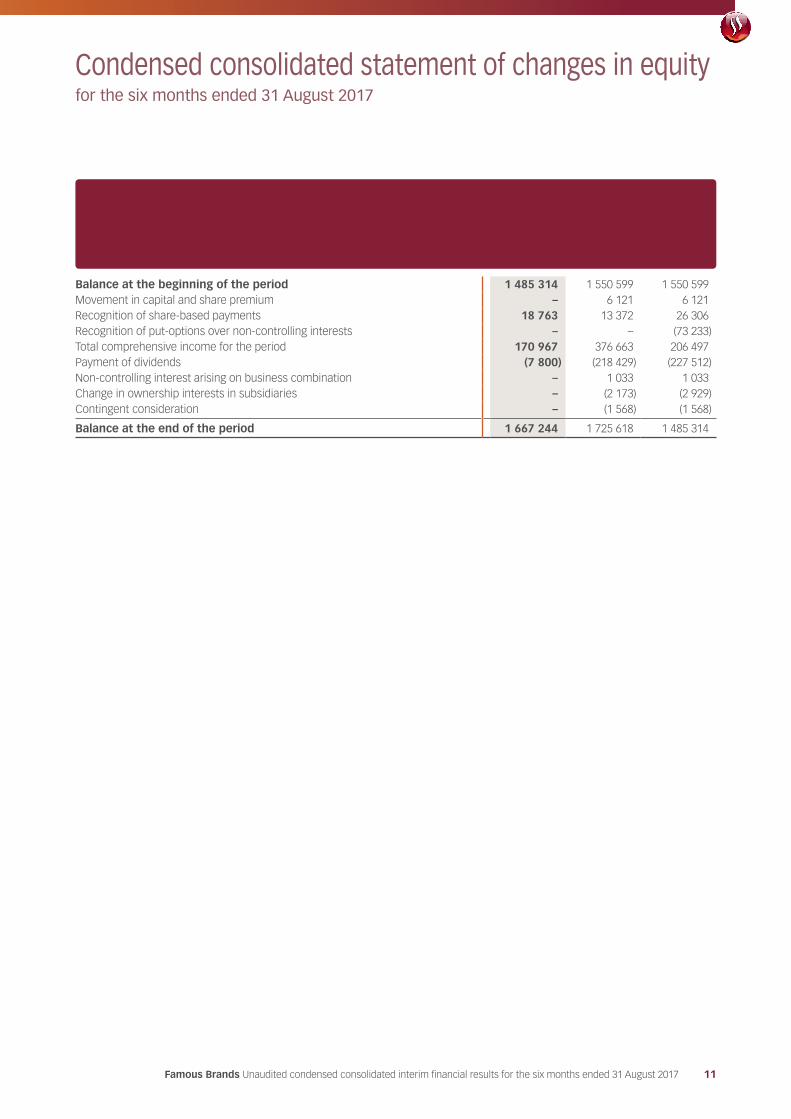
Condensed consolidated statement of changes in equityfor the six months ended 31 August 2017
Unaudited six months
ended31 August
2017R000
Unaudited six months
ended31 August
2016R000
Audited year
ended28 February
2017R000
Balance at the beginning of the period 1 485 314 1 550 599 1 550 599 Movement in capital and share premium – 6 121 6 121 Recognition of share-based payments 18 763 13 372 26 306 Recognition of put-options over non-controlling interests – – (73 233)Total comprehensive income for the period 170 967 376 663 206 497 Payment of dividends (7 800) (218 429) (227 512)Non-controlling interest arising on business combination – 1 033 1 033 Change in ownership interests in subsidiaries – (2 173) (2 929)Contingent consideration – (1 568) (1 568)
Balance at the end of the period 1 667 244 1 725 618 1 485 314
12 Famous Brands Unaudited condensed consolidated interim financial results for the six months ended 31 August 2017
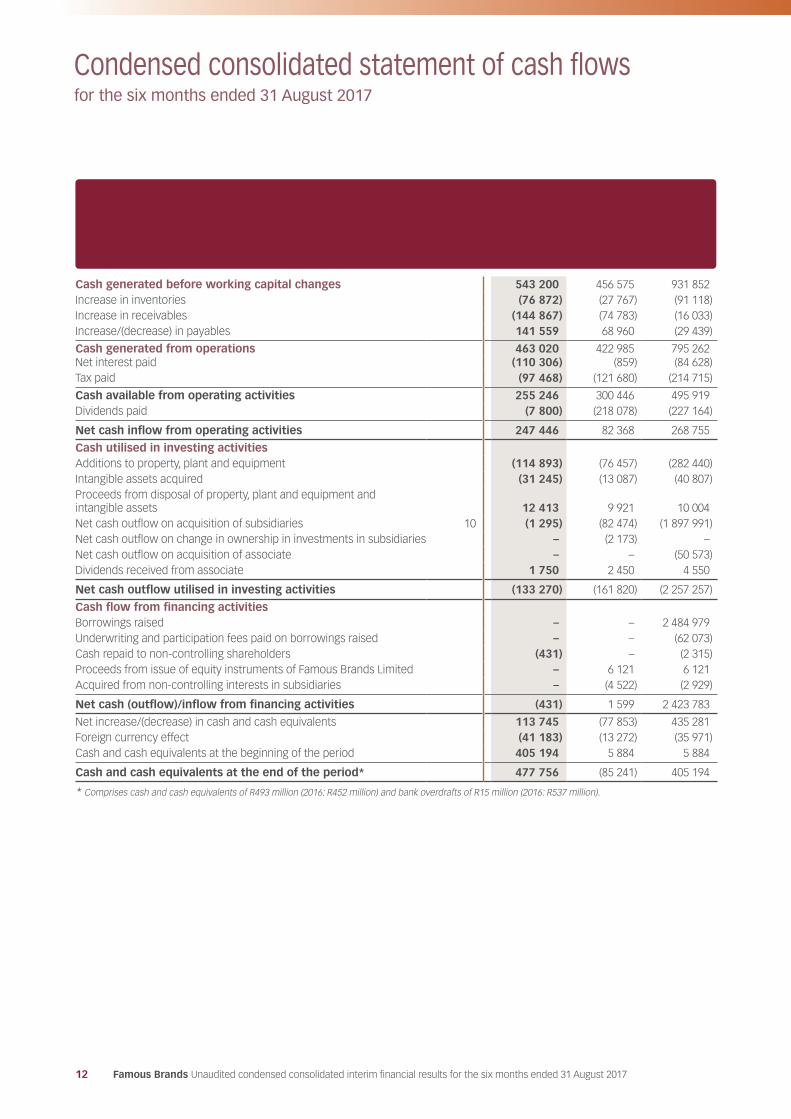
Condensed consolidated statement of cash flowsfor the six months ended 31 August 2017
Note
Unaudited six months
ended31 August
2017R000
Unaudited six months
ended31 August
2016R000
Audited year
ended28 February
2017R000
Cash generated before working capital changes 543 200 456 575 931 852 Increase in inventories (76 872) (27 767) (91 118)Increase in receivables (144 867) (74 783) (16 033)Increase/(decrease) in payables 141 559 68 960 (29 439)
Cash generated from operations 463 020 422 985 795 262 Net interest paid (110 306) (859) (84 628)Tax paid (97 468) (121 680) (214 715)
Cash available from operating activities 255 246 300 446 495 919 Dividends paid (7 800) (218 078) (227 164)
Net cash inflow from operating activities 247 446 82 368 268 755
Cash utilised in investing activitiesAdditions to property, plant and equipment (114 893) (76 457) (282 440)Intangible assets acquired (31 245) (13 087) (40 807)Proceeds from disposal of property, plant and equipment and intangible assets 12 413 9 921 10 004 Net cash outflow on acquisition of subsidiaries 10 (1 295) (82 474) (1 897 991)Net cash outflow on change in ownership in investments in subsidiaries – (2 173) – Net cash outflow on acquisition of associate – – (50 573)Dividends received from associate 1 750 2 450 4 550
Net cash outflow utilised in investing activities (133 270) (161 820) (2 257 257)
Cash flow from financing activitiesBorrowings raised – – 2 484 979 Underwriting and participation fees paid on borrowings raised – – (62 073)Cash repaid to non-controlling shareholders (431) – (2 315)Proceeds from issue of equity instruments of Famous Brands Limited – 6 121 6 121 Acquired from non-controlling interests in subsidiaries – (4 522) (2 929)
Net cash (outflow)/inflow from financing activities (431) 1 599 2 423 783
Net increase/(decrease) in cash and cash equivalents 113 745 (77 853) 435 281 Foreign currency effect (41 183) (13 272) (35 971)Cash and cash equivalents at the beginning of the period 405 194 5 884 5 884
Cash and cash equivalents at the end of the period* 477 756 (85 241) 405 194
* Comprises cash and cash equivalents of R493 million (2016: R452 million) and bank overdrafts of R15 million (2016: R537 million).
Famous Brands Unaudited condensed consolidated interim financial results for the six months ended 31 August 2017 13
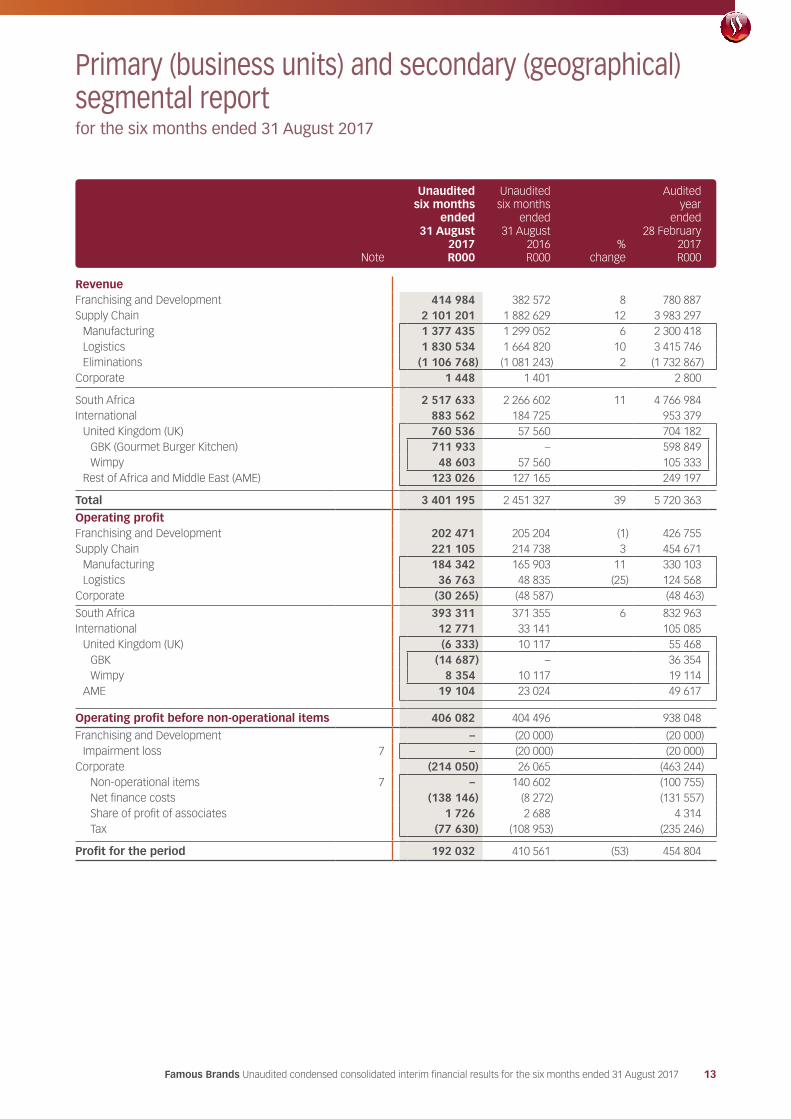
Primary (business units) and secondary (geographical) segmental reportfor the six months ended 31 August 2017
Note
Unaudited six months
ended31 August
2017R000
Unaudited six months
ended31 August
2016R000
%change
Auditedyear
ended28 February
2017R000
RevenueFranchising and Development 414 984 382 572 8 780 887 Supply Chain 2 101 201 1 882 629 12 3 983 297
Manufacturing 1 377 435 1 299 052 6 2 300 418 Logistics 1 830 534 1 664 820 10 3 415 746 Eliminations (1 106 768) (1 081 243) 2 (1 732 867)
Corporate 1 448 1 401 2 800
South Africa 2 517 633 2 266 602 11 4 766 984 International 883 562 184 725 953 379
United Kingdom (UK) 760 536 57 560 704 182 GBK (Gourmet Burger Kitchen) 711 933 – 598 849 Wimpy 48 603 57 560 105 333
Rest of Africa and Middle East (AME) 123 026 127 165 249 197
Total 3 401 195 2 451 327 39 5 720 363
Operating profitFranchising and Development 202 471 205 204 (1) 426 755 Supply Chain 221 105 214 738 3 454 671
Manufacturing 184 342 165 903 11 330 103 Logistics 36 763 48 835 (25) 124 568
Corporate (30 265) (48 587) (48 463)
South Africa 393 311 371 355 6 832 963 International 12 771 33 141 105 085
United Kingdom (UK) (6 333) 10 117 55 468 GBK (14 687) – 36 354 Wimpy 8 354 10 117 19 114
AME 19 104 23 024 49 617
Operating profit before non-operational items 406 082 404 496 938 048
Franchising and Development – (20 000) (20 000)Impairment loss 7 – (20 000) (20 000)
Corporate (214 050) 26 065 (463 244)Non-operational items 7 – 140 602 (100 755)Net finance costs (138 146) (8 272) (131 557)Share of profit of associates 1 726 2 688 4 314 Tax (77 630) (108 953) (235 246)
Profit for the period 192 032 410 561 (53) 454 804
14 Famous Brands Unaudited condensed consolidated interim financial results for the six months ended 31 August 2017
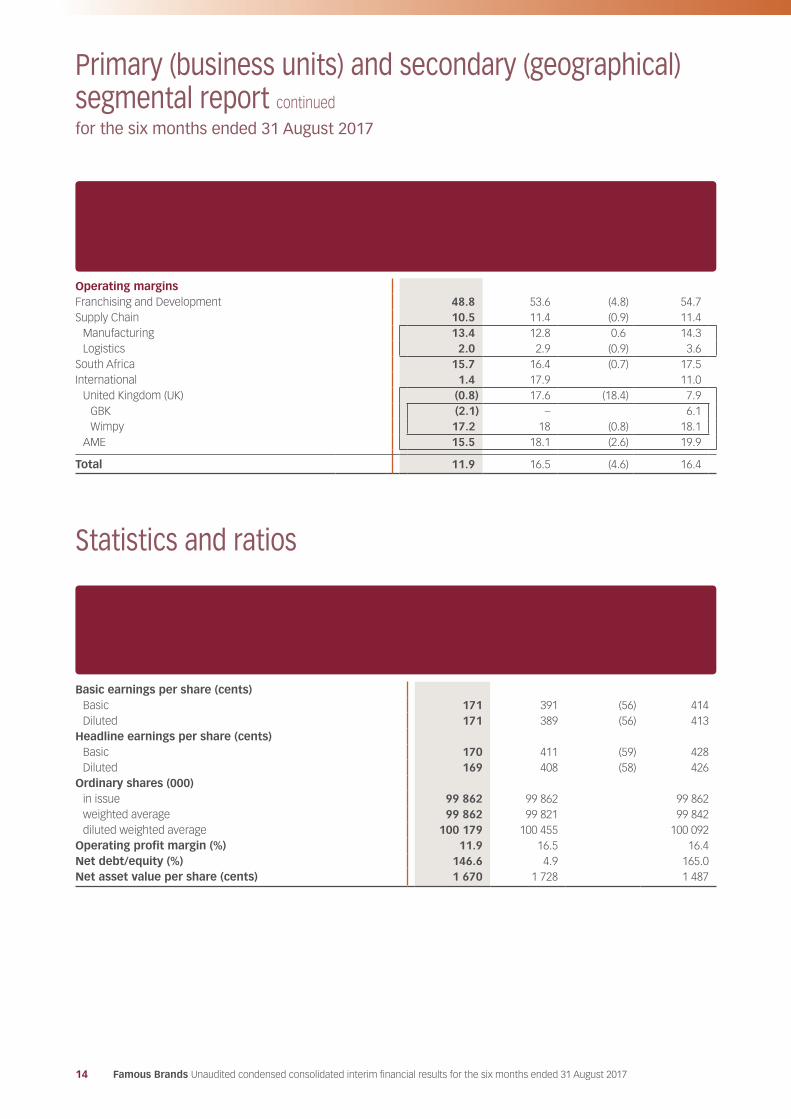
Statistics and ratios
Primary (business units) and secondary (geographical) segmental report continued
for the six months ended 31 August 2017
Unaudited six months
ended31 August
2017%
Unaudited six months
ended31 August
2016% change
Auditedyear
ended28 February
2017%
Operating marginsFranchising and Development 48.8 53.6 (4.8) 54.7 Supply Chain 10.5 11.4 (0.9) 11.4
Manufacturing 13.4 12.8 0.6 14.3 Logistics 2.0 2.9 (0.9) 3.6
South Africa 15.7 16.4 (0.7) 17.5 International 1.4 17.9 11.0
United Kingdom (UK) (0.8) 17.6 (18.4) 7.9 GBK (2.1) – 6.1 Wimpy 17.2 18 (0.8) 18.1
AME 15.5 18.1 (2.6) 19.9
Total 11.9 16.5 (4.6) 16.4
Unaudited six months
ended31 August
2017R000
Unaudited six months
ended31 August
2016R000
%change
Auditedyear
ended28 February
2017R000
Basic earnings per share (cents)Basic 171 391 (56) 414 Diluted 171 389 (56) 413
Headline earnings per share (cents)Basic 170 411 (59) 428 Diluted 169 408 (58) 426
Ordinary shares (000)in issue 99 862 99 862 99 862 weighted average 99 862 99 821 99 842 diluted weighted average 100 179 100 455 100 092
Operating profit margin (%) 11.9 16.5 16.4 Net debt/equity (%) 146.6 4.9 165.0Net asset value per share (cents) 1 670 1 728 1 487
Famous Brands Unaudited condensed consolidated interim financial results for the six months ended 31 August 2017 15
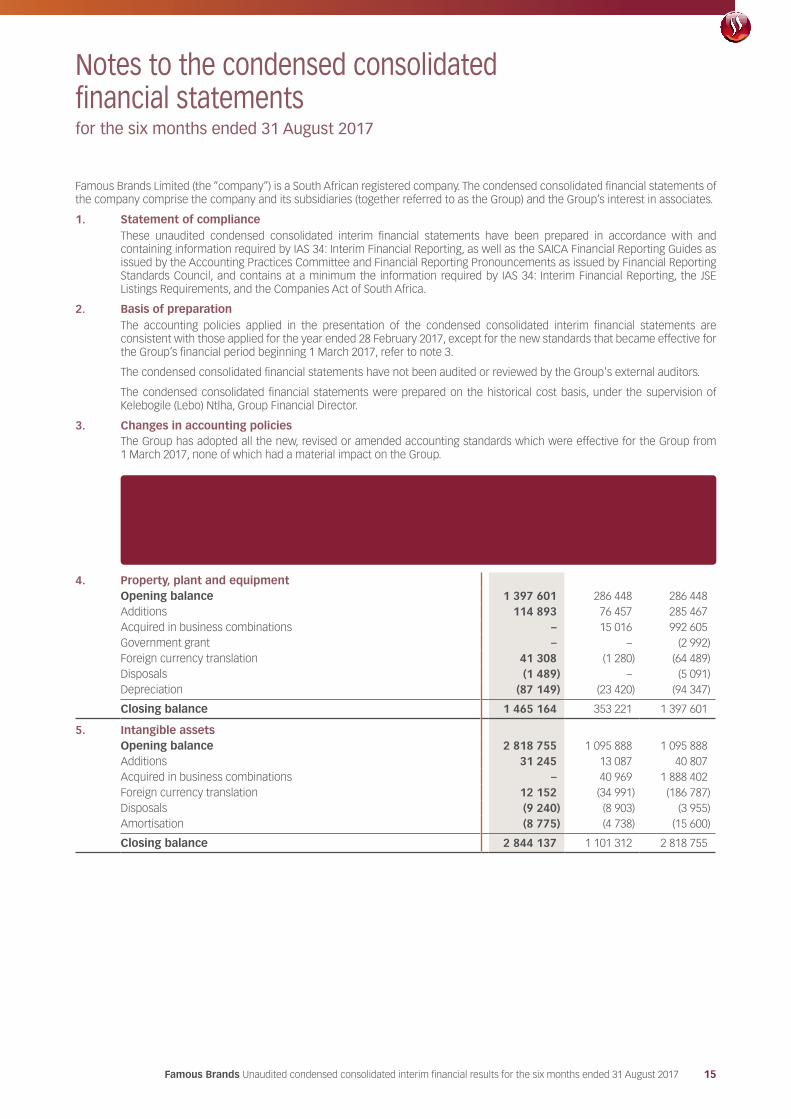
Notes to the condensed consolidated financial statementsfor the six months ended 31 August 2017
Famous Brands Limited (the “company”) is a South African registered company. The condensed consolidated financial statements of the company comprise the company and its subsidiaries (together referred to as the Group) and the Group’s interest in associates.
1. Statement of complianceThese unaudited condensed consolidated interim financial statements have been prepared in accordance with and containing information required by IAS 34: Interim Financial Reporting, as well as the SAICA Financial Reporting Guides as issued by the Accounting Practices Committee and Financial Reporting Pronouncements as issued by Financial Reporting Standards Council, and contains at a minimum the information required by IAS 34: Interim Financial Reporting, the JSE Listings Requirements, and the Companies Act of South Africa.
2. Basis of preparationThe accounting policies applied in the presentation of the condensed consolidated interim financial statements are consistent with those applied for the year ended 28 February 2017, except for the new standards that became effective for the Group’s financial period beginning 1 March 2017, refer to note 3.
The condensed consolidated financial statements have not been audited or reviewed by the Group's external auditors.
The condensed consolidated financial statements were prepared on the historical cost basis, under the supervision of Kelebogile (Lebo) Ntlha, Group Financial Director.
3. Changes in accounting policiesThe Group has adopted all the new, revised or amended accounting standards which were effective for the Group from 1 March 2017, none of which had a material impact on the Group.
Unaudited six months
ended31 August
2017R000
Unaudited six months
ended31 August
2016R000
Auditedyear
ended28 February
2017R000
4. Property, plant and equipmentOpening balance 1 397 601 286 448 286 448 Additions 114 893 76 457 285 467 Acquired in business combinations – 15 016 992 605 Government grant – – (2 992)Foreign currency translation 41 308 (1 280) (64 489)Disposals (1 489) – (5 091)Depreciation (87 149) (23 420) (94 347)
Closing balance 1 465 164 353 221 1 397 601
5. Intangible assetsOpening balance 2 818 755 1 095 888 1 095 888 Additions 31 245 13 087 40 807 Acquired in business combinations – 40 969 1 888 402 Foreign currency translation 12 152 (34 991) (186 787)Disposals (9 240) (8 903) (3 955)Amortisation (8 775) (4 738) (15 600)
Closing balance 2 844 137 1 101 312 2 818 755
16 Famous Brands Unaudited condensed consolidated interim financial results for the six months ended 31 August 2017
Unaudited six months
ended31 August
2017R000
Unaudited six months
ended31 August
2016R000
Auditedyear
ended28 February
2017R000
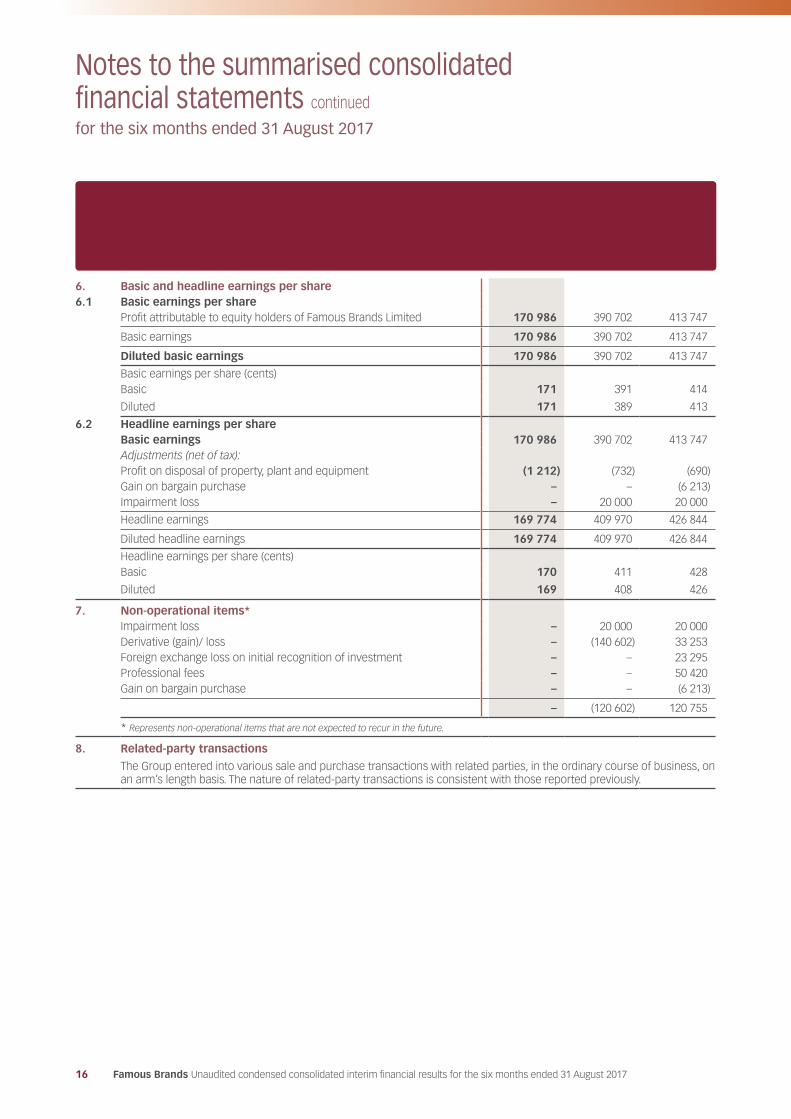
6. Basic and headline earnings per share6.1 Basic earnings per share
Profit attributable to equity holders of Famous Brands Limited 170 986 390 702 413 747
Basic earnings 170 986 390 702 413 747
Diluted basic earnings 170 986 390 702 413 747
Basic earnings per share (cents)Basic 171 391 414
Diluted 171 389 413
6.2 Headline earnings per shareBasic earnings 170 986 390 702 413 747 Adjustments (net of tax):Profit on disposal of property, plant and equipment (1 212) (732) (690)Gain on bargain purchase – – (6 213)Impairment loss – 20 000 20 000
Headline earnings 169 774 409 970 426 844
Diluted headline earnings 169 774 409 970 426 844
Headline earnings per share (cents)Basic 170 411 428
Diluted 169 408 426
7. Non-operational items*Impairment loss – 20 000 20 000 Derivative (gain)/ loss – (140 602) 33 253 Foreign exchange loss on initial recognition of investment – – 23 295 Professional fees – – 50 420 Gain on bargain purchase – – (6 213)
– (120 602) 120 755
* Represents non-operational items that are not expected to recur in the future.
8. Related-party transactions
The Group entered into various sale and purchase transactions with related parties, in the ordinary course of business, on an arm’s length basis. The nature of related-party transactions is consistent with those reported previously.
Notes to the summarised consolidated financial statements continued
for the six months ended 31 August 2017
Famous Brands Unaudited condensed consolidated interim financial results for the six months ended 31 August 2017 17
Notes to the summarised consolidated financial statements continued
for the six months ended 31 August 2017
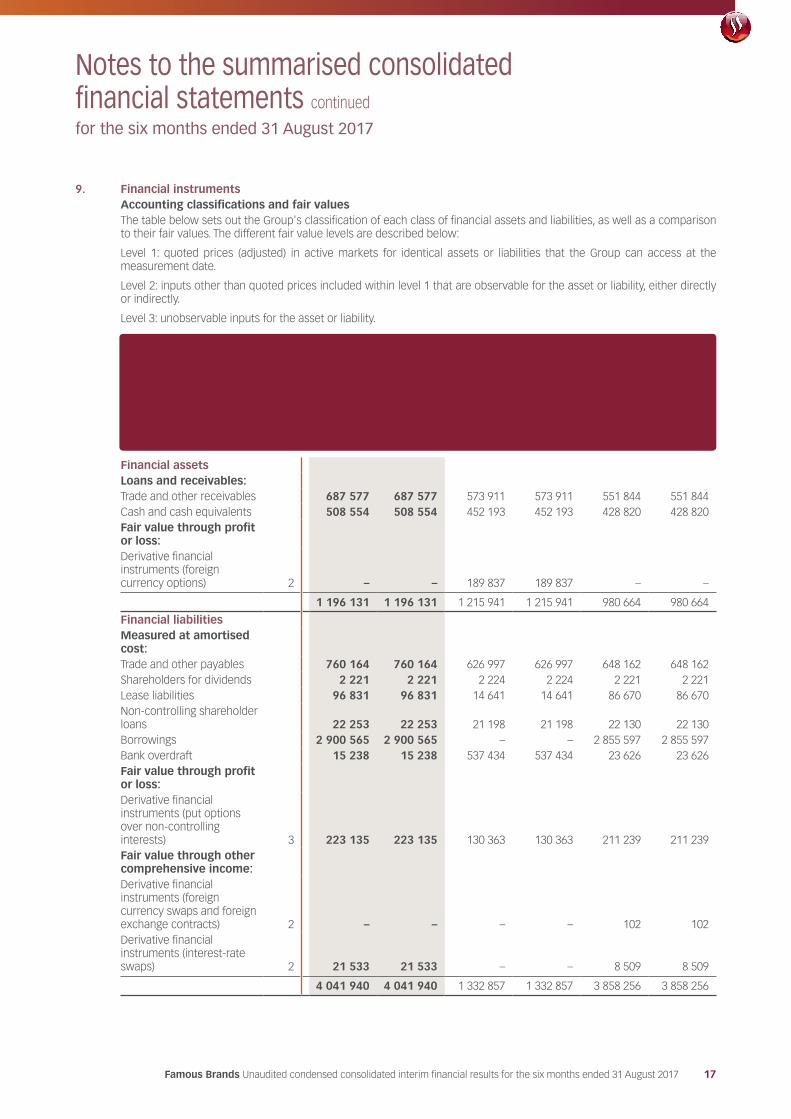
9. Financial instrumentsAccounting classifications and fair valuesThe table below sets out the Group's classification of each class of financial assets and liabilities, as well as a comparison to their fair values. The different fair value levels are described below:
Level 1: quoted prices (adjusted) in active markets for identical assets or liabilities that the Group can access at the measurement date.
Level 2: inputs other than quoted prices included within level 1 that are observable for the asset or liability, either directly or indirectly.
Level 3: unobservable inputs for the asset or liability.
Level
Unaudited six months
ended 31 August
2017 Carrying amount
R000
Unaudited six months
ended 31 August
2017 Fair
valueR000
Unaudited six months
ended 31 August
2016 Carrying amount
R000
Unaudited six months
ended 31 August
2016 Fair
valueR000
Auditedyear
ended28 February
2017Carrying amount
R000
Auditedyear
ended28 February
2017 Fair
valueR000
Financial assetsLoans and receivables:Trade and other receivables 687 577 687 577 573 911 573 911 551 844 551 844 Cash and cash equivalents 508 554 508 554 452 193 452 193 428 820 428 820 Fair value through profit or loss:Derivative financial instruments (foreign currency options) 2 – – 189 837 189 837 – –
1 196 131 1 196 131 1 215 941 1 215 941 980 664 980 664
Financial liabilitiesMeasured at amortised cost:Trade and other payables 760 164 760 164 626 997 626 997 648 162 648 162 Shareholders for dividends 2 221 2 221 2 224 2 224 2 221 2 221 Lease liabilities 96 831 96 831 14 641 14 641 86 670 86 670 Non-controlling shareholder loans 22 253 22 253 21 198 21 198 22 130 22 130 Borrowings 2 900 565 2 900 565 – – 2 855 597 2 855 597 Bank overdraft 15 238 15 238 537 434 537 434 23 626 23 626 Fair value through profit or loss:Derivative financial instruments (put options over non-controlling interests) 3 223 135 223 135 130 363 130 363 211 239 211 239 Fair value through other comprehensive income:Derivative financial instruments (foreign currency swaps and foreign exchange contracts) 2 – – – – 102 102 Derivative financial instruments (interest-rate swaps) 2 21 533 21 533 – – 8 509 8 509
4 041 940 4 041 940 1 332 857 1 332 857 3 858 256 3 858 256
18 Famous Brands Unaudited condensed consolidated interim financial results for the six months ended 31 August 2017
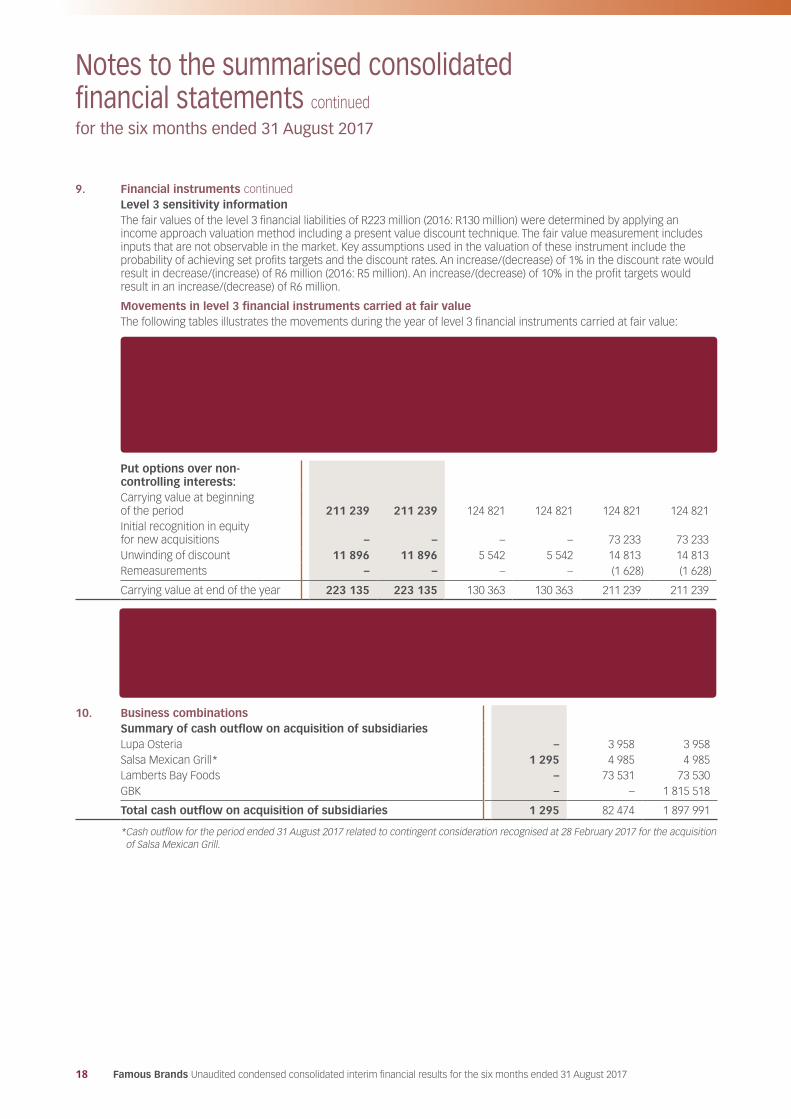
9. Financial instruments continuedLevel 3 sensitivity informationThe fair values of the level 3 financial liabilities of R223 million (2016: R130 million) were determined by applying an income approach valuation method including a present value discount technique. The fair value measurement includes inputs that are not observable in the market. Key assumptions used in the valuation of these instrument include the probability of achieving set profits targets and the discount rates. An increase/(decrease) of 1% in the discount rate would result in decrease/(increase) of R6 million (2016: R5 million). An increase/(decrease) of 10% in the profit targets would result in an increase/(decrease) of R6 million.
Movements in level 3 financial instruments carried at fair valueThe following tables illustrates the movements during the year of level 3 financial instruments carried at fair value:
Unaudited six months
ended 31 August
2017 Carrying amount
R000
Unaudited six months
ended 31 August
2017 Fair
valueR000
Unaudited six months
ended 31 August
2016 Carrying amount
R000
Unaudited six months
ended 31 August
2016 Fair
valueR000
Auditedyear
ended28 February
2017Carrying amount
R000
Auditedyear
ended28 February
2017 Fair
valueR000
Put options over non-controlling interests:Carrying value at beginning of the period 211 239 211 239 124 821 124 821 124 821 124 821 Initial recognition in equity for new acquisitions – – – – 73 233 73 233 Unwinding of discount 11 896 11 896 5 542 5 542 14 813 14 813 Remeasurements – – – – (1 628) (1 628)
Carrying value at end of the year 223 135 223 135 130 363 130 363 211 239 211 239
Unaudited six months
ended31 August
2017R000
Unaudited six months
ended31 August
2016R000
Auditedyear
ended28 February
2017R000
10. Business combinationsSummary of cash outflow on acquisition of subsidiariesLupa Osteria – 3 958 3 958 Salsa Mexican Grill* 1 295 4 985 4 985 Lamberts Bay Foods – 73 531 73 530 GBK – – 1 815 518
Total cash outflow on acquisition of subsidiaries 1 295 82 474 1 897 991
* Cash outflow for the period ended 31 August 2017 related to contingent consideration recognised at 28 February 2017 for the acquisition of Salsa Mexican Grill.
Notes to the summarised consolidated financial statements continued
for the six months ended 31 August 2017
Famous Brands Unaudited condensed consolidated interim financial results for the six months ended 31 August 2017 19
Notes to the summarised consolidated financial statements continued
for the six months ended 31 August 2017
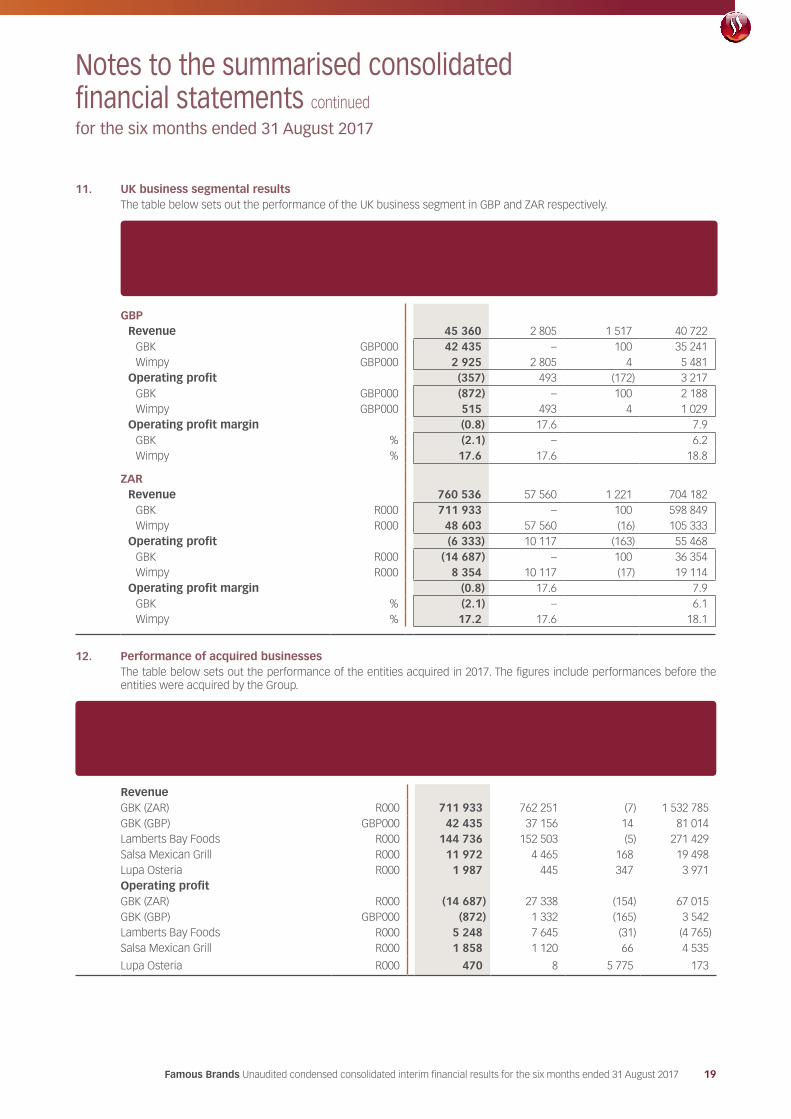
11. UK business segmental resultsThe table below sets out the performance of the UK business segment in GBP and ZAR respectively.
Unaudited six months
ended31 August
2017
Unaudited six months
ended31 August
2016%
change
Auditedyear
ended28 February
2017
GBPRevenue 45 360 2 805 1 517 40 722
GBK GBP000 42 435 – 100 35 241 Wimpy GBP000 2 925 2 805 4 5 481
Operating profit (357) 493 (172) 3 217 GBK GBP000 (872) – 100 2 188 Wimpy GBP000 515 493 4 1 029
Operating profit margin (0.8) 17.6 7.9 GBK % (2.1) – 6.2 Wimpy % 17.6 17.6 18.8
ZARRevenue 760 536 57 560 1 221 704 182
GBK R000 711 933 – 100 598 849 Wimpy R000 48 603 57 560 (16) 105 333
Operating profit (6 333) 10 117 (163) 55 468 GBK R000 (14 687) – 100 36 354 Wimpy R000 8 354 10 117 (17) 19 114
Operating profit margin (0.8) 17.6 7.9 GBK % (2.1) – 6.1 Wimpy % 17.2 17.6 18.1
12. Performance of acquired businessesThe table below sets out the performance of the entities acquired in 2017. The figures include performances before the entities were acquired by the Group.
Unaudited six months
ended31 August
2017
Unaudited six months
ended31 August
2016%
change
Auditedyear
ended28 February
2017
RevenueGBK (ZAR) R000 711 933 762 251 (7) 1 532 785 GBK (GBP) GBP000 42 435 37 156 14 81 014 Lamberts Bay Foods R000 144 736 152 503 (5) 271 429 Salsa Mexican Grill R000 11 972 4 465 168 19 498 Lupa Osteria R000 1 987 445 347 3 971 Operating profitGBK (ZAR) R000 (14 687) 27 338 (154) 67 015 GBK (GBP) GBP000 (872) 1 332 (165) 3 542 Lamberts Bay Foods R000 5 248 7 645 (31) (4 765) Salsa Mexican Grill R000 1 858 1 120 66 4 535
Lupa Osteria R000 470 8 5 775 173
20 Famous Brands Unaudited condensed consolidated interim financial results for the six months ended 31 August 2017
CurrencyMaturity
date Nature
Interestrate
margin% Rate
Unauditedsix months
ended31 August
2017%
Unauditedsix months
ended31 August
2016%
Auditedyear
ended28 February
2017%
Unauditedsix months
ended31 August
2017R000
Unauditedsix months
ended31 August
2016R000
Auditedyear
ended28 February
2017R000
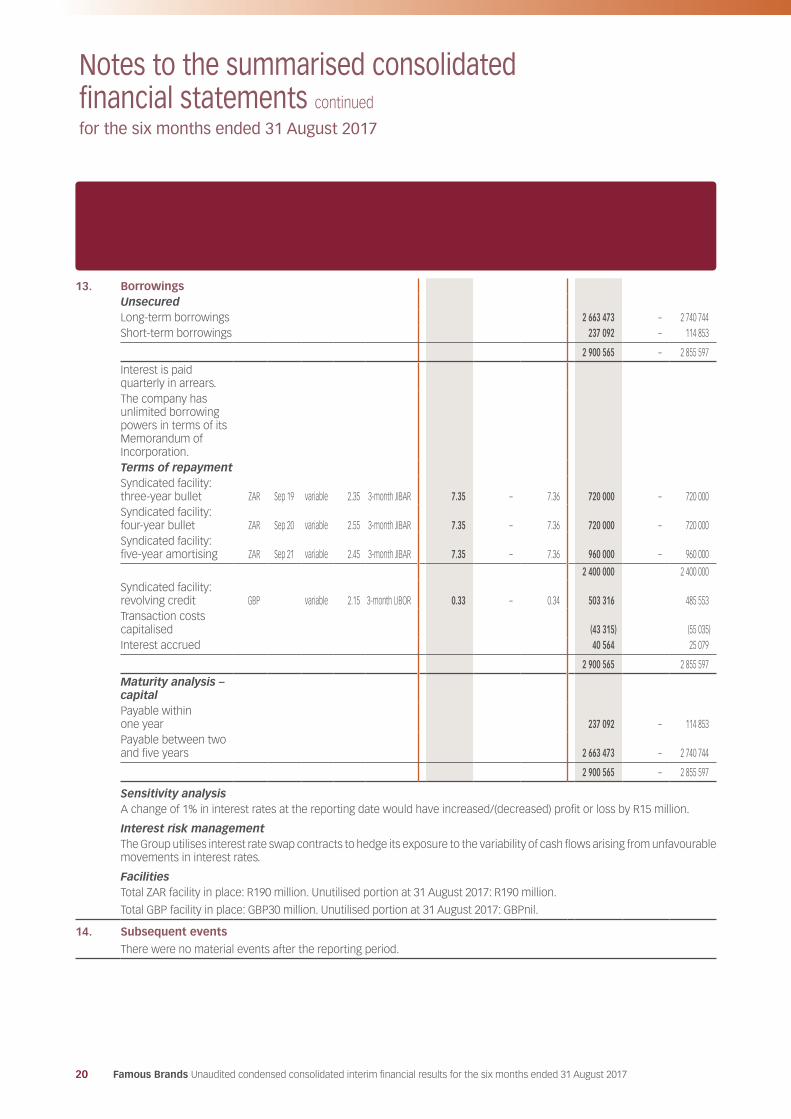
13. BorrowingsUnsecuredLong-term borrowings 2 663 473 – 2 740 744 Short-term borrowings 237 092 – 114 853
2 900 565 – 2 855 597
Interest is paid quarterly in arrears.The company has unlimited borrowing powers in terms of its Memorandum of Incorporation.Terms of repaymentSyndicated facility: three-year bullet ZAR Sep 19 variable 2.35 3-month JIBAR 7.35 – 7.36 720 000 – 720 000 Syndicated facility: four-year bullet ZAR Sep 20 variable 2.55 3-month JIBAR 7.35 – 7.36 720 000 – 720 000 Syndicated facility: five-year amortising ZAR Sep 21 variable 2.45 3-month JIBAR 7.35 – 7.36 960 000 – 960 000
2 400 000 2 400 000 Syndicated facility: revolving credit GBP variable 2.15 3-month LIBOR 0.33 – 0.34 503 316 485 553 Transaction costs capitalised (43 315) (55 035)Interest accrued 40 564 25 079
2 900 565 2 855 597
Maturity analysis – capitalPayable within one year 237 092 – 114 853 Payable between two and five years 2 663 473 – 2 740 744
2 900 565 – 2 855 597
Sensitivity analysisA change of 1% in interest rates at the reporting date would have increased/(decreased) profit or loss by R15 million.
Interest risk managementThe Group utilises interest rate swap contracts to hedge its exposure to the variability of cash flows arising from unfavourable movements in interest rates.
FacilitiesTotal ZAR facility in place: R190 million. Unutilised portion at 31 August 2017: R190 million.
Total GBP facility in place: GBP30 million. Unutilised portion at 31 August 2017: GBPnil.
14. Subsequent events
There were no material events after the reporting period.
Notes to the summarised consolidated financial statements continued
for the six months ended 31 August 2017
Famous Brands Limited Incorporated in the Republic of South AfricaRegistration number: 1969/004875/06JSE share code: FBRISIN code: ZAE000053328
Directors NJ Adami, SL Botha (Independent Chairman), CH Boulle, P Halamandaris, P Halamandaris (Jnr), T Halamandaris, JL Halamandres, K Hedderwick, DP Hele (Chief Executive Officer)*, K Ntlha (Group Financial Director)*, BL Sibiya and T Skweyiya.* Executive
Company SecretaryIWM Isdale
Registered office478 James Crescent, Halfway House, Midrand, 1685PO Box 2884, Halfway House, 1685Telephone: +27 11 315 3000Email: [email protected] address: www.famousbrands.co.za
Transfer secretariesComputershare Investor Services Proprietary LimitedRegistration number: 2004/003647/07Rosebank Towers, 15 Biermann AvenueRosebank, 2196, South AfricaPO Box 61051, Marshalltown, 2107
SponsorThe Standard Bank of South Africa LimitedRegistration number: 1969/017128/0630 Baker Street, Rosebank, 2196
AuditorsDeloitte & Touche
Administration
Contact informationTel: +27 11 315 [email protected]@famousbrands.co.za
478 James CrescentHalfway House, South Africa, 1685


