®
Growth through diversification
Highlights
Unaudited condensed consolidated interim financial results
for the six months ended 31 August 2014www.afrimat.co.za
Afrimat Limited (“Afrimat” or “the company” or “the group”) (Incorporated in the Republic of South Africa) (Registration number: 2006/022534/06) Share code: AFT ISIN code: ZAE000086302
Revenue up 10,5%
HEPS up 23,9% to 61,1 cents
Net debt:equity ratio 23,3%
NAV per share of 594 cents
Interim dividend 13 cents per share
Return on net operating assets 23,3%
COMMENTARY
BASIS OF PREPARATIONThe unaudited condensed consolidated interim financial statements (“the financial statements”) for the six months ended 31 August 2014 (“the period”) have been prepared in accordance with and containing the information required by IAS 34: Interim Financial Reporting, the SAICA Financial Reporting Guides as issued by the Accounting Practices Committee, JSE Listings Requirements and in the manner required by the South African Companies Act No. 71 of 2008, as amended. The accounting policies and method of computation applied in preparation of the financial statements are in accordance with International Financial Reporting Standards (“IFRS”) and are consistent with those applied in the audited annual financial statements for the year ended 28 February 2014. The above information has not been reviewed or reported on by Afrimat’s auditors.
The financial statements have been prepared under the supervision of the Financial Director, HP Verreynne BCompt (Hons) CA(SA).
INTRODUCTIONThe group has continued to deliver solid results driven by its diversification strategy. The turnaround of Infrasors, acquired during the previous year, is progressing well and contributing positive results.
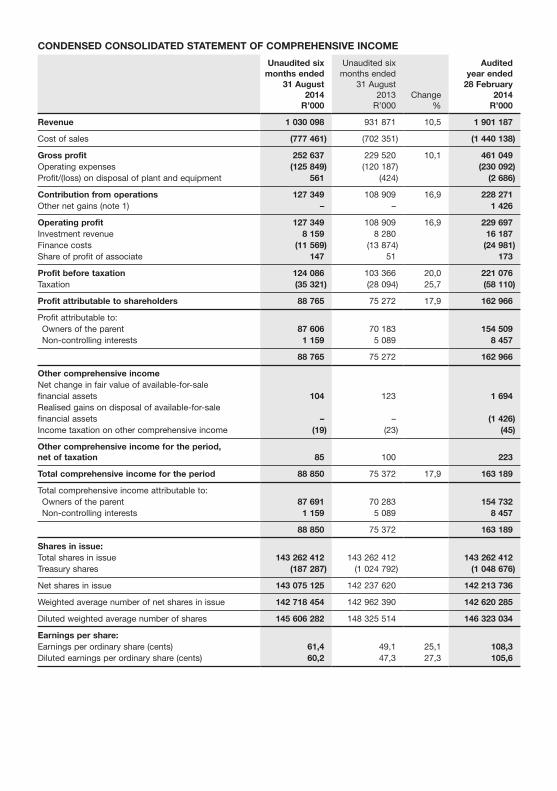
FINANCIAL RESULTSRevenue for the period increased by 10,5% to R1 030,1 million from R931,9 million. Headline earnings increased by 23,7%, translating into headline earnings per share of 61,1 cents (2013: 49,3 cents).
The overdraft less cash and cash equivalents at the end of the period amounts to a net overdraft of R48,4 million (2013: net cash R36,4 million). The group changed its funding strategy, in order to increase its return on cash held, by utilising surplus cash to settle capital expenditures and accordingly reduced asset based financing. It also brought forward plant and equipment capital expenditures in this period, in order to reduce maintenance costs, and increased inventory levels to meet anticipated demand from customers and to enable lower manufacturing costs.
OPERATIONAL REVIEWThe Mining & Aggregates segment generated satisfactory profits with an excellent contribution from the clinker operations. The KwaZulu-Natal operations incurred high mining and maintenance costs in efforts to ensure long-term compliance with Department of Mineral Resources requirements and to gear the business for growth. Contracting operations were impacted by contracts coming to an end and setup costs for new contracts. The group’s industrial mineral operations performed well, with the Infrasors’ turnaround progressing as planned.
All processing plants are fully operational and well-placed to supply market demand. Afrimat’s flexible service delivery model, supplemented by mobile equipment, positions the group to take advantage of opportunities as and where they arise.
The Concrete Based Products segment achieved a good increase in profits resulting from cost reduction initiatives and good market conditions. During the comparative period a strike at the Gauteng operation resulted in lower profits for the period.
BUSINESS DEVELOPMENTNew business development remains a key component of the group’s growth strategy. The dedicated business development team continues to successfully identify and pursue opportunities in existing markets, as well as in anticipated new high growth areas.
B-BBEEExisting BEE shareholders and the Afrimat BEE Trust in aggregate hold 26,1% of Afrimat’s issued shares. Notwithstanding the fully empowered ownership platform in line with the Mining Charter requirements, the group remains dedicated to enhancing all aspects of B-BBEE on an ongoing basis.
DIVIDENDAn interim gross dividend of 13,00 cents per share (2013: 11,00 cents) for the period was declared on 5 November 2014. This is in line with the group’s dividend policy of 2,75 times cover. The dividend payable to shareholders who are subject to dividend tax is 11,05 cents per share (2013: 9,35 cents per share).
PROSPECTSThe group is well positioned to capitalise on its strategic initiatives such as continued growth from the excellent asset base and turnaround at the Infrasors operations.
Operational efficiency initiatives aimed at expanding volumes, reducing costs and developing the required skill levels of all employees remains a key focus in all operations. These programmes, supported by ongoing product diversification in attractive growth sectors such as industrial minerals and open cast mining, should see volumes continue to increase.
Going forward, the group is intensifying its focus on finding opportunities outside of South Africa.
Afrimat expects the current business climate to continue with moderate market growth projected. The group’s growth will remain driven by the successful execution of its proven strategy which has been implemented over the last five years.
On behalf of the board
MW von Wielligh AJ van HeerdenChairman Chief Executive Officer
6 November 2014
DIVIDEND DECLARATIONNotice is hereby given that an interim gross dividend, No. 15 of 13,00 cents per share, in respect of the six months ended 31 August 2014, was declared on Wednesday, 5 November 2014.
There are 143 262 412 shares in issue at announcement date, of which 187 287 are held in treasury. The total dividend payable is R18,6 million (2013: R15,6 million).
The board has confirmed by resolution that the solvency and liquidity test as contemplated by the Companies Act, No. 71 of 2008, as amended, has been duly considered, applied and satisfied. This is a dividend as defined in the Income Tax Act, 1962, and is payable from income reserves. The South African dividend tax rate is 15,0% and no STC credit is available to be utilised by shareholders. The dividend payable to shareholders who are subject to dividend tax and shareholders who are exempt from dividend tax is 11,05 cents and 13,00 cents per share, respectively. The income tax number of the company is 9568738158.
Relevant dates to the final dividend are as follows:Last day to trade cum dividend Friday, 5 December 2014Commence trading ex dividend Monday, 8 December 2014Record date Friday, 12 December 2014Dividend payable Monday, 15 December 2014
Share certificates may not be dematerialised or rematerialised between Monday, 8 December 2014 and Friday, 12 December 2014, both dates inclusive.
CONDENSED CONSOLIDATED STATEMENT OF COMPREHENSIVE INCOME
Unaudited six months ended
31 August2014
R’000
Unaudited six months ended
31 August2013
R’000Change
%
Audited year ended
28 February2014
R’000
Revenue 1 030 098 931 871 10,5 1 901 187
Cost of sales (777 461) (702 351) (1 440 138)
Gross profit 252 637 229 520 10,1 461 049 Operating expenses (125 849) (120 187) (230 092)Profit/(loss) on disposal of plant and equipment 561 (424) (2 686)
Contribution from operations 127 349 108 909 16,9 228 271 Other net gains (note 1) – – 1 426
Operating profit 127 349 108 909 16,9 229 697 Investment revenue 8 159 8 280 16 187 Finance costs (11 569) (13 874) (24 981)Share of profit of associate 147 51 173
Profit before taxation 124 086 103 366 20,0 221 076 Taxation (35 321) (28 094) 25,7 (58 110)
Profit attributable to shareholders 88 765 75 272 17,9 162 966
Profit attributable to: Owners of the parent 87 606 70 183 154 509 Non-controlling interests 1 159 5 089 8 457
88 765 75 272 162 966
Other comprehensive incomeNet change in fair value of available-for-salefinancial assets 104 123 1 694 Realised gains on disposal of available-for-salefinancial assets – – (1 426)Income taxation on other comprehensive income (19) (23) (45)
Other comprehensive income for the period, net of taxation 85 100 223
Total comprehensive income for the period 88 850 75 372 17,9 163 189
Total comprehensive income attributable to: Owners of the parent 87 691 70 283 154 732 Non-controlling interests 1 159 5 089 8 457
88 850 75 372 163 189
Shares in issue:Total shares in issue 143 262 412 143 262 412 143 262 412 Treasury shares (187 287) (1 024 792) (1 048 676)
Net shares in issue 143 075 125 142 237 620 142 213 736
Weighted average number of net shares in issue 142 718 454 142 962 390 142 620 285
Diluted weighted average number of shares 145 606 282 148 325 514 146 323 034
Earnings per share:Earnings per ordinary share (cents) 61,4 49,1 25,1 108,3 Diluted earnings per ordinary share (cents) 60,2 47,3 27,3 105,6
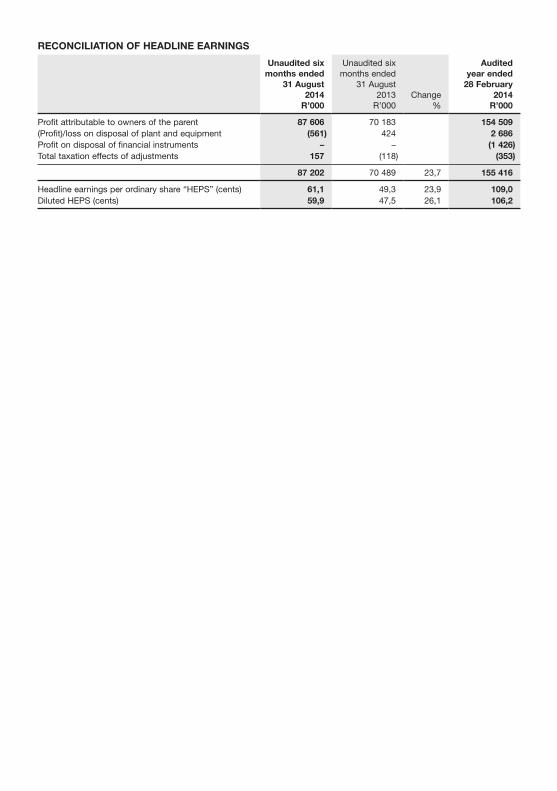
RECONCILIATION OF HEADLINE EARNINGS
Unaudited six months ended
31 August2014
R’000
Unaudited six months ended
31 August2013
R’000Change
%
Audited year ended
28 February2014
R’000
Profit attributable to owners of the parent 87 606 70 183 154 509 (Profit)/loss on disposal of plant and equipment (561) 424 2 686 Profit on disposal of financial instruments – – (1 426)Total taxation effects of adjustments 157 (118) (353)
87 202 70 489 23,7 155 416
Headline earnings per ordinary share “HEPS” (cents) 61,1 49,3 23,9 109,0 Diluted HEPS (cents) 59,9 47,5 26,1 106,2
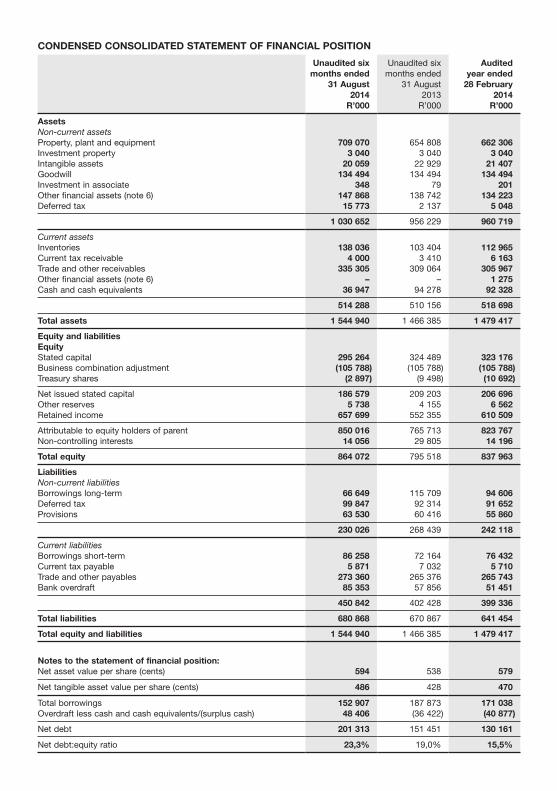
CONDENSED CONSOLIDATED STATEMENT OF FINANCIAL POSITION
Unaudited sixmonths ended
31 August2014
R’000
Unaudited six months ended
31 August2013
R’000
Audited year ended
28 February2014
R’000
AssetsNon-current assetsProperty, plant and equipment 709 070 654 808 662 306Investment property 3 040 3 040 3 040Intangible assets 20 059 22 929 21 407Goodwill 134 494 134 494 134 494Investment in associate 348 79 201Other financial assets (note 6) 147 868 138 742 134 223Deferred tax 15 773 2 137 5 048
1 030 652 956 229 960 719
Current assetsInventories 138 036 103 404 112 965Current tax receivable 4 000 3 410 6 163Trade and other receivables 335 305 309 064 305 967Other financial assets (note 6) – – 1 275Cash and cash equivalents 36 947 94 278 92 328
514 288 510 156 518 698
Total assets 1 544 940 1 466 385 1 479 417
Equity and liabilitiesEquityStated capital 295 264 324 489 323 176Business combination adjustment (105 788) (105 788) (105 788)Treasury shares (2 897) (9 498) (10 692)
Net issued stated capital 186 579 209 203 206 696Other reserves 5 738 4 155 6 562Retained income 657 699 552 355 610 509
Attributable to equity holders of parent 850 016 765 713 823 767Non-controlling interests 14 056 29 805 14 196
Total equity 864 072 795 518 837 963
LiabilitiesNon-current liabilitiesBorrowings long-term 66 649 115 709 94 606Deferred tax 99 847 92 314 91 652Provisions 63 530 60 416 55 860
230 026 268 439 242 118
Current liabilitiesBorrowings short-term 86 258 72 164 76 432Current tax payable 5 871 7 032 5 710Trade and other payables 273 360 265 376 265 743Bank overdraft 85 353 57 856 51 451
450 842 402 428 399 336
Total liabilities 680 868 670 867 641 454
Total equity and liabilities 1 544 940 1 466 385 1 479 417
Notes to the statement of financial position:Net asset value per share (cents) 594 538 579
Net tangible asset value per share (cents) 486 428 470
Total borrowings 152 907 187 873 171 038Overdraft less cash and cash equivalents/(surplus cash) 48 406 (36 422) (40 877)
Net debt 201 313 151 451 130 161
Net debt:equity ratio 23,3% 19,0% 15,5%
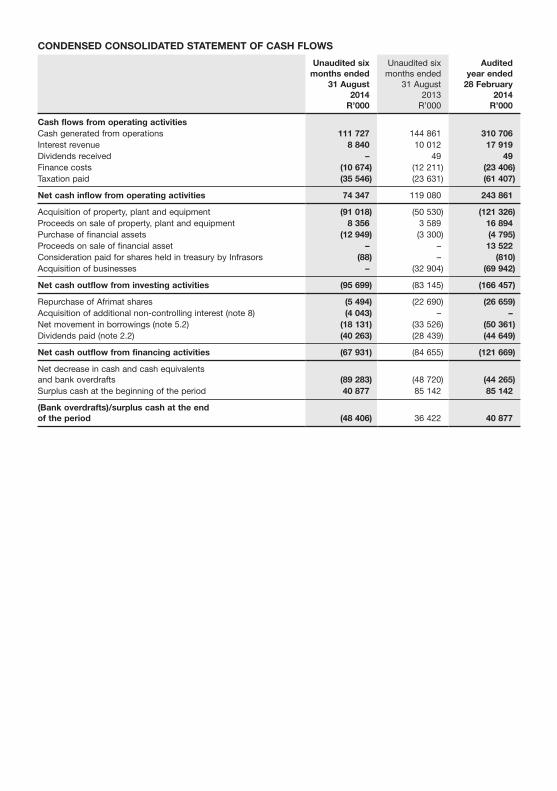
CONDENSED CONSOLIDATED STATEMENT OF CASH FLOWS
Unaudited sixmonths ended
31 August2014
R’000
Unaudited six months ended
31 August2013
R’000
Audited year ended
28 February2014
R’000
Cash flows from operating activitiesCash generated from operations 111 727 144 861 310 706 Interest revenue 8 840 10 012 17 919 Dividends received – 49 49 Finance costs (10 674) (12 211) (23 406)Taxation paid (35 546) (23 631) (61 407)
Net cash inflow from operating activities 74 347 119 080 243 861
Acquisition of property, plant and equipment (91 018) (50 530) (121 326)Proceeds on sale of property, plant and equipment 8 356 3 589 16 894 Purchase of financial assets (12 949) (3 300) (4 795)Proceeds on sale of financial asset – – 13 522 Consideration paid for shares held in treasury by Infrasors (88) – (810)Acquisition of businesses – (32 904) (69 942)
Net cash outflow from investing activities (95 699) (83 145) (166 457)
Repurchase of Afrimat shares (5 494) (22 690) (26 659)Acquisition of additional non-controlling interest (note 8) (4 043) – –Net movement in borrowings (note 5.2) (18 131) (33 526) (50 361)Dividends paid (note 2.2) (40 263) (28 439) (44 649)
Net cash outflow from financing activities (67 931) (84 655) (121 669)
Net decrease in cash and cash equivalents and bank overdrafts (89 283) (48 720) (44 265)Surplus cash at the beginning of the period 40 877 85 142 85 142
(Bank overdrafts)/surplus cash at the end of the period (48 406) 36 422 40 877
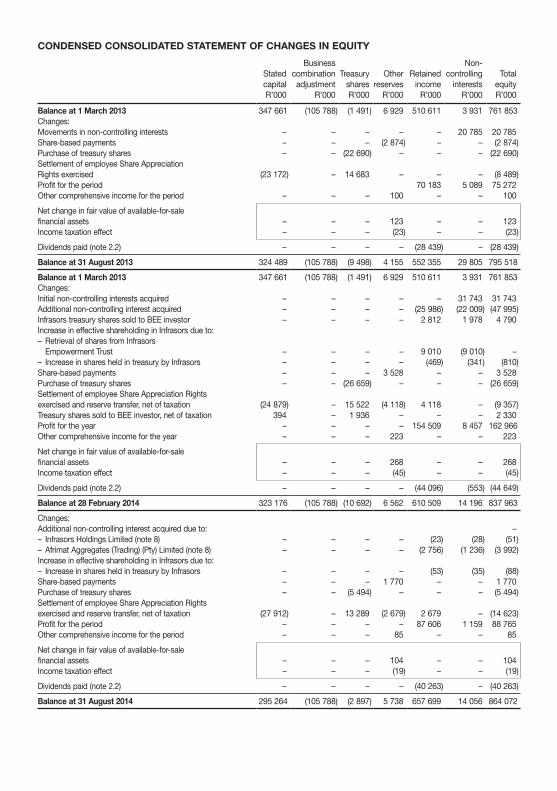
CONDENSED CONSOLIDATED STATEMENT OF CHANGES IN EQUITY
Stated capital
R’000
Business combination adjustment
R’000
Treasury shares
R’000
Otherreserves
R’000
Retained income
R’000
Non-controlling
interestsR’000
Total equityR’000
Balance at 1 March 2013 347 661 (105 788) (1 491) 6 929 510 611 3 931 761 853 Changes:Movements in non-controlling interests – – – – – 20 785 20 785 Share-based payments – – – (2 874) – – (2 874)Purchase of treasury shares – – (22 690) – – – (22 690)Settlement of employee Share Appreciation Rights exercised (23 172) – 14 683 – – – (8 489)Profit for the period 70 183 5 089 75 272 Other comprehensive income for the period – – – 100 – – 100
Net change in fair value of available-for-sale financial assets – – – 123 – – 123 Income taxation effect – – – (23) – – (23)
Dividends paid (note 2.2) – – – – (28 439) – (28 439)
Balance at 31 August 2013 324 489 (105 788) (9 498) 4 155 552 355 29 805 795 518
Balance at 1 March 2013 347 661 (105 788) (1 491) 6 929 510 611 3 931 761 853 Changes:Initial non-controlling interests acquired – – – – – 31 743 31 743 Additional non-controlling interest acquired – – – – (25 986) (22 009) (47 995)Infrasors treasury shares sold to BEE investor – – – – 2 812 1 978 4 790 Increase in effective shareholding in Infrasors due to:– Retrieval of shares from Infrasors
Empowerment Trust – – – – 9 010 (9 010) – – Increase in shares held in treasury by Infrasors – – – – (469) (341) (810)Share-based payments – – – 3 528 – – 3 528 Purchase of treasury shares – – (26 659) – – – (26 659)Settlement of employee Share Appreciation Rights exercised and reserve transfer, net of taxation (24 879) – 15 522 (4 118) 4 118 – (9 357)Treasury shares sold to BEE investor, net of taxation 394 – 1 936 – – – 2 330 Profit for the year – – – – 154 509 8 457 162 966 Other comprehensive income for the year – – – 223 – – 223
Net change in fair value of available-for-sale financial assets – – – 268 – – 268 Income taxation effect – – – (45) – – (45)
Dividends paid (note 2.2) – – – – (44 096) (553) (44 649)
Balance at 28 February 2014 323 176 (105 788) (10 692) 6 562 610 509 14 196 837 963
Changes:Additional non-controlling interest acquired due to: – – Infrasors Holdings Limited (note 8) – – – – (23) (28) (51)– Afrimat Aggregates (Trading) (Pty) Limited (note 8) – – – – (2 756) (1 236) (3 992)Increase in effective shareholding in Infrasors due to:– Increase in shares held in treasury by Infrasors – – – – (53) (35) (88)Share-based payments – – – 1 770 – – 1 770 Purchase of treasury shares – – (5 494) – – – (5 494)Settlement of employee Share Appreciation Rights exercised and reserve transfer, net of taxation (27 912) – 13 289 (2 679) 2 679 – (14 623)Profit for the period – – – – 87 606 1 159 88 765 Other comprehensive income for the period – – – 85 – – 85
Net change in fair value of available-for-sale financial assets – – – 104 – – 104 Income taxation effect – – – (19) – – (19)
Dividends paid (note 2.2) – – – – (40 263) – (40 263)
Balance at 31 August 2014 295 264 (105 788) (2 897) 5 738 657 699 14 056 864 072
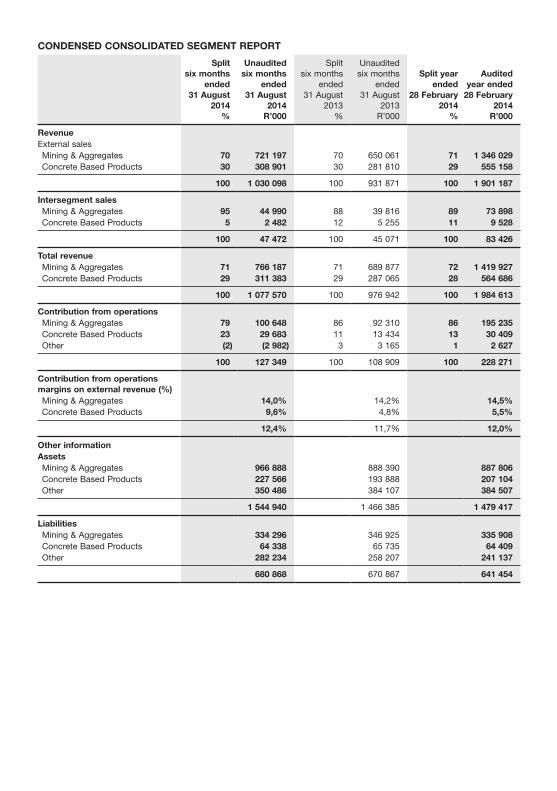
CONDENSED CONSOLIDATED SEGMENT REPORT
Split six months
ended31 August
2014%
Unaudited six months
ended31 August
2014R’000
Split six months
ended31 August
2013%
Unaudited six months
ended31 August
2013R’000
Split yearended
28 February2014
%
Audited year ended
28 February2014
R’000
RevenueExternal sales Mining & Aggregates 70 721 197 70 650 061 71 1 346 029 Concrete Based Products 30 308 901 30 281 810 29 555 158
100 1 030 098 100 931 871 100 1 901 187
Intersegment sales Mining & Aggregates 95 44 990 88 39 816 89 73 898 Concrete Based Products 5 2 482 12 5 255 11 9 528
100 47 472 100 45 071 100 83 426
Total revenue Mining & Aggregates 71 766 187 71 689 877 72 1 419 927 Concrete Based Products 29 311 383 29 287 065 28 564 686
100 1 077 570 100 976 942 100 1 984 613
Contribution from operations Mining & Aggregates 79 100 648 86 92 310 86 195 235 Concrete Based Products 23 29 683 11 13 434 13 30 409 Other (2) (2 982) 3 3 165 1 2 627
100 127 349 100 108 909 100 228 271
Contribution from operations margins on external revenue (%) Mining & Aggregates 14,0% 14,2% 14,5% Concrete Based Products 9,6% 4,8% 5,5%
12,4% 11,7% 12,0%
Other informationAssets Mining & Aggregates 966 888 888 390 887 806 Concrete Based Products 227 566 193 888 207 104 Other 350 486 384 107 384 507
1 544 940 1 466 385 1 479 417
Liabilities Mining & Aggregates 334 296 346 925 335 908 Concrete Based Products 64 338 65 735 64 409 Other 282 234 258 207 241 137
680 868 670 867 641 454
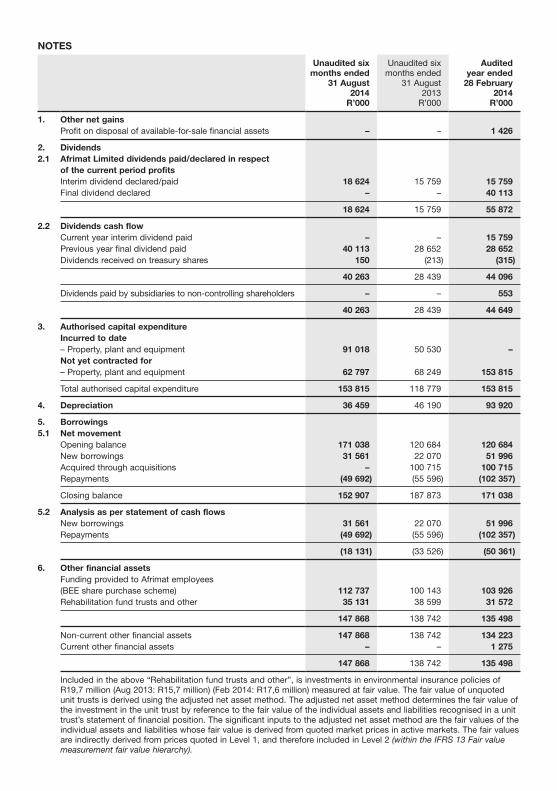
NOTES
Unaudited sixmonths ended
31 August2014
R’000
Unaudited sixmonths ended
31 August2013
R’000
Audited year ended
28 February2014
R’000
1. Other net gainsProfit on disposal of available-for-sale financial assets – – 1 426
2. Dividends2.1 Afrimat Limited dividends paid/declared in respect
of the current period profitsInterim dividend declared/paid 18 624 15 759 15 759 Final dividend declared – – 40 113
18 624 15 759 55 872
2.2 Dividends cash flowCurrent year interim dividend paid – – 15 759 Previous year final dividend paid 40 113 28 652 28 652 Dividends received on treasury shares 150 (213) (315)
40 263 28 439 44 096
Dividends paid by subsidiaries to non-controlling shareholders – – 553
40 263 28 439 44 649
3. Authorised capital expenditureIncurred to date– Property, plant and equipment 91 018 50 530 – Not yet contracted for– Property, plant and equipment 62 797 68 249 153 815
Total authorised capital expenditure 153 815 118 779 153 815
4. Depreciation 36 459 46 190 93 920
5. Borrowings5.1 Net movement
Opening balance 171 038 120 684 120 684 New borrowings 31 561 22 070 51 996 Acquired through acquisitions – 100 715 100 715 Repayments (49 692) (55 596) (102 357)
Closing balance 152 907 187 873 171 038
5.2 Analysis as per statement of cash flowsNew borrowings 31 561 22 070 51 996 Repayments (49 692) (55 596) (102 357)
(18 131) (33 526) (50 361)
6. Other financial assetsFunding provided to Afrimat employees (BEE share purchase scheme) 112 737 100 143 103 926 Rehabilitation fund trusts and other 35 131 38 599 31 572
147 868 138 742 135 498
Non-current other financial assets 147 868 138 742 134 223 Current other financial assets – – 1 275
147 868 138 742 135 498
Included in the above “Rehabilitation fund trusts and other”, is investments in environmental insurance policies of R19,7 million (Aug 2013: R15,7 million) (Feb 2014: R17,6 million) measured at fair value. The fair value of unquoted unit trusts is derived using the adjusted net asset method. The adjusted net asset method determines the fair value of the investment in the unit trust by reference to the fair value of the individual assets and liabilities recognised in a unit trust’s statement of financial position. The significant inputs to the adjusted net asset method are the fair values of the individual assets and liabilities whose fair value is derived from quoted market prices in active markets. The fair values are indirectly derived from prices quoted in Level 1, and therefore included in Level 2 (within the IFRS 13 Fair value measurement fair value hierarchy).
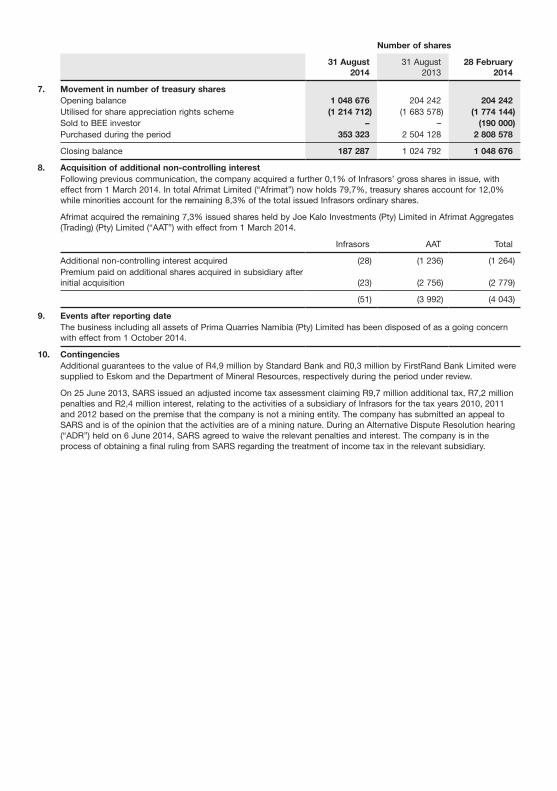
Number of shares
31 August2014
31 August2013
28 February2014
7. Movement in number of treasury sharesOpening balance 1 048 676 204 242 204 242 Utilised for share appreciation rights scheme (1 214 712) (1 683 578) (1 774 144)Sold to BEE investor – – (190 000)Purchased during the period 353 323 2 504 128 2 808 578
Closing balance 187 287 1 024 792 1 048 676
8. Acquisition of additional non-controlling interestFollowing previous communication, the company acquired a further 0,1% of Infrasors’ gross shares in issue, with effect from 1 March 2014. In total Afrimat Limited (“Afrimat”) now holds 79,7%, treasury shares account for 12,0% while minorities account for the remaining 8,3% of the total issued Infrasors ordinary shares.
Afrimat acquired the remaining 7,3% issued shares held by Joe Kalo Investments (Pty) Limited in Afrimat Aggregates (Trading) (Pty) Limited (“AAT”) with effect from 1 March 2014.
Infrasors AAT Total
Additional non-controlling interest acquired (28) (1 236) (1 264)Premium paid on additional shares acquired in subsidiary after initial acquisition (23) (2 756) (2 779)
(51) (3 992) (4 043)
9. Events after reporting dateThe business including all assets of Prima Quarries Namibia (Pty) Limited has been disposed of as a going concern with effect from 1 October 2014.
10. ContingenciesAdditional guarantees to the value of R4,9 million by Standard Bank and R0,3 million by FirstRand Bank Limited were supplied to Eskom and the Department of Mineral Resources, respectively during the period under review.
On 25 June 2013, SARS issued an adjusted income tax assessment claiming R9,7 million additional tax, R7,2 million penalties and R2,4 million interest, relating to the activities of a subsidiary of Infrasors for the tax years 2010, 2011 and 2012 based on the premise that the company is not a mining entity. The company has submitted an appeal to SARS and is of the opinion that the activities are of a mining nature. During an Alternative Dispute Resolution hearing (“ADR”) held on 6 June 2014, SARS agreed to waive the relevant penalties and interest. The company is in the process of obtaining a final ruling from SARS regarding the treatment of income tax in the relevant subsidiary.
Directors MW von Wielligh*^ (Chairman)AJ van Heerden (CEO)HP Verreynne (Financial Director)GJ CoffeeL Dotwana*F du Toit*PRE Tsukudu*^JF van der Merwe*^HJE van Wyk*^ * Non-executive director ^ Independent
Registered officeTyger Valley Office Park No. 2Corner Willie van SchoorAvenue and Old Oak RoadTyger Valley7530(PO Box 5278, Tyger Valley, 7536)
SponsorBridge Capital Advisors (Pty) Limited27 Fricker RoadIllovo2196(PO Box 651010, Benmore, 2010)
AuditorsMazars Inc.Mazars HouseRialto RoadGrand MooringsPrecinct Century City7441(PO Box 134, Century City, 7446)
Transfer secretariesComputershare Investor Services (Pty) Limited70 Marshall StreetJohannesburg2001 (PO Box 61051, Marshalltown, 2107)
Company secretaryM SwartTyger Valley Office Park No. 2Corner Willie van Schoor Avenue and Old Oak RoadTyger Valley7530 (PO Box 5278, Tyger Valley, 7536)


