Tropical Cyclone ReportHurricane Gordon
14-18 September 2000
Stacy R. StewartNational Hurricane Center
26 November 2000
Gordon became a category one hurricane on the Saffir-Simpson Hurricane Scale over theeastern Gulf of Mexico, but eventually made landfall in the Florida Big Bend area as a weakeningtropical storm.
a. Synoptic History
A tropical wave moved off the west coast of Africa on 4 September and tracked westwardacross the tropical Atlantic. Little or no deep convection was associated with the wave until 8September when the wave was located about 600 n mi east of the Lesser Antilles. The tropical wavemoved through those islands on 9-10 September bringing locally heavy rainfall and wind gusts of25 to 30 kt. The wave tracked west-northwestward and developed centralized convection near thevorticity center over the central Caribbean Sea on the 12 . th
Satellite classifications from the Tropical Analysis and Forecast Branch (TAFB) and theSatellite Analysis Branch (SAB) began around 0000 UTC 13 October. They indicated the convectionwas poorly organized. However, by 1800 UTC surface observations indicated a broad low pressurearea had developed along the wave axis about 100 n mi southeast of Cozumel, Mexico. At 0000UTC 14 October, Dvorak satellite intensity estimates from the TAFB, SAB, and the Air ForceWeather Agency (AFWA) suggested the broad low pressure system was near tropical depressionstrength, but the overall convective pattern was still poorly organized.
Tropical Depression Eleven formed about midway between Cozumel and Chetumal, Mexicoon the morning of 14 October based on a U. S. Air Force Reserve (USAFR) reconnaissance aircraftreport of a broad closed circulation and 31 kt flight-level (1500 ft) winds. By 2100 UTC, thedepression’s low-level center had moved inland over the eastern Yucatan Peninsula, while the morepronounced mid-level circulation was located about 10 n mi to the northeast. This decoupled patternpersisted for more than 24 hours while the depression tracked slowly northwestward across thenorthern Yucatan Peninsula.
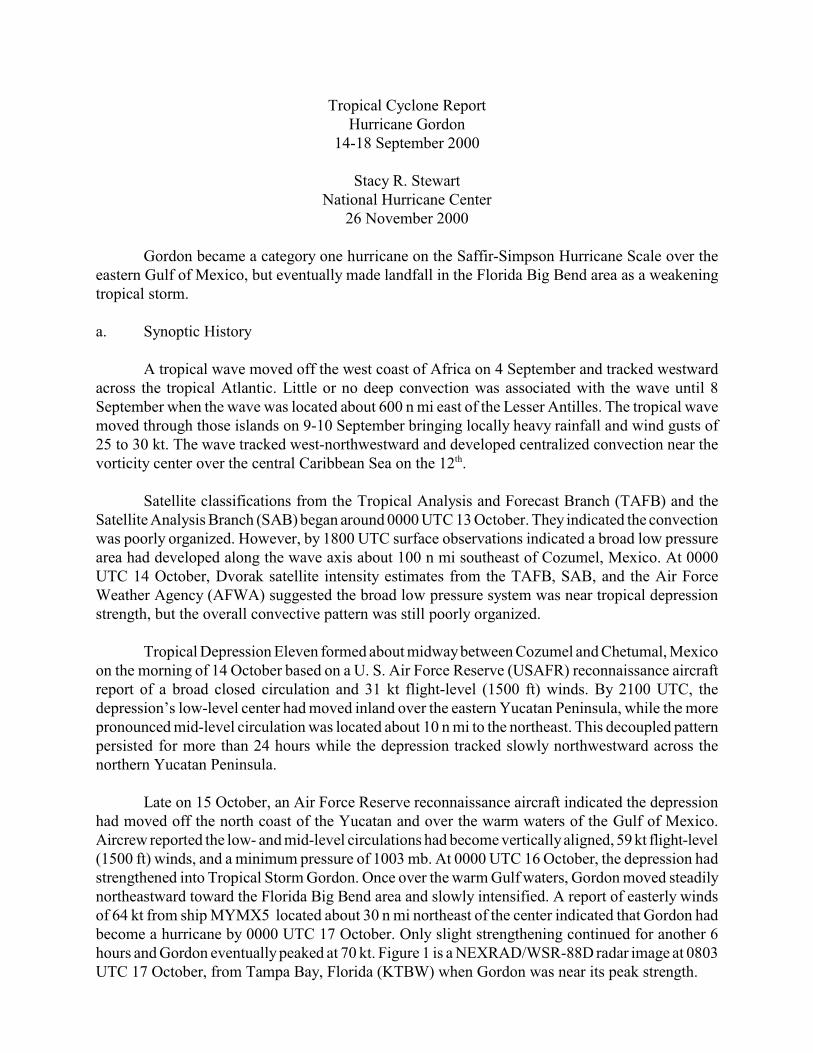
Late on 15 October, an Air Force Reserve reconnaissance aircraft indicated the depressionhad moved off the north coast of the Yucatan and over the warm waters of the Gulf of Mexico.Aircrew reported the low- and mid-level circulations had become vertically aligned, 59 kt flight-level(1500 ft) winds, and a minimum pressure of 1003 mb. At 0000 UTC 16 October, the depression hadstrengthened into Tropical Storm Gordon. Once over the warm Gulf waters, Gordon moved steadilynortheastward toward the Florida Big Bend area and slowly intensified. A report of easterly windsof 64 kt from ship MYMX5 located about 30 n mi northeast of the center indicated that Gordon hadbecome a hurricane by 0000 UTC 17 October. Only slight strengthening continued for another 6hours and Gordon eventually peaked at 70 kt. Figure 1 is a NEXRAD/WSR-88D radar image at 0803UTC 17 October, from Tampa Bay, Florida (KTBW) when Gordon was near its peak strength.
After peaking on the 17 about 165 n mi southwest of Tampa, Florida, slow weakening beganth
as moderate southwesterly upper-level winds ahead of an approaching mid-tropospheric troughbegan to increase the vertical shear across the hurricane. Water vapor imagery and surroundingupper-air data indicated that mid-level dry air entrainment from the south also helped the weakeningprocess. The dry air helped erode the outer cloud and precipitation shield and gradually wrapped intothe inner core of the hurricane. This is depicted in Figure 1 by the large rain-free or “dry slot” arealocated in the eastern semicircle between the eye and the outer convective bands near the Floridawest coast. Within a few hours, the dry slot had worked its way counter-clockwise completelyaround the eye and by 1328 UTC reconnaissance reports indicated the minimum surface pressurehad risen sharply to 990 mb.
Gordon weakened to a tropical storm at 0000 UTC 18 October. It continued to tracknortheastward and eventually made landfall just northwest of Cedar Key, Florida, at 0300 UTC 18October, as a tropical storm with 55 kt winds. After landfall, interaction with land and cool, stableair north of a weak frontal boundary hastened the weakening process. At 1200 UTC the same day,Gordon weakened into a tropical depression. By 1800 UTC, it merged with the front andextratropical transition occurred over southeast Georgia. Gordon’s remnant low-level circulationthen moved northeastward up the east coast of the United States for the next 3 days before beingabsorbed by a large extratropical low pressure system over eastern Canada around 1200 UTC21October. Owing to the lack of any significant baroclinic effects, only modest rainfall totals andno significant flooding were observed over the mid-Atlantic and northeast regions of the UnitedStates.
b. Meteorological Statistics
Table 1 lists the best track positions and intensities of Gordon at six-hour intervals. Figure2 is a display of this track. Observations in Gordon (Figs. 3 and 4) include satellite-based Dvoraktechnique intensity estimates from TAFB, SAB, and AFWA. In addition, flight-level observationswere available from flights of the USAFR 53 Weather Reconnaissance Squadron and the NOAArd
Aircraft Operations Center.
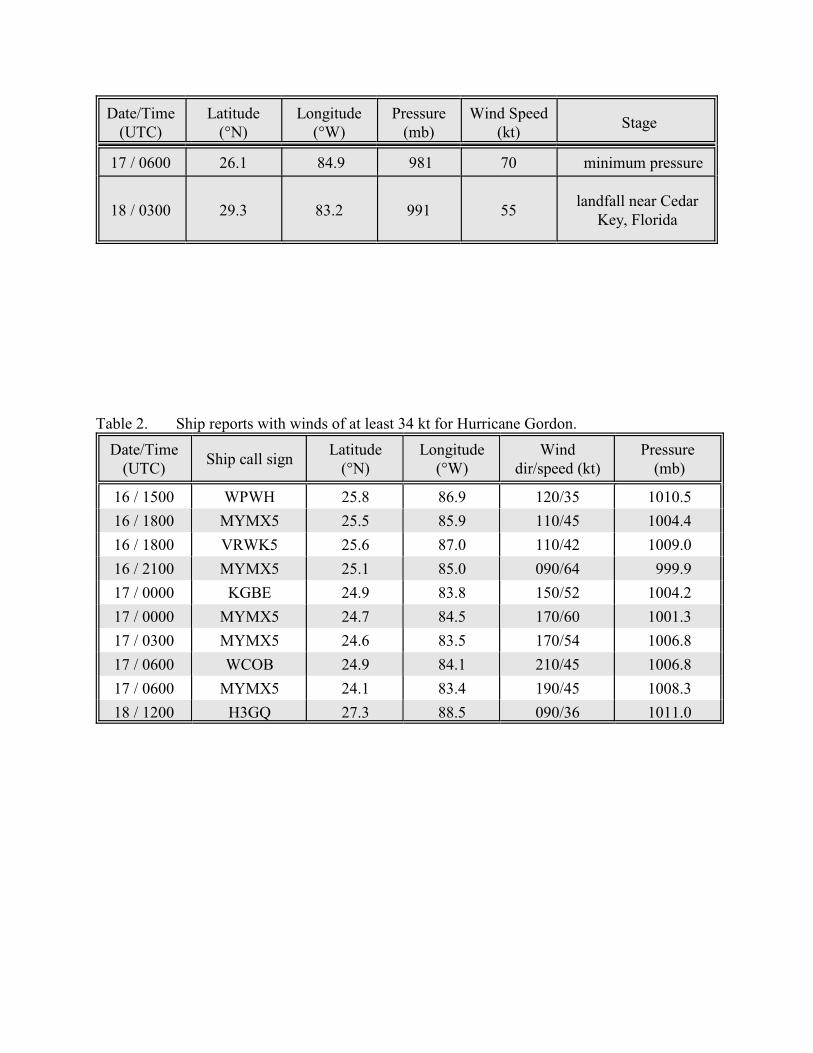
As a result of Gordon weakening well offshore the Florida west coast, only a few reports oftropical storm force winds were received. Tables 2 and 3 consist of all ship and buoy reports,respectively, of tropical storm force winds (> 34 kt) associated with Hurricane Gordon. Table 4consists of selected surface reports from Automated Surface Observing System (ASOS) and Coastal-Marine Automated Network (C-MAN) observation stations from Florida for Hurricane Gordon.
During Gordon’s intensification stage, the maximum reconnaissance flight level (850 mb)wind measured was 89 kt (71 kt surface wind using an adjustment factor of 80%) at 0544 UTC 17October, whereas the minimum surface pressure of 981 mb was observed at 0805 UTC -- 11 mblower than the pressure when the maximum wind was observed.
Dry air entrainment further reduced the amount of rainfall that typically occurs with a landfalling tropical cyclone moving at a forward speed of 10 to 12 kt. The largest rainfall amounts werereported in Florida and ranged from 4.83 in at Cedar Key on the west coast to 3.02 in at Vero Beachon the east coast. No significant flooding was reported.
Gordon’s weakened state also reduced the amount of storm surge flooding that otherwise
could have occurred. Maximum storm tides (i.e., water height above National Geodetic VerticalDatum [1929 mean sea level]) occurred along the Florida west coast and generally ranged from 3to 5 ft from the Tampa Bay area northward to Cedar Key.
c. Forecast and Warning Critique
There are no error statistics available at 72 h due to the short time period that Gordon existedas a tropical storm or hurricane. Average official track errors for Gordon (with the number of casesin parentheses) were 32 (8), 37 (6), 40 (4), and 75 (2) n mi for the 12, 24, 36, and 48 h forecasts,respectively. These errors are significantly lower than the average official track errors for the 10-yrperiod 1990-1999 (46, 85, 122, and 158 n mi, respectively) at all times. The official forecast errorswere better than all available forecast guidance at all times, except slightly worse than the CLIPER(CLImatological and PERsistence) model at 12 h and the GFDL model at 48 h.
Average official intensity errors for Gordon were 8, 9, 20, and 18 kt for the 12, 24, 36, and 48,respectively. Unlike the track errors, the intensity errors were greater than the average official errorsfor the 10-yr period 1990-1999 (7, 11, 13, and 16 kt, respectively), and were over-forecasts at alltimes, especially at 36 and 48 h. The SHIPS (Statistical Hurricane Intensity Prediction Scheme)intensity forecast model had similarly poor intensity forecasts.
Table 5 lists watches and warnings issued for Hurricane Gordon.
d. Casualty and Damage Statistics
There were 23 deaths reported in Guatemala due to heavy rainfall-induced flooding inmountainous areas. Many of the deaths may have occurred during the pre-depression stage while thesystem was moving slowly over the western Caribbean Sea and Yucatan Peninsula of Mexico. Onedeath occurred in the United States when a surfer drowned in heavy seas near Pensacola, FL whileGordon make landfall in the Florida Big Bend area.
Most of the damage was due to downed tree and power lines. In addition, more than 20,000Florida customers lost power for more than six hours during Gordon’s passage. Also, numeroushomes along the immediate Florida west coast from the Tampa Bay area northward to Cedar Keyexperienced some minor roof damage. Some coastal roads and highways experienced flooding fromthe storm surge and had to be temporarily closed. Damage estimate for the United States is $10.8million. No damage estimates have been received from Guatemala in association with the heavyrainfall and flooding.
There were also two confirmed tornadoes. The first tornado (intensity unknown) occurredaround 1845 UTC 17 October, in Cape Coral along the Florida west coast. At least 1 home receivedmajor damage and 2 other homes received minor damage. A second tornado (F0) touched down laterthat down around 2030 UTC near the town of Ponce Inlet in Volusia County along the Florida eastcoast. Damage was minimal and mainly confined to downed trees and power lines, although a fewhomes received minor damage.
Figure 1. 0803 UTC, 17 October 2000, NEXRAD/WSR-88D Base Reflectivity (0.5 elev.) radaro
data from Tampa Bay (KTBW), Florida. Image is at approximately the same time theminimum pressure of 981 mb was observed. Eye is located about 140 n mi west-southwest of the radar site at an altitude of approximately 22,000 ft ASL.
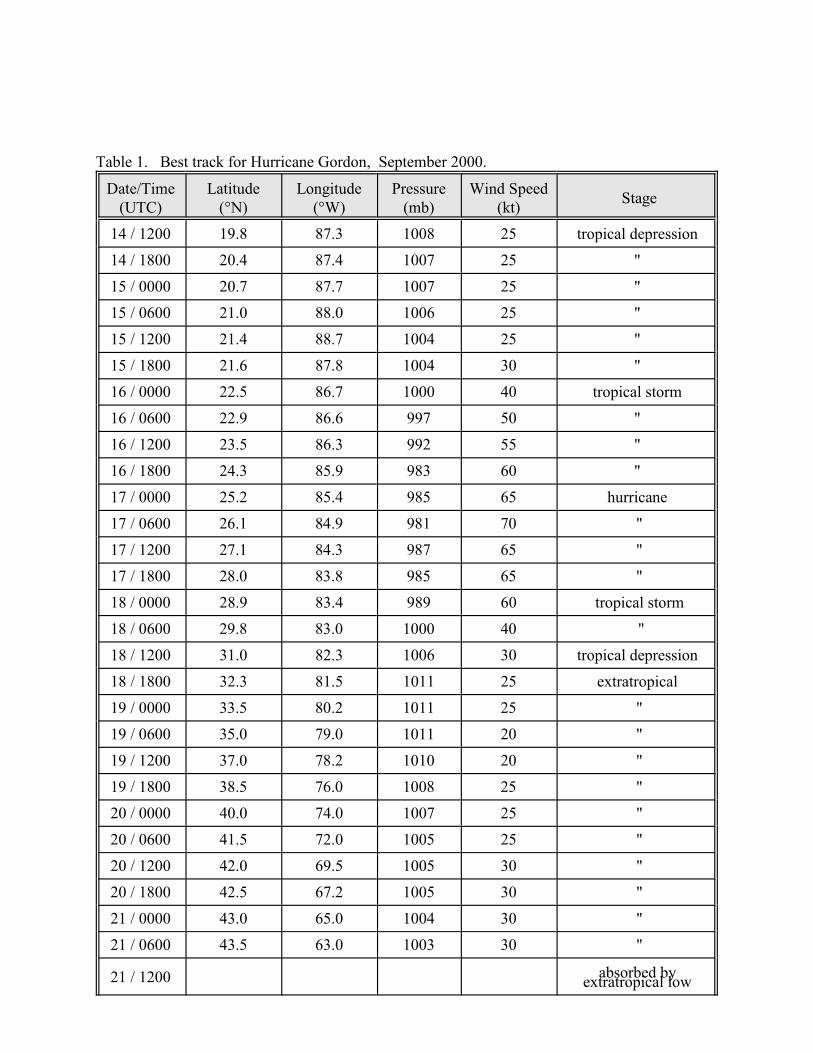
Table 1. Best track for Hurricane Gordon, September 2000.
Date/Time(UTC)
Latitude(°N)
Longitude(°W)
Pressure(mb)
Wind Speed(kt)
Stage
14 / 1200 19.8 87.3 1008 25 tropical depression
14 / 1800 20.4 87.4 1007 25 "
15 / 0000 20.7 87.7 1007 25 "
15 / 0600 21.0 88.0 1006 25 "
15 / 1200 21.4 88.7 1004 25 "
15 / 1800 21.6 87.8 1004 30 "
16 / 0000 22.5 86.7 1000 40 tropical storm
16 / 0600 22.9 86.6 997 50 "
16 / 1200 23.5 86.3 992 55 "
16 / 1800 24.3 85.9 983 60 "
17 / 0000 25.2 85.4 985 65 hurricane
17 / 0600 26.1 84.9 981 70 "
17 / 1200 27.1 84.3 987 65 "
17 / 1800 28.0 83.8 985 65 "
18 / 0000 28.9 83.4 989 60 tropical storm
18 / 0600 29.8 83.0 1000 40 "
18 / 1200 31.0 82.3 1006 30 tropical depression
18 / 1800 32.3 81.5 1011 25 extratropical
19 / 0000 33.5 80.2 1011 25 "
19 / 0600 35.0 79.0 1011 20 "
19 / 1200 37.0 78.2 1010 20 "
19 / 1800 38.5 76.0 1008 25 "
20 / 0000 40.0 74.0 1007 25 "
20 / 0600 41.5 72.0 1005 25 "
20 / 1200 42.0 69.5 1005 30 "
20 / 1800 42.5 67.2 1005 30 "
21 / 0000 43.0 65.0 1004 30 "
21 / 0600 43.5 63.0 1003 30 "
21 / 1200 absorbed byextratropical low
Date/Time(UTC)
Latitude(°N)
Longitude(°W)
Pressure(mb)
Wind Speed(kt)
Stage
17 / 0600 26.1 84.9 981 70 minimum pressure
18 / 0300 29.3 83.2 991 55landfall near Cedar
Key, Florida
Table 2. Ship reports with winds of at least 34 kt for Hurricane Gordon.
Date/Time(UTC)
Ship call signLatitude
(°N)Longitude
(°W)Wind
dir/speed (kt)Pressure
(mb)
16 / 1500 WPWH 25.8 86.9 120/35 1010.5
16 / 1800 MYMX5 25.5 85.9 110/45 1004.4
16 / 1800 VRWK5 25.6 87.0 110/42 1009.0
16 / 2100 MYMX5 25.1 85.0 090/64 999.9
17 / 0000 KGBE 24.9 83.8 150/52 1004.2
17 / 0000 MYMX5 24.7 84.5 170/60 1001.3
17 / 0300 MYMX5 24.6 83.5 170/54 1006.8
17 / 0600 WCOB 24.9 84.1 210/45 1006.8
17 / 0600 MYMX5 24.1 83.4 190/45 1008.3
18 / 1200 H3GQ 27.3 88.5 090/36 1011.0
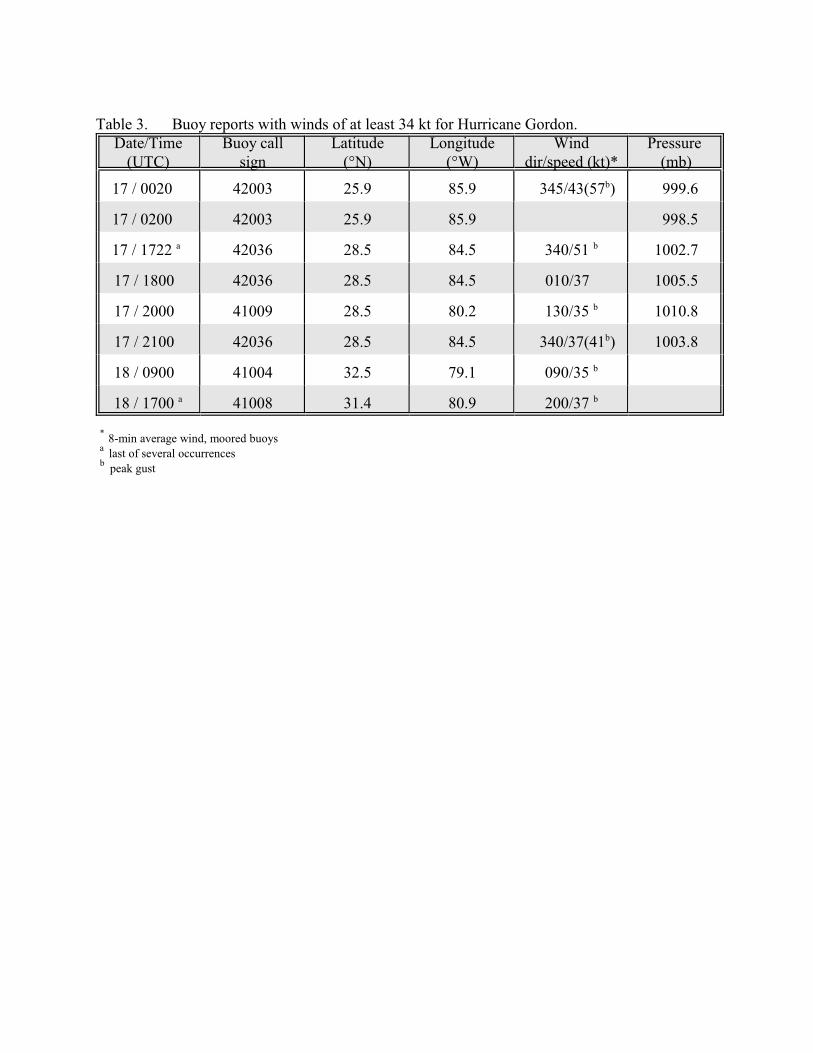
Table 3. Buoy reports with winds of at least 34 kt for Hurricane Gordon.Date/Time
(UTC)Buoy call
signLatitude
(°N)Longitude
(°W)Wind
dir/speed (kt)*Pressure
(mb)
17 / 0020 42003 25.9 85.9 345/43(57 ) 999.6b
17 / 0200 42003 25.9 85.9 998.5
17 / 1722 42036 28.5 84.5 340/51 1002.7a b
17 / 1800 42036 28.5 84.5 010/37 1005.5
17 / 2000 41009 28.5 80.2 130/35 1010.8b
17 / 2100 42036 28.5 84.5 340/37(41 ) 1003.8b
18 / 0900 41004 32.5 79.1 090/35 b
18 / 1700 41008 31.4 80.9 200/37 a b
8-min average wind, moored buoys*
last of several occurrencesa
peak gustb
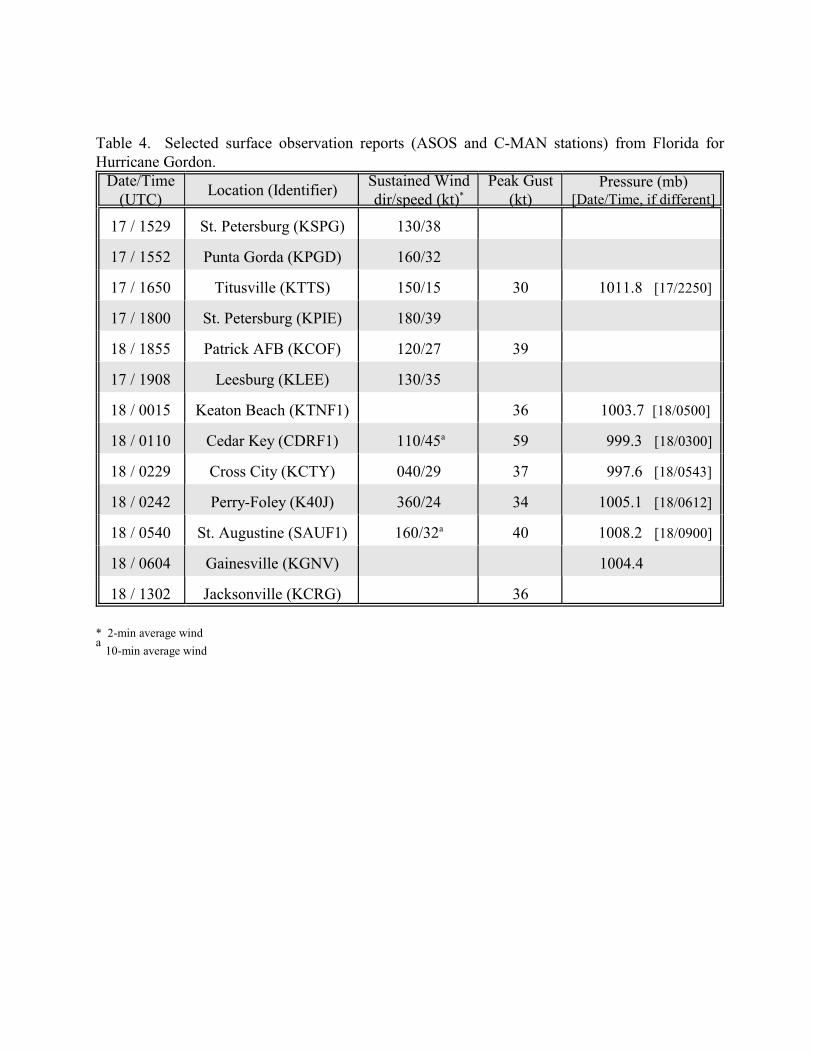
Table 4. Selected surface observation reports (ASOS and C-MAN stations) from Florida forHurricane Gordon.
Date/Time(UTC)
Location (Identifier)Sustained Winddir/speed (kt)*
Peak Gust(kt)
Pressure (mb)[Date/Time, if different]
17 / 1529 St. Petersburg (KSPG) 130/38
17 / 1552 Punta Gorda (KPGD) 160/32
17 / 1650 Titusville (KTTS) 150/15 30 1011.8 [17/2250]
17 / 1800 St. Petersburg (KPIE) 180/39
18 / 1855 Patrick AFB (KCOF) 120/27 39
17 / 1908 Leesburg (KLEE) 130/35
18 / 0015 Keaton Beach (KTNF1) 36 1003.7 [18/0500]
18 / 0110 Cedar Key (CDRF1) 110/45 59 999.3 [18/0300]a
18 / 0229 Cross City (KCTY) 040/29 37 997.6 [18/0543]
18 / 0242 Perry-Foley (K40J) 360/24 34 1005.1 [18/0612]
18 / 0540 St. Augustine (SAUF1) 160/32 40 1008.2 [18/0900]a
18 / 0604 Gainesville (KGNV) 1004.4
18 / 1302 Jacksonville (KCRG) 36
* 2-min average wind
10-min average winda
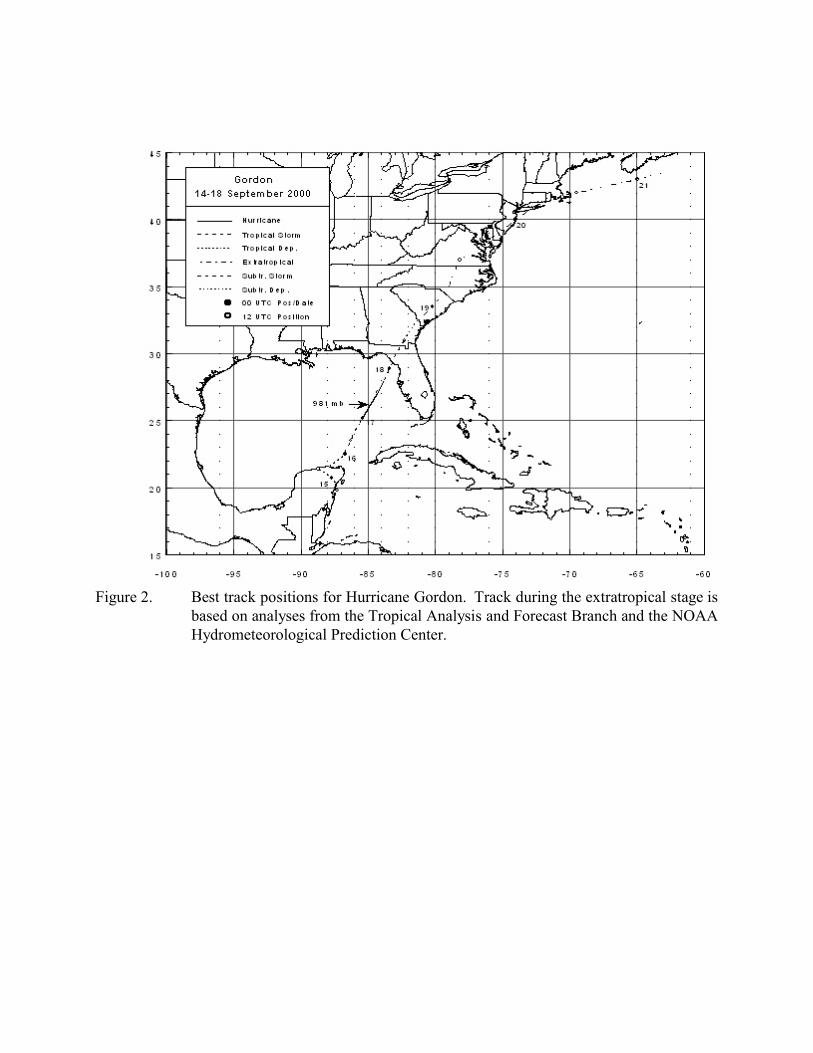
Figure 2. Best track positions for Hurricane Gordon. Track during the extratropical stage isbased on analyses from the Tropical Analysis and Forecast Branch and the NOAAHydrometeorological Prediction Center.
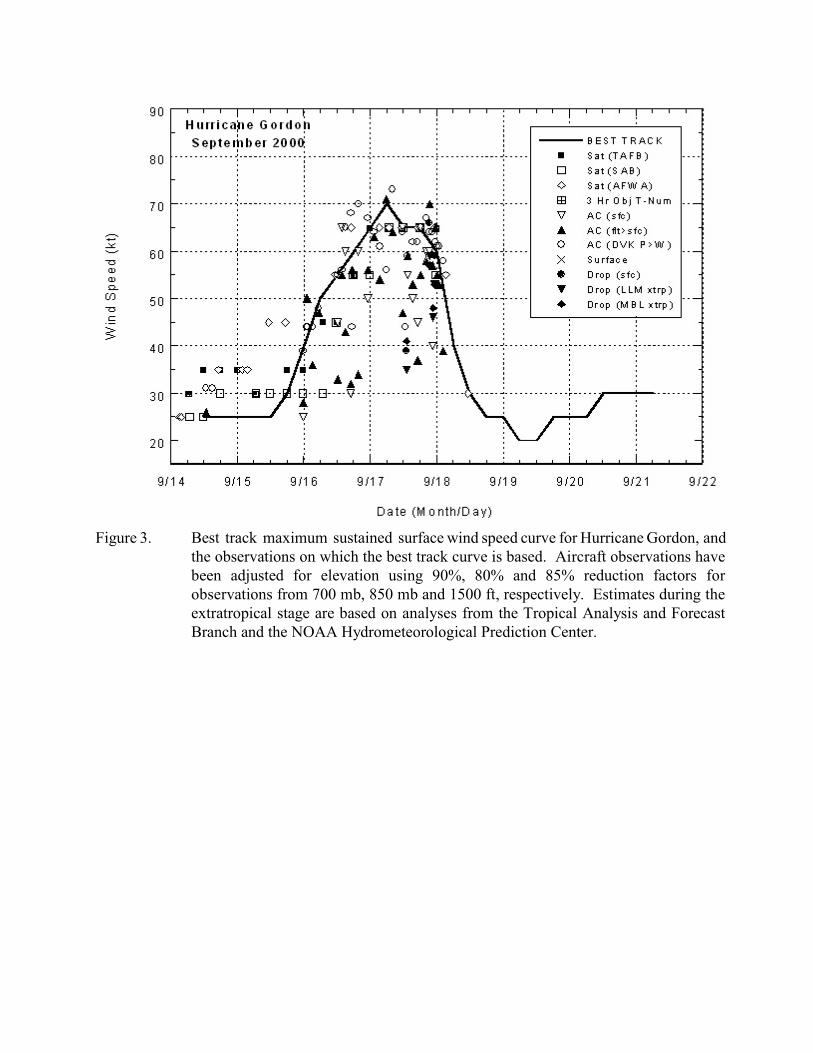
Figure 3. Best track maximum sustained surface wind speed curve for Hurricane Gordon, andthe observations on which the best track curve is based. Aircraft observations havebeen adjusted for elevation using 90%, 80% and 85% reduction factors forobservations from 700 mb, 850 mb and 1500 ft, respectively. Estimates during theextratropical stage are based on analyses from the Tropical Analysis and ForecastBranch and the NOAA Hydrometeorological Prediction Center.
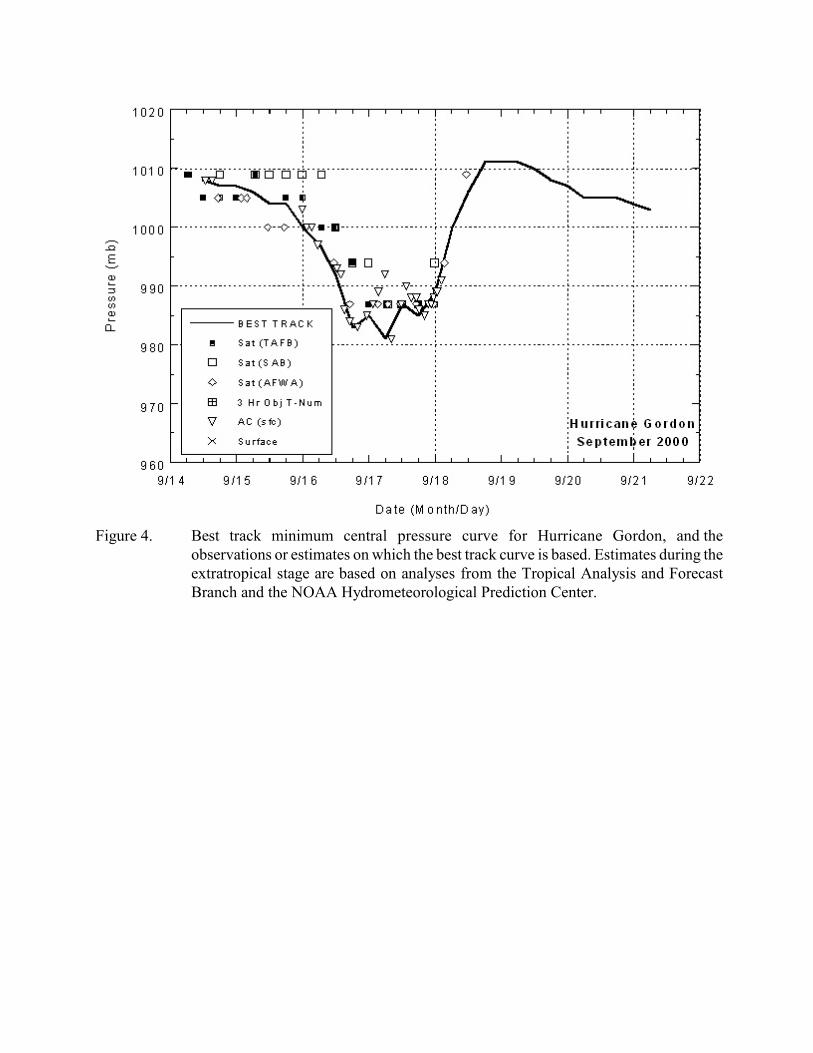
Figure 4. Best track minimum central pressure curve for Hurricane Gordon, and theobservations or estimates on which the best track curve is based. Estimates during theextratropical stage are based on analyses from the Tropical Analysis and ForecastBranch and the NOAA Hydrometeorological Prediction Center.
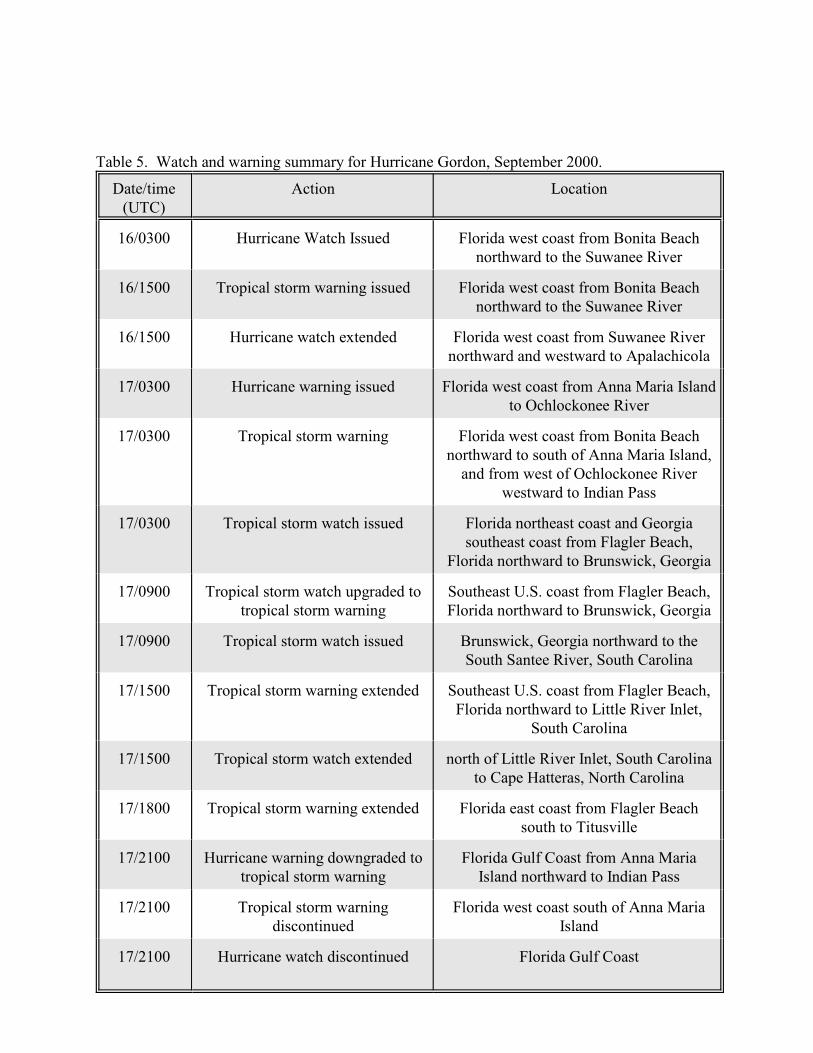
Table 5. Watch and warning summary for Hurricane Gordon, September 2000.
Date/time(UTC)
Action Location
16/0300 Hurricane Watch Issued Florida west coast from Bonita Beachnorthward to the Suwanee River
16/1500 Tropical storm warning issued Florida west coast from Bonita Beachnorthward to the Suwanee River
16/1500 Hurricane watch extended Florida west coast from Suwanee Rivernorthward and westward to Apalachicola
17/0300 Hurricane warning issued Florida west coast from Anna Maria Islandto Ochlockonee River
17/0300 Tropical storm warning Florida west coast from Bonita Beachnorthward to south of Anna Maria Island,
and from west of Ochlockonee Riverwestward to Indian Pass
17/0300 Tropical storm watch issued Florida northeast coast and Georgiasoutheast coast from Flagler Beach,
Florida northward to Brunswick, Georgia
17/0900 Tropical storm watch upgraded totropical storm warning
Southeast U.S. coast from Flagler Beach,Florida northward to Brunswick, Georgia
17/0900 Tropical storm watch issued Brunswick, Georgia northward to theSouth Santee River, South Carolina
17/1500 Tropical storm warning extended Southeast U.S. coast from Flagler Beach,Florida northward to Little River Inlet,
South Carolina
17/1500 Tropical storm watch extended north of Little River Inlet, South Carolinato Cape Hatteras, North Carolina
17/1800 Tropical storm warning extended Florida east coast from Flagler Beachsouth to Titusville
17/2100 Hurricane warning downgraded totropical storm warning
Florida Gulf Coast from Anna MariaIsland northward to Indian Pass
17/2100 Tropical storm warningdiscontinued
Florida west coast south of Anna MariaIsland
17/2100 Hurricane watch discontinued Florida Gulf Coast
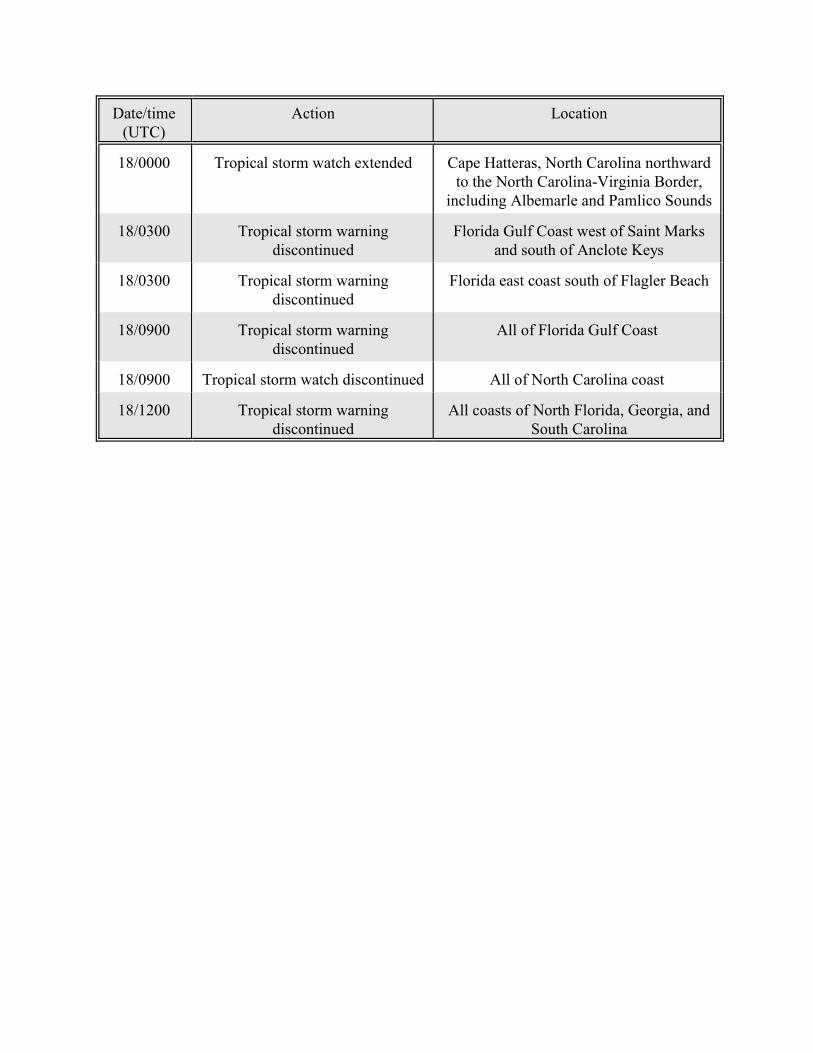
Date/time(UTC)
Action Location
18/0000 Tropical storm watch extended Cape Hatteras, North Carolina northwardto the North Carolina-Virginia Border,
including Albemarle and Pamlico Sounds
18/0300 Tropical storm warningdiscontinued
Florida Gulf Coast west of Saint Marksand south of Anclote Keys
18/0300 Tropical storm warningdiscontinued
Florida east coast south of Flagler Beach
18/0900 Tropical storm warningdiscontinued
All of Florida Gulf Coast
18/0900 Tropical storm watch discontinued All of North Carolina coast
18/1200 Tropical storm warningdiscontinued
All coasts of North Florida, Georgia, andSouth Carolina


