Third Energy UK Gas Limited
Air quality impact assessment of operations at the
Kirby Misperton A wellsite
Report 150332
Date 17 September 2015
Revision 10
Report No.150332 Page 1 of 41
Revision 10
17 September 2015
AIR QUALITY IMPACT ASSESSMENT OF OPERATIONS AT THE KIRBY MISPERTON A WELLSITE THIRD ENERGY UK GAS LIMITED
Report prepared for
Third Energy UK Gas Limited
Knapton Generating station
East Knapton
Malton
North Yorkshire
YO17 8JF
Report prepared by
Environmental Scientifics Group Limited Unit D
Bankside Trade Park
Cirencester
GL7 1YT
Author
Report No.150332 Page 2 of 41
Revision 10
Third Energy UK Gas Limited
Kirby Misperton
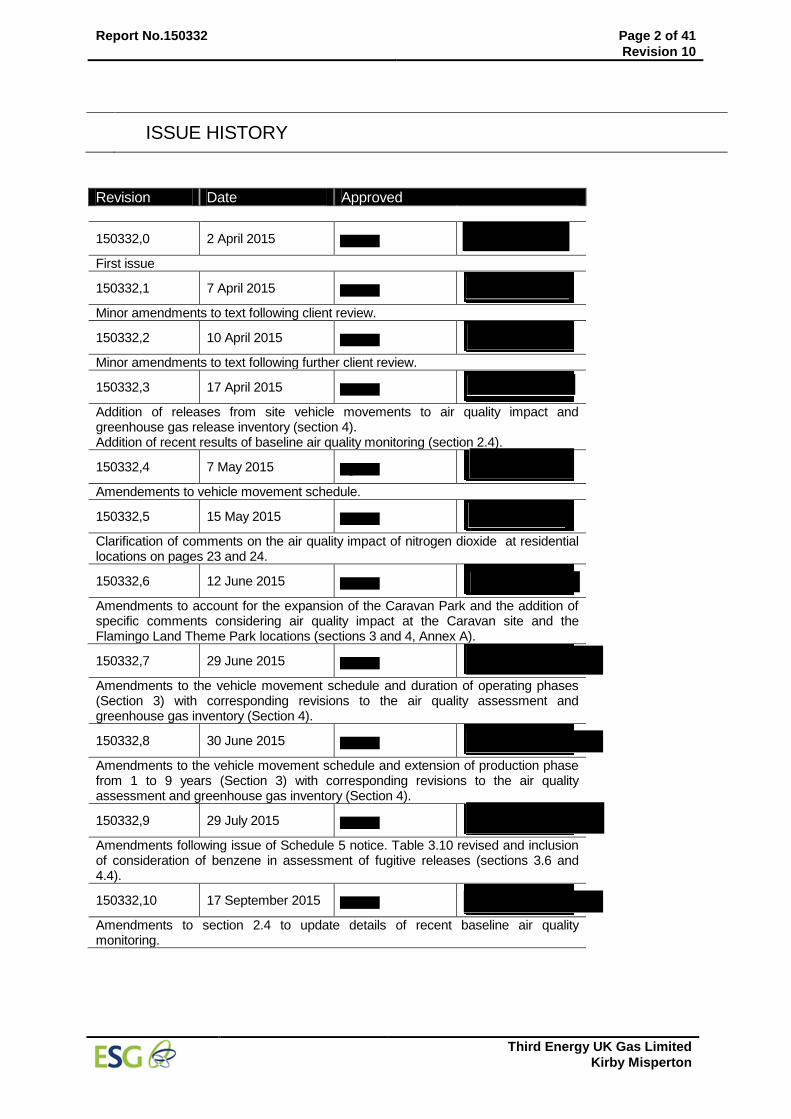
ISSUE HISTORY
Revision Date Approved
150332,0 2 April 2015
First issue
150332,1 7 April 2015
Minor amendments to text following client review.
150332,2 10 April 2015
Minor amendments to text following further client review.
150332,3 17 April 2015
Addition of releases from site vehicle movements to air quality impact and greenhouse gas release inventory (section 4). Addition of recent results of baseline air quality monitoring (section 2.4).
150332,4 7 May 2015
Amendements to vehicle movement schedule.
150332,5 15 May 2015
Clarification of comments on the air quality impact of nitrogen dioxide at residential locations on pages 23 and 24.
150332,6 12 June 2015
Amendments to account for the expansion of the Caravan Park and the addition of specific comments considering air quality impact at the Caravan site and the Flamingo Land Theme Park locations (sections 3 and 4, Annex A).
150332,7 29 June 2015
Amendments to the vehicle movement schedule and duration of operating phases (Section 3) with corresponding revisions to the air quality assessment and greenhouse gas inventory (Section 4).
150332,8 30 June 2015
Amendments to the vehicle movement schedule and extension of production phase from 1 to 9 years (Section 3) with corresponding revisions to the air quality assessment and greenhouse gas inventory (Section 4).
150332,9 29 July 2015
Amendments following issue of Schedule 5 notice. Table 3.10 revised and inclusion of consideration of benzene in assessment of fugitive releases (sections 3.6 and 4.4).
150332,10 17 September 2015
Amendments to section 2.4 to update details of recent baseline air quality monitoring.
Report No.150332 Page 3 of 41
Revision 10
Third Energy UK Gas Limited
Kirby Misperton
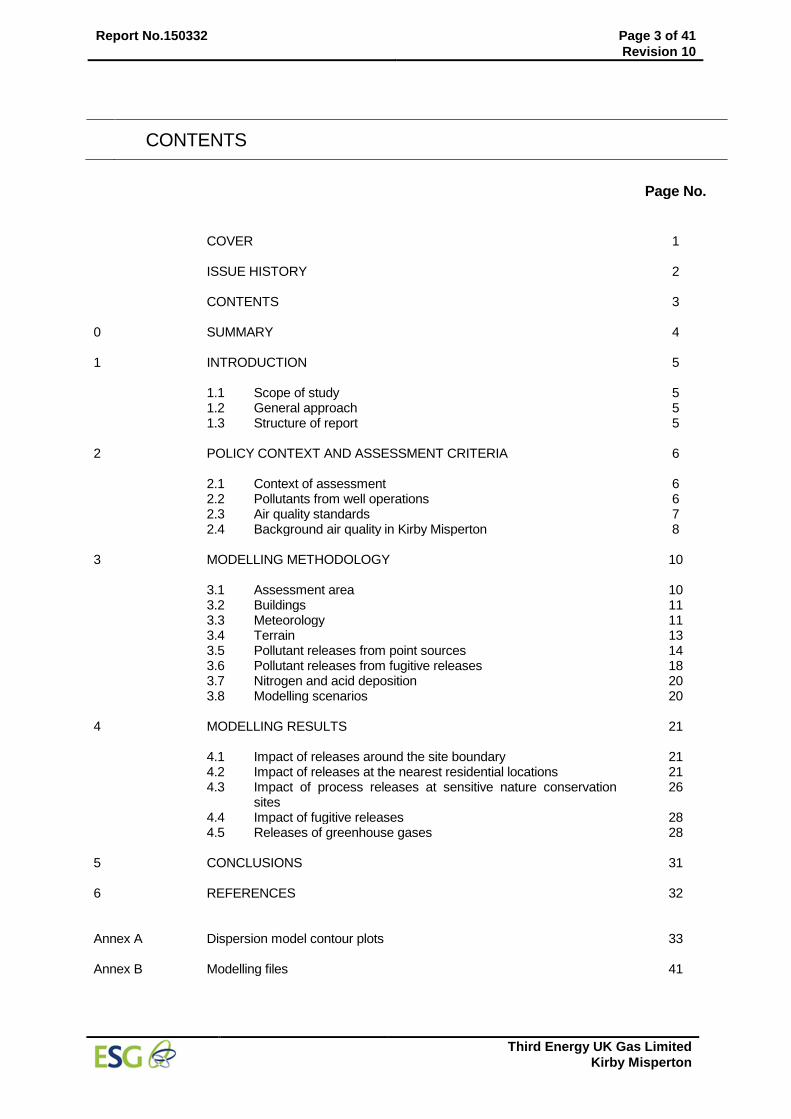
CONTENTS
Page No. COVER 1 ISSUE HISTORY 2 CONTENTS 3 0 SUMMARY 4 1 INTRODUCTION 5 1.1 Scope of study 5 1.2 General approach 5 1.3 Structure of report 5 2 POLICY CONTEXT AND ASSESSMENT CRITERIA 6 2.1 Context of assessment 6 2.2 Pollutants from well operations 6 2.3 Air quality standards 7 2.4 Background air quality in Kirby Misperton 8 3 MODELLING METHODOLOGY 10 3.1 Assessment area 10 3.2 Buildings 11 3.3 Meteorology 11 3.4 Terrain 13 3.5 Pollutant releases from point sources 14 3.6 Pollutant releases from fugitive releases 18 3.7 Nitrogen and acid deposition 20 3.8 Modelling scenarios 20 4 MODELLING RESULTS 21 4.1 Impact of releases around the site boundary 21 4.2 Impact of releases at the nearest residential locations 21 4.3 Impact of process releases at sensitive nature conservation
sites 26
4.4 Impact of fugitive releases 28 4.5 Releases of greenhouse gases 28 5 CONCLUSIONS 31 6 REFERENCES 32 Annex A Dispersion model contour plots 33 Annex B Modelling files 41
Report No.150332 Page 4 of 41
Revision 10
Third Energy UK Gas Limited
Kirby Misperton
0 SUMMARY
A dispersion modelling assessment using the ADMS 5 model was employed to predict the impact on local air quality of discharges of important pollutants from well operations at the Kirby Misperton A (KMA) wellsite. All operating phases associated with the well workover, fracturing, subsequent clean up and demobilisation prior to production were considered with emphasis on releases from temporary operations equipment, largely stationary diesel engines, and fugitive emissions from the natural gas transmission system. The greenhouse gas inventory for the operation was also assessed. Process contributions from engine releases to ground level concentrations of nitrogen dioxide and PM10 are expected to exceed short term air quality standards at the site boundary based on model predictions, although the extent of any exceedence is not clear due to the influence of temporary structures on the dispersion of low level engine exhaust releases. At the nearest locations of permanent human habitation process contributions to ground level concentrations of carbon monoxide, sulphur dioxide, volatile organic compounds and PM10 are not considered to be likely to have any significant impact on air quality. Process contributions of nitrogen dioxide are more significant, although it is concluded that these are unlikely to pose a substantial threat to the continued attainment of air quality standards. At the closest statutory designated nature conservation sites process contributions to ground level concentrations of sulphur dioxide and nitrogen dioxide are mostly below the level of significance and do not pose any substantial risk to attainment of the critical levels. Nutrient nitrogen and acid deposition associated with the process contributions at these locations are not considered to be significant in relation to corresponding critical loads. Natural gas produced from the KMA wellsite is transported via pipeline to the nearby Knapton Generating Station. Fugitive releases of natural gas are expected from the on site gas transmission system. Based on leakage rates assessed by Third Energy the impact on local air quality of fugitive natural gas releases was assessed. The maximum process contribution to ground level concentrations of methane, ethane , propane and higher hydrocarbons (expressed as benzene) was predicted to be equivalent to no more than 8% of the estimated long term environmental benchmark at the site boundary falling to below 1% of these levels at the nearest residential locations. The long term process contribution to ground level concentrations of these compounds during both pre production and production phases of well operations is not considered to be significant based on Environment Agency assessment criteria. The modelling assessment methodology and necessary assumptions provide a very conservative assessment of impact on air quality, particularly for nitrogen dioxide. The overall results and conclusions reached therefore incorporate a reasonable margin of comfort in spite of the inevitable uncertainty of such modelling studies. It is concluded that the well operations will not affect the attainment of air quality standards around the areas of permanent human habitation closest to the wellsite and will have negligible impact at local statutory designated conservation sites. Exceedences in short term air quality standards for some pollutants are likely on occasions around the site boundary. No exceedence in air quality standards is indicated for the locations of temporary habitation in the Caravan Park and nearby Flamingo Land Theme Park. Release of greenhouse gases during well operations are estimated to be around 1680 t CO2 equivalent, based on the expected duration of the defined operational phases. Due to the inherent uncertainty of this type of project the duration of some phases may exceed initial expectations and as such an estimate of 2602 tCO2 equivalent is provided as a maximum for the overall project.
Report No.150332 Page 5 of 41
Revision 10
Third Energy UK Gas Limited
Kirby Misperton
1 INTRODUCTION
Third Energy UK Gas Limited (Third Energy) placed a contract with Environmental Scientifics Group Limited (ESG) to undertake an assessment of the impact on local air quality of discharges of important pollutants from proposed operations at the Kirby Misperton A (KMA) wellsite, North Yorkshire.
1.1 Scope of study The purpose of this study is to assess the impact of releases from the proposed operations at the KMA wellsite on local air quality in the context of applicable air quality standards and accepted environmental benchmarks. It is necessary, as part of the application for a permit to operate, to demonstrate that the proposed development will not have a significant adverse impact on the ambient concentrations of important pollutants. The main issues to be addressed within this assessment are:
The impact on local air quality of releases of pollutants, both point source and fugitive, on local air quality
The estimated release of greenhouse gases during the period of operation
1.2 General approach The approach taken in this assessment comprised the following main stages:
Determine a suitable modelling tool for the assessment.
Collate available process design data for input to the model.
Determine pertinent point source release conditions over various phases of wellsite operation
Determine pertinent fugitive releases over the various phases of wellsite operation
Establish the influence of any proposed site buildings or structures on the dispersion of releases
Obtain information on local background concentrations of important pollutants.
Obtain 5 years’ recent meteorological data from a measurement station appropriate to the location.
Model the dispersion of releases of important pollutants from the wellsite operations to determine the process contribution to ambient concentrations over the local area with particular attention to locations of human exposure and statutory designated areas.
Assess the predicted process contributions and established background concentrations with reference to applicable air quality standards and environmental benchmarks to determine compliance.
Comment on the predicted impact of discharges of important pollutants on local air quality
Establish an inventory of greenhouse gas releases for the wellsite operations Further details of the approach taken and model input information are provided in the following sections.
1.3 Structure of the report This report provides an assessment of the impact of discharges from the proposed operations at the KMA wellsite on air quality in the vicinity and on releases of greenhouse gases. The approach to the assessment has been described above. The following sections provide a detailed commentary on the assessment and conclusions: Section 2 Air quality standards and assessment criteria Section 3 The model methodology employed and important input data Section 4 The results of the assessment Section 5 Conclusions of the assessment
Report No.150332 Page 6 of 41
Revision 10
Third Energy UK Gas Limited
Kirby Misperton
2 POLICY CONTEXT AND ASSESSMENT CRITERIA
The Kirby Misperton A wellsite is located 750m south west of Kirby Misperton village and around 1 km south east of the village of Little Barugh in the Ryedale District of North Yorkshire (see Figure 3.1). Kirby Misperton A is an existing wellsite and the Kirby Misperton 8 (KM8) well was most recently drilled by Third Energy in 2013 as part of an appraisal of gas reserves followed by subsequent production. This appraisal concluded that there is a resource of sandstone and shale in the deep Bowland section. The current operations proposed by Third Energy are for the hydraulic fracturing of five zones within the well and, if successful, flowing of the natural gas produced, by pipeline, to the Knapton Generating Station. This is intended to enable the appraisal of the potential of the reserve.
2.1 Context of assessment This operation will be under the control of both the minerals planning authority and the Environment Agency and will require planning permission and an environmental permit to operate. As part of the planning and permitting applications it is necessary to demonstrate the likely impact of operations on local ambient concentrations of important pollutants. It is in this context that the proposed operations are being examined to determine their additional contribution to the existing concentrations of important pollutants and therefore determine compliance with applicable air quality limit values and environmental benchmarks. Local Authorities are required to assess compliance with applicable air quality objectives. Where the objectives are unlikely to be met the Local Authority is required to declare an Air Quality Management Area (AQMA) and prepare proposals for remedial action to achieve the required objective. There are no declared AQMAs in the vicinity of the wellsite, in addition, there is no knowledge of any other intended developments locally that will significantly impact on existing air quality.
2.2 Pollutants from well operations The operations at Kirby Misperton do not involve any on site flaring of natural gas as the gas produced will be piped to the local Knapton Generating Station. There will however be releases of pollutants from two main sources:
Releases from the mobile plant used for the wellsite operations during the initial preparation, fracturing and well testing operations and subsequent site restoration.
Fugitive releases of natural gas from the initial fracturing process and during the subsequent production phase.
Substantial mobile plant is required for the intended operations. These will be predominately powered using stationary diesel engines. The main pollutants from the combustion of diesel fuel, are oxides of nitrogen (NOx), carbon monoxide (CO) and volatile organic compounds (VOCs). Oxides of nitrogen are generally considered to comprise of nitrogen monoxide (NO) and nitrogen dioxide (NO2). Emissions from combustion primarily consist of nitrogen monoxide, although reaction in the atmosphere results in conversion to nitrogen dioxide, which is the primary nitrogen oxide of interest with respect to ambient pollution. Carbon monoxide and volatile organic compounds are generally formed from incomplete combustion of fuel and their presence will therefore be related to efficiency of combustion. It is assumed that the diesel fuel used will meet current regulations and as such will have a sulphur content of 0.1% by mass or less. A worst case is assumed in this assessment with consideration of discharges of sulphur dioxide (SO2) consistent with the maximum allowable fuel sulphur content. Diesel combustion may also give rise to the release of fine particulate matter. In this assessment PM10
(particulate matter with an aerodynamic diameter below 10 µm) releases from the combustion of diesel have been considered. Air quality standards for England consider limit values for nitrogen dioxide, carbon monoxide, sulphur dioxide and PM10. The standards specified are in the form of concentrations and are determined to be
Report No.150332 Page 7 of 41
Revision 10
Third Energy UK Gas Limited
Kirby Misperton
levels below which effects are unlikely even in sensitive population groups or below which the risk to public health would be very small. There are no applicable standards for the general group of volatile organic compounds, although guidance
1 recommends comparison with the air quality standards for
benzene as a means of determining significance.
2.3 Air Quality Standards The UK’s air quality strategy is based on meeting obligations within the European Union (EU) Ambient Air Quality Directive (2008/50/EC, 21 May 2008)
2 and the Fourth Daughter Directive (relating to metals and
hydrocarbons). Table 2.1 summarises the applicable limit values for the pollutants considered in this assessment as at 2015. It may be seen that standards are generally provided on the basis of short term and long term means. The limit values are considered to apply where members of the public are likely to be regularly exposed over the monitoring period. For the longer averaging periods the standards are considered to apply around the frontage of premises such as residential properties, schools and hospitals. The shorter term limit value (1 hour or 1 day means) applies at these locations and other areas where exposure is likely to be of one hour or more on a regular basis. In some cases air quality standards (AQS) discuss standards (concentrations recorded over a specified time period which are considered to be acceptable in terms of current knowledge of the impact on health and the environment), objectives (target date by which the standard is expected to be met) and limit values (a legally binding time averaged limit which must not be exceeded). In the case of pollutants considered above the values specified are limit values which the UK is obliged to meet. In addition, the Environment Agency guidance (H1, Annex F
1) provides environmental assessment levels
(EALs) for the protection of human health which may also be employed to assess the significance of ambient pollutant concentrations. These are also summarised in Table 2.1. Where an AQS or EAL is not available, workplace exposure limits have been employed, together with the methodology in H1, Annex F
1, to provide a benchmark for this assessment.
Table 2.1 UK Air Quality Standards and Environmental Assessment Levels
Pollutant Basis Concentration
Air quality standards
Carbon monoxide (CO) running 8 hour mean 10 mg/m3
Nitrogen dioxide (NO2) 1 hour mean (99.79 percentile – 18 exceedences per year) 200 µg/m3
annual mean 40 µg/m3
Sulphur dioxide (SO2)
15 minute mean (99.9 percentile – 35 exceedences per year) 266 µg/m3
1 hour mean (99.72 percentile – 24 exceedences per year) 350 µg/m3
24 hour mean – 99.18 percentile – 3 exceedences per year) 125 µg/m3
PM10 24 hour mean (90.41 percentile- 35 exceedences per year) 50 µg/m
3
annual mean 40 µg/m3
Benzene annual mean 5 µg/m3
Environmental assessment levels
Carbon monoxide (CO) Short term 30000 µg/m3
Environmental assessment levels determined from workplace exposure limits
Methane Long term 7140 µg/m3
Ethane Long term 13420 µg/m3
Propane Long term 19680 µg/m3
Long term and short term EALs are assumed to apply to annual and hourly values respectively. Values determined from workplace exposure limits use the methodology specified in H1, Annex F
1 and the
workplace exposure values provided in the HSE’s EH40/20053 and OSHA’s PEL
4.
In addition to the standards associated with human health above, critical levels are specified
1 for sulphur
dioxide and nitrogen dioxide in relation to the protection of vegetation and ecosystems as shown in Table 2.2.
Report No.150332 Page 8 of 41
Revision 10
Third Energy UK Gas Limited
Kirby Misperton
Table 2.2 Critical levels for the protection of vegetation and ecosystems
Pollutant Basis Concentration
Nitrogen dioxide (NO2) annual mean 30 µg/m
3
daily mean 75 µg/m3
Sulphur dioxide (SO2) annual mean1 10 µg/m
3
1. refers to the lower limit for sensitive lichen communities & bryophytes and ecosystems where lichens & bryophytes are an important part of the ecosystem’s integrity.
2.4 Background air quality in Kirby Misperton In considering the overall impact of an operation, such as this herein, on local air quality and compliance with limit values, it is necessary not only to consider the contribution from the source of interest, but also the existing levels of pollutants of interest. Background air quality data for the Kirby Misperton area are available from DEFRA’s air quality archive (http://uk-air.defra.gov.uk/data/pcm-data). The archive provides estimated background concentrations of important pollutants for 1km
2 areas for the UK. The
latest background levels of pollutants of interest for the area considered (477500 478500) were used for this assessment. Table 2.3 summarises the estimated background concentration for NO2, CO, PM10, SO2 and benzene as obtained from the air quality archive and which have been employed in this study. The DEFRA archive does not extend to the monitoring of total volatile organic compounds.
Table 2.3 Background concentrations for Kirby Misperton
Pollutant Basis Concentration (µg/m3)
Nitrogen dioxide (2012) annual mean 6.1
Carbon monoxide (2010) maximum 8 hour running mean 1431
Benzene (2012) annual mean 0.24
Sulphur dioxide (2012) annual mean 2.3
PM10 (2012) annual mean 13.6
As part of the environmental assessment of the KM8 operation air quality monitoring around the vicinity of the site has been undertaken to establish baseline conditions. This is reported elsewhere within the accompanying supporting documentation for the associated Environmental Impact Assessment. Subsequent air quality monitoring will be undertaken during the operations. The results of the complete baseline monitoring exercise are presented in Table 2.4.
Table 2.4 Baseline air quality measurements for the KMA wellsite
Parameter Concentration
Methane 0.0008%
Carbon dioxide 0.0389%
Volatile organic compounds 9.89 µg/m3
Benzene 6.92 µg/m3
Toluene 30.07 µg/m3
Ethylbenzene 6.52 µg/m3
m & p xylene 11.63 µg/m3
o xylene 6.12 µg/m3
Nitrogen dioxide 22.19 µg/m3
Nitrogen monoxide 6.48 µg/m3
Nitrogen oxides 14.29 µg/m3
Sulphur hexafluoride <0.15 µg/m3
Hydrogen sulphide 1.12 µg/m3
Particulate matter 52 mg/m2 day
a. methane and carbon dioxide reported measurements are the mean of 3 grab samples respectively together with all other reported measurements which are individual measurements from continuous sampling over the 25 February to 10 April 2015.
Report No.150332 Page 9 of 41
Revision 10
Third Energy UK Gas Limited
Kirby Misperton
The concentration of methane of 0.0008% is consistent with the monitoring point located offsite, suggesting that the area in general is higher than the UK general background. However it should also be noted that maintenance on the existing production plant within the KM1 wellsite was being undertaken during periods of monitoring which could attribute to slightly elevated methane levels. A total of three (3) sampling rounds were undertaken to establish a baseline figure for ambient air quality. These were taken every two (2) weeks between the 25 February 2015 and 10 April 2015. Once collected, the samples were analysed by ESG within a couple of days. Four monitoring locations were selected in order to give a wide coverage of the main site. A ‘clean’ sample point was chosen and a monitoring stand positioned outside the South West corner of the KMA wellsite, 20m south along the access track. The position was chosen to give a baseline for all of the required parameters. Three (3) further monitoring locations identified around KMA wellsite. The first location, in the North East corner of the wellsite, was chosen, taking into account prevailing wind direct, site elevation and future positioning of equipment. The second location, in the North West corner of the wellsite, was chosen following the considerations as the first. The third monitoring location, in the South East corner of the wellsite, was chosen to provide a full perimeter monitoring suite and the prevailing wind direction. The ‘clean sample’ placed outside the South West corner of the wellsite would give the make of any particles coming onto the wellsite. This would then be deducted from other samples to give a true sample of particulates generated from the works being carried out within the wellsite. For clarity, any parameters that will be monitored by grab sampling techniques will be done so at the four (4) monitoring locations to ensure consistency amongst all of the monitoring rounds. It is important to state that the locations proposed are the same locations that have been used to establish the baseline condition. An additional grab sample will also be taken by the ESG engineers for methane whilst attending site. The additional monitoring location shall be variable and will be determined on the day by the wind speed and direction. A minimum distance from the methane emission sources will be 5m on a still/calm day, with a maximum of 20 meters on a windy day. The location will also be dependent on any ATEX zones that are established at the KMA wellsite. Although proposed monitoring plan would only provide for one (1) clear downwind sampling location (with the addition of the variable methane sampling), Third Energy have been advised by ESG that the proposed locations are sufficient. When considering the combination of estimated process contributions and background concentrations it should be noted that background concentrations are generally available as annual mean values and as such simple addition when considering short term air quality standards may not be appropriate. Guidance from the Environment Agency
5 suggests a simplified method for combining
estimated process contributions and background concentrations. For comparison with long term standards the overall concentration is the sum of the process contribution (annual mean) and background concentration (annual mean). For comparison with short term standards the Environment Agency suggest the sum of the process contribution (hourly or daily mean) and twice the background concentration (annual mean). This methodology has been employed in this assessment. The Environment Agency’s guidance note H1
1 provides a methodology for assessing the impact and
determining the acceptability of emissions to atmosphere on ambient air quality. The contribution of the process (PC) to the ambient concentration of a given pollutant is considered insignificant if:
the long term PC is less than 1% of the long term environmental standard
the short term PC is less than 10% of the short term environmental standard
If the long term PC is greater than 1% of the environmental standard then the corresponding predicted environmental concentration (PEC, PC + background concentration) should be assessed. The ambient concentration of the pollutant is unlikely to have a significant effect if:
The long term PEC is less than 70% of the relevant long-term environmental standard
Report No.150332 Page 10 of 41
Revision 10
Third Energy UK Gas Limited
Kirby Misperton
3 MODELLING METHODOLOGY
The contributions to ambient concentrations of selected pollutants from the proposed operations at the KMA wellsite have been modelled using the Atmospheric Dispersion Modelling System (ADMS) version 5. The use of this modelling tool is widely accepted by the Environment Agency and UK Local Authorities. ADMS 5 requires a range of information in order to perform the modelling. The primary information used to perform the modelling is discussed below.
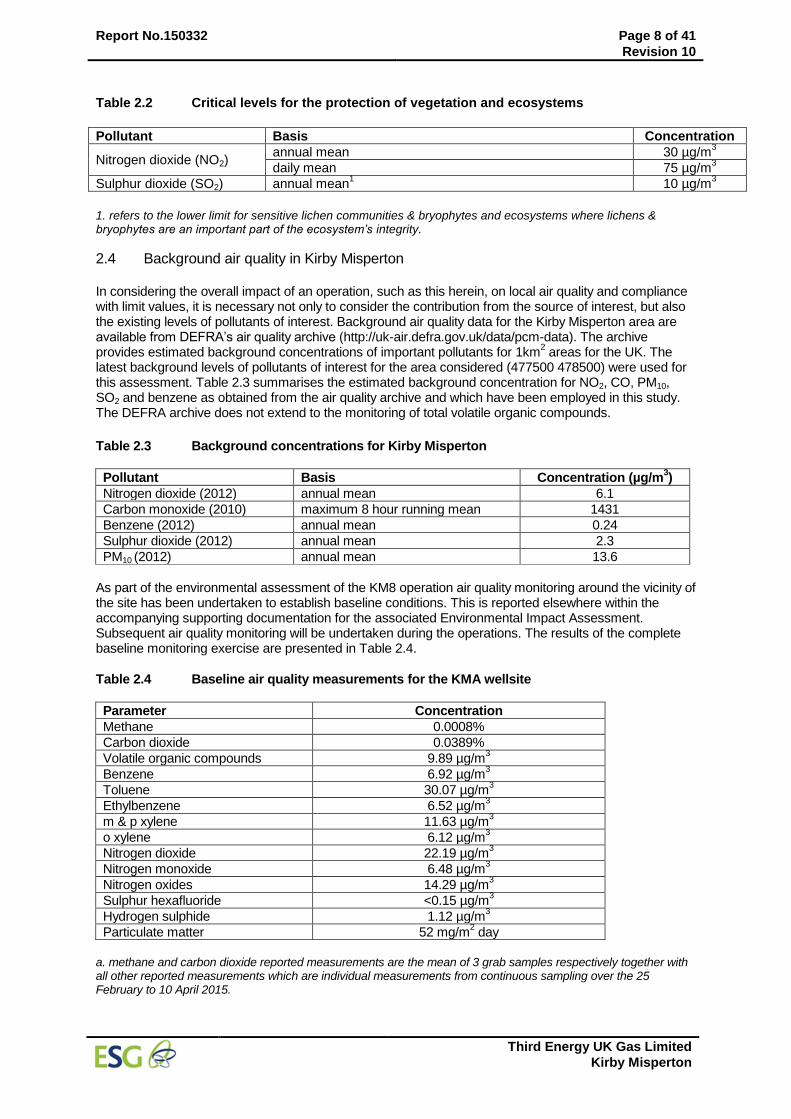
3.1 Assessment area The area over which the assessment was undertaken is a 2000m x 2000m area with the wellsite (477113 478936) located approximately at the centre (see Figure 3.1).
Figure 3.1 Assessment area for modelling
A general grid with receptors spaced at 40 m intervals (i.e. 2601 points for a 51 x 51 grid) was used to assess the process contribution to ground level concentrations over the area. The grid was considered at ground level (i.e. 0m). Some special receptors, as identified in Figure 3.1, were considered at the locations of human habitation closest to the wellsite including transient populations at the Caravan site and Flamingo Land Park. In addition a number of receptors located at the edge of the statutory designated sites in the vicinity of the wellsite have also been included. The coordinates of the special receptors located at the nearest residential locations and statutory designated sites are summarised in Tables 3.1 and 3.2 respectively. All special receptors are considered at an elevation of 1.5 m above ground level.
©Crown copyright and database rights 2015 Ordnance Survey Licence Number 100056116
Report No.150332 Page 11 of 41
Revision 10
Third Energy UK Gas Limited
Kirby Misperton
Table 3.1 Locations of residential receptors
Location (see Figure 3.1) Easting Northing
1 Alma Farm 476847 479139
2 Kirby-O-Carr 477115 478619
3 Tuiffit Manor 476728 478287
4 High Grange Farm 477802 478865
5 Glebe Farm 477371 479489
6 Caravan Park 477530 479274
7 Manor Farm 476196 479640
8 North west Farm 477830 478140
Table 3.2 Locations of statutory designated sites
Site Designation
a Position
b Easting Northing
Howardian Hills AONB 6.0 km S 476862 473113
Newbridge Quarry SSSI 7.2 km NE 479904 485282
River Derwent SSSI, SAC 6.4 km SE 482433 475800
Green Lane Pit SSSI 6.2 km NW 473227 483663
Cropton Bank SSSI 8.9 km NW 474491 487179
The Ings SSSI 4.0 km SW 475834 475286
Haugh & Gundale Slacks SSSI 9.5 km NE 479746 487712
Golden Hill Pit SSSI 5.9 km NW 472555 482596
Ellerburn Bank SSSI 10 km NE 485001 484690
a. SSSI (Site of special scientific interest), AONB (Area of outstanding natural beauty), SAC (Special area of conservation). b. Position is the edge of the site closest to the wellsite.
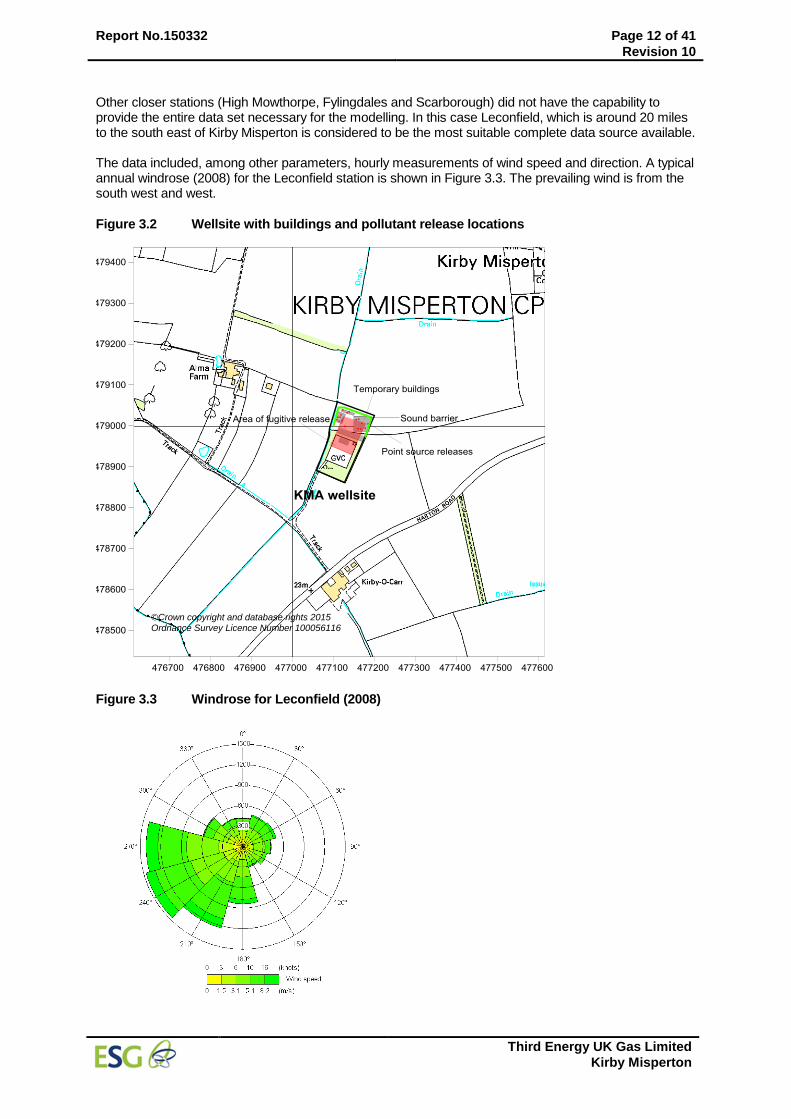
3.2 Buildings The presence of buildings close to a release point can have a significant impact on the dispersion of releases. The most significant impact can be the downwash of a plume around a building causing increased concentrations in the immediate area around the building. Buildings can also disturb the wind flow causing turbulent wake downwind which can also affect dispersion. It is normally considered that buildings within 5 times the height of release should be considered in any modelling. The temporary structures and buildings intended for the site are generally at a relatively low level of around 3-4 m, however the exhausts from the engines are generally of similar height and as such it is considered necessary to include some consideration of temporary structures within the modelling. A sound barrier consisting of ISO containers to a height of 8.7 m will be located close to the site boundary on the north, east and west side. ADMS 5 models buildings as either rectangular or circular structure. As shown in Figure 3.2 the structures which are considered to be significant in relation to dispersion from the various engine exhausts are estimated as rectangular blocks based on the site plan provided by Third Energy
6.This is a
necessary approximation given the number of individual blocks and their varying height. Subsequent sensitivity analyses undertaken indicated that the main impact of on-site buildings is on the dispersion and subsequent ground level concentrations around the site boundary. Consideration of buildings has insignificant impact on the predicted ground level pollutant concentrations beyond around 200 m of the site and no impact at the nearest locations of human habitation as summarised in Table 3.1.
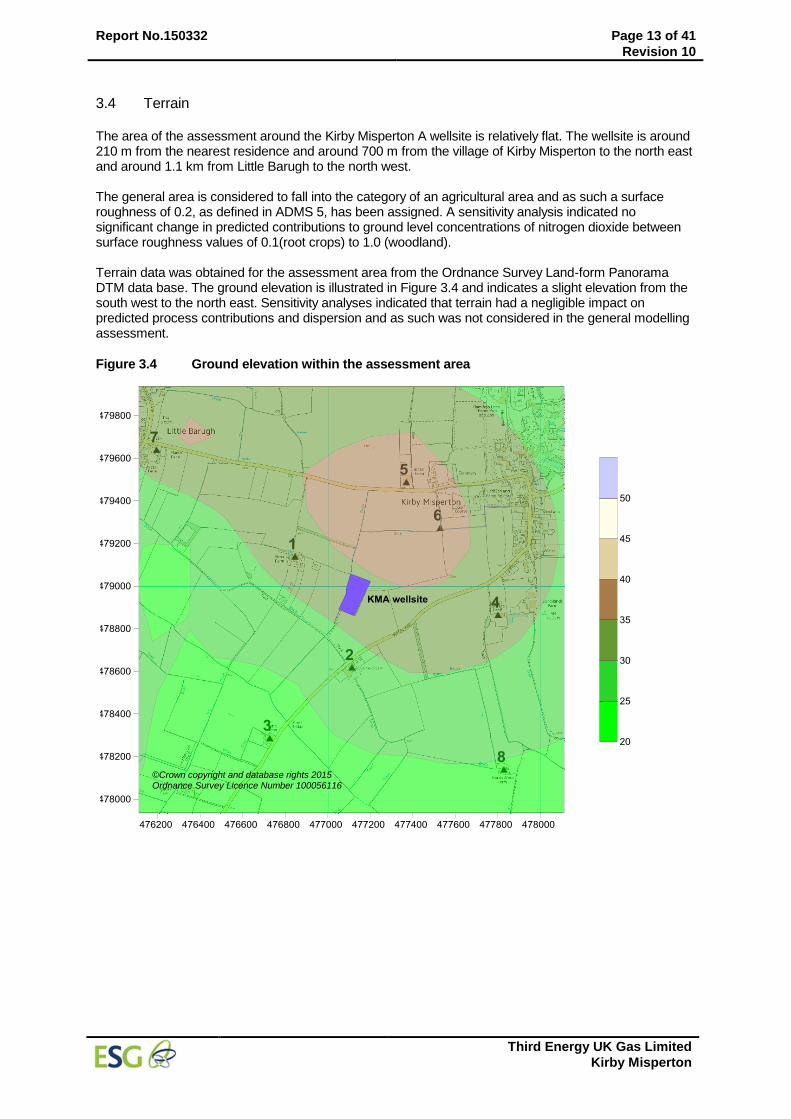
3.3 Meteorology For this modelling assessment hourly sequential meteorological data from the nearest suitable meteorological station to the Kirby Misperton site was obtained. The data, provided by the UK Met Office, was from the Leconfield station and covered the 5-year period 2008 to 2012.
Report No.150332 Page 12 of 41
Revision 10
Third Energy UK Gas Limited
Kirby Misperton
Other closer stations (High Mowthorpe, Fylingdales and Scarborough) did not have the capability to provide the entire data set necessary for the modelling. In this case Leconfield, which is around 20 miles to the south east of Kirby Misperton is considered to be the most suitable complete data source available. The data included, among other parameters, hourly measurements of wind speed and direction. A typical annual windrose (2008) for the Leconfield station is shown in Figure 3.3. The prevailing wind is from the south west and west.
Figure 3.2 Wellsite with buildings and pollutant release locations
Figure 3.3 Windrose for Leconfield (2008)
©Crown copyright and database rights 2015 Ordnance Survey Licence Number 100056116
Report No.150332 Page 13 of 41
Revision 10
Third Energy UK Gas Limited
Kirby Misperton
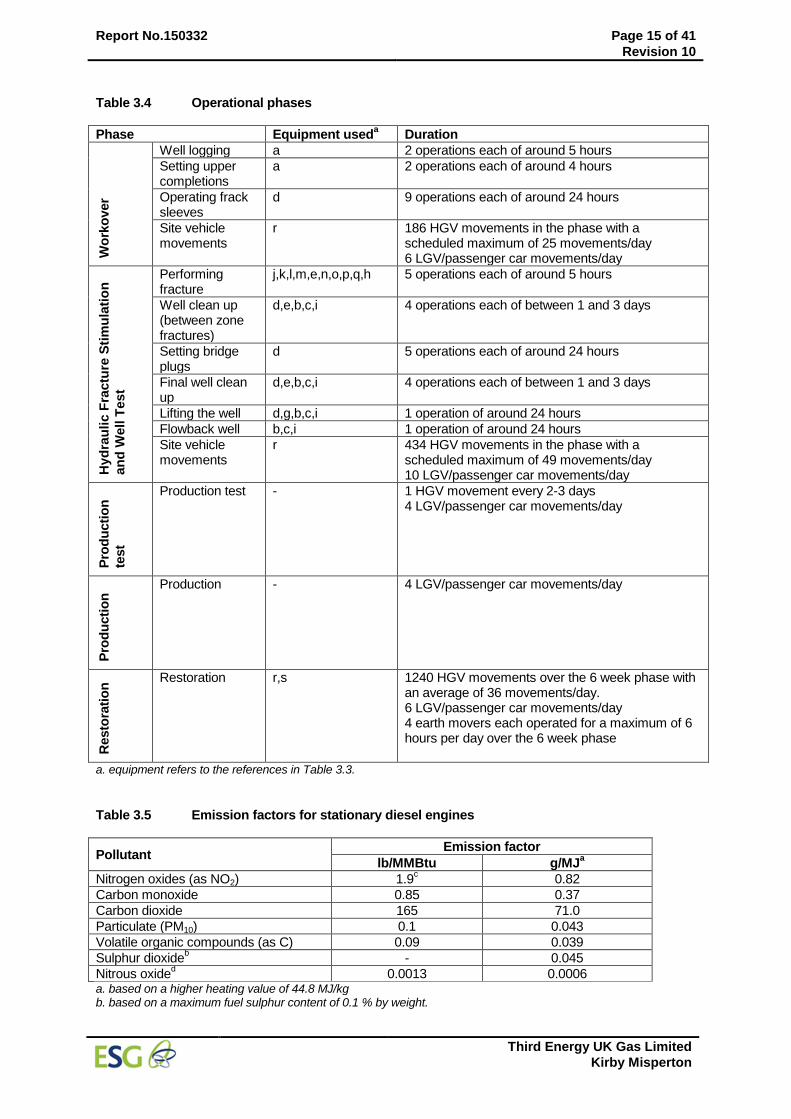
3.4 Terrain The area of the assessment around the Kirby Misperton A wellsite is relatively flat. The wellsite is around 210 m from the nearest residence and around 700 m from the village of Kirby Misperton to the north east and around 1.1 km from Little Barugh to the north west. The general area is considered to fall into the category of an agricultural area and as such a surface roughness of 0.2, as defined in ADMS 5, has been assigned. A sensitivity analysis indicated no significant change in predicted contributions to ground level concentrations of nitrogen dioxide between surface roughness values of 0.1(root crops) to 1.0 (woodland). Terrain data was obtained for the assessment area from the Ordnance Survey Land-form Panorama DTM data base. The ground elevation is illustrated in Figure 3.4 and indicates a slight elevation from the south west to the north east. Sensitivity analyses indicated that terrain had a negligible impact on predicted process contributions and dispersion and as such was not considered in the general modelling assessment.
Figure 3.4 Ground elevation within the assessment area
©Crown copyright and database rights 2015 Ordnance Survey Licence Number 100056116

Report No.150332 Page 14 of 41
Revision 10
Third Energy UK Gas Limited
Kirby Misperton
3.5 Pollutant releases from point sources
The significant point source pollutant releases from the site during the proposed operation result from the use of diesel fuel in various engines. Third Energy
7 have provided details of the engines used during
each phase of the operations and their maximum fuel consumption. Table 3.3 summarises the operational details of all equipment which have significant exhaust pollutant release. Based on site information provided by Third Energy
6, the individual point source have been located as
shown in Figure 3.2 (red dots).
Table 3.3 Operating details of major equipment and other sources of pollutant release
Ref. Unit
Fuel
consumption
l/ha
Exhaust
diameter
m
Exhaust
height
m
Exhaust
velocityb
m/s
a ICH truck (MB Actros 2641l) 71.2 0.12 3.8 30.8
b Zone II 1600cfm (150psig) diesel driven air compressor
85 0.2 2.35 13.2
c Zone II 6.0mBTU/hr (150psig) steam generator
150 0.4 2.96 7.4
d Power Pack Zone 2 HES 60/80/85/100K
106 0.3 3.21 43.6
e Batchmixer & HT-400 pump - (Annulus pump)
131 2 off 0.2 4.05 10.4
f Water Pump Unit - SK 36 PE Pump Trailer
95 0.12 3.8 44.1
g Nitrogen unit (John Deere engine)
105 0.20 2.51 16.3
h CleanStream unit, with diesel generator
57.5 0.20 3.0 9.0
i MiniWave water treatment unit 61.1 2.0 9.5
j, k, l HQ-2000 Grizzly pumps (3 off) 187 0.3 4.09 14.8
m HQ-2000 Grizzly Stand by 155 0.3 4.09 12.3
n 50 bpm Blender 100.25 2 off 0.2 3.0 7.8
o Dry gel Blender 39.25 0.2 4.0 8.2
p Generator (2 off) 20.25 0.1 1.5 6.3
q Centrifugal pumps (2 off) 25.5 0.1 1.2 7.9
r Articulated flatbed HGVc 3.5 0.12 3.8 1.5
s Earth mover 25 0.12 3.8 10.8
t Fugitive emissions from gas transfer system leaks
- - - -
a. fuel consumption is based on average operation at 88% full load. b. based on an assumed exhaust gas temperature of 100
oC and an exhaust gas volume of 15.8 Nm
3/kg fuel.
c. estimated fuel consumption at engine idle12
.
Third Energy have identified several distinct phases of the operation where different groups of equipment will be employed. Table 3.4 summarises the main phases of the operation at the KMA wellsite. There is some uncertainty as to the duration of some of the above phases as the work to be undertaken will depend largely on the results of the fracture, however it is anticipated that the main phases will be of the following durations: Workover 2 weeks Hydraulic fracture stimulation and well test 6 weeks Production test 90 days Production 9 years Restoration 6 weeks (Monday to Saturday)
Report No.150332 Page 15 of 41
Revision 10
Third Energy UK Gas Limited
Kirby Misperton
Table 3.4 Operational phases
Phase Equipment useda Duration
Wo
rko
ver
Well logging a 2 operations each of around 5 hours
Setting upper completions
a 2 operations each of around 4 hours
Operating frack sleeves
d 9 operations each of around 24 hours
Site vehicle movements
r 186 HGV movements in the phase with a scheduled maximum of 25 movements/day 6 LGV/passenger car movements/day
Hyd
rau
lic F
ractu
re S
tim
ula
tio
n
an
d W
ell T
es
t
Performing fracture
j,k,l,m,e,n,o,p,q,h 5 operations each of around 5 hours
Well clean up (between zone fractures)
d,e,b,c,i 4 operations each of between 1 and 3 days
Setting bridge plugs
d 5 operations each of around 24 hours
Final well clean up
d,e,b,c,i 4 operations each of between 1 and 3 days
Lifting the well d,g,b,c,i 1 operation of around 24 hours
Flowback well b,c,i 1 operation of around 24 hours
Site vehicle movements
r 434 HGV movements in the phase with a scheduled maximum of 49 movements/day 10 LGV/passenger car movements/day
Pro
du
cti
on
test
Production test - 1 HGV movement every 2-3 days 4 LGV/passenger car movements/day
Pro
du
cti
on
Production - 4 LGV/passenger car movements/day
Resto
rati
on
Restoration r,s 1240 HGV movements over the 6 week phase with an average of 36 movements/day. 6 LGV/passenger car movements/day 4 earth movers each operated for a maximum of 6 hours per day over the 6 week phase
a. equipment refers to the references in Table 3.3.
Table 3.5 Emission factors for stationary diesel engines
Pollutant Emission factor
lb/MMBtu g/MJa
Nitrogen oxides (as NO2) 1.9c 0.82
Carbon monoxide 0.85 0.37
Carbon dioxide 165 71.0
Particulate (PM10) 0.1 0.043
Volatile organic compounds (as C) 0.09 0.039
Sulphur dioxideb - 0.045
Nitrous oxided 0.0013 0.0006
a. based on a higher heating value of 44.8 MJ/kg b. based on a maximum fuel sulphur content of 0.1 % by weight.
Report No.150332 Page 16 of 41
Revision 10
Third Energy UK Gas Limited
Kirby Misperton
c. the lower end of the range provided is assumed as this is more consistent with vendor information7 than the
upper end of the range. d. emission factor derived from US EPA 2014 Emission factors for greenhouse gas inventories, April 2014.
The fuel used by the above equipment will be diesel. In order to determine the likely pollutant releases from the above operations emissions factors and the estimated fuel usage have been employed. The emission factors used for this application are based on the United States Environmental Protection Agency (US EPA) AP-42
8 compilation and refer to diesel combustion in stationary engines. These
factors are widely accepted and are seen as being reasonably representative in this case. Table 3.5 summarises the emission factors employed herein for releases from stationary diesel engines. For the vehicles involved in the operation the following emission factors in Table 3.6 are assumed.
Table 3.6 Emission factors for diesel vehicles
Pollutant Emission factor (g/h)
Articulated flatbeda Earth mover
Nitrogen oxides (as NO2) 57 669
Nitrous oxide 0.9 2.8
Carbon monoxide 95 219
Carbon dioxide 9100 64432
Particulate (PM10) 2.6 43
Volatile organic compounds (as C) 13 69
Sulphur dioxideb 5.7 41
a. assumes a diesel heavy duty vehicle operating at idle
13. For each vehicle movement it is assumed that the
incoming vehicle remains at the site operating at idle for a period of 1 hour before leaving. Releases during movement to and from the wellsite are not considered to have a significant impact on local air quality in comparison to on site vehicle releases. b.based on a construction land based mobile machine (1.A.2.fii)
14 and fuel consumption for a moderate load for a
Caterpillar D6N bulldozer. Each earth mover is assumed to operate for 6 hours per day and 6 days per week.
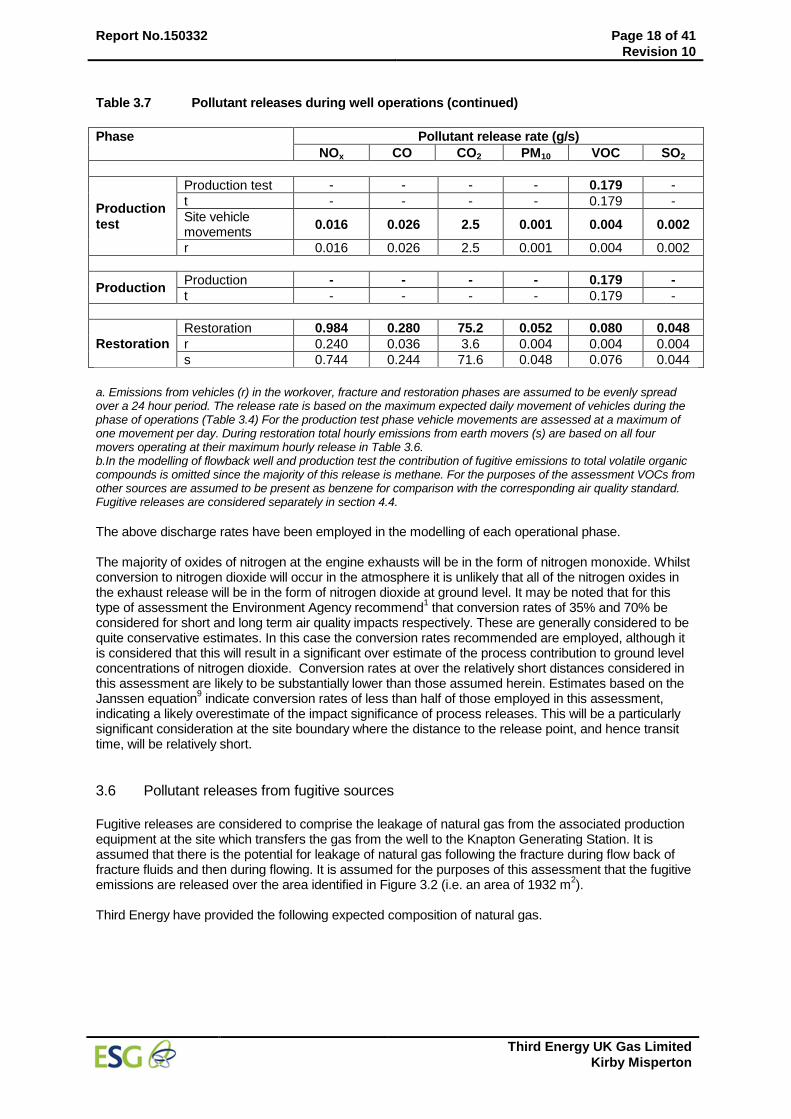
LGV and passenger car movements are primarily for the movement of staff to and from the site. It is therefore considered that pollutant releases from these vehicles within the site boundary will be negligible in relation to the releases from HGVs and stationary engines and are therefore not considered further in the assessment of local air quality Impact. The hourly pollutant release rates for each of the operational phases in Table 3.4 is summarised in Table 3.7 based on the emission factors in Table 3.5 and the corresponding fuel consumption in Table 3.3.
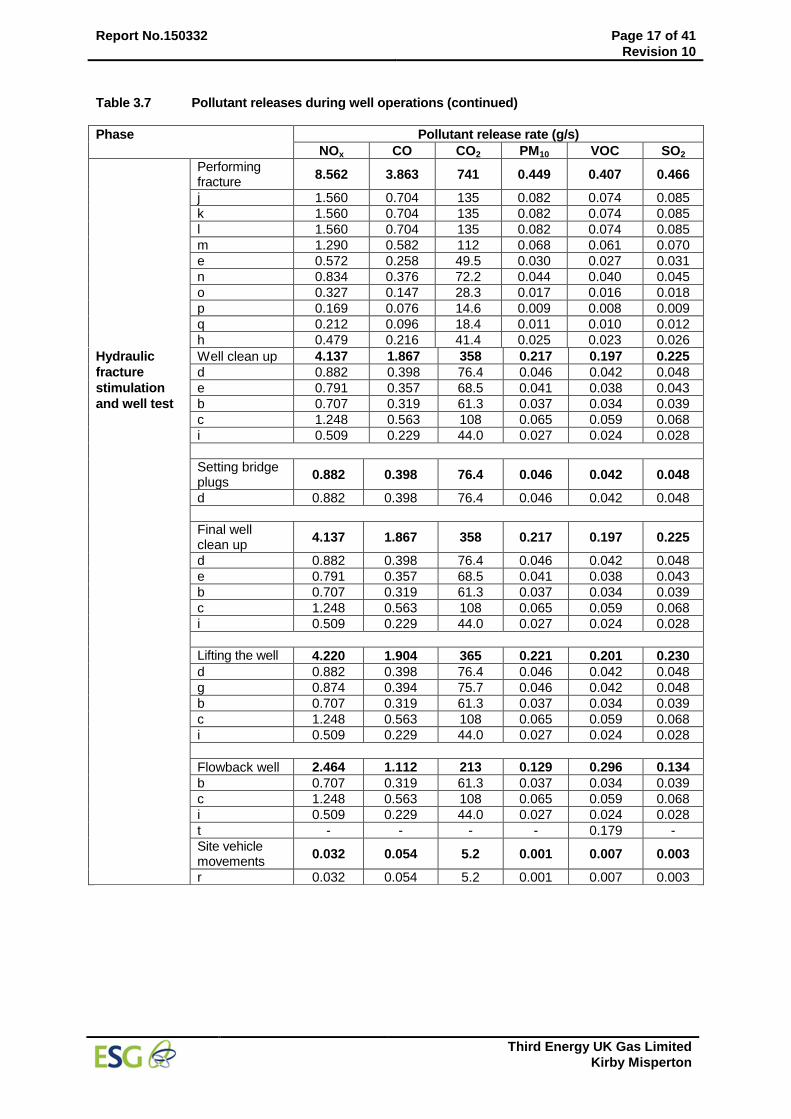
Table 3.7 Pollutant releases during well operations
Phase Pollutant release rate (g/s)
NOx CO CO2 PM10 VOC SO2
Workover
Well logging 0.593 0.267 51.3 0.031 0.028 0.032
a 0.593 0.267 51.3 0.031 0.028 0.032
Setting upper completions
0.593 0.267 51.3 0.031 0.028 0.032
a 0.593 0.267 51.3 0.031 0.028 0.032
Operating frack sleeves
0.882 0.398 76.4 0.046 0.042 0.048
d 0.882 0.398 76.4 0.046 0.042 0.048
Site vehicle movements
0.016 0.027 2.6 0.001 0.004 0.002
r 0.016 0.027 2.6 0.001 0.004 0.002
Report No.150332 Page 17 of 41
Revision 10
Third Energy UK Gas Limited
Kirby Misperton
Table 3.7 Pollutant releases during well operations (continued)
Phase Pollutant release rate (g/s)
NOx CO CO2 PM10 VOC SO2
Performing fracture
8.562 3.863 741 0.449 0.407 0.466
j 1.560 0.704 135 0.082 0.074 0.085
k 1.560 0.704 135 0.082 0.074 0.085
l 1.560 0.704 135 0.082 0.074 0.085
m 1.290 0.582 112 0.068 0.061 0.070
e 0.572 0.258 49.5 0.030 0.027 0.031
n 0.834 0.376 72.2 0.044 0.040 0.045
o 0.327 0.147 28.3 0.017 0.016 0.018
p 0.169 0.076 14.6 0.009 0.008 0.009
q 0.212 0.096 18.4 0.011 0.010 0.012
h 0.479 0.216 41.4 0.025 0.023 0.026
Hydraulic
fracture
stimulation
and well test
Well clean up 4.137 1.867 358 0.217 0.197 0.225
d 0.882 0.398 76.4 0.046 0.042 0.048
e 0.791 0.357 68.5 0.041 0.038 0.043
b 0.707 0.319 61.3 0.037 0.034 0.039
c 1.248 0.563 108 0.065 0.059 0.068
i 0.509 0.229 44.0 0.027 0.024 0.028
Setting bridge plugs
0.882 0.398 76.4 0.046 0.042 0.048
d 0.882 0.398 76.4 0.046 0.042 0.048
Final well clean up
4.137 1.867 358 0.217 0.197 0.225
d 0.882 0.398 76.4 0.046 0.042 0.048
e 0.791 0.357 68.5 0.041 0.038 0.043
b 0.707 0.319 61.3 0.037 0.034 0.039
c 1.248 0.563 108 0.065 0.059 0.068
i 0.509 0.229 44.0 0.027 0.024 0.028
Lifting the well 4.220 1.904 365 0.221 0.201 0.230
d 0.882 0.398 76.4 0.046 0.042 0.048
g 0.874 0.394 75.7 0.046 0.042 0.048
b 0.707 0.319 61.3 0.037 0.034 0.039
c 1.248 0.563 108 0.065 0.059 0.068
i 0.509 0.229 44.0 0.027 0.024 0.028
Flowback well 2.464 1.112 213 0.129 0.296 0.134
b 0.707 0.319 61.3 0.037 0.034 0.039
c 1.248 0.563 108 0.065 0.059 0.068
i 0.509 0.229 44.0 0.027 0.024 0.028
t - - - - 0.179 -
Site vehicle movements
0.032 0.054 5.2 0.001 0.007 0.003
r 0.032 0.054 5.2 0.001 0.007 0.003
Report No.150332 Page 18 of 41
Revision 10
Third Energy UK Gas Limited
Kirby Misperton
Table 3.7 Pollutant releases during well operations (continued)
Phase Pollutant release rate (g/s)
NOx CO CO2 PM10 VOC SO2
Production
test
Production test - - - - 0.179 -
t - - - - 0.179 -
Site vehicle movements
0.016 0.026 2.5 0.001 0.004 0.002
r 0.016 0.026 2.5 0.001 0.004 0.002
Production Production - - - - 0.179 -
t - - - - 0.179 -
Restoration
Restoration 0.984 0.280 75.2 0.052 0.080 0.048
r 0.240 0.036 3.6 0.004 0.004 0.004
s 0.744 0.244 71.6 0.048 0.076 0.044
a. Emissions from vehicles (r) in the workover, fracture and restoration phases are assumed to be evenly spread over a 24 hour period. The release rate is based on the maximum expected daily movement of vehicles during the phase of operations (Table 3.4) For the production test phase vehicle movements are assessed at a maximum of one movement per day. During restoration total hourly emissions from earth movers (s) are based on all four movers operating at their maximum hourly release in Table 3.6. b.In the modelling of flowback well and production test the contribution of fugitive emissions to total volatile organic compounds is omitted since the majority of this release is methane. For the purposes of the assessment VOCs from other sources are assumed to be present as benzene for comparison with the corresponding air quality standard. Fugitive releases are considered separately in section 4.4.
The above discharge rates have been employed in the modelling of each operational phase. The majority of oxides of nitrogen at the engine exhausts will be in the form of nitrogen monoxide. Whilst conversion to nitrogen dioxide will occur in the atmosphere it is unlikely that all of the nitrogen oxides in the exhaust release will be in the form of nitrogen dioxide at ground level. It may be noted that for this type of assessment the Environment Agency recommend
1 that conversion rates of 35% and 70% be
considered for short and long term air quality impacts respectively. These are generally considered to be quite conservative estimates. In this case the conversion rates recommended are employed, although it is considered that this will result in a significant over estimate of the process contribution to ground level concentrations of nitrogen dioxide. Conversion rates at over the relatively short distances considered in this assessment are likely to be substantially lower than those assumed herein. Estimates based on the Janssen equation
9 indicate conversion rates of less than half of those employed in this assessment,
indicating a likely overestimate of the impact significance of process releases. This will be a particularly significant consideration at the site boundary where the distance to the release point, and hence transit time, will be relatively short.
3.6 Pollutant releases from fugitive sources
Fugitive releases are considered to comprise the leakage of natural gas from the associated production equipment at the site which transfers the gas from the well to the Knapton Generating Station. It is assumed that there is the potential for leakage of natural gas following the fracture during flow back of fracture fluids and then during flowing. It is assumed for the purposes of this assessment that the fugitive emissions are released over the area identified in Figure 3.2 (i.e. an area of 1932 m
2).
Third Energy have provided the following expected composition of natural gas.
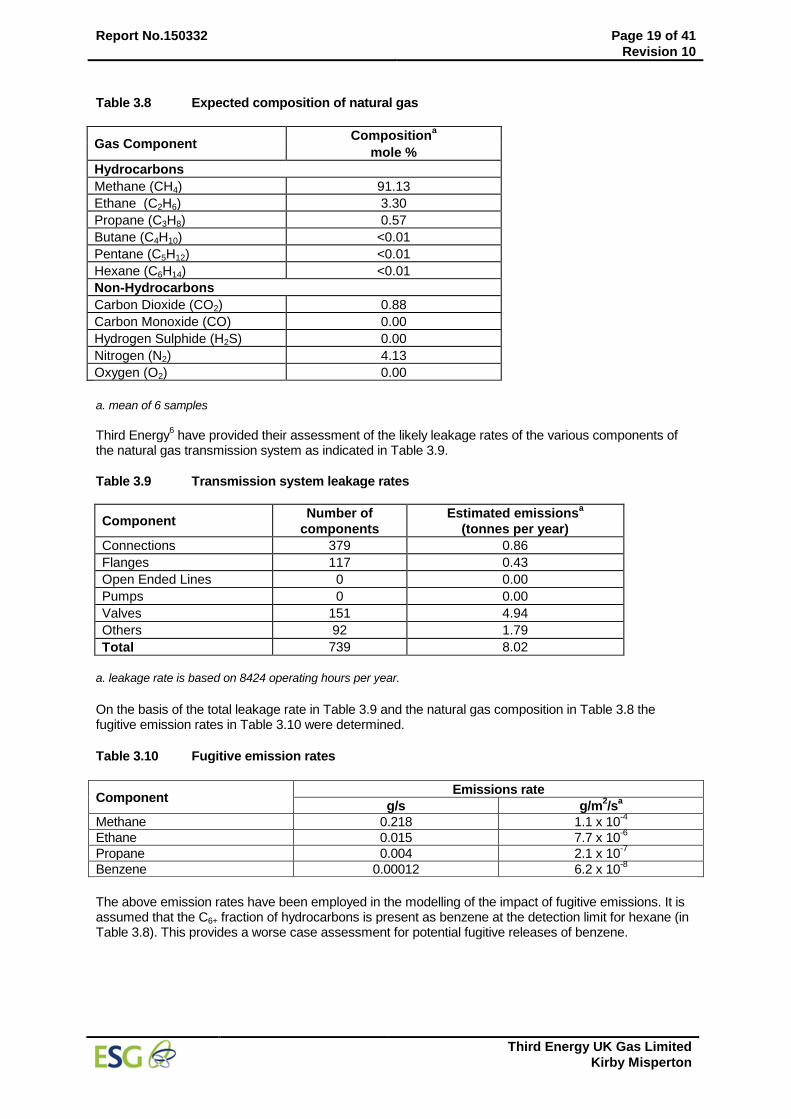
Report No.150332 Page 19 of 41
Revision 10
Third Energy UK Gas Limited
Kirby Misperton
Table 3.8 Expected composition of natural gas
Gas Component Composition
a
mole %
Hydrocarbons
Methane (CH4) 91.13
Ethane (C2H6) 3.30
Propane (C3H8) 0.57
Butane (C4H10) <0.01
Pentane (C5H12) <0.01
Hexane (C6H14) <0.01
Non-Hydrocarbons
Carbon Dioxide (CO2) 0.88
Carbon Monoxide (CO) 0.00
Hydrogen Sulphide (H2S) 0.00
Nitrogen (N2) 4.13
Oxygen (O2) 0.00
a. mean of 6 samples
Third Energy
6 have provided their assessment of the likely leakage rates of the various components of
the natural gas transmission system as indicated in Table 3.9.
Table 3.9 Transmission system leakage rates
Component Number of
components
Estimated emissionsa
(tonnes per year)
Connections 379 0.86
Flanges 117 0.43
Open Ended Lines 0 0.00
Pumps 0 0.00
Valves 151 4.94
Others 92 1.79
Total 739 8.02
a. leakage rate is based on 8424 operating hours per year.
On the basis of the total leakage rate in Table 3.9 and the natural gas composition in Table 3.8 the fugitive emission rates in Table 3.10 were determined.
Table 3.10 Fugitive emission rates
Component Emissions rate
g/s g/m2/s
a
Methane 0.218 1.1 x 10⁻⁴
Ethane 0.015 7.7 x 10⁻⁶
Propane 0.004 2.1 x 10⁻⁷
Benzene 0.00012 6.2 x 10⁻⁸
The above emission rates have been employed in the modelling of the impact of fugitive emissions. It is assumed that the C6+ fraction of hydrocarbons is present as benzene at the detection limit for hexane (in Table 3.8). This provides a worse case assessment for potential fugitive releases of benzene.
Report No.150332 Page 20 of 41
Revision 10
Third Energy UK Gas Limited
Kirby Misperton
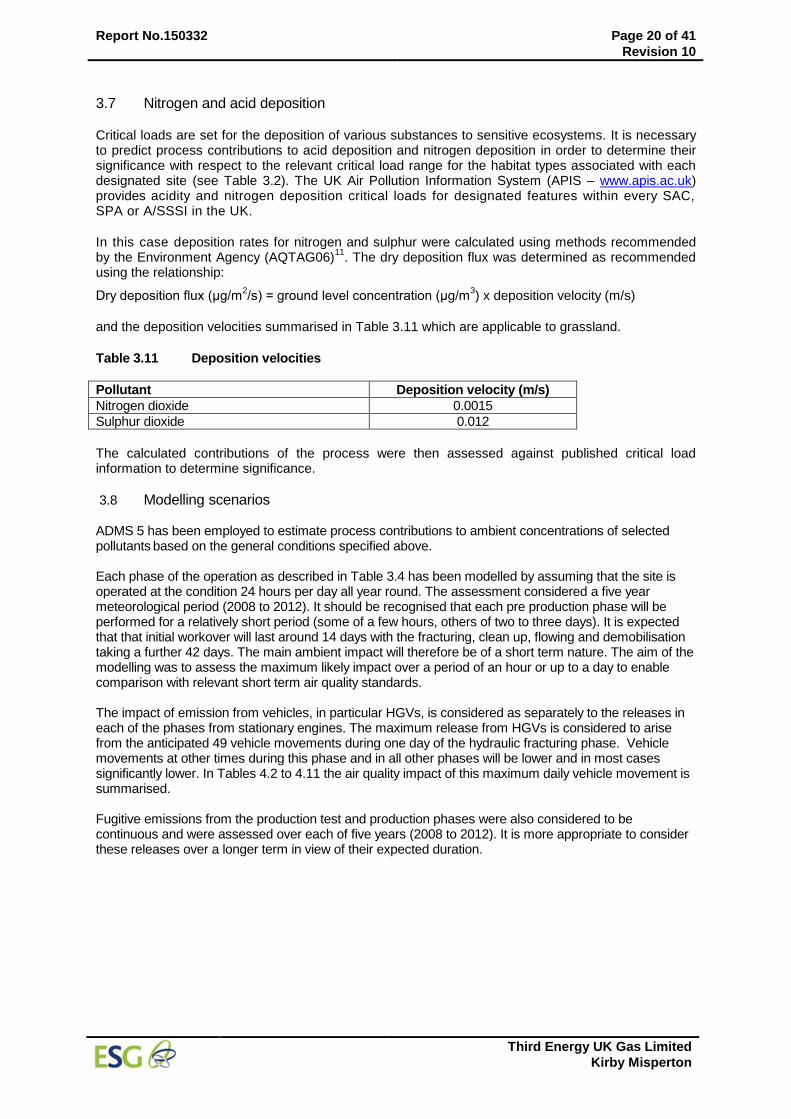
3.7 Nitrogen and acid deposition
Critical loads are set for the deposition of various substances to sensitive ecosystems. It is necessary to predict process contributions to acid deposition and nitrogen deposition in order to determine their significance with respect to the relevant critical load range for the habitat types associated with each designated site (see Table 3.2). The UK Air Pollution Information System (APIS – www.apis.ac.uk) provides acidity and nitrogen deposition critical loads for designated features within every SAC, SPA or A/SSSI in the UK.
In this case deposition rates for nitrogen and sulphur were calculated using methods recommended by the Environment Agency (AQTAG06)
11. The dry deposition flux was determined as recommended
using the relationship:
Dry deposition flux (μg/m2/s) = ground level concentration (μg/m
3) x deposition velocity (m/s)
and the deposition velocities summarised in Table 3.11 which are applicable to grassland.
Table 3.11 Deposition velocities
Pollutant Deposition velocity (m/s)
Nitrogen dioxide 0.0015
Sulphur dioxide 0.012
The calculated contributions of the process were then assessed against published critical load information to determine significance.
3.8 Modelling scenarios ADMS 5 has been employed to estimate process contributions to ambient concentrations of selected pollutants based on the general conditions specified above. Each phase of the operation as described in Table 3.4 has been modelled by assuming that the site is operated at the condition 24 hours per day all year round. The assessment considered a five year meteorological period (2008 to 2012). It should be recognised that each pre production phase will be performed for a relatively short period (some of a few hours, others of two to three days). It is expected that that initial workover will last around 14 days with the fracturing, clean up, flowing and demobilisation taking a further 42 days. The main ambient impact will therefore be of a short term nature. The aim of the modelling was to assess the maximum likely impact over a period of an hour or up to a day to enable comparison with relevant short term air quality standards. The impact of emission from vehicles, in particular HGVs, is considered as separately to the releases in each of the phases from stationary engines. The maximum release from HGVs is considered to arise from the anticipated 49 vehicle movements during one day of the hydraulic fracturing phase. Vehicle movements at other times during this phase and in all other phases will be lower and in most cases significantly lower. In Tables 4.2 to 4.11 the air quality impact of this maximum daily vehicle movement is summarised. Fugitive emissions from the production test and production phases were also considered to be continuous and were assessed over each of five years (2008 to 2012). It is more appropriate to consider these releases over a longer term in view of their expected duration.
Report No.150332 Page 21 of 41
Revision 10
Third Energy UK Gas Limited
Kirby Misperton
4 MODELLING RESULTS
ADMS 5 has been run for the operating scenarios described in Section 3.8. The results of the modelling are discussed below.
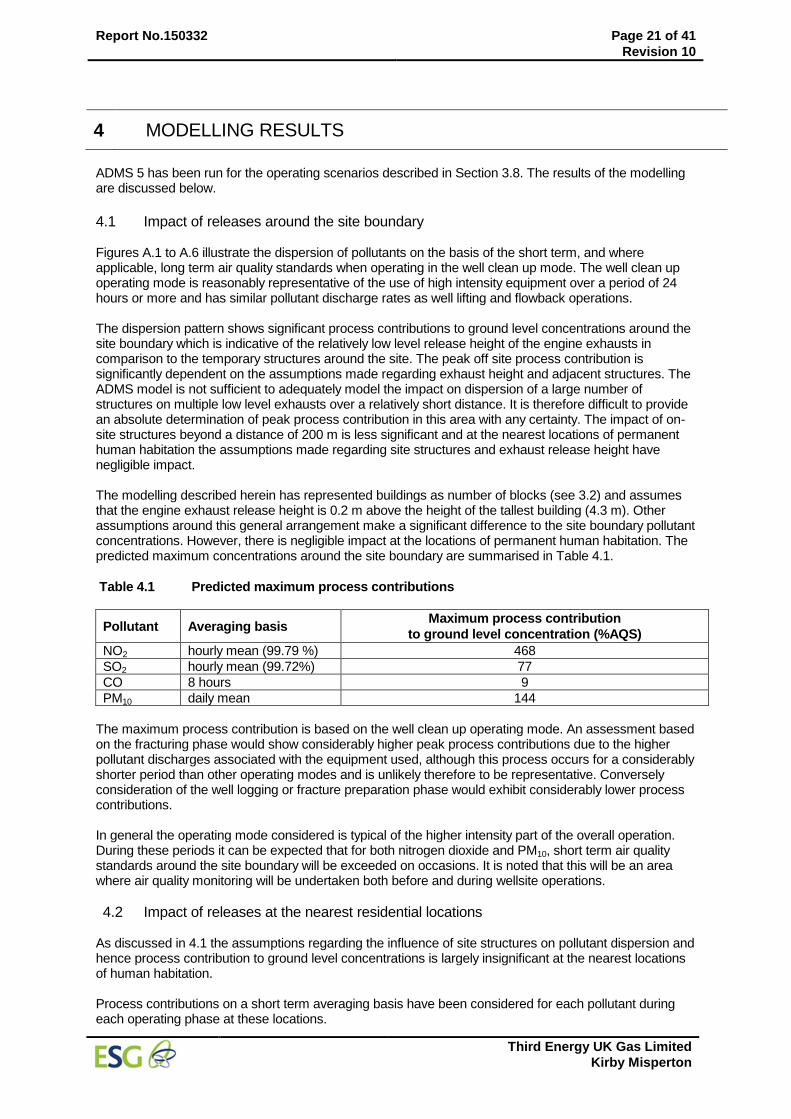
4.1 Impact of releases around the site boundary Figures A.1 to A.6 illustrate the dispersion of pollutants on the basis of the short term, and where applicable, long term air quality standards when operating in the well clean up mode. The well clean up operating mode is reasonably representative of the use of high intensity equipment over a period of 24 hours or more and has similar pollutant discharge rates as well lifting and flowback operations. The dispersion pattern shows significant process contributions to ground level concentrations around the site boundary which is indicative of the relatively low level release height of the engine exhausts in comparison to the temporary structures around the site. The peak off site process contribution is significantly dependent on the assumptions made regarding exhaust height and adjacent structures. The ADMS model is not sufficient to adequately model the impact on dispersion of a large number of structures on multiple low level exhausts over a relatively short distance. It is therefore difficult to provide an absolute determination of peak process contribution in this area with any certainty. The impact of on-site structures beyond a distance of 200 m is less significant and at the nearest locations of permanent human habitation the assumptions made regarding site structures and exhaust release height have negligible impact. The modelling described herein has represented buildings as number of blocks (see 3.2) and assumes that the engine exhaust release height is 0.2 m above the height of the tallest building (4.3 m). Other assumptions around this general arrangement make a significant difference to the site boundary pollutant concentrations. However, there is negligible impact at the locations of permanent human habitation. The predicted maximum concentrations around the site boundary are summarised in Table 4.1.
Table 4.1 Predicted maximum process contributions
Pollutant Averaging basis Maximum process contribution
to ground level concentration (%AQS)
NO2 hourly mean (99.79 %) 468
SO2 hourly mean (99.72%) 77
CO 8 hours 9
PM10 daily mean 144
The maximum process contribution is based on the well clean up operating mode. An assessment based on the fracturing phase would show considerably higher peak process contributions due to the higher pollutant discharges associated with the equipment used, although this process occurs for a considerably shorter period than other operating modes and is unlikely therefore to be representative. Conversely consideration of the well logging or fracture preparation phase would exhibit considerably lower process contributions. In general the operating mode considered is typical of the higher intensity part of the overall operation. During these periods it can be expected that for both nitrogen dioxide and PM10, short term air quality standards around the site boundary will be exceeded on occasions. It is noted that this will be an area where air quality monitoring will be undertaken both before and during wellsite operations.
4.2 Impact of releases at the nearest residential locations As discussed in 4.1 the assumptions regarding the influence of site structures on pollutant dispersion and hence process contribution to ground level concentrations is largely insignificant at the nearest locations of human habitation. Process contributions on a short term averaging basis have been considered for each pollutant during each operating phase at these locations.
Report No.150332 Page 22 of 41
Revision 10
Third Energy UK Gas Limited
Kirby Misperton
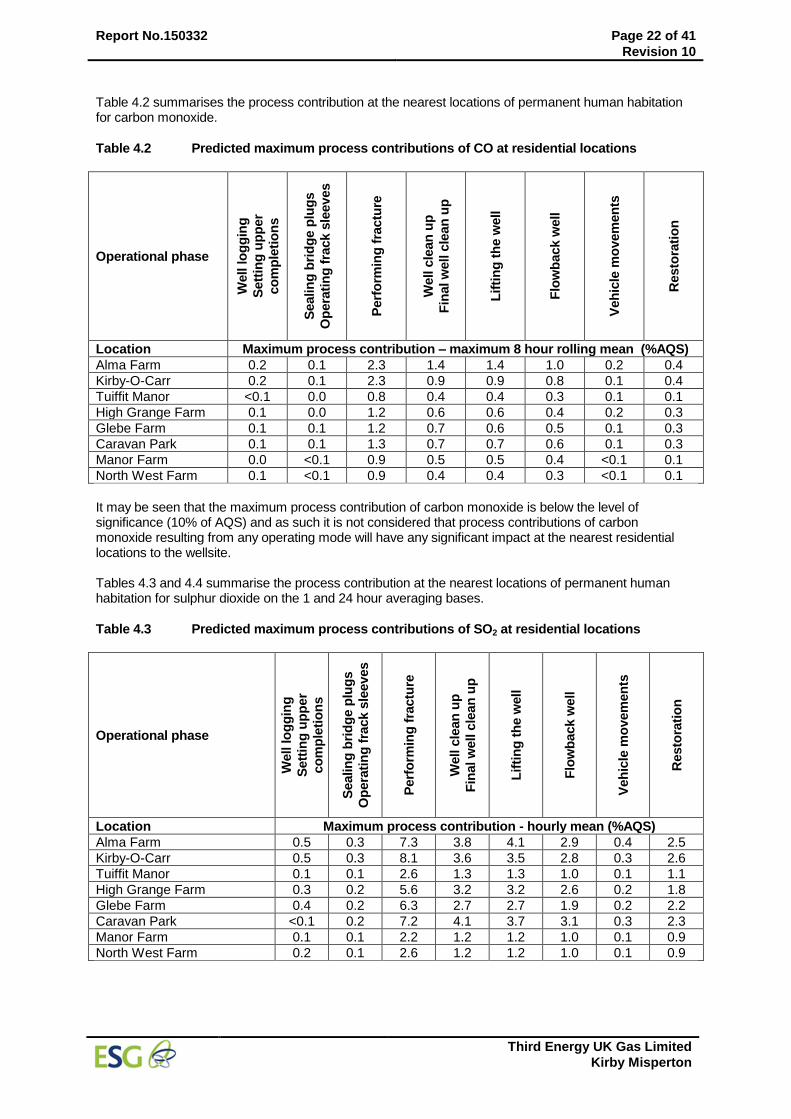
Table 4.2 summarises the process contribution at the nearest locations of permanent human habitation for carbon monoxide.
Table 4.2 Predicted maximum process contributions of CO at residential locations
Operational phase
Well lo
gg
ing
Sett
ing
up
per
co
mp
leti
on
s
Sealin
g b
rid
ge p
lug
s
Op
era
tin
g f
rack s
leeves
Perf
orm
ing
fra
ctu
re
Well c
lean
up
Fin
al w
ell c
lean
up
Lif
tin
g t
he w
ell
Flo
wb
ack w
ell
Veh
icle
mo
vem
en
ts
Resto
rati
on
Location Maximum process contribution – maximum 8 hour rolling mean (%AQS)
Alma Farm 0.2 0.1 2.3 1.4 1.4 1.0 0.2 0.4
Kirby-O-Carr 0.2 0.1 2.3 0.9 0.9 0.8 0.1 0.4
Tuiffit Manor <0.1 0.0 0.8 0.4 0.4 0.3 0.1 0.1
High Grange Farm 0.1 0.0 1.2 0.6 0.6 0.4 0.2 0.3
Glebe Farm 0.1 0.1 1.2 0.7 0.6 0.5 0.1 0.3
Caravan Park 0.1 0.1 1.3 0.7 0.7 0.6 0.1 0.3
Manor Farm 0.0 <0.1 0.9 0.5 0.5 0.4 <0.1 0.1
North West Farm 0.1 <0.1 0.9 0.4 0.4 0.3 <0.1 0.1
It may be seen that the maximum process contribution of carbon monoxide is below the level of significance (10% of AQS) and as such it is not considered that process contributions of carbon monoxide resulting from any operating mode will have any significant impact at the nearest residential locations to the wellsite. Tables 4.3 and 4.4 summarise the process contribution at the nearest locations of permanent human habitation for sulphur dioxide on the 1 and 24 hour averaging bases.
Table 4.3 Predicted maximum process contributions of SO2 at residential locations
Operational phase
Well lo
gg
ing
Sett
ing
up
per
co
mp
leti
on
s
Sealin
g b
rid
ge p
lug
s
Op
era
tin
g f
rack s
leeves
Perf
orm
ing
fra
ctu
re
Well c
lean
up
Fin
al w
ell c
lean
up
Lif
tin
g t
he w
ell
Flo
wb
ack w
ell
Veh
icle
mo
vem
en
ts
Resto
rati
on
Location Maximum process contribution - hourly mean (%AQS)
Alma Farm 0.5 0.3 7.3 3.8 4.1 2.9 0.4 2.5
Kirby-O-Carr 0.5 0.3 8.1 3.6 3.5 2.8 0.3 2.6
Tuiffit Manor 0.1 0.1 2.6 1.3 1.3 1.0 0.1 1.1
High Grange Farm 0.3 0.2 5.6 3.2 3.2 2.6 0.2 1.8
Glebe Farm 0.4 0.2 6.3 2.7 2.7 1.9 0.2 2.2
Caravan Park <0.1 0.2 7.2 4.1 3.7 3.1 0.3 2.3
Manor Farm 0.1 0.1 2.2 1.2 1.2 1.0 0.1 0.9
North West Farm 0.2 0.1 2.6 1.2 1.2 1.0 0.1 0.9
Report No.150332 Page 23 of 41
Revision 10
Third Energy UK Gas Limited
Kirby Misperton
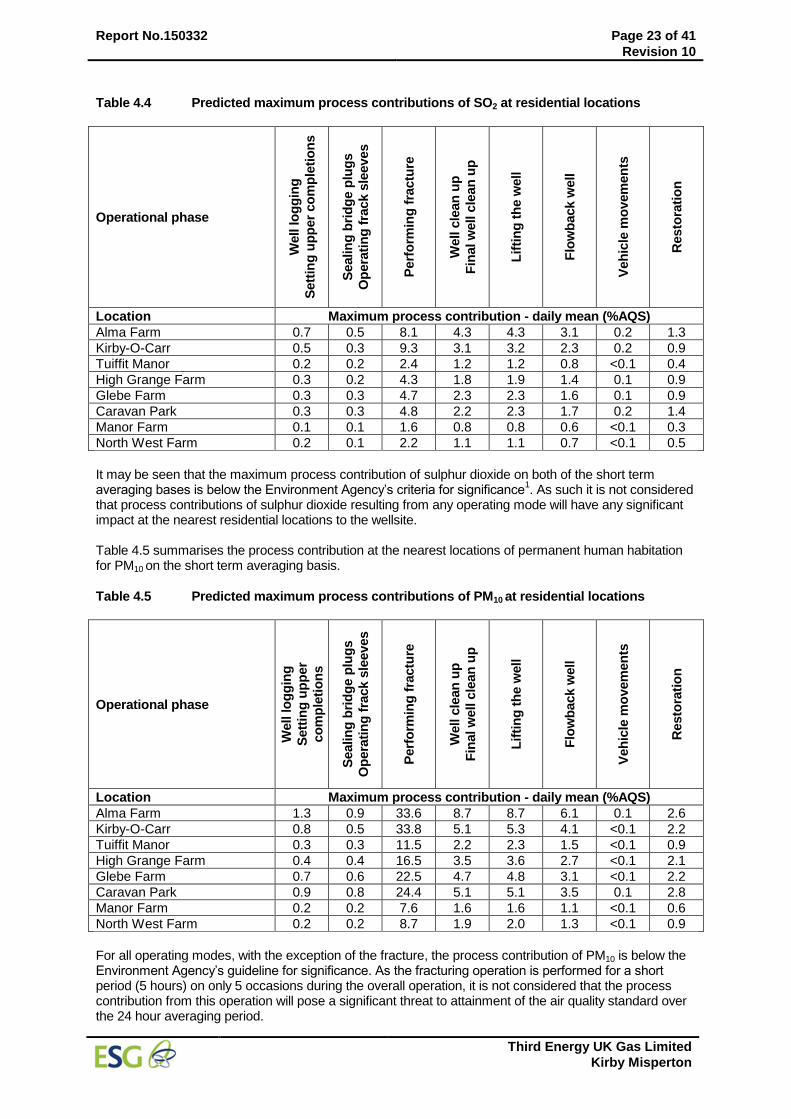
Table 4.4 Predicted maximum process contributions of SO2 at residential locations
Operational phase
Well lo
gg
ing
Sett
ing
up
per
co
mp
leti
on
s
Sealin
g b
rid
ge p
lug
s
Op
era
tin
g f
rack s
leeves
Perf
orm
ing
fra
ctu
re
Well c
lean
up
Fin
al w
ell c
lean
up
Lif
tin
g t
he w
ell
Flo
wb
ack w
ell
Veh
icle
mo
vem
en
ts
Resto
rati
on
Location Maximum process contribution - daily mean (%AQS)
Alma Farm 0.7 0.5 8.1 4.3 4.3 3.1 0.2 1.3
Kirby-O-Carr 0.5 0.3 9.3 3.1 3.2 2.3 0.2 0.9
Tuiffit Manor 0.2 0.2 2.4 1.2 1.2 0.8 <0.1 0.4
High Grange Farm 0.3 0.2 4.3 1.8 1.9 1.4 0.1 0.9
Glebe Farm 0.3 0.3 4.7 2.3 2.3 1.6 0.1 0.9
Caravan Park 0.3 0.3 4.8 2.2 2.3 1.7 0.2 1.4
Manor Farm 0.1 0.1 1.6 0.8 0.8 0.6 <0.1 0.3
North West Farm 0.2 0.1 2.2 1.1 1.1 0.7 <0.1 0.5
It may be seen that the maximum process contribution of sulphur dioxide on both of the short term averaging bases is below the Environment Agency’s criteria for significance
1. As such it is not considered
that process contributions of sulphur dioxide resulting from any operating mode will have any significant impact at the nearest residential locations to the wellsite. Table 4.5 summarises the process contribution at the nearest locations of permanent human habitation for PM10 on the short term averaging basis.
Table 4.5 Predicted maximum process contributions of PM10 at residential locations
Operational phase
Well lo
gg
ing
Sett
ing
up
per
co
mp
leti
on
s
Sealin
g b
rid
ge p
lug
s
Op
era
tin
g f
rack s
leeves
Perf
orm
ing
fra
ctu
re
Well c
lean
up
Fin
al w
ell c
lean
up
Lif
tin
g t
he w
ell
Flo
wb
ack w
ell
Veh
icle
mo
vem
en
ts
Resto
rati
on
Location Maximum process contribution - daily mean (%AQS)
Alma Farm 1.3 0.9 33.6 8.7 8.7 6.1 0.1 2.6
Kirby-O-Carr 0.8 0.5 33.8 5.1 5.3 4.1 <0.1 2.2
Tuiffit Manor 0.3 0.3 11.5 2.2 2.3 1.5 <0.1 0.9
High Grange Farm 0.4 0.4 16.5 3.5 3.6 2.7 <0.1 2.1
Glebe Farm 0.7 0.6 22.5 4.7 4.8 3.1 <0.1 2.2
Caravan Park 0.9 0.8 24.4 5.1 5.1 3.5 0.1 2.8
Manor Farm 0.2 0.2 7.6 1.6 1.6 1.1 <0.1 0.6
North West Farm 0.2 0.2 8.7 1.9 2.0 1.3 <0.1 0.9
For all operating modes, with the exception of the fracture, the process contribution of PM10 is below the Environment Agency’s guideline for significance. As the fracturing operation is performed for a short period (5 hours) on only 5 occasions during the overall operation, it is not considered that the process contribution from this operation will pose a significant threat to attainment of the air quality standard over the 24 hour averaging period.
Report No.150332 Page 24 of 41
Revision 10
Third Energy UK Gas Limited
Kirby Misperton
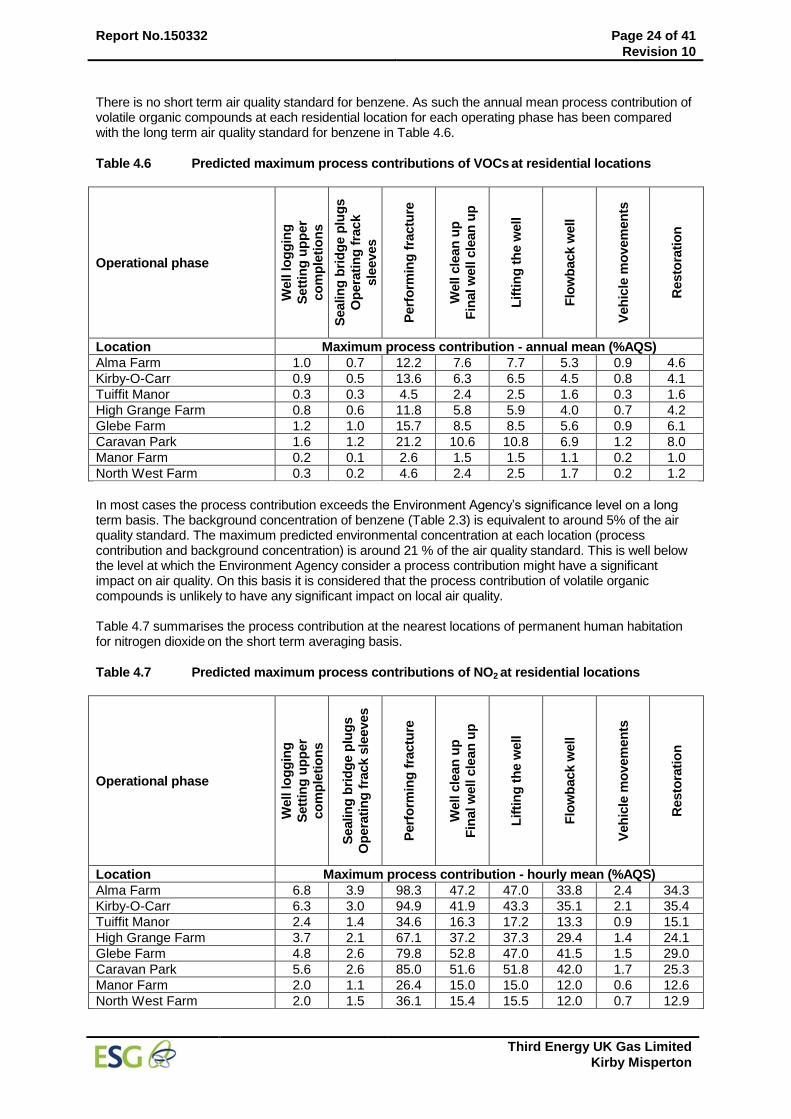
There is no short term air quality standard for benzene. As such the annual mean process contribution of volatile organic compounds at each residential location for each operating phase has been compared with the long term air quality standard for benzene in Table 4.6.
Table 4.6 Predicted maximum process contributions of VOCs at residential locations
Operational phase
Well lo
gg
ing
Sett
ing
up
per
co
mp
leti
on
s
Sealin
g b
rid
ge p
lug
s
Op
era
tin
g f
rack
sle
eves
Perf
orm
ing
fra
ctu
re
Well c
lean
up
Fin
al w
ell c
lean
up
Lif
tin
g t
he w
ell
Flo
wb
ack w
ell
Veh
icle
mo
vem
en
ts
Resto
rati
on
Location Maximum process contribution - annual mean (%AQS)
Alma Farm 1.0 0.7 12.2 7.6 7.7 5.3 0.9 4.6
Kirby-O-Carr 0.9 0.5 13.6 6.3 6.5 4.5 0.8 4.1
Tuiffit Manor 0.3 0.3 4.5 2.4 2.5 1.6 0.3 1.6
High Grange Farm 0.8 0.6 11.8 5.8 5.9 4.0 0.7 4.2
Glebe Farm 1.2 1.0 15.7 8.5 8.5 5.6 0.9 6.1
Caravan Park 1.6 1.2 21.2 10.6 10.8 6.9 1.2 8.0
Manor Farm 0.2 0.1 2.6 1.5 1.5 1.1 0.2 1.0
North West Farm 0.3 0.2 4.6 2.4 2.5 1.7 0.2 1.2
In most cases the process contribution exceeds the Environment Agency’s significance level on a long term basis. The background concentration of benzene (Table 2.3) is equivalent to around 5% of the air quality standard. The maximum predicted environmental concentration at each location (process contribution and background concentration) is around 21 % of the air quality standard. This is well below the level at which the Environment Agency consider a process contribution might have a significant impact on air quality. On this basis it is considered that the process contribution of volatile organic compounds is unlikely to have any significant impact on local air quality. Table 4.7 summarises the process contribution at the nearest locations of permanent human habitation for nitrogen dioxide on the short term averaging basis.
Table 4.7 Predicted maximum process contributions of NO2 at residential locations
Operational phase
Well lo
gg
ing
Sett
ing
up
per
co
mp
leti
on
s
Sealin
g b
rid
ge p
lug
s
Op
era
tin
g f
rack s
leeves
Perf
orm
ing
fra
ctu
re
Well c
lean
up
Fin
al w
ell c
lean
up
Lif
tin
g t
he w
ell
Flo
wb
ack w
ell
Veh
icle
mo
vem
en
ts
Resto
rati
on
Location Maximum process contribution - hourly mean (%AQS)
Alma Farm 6.8 3.9 98.3 47.2 47.0 33.8 2.4 34.3
Kirby-O-Carr 6.3 3.0 94.9 41.9 43.3 35.1 2.1 35.4
Tuiffit Manor 2.4 1.4 34.6 16.3 17.2 13.3 0.9 15.1
High Grange Farm 3.7 2.1 67.1 37.2 37.3 29.4 1.4 24.1
Glebe Farm 4.8 2.6 79.8 52.8 47.0 41.5 1.5 29.0
Caravan Park 5.6 2.6 85.0 51.6 51.8 42.0 1.7 25.3
Manor Farm 2.0 1.1 26.4 15.0 15.0 12.0 0.6 12.6
North West Farm 2.0 1.5 36.1 15.4 15.5 12.0 0.7 12.9

Report No.150332 Page 25 of 41
Revision 10
Third Energy UK Gas Limited
Kirby Misperton
It may be seen for the main high intensity operational phases the process contributions of nitrogen dioxide at all residential locations exceed the Environment Agency’s guideline level of significance. The background concentration of nitrogen dioxide on a short term basis is equivalent to around 6% of the air quality standard. The predicted process contributions at the two locations closest to the wellsite therefore indicate an exceedence of the air quality standard during fracturing operations. However, these operations are of a short term duration (5 hours with a maximum total duration of 25 hours) whereas the assessment considers the maximum process contribution for full time operation over a period of one year for each of five years’ meteorological conditions. On this basis it is considered unlikely that all periods of fracturing will coincide with the meteorological conditions necessary to result in the maximum process contributions in Table 4.7. Compliance with this air quality standard is more likely to be influenced by operation at the other high intensity operating modes which are of a longer duration and which all show predicted environmental concentrations below the air quality standard. It is considered that for most pollutants during most operating phases the process contributions to ground level pollutant concentrations at the nearest residential locations are unlikely to have a significant air quality impact. The air quality impact of HGV movements, even at the maximum anticipated daily activity, is almost entirely below the level of significance at the nearest locations of frequent human habitation. The assessment indicates that nitrogen dioxide is the predominant pollutant in relation to air quality, although it is not considered that this will lead to a failure in the short term air quality standard in practice. A long term assessment of the predicted environmental concentration of nitrogen dioxide, shown in Table 4.8, assuming full time running at each operational mode, indicates concentrations well below the air quality standard and at levels which the Environment Agency assessment criteria suggest will not significantly impact on air quality.
Table 4.8 Predicted maximum process contributions of NO2 at residential locations
Operational phase
Well lo
gg
ing
Sett
ing
up
per
co
mp
leti
on
s
Sealin
g b
rid
ge p
lug
s
Op
era
tin
g f
rack
sle
eves
Perf
orm
ing
fra
ctu
re
Well c
lean
up
Fin
al w
ell c
lean
up
Lif
tin
g t
he w
ell
Flo
wb
ack w
ell
Veh
icle
mo
vem
en
ts
Resto
rati
on
Location Maximum predicted environmental concentrations - annual mean
(%AQS)
Alma Farm 17.1 16.5 41.2 29.2 29.4 25.0 15.6 20.4
Kirby-O-Carr 16.9 16.2 43.4 26.8 27.2 23.5 15.6 19.9
Tuiffit Manor 15.9 15.8 24.8 19.7 19.9 18.3 15.4 17.0
High Grange Farm 16.7 16.4 40.0 25.9 26.2 22.7 15.5 19.9
Glebe Farm 17.5 17.1 47.9 30.8 30.8 25.6 15.6 22.1
Caravan Park 18.2 17.4 59.2 34.9 35.1 28.8 15.7 22.6
Manor Farm 15.6 15.5 20.8 18.0 18.1 17.2 15.3 16.4
North West Farm 15.8 15.7 24.9 19.7 19.8 18.4 15.3 16.6
It should also be considered that the assumptions made for the purposes of the modelling tend to give a pessimistic view of maximum pollutant concentrations, in particular for nitrogen dioxide (see 3.5). The Caravan site is around 420 m from the site boundary at its closest to the north west in the general direction of the prevailing wind. No exceedence in air quality standards for any of the pollutants considered is indicated within this assessment. The Flamingo Land Park is a further 500 m to the north east. The impact of pollutant releases from the wellsite at this location is significantly less than at the Caravan Park as indicated in Figures A.1 to A.7.
Report No.150332 Page 26 of 41
Revision 10
Third Energy UK Gas Limited
Kirby Misperton
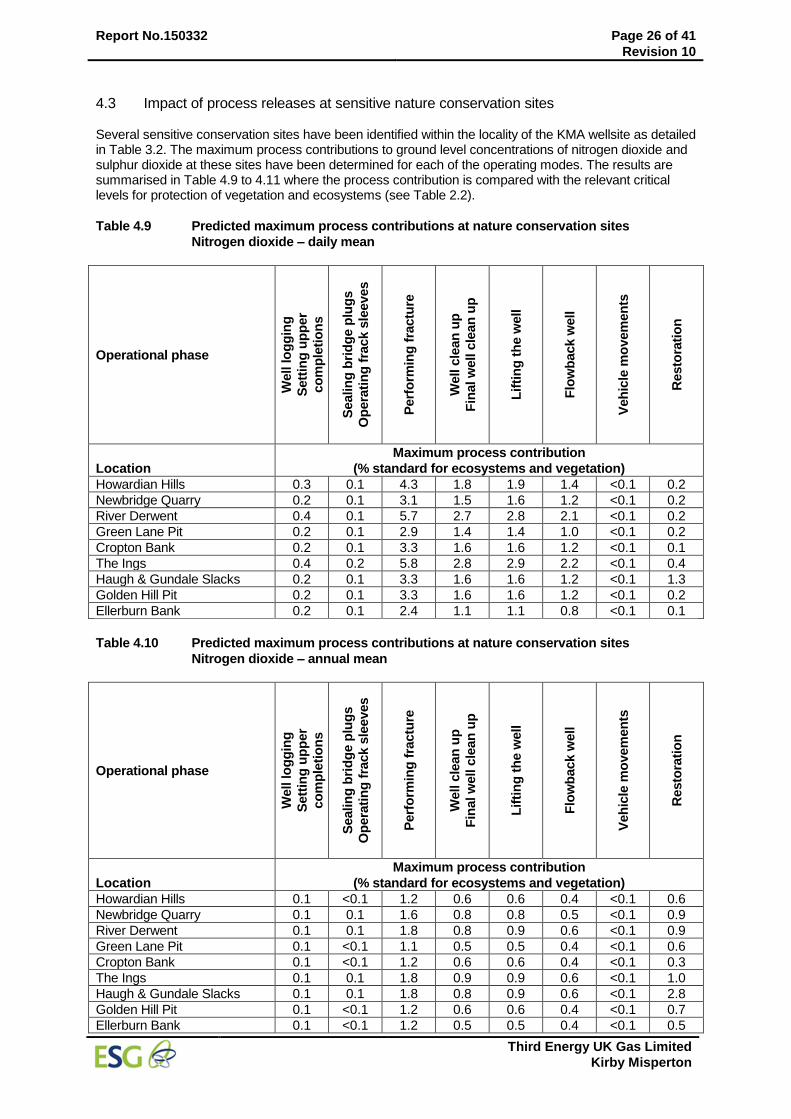
4.3 Impact of process releases at sensitive nature conservation sites Several sensitive conservation sites have been identified within the locality of the KMA wellsite as detailed in Table 3.2. The maximum process contributions to ground level concentrations of nitrogen dioxide and sulphur dioxide at these sites have been determined for each of the operating modes. The results are summarised in Table 4.9 to 4.11 where the process contribution is compared with the relevant critical levels for protection of vegetation and ecosystems (see Table 2.2).
Table 4.9 Predicted maximum process contributions at nature conservation sites
Nitrogen dioxide – daily mean
Operational phase
Well lo
gg
ing
Sett
ing
up
per
co
mp
leti
on
s
Sealin
g b
rid
ge p
lug
s
Op
era
tin
g f
rack s
leeves
Perf
orm
ing
fra
ctu
re
Well c
lean
up
Fin
al w
ell c
lean
up
Lif
tin
g t
he w
ell
Flo
wb
ack w
ell
Veh
icle
mo
vem
en
ts
Resto
rati
on
Location
Maximum process contribution
(% standard for ecosystems and vegetation)
Howardian Hills 0.3 0.1 4.3 1.8 1.9 1.4 <0.1 0.2
Newbridge Quarry 0.2 0.1 3.1 1.5 1.6 1.2 <0.1 0.2
River Derwent 0.4 0.1 5.7 2.7 2.8 2.1 <0.1 0.2
Green Lane Pit 0.2 0.1 2.9 1.4 1.4 1.0 <0.1 0.2
Cropton Bank 0.2 0.1 3.3 1.6 1.6 1.2 <0.1 0.1
The Ings 0.4 0.2 5.8 2.8 2.9 2.2 <0.1 0.4
Haugh & Gundale Slacks 0.2 0.1 3.3 1.6 1.6 1.2 <0.1 1.3
Golden Hill Pit 0.2 0.1 3.3 1.6 1.6 1.2 <0.1 0.2
Ellerburn Bank 0.2 0.1 2.4 1.1 1.1 0.8 <0.1 0.1
Table 4.10 Predicted maximum process contributions at nature conservation sites
Nitrogen dioxide – annual mean
Operational phase
Well lo
gg
ing
Sett
ing
up
per
co
mp
leti
on
s
Sealin
g b
rid
ge p
lug
s
Op
era
tin
g f
rack s
leeves
Perf
orm
ing
fra
ctu
re
Well c
lean
up
Fin
al w
ell c
lean
up
Lif
tin
g t
he w
ell
Flo
wb
ack w
ell
Veh
icle
mo
vem
en
ts
Resto
rati
on
Location
Maximum process contribution
(% standard for ecosystems and vegetation)
Howardian Hills 0.1 <0.1 1.2 0.6 0.6 0.4 <0.1 0.6
Newbridge Quarry 0.1 0.1 1.6 0.8 0.8 0.5 <0.1 0.9
River Derwent 0.1 0.1 1.8 0.8 0.9 0.6 <0.1 0.9
Green Lane Pit 0.1 <0.1 1.1 0.5 0.5 0.4 <0.1 0.6
Cropton Bank 0.1 <0.1 1.2 0.6 0.6 0.4 <0.1 0.3
The Ings 0.1 0.1 1.8 0.9 0.9 0.6 <0.1 1.0
Haugh & Gundale Slacks 0.1 0.1 1.8 0.8 0.9 0.6 <0.1 2.8
Golden Hill Pit 0.1 <0.1 1.2 0.6 0.6 0.4 <0.1 0.7
Ellerburn Bank 0.1 <0.1 1.2 0.5 0.5 0.4 <0.1 0.5

Report No.150332 Page 27 of 41
Revision 10
Third Energy UK Gas Limited
Kirby Misperton
Table 4.11 Predicted maximum process contributions at nature conservation sites
Sulphur dioxide – annual mean
Operational phase
Well lo
gg
ing
Sett
ing
up
per
co
mp
leti
on
s
Sealin
g b
rid
ge p
lug
s
Op
era
tin
g f
rack s
leeves
Perf
orm
ing
fra
ctu
re
Well c
lean
up
Fin
al w
ell c
lean
up
Lif
tin
g t
he w
ell
Flo
wb
ack w
ell
Veh
icle
mo
vem
en
ts
Resto
rati
on
Location
Maximum process contribution
(% standard for ecosystems and vegetation)
Howardian Hills <0.1 <0.1 0.3 0.1 0.1 0.1 <0.1 <0.1
Newbridge Quarry <0.1 <0.1 0.4 0.2 0.2 0.1 <0.1 <0.1
River Derwent <0.1 <0.1 0.4 0.2 0.2 0.1 <0.1 <0.1
Green Lane Pit <0.1 <0.1 0.3 0.1 0.1 0.1 <0.1 <0.1
Cropton Bank <0.1 <0.1 0.3 0.1 0.1 0.1 <0.1 <0.1
The Ings <0.1 <0.1 0.4 0.2 0.2 0.1 <0.1 <0.1
Haugh & Gundale Slacks <0.1 <0.1 0.3 0.1 0.1 0.1 <0.1 0.1
Golden Hill Pit <0.1 <0.1 0.3 0.1 0.1 0.1 <0.1 <0.1
Ellerburn Bank <0.1 <0.1 0.3 0.1 0.1 0.1 <0.1 <0.1
At all sites the process contribution is relatively low and generally below the level of significance on a short term and long term basis. APIS provides information on critical loads for nature conservation sites in respect of nutrient nitrogen and acid deposition. Table 4.12 summarises the determination of the impact of nutrient nitrogen and acid deposition at applicable sites for the well cleaning operating mode, which is considered representative of the high intensity operating phases. Some of the sites originally identified are geological sites or sites not sensitive to acid deposition and have been omitted from the subsequent assessment.
Table 4.12 Nutrient nitrogen and acid deposition
Site
Nitrogen deposition Sulphur
deposition Total acid deposition
kgN/ha y % critical
load kgS/ha y Keq/ha y
% critical
load
Cropton Bank 0.099 0.6 0.251 0.023 6.3
The Ings 0.151 1.5 0.382 0.035 7.9
Haugh & Gundale Slacks 0.099 0.6 0.251 0.023 2.7
Ellerburn Bank 0.085 0.6 0.237 0.021 2.1
a. Conversion factor for µgNO2/m
2/s to kgN/ha y is 96. Conversion factor for kgN/ha y to Keq/ha y is 0.0714.
b. Conversion factor for µgSO2/m2/s to kgS/ha y is 157.7. Conversion factor for kgS/ha y to Keq/ha y is 0.0625.
H1 Annex B
10 indicates that process contributions for nitrogen deposition exceeding 20% of the critical
load may not be acceptable for the most sensitive sites (e.g. SPA, RAMSAR). On this basis it is considered that the process contribution to nitrogen and acid deposition at local sensitive sites is not significant. It should also be noted that these above calculations are based on annual mean process contributions. The total operation is expected to be of a duration of around 8 weeks and as such annual mean process contributions can be expected to be significantly lower than reported in Tables 4.10 and 4.11 with commensurate reductions in nitrogen and acid deposition.
Report No.150332 Page 28 of 41
Revision 10
Third Energy UK Gas Limited
Kirby Misperton
4.4 Impact of fugitive releases The fugitive releases determined in Table 3.10 have been modelled to determine their impact on local air quality around the KMA wellsite. Figure A.7 illustrates the predicted dispersion of fugitive releases of methane which provides the highest contributions to ground level concentrations. In this case it is considered that modelling over an extended period of one year is suitable since these releases are considered to be typical of those during the production test and production phases when the well is flowing. It may be seen that the maximum impact is confined to the wellsite with concentrations at the site boundary equivalent to around 8% of the calculated environmental assessment level for methane and 6% of the air quality standard for benzene. Table 4.13 summarises the impact of process contributions of methane, ethane, propane and benzene at the nearest locations of permanent human habitation and temporary accommodation at the Caravan Park.
Table 4.13 Process contributions from fugitive releases at residential lcoations
Location
Maximum process contribution (annual mean)
% environmental assessment level % AQS
Methane Ethane Propane Benzene
Alma Farm 0.1 <0.1 <0.1 0.09
Kirby-O-Carr 0.1 <0.1 <0.1 0.09
Tuiffit Manor <0.1 <0.1 <0.1 0.02
High Grange Farm 0.1 <0.1 <0.1 0.05
Glebe Farm 0.1 <0.1 <0.1 0.06
Caravan Park <0.1 <0.1 <0.1 0.08
Manor Farm <0.1 <0.1 <0.1 0.01
North West Farm <0.1 <0.1 <0.1 0.01
It may be seen that all process contributions for methane, ethane, propane and C6+ higher hydrocarbons (expressed as benzene) are below the Environment Agency’s long term criteria for significance. It is therefore considered that fugitive releases do not have any significant impact on air quality in the vicinity of the wellsite. It is anticipated that the production phase will be of 9 years duration. No year on year cumulative effects are indicated for fugitive releases.
4.5 Releases of greenhouse gases Greenhouse gas releases from the KM8 operations are primarily associated with three sources:
Carbon dioxide, nitrous oxide and volatile organic compounds released from stationary engines during pre production well operations.
Carbon dioxide, nitrous oxide and volatile organic compounds from mobile sources deployed at various stages of the workover, site clearance during the production test period and the site restoration.
Methane releases from the natural gas transmission system during flow back and production. Greenhouse gas (GHG) release rates from wellsite operations are estimated in Table 4.14 and the total greenhouse gas inventory for each phase is summarised in Table 4.15. Releases from the stationary engines are based on the release rates in Table 3.7 and the expected duration of each operational phase described in section 3.4. Releases from mobile sources are based on the release rates in Table 3.7 and maximum daily vehicle movements described in Table 3.4. Fugitive emissions of methane are assumed to be at the rates determined in Table 3.10 and to persist for the period of well flowback, production test and production. The determination of greenhouse gas emissions is confined to consideration of releases of carbon dioxide, methane and nitrous oxide. Other gases with significantly higher global warming potentials (e.g. sulphur hexafluoride (SF6), hydroflurocarbons (HFCs) and perfluorocarbons (PFCs)) are not generally considered to be generated in significant concentrations from diesel combustion and emission factors for these gases are not readily available.

Report No.150332 Page 29 of 41
Revision 10
Third Energy UK Gas Limited
Kirby Misperton
Table 4.14 Greenhouse gas releases
Phase Release rate (kg/h)
a
CO2 CH4 N2O
Workover
Well logging 185 0.10 0.030
Setting upper completions 185 0.10 0.030
Operating frack sleeves 275 0.15 0.049
Vehicle movements 9.4 0.01 0.001
Hydraulic
fracture
stimulation and
well test
Performing fracture 2668 1.47 0.480
Well clean up 1289 0.71 0.230
Setting bridge plugs 275 0.15 0.050
Final well clean up 1289 0.71 0.230
Lifting well 1314 0.72 0.240
Flowback well 767 1.06 0.140
Vehicle movements 18.4 0.03 0.002
Production test Production test 0 0.64 0
Vehicle movements 0.38 0.0005 0.00004
Production Production 0 0.64 0
Restoration Restoration 78 0.09 0.004
a. release rate is the mean release rate per hour for the expected duration of the operational phase.
Table 4.15 Greenhouse gas inventory
Phase
GHG release
ratea
Phase
duration
Total GHG release
kgCO2eq100
/h h t
Workover
Well logging 196.4 10 2.0
37.0
Setting upper completions 196.4 8 1.6
Operating frack sleeves 293.3 108 31.7
Vehicle movements 9.9 88 1.8
Hydraulic
fracture
stimulation and
well test
Performing fracture 2847.7 20 57.0
483.3
Well clean up 1375.2 192 264.0
Setting bridge plugs 293.7 120 35.2
Final well clean up 1375.2 48 66.0
Lifting well 1403.5 24 33.7
Flowback well 832.7 24 20.0
Vehicle movements 19.7 374 7.4
Production
test
Production test 13.4 2160 29.0 29.9
Vehicle movements 0.4 2160 0.9
Production Production 13.4 78840 1059.6 1059.6
Restoration Restoration 72.6 864 70.2 70.2
Wellsite operations 1679.9
a. Methane and nitrous oxide are expressed as a CO2 equivalent based on a 100 year time horizon (IPPC, 2007 – 1 kg CH4 is equivalent to 21 kg CO2 and 310 kg N2O).
This assessment indicates a total greenhouse gas release over the period of wellsite operations of 1680 t CO2 equivalent. The estimated greenhouse gas release during each phase is illustrated in Figure 4.1.
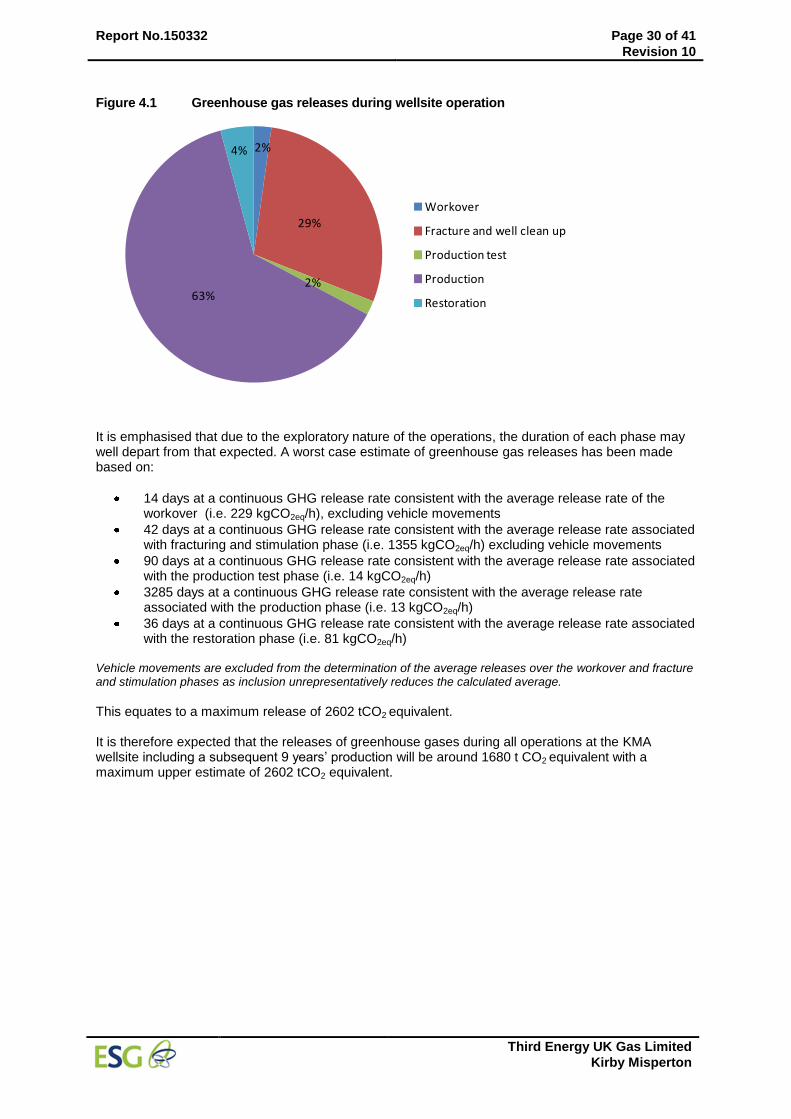
Report No.150332 Page 30 of 41
Revision 10
Third Energy UK Gas Limited
Kirby Misperton
Figure 4.1 Greenhouse gas releases during wellsite operation
2%
29%
2%63%
4%
Workover
Fracture and well clean up
Production test
Production
Restoration
It is emphasised that due to the exploratory nature of the operations, the duration of each phase may well depart from that expected. A worst case estimate of greenhouse gas releases has been made based on:
14 days at a continuous GHG release rate consistent with the average release rate of the workover (i.e. 229 kgCO2eq/h), excluding vehicle movements
42 days at a continuous GHG release rate consistent with the average release rate associated with fracturing and stimulation phase (i.e. 1355 kgCO2eq/h) excluding vehicle movements
90 days at a continuous GHG release rate consistent with the average release rate associated with the production test phase (i.e. 14 kgCO2eq/h)
3285 days at a continuous GHG release rate consistent with the average release rate associated with the production phase (i.e. 13 kgCO2eq/h)
36 days at a continuous GHG release rate consistent with the average release rate associated with the restoration phase (i.e. 81 kgCO2eq/h)
Vehicle movements are excluded from the determination of the average releases over the workover and fracture and stimulation phases as inclusion unrepresentatively reduces the calculated average.
This equates to a maximum release of 2602 tCO2 equivalent. It is therefore expected that the releases of greenhouse gases during all operations at the KMA wellsite including a subsequent 9 years’ production will be around 1680 t CO2 equivalent with a maximum upper estimate of 2602 tCO2 equivalent.
Report No.150332 Page 31 of 41
Revision 10
Third Energy UK Gas Limited
Kirby Misperton
5 CONCLUSIONS
A dispersion modelling assessment using the ADMS 5 model was employed to predict the impact on local air quality of discharges of important pollutants from well operations at the Kirby Misperton A (KMA) wellsite. All operating phases associated with the well workover, fracturing, subsequent clean up and demobilisation prior to production were considered with emphasis on releases from temporary operations equipment, largely stationary diesel engines, and fugitive emissions from the natural gas transmission system. The greenhouse gas inventory for the operation was also assessed. Process contributions from engine releases to ground level concentrations of nitrogen dioxide and PM10 are expected to exceed short term air quality standards at the site boundary based on model predictions, although the extent of any exceedence is not clear due to the influence of temporary structures on the dispersion of low level engine exhaust releases. At the nearest locations of permanent human habitation process contributions to ground level concentrations of carbon monoxide, sulphur dioxide, volatile organic compounds and PM10 are not considered to be likely to have any significant impact on air quality. Process contributions of nitrogen dioxide are more significant, although it is concluded that these are unlikely to pose a substantial threat to the continued attainment of air quality standards. At the closest statutory designated nature conservation sites process contributions to ground level concentrations of sulphur dioxide and nitrogen dioxide are mostly below the level of significance and do not pose any substantial risk to attainment of the critical levels. Nutrient nitrogen and acid deposition associated with the process contributions at these locations are not considered to be significant in relation to corresponding critical loads. Natural gas produced from the KMA wellsite is transported via pipeline to the nearby Knapton Generating Station. Fugitive releases of natural gas are expected from the on site gas transmission system. Based on leakage rates assessed by Third Energy the impact on local air quality of fugitive natural gas releases was assessed. The maximum process contribution to ground level concentrations of methane, ethane , propane and higher hydrocarbons (expressed as benzene) was predicted to be equivalent to no more than 8% of the estimated long term environmental benchmark at the site boundary falling to below 1% of these levels at the nearest residential locations. The long term process contribution to ground level concentrations of these compounds during both pre production and production phases of well operations is not considered to be significant based on Environment Agency assessment criteria. The modelling assessment methodology and necessary assumptions provide a very conservative assessment of impact on air quality, particularly for nitrogen dioxide. The overall results and conclusions reached therefore incorporate a reasonable margin of comfort in spite of the inevitable uncertainty of such modelling studies. It is concluded that the well operations will not affect the attainment of air quality standards around the areas of permanent human habitation closest to the wellsite and will have negligible impact at local statutory designated conservation sites. Exceedences in short term air quality standards for some pollutants are likely on occasions around the site boundary. No exceedence in air quality standards is indicated for the locations of temporary habitation in the Caravan Park and nearby Flamingo Land Theme Park. Release of greenhouse gases during well operations are estimated to be around 1680 t CO2 equivalent, based on the expected duration of the defined operational phases. Due to the inherent uncertainty of this type of project the duration of some phases may exceed initial expectations and as such an estimate of 2602 tCO2 equivalent is provided as a maximum for the overall project.
Report No.150332 Page 32 of 41
Revision 10
Third Energy UK Gas Limited
Kirby Misperton
6 REFERENCES
1. Environment Agency, “Horizontal guidance note H1 – Annex (f) Air Emissions”, version 2.2, December 2011.
2. Directive 2008/50/EC – Ambient air quality and cleaner air for Europe, 21 May 2008.
3. Health and Safety Executive, EH40/2005 Workplace exposure limits, 2011. 4. Occupation Health and Safety Administration, Permissible exposure limits, US Department of
Labor, September 1976.
5. Environment Agency, ‘Review of background air quality data and methods to combine these with process contributions: technical modelling aspects’, Science report SC030174/1SR2, October 2006.
6. Personal communication, J Foster (PSSL) to N Ford, 23 February 2015. 7. Personal communication, N Dugnaite (Haliburton) to N Ford, 27 March 2015. 8. ‘Compilation of Air Pollutant Emission Factors’, Volume 1, 5
th Edition, January 1995, United
States Environmental Protection Agency. 9. Janssen LHJM, Van Wakeren JHA, Van Duuren H and Elshout A J, 1988, A classification of NO oxidation rates in power plant plumes based on atmospheric conditions, Atmospheric Environment, 22, 43-53.
10. Environment Agency, H1 Annex B – Intensive farming, version 2.0, December 2011. 11. Environment Agency, AQTAG06 Technical guidance on detailed modelling approach for an
appropriate assessment for emissions to air, October 2011. 12. S.M. Ashrafur Rahman, Impact of idling on fuel consumption and exhaust emissions and
available idle-reduction technologies for diesel vehicles – A review, Energy conversion and management, 74, 2013.
13. EMEP/EEA, Emissions inventory guidebook 2013, September 2014. 14. United States Environmental Protection Agency, Idling vehicle emission, EPA-420-F-98-014,
April 1998. 15. United States Environmental Protection Agency, Idling vehicle emission, EPA-420-F-98-014,
April 1998.
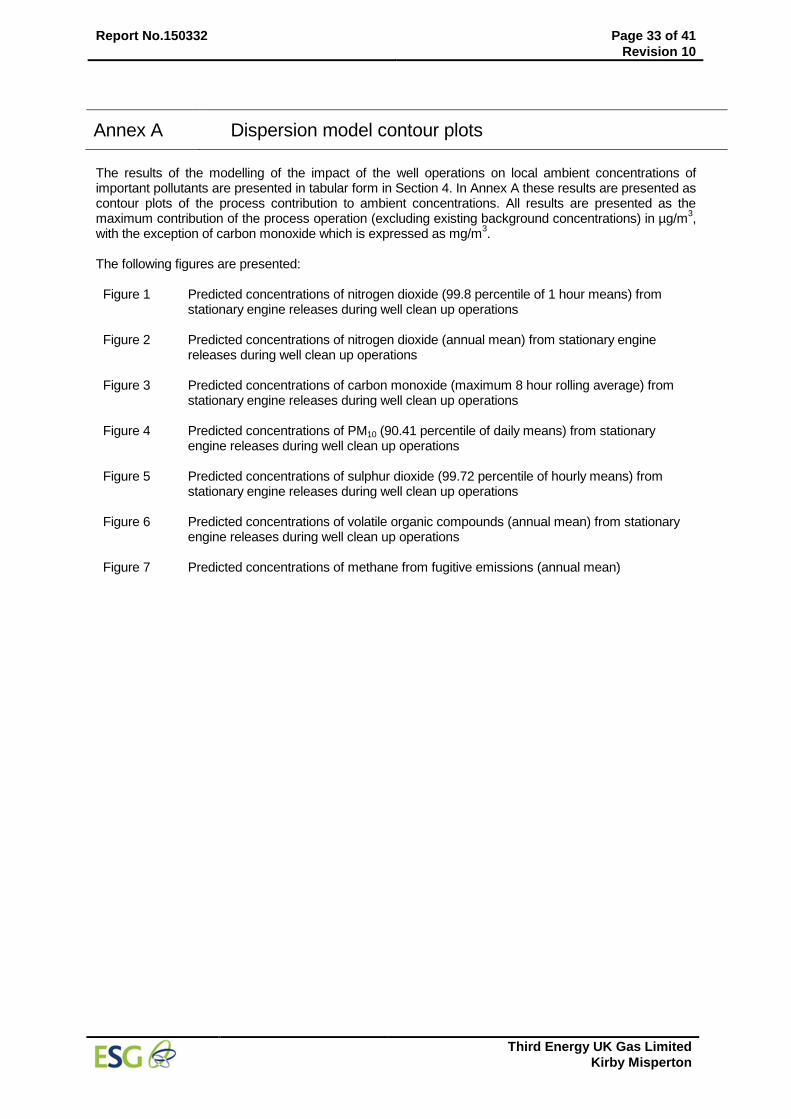
Report No.150332 Page 33 of 41
Revision 10
Third Energy UK Gas Limited
Kirby Misperton
Annex A Dispersion model contour plots
The results of the modelling of the impact of the well operations on local ambient concentrations of important pollutants are presented in tabular form in Section 4. In Annex A these results are presented as contour plots of the process contribution to ambient concentrations. All results are presented as the maximum contribution of the process operation (excluding existing background concentrations) in µg/m
3,
with the exception of carbon monoxide which is expressed as mg/m3.
The following figures are presented: Figure 1 Predicted concentrations of nitrogen dioxide (99.8 percentile of 1 hour means) from
stationary engine releases during well clean up operations
Figure 2 Predicted concentrations of nitrogen dioxide (annual mean) from stationary engine releases during well clean up operations
Figure 3 Predicted concentrations of carbon monoxide (maximum 8 hour rolling average) from stationary engine releases during well clean up operations
Figure 4 Predicted concentrations of PM10 (90.41 percentile of daily means) from stationary engine releases during well clean up operations
Figure 5 Predicted concentrations of sulphur dioxide (99.72 percentile of hourly means) from stationary engine releases during well clean up operations
Figure 6 Predicted concentrations of volatile organic compounds (annual mean) from stationary engine releases during well clean up operations
Figure 7 Predicted concentrations of methane from fugitive emissions (annual mean)
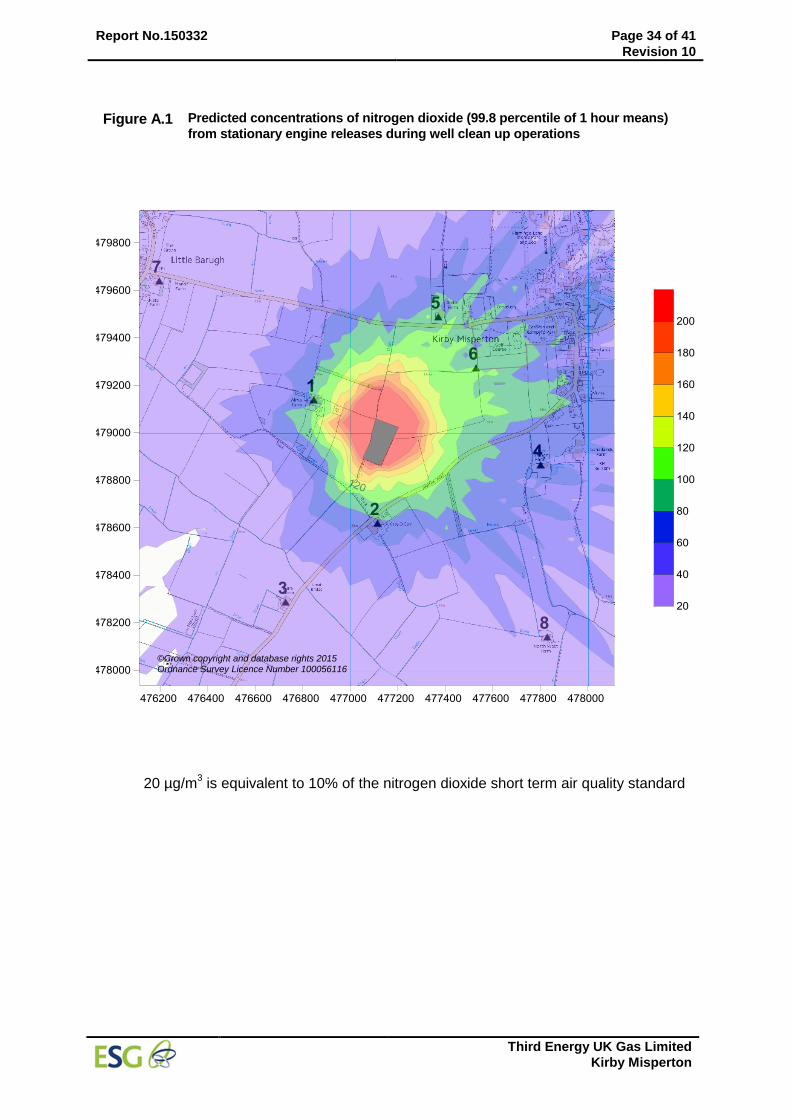
Report No.150332 Page 34 of 41
Revision 10
Third Energy UK Gas Limited
Kirby Misperton
Figure A.1 Predicted concentrations of nitrogen dioxide (99.8 percentile of 1 hour means)
from stationary engine releases during well clean up operations
20 µg/m3 is equivalent to 10% of the nitrogen dioxide short term air quality standard
©Crown copyright and database rights 2015 Ordnance Survey Licence Number 100056116
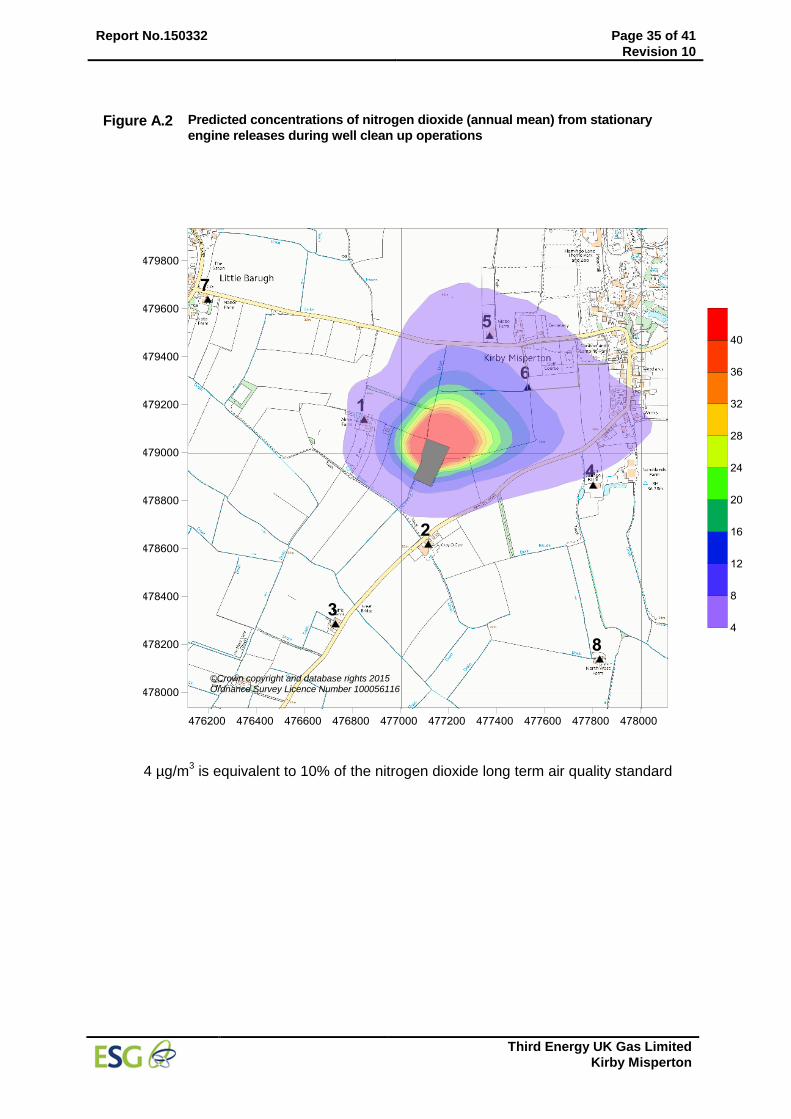
Report No.150332 Page 35 of 41
Revision 10
Third Energy UK Gas Limited
Kirby Misperton
Figure A.2 Predicted concentrations of nitrogen dioxide (annual mean) from stationary
engine releases during well clean up operations
4 µg/m
3 is equivalent to 10% of the nitrogen dioxide long term air quality standard
©Crown copyright and database rights 2015 Ordnance Survey Licence Number 100056116
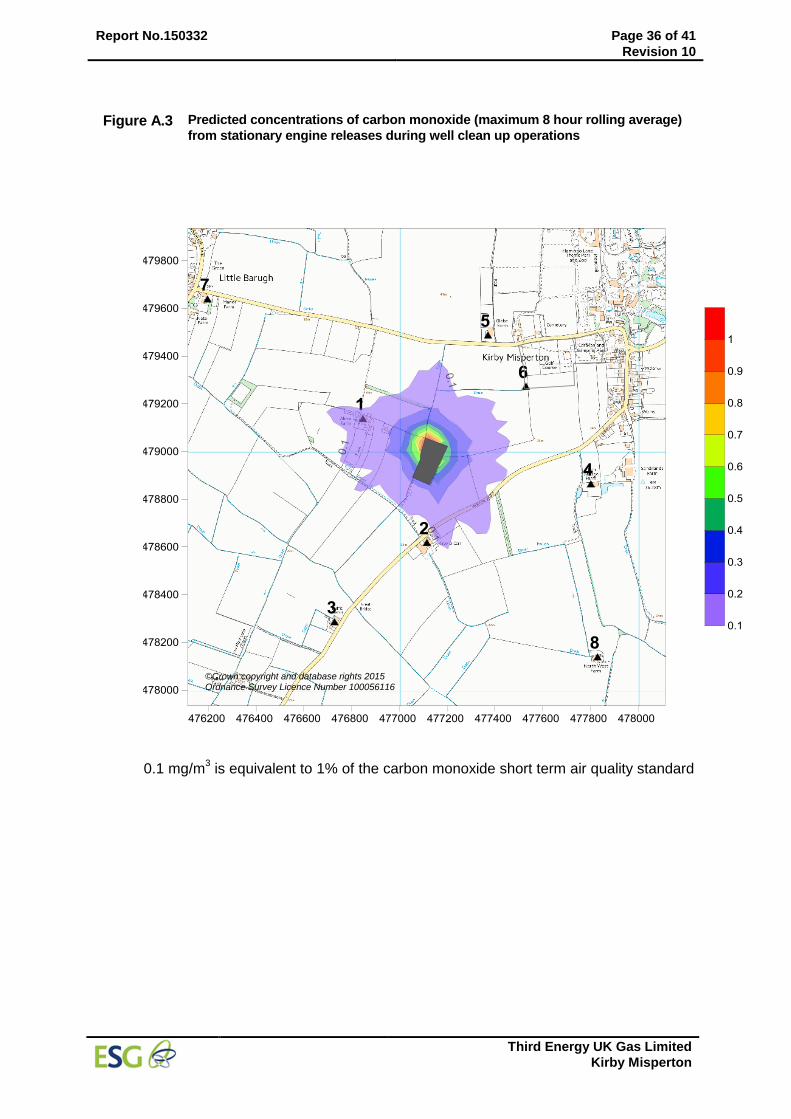
Report No.150332 Page 36 of 41
Revision 10
Third Energy UK Gas Limited
Kirby Misperton
Figure A.3 Predicted concentrations of carbon monoxide (maximum 8 hour rolling average)
from stationary engine releases during well clean up operations
0.1 mg/m
3 is equivalent to 1% of the carbon monoxide short term air quality standard
©Crown copyright and database rights 2015 Ordnance Survey Licence Number 100056116
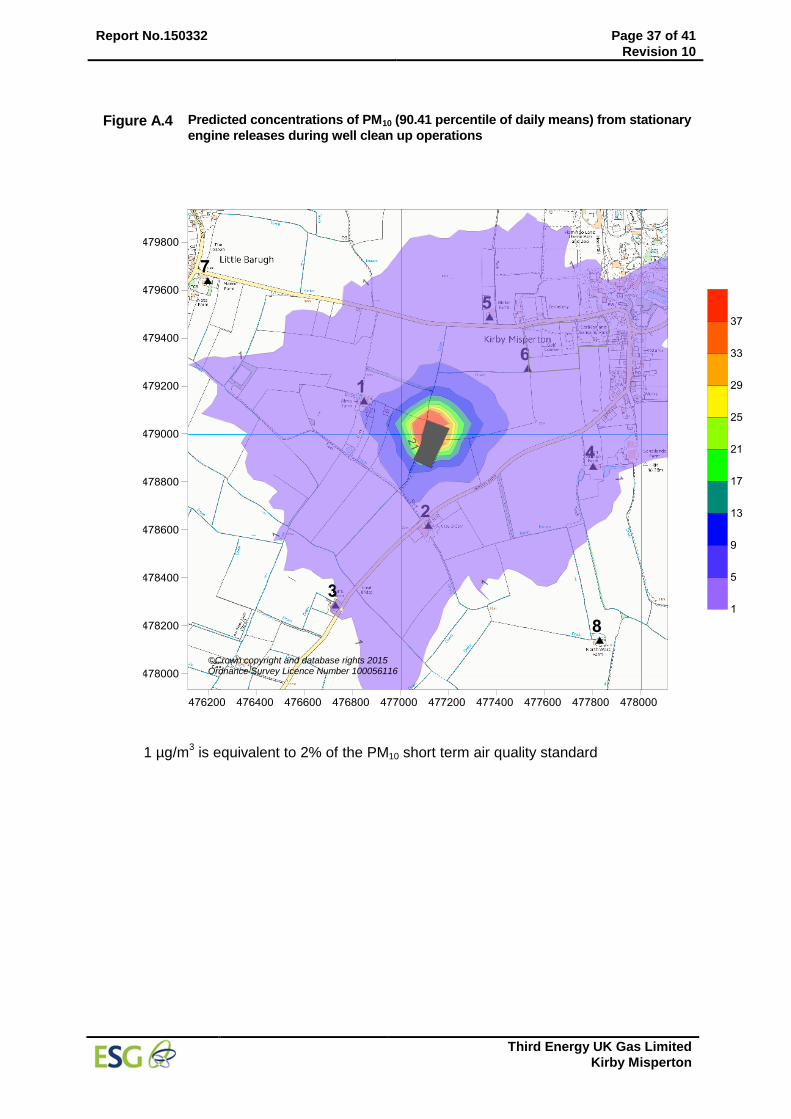
Report No.150332 Page 37 of 41
Revision 10
Third Energy UK Gas Limited
Kirby Misperton
Figure A.4 Predicted concentrations of PM10 (90.41 percentile of daily means) from stationary
engine releases during well clean up operations
1 µg/m
3 is equivalent to 2% of the PM10 short term air quality standard
©Crown copyright and database rights 2015 Ordnance Survey Licence Number 100056116
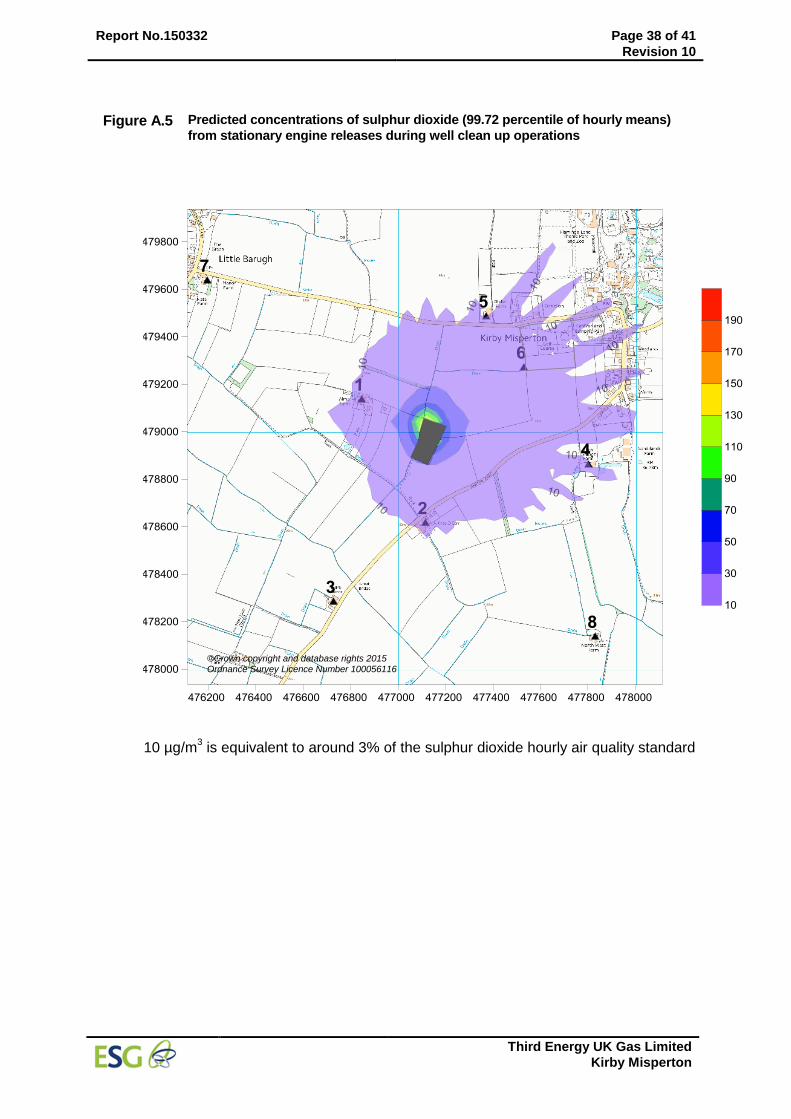
Report No.150332 Page 38 of 41
Revision 10
Third Energy UK Gas Limited
Kirby Misperton
Figure A.5 Predicted concentrations of sulphur dioxide (99.72 percentile of hourly means)
from stationary engine releases during well clean up operations
10 µg/m
3 is equivalent to around 3% of the sulphur dioxide hourly air quality standard
©Crown copyright and database rights 2015 Ordnance Survey Licence Number 100056116

Report No.150332 Page 39 of 41
Revision 10
Third Energy UK Gas Limited
Kirby Misperton
Figure A.6 Predicted concentrations of volatile organic compounds (annual mean) from
stationary engine releases during well clean up operations
0.5 µg/m
3 is equivalent to around 10% of the benzene long term air quality standard
©Crown copyright and database rights 2015 Ordnance Survey Licence Number 100056116
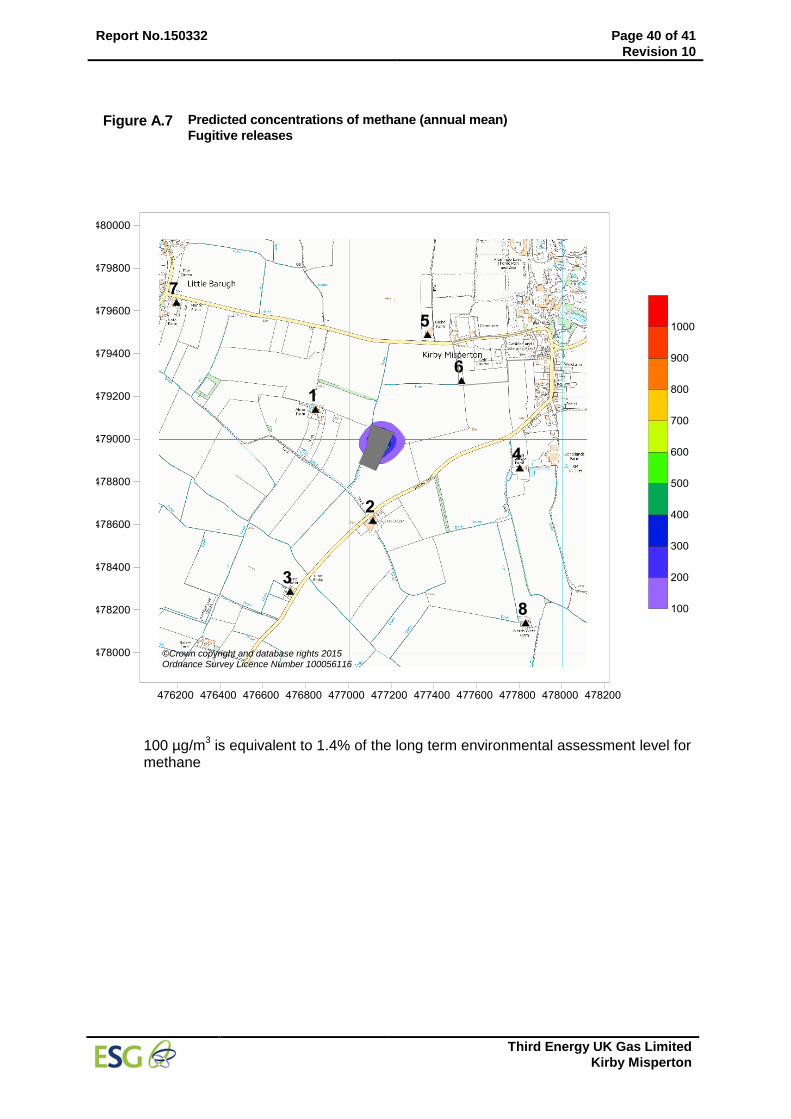
Report No.150332 Page 40 of 41
Revision 10
Third Energy UK Gas Limited
Kirby Misperton
Figure A.7 Predicted concentrations of methane (annual mean)
Fugitive releases
100 µg/m3 is equivalent to 1.4% of the long term environmental assessment level for
methane
©Crown copyright and database rights 2015 Ordnance Survey Licence Number 100056116
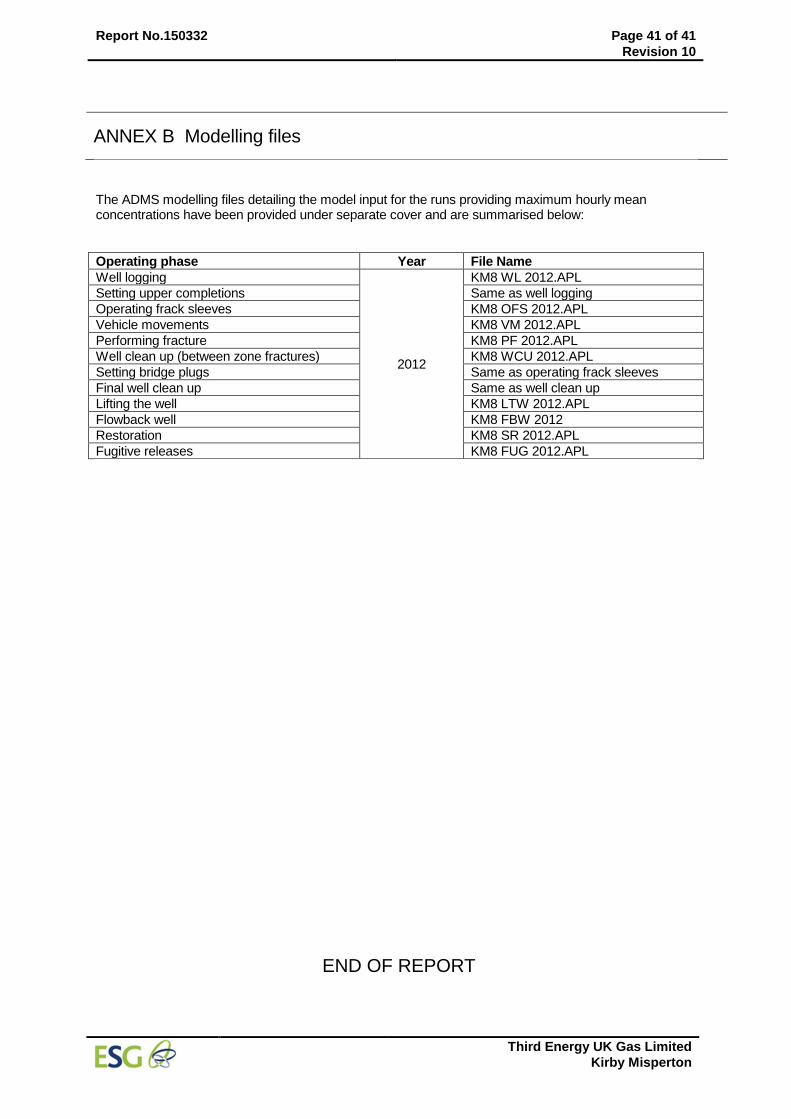
Report No.150332 Page 41 of 41
Revision 10
Third Energy UK Gas Limited
Kirby Misperton
ANNEX B Modelling files
The ADMS modelling files detailing the model input for the runs providing maximum hourly mean concentrations have been provided under separate cover and are summarised below:
Operating phase Year File Name
Well logging
2012
KM8 WL 2012.APL
Setting upper completions Same as well logging
Operating frack sleeves KM8 OFS 2012.APL
Vehicle movements KM8 VM 2012.APL
Performing fracture KM8 PF 2012.APL
Well clean up (between zone fractures) KM8 WCU 2012.APL
Setting bridge plugs Same as operating frack sleeves
Final well clean up Same as well clean up
Lifting the well KM8 LTW 2012.APL
Flowback well KM8 FBW 2012
Restoration KM8 SR 2012.APL
Fugitive releases KM8 FUG 2012.APL
END OF REPORT

Contact:
Environmental Scientifics Group Ltd Unit D, Acacia Building Vantage Point Business Village Mitcheldean Gloucestershire GL17 0DD T: E: @esg.co.uk


