
Supporting the competitiveness of the European
food and drink industry
CIAA CompetItIveness RepoRt 2010

Scope and objectives of the 2010 Competitiveness Report
This report analyses and sets out the priority areas which are critical for the long-term competitiveness of food and drink manufacturers in the EU.
The analysis has been done on several levels, by:
1. Presenting key competitiveness indicators; 2. Identifying the opportunities and threats for the EU food and drink industry compared to other
countries and regions;3. Assessing the extent to which the Recommendations of the Commission’s High Level Group for the
Competitiveness of the Agro-Food Industry have been implemented; and4. Identifying, and in some cases, confirming areas of action for policy-makers.
This report presents EU-27 data unless otherwise specified.
CIA
A C
ompe
titiv
enes
s Re
port
201
0
3
Foreword
The 2010 CIAA Competitiveness Report aims to assess the performance of the EU food and drink industry in light of political and economic developments in Europe and globally.
A pillar of the EU economy, the European food and drink sector is a stable employer and manufacturer. Despite this solid base and stable but low growth in production, the EU food and drink sector growth is being outpaced by the performance of emerging economies. This is due, among other things, to:
• Low levels of R&D in EU food and drink companies; • Lower labour productivity growth in the EU;• Uneven industry-retail relations within the EU food
chain leading to unfair practices;• Currently stable but relatively high input prices for
raw materials in the EU; and• A highly-regulated business environment in the EU.
At the same time, the EU food and drink industry remains the largest exporter globally, although its export market share on global markets is declining. Surprisingly, after eight years of decreasing trade balance, in 2009 the EU food and drink sector registered an upswing due to a sharp decrease in imports during the economic crisis.
As a non-cyclical sector, minimally subjected to the flow of markets and the economy, the EU food and drink industry has been less affected by the economic crisis than other industrial sectors, allowing it to continue to operate well in a challenging economic environment without state support. Food and drink companies have continued to provide healthy and nutritious products to their consumers throughout the crisis, while maintaining their commitments, among others, to the promotion of healthy lifestyles and balanced diets, sustainable consumption and production as well as research and innovation.
Finally, the EU food and drink industry calls for enhanced political support for the implementation of all actions aiming to increase the industry’s competitiveness as identified by CIAA in this report. For the EU food and drink industry, this is the way forward towards fulfilling the objectives of the EU 2020 Strategy.
Jesús Serafín Pérez PRESIDEnT
CIA
A C
ompe
titiv
enes
s Re
port
201
0C
IAA
Com
petit
iven
ess
Repo
rt 2
010
CIA
A C
ompe
titiv
enes
s Re
port
201
0
CIA
A C
ompe
titiv
enes
s Re
port
201
0
4
Table of Contents
Foreword . . . . . . . . . . . . . . . . . . . . . . . . . . . . . . . . . . . . . . . . . . . . . . . . . . . . . . . . . . . . . . . . . . . . . . . . . . . . . . . . . . . . . . . . . . . . . . . . . . . . . . . . 32009 at a glance: Food and drink companies in the EU . . . . . . . . . . . . . . . . . . . . . . . . . . . . . . . . . . . . . . . . . . . . . . . . . . . . 5
1. Setting the scene: The food and drink industry – a pillar of the European economy . . . . . . . . . . . . . . . . 6
2. Main food and drink competitiveness indicators – an international comparison . . . . . . . . . . . . . . . . . . . . 8
2.1 Production value . . . . . . . . . . . . . . . . . . . . . . . . . . . . . . . . . . . . . . . . . . . . . . . . . . . . . . . . . . . . . . . . . . . . . . . . . . . . . . . . . . . . . . . . . 82.2 Labour productivity . . . . . . . . . . . . . . . . . . . . . . . . . . . . . . . . . . . . . . . . . . . . . . . . . . . . . . . . . . . . . . . . . . . . . . . . . . . . . . . . . . . . . . . 92.3 Export market share . . . . . . . . . . . . . . . . . . . . . . . . . . . . . . . . . . . . . . . . . . . . . . . . . . . . . . . . . . . . . . . . . . . . . . . . . . . . . . . . . . . . . 102.4 R&D investment . . . . . . . . . . . . . . . . . . . . . . . . . . . . . . . . . . . . . . . . . . . . . . . . . . . . . . . . . . . . . . . . . . . . . . . . . . . . . . . . . . . . . . . . . 11
Special Section: High Level Group on the Competitiveness of the Agro-Food Industry . . . . . . . . . . . . . . . . 12
3. Specific food and drink industry benchmarks and requirements . . . . . . . . . . . . . . . . . . . . . . . . . . . . . . . . . . . . . 143.1 Food supply chain issues . . . . . . . . . . . . . . . . . . . . . . . . . . . . . . . . . . . . . . . . . . . . . . . . . . . . . . . . . . . . . . . . . . . . . . . . . . . . . . . . . 143.2 Regulatory environment . . . . . . . . . . . . . . . . . . . . . . . . . . . . . . . . . . . . . . . . . . . . . . . . . . . . . . . . . . . . . . . . . . . . . . . . . . . . . . . . . . 183.3 Business input costs, including agricultural raw materials . . . . . . . . . . . . . . . . . . . . . . . . . . . . . . . . . . . . . . . . . . . . . . . . . . . . . 213.4 Environmental policy and sustainability . . . . . . . . . . . . . . . . . . . . . . . . . . . . . . . . . . . . . . . . . . . . . . . . . . . . . . . . . . . . . . . . . . . . . 233.5 Trade competitiveness . . . . . . . . . . . . . . . . . . . . . . . . . . . . . . . . . . . . . . . . . . . . . . . . . . . . . . . . . . . . . . . . . . . . . . . . . . . . . . . . . . . 25
Conclusion . . . . . . . . . . . . . . . . . . . . . . . . . . . . . . . . . . . . . . . . . . . . . . . . . . . . . . . . . . . . . . . . . . . . . . . . . . . . . . . . . . . . . . . . . . . . . . . . . . . . 28
Bibliography . . . . . . . . . . . . . . . . . . . . . . . . . . . . . . . . . . . . . . . . . . . . . . . . . . . . . . . . . . . . . . . . . . . . . . . . . . . . . . . . . . . . . . . . . . . . . . . . . . . . 29
Annexes . . . . . . . . . . . . . . . . . . . . . . . . . . . . . . . . . . . . . . . . . . . . . . . . . . . . . . . . . . . . . . . . . . . . . . . . . . . . . . . . . . . . . . . . . . . . . . . . . . . . . . . 30
Acronyms . . . . . . . . . . . . . . . . . . . . . . . . . . . . . . . . . . . . . . . . . . . . . . . . . . . . . . . . . . . . . . . . . . . . . . . . . . . . . . . . . . . . . . . . . . . . . . . . . . 30List of tables . . . . . . . . . . . . . . . . . . . . . . . . . . . . . . . . . . . . . . . . . . . . . . . . . . . . . . . . . . . . . . . . . . . . . . . . . . . . . . . . . . . . . . . . . . . . . . . 30List of figures . . . . . . . . . . . . . . . . . . . . . . . . . . . . . . . . . . . . . . . . . . . . . . . . . . . . . . . . . . . . . . . . . . . . . . . . . . . . . . . . . . . . . . . . . . . . . . 31List of boxes . . . . . . . . . . . . . . . . . . . . . . . . . . . . . . . . . . . . . . . . . . . . . . . . . . . . . . . . . . . . . . . . . . . . . . . . . . . . . . . . . . . . . . . . . . . . . . . 31
Table of Contents

CIA
A C
ompe
titiv
enes
s Re
port
201
0
5
Key sector characteristics
• Stable manufacturing sector and employer, true pillar of the EU economy• Mature sector operating mainly in a mature market (EU Single Market), although in need of policy-makers’
support to maintain its export competitiveness• Competitive industry compared to other developed countries but losing competitiveness against emerging
economies• Robust non-cyclical sector, less affected by the economic crisis than other business sectors in the EU
Key competitiveness indicators
Quantitative Indicators
Production Value Slow increase in production growth compared to emerging markets but keeping pace with developed economies
Labour Productivity Increased labour productivity, but still lagging behind other developed economies
Export Market Share EU still first exporter, but with a decreasing export market share
R&D Investment EU lagging behind its competitors and not growing
Qualitative Indicators
Functioning of the Food Chain Uneven industry-retail relations within the food chain leading to the proliferation of unfair practices
Private Labels The dual role of retail and the misuse of Private Labels
Regulatory Impact Highly-regulated business environment and low predictability for business decisions due to regulatory change
Access to Input Products Currently stable, but relatively high price levels of input products
Environment and Sustainability Increased efforts towards sustainable consumption and production and towards decoupling growth from greenhouse gas emissions
Food and drink companies in the EU 2009 at a glance
CIA
A C
ompe
titiv
enes
s Re
port
201
0
6
Setting the scene: the food and drink industry – a pillar of the European economy
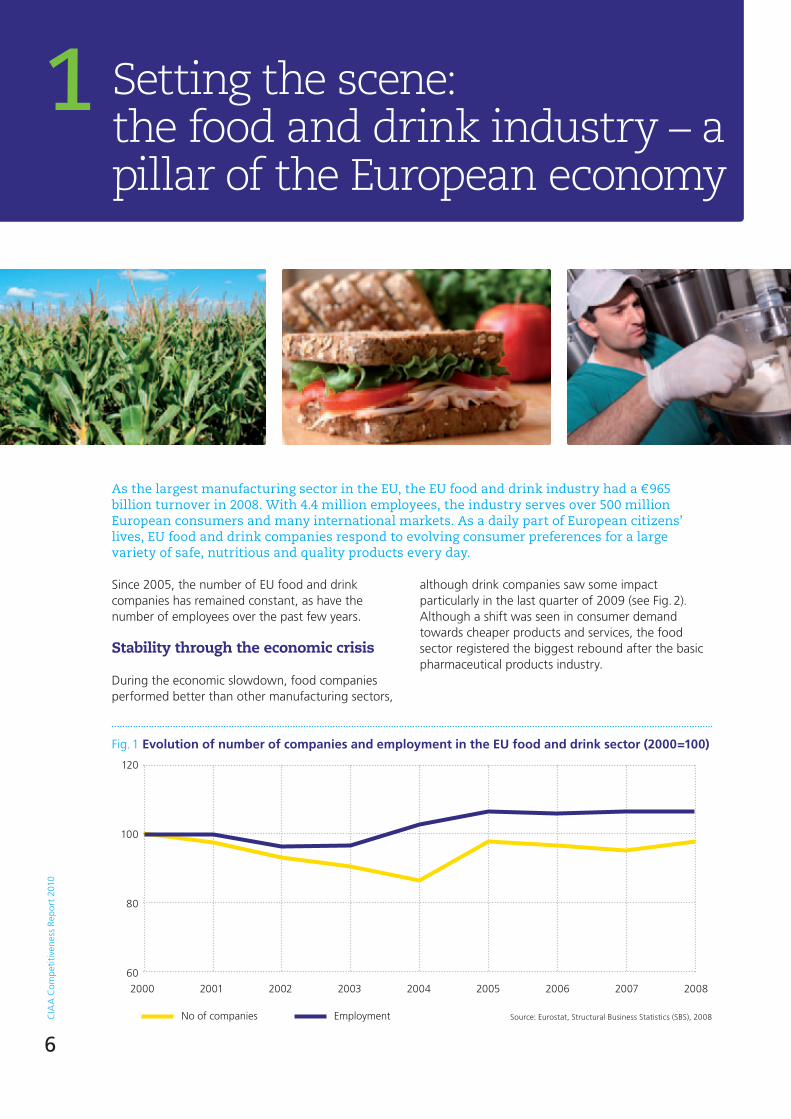
As the largest manufacturing sector in the eU, the eU food and drink industry had a € 965 billion turnover in 2008. With 4.4 million employees, the industry serves over 500 million european consumers and many international markets. As a daily part of european citizens’ lives, eU food and drink companies respond to evolving consumer preferences for a large variety of safe, nutritious and quality products every day.
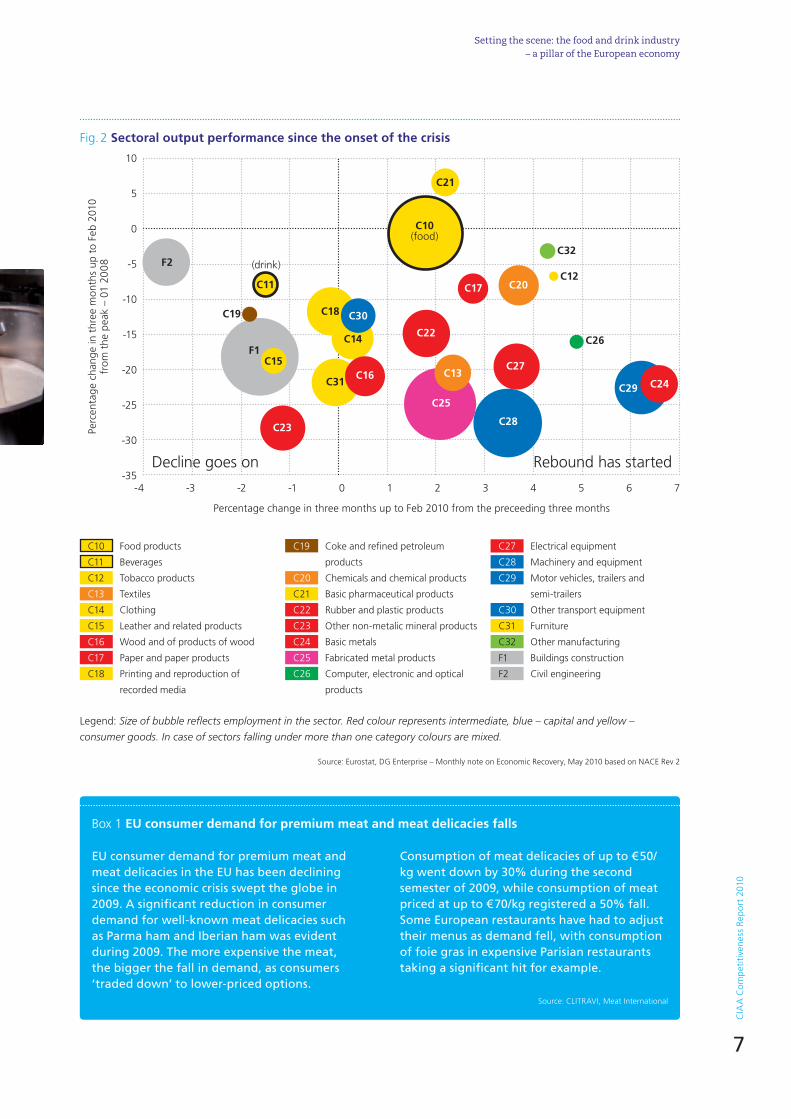
although drink companies saw some impact particularly in the last quarter of 2009 (see Fig. 2). Although a shift was seen in consumer demand towards cheaper products and services, the food sector registered the biggest rebound after the basic pharmaceutical products industry.
Fig. 1 Evolution of number of companies and employment in the EU food and drink sector (2000=100)
120
100
80
60
2000 2001 2002 2003 2004 2005 2006 2007 2008
no of companies Employment Source: Eurostat, Structural Business Statistics (SBS), 2008
Since 2005, the number of EU food and drink companies has remained constant, as have the number of employees over the past few years.
Stability through the economic crisis
During the economic slowdown, food companies performed better than other manufacturing sectors,
1
CIA
A C
ompe
titiv
enes
s Re
port
201
0
7
Box 1 EU consumer demand for premium meat and meat delicacies falls
10
5
0
-5
-10
-15
-20
-25
-30
-35
C21
F2
F1C15
C11
C10(food)
C18
C14
C31
C19
C32
C12
C26
C23
C30
C28
C20
C24C29C16
C22
C17
C27
C25
C13
-4 -3 -2 -1 0 1 2 3 4 5 6 7
Percentage change in three months up to Feb 2010 from the preceeding three months
Legend: Size of bubble reflects employment in the sector. Red colour represents intermediate, blue – capital and yellow –
consumer goods. In case of sectors falling under more than one category colours are mixed.
Perc
enta
ge c
hang
e in
thr
ee m
onth
s up
to
Feb
2010
fr
om t
he p
eak
– 01
20
08
Decline goes on Rebound has started
Source: Eurostat, DG Enterprise – Monthly note on Economic Recovery, May 2010 based on nACE Rev 2
Fig. 2 Sectoral output performance since the onset of the crisis
setting the scene: the food and drink industry – a pillar of the european economy
EU consumer demand for premium meat and meat delicacies in the EU has been declining since the economic crisis swept the globe in 2009. A significant reduction in consumer demand for well-known meat delicacies such as Parma ham and Iberian ham was evident during 2009. The more expensive the meat, the bigger the fall in demand, as consumers ‘traded down’ to lower-priced options.
Consumption of meat delicacies of up to € 50/kg went down by 30% during the second semester of 2009, while consumption of meat priced at up to € 70/kg registered a 50% fall. Some European restaurants have had to adjust their menus as demand fell, with consumption of foie gras in expensive Parisian restaurants taking a significant hit for example.
Source: CLITRAVI, Meat International
(drink)
C10 Food products
C11 Beverages
C12 Tobacco products
C13 Textiles
C14 Clothing
C15 Leather and related products
C16 Wood and of products of wood
C17 Paper and paper products
C18 Printing and reproduction of
recorded media
C19 Coke and refined petroleum
products
C20 Chemicals and chemical products
C21 Basic pharmaceutical products
C22 Rubber and plastic products
C23 Other non-metalic mineral products
C24 Basic metals
C25 Fabricated metal products
C26 Computer, electronic and optical
products
C27 Electrical equipment
C28 Machinery and equipment
C29 Motor vehicles, trailers and
semi-trailers
C30 Other transport equipment
C31 Furniture
C32 Other manufacturing
F1 Buildings construction
F2 Civil engineering
CIA
A C
ompe
titiv
enes
s Re
port
201
0
8
Main food and drink competitiveness indicators – an international comparison
the 2010 CIAA Competitiveness Report builds on previous years’ reports and analyses a number of competitiveness indicators for the food and drink industries worldwide. the previous analysis showed that the eU food and drink sector was lagging behind other countries.
this year’s report shows that the competitive position of the eU food and drink industry has not improved when analysed in terms of evolution of production value, labour productivity, eU export share and R&D investment. moreover, emerging countries show enormous growth in production value and trade balance of the food and drink sector. Finally, the distribution of export market shares is shifting from established competitors to new emerging economies.
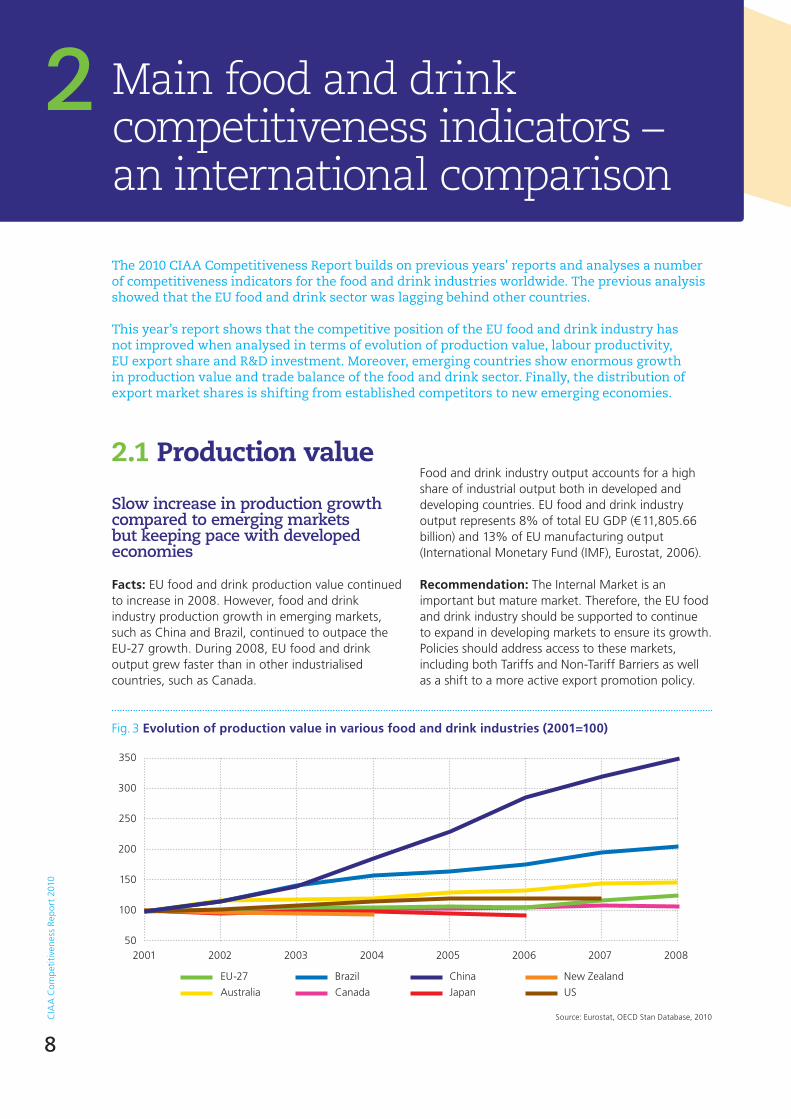
2.1 Production value
Slow increase in production growth compared to emerging markets but keeping pace with developed economies
Facts: EU food and drink production value continued to increase in 2008. However, food and drink industry production growth in emerging markets, such as China and Brazil, continued to outpace the EU-27 growth. During 2008, EU food and drink output grew faster than in other industrialised countries, such as Canada.
350
300
250
200
150
100
502001 2002 2003 2004 2005 2006 2007 2008
Fig. 3 Evolution of production value in various food and drink industries (2001=100)
Source: Eurostat, OECD Stan Database, 2010
EU-27
Australia
Brazil
Canada
China
Japan
new Zealand
US
2
Food and drink industry output accounts for a high share of industrial output both in developed and developing countries. EU food and drink industry output represents 8% of total EU GDP (€ 11,805.66 billion) and 13% of EU manufacturing output (International Monetary Fund (IMF), Eurostat, 2006).
Recommendation: The Internal Market is an important but mature market. Therefore, the EU food and drink industry should be supported to continue to expand in developing markets to ensure its growth. Policies should address access to these markets, including both Tariffs and non-Tariff Barriers as well as a shift to a more active export promotion policy.

CIA
A C
ompe
titiv
enes
s Re
port
201
0
9
2.2 Labour productivity
main food and drink competitiveness indicators – an international comparison
Increased labour productivity, but still lagging behind peers
Facts: Labour productivity (expressed as output in euros per employee) in the EU food and drink industry increased by 3% in 2008 compared to 2007. The EU continues to lag behind productivity levels in the food and drink sector in the US, Australia, new Zealand and Canada. Equally, EU labour productivity growth lags behind growth levels in emerging countries like China and Brazil. The main causes of lower labour productivity in the EU food and drink industries are the lack of exposure to global best practices1, low competitive intensity and the promotion of legitimate social objectives, which bear a high economic cost. As a result, Europe experiences lower investment when compared to its competitors in developed countries.
1 Due to product market barriers such as trade restrictions, price constraints, land ownership regulation etc.
Table 1 Labour productivity (output in € 1,000/employee/year)
Labour productivity (€ 1,000)
(%)
2007 2008 2008/2007
EU-27 214 220 3
US 285 – –
Australia 256 238 -7
New Zealand 220 252 15
Canada 205 242 18
Japan 157* – –
Mexico 103* – –
Brazil 59 74 25
China 42 49 17
* For Mexico and Japan 2006
Source: CIAA (details available on request)
Recommendations: Policies should focus on improving the overall labour productivity of the EU food and drink sector as part of the EU manufacturing industry, by addressing areas that affect the exposure to global best practices.

CIA
A C
ompe
titiv
enes
s Re
port
201
0
10
2.3 Export market share
Source: Eurostat Comext, WITS Database, 2008
Fig. 5 Evolution of various countries share in world food and drink exports (% in total)
2008
2007
2006
2005
2004
2003
2002
2001
2000
1999
1998
0% 10% 20% 30% 40% 50% 60% 70% 80% 90% 100%
EU-27
US
Brazil
China
Canada
Australia
new Zealand
Others
Fig. 4 EU food and drink sector export market share 1998-2008
Source: Eurostat Comext, WITS Database, 2008
EU-27
US
Brazil
China
Canada
Australia
new Zealand
Others
24.6%
1998
14.9%
4.9%4.6%
5.0%3.9%2.9%
39.1%
17.5%
200811.0%
7.3%
6.0%
3.9%3.0%2.9%
48.4%
EU still first exporter, but with a decreasing export market share
Facts: The EU is still the world’s largest food and drink exporter although the share of EU exports to world markets fell from 24.6% to 17.5% in the ten-year period from 1998 to 2008. This followed the general trend that, with the exception of new Zealand, the export market share of developed countries decreased and that of emerging economies grew.
Recommendations: An improved trade environment is required if the EU food and drink industry is to maintain its global share and take advantage of expanding emerging markets. This environment would include measures to prevent and remove regulatory barriers and the conclusion of well-balanced free trade agreements, both multilateral and bilateral.
CIA
A C
ompe
titiv
enes
s Re
port
201
0
11
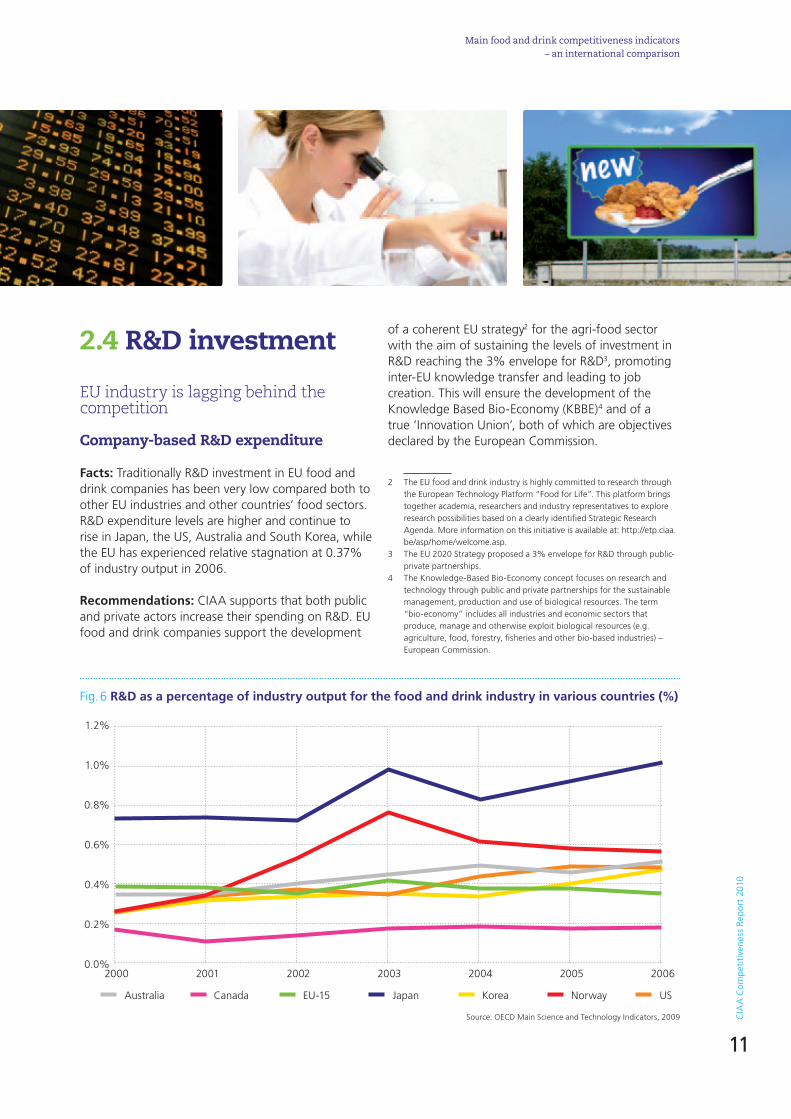
2.4 R&D investment
EU industry is lagging behind the competition
Company-based R&D expenditure
Facts: Traditionally R&D investment in EU food and drink companies has been very low compared both to other EU industries and other countries’ food sectors. R&D expenditure levels are higher and continue to rise in Japan, the US, Australia and South Korea, while the EU has experienced relative stagnation at 0.37% of industry output in 2006.
Recommendations: CIAA supports that both public and private actors increase their spending on R&D. EU food and drink companies support the development
Fig. 6 R&D as a percentage of industry output for the food and drink industry in various countries (%)
Source: OECD Main Science and Technology Indicators, 2009
1.2%
1.0%
0.8%
0.6%
0.4%
0.2%
0.0%2000 2001 2002 2003 2004 2005 2006
Australia Canada EU-15 Japan Korea norway US
of a coherent EU strategy2 for the agri-food sector with the aim of sustaining the levels of investment in R&D reaching the 3% envelope for R&D3, promoting inter-EU knowledge transfer and leading to job creation. This will ensure the development of the Knowledge Based Bio-Economy (KBBE)4 and of a true ‘Innovation Union’, both of which are objectives declared by the European Commission.
2 The EU food and drink industry is highly committed to research through the European Technology Platform “Food for Life”. This platform brings together academia, researchers and industry representatives to explore research possibilities based on a clearly identified Strategic Research Agenda. More information on this initiative is available at: http://etp.ciaa.be/asp/home/welcome.asp.
3 The EU 2020 Strategy proposed a 3% envelope for R&D through public-private partnerships.
4 The Knowledge-Based Bio-Economy concept focuses on research and technology through public and private partnerships for the sustainable management, production and use of biological resources. The term “bio-economy” includes all industries and economic sectors that produce, manage and otherwise exploit biological resources (e.g. agriculture, food, forestry, fisheries and other bio-based industries) – European Commission.
main food and drink competitiveness indicators – an international comparison

CIA
A C
ompe
titiv
enes
s Re
port
201
0
12
CIA
A C
ompe
titiv
enes
s Re
port
201
0
12
Polic
y ar
eaH
LG R
eco
mm
end
atio
nD
G/E
uro
pea
n In
stit
uti
on
res
po
nsi
ble
Stat
us
July
201
0
Gen
era
lN
° 1: E
nsur
e a
holis
tic a
ppro
ach
for
the
Euro
pean
ag
ri-fo
od in
dust
ryD
G E
nter
pris
eO
ngoi
ng
• A
t C
omm
issi
on le
vel -
con
tinuo
us•
At
stak
ehol
der
leve
l, in
c. C
IAA
: “A
hol
istic
app
roac
h to
foo
d po
licy
– co
nsum
er in
form
atio
n: a
ca
se s
tudy
” –
to b
e pu
blis
hed
by e
nd 2
010
aG
ricu
ltu
ral
poli
cyN
° 2: C
ontin
ued
supp
ort
for
an a
mbi
tious
dev
elop
-m
ent
of t
he C
omm
on A
gric
ultu
ral P
olic
y (C
AP)
DG
Agr
icul
ture
& R
ural
Dev
elop
men
tO
ngoi
ng
• St
akeh
olde
rs c
onsu
ltatio
n an
d C
onfe
renc
e on
the
fut
ure
of t
he C
AP
post
-201
3 •
Com
mis
sion
Com
mun
icat
ion
on C
AP
post
-201
3 du
e to
be
rele
ased
in n
ovem
ber
2010
N° 3
: Suf
ficie
nt s
uppl
y of
raw
mat
eria
ls
at c
ompe
titiv
e pr
ices
DG
Agr
icul
ture
& R
ural
Dev
elop
men
tD
G H
ealth
& C
onsu
mer
sO
ngoi
ng
• Se
vera
l act
ions
with
FFC
(Foo
d an
d Fe
ed C
oalit
ion)
as
rega
rds
to G
MO
s•
new
Com
mis
sion
GM
O p
olic
y pr
opos
ed in
Jul
y 20
10, w
hich
incl
udes
gui
delin
es f
or c
ultiv
atio
n•
Stak
ehol
ders
wor
k to
war
ds t
he in
clus
ion
of f
ood
in t
he s
cope
of
the
impl
emen
ting
mea
sure
s to
ad
dres
s th
e is
sue
of a
sync
hron
ous
auth
oris
atio
ns f
or G
MO
s in
fee
d
envi
ron
men
tal
poli
cyN
° 4: D
esig
n an
env
ironm
enta
l and
sus
tain
able
in
dust
rial p
olic
yD
G E
nter
pris
eO
ngoi
ng•
Roun
d Ta
ble
esta
blis
hed
for
2009
-201
1•
EC s
tudy
on
eco
-labe
l crit
eria
for
foo
d by
201
1
N° 5
: Pro
mot
e en
ergy
effi
cien
cy f
or t
he E
urop
ean
agri-
food
indu
stry
DG
Ent
erpr
ise
DG
Res
earc
hO
ngoi
ng
• Im
plem
enta
tion
2007
-201
3•
Entr
epre
neur
ship
and
Inno
vatio
n Pr
ogra
mm
e as
par
t of
the
Com
petit
iven
ess
and
Inno
vatio
n Fr
amew
ork
Prog
ram
me
inte
rna
l m
ark
et
for
foo
d
N° 6
: Hig
h qu
alit
y an
d co
mpr
ehen
sive
impa
ct
asse
ssm
ents
Secr
etar
iat
Gen
eral
Euro
pean
Foo
d Sa
fety
Aut
horit
yC
ontin
uous
N° 7
: Har
mon
ised
inte
rpre
tatio
n an
d im
plem
enta
tion
of E
urop
ean
food
legi
slat
ion
DG
Hea
lth &
Con
sum
ers
Ong
oing
N° 8
: Effi
cien
t au
thor
isat
ion
proc
edur
es f
or n
ovel
fo
ods
DG
Hea
lth &
Con
sum
ers
Euro
pean
Foo
d Sa
fety
Aut
horit
yO
ngoi
ng
• Fo
llow
-up
by m
eans
of
the
Euro
pean
Foo
d Sa
fety
Aut
horit
y (E
FSA
) Ann
ual R
epor
t•
Ong
oing
con
cilia
tion
30 n
ovem
ber,
outc
ome
not
yet
clea
r
N° 9
: Enh
ance
the
Eur
opea
n in
cide
nt
man
agem
ent
syst
emD
G H
ealth
& C
onsu
mer
sO
ngoi
ng•
2010
con
sulta
tion
on t
he f
unct
ioni
ng o
f th
e Ra
pid
Ale
rt S
yste
m fo
r Fo
od a
nd F
eed
(RA
SFF)
• C
IAA
con
trib
utio
n to
the
con
sulta
tion
ope
rati
on
s in
th
e fo
od
ch
ain
N° 1
0: B
ette
r su
ppor
t fo
r SM
EsD
G E
nter
pris
eO
ngoi
ng•
Com
mis
sion
rev
iew
of
the
impl
emen
tatio
n of
the
Sm
all B
usin
ess
Act
(SBA
) (Ju
ne 2
010)
• Fo
llow
-up
by m
eans
of t
he Y
early
Act
ivity
Rep
ort o
f the
Exe
cutiv
e A
genc
y fo
r Com
petit
iven
ess
and
Inno
vatio
n (E
AC
I) a
wel
l as
by S
MEs
feed
back
mec
hani
sm e
xist
ing
with
in E
nter
pris
e Eu
rope
net
wor
k.
N° 1
1: B
ette
r ac
cess
to
finan
ceD
G B
udge
tEu
rope
an In
vest
men
t Ba
nk (E
IB)
Ong
oing
be
twee
n
2007
-201
3
• EI
B se
t up
3 fi
nanc
ing
inst
rum
ents
to
be f
urth
er im
plem
ente
d: lo
an s
chem
e, r
isk
shar
ing
an
d m
ezza
nine
fina
ncin
g•
Mic
rocr
edit:
est
ablis
hing
JA
SMIn
E m
icro
cred
it fa
cilit
y (f
or t
he n
on-b
ank
sect
or)
N° 1
2: S
impl
ify
acce
ss t
o fu
ndin
g re
sear
ch
prog
ram
mes
DG
Res
earc
hn
atio
nal T
echn
olog
y Pl
atfo
rms
Ong
oing
N° 1
3: F
acili
tate
acc
ess
of a
gri-f
ood
SMEs
to
glob
al
mar
kets
DG
Tra
deD
G E
nter
pris
eO
ngoi
ng•
Part
ially
ach
ieve
d th
roug
h th
e Sm
all B
usin
ess
Act
and
the
Com
mis
sion
Mar
ket
Acc
ess
Adv
isor
y C
omm
ittee
reg
ular
mee
tings
N° 1
4: S
uppo
rt e
ffec
tive
inte
grat
ion
of S
MEs
in t
he
food
cha
inD
G E
nter
pris
eO
ngoi
ng•
Part
ially
ach
ieve
d th
roug
h th
e Sm
all B
usin
ess
Act
N° 1
5: E
nsur
e pr
oper
and
opt
imal
fun
ctio
ning
of
the
foo
d ch
ain
DG
Ent
erpr
ise
Ong
oing
• C
omm
issi
on C
omm
unic
atio
n C
OM
(20
09)5
91 p
ublis
hed
in O
ctob
er 2
009
• H
igh
Leve
l For
um o
n th
e be
tter
fun
ctio
ning
foo
d su
pply
cha
in la
unch
ed in
Jul
y 20
10. F
irst
mee
ting
of t
he F
orum
exp
ecte
d to
con
vene
in n
ovem
ber
2010
• C
omm
issi
on f
ood
pric
e m
onito
ring
tool
con
tinuo
us u
pdat
e (la
st M
ay 2
010)
N° 1
6: S
tudy
the
eff
ect
of P
rivat
e La
bels
DG
Ent
erpr
ise
Ong
oing
• St
udy
resu
lts e
xpec
ted
Sum
mer
201
0 (d
elay
ed)
N° 1
7: In
crea
se a
ttra
ctiv
enes
s of
Eur
opea
n ag
ro-f
ood
indu
stry
to
wor
kers
DG
Em
ploy
men
tSo
cial
Aff
airs
& E
qual
Opp
ortu
nitie
sO
ngoi
ng•
Com
mis
sion
pro
gram
mes
for
you
ng e
ntre
pren
eurs
and
wor
kers
• C
omm
issi
on d
isse
min
atio
n of
the
res
ults
of
the
netw
ork
for
exce
llenc
e
N° 1
8: E
stab
lish
a so
cial
dia
logu
e in
the
agr
o-f
ood
indu
stry
DG
Em
ploy
men
t, S
ocia
l Aff
airs
& E
qual
O
ppor
tuni
ties,
Soc
ial P
artn
ers
Ong
oing
• A
firs
t m
eetin
g to
ok p
lace
ahe
ad o
f es
tabl
ishi
ng t
he s
ocia
l dia
logu
e•
Furt
her
mee
tings
to
be c
onve
ned
in 2
010
N° 1
9: E
ncou
rage
ICTs
use
in t
he a
gri-f
ood
indu
stry
DG
Res
earc
hO
ngoi
ng•
eBus
ines
s Su
ppor
t n
etw
ork
mee
tings
to
be d
isse
min
ated
by
end
of 2
010
N° 2
0: P
rom
ote
clar
ity
and
cohe
renc
e of
info
rmat
ion
to c
onsu
mer
sD
G H
ealth
& C
onsu
mer
sO
ngoi
ng
• Fo
od In
form
atio
n to
Con
sum
ers
Regu
latio
n un
der
revi
sion
: 1st r
eadi
ng in
the
Eur
opea
n Pa
rliam
ent
Plen
ary
was
on
16 J
une
2010
, with
2nd
rea
ding
exp
ecte
d du
ring
2011
rese
arc
h a
nd
in
no
vati
on
N° 2
1: E
nhan
ce r
esea
rch
and
inno
vatio
n ef
fort
sD
G R
esea
rch
Ong
oing
• In
the
cur
rent
7th F
ram
ewor
k Pr
ogra
mm
e (2
007
-201
3)•
New
CIA
A d
irect
invo
lvem
ent
in t
wo
proj
ects
(nuA
ge a
nd P
rom
ethe
us)
N° 2
2: B
ette
r us
e th
e in
stru
men
ts a
vaila
ble
in r
esea
rch
and
inno
vatio
n po
licy
DG
Res
earc
h, E
urop
ean
Tech
nolo
gy
Plat
form
Foo
d fo
r Li
fe, E
urop
ean
Inst
itute
of
Inno
vatio
n &
Tec
hnol
ogy
Ong
oing
• Th
e fir
st K
now
ledg
e an
d In
form
atio
n C
omm
uniti
es (K
ICs)
pub
lishe
d: C
limat
e, IC
T La
bs•
Com
mis
sion
to
refle
ct o
n an
ann
ual b
asis
on
the
Wor
k Pr
ogra
mm
e of
the
DG
Res
earc
h•
ETP
refle
cted
in t
he D
G r
esea
rch
wor
k pr
ogra
mm
e
N° 2
3: S
uppo
rt d
evel
opm
ent
of n
ew fo
od t
echn
olog
ies
DG
Res
earc
hO
ngoi
ng20
09-2
013
tra
de
N° 2
4: P
ursu
e th
e ob
ject
ive
of r
each
ing
a W
TO
bala
nced
agr
eem
ent
DG
s Tr
ade/
Ente
rpris
e/A
gric
ultu
re &
Ru
ral D
evel
opm
ent
Ong
oing
Acc
ordi
ng t
o th
e W
TO n
egot
iatio
ns r
oadm
ap:
• C
omm
issi
on 6
th R
epor
t on
Tra
de R
estr
ictiv
e M
easu
res,
incl
udin
g m
easu
res
affe
ctin
g fo
od t
rade
, pu
blis
hed
in M
ay 2
010.
N° 2
5: S
eize
mar
ket
oppo
rtun
ities
by
mea
ns o
f bi
late
ral t
rade
neg
otia
tions
DG
s Tr
ade/
Ente
rpris
e/A
gric
ultu
re &
Ru
ral D
evel
opm
ent
Ong
oing
• A
nnua
l mee
ting
with
the
agr
i-foo
d in
dust
ry s
take
hold
ers
• C
omm
issi
on a
nnua
l bila
tera
l mee
tings
with
thi
rd c
ount
ries
on S
anita
ry a
nd P
hyto
sani
tary
(SPS
) m
easu
res
and
Tech
nica
l Bar
riers
to
Trad
e (T
BT)
N° 2
6: B
ette
r pr
omot
e in
tern
atio
nal t
rade
sta
ndar
ds
DG
Tra
deO
ngoi
ng
Com
mis
sion
act
ions
tow
ards
Afr
ican
, Car
ibbe
an a
nd P
acifi
c (A
CP)
cou
ntrie
s:•
To p
rom
ote
lega
l fra
mew
ork
for
harm
onis
ed in
tern
atio
nal s
tand
ards
and
• To
pro
vide
a h
ighe
r de
gree
of
assi
stan
ce t
hrou
gh c
apac
ity
build
ing
N° 2
7: E
nhan
ce r
espe
ct o
f in
telle
ctua
l pro
pert
y rig
hts
by t
hird
cou
ntrie
sD
G E
nter
pris
eO
ngoi
ng•
Com
mis
sion
to
esta
blis
h m
arke
t su
rvei
llanc
e or
gani
sms
by 2
010
• Se
t up
nat
iona
l org
anis
atio
ns t
o re
port
on
coun
terf
eite
d pr
oduc
ts b
y 20
11
N° 2
8: D
efine
bet
ter
the
posi
tion
of t
he E
urop
ean
agri-
food
indu
stry
in t
he g
loba
l mar
ket
DG
Tra
de &
DG
Agr
icul
ture
Ong
oing
• Im
prov
emen
t of
the
EU
pro
mot
ion
regi
me
will
be
part
of
the
Com
mis
sion
Com
mun
icat
ion
on t
he
CA
P po
st-2
013
• C
omm
issi
on t
o la
unch
SW
OT
anal
ysis
by
end
2010
. Res
ults
to
be m
ade
avai
labl
e by
201
1
N° 2
9: S
impl
ify
cust
oms
form
aliti
esD
G T
axat
ion
& C
usto
ms
Uni
onO
ngoi
ng•
Euro
pean
Com
mis
sion
to
defin
e a
stra
tegy
on
sing
le w
indo
w c
omm
unic
atio
n
N° 3
0: P
rom
ote
a se
ctor
-spe
cific
app
roac
h fo
r th
e ru
les
of o
rigin
DG
Tax
atio
n &
Cus
tom
s U
nion
Ong
oing
• Eu
rope
an C
omm
issi
on t
o in
clud
e th
is s
ecto
r-sp
ecifi
c ap
proa
ch o
n ru
les
of o
rigin
in t
he
fort
hcom
ing
refo
rm o
f ru
les
of o
rigin
to
be a
pplie
d in
the
con
text
of
the
Gen
eral
ised
Sys
tem
of
Pref
eren
ces
– by
201
0
Sour
ce: C
IAA
ana
lysi
s of
HLG
Rec
omm
enda
tion
s (D
G E
nter
pris
e, H
LG 0
06
and
HLG
007
)
(htt
p://e
c.eu
ropa
.eu
/ent
erpr
ise/
new
sro
om/c
f/do
cum
ent.
cfm
?act
ion
=di
spla
y&do
c_id
=26
05&
user
serv
ice_
id=1
)
Hig
h L
evel
Gro
up
on t
he
Com
peti
tive
nes
s of
th
e A
gro-
Food
Indu
stry
HLG
rec
omm
enda
tion
s sc
oreb
oard
In
crea
sin
g th
e C
omp
etit
iven
ess
of t
he
Agr
o-Fo
od in
dust
ry
th
e 20
08 C
omm
issi
on-d
rive
n H
igh
Lev
el G
rou
p (H
LG) o
n t
he
Com
pet
itiv
enes
s of
th
e A
gro
-Foo
d I
nd
ust
ry p
rese
nte
d in
Jun
e 20
09 a
set
of
30
Rec
omm
end
atio
ns
aim
ed a
t in
crea
sin
g th
e in
du
stry
’s c
omp
etit
iven
ess.
th
is s
ecti
on c
har
ts t
he
imp
lem
enta
tion
of
the
HLG
Rec
omm
end
atio
ns
to d
ate.
CIA
A
wil
l con
tin
ue
to m
onit
or t
he
HLG
Rec
omm
end
atio
ns
imp
lem
enta
tion
pro
cess
.
CIA
A b
elie
ves
that
fur
ther
con
sist
ency
is n
eede
d be
twee
n po
licie
s in
all
area
s w
hich
impa
ct o
n th
e fo
od a
nd d
rink
indu
stry
, inc
ludi
ng r
esea
rch
and
inno
vatio
n, c
omm
erci
al
law
, agr
icul
ture
, foo
d sa
fety
, env
ironm
ent
and
trad
e. T
his
is o
f pa
ram
ount
impo
rtan
ce if
the
EU
is t
o ai
m f
or a
n in
tegr
ated
foo
d po
licy.
In li
ne w
ith t
his
appr
oach
, the
se H
LG
Reco
mm
enda
tions
set
out
in t
he t
able
bel
ow w
ill b
e ex
plor
ed in
the
nex
t su
bsec
tions
of
this
rep
ort.
The
foo
d an
d dr
ink
indu
stry
is s
tron
gly
com
mitt
ed t
o co
ntrib
utin
g to
the
im
plem
enta
tion
of t
he H
LG R
ecom
men
datio
ns a
long
with
the
res
pons
ible
Inst
itutio
ns.
Tabl
e 2
Hig
h L
evel
Gro
up
rec
om
men
dat
ion
s im
ple
men
tati
on
(Red
= t
op C
IAA
prio
ritie
s)
CIA
A C
ompe
titiv
enes
s Re
port
201
0
13
CIA
A C
ompe
titiv
enes
s Re
port
201
0
13
Polic
y ar
eaH
LG R
eco
mm
end
atio
nD
G/E
uro
pea
n In
stit
uti
on
res
po
nsi
ble
Stat
us
July
201
0
Gen
era
lN
° 1: E
nsur
e a
holis
tic a
ppro
ach
for
the
Euro
pean
ag
ri-fo
od in
dust
ryD
G E
nter
pris
eO
ngoi
ng
• A
t C
omm
issi
on le
vel -
con
tinuo
us•
At
stak
ehol
der
leve
l, in
c. C
IAA
: “A
hol
istic
app
roac
h to
foo
d po
licy
– co
nsum
er in
form
atio
n: a
ca
se s
tudy
” –
to b
e pu
blis
hed
by e
nd 2
010
aG
ricu
ltu
ral
poli
cyN
° 2: C
ontin
ued
supp
ort
for
an a
mbi
tious
dev
elop
-m
ent
of t
he C
omm
on A
gric
ultu
ral P
olic
y (C
AP)
DG
Agr
icul
ture
& R
ural
Dev
elop
men
tO
ngoi
ng
• St
akeh
olde
rs c
onsu
ltatio
n an
d C
onfe
renc
e on
the
fut
ure
of t
he C
AP
post
-201
3 •
Com
mis
sion
Com
mun
icat
ion
on C
AP
post
-201
3 du
e to
be
rele
ased
in n
ovem
ber
2010
N° 3
: Suf
ficie
nt s
uppl
y of
raw
mat
eria
ls
at c
ompe
titiv
e pr
ices
DG
Agr
icul
ture
& R
ural
Dev
elop
men
tD
G H
ealth
& C
onsu
mer
sO
ngoi
ng
• Se
vera
l act
ions
with
FFC
(Foo
d an
d Fe
ed C
oalit
ion)
as
rega
rds
to G
MO
s•
new
Com
mis
sion
GM
O p
olic
y pr
opos
ed in
Jul
y 20
10, w
hich
incl
udes
gui
delin
es f
or c
ultiv
atio
n•
Stak
ehol
ders
wor
k to
war
ds t
he in
clus
ion
of f
ood
in t
he s
cope
of
the
impl
emen
ting
mea
sure
s to
ad
dres
s th
e is
sue
of a
sync
hron
ous
auth
oris
atio
ns f
or G
MO
s in
fee
d
envi
ron
men
tal
poli
cyN
° 4: D
esig
n an
env
ironm
enta
l and
sus
tain
able
in
dust
rial p
olic
yD
G E
nter
pris
eO
ngoi
ng•
Roun
d Ta
ble
esta
blis
hed
for
2009
-201
1•
EC s
tudy
on
eco
-labe
l crit
eria
for
foo
d by
201
1
N° 5
: Pro
mot
e en
ergy
effi
cien
cy f
or t
he E
urop
ean
agri-
food
indu
stry
DG
Ent
erpr
ise
DG
Res
earc
hO
ngoi
ng
• Im
plem
enta
tion
2007
-201
3•
Entr
epre
neur
ship
and
Inno
vatio
n Pr
ogra
mm
e as
par
t of
the
Com
petit
iven
ess
and
Inno
vatio
n Fr
amew
ork
Prog
ram
me
inte
rna
l m
ark
et
for
foo
d
N° 6
: Hig
h qu
alit
y an
d co
mpr
ehen
sive
impa
ct
asse
ssm
ents
Secr
etar
iat
Gen
eral
Euro
pean
Foo
d Sa
fety
Aut
horit
yC
ontin
uous
N° 7
: Har
mon
ised
inte
rpre
tatio
n an
d im
plem
enta
tion
of E
urop
ean
food
legi
slat
ion
DG
Hea
lth &
Con
sum
ers
Ong
oing
N° 8
: Effi
cien
t au
thor
isat
ion
proc
edur
es f
or n
ovel
fo
ods
DG
Hea
lth &
Con
sum
ers
Euro
pean
Foo
d Sa
fety
Aut
horit
yO
ngoi
ng
• Fo
llow
-up
by m
eans
of
the
Euro
pean
Foo
d Sa
fety
Aut
horit
y (E
FSA
) Ann
ual R
epor
t•
Ong
oing
con
cilia
tion
30 n
ovem
ber,
outc
ome
not
yet
clea
r
N° 9
: Enh
ance
the
Eur
opea
n in
cide
nt
man
agem
ent
syst
emD
G H
ealth
& C
onsu
mer
sO
ngoi
ng•
2010
con
sulta
tion
on t
he f
unct
ioni
ng o
f th
e Ra
pid
Ale
rt S
yste
m fo
r Fo
od a
nd F
eed
(RA
SFF)
• C
IAA
con
trib
utio
n to
the
con
sulta
tion
ope
rati
on
s in
th
e fo
od
ch
ain
N° 1
0: B
ette
r su
ppor
t fo
r SM
EsD
G E
nter
pris
eO
ngoi
ng•
Com
mis
sion
rev
iew
of
the
impl
emen
tatio
n of
the
Sm
all B
usin
ess
Act
(SBA
) (Ju
ne 2
010)
• Fo
llow
-up
by m
eans
of t
he Y
early
Act
ivity
Rep
ort o
f the
Exe
cutiv
e A
genc
y fo
r Com
petit
iven
ess
and
Inno
vatio
n (E
AC
I) a
wel
l as
by S
MEs
feed
back
mec
hani
sm e
xist
ing
with
in E
nter
pris
e Eu
rope
net
wor
k.
N° 1
1: B
ette
r ac
cess
to
finan
ceD
G B
udge
tEu
rope
an In
vest
men
t Ba
nk (E
IB)
Ong
oing
be
twee
n
2007
-201
3
• EI
B se
t up
3 fi
nanc
ing
inst
rum
ents
to
be f
urth
er im
plem
ente
d: lo
an s
chem
e, r
isk
shar
ing
an
d m
ezza
nine
fina
ncin
g•
Mic
rocr
edit:
est
ablis
hing
JA
SMIn
E m
icro
cred
it fa
cilit
y (f
or t
he n
on-b
ank
sect
or)
N° 1
2: S
impl
ify
acce
ss t
o fu
ndin
g re
sear
ch
prog
ram
mes
DG
Res
earc
hn
atio
nal T
echn
olog
y Pl
atfo
rms
Ong
oing
N° 1
3: F
acili
tate
acc
ess
of a
gri-f
ood
SMEs
to
glob
al
mar
kets
DG
Tra
deD
G E
nter
pris
eO
ngoi
ng•
Part
ially
ach
ieve
d th
roug
h th
e Sm
all B
usin
ess
Act
and
the
Com
mis
sion
Mar
ket
Acc
ess
Adv
isor
y C
omm
ittee
reg
ular
mee
tings
N° 1
4: S
uppo
rt e
ffec
tive
inte
grat
ion
of S
MEs
in t
he
food
cha
inD
G E
nter
pris
eO
ngoi
ng•
Part
ially
ach
ieve
d th
roug
h th
e Sm
all B
usin
ess
Act
N° 1
5: E
nsur
e pr
oper
and
opt
imal
fun
ctio
ning
of
the
foo
d ch
ain
DG
Ent
erpr
ise
Ong
oing
• C
omm
issi
on C
omm
unic
atio
n C
OM
(20
09)5
91 p
ublis
hed
in O
ctob
er 2
009
• H
igh
Leve
l For
um o
n th
e be
tter
fun
ctio
ning
foo
d su
pply
cha
in la
unch
ed in
Jul
y 20
10. F
irst
mee
ting
of t
he F
orum
exp
ecte
d to
con
vene
in n
ovem
ber
2010
• C
omm
issi
on f
ood
pric
e m
onito
ring
tool
con
tinuo
us u
pdat
e (la
st M
ay 2
010)
N° 1
6: S
tudy
the
eff
ect
of P
rivat
e La
bels
DG
Ent
erpr
ise
Ong
oing
• St
udy
resu
lts e
xpec
ted
Sum
mer
201
0 (d
elay
ed)
N° 1
7: In
crea
se a
ttra
ctiv
enes
s of
Eur
opea
n ag
ro-f
ood
indu
stry
to
wor
kers
DG
Em
ploy
men
tSo
cial
Aff
airs
& E
qual
Opp
ortu
nitie
sO
ngoi
ng•
Com
mis
sion
pro
gram
mes
for
you
ng e
ntre
pren
eurs
and
wor
kers
• C
omm
issi
on d
isse
min
atio
n of
the
res
ults
of
the
netw
ork
for
exce
llenc
e
N° 1
8: E
stab
lish
a so
cial
dia
logu
e in
the
agr
o-f
ood
indu
stry
DG
Em
ploy
men
t, S
ocia
l Aff
airs
& E
qual
O
ppor
tuni
ties,
Soc
ial P
artn
ers
Ong
oing
• A
firs
t m
eetin
g to
ok p
lace
ahe
ad o
f es
tabl
ishi
ng t
he s
ocia
l dia
logu
e•
Furt
her
mee
tings
to
be c
onve
ned
in 2
010
N° 1
9: E
ncou
rage
ICTs
use
in t
he a
gri-f
ood
indu
stry
DG
Res
earc
hO
ngoi
ng•
eBus
ines
s Su
ppor
t n
etw
ork
mee
tings
to
be d
isse
min
ated
by
end
of 2
010
N° 2
0: P
rom
ote
clar
ity
and
cohe
renc
e of
info
rmat
ion
to c
onsu
mer
sD
G H
ealth
& C
onsu
mer
sO
ngoi
ng
• Fo
od In
form
atio
n to
Con
sum
ers
Regu
latio
n un
der
revi
sion
: 1st r
eadi
ng in
the
Eur
opea
n Pa
rliam
ent
Plen
ary
was
on
16 J
une
2010
, with
2nd
rea
ding
exp
ecte
d du
ring
2011
rese
arc
h a
nd
in
no
vati
on
N° 2
1: E
nhan
ce r
esea
rch
and
inno
vatio
n ef
fort
sD
G R
esea
rch
Ong
oing
• In
the
cur
rent
7th F
ram
ewor
k Pr
ogra
mm
e (2
007
-201
3)•
New
CIA
A d
irect
invo
lvem
ent
in t
wo
proj
ects
(nuA
ge a
nd P
rom
ethe
us)
N° 2
2: B
ette
r us
e th
e in
stru
men
ts a
vaila
ble
in r
esea
rch
and
inno
vatio
n po
licy
DG
Res
earc
h, E
urop
ean
Tech
nolo
gy
Plat
form
Foo
d fo
r Li
fe, E
urop
ean
Inst
itute
of
Inno
vatio
n &
Tec
hnol
ogy
Ong
oing
• Th
e fir
st K
now
ledg
e an
d In
form
atio
n C
omm
uniti
es (K
ICs)
pub
lishe
d: C
limat
e, IC
T La
bs•
Com
mis
sion
to
refle
ct o
n an
ann
ual b
asis
on
the
Wor
k Pr
ogra
mm
e of
the
DG
Res
earc
h•
ETP
refle
cted
in t
he D
G r
esea
rch
wor
k pr
ogra
mm
e
N° 2
3: S
uppo
rt d
evel
opm
ent
of n
ew fo
od t
echn
olog
ies
DG
Res
earc
hO
ngoi
ng20
09-2
013
tra
de
N° 2
4: P
ursu
e th
e ob
ject
ive
of r
each
ing
a W
TO
bala
nced
agr
eem
ent
DG
s Tr
ade/
Ente
rpris
e/A
gric
ultu
re &
Ru
ral D
evel
opm
ent
Ong
oing
Acc
ordi
ng t
o th
e W
TO n
egot
iatio
ns r
oadm
ap:
• C
omm
issi
on 6
th R
epor
t on
Tra
de R
estr
ictiv
e M
easu
res,
incl
udin
g m
easu
res
affe
ctin
g fo
od t
rade
, pu
blis
hed
in M
ay 2
010.
N° 2
5: S
eize
mar
ket
oppo
rtun
ities
by
mea
ns o
f bi
late
ral t
rade
neg
otia
tions
DG
s Tr
ade/
Ente
rpris
e/A
gric
ultu
re &
Ru
ral D
evel
opm
ent
Ong
oing
• A
nnua
l mee
ting
with
the
agr
i-foo
d in
dust
ry s
take
hold
ers
• C
omm
issi
on a
nnua
l bila
tera
l mee
tings
with
thi
rd c
ount
ries
on S
anita
ry a
nd P
hyto
sani
tary
(SPS
) m
easu
res
and
Tech
nica
l Bar
riers
to
Trad
e (T
BT)
N° 2
6: B
ette
r pr
omot
e in
tern
atio
nal t
rade
sta
ndar
ds
DG
Tra
deO
ngoi
ng
Com
mis
sion
act
ions
tow
ards
Afr
ican
, Car
ibbe
an a
nd P
acifi
c (A
CP)
cou
ntrie
s:•
To p
rom
ote
lega
l fra
mew
ork
for
harm
onis
ed in
tern
atio
nal s
tand
ards
and
• To
pro
vide
a h
ighe
r de
gree
of
assi
stan
ce t
hrou
gh c
apac
ity
build
ing
N° 2
7: E
nhan
ce r
espe
ct o
f in
telle
ctua
l pro
pert
y rig
hts
by t
hird
cou
ntrie
sD
G E
nter
pris
eO
ngoi
ng•
Com
mis
sion
to
esta
blis
h m
arke
t su
rvei
llanc
e or
gani
sms
by 2
010
• Se
t up
nat
iona
l org
anis
atio
ns t
o re
port
on
coun
terf
eite
d pr
oduc
ts b
y 20
11
N° 2
8: D
efine
bet
ter
the
posi
tion
of t
he E
urop
ean
agri-
food
indu
stry
in t
he g
loba
l mar
ket
DG
Tra
de &
DG
Agr
icul
ture
Ong
oing
• Im
prov
emen
t of
the
EU
pro
mot
ion
regi
me
will
be
part
of
the
Com
mis
sion
Com
mun
icat
ion
on t
he
CA
P po
st-2
013
• C
omm
issi
on t
o la
unch
SW
OT
anal
ysis
by
end
2010
. Res
ults
to
be m
ade
avai
labl
e by
201
1
N° 2
9: S
impl
ify
cust
oms
form
aliti
esD
G T
axat
ion
& C
usto
ms
Uni
onO
ngoi
ng•
Euro
pean
Com
mis
sion
to
defin
e a
stra
tegy
on
sing
le w
indo
w c
omm
unic
atio
n
N° 3
0: P
rom
ote
a se
ctor
-spe
cific
app
roac
h fo
r th
e ru
les
of o
rigin
DG
Tax
atio
n &
Cus
tom
s U
nion
Ong
oing
• Eu
rope
an C
omm
issi
on t
o in
clud
e th
is s
ecto
r-sp
ecifi
c ap
proa
ch o
n ru
les
of o
rigin
in t
he
fort
hcom
ing
refo
rm o
f ru
les
of o
rigin
to
be a
pplie
d in
the
con
text
of
the
Gen
eral
ised
Sys
tem
of
Pref
eren
ces
– by
201
0
Sour
ce: C
IAA
ana
lysi
s of
HLG
Rec
omm
enda
tion
s (D
G E
nter
pris
e, H
LG 0
06
and
HLG
007
)
(htt
p://e
c.eu
ropa
.eu
/ent
erpr
ise/
new
sro
om/c
f/do
cum
ent.
cfm
?act
ion
=di
spla
y&do
c_id
=26
05&
user
serv
ice_
id=1
)
CIA
A C
ompe
titiv
enes
s Re
port
201
0
14
Specific food and drink industry benchmarks and requirements
and innovate, and longer-term, consumer economic welfare and choice are jeopardised. While the food and drink sector is in favour of strong competition, such unfair practices can only be solved if a new focus is put on the existing instruments of competition law.
Recommendations: CIAA fully supports the launch of the Forum for the Better Functioning Food Supply Chain, and of the Platform/Working Group on Contractual Relations, which will address the issue of manifest, unfair practices. CIAA recommends looking into the effects of Private Labels and international buying alliances, which are mutually reinforcing the buying power of retailers along the food chain.
HLG Recommendations
15, 16
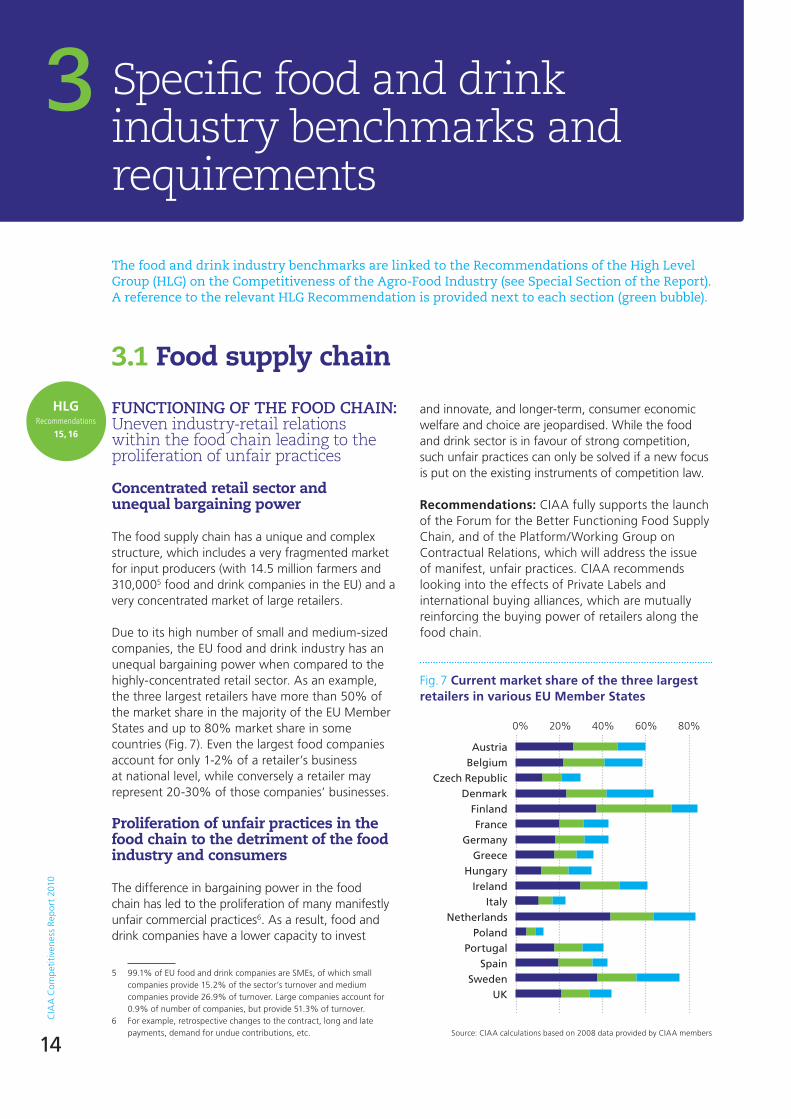
3.1 Food supply chain
FUNCTIONING OF THE FOOD CHAIN: Uneven industry-retail relations within the food chain leading to the proliferation of unfair practices
Concentrated retail sector and unequal bargaining power
The food supply chain has a unique and complex structure, which includes a very fragmented market for input producers (with 14.5 million farmers and 310,0005 food and drink companies in the EU) and a very concentrated market of large retailers.
Due to its high number of small and medium-sized companies, the EU food and drink industry has an unequal bargaining power when compared to the highly-concentrated retail sector. As an example, the three largest retailers have more than 50% of the market share in the majority of the EU Member States and up to 80% market share in some countries (Fig. 7). Even the largest food companies account for only 1-2% of a retailer’s business at national level, while conversely a retailer may represent 20-30% of those companies’ businesses.
Proliferation of unfair practices in the food chain to the detriment of the food industry and consumers
The difference in bargaining power in the food chain has led to the proliferation of many manifestly unfair commercial practices6. As a result, food and drink companies have a lower capacity to invest
5 99.1% of EU food and drink companies are SMEs, of which small companies provide 15.2% of the sector’s turnover and medium companies provide 26.9% of turnover. Large companies account for 0.9% of number of companies, but provide 51.3% of turnover.
6 For example, retrospective changes to the contract, long and late payments, demand for undue contributions, etc.
Fig. 7 Current market share of the three largest retailers in various EU Member States
Source: CIAA calculations based on 2008 data provided by CIAA members
AustriaBelgium
Czech RepublicDenmark
FinlandFrance
GermanyGreece
HungaryIreland
ItalyNetherlands
PolandPortugal
SpainSweden
UK
0% 20% 40% 60% 80%
the food and drink industry benchmarks are linked to the Recommendations of the High Level Group (HLG) on the Competitiveness of the Agro-Food Industry (see special section of the Report). A reference to the relevant HLG Recommendation is provided next to each section (green bubble).
3
CIA
A C
ompe
titiv
enes
s Re
port
201
0
15
Box 2 Summary of national initiatives for industry – retail relations: numerous initiatives, few results and fragmentation of the Internal Market
Various initiatives have been taken at national level in order to address the issues of bargaining power and unfair practices. Some countries have introduced codes of conduct, while others adopted laws banning unfair practices. However, without any visible effect of national voluntary measures, an EU solution is needed in order to solve the unfair practices problem and to ensure harmonisation within the Internal Market.
Type of measure
Measure taken in the past
Current measure
Voluntary Code
France, Hungary, Romania, UK
Belgium, Ireland, Finland, Spain
Mandatory Code
UK
Ombuds-man
Ireland (ongoing), UK (ongoing)
Legislation Czech Republic, France, Hungary, Romania, Slovak Republic, Spain
No measure but inves-tigations ongoing
Germany, The netherlands, norway, Portugal
Source: CIAA members
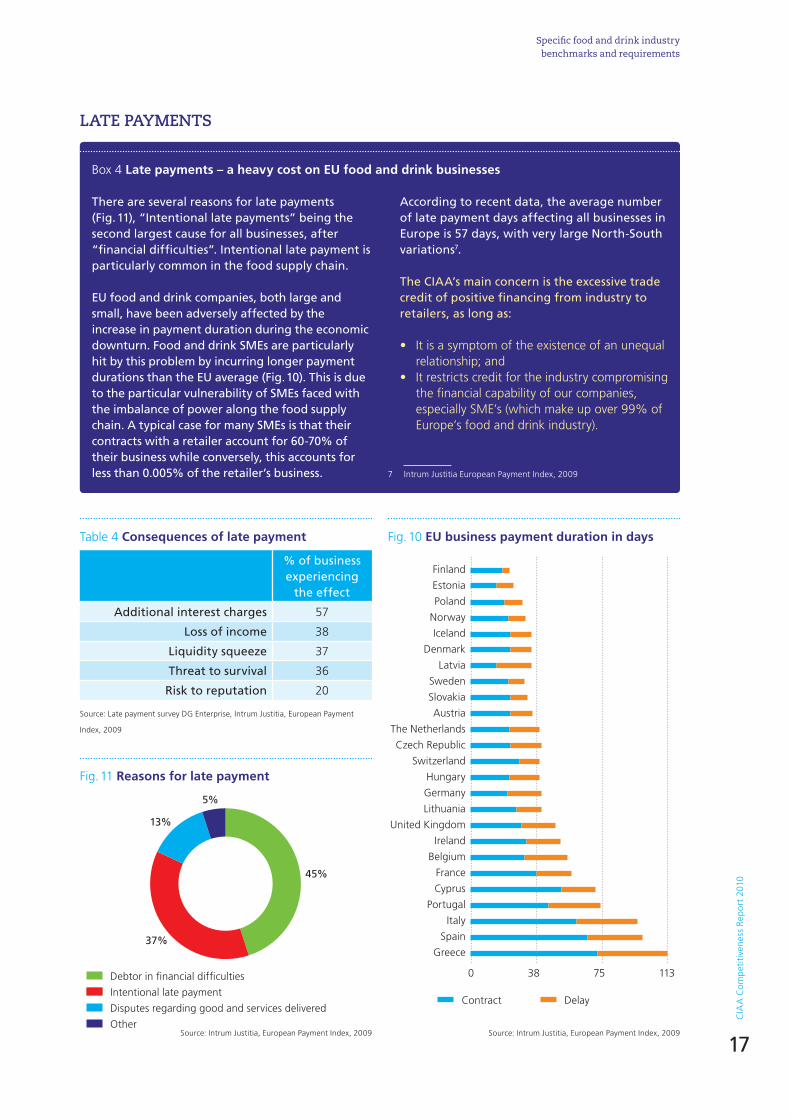
Box 3 Evolution of value added in the food chain in The Netherlands: food industry drives innovation in the food chain
The Dutch food and drink industry has the highest value added growth rate in the food chain, with a compound annual growth rate (CAGR) of 2.8%. The food and drink sector in the Netherlands is a driver for value added growth in the other sectors in the chain such as the agriculture and retail sectors. This is due to the constant level of investment in innovation and market research of the food and drink industry.
10
8
6
4
2
02002 2003 2004 2005 2006 2007
Primary production – CAGR = 0.8%
Food and drink industry – CAGR = 2.8%
Horeca – CAGR = 2.1%
Retail – CAGR = 0.1%
CAGR = Compound Annual Growth Rate
Fig. 8 Evolution of value added in the Dutch food supply chain (€ billion)
Source: LEI, Eurostat, CBS statline, Roland Berger, 2008
specific food and drink industry benchmarks and requirements

CIA
A C
ompe
titiv
enes
s Re
port
201
0
16
PRIVATE LABELS: The dual role of retailers and the misuse of Private Labels
Facts: The increase in Private Labels (PL) gives rise to a series of issues, of which the ‘dual agent’ role where the retailer is both the customer and competitor is one of the most critical. Various negative effects can be seen, such as the effect on consumer choice and on prices, which are already evident today. Intra-brand and in-store competition are also hampered, which triggers similar concerns.
Recommendations: While policy-makers are examining the impact of Private Labels, CIAA calls on them to examine in particular the dual role of retailers on competitive practices across the food chain.
Switzerland
UK
Germany
Spain
Belgium
France
The netherlands
Australia
Canada
US
Italy
Japan
2013 (f) 2007
Fig. 9 Private Labels’ market share (value) 2007-2013 (f*) (%)
Source: Planet Retail, 2009
0 5 10 15 20 25 30 35 40 45
HLG Recommendation
16
Table 3 Private Labels’ share of world’s top retailers by retail banner sale
Ran
k
Co
mp
any
Priv
ate
lab
el
shar
e 20
07 (%
)
Priv
ate
lab
el
shar
e 20
08 (%
)
Ch
ang
e 08
/07
1 Wal-Mart 38 39
2 Carrefour 35 36
3 Metro Group 17 18
4 Tesco 48 50
5 Schwartz Group 61 60
6 Seven&I* 28 30
7 Target 15 16
8 Costco 16 18
9 Auchan 25 25
10 Kroger 25 26
11 Aldi 94 89
12 Safeway 25 25
13 SuperValu 18 16
* includes consolidated operations only
Source: Planet Retail ltd www.planetretail.net, “Economic Downturn spurs on
sophisticated private labelling”, Press release, 11 February 2009
*f = forecast
CIA
A C
ompe
titiv
enes
s Re
port
201
0
17
Table 4 Consequences of late payment
% of business experiencing
the effect
Additional interest charges 57
Loss of income 38
Liquidity squeeze 37
Threat to survival 36
Risk to reputation 20
Source: Late payment survey DG Enterprise, Intrum Justitia, European Payment
Index, 2009
Finland
Estonia
Poland
norway
Iceland
Denmark
Latvia
Sweden
Slovakia
Austria
The netherlands
Czech Republic
Switzerland
Hungary
Germany
Lithuania
United Kingdom
Ireland
Belgium
France
Cyprus
Portugal
Italy
Spain
Greece
0 38 75 113
Contract Delay
Fig. 10 EU business payment duration in days
Source: Intrum Justitia, European Payment Index, 2009
Fig. 11 Reasons for late payment
Source: Intrum Justitia, European Payment Index, 2009
Debtor in financial difficulties
Intentional late payment
Disputes regarding good and services delivered
Other
45%
37%
13%
5%
LATE PAYMENTS
Box 4 Late payments – a heavy cost on EU food and drink businesses
There are several reasons for late payments (Fig. 11), “Intentional late payments” being the second largest cause for all businesses, after “financial difficulties”. Intentional late payment is particularly common in the food supply chain.
EU food and drink companies, both large and small, have been adversely affected by the increase in payment duration during the economic downturn. Food and drink SMEs are particularly hit by this problem by incurring longer payment durations than the EU average (Fig. 10). This is due to the particular vulnerability of SMEs faced with the imbalance of power along the food supply chain. A typical case for many SMEs is that their contracts with a retailer account for 60-70% of their business while conversely, this accounts for less than 0.005% of the retailer’s business.
According to recent data, the average number of late payment days affecting all businesses in Europe is 57 days, with very large North-South variations7.
The CIAA’s main concern is the excessive trade credit of positive financing from industry to retailers, as long as:
• It is a symptom of the existence of an unequal relationship; and
• It restricts credit for the industry compromising the financial capability of our companies, especially SME’s (which make up over 99% of Europe’s food and drink industry).
7 Intrum Justitia European Payment Index, 2009
specific food and drink industry benchmarks and requirements
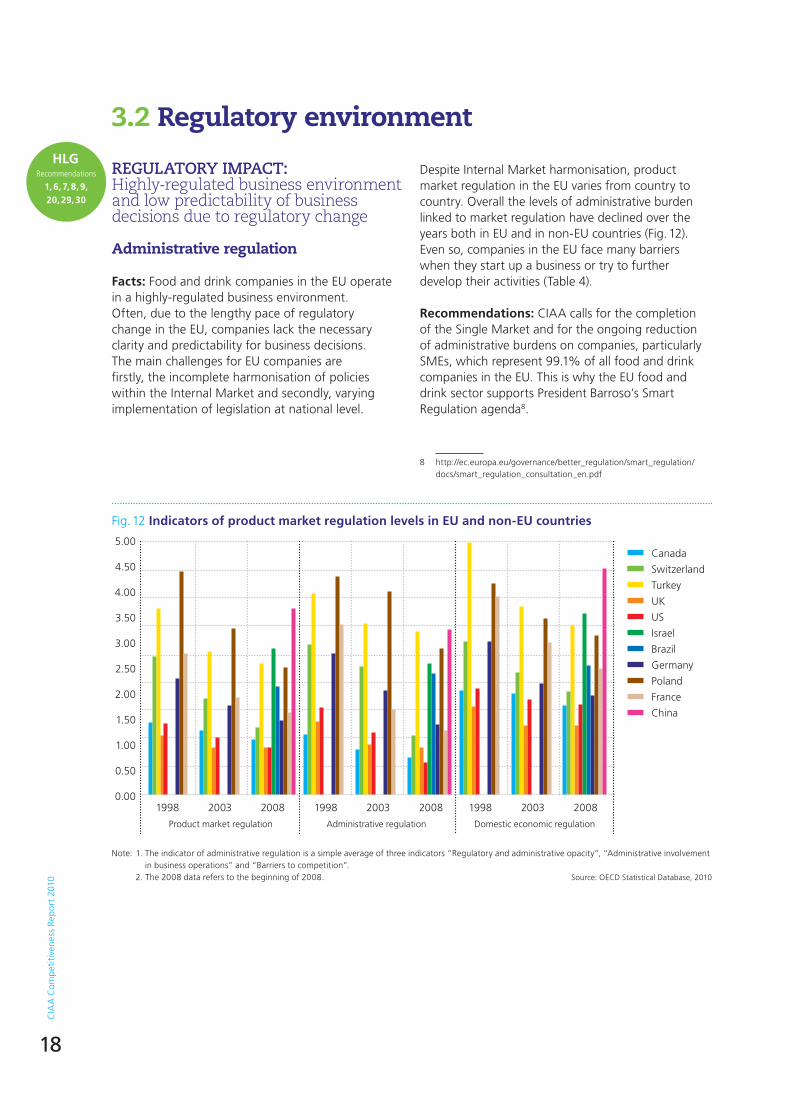
CIA
A C
ompe
titiv
enes
s Re
port
201
0
18
3.2 Regulatory environment
REGULATORY IMPACT: Highly-regulated business environment and low predictability of business decisions due to regulatory change
Administrative regulation
Facts: Food and drink companies in the EU operate in a highly-regulated business environment. Often, due to the lengthy pace of regulatory change in the EU, companies lack the necessary clarity and predictability for business decisions. The main challenges for EU companies are firstly, the incomplete harmonisation of policies within the Internal Market and secondly, varying implementation of legislation at national level.
Fig. 12 Indicators of product market regulation levels in EU and non-EU countries
note: 1. The indicator of administrative regulation is a simple average of three indicators “Regulatory and administrative opacity”, “Administrative involvement in business operations” and “Barriers to competition”.
2. The 2008 data refers to the beginning of 2008. Source: OECD Statistical Database, 2010
Canada
Switzerland
Turkey
UK
US
Israel
Brazil
Germany
Poland
France
China
5.00
4.50
4.00
3.50
3.00
2.50
2.00
1.50
1.00
0.50
0.001998 2003 2008
Product market regulation Administrative regulation Domestic economic regulation
1998 2003 2008 1998 2003 2008
Despite Internal Market harmonisation, product market regulation in the EU varies from country to country. Overall the levels of administrative burden linked to market regulation have declined over the years both in EU and in non-EU countries (Fig. 12). Even so, companies in the EU face many barriers when they start up a business or try to further develop their activities (Table 4).
Recommendations: CIAA calls for the completion of the Single Market and for the ongoing reduction of administrative burdens on companies, particularly SMEs, which represent 99.1% of all food and drink companies in the EU. This is why the EU food and drink sector supports President Barroso’s Smart Regulation agenda8.
8 http://ec.europa.eu/governance/better_regulation/smart_regulation/docs/smart_regulation_consultation_en.pdf
HLG Recommendations
1, 6, 7, 8, 9, 20, 29, 30

CIA
A C
ompe
titiv
enes
s Re
port
201
0
19
SPECIFIC REGULATORY AREAS
There are several key areas where the food and drink industries strongly support timely adoption and implementation of legislation. These include novel foods14, health claims15 and low level presence for genetically modified events16. The competitiveness of the food and drink sector today is very much dependent on the success of the regulatory process.
Novel food17 legislation
Facts: novel foods improve innovation, which are currently regulated in the EU by Regulation EC 258/97. novel foods must undergo an authorisation procedure including a safety assessment before being placed on the EU market. This legislation is currently under revision.
Recommendations: The food and drink industry calls for the swift adoption of the revision of the novel Foods legislation.
Low Level Presence (LLP)
Facts: By the end of the current Commission’s mandate in 2015, the number of GM events commercially cultivated worldwide is predicted to increase from 30 annually to over 12018.
14 http://ec.europa.eu/food/food/biotechnology/novelfood/index_en.htm 15 http://ec.europa.eu/food/food/labellingnutrition/claims/index_en.htm 16 http://ec.europa.eu/agriculture/envir/gmo/economic_impactGMOs_en.pdf 17 Foods produced with a novel ingredient or through a new process, not
used to date18 Joint Research Centre, “The global pipeline of new GM crops;
implications of asynchronous approval for international trade” (2009)
These events could potentially find their way into the European food and feed chain and might lead to the low level presence of GMO events in conventional raw material, events that have not yet been authorised by the EU. Under the current legislation, in the event of Low Level Presence (LLP), the material cannot be placed on the European market.
Recommendations: It is of utmost importance that authorities recognise that LLP cannot be completely avoided despite all preventive measures. Therefore, a technical solution must be developed to apply to both the food and feed sectors to cover GM events. The Joint Research Centre (JRC) of the European Commission has validated a testing method that the food industry acknowledges.
Box 6 Low Level Presence (LLP) of genetically modified (GM) events – a high cost for the EU industry
In a Landmark Europe study commissioned by the CIAA, the cost of LLP incidents on the basis of the practical experience of several food companies was examined. One LLP incident can cost up to € 2 million for a sizeable food manufacturer and up to € 14 million for a leading company in the primary processing sector. If retailer and consumer recalls had been necessary, the total cost of an incident could reach € 46 million.
Box 5 Main political developments in 2009 and 2010 of relevance for the competitiveness of the food and drink industry in the EU
• The 2008 Commission High Level Group (HLG) on the Competitiveness of the Agro-Food industry, which presented in 2009 a Report, a Roadmap and a list of 30 Policy Recommendations9;
• The 2009 Commission Communication on “A better functioning food supply chain in Europe” as a continuation of the work done in analysing food prices the previous year10;
9 http://ec.europa.eu/enterprise/newsroom/cf/document.cfm?action=display&doc_id=2605&userservice_id=1
10 http://ec.europa.eu/economy_finance/publications/publication16061_en.pdf
• The Commission’s EU 2020 Strategy to promote sustainable and green growth in Europe11;
• The Monti Report on the completion of the Single Market12; and
• The set-up of an extended High Level Forum for a better functioning food supply chain13.
• The future EU industrial policy
11 http://ec.europa.eu/eu2020/index_en.htm 12 http://ec.europa.eu/bepa/pdf/monti_report_final_10_05_2010_en.pdf 13 http://eur-lex.europa.eu/LexUriServ/LexUriServ.do?uri=OJ:C:2010:21
0:0004:0005:En:PDF
specific food and drink industry benchmarks and requirements
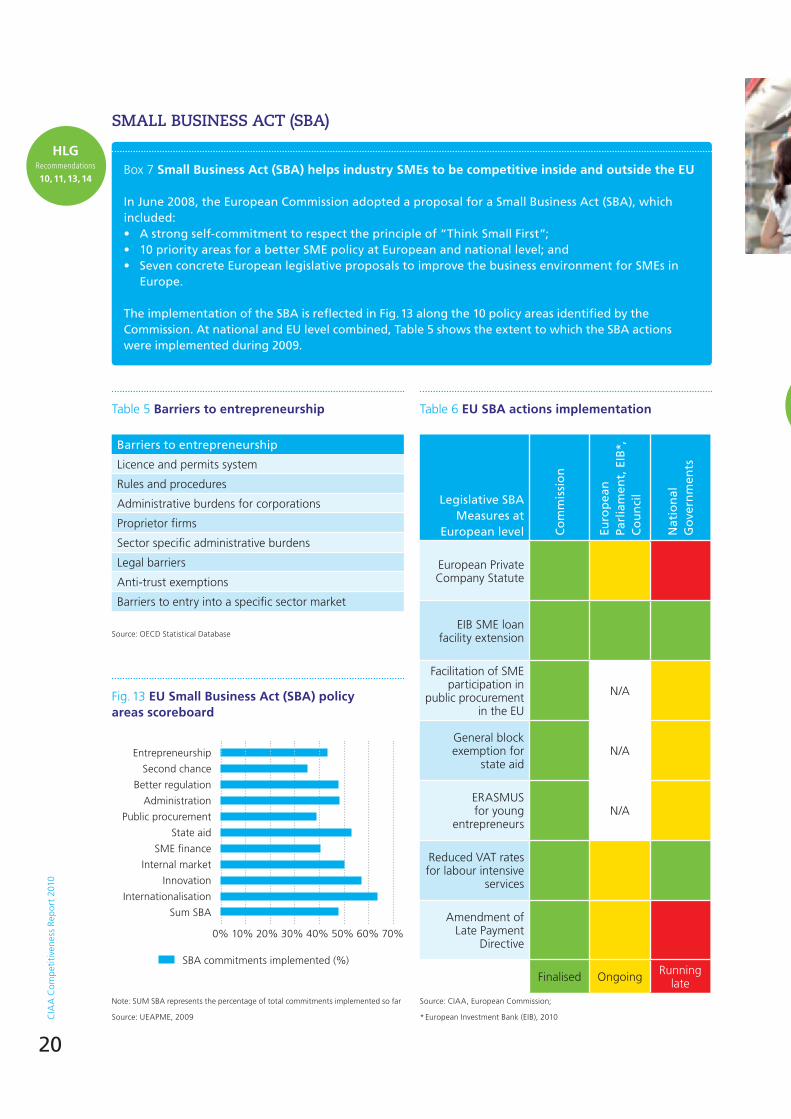
CIA
A C
ompe
titiv
enes
s Re
port
201
0
20
SMALL BUSINESS ACT (SBA)
Box 7 Small Business Act (SBA) helps industry SMEs to be competitive inside and outside the EU
In June 2008, the European Commission adopted a proposal for a Small Business Act (SBA), which included:• A strong self-commitment to respect the principle of “Think Small First”;• 10 priority areas for a better SME policy at European and national level; and • Seven concrete European legislative proposals to improve the business environment for SMEs in
Europe.
The implementation of the SBA is reflected in Fig. 13 along the 10 policy areas identified by the Commission. At national and EU level combined, Table 5 shows the extent to which the SBA actions were implemented during 2009.
Fig. 13 EU Small Business Act (SBA) policy areas scoreboard
SBA commitments implemented (%)
Entrepreneurship
Second chance
Better regulation
Administration
Public procurement
State aid
SME finance
Internal market
Innovation
Internationalisation
Sum SBA
0% 10% 20% 30% 40% 50% 60% 70%
note: SUM SBA represents the percentage of total commitments implemented so far
Source: UEAPME, 2009
HLG Recommendations 10, 11, 13, 14
Table 5 Barriers to entrepreneurship
Barriers to entrepreneurship
Licence and permits system
Rules and procedures
Administrative burdens for corporations
Proprietor firms
Sector specific administrative burdens
Legal barriers
Anti-trust exemptions
Barriers to entry into a specific sector market
Source: OECD Statistical Database
Table 6 EU SBA actions implementation
Legislative SBA Measures at
European level Co
mm
issi
on
Euro
pea
n
Parl
iam
ent,
EIB
*,
Co
un
cil
Nat
ion
alG
ove
rnm
ents
European Private Company Statute
EIB SME loan facility extension
Facilitation of SME participation in
public procurement in the EU
n/A
General block exemption for
state aidn/A
ERASMUS for young
entrepreneursn/A
Reduced VAT rates for labour intensive
services
Amendment of Late Payment
Directive
Finalised Ongoing Running late
Source: CIAA, European Commission;
* European Investment Bank (EIB), 2010
HLG Recommendations
2, 3
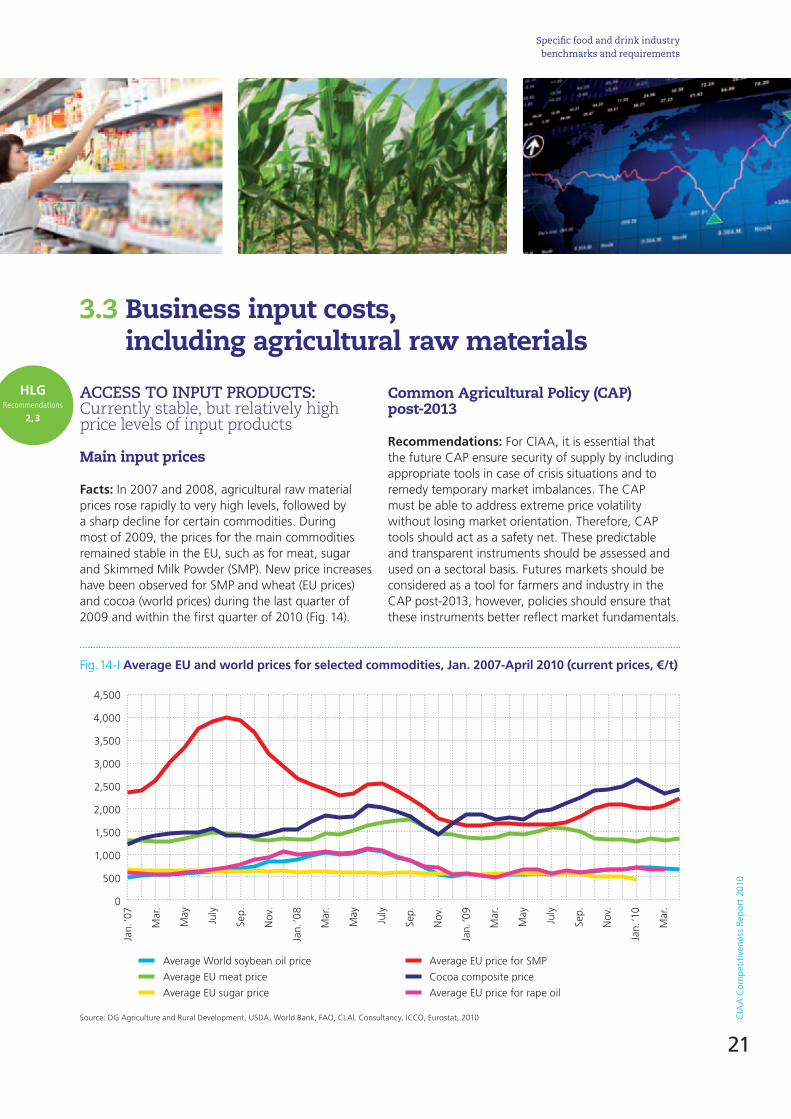
CIA
A C
ompe
titiv
enes
s Re
port
201
0
21
3.3 Business input costs, including agricultural raw materials
ACCESS TO INPUT PRODUCTS: Currently stable, but relatively high price levels of input products
Main input prices
Facts: In 2007 and 2008, agricultural raw material prices rose rapidly to very high levels, followed by a sharp decline for certain commodities. During most of 2009, the prices for the main commodities remained stable in the EU, such as for meat, sugar and Skimmed Milk Powder (SMP). new price increases have been observed for SMP and wheat (EU prices) and cocoa (world prices) during the last quarter of 2009 and within the first quarter of 2010 (Fig. 14).
Common Agricultural Policy (CAP) post-2013
Recommendations: For CIAA, it is essential that the future CAP ensure security of supply by including appropriate tools in case of crisis situations and to remedy temporary market imbalances. The CAP must be able to address extreme price volatility without losing market orientation. Therefore, CAP tools should act as a safety net. These predictable and transparent instruments should be assessed and used on a sectoral basis. Futures markets should be considered as a tool for farmers and industry in the CAP post-2013, however, policies should ensure that these instruments better reflect market fundamentals.
4,500
4,000
3,500
3,000
2,500
2,000
1,500
1,000
500
0
Fig. 14-I Average EU and world prices for selected commodities, Jan. 2007-April 2010 (current prices, €/t)
Source: DG Agriculture and Rural Development, USDA, World Bank, FAO, CLAL Consultancy, ICCO, Eurostat, 2010
Jan.
‘07
Mar
.
May
July
Sep.
nov
.
Jan.
‘08
Mar
.
May
July
Sep.
nov
.
Jan.
‘09
Mar
.
May
July
Sep.
nov
.
Jan.
‘10
Mar
.
Average World soybean oil price
Average EU meat price
Average EU sugar price
Average EU price for SMP
Cocoa composite price
Average EU price for rape oil
HLG Recommendations
2, 3
specific food and drink industry benchmarks and requirements

CIA
A C
ompe
titiv
enes
s Re
port
201
0
22
Other input prices
Gas prices per Gigajoules (GJ) for industrial consumers in the EU started falling since the second semester of 2008, after a twelve-month peak. Electricity prices have increased continuously since 2007. However, electricity prices started to fall during the second half of 2009 reaching € 0.10 cents/KW/h.
300
250
200
150
100
50
0
Jan.
‘07
Apr
.
July
Oct
.
Jan.
‘08
Apr
.
July
Oct
.
Jan.
‘09
Apr
.
July
Oct
.
Jan.
‘10
Apr
.
Average EU maize price Average EU wheat price
Fig. 14-II Average EU and world prices for selected commodities, Jan 2007-April 2010 (current prices, €/t)
Source: DG Agriculture and Rural Development, 2010
Availability of raw materials – the case of biodiesel
Facts: World production of biodiesel more than doubled within three years to an estimated 16 Mn T in 2009. In the EU, production has increased by 3.5 Mn T since 2006 to 8.4 Mn T in 2009.
Rapeseed is the main biomass used for producing biodiesel in the EU. Since 2005, the consumption of rapeseed oil for biodiesel increased at twice the rate
2007S2 2008S1 2008S2 2009S1 2009S2
Gas prices Electricity prices
Fig. 15 Evolution of gas and electricity half-yearly prices for industrial consumers (2007 S2=100)
Source: Eurostat, Short Term Business Statistics, 2010
150
140
130
120
110
100
90
80
70
60
50
of that used for food and feed. The overall increase of rapeseed oil usage was mainly based on higher EU production (+38% during the 2005-2009 period) and, to a lesser extent, on imports.
For biodiesel
For food and feed
Total consumption
2005 2007 2009
Fig. 16 Consumption of rapeseed oil for food, feed and biodiesel (Mn T) in the EU
Source: Annual Oil World, 2010
10
9
8
7
6
5
4
3
2
1
0
Recommendations: In 2009, biofuels accounted for about 4% of transport fuel consumption in the EU. The Directive on the promotion of renewable energy in Europe sets a mandatory 10% share of renewable energy in transport by 2020. It is essential, therefore, that the increasing demand for biomass to meet the EU 10% target does not harm the supply of raw materials for the food industry. The primary role of EU agriculture is, and must remain, the production of agricultural raw materials for food and feed. Policy-makers have to ensure the coherence of all policies driving supply, including the CAP and energy and environment policy.
HLG Recommendations
4, 5
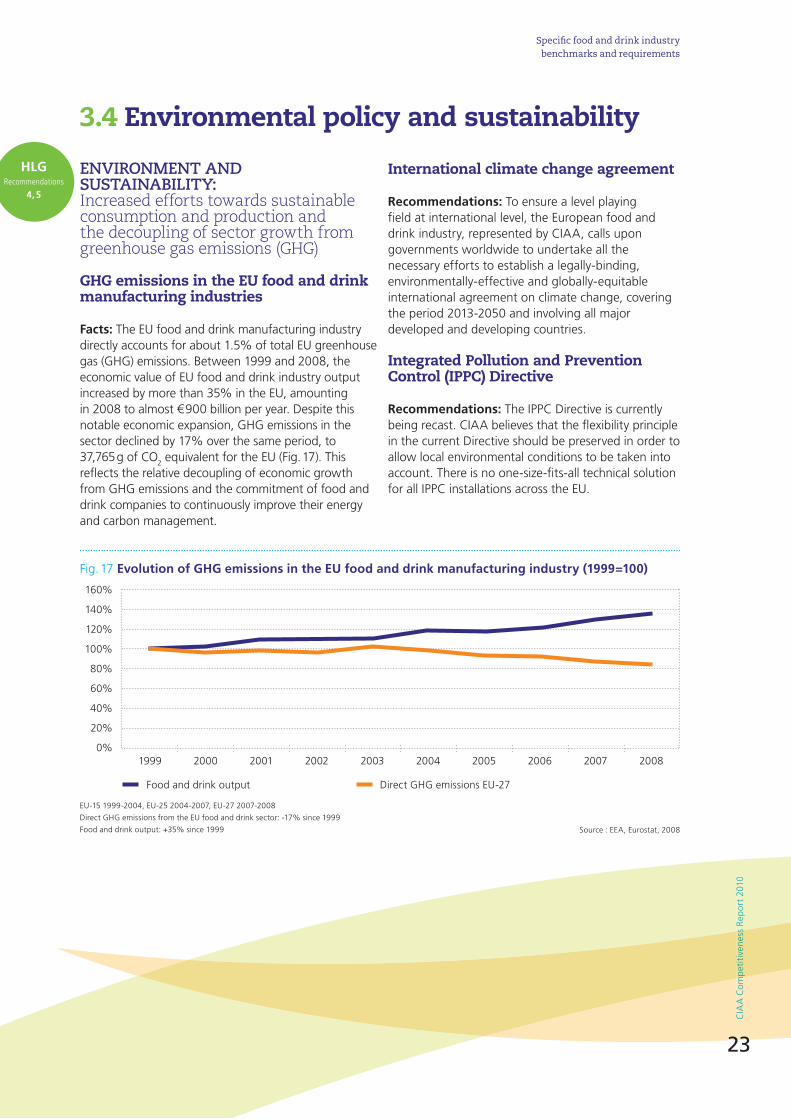
CIA
A C
ompe
titiv
enes
s Re
port
201
0
23
3.4 Environmental policy and sustainability
ENVIRONMENT AND SUSTAINABILITY: Increased efforts towards sustainable consumption and production and the decoupling of sector growth from greenhouse gas emissions (GHG)
GHG emissions in the EU food and drink manufacturing industries
Facts: The EU food and drink manufacturing industry directly accounts for about 1.5% of total EU greenhouse gas (GHG) emissions. Between 1999 and 2008, the economic value of EU food and drink industry output increased by more than 35% in the EU, amounting in 2008 to almost € 900 billion per year. Despite this notable economic expansion, GHG emissions in the sector declined by 17% over the same period, to 37,765 g of CO2 equivalent for the EU (Fig. 17). This reflects the relative decoupling of economic growth from GHG emissions and the commitment of food and drink companies to continuously improve their energy and carbon management.
International climate change agreement
Recommendations: To ensure a level playing field at international level, the European food and drink industry, represented by CIAA, calls upon governments worldwide to undertake all the necessary efforts to establish a legally-binding, environmentally-effective and globally-equitable international agreement on climate change, covering the period 2013-2050 and involving all major developed and developing countries.
Integrated Pollution and Prevention Control (IPPC) Directive
Recommendations: The IPPC Directive is currently being recast. CIAA believes that the flexibility principle in the current Directive should be preserved in order to allow local environmental conditions to be taken into account. There is no one-size-fits-all technical solution for all IPPC installations across the EU.
EU-15 1999-2004, EU-25 2004-2007, EU-27 2007-2008
Direct GHG emissions from the EU food and drink sector: -17% since 1999
Food and drink output: +35% since 1999
Fig. 17 Evolution of GHG emissions in the EU food and drink manufacturing industry (1999=100)
160%
140%
120%
100%
80%
60%
40%
20%
0%1999 2000 2001 2002 2003 2004 2005 2006 2007 2008
Food and drink output Direct GHG emissions EU-27
Source : EEA, Eurostat, 2008
HLG Recommendations
4, 5
specific food and drink industry benchmarks and requirements
CIA
A C
ompe
titiv
enes
s Re
port
201
0C
IAA
Com
petit
iven
ess
Repo
rt 2
010
23
CIA
A C
ompe
titiv
enes
s Re
port
201
0

CIA
A C
ompe
titiv
enes
s Re
port
201
0
24
EU Emissions Trading Scheme (ETS)
Facts: Around 900 food and drink processing installations are covered by the EU ETS and deliver continuous reductions of CO2 emissions in support of the EU 2020 Strategy objectives.
Recommendations: In the implementation of the revised EU ETS Directive, particular attention must be paid to safeguarding the competitiveness of internationally exposed food sub-sectors to avoid carbon leakage and to design CO2 benchmarks which respect the immense diversity of food and drink products. On 5 January 2010, the European Commission published the list of carbon leakage sectors based on the definition in the EU ETS Directive (2003/87/EC).
Sustainable Consumption and Production (SCP)
Actors within the food supply chain are grouped together in the European Food SCP Round Table whose goal is to strengthen the long-term competitiveness of the European food chain and also to support various EU policy objectives, including those outlined in the European Commission’s Action Plan on Sustainable Consumption and Production and Sustainable Industrial Policy. The Round Table is a multi-stakeholder forum currently bringing together 24 European food chain organisations, co-chaired by the European Commission. In short, the Round Table aims to:
• Establish common principles and methodologies for the environmental assessment of food and drink products;
• Identify suitable communication tools to consumers; and
• Promote continuous environmental improvement initiatives along the entire food chain.
HLG Recommendations
13, 24, 25, 26, 27, 28, 29, 30
Box 8 Many food and drink sectors are at high risk of carbon leakage
The final list of carbon leakage sectors in the EU ETS Directive includes, inter alia, the production of:
• Malt• Starches and starch products• Sugar• Other non-distilled fermented beverages• Ethyl alcohol from fermented materials• Processing and preserving of fish and fish
products• Crude oils and fats• Distilled potable alcoholic beverages
• Production of wines• Concentrated tomato puree and paste• Milk and cream in solid form• Casein• Lactose and lactose syrup• Dried baker’s yeast• Gelatine and its derivatives; isinglass (excluding
casein glues and bone glues)
Source : EU ETS Directive (2003/87/EC)

CIA
A C
ompe
titiv
enes
s Re
port
201
0
25
3.5 Trade competitiveness
TRADE COMPETITIVENESS: Increased trade balance amid significant import reductions
Facts: The EU food and drink positive trade balance has declined over the past decade. However, this trend reversed in 2009 (Fig. 18) mostly due to a significant import reduction. The value of food and drink imports in the EU shrunk by over 11% in 2009 compared to the previous year. A decrease in terms of volumes was even more important. At the same time, the value of exports dropped by 7.4% but the volume remained almost unchanged. This can be interpreted as a combined impact of lower prices in 2009 after the 2008 peak and of the crisis-linked demand reduction for European high value goods outside the EU.
In terms of the evolution of the trade balance, the EU food and drink industry has been experiencing average performance in recent years compared to its traditional counterparts in the global food market. none of the developed countries can compare with the growth observed in emerging countries such as Brazil.
Fig. 18 The EU food and drink trade balance (€ billion)
Source: Eurostat Comext, 2009
8
7
6
5
4
3
2
1
0
2000 2001 2002 2003 2004 2005 2006 2007 2008 2009
Fig. 19 Evolution of the external trade balance of various food and drink industries (1999=100)
Source: Eurostat Comext, WITS database, 2008note: For EU-27: Extra-EU trade
1999 2000 2001 2002 2003 2004 2005 2006 2007 2008
600
500
400
300
200
100
0
-100
-200
EU-27
US
Brazil
Japan
Canada
new Zealand
China
HLG Recommendations
13, 24, 25, 26, 27, 28, 29, 30
specific food and drink industry benchmarks and requirements

CIA
A C
ompe
titiv
enes
s Re
port
201
0
2626
Import exposure
In terms of value, Europe imports almost as much food and drink products as it exports. Imports amounted to 26% of the internal EU trade value in 2009. Also, around 20% of the raw material processed by the European food and drink industries originates outside Europe.
WTO negotiations
The food and drink industry regrets that a swift conclusion of the WTO Doha Round of multilateral trade negotiations does not appear to be in sight and continues to support a balanced agreement in the WTO, offering EU food producers improved market access outside Europe.
Bilateral negotiations
However, taking into account the stalemate in the WTO multilateral talks and the policy choices of EU trade counterparts, such as specific trade barriers in foreign markets for European products, the negotiation of bi-regional and bilateral free trade agreements (FTAs) should now be pursued. FTAs would provide a better framework for food safety and other regulatory issues, reduce burdensome customs procedures, improve the protection of intellectual property rights (IPR) including Geographical Indications (GIs) and promote international standards in partner countries. In the absence of a global multilateral agreement, FTAs should also aim to eliminate any remaining high import tariffs that limit market access for EU food and drink products worldwide.
Imports Intra-EU trade
Fig. 20 Import exposure of EU food and drink companies (imports and total Intra-EU trade) (€ billion)
Source: Eurostat, Comext, 2009
2000 2001 2002 2003 2004 2005 2006 2007 2008 2009
250
200
150
100
50
0
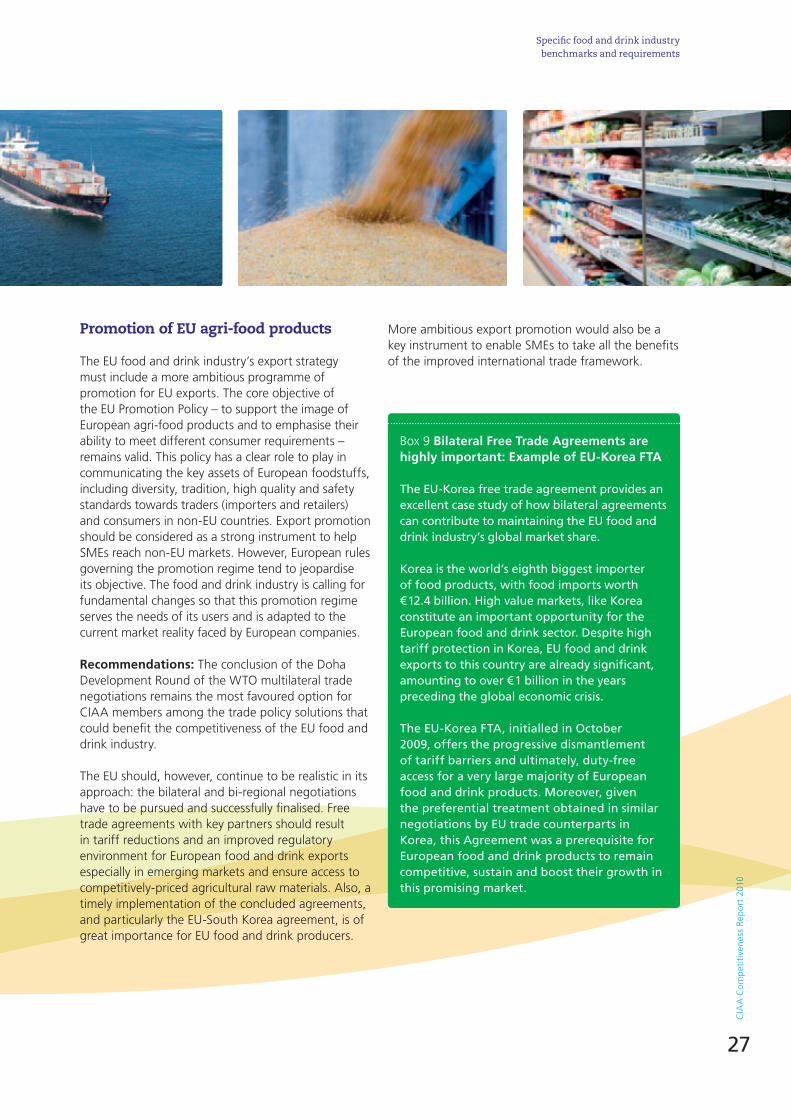
CIA
A C
ompe
titiv
enes
s Re
port
201
0
27
CIA
A C
ompe
titiv
enes
s Re
port
201
0C
IAA
Com
petit
iven
ess
Repo
rt 2
010
More ambitious export promotion would also be a key instrument to enable SMEs to take all the benefits of the improved international trade framework.
Promotion of EU agri-food products
The EU food and drink industry’s export strategy must include a more ambitious programme of promotion for EU exports. The core objective of the EU Promotion Policy – to support the image of European agri-food products and to emphasise their ability to meet different consumer requirements – remains valid. This policy has a clear role to play in communicating the key assets of European foodstuffs, including diversity, tradition, high quality and safety standards towards traders (importers and retailers) and consumers in non-EU countries. Export promotion should be considered as a strong instrument to help SMEs reach non-EU markets. However, European rules governing the promotion regime tend to jeopardise its objective. The food and drink industry is calling for fundamental changes so that this promotion regime serves the needs of its users and is adapted to the current market reality faced by European companies.
Recommendations: The conclusion of the Doha Development Round of the WTO multilateral trade negotiations remains the most favoured option for CIAA members among the trade policy solutions that could benefit the competitiveness of the EU food and drink industry.
The EU should, however, continue to be realistic in its approach: the bilateral and bi-regional negotiations have to be pursued and successfully finalised. Free trade agreements with key partners should result in tariff reductions and an improved regulatory environment for European food and drink exports especially in emerging markets and ensure access to competitively-priced agricultural raw materials. Also, a timely implementation of the concluded agreements, and particularly the EU-South Korea agreement, is of great importance for EU food and drink producers.
Box 9 Bilateral Free Trade Agreements are highly important: Example of EU-Korea FTA
The EU-Korea free trade agreement provides an excellent case study of how bilateral agreements can contribute to maintaining the EU food and drink industry’s global market share.
Korea is the world’s eighth biggest importer of food products, with food imports worth € 12.4 billion. High value markets, like Korea constitute an important opportunity for the European food and drink sector. Despite high tariff protection in Korea, EU food and drink exports to this country are already significant, amounting to over € 1 billion in the years preceding the global economic crisis.
The EU-Korea FTA, initialled in October 2009, offers the progressive dismantlement of tariff barriers and ultimately, duty-free access for a very large majority of European food and drink products. Moreover, given the preferential treatment obtained in similar negotiations by EU trade counterparts in Korea, this Agreement was a prerequisite for European food and drink products to remain competitive, sustain and boost their growth in this promising market.
specific food and drink industry benchmarks and requirements
CIA
A C
ompe
titiv
enes
s Re
port
201
0
28
Conclusion
The 2010 CIAA Competitiveness Report explores in some depth recent developments in the European food and drink industry and how they are affected by political developments, as presented in the “Regulatory Environment” section of the report.
The indicators used demonstrate the performance of the EU food and drink sector and enable a comparison with third country competitors.
With stable but low growth in production, the EU food and drink sector is outpaced by the growth of emerging economies. Furthermore, the distribution of export market shares is shifting from established competitors to new emerging economies. The main reasons for the recent performance of the EU food and drink industry are the following:
• Low levels of R&D investment of EU companies;
• Lower labour productivity growth;• Uneven industry-retail relations across the
EU food chain leading to the proliferation of unfair practices;
• Currently stable, but relatively high input prices for raw materials in the EU; and finally,
• A highly-regulated business environment in the EU.
As a result, the competitive position of the EU food and drink industry i.e. analysed in terms of evolution of production value, labour productivity, EU export market share and R&D investment, has not improved compared to previous years.
Furthermore, the 2010 competitiveness assessment provides a review of specific food and drink benchmarks, case studies and an analysis of the impact of certain pieces of EU legislation on business. These benchmarks are key to understanding the performance of the EU food and drink sector vis-à-vis third country competitors.
This analysis shows that measures need to be taken in the areas set out below, most notably:
• To boost R&D investment levels of EU companies which currently remain low;
• To improve the functioning of the food supply chain in Europe through the launch of the Forum on a Better Functioning Food Supply Chain and the Platform/Working Group on Contractual Relations;
• To manage the impact of regulation on business in areas such as novel food, climate change mitigation, the Common Agricultural Policy post-2013 and trade policy;
• To maintain the EU food and drink industry’s export competitiveness; and
• To ensure continuous availability of raw materials for the EU food and drink industry.
For EU food and drink companies, the Recommenda-tions and the Action Plan adopted in 2009 by the Commission’s High Level Group on the Competitiveness of the Agro-food Industry provide a sound basis for setting competitiveness objectives for the sector for the years to come.
Finally, CIAA is committed to actively participating in the new High Level Forum for a Better Functioning Food Supply Chain and its technical Platforms/Working Groups, and contributing to results that will drive the competitiveness of Europe’s food and drink industry to meet the wider EU 2020 socio-economic and environmental objectives.
CIA
A C
ompe
titiv
enes
s Re
port
201
0
29
Bibliography
• CLAL Consultancy• Clitravi, Meat International• Comext Database, Eurostat• DG Enterprise, Food Unit, HLG 006, HLG 007• DG Economic and Financial Affairs:
Communication on a better functioning food supply chain in Europe COM (2009) 591
• EEA – European Environment Agency – Carbon Intensity in EU Manufacturing Sectors
• Eurostat, HICP, 2010• Eurostat, DG Enterprise – Monthly note on
Economic Recovery, April 2010• Eurostat, nama_co2_c• Eurostat, SBS• Eurostat, Short Term Business Statistics• EU Industrial R&D Investment Scoreboard,
European Commission, DG RTD and JRC, 2009• Eurostat, European Innovation Scoreboard
2007, Science, Technology and Innovation in Europe 2008
• FAO, Food and Agriculture Organisation – Food price indices
• Intrum Justitia, European Payment Index 2009• ICCO – International Cocoa Organisation • Joint Research Centre, “The global pipeline of new
GM crops; implications of asynchronous approval for international trade” (2009)
• Late payment survey – DG Enterprise• LEI, Eurostat, CBS Statline, Roland Berger• OECD Stan Database 2010• OECD Agricultural Outlook 2009 – 2018, OECD
(2009)• Planet Retail Ltd – www.planetretail.net,
“Economic downturn spurs on sophisticated private labelling”, Press release, 11 February 2009
• Rabobank Ubifrance 2008• UEAPME European SME Finance Survey 2009• US Department of Agriculture (USDA) • Wits Database• XTC World Innovation
www.xtcworldinnovation.com
Bibliography

CIA
A C
ompe
titiv
enes
s Re
port
201
0
30
Annexes
Acronyms
ACP Africa, Carribean and Pacific countriesCAGR Compound Annual Growth RateCAP Common Agricultural PolicyCIAA Confederation of the food and drink
industries of the EUEACI Executive Agency for Competitiveness and
InnovationEEA European Environment AgencyEFSA European Food Safety AgencyEU-15 European Union of 15 Member States
until the May 2004 enlargementEU-25 European Union of 25 Member States from
May 2004 to January 2007EU-27 European Union of 27 Member States
since 1 January 2007ETS Emission Trading SchemeETP European Technology PlatformEurostat European Statistical OfficeF&D Food and DrinkFAO Food and Agriculture OrganisationFDI Foreign Direct InvestmentFFC Food and Feed CoalitionFP Framework ProgrammeFTA Free Trade AgreementGI Geographical IndicationGHG Greenhouse gasesGM Genetically modifiedGMO Genetically Modified OrganismHFO Heavy Fuel Oil
HLG High Level Group of the Competitiveness of the Agro-Food Industry
IEA International Energy AgencyIMF International Monetary FundIPPC Integrated Pollution and Prevention ControlIPR Intellectual Property RightsJASMInE European Commission Initiative to reinforce
development of micro-credit in EuropeKBBE Knowledge Based Bio EconomyKIC Knowledge and Information CommunityLCA Life Cycle AnalysisLLP Low Level PresenceOECD Organisation for Cooperation and
DevelopmentR&D Research and DevelopmentSBS Structural Business StatisticsSII Summary Innovation IndexSCP Sustainable Consumption and ProductionSPS Sanitary and Phytosanitary measuresSTAn Structural Analysis Database of the OECDSMEs Small and Medium-size EnterprisesTBT Technical Barriers to TradeTRIPs Trade-Related Aspects of Intellectual
Property RightsWFD Waste Framework DirectiveWITS World Integrated Trade Solutions
of the World BankWTO World Trade Organisation
List of tables
Table 1 Labour productivity (output in € 1,000/employee/year) . . . . . . . . . . . . . . . . 9
Table 2 High Level Group recommendations implementation . . . . . . . . . . . . . . . . . . . . . . . . . . . . 12
Table 3 Private Labels’ share of world’s top retailers by retail banner sale . . . . . . . . . . . . . . . . . . . . . . . . . 16
Table 4 Consequences of late payment . . . . . . . . . . . . . . 17
Table 5 Barriers to entrepreneurship . . . . . . . . . . . . . . . . 20
Table 6 EU SBA actions implementation . . . . . . . . . . . . . 20
CIA
A C
ompe
titiv
enes
s Re
port
201
0
31
List of figures
Fig. 1 Evolution of number of companies and employment in the EU food and drink sector (2000=100) . . . . . . . . 6
Fig. 2 Sectoral output performance since the onset of the crisis . . . . . . . . . . . . . . . . . . . . . . . . . . . . . . . . . . . . . . 7
Fig. 3 Evolution of production value in various food and drink industries (2001=100) . . . . . . . . . . . . . . . . . . . . . 8
Fig. 4 EU food and drink sector export market share 1998-2008 . . . . . . . . . . . . . . . . . . . . . . . . . . . . . . . . 10
Fig. 5 Evolution of various countries share in world food and drink exports (% in total) . . . . . . . . . . . . . . . . . . 10
Fig. 6 R&D as a percentage of industry output for the food and drink industry in various countries (%) . . . . 11
Fig. 7 Current market share of the three largest retailers in various EU Member States . . . . . . . . . . . . . . . . . . . 14
Fig. 8 Evolution of value added in the Dutch food supply chain (€ billion) . . . . . . . . . . . . . . . . . . . . . . . . 15
Fig. 9 Private Labels’ market share (value) 2007-2013 (f*) (%). . . . . . . . . . . . . . . . . . . . . . . . . . . 16
Fig. 10 EU business payment duration in days . . . . . . . . . 17
Fig. 11 Reasons for late payment . . . . . . . . . . . . . . . . . . . 17
Fig. 12 Indicators of product market regulation levels in EU and non-EU countries . . . . . . . . . . . . . . . . . . . . 18
Fig. 13 EU Small Business Act (SBA) policy areas scoreboard . . . . . . . . . . . . . . . . . . . . . . . . . . . . . . . . 20
Fig. 14-I Average EU and world prices for selected commodities, Jan. 2009-April 2010 (current prices, €/t) . . . . . . . . . . . . . . . . . . . . . . . . . . 21
Fig. 14-II Average EU and world prices for selected commodities, Jan 2009-April 2010 (current prices, €/t) . . . . . . . . . . . . . . . . . . . . . . . . . . 22
Fig. 15 Evolution of gas and electricity half-yearly prices for industrial consumers (2007 S2=100) . . . . . . . . . . . 22
Fig. 16 Consumption of rapeseed oil for food, feed and biodiesel (million tonnes Mn T) . . . . . . . . . . . . . . 22
Fig. 17 Evolution of GHG emissions in the EU food and drink manufacturing industry (1999=100) . . . . . . 23
Fig. 18 The EU food and drink trade balance (€ billion) . . 25
Fig. 19 Evolution of the external trade balance of various food and drink industries (1999=100) . . . . . . 25
Fig. 20 Import exposure of EU food and drink companies (imports and total Intra-EU trade) (€ billion) . . . . . . . . 26
List of boxes
Box 1 EU consumer demand for premium meat and meat delicacies falls . . . . . . . . . . . . . . . . . . . . . . . 7
Box 2 Summary of national initiatives for industry – retail relations: numerous initiatives, few results and fragmentation of the Internal Market . . . . . . . . . . . . 15
Box 3 Evolution of value added in the food chain in The netherlands: food industry drives innovation in the food chain . . . . . . . . . . . . . . . . . . . . . . . . . . . . 15
Box 4 Late payments – a heavy cost on EU food and drink businesses . . . . . . . . . . . . . . . . . . . . . . . . . 17
Box 5 Main political developments in 2009 and 2010 of relevance for the competitiveness of the food and drink industry in the EU . . . . . . . . . . . . . . . . . . . . . . . . . . . 19
Box 6 Low Level Presence (LLP) of genetically modified (GM) events – a high cost for the EU industry . . . . . . 19
Box 7 Small Business Act (SBA) helps industry SMEs to be competitive inside and outside the EU . . . . . . . 20
Box 8 Many food and drink sectors have high risk of carbon leakage . . . . . . . . . . . . . . . . . . . . . . . . . . . 24
Box 9 Bilateral Free Trade Agreements are highly important: Example of EU-Korea FTA . . . . . . . . . . . . 27

Avenue des Arts, 431040 Brussels, Belgium
www.ciaa.eu
Prin
ted
on F
SC c
erti
fied
pape
r D
esig
n &
pro
duct
ion:
ww
w.in
extr
emis
.be


