
Substance Abuse Trends in Maine State Epidemiological Profile 2015
Produced for Maine Department of Health and Human Services Office of Substance Abuse and Mental Health Services
by Hornby Zeller Associates, Inc. July 2015


Substance Abuse Trends in Maine State Epidemiological Profile 2015
THIS REPORT IS PRODUCED FOR THE MAINE OFFICE OF SUBSTANCE ABUSE AND MENTAL HEALTH SERVICES
COMMUNITY EPIDEMIOLOGY SURVEILLANCE NETWORK (CESN)
Produced by Hornby Zeller Associates, Inc. 373 Broadway South Portland, ME 04106 (207) 773-9529 www.hornbyzeller.com


Table of Contents
Executive Summary ............................................................................................................... 1
Consumption of Substances ............................................................................................ 1
Consequences Resulting from Substance Use and Abuse ................................................. 2
Factors Contributing to Substance Use and Abuse ........................................................... 4
Mental Health, Suicide and Co-occurring Disorders ......................................................... 5
Treatment Admissions for Substance Abuse .................................................................... 6
Introduction .......................................................................................................................... 7
Overview of Maine ......................................................................................................... 7
Purpose of this Report .................................................................................................... 8
Organization of the Report ............................................................................................. 8
Data Sources, Indicators and Selection Criteria ...................................................................... 9
Description of Data Sources .......................................................................................... 10
Consumption of Substances ................................................................................................. 15
Alcohol ............................................................................................................................ 16
Tobacco ........................................................................................................................... 22
Prescription Drugs ............................................................................................................ 25
Other Illegal Drugs ........................................................................................................... 28
Consequences Resulting from Substance Use and Abuse ...................................................... 33
Substance Use and Pregnancy .......................................................................................... 34
Criminal Justice Involvement ............................................................................................ 40
Motor Vehicle Crashes Involving Alcohol .......................................................................... 48
Hospital Visits Related to Substance Abuse ...................................................................... 52
Overdoses and Related Deaths ......................................................................................... 55
Morbidity and Mortality................................................................................................... 63
Factors Contributing to Substance Use and Abuse ................................................................ 69
Availability and Accessibility ............................................................................................ 70
Perceived Harm ............................................................................................................... 79
Perceived Enforcement .................................................................................................... 84
Community and Cultural Norms ....................................................................................... 86
Mental Health, Suicide and Co-occurring Disorders .............................................................. 93
Mental Illness, Depression and Anxiety ............................................................................ 94
Hornby Zeller Associates, Inc. i

Suicide and Suicidal Ideation ............................................................................................ 98
Mental Health and Substance Abuse Co-Occurrence ......................................................... 99
Treatment Admissions for Substance Abuse ...................................................................... 103
Need for Treatment ....................................................................................................... 104
Alcohol .......................................................................................................................... 105
Synthetic Opioids ........................................................................................................... 107
Marijuana ...................................................................................................................... 109
Heroin/Morphine ........................................................................................................... 111
Cocaine/Crack ................................................................................................................ 113
Methadone .................................................................................................................... 115
Benzodiazepines ............................................................................................................ 117
Conclusion ......................................................................................................................... 121
Hornby Zeller Associates, Inc. ii
List of Figures Figure 1. Percent of high school students reporting alcohol use in the past month: 2009–2013 .......................... 16 Figure 2. Percent of high school students who had five or more drinks in a row at least once in the past month: 2009–2013 ........................................................................................................................................................... 17 Figure 3. Percent of adults ages 18 to 20 reporting drinking in past 30 days by type of drinking: 2011–12 and 2012–13 ............................................................................................................................................................... 18 Figure 4. Percent of adults at risk from heavy alcohol use in past 30 days, by age group: 2011–12 and 2012–13. 19 Figure 5. Percent of adults reporting binge drinking in past 30 days, by age group: 2011–12 and-2012–13 ......... 20 Figure 6. Percent of Maine residents (age 18 and older) reporting binge alcohol use in past month, by age group: 2008–09 through 2012–13 ................................................................................................................................... 21 Figure 7. Percent of high school students who smoked at least one cigarette during past month: 2009–2013 .... 22 Figure 8. Percent of high school students who used tobacco during past month, by tobacco type: 2009–2013 ... 23 Figure 9. Past month cigarette use among adults, by age group: BRFSS, 2011–12 and 2012–13........................... 24 Figure 10. Percent of high school students who have taken prescription drugs that were not prescribed to them in their lifetime and in the past month: 2009–2013 ............................................................................................. 25 Figure 11. Non-medical use of pain relievers among Maine residents in the past year, by age group: 2007–08 through 2012–13 ................................................................................................................................................. 26 Figure 12. Misuse of prescription drugs among Maine residents in their lifetime, by age group: 2011–12 and 2012–13 ............................................................................................................................................................... 27 Figure 13. Percent of high school students who have used marijuana at least once in the past month: 2009–2013 ............................................................................................................................................................................ 28 Figure 14. Percent of Maine residents (age 18 and older) reporting marijuana use in past month, by age group: 29 Figure 15. Percent of Maine adults reporting marijuana use in past month, by age group: 2012–13 ................... 30 Figure 16. Percent of Maine residents (age 18 and older) reporting cocaine use in past year, by age group: 2008–09 through 2012–13 ............................................................................................................................................. 31 Figure 17. Percent of high school students reporting inhalant use (ever): 2009–2013.......................................... 32 Figure 18. Percent of women reporting alcohol and/or cigarette use during last trimester of pregnancy: 2008–2012 ..................................................................................................................................................................... 34 Figure 19. Percent of women who reported drinking alcohol during last trimester of pregnancy, by age group: 2007–08 to 2011–12 ............................................................................................................................................ 35 Figure 20. Percent of women who reported drinking alcohol during last trimester of pregnancy, by income: 2007–08 to 2011–12 ............................................................................................................................................ 36 Figure 21. Percent of pregnant treatment admissions, by primary substance: 2010–2014 ................................... 37 Figure 22. Number of drug affected baby reports: 2010–2014 ............................................................................. 39 Figure 23. Adult arrests (18+ years old) related to alcohol, by arrest type: 2009–2013 ........................................ 40 Figure 24. Juvenile arrests (<18 years old) related to alcohol, by arrest type: 2009–2013 .................................... 41 Figure 25. Arrests related to alcohol, by age group: 2013 .................................................................................... 42 Figure 26. Local law enforcement adult and juvenile drug offenses, by type: 2013 .............................................. 43 Figure 27. Local law enforcement adult and juvenile drug arrests: 2009–2014 .................................................... 44 Figure 28. Local law enforcement drug offense arrests (all ages) for possession, by drug type: 2009–2014 ......... 45 Figure 29. MDEA drug offense arrests in Maine, by drug type: 2010–2014 .......................................................... 46 Figure 30. Number of pharmacy robberies in Maine: 2010–2014 ......................................................................... 47 Figure 31. Number of motor vehicle crashes, by whether they involved alcohol: 2010–2014 .............................. 48 Figure 32. Number of fatal motor vehicle crashes, by whether they involved alcohol: 2010–2014 ...................... 49 Figure 33. Alcohol-related motor vehicle crash rate per 100,000 licensees, by age group: 2010–2014 ................. 50 Figure 34. Alcohol related motor vehicle crash fatality rate per 100,000 licensees, by age: 2008–10 to 2012–14 51 Figure 35. Inpatient hospital admissions (per 10,000 people) related to substance use: 2010–2011* .................. 52 Figure 36. Outpatient hospital admissions (per 10,000 people) related to substance use (2010–2011)* ............. 53 Figure 37. Poisonings reported to Northern New England Poison Center, by intent: 2010–2014 ......................... 54 Figure 38. Number of overdose EMS responses, by type: 2011–2014 .................................................................. 55 Figure 39. Distribution of overdose responses, by age and type: 2014 ................................................................. 56
Hornby Zeller Associates, Inc. iii
Figure 40. Naloxone* administrations, by gender and age: 2014 ......................................................................... 57 Figure 41. Number of deaths* caused by pharmaceuticals and/or illicit drugs: 2010–2014 ................................. 58 Figure 42. Percent of drug deaths involving specific drug types†: 2010–2014* .................................................... 59 Figure 43. Number of drug deaths involving specific drug types†: 2010–2014* ................................................... 60 Figure 44. Substance abuse and overdose deaths, per 100,000, by age group: 2010–2014* ................................ 62 Figure 45. Deaths from chronic diseases related to substance use, per 100,000 of the population: 2010–2014* . 63 Figure 46. Deaths from alcoholic cirrhosis and liver disease per 100,000 of the population, by gender: 2010–2014* ................................................................................................................................................................... 64 Figure 47. Deaths from suicide or homicide per 100,000 of the population: 2010–2014* .................................... 65 Figure 48. Deaths from suicide or homicide per 100,000 of the population, by age groups: 2011–13 .................. 66 Figure 49. Deaths from suicide or homicide per 100,000 of the population, by gender: 2011–13 ........................ 67 Figure 50. Percent of high school students who reported it would be easy to get alcohol: 2009–2013 ................ 70 Figure 51. Percent of high school students who obtained alcohol by someone giving it to them, among those who drank in past month: 2009–2013 ................................................................................................................. 71 Figure 52. Parent perceptions of accessibility of parent-purchased alcohol without parental knowledge: 2008–2015 ..................................................................................................................................................................... 72 Figure 53. Parent perception of teen accessibility of prescription drugs at home without parental knowledge: 2015 ..................................................................................................................................................................... 73 Figure 54. Percent of high school students who reported it would be easy to get marijuana: 2009–2013 ........... 74 Figure 55. Percent of high school students who were sold, offered, or given an illegal drug on school property in past year: 2009–2013 ........................................................................................................................................... 75 Figure 56. Number of prescriptions filled in Maine, by type: 2011-2014* ............................................................ 76 Figure 57. Number of pills per capita in Maine, by type: 2010–2014* .................................................................. 77 Figure 58. Substances most frequently requested for medication verification by non-law enforcement, by type: 2010–2014 ........................................................................................................................................................... 78 Figure 59. Percent of high school students perceiving moderate to great risk from drinking 1–2 drinks every day: 2009–2013 ........................................................................................................................................................... 79 Figure 60. Percent of high school students perceiving moderate to great risk from drinking five or more drinks once or twice per week: 2009–2013 .................................................................................................................... 80 Figure 61. Maine residents (age 18 and older) perceiving great risk from drinking five or more drinks once or twice per week, by age group: 2008–09 through 2012–13 ................................................................................... 81 Figure 62. Percent of high school students perceiving moderate to great risk from smoking marijuana regularly: 2009–2013 ........................................................................................................................................................... 82 Figure 63. Maine residents (age 18 and older) perceiving great risk from smoking marijuana once per month: 2008–09 through 2012–13 ................................................................................................................................... 83 Figure 64. Percent of high school students reporting they would not be caught by parents or the police if they drank: 2009–2013 ................................................................................................................................................ 84 Figure 65. Percent of high school students reporting they would not get caught by the police if they smoked marijuana: 2009–2013 ......................................................................................................................................... 85 Figure 66. Percent of high school students who reported they would be seen as "cool" for drinking alcohol or smoking marijuana: 2009–2013 ........................................................................................................................... 86 Figure 67. Percent of high school students who reported perceiving that their parents and adults in their community think student alcohol use is wrong: 2009–2013*............................................................................... 87 Figure 68. Percent of high school students who reported that parents would think it was wrong to use marijuana: 2009–2013 ......................................................................................................................................... 88 Figure 69. Parental attitudes regarding their teen using marijuana: 2013 and 2015 ............................................ 89 Figure 70. Percent of high school students who reported their family has clear rules about alcohol and drug use: 2009–2013 ........................................................................................................................................................... 90 Figure 71. Parent’s (of high school students) perception of youth alcohol use: 2009–2015 ................................. 91 Figure 72. Percent of Maine residents (age 18 and older) experiencing any mental illness or serious mental illness in past year, by age group: 2012–13 .......................................................................................................... 94 Figure 73. Percent of Maine residents (age 18 and older) experiencing at least one major depressive episode in past year, by age group: 2008–09 through 2012–13............................................................................................. 95
Hornby Zeller Associates, Inc. iv

Figure 74. Percent of adults who have been told they have a depression or anxiety disorder by age group: 2012–13 ........................................................................................................................................................................ 96 Figure 75. Percent of high school students who reported feeling sad or hopeless in past year: 2009–2013 ......... 97 Figure 76. Percent of high school students who considered, planned, or attempted suicide in past year: 2009–2013 ..................................................................................................................................................................... 98 Figure 77. Percent of students reporting seriously considering suicide in the past year, by alcohol use in the past month: ................................................................................................................................................................. 99 Figure 78. Percent of total treatment admissions with reported mental health disorders: 2010–2014 .............. 100 Figure 79. Percent of total treatment admissions where individuals received previous mental health services, by type: 2010–2014 ................................................................................................................................................ 101 Figure 80. Number of 211 referral calls, by service type: 2010–2014 ................................................................. 102 Figure 81. Primary treatment admissions by substance: 2014* ......................................................................... 103 Figure 82. Needing but not receiving treatment, by age: 2012–13 ..................................................................... 104 Figure 83. Number of treatment admissions where alcohol was the primary, secondary, or tertiary substance: .......................................................................................................................................................................... 105 Figure 84. Percent of treatment admissions where alcohol was the primary, secondary, or tertiary substance: 106 Figure 85. Number of treatment admissions where synthetic opioids were the primary, secondary, or tertiary substance: 2010–2014* ..................................................................................................................................... 107 Figure 86. Percent of total treatment admissions where synthetic opioids were the primary, secondary, or tertiary substance: 2010–2014 ........................................................................................................................... 108 Figure 87. Number of treatment admissions where marijuana was the primary, secondary, or tertiary substance: .......................................................................................................................................................................... 109 Figure 88. Percent of total treatment admissions where marijuana was the primary, secondary, or tertiary substance: 2010–2014 ....................................................................................................................................... 110 Figure 89. Number of treatment admissions where heroin or morphine were the primary, secondary, or tertiary substance: 2010–2014* ..................................................................................................................................... 111 Figure 90. Percent of total treatment admissions where heroin/morphine was the primary, secondary, or tertiary substance: 2010-2014 ........................................................................................................................... 112 Figure 91. Number of treatment admissions where cocaine/crack was the primary, secondary, or tertiary substance: 2010–2014* ..................................................................................................................................... 113 Figure 92. Percent of total treatment admissions where cocaine/crack was the primary, secondary, or tertiary substance: 2010-2014 ........................................................................................................................................ 114 Figure 93. Number of treatment admissions where methadone was the primary, secondary, or tertiary substance: 2010–2014* ..................................................................................................................................... 115 Figure 94. Percent of total treatment admissions where methadone was the primary, secondary, or tertiary substance: 2010–2014 ....................................................................................................................................... 116 Figure 95. Number of treatment admissions where benzodiazepines were the primary, secondary, or tertiary substance: 2010–2014* ..................................................................................................................................... 117 Figure 96. Percent of total treatment admissions where benzodiazepines was the primary, secondary, or tertiary substance: 2010–2014 ....................................................................................................................................... 118 Figure 97. Percent of total treatment admissions where bath salts were the primary, secondary, or tertiary substance: 2011–2014* ..................................................................................................................................... 119
Hornby Zeller Associates, Inc. v

Hornby Zeller Associates, Inc. vi
Executive Summary
This report takes into account the primary objectives of the Office of Substance Abuse and Mental Health Services (SAMHS): to identify substance abuse patterns in defined geographical areas, establish substance abuse trends, detect emerging substances, and provide information for policy development and program planning. It also highlights all the prevention priorities identified in the SAMHS strategic prevention plan: underage drinking, high-risk drinking among 18-25 year olds, misuse of prescription drugs among 18-25 year olds, and marijuana use in 12-25 year olds; as well as monitors the progress being made to address these priorities. This report includes data available through December 2014. Key findings of this report include: Consumption of Substances
• The proportion of high school students in Maine who reported consuming any alcohol in the past month decreased notably from 2009 to 2013.
• From 2009 to 2013, the proportion of high school students who reported binge drinking within the past month decreased.
• In 2012-13, among underage adults (18 to 20), about two in five reported any alcohol use in the past month while almost one in five had engaged in binge drinking at least once within the past month.
• In 2012-13, 18 to 25 year olds appeared to be at greatest risk from heavy alcohol use, with about one in ten reporting that they consumed at least one alcoholic drink per day in the past 30 days.
• In 2012-13, the highest binge drinking rates were found among 18 to 25 year olds (32%) and 26 to 35 year olds (30%). Rates of binge drinking have remained fairly stable over time.
• The use of cigarettes by high school students has been decreasing steadily since 2009. In 2013, more than one in ten students reported either having smoked a cigarette or cigar within the past 30 days.
• During 2012-13, one in five Mainers 18 and older reported smoking at least one cigarette within the past 30 days. Adults between the ages of 26 and 35 were the most likely to smoke cigarettes, with almost one in three having smoked at least one cigarette within the past 30 days.
• In 2013, more than one out of ten high school students reported misusing a prescription drug in their lifetime. Among high school students, the rates for lifetime as well as past month misuse of prescription drugs decreased from 2009 to 2013.
• Non-medical use of prescription pain relievers is more likely among young adults between the ages of 18 and 25 compared to adults age 26 and older. Nearly one in ten 18 to 25 year olds reported having misused pain relievers in the past year although this has been decreasing over time.
Hornby Zeller Associates, Inc. 1
• During 2012-13, the highest rate of lifetime prescription drug misuse was observed among adults between the ages of 18 and 35; seven percent reported misusing prescription drugs within their lifetime.
• In 2013, more than one in five high school students reported using marijuana within the past month; similar rates are seen within the young adult (18 to 25) population. Rates of marijuana use among Mainers have remained stable over time. In 2013, one fifth of high school users started before the age of 13.
• Among adults, those between the ages of 18 to 25 reported higher rates of cocaine use in the past year than adults 26 and older. The proportion of high school students who used cocaine in their lifetime is low and decreased slightly from 2011 (7%) to 2013 (6%).
• In 2013, about one in ten high school students reported using an inhalant during their lifetime. Rates of inhalant use have continued to decrease over the past several years.
Consequences Resulting from Substance Use and Abuse
• In 2012, more than one in five pregnant women reported smoking in the last trimester, and eight percent reported drinking alcohol. The rates of alcohol consumption during the last trimester were slightly higher for pregnant women age 35 or older, and among pregnant women with higher incomes.
• In 2014, almost three percent of all adult women admitted to substance abuse treatment were pregnant. Recently, the proportion of admissions primarily due to synthetic opioids has decreased while the proportion related to heroin has substantially increased.
• In 2014, there were 961 reports to Child Protective Services regarding infants born affected by substance abuse. Reports have been rising steadily since 2010.
• More adult arrests related to alcohol came from OUIs than from violations of liquor laws, whereas alcohol-related arrests among juveniles show the opposite pattern. Rates for liquor law violations and OUIs have been decreasing among Maine residents (both juveniles and adults) over the past several years. Liquor law violations are most prevalent among 18 to 20 year olds whereas OUIs are observed most among Mainers ages 21 to 29.
• Most drug-related offenses in 2013 were for possession rather than sale and manufacturing. Since 2009, it appears that adult arrests related to drugs have remained stable, while juvenile arrests have generally declined. Six out of ten drug offense arrests for possession are for marijuana.
• In 2013, the vast majority of drug related offense arrests made by local law enforcement agencies (not the Maine DEA) for possession were for marijuana (2,769), followed by other dangerous non-narcotics (e.g. barbiturates, Benzedrine) at 656, opium/cocaine derivatives (e.g. morphine, heroin, codeine) at 563, and synthetic narcotics (e.g. Demerol, methadone) at 371.
• In 2014, about one in three Maine DEA drug offense arrests involved heroin. The number of drug offense arrests related to heroin quadrupled from 2010 to 2014.
Hornby Zeller Associates, Inc. 2

• After observing a steady increase in pharmacy robberies from 2010 to 2012, Maine saw a dramatic decrease in 2013. In 2014, there were 20 pharmacy robberies in Maine.
• Both the number and proportion of alcohol-related motor vehicle crashes have observed an overall decrease within the past several years.
• In 2014, nearly one in four (24%) of fatal motor vehicle crashes involved alcohol. • In 2014, drivers between the ages of 21 and 24 had the highest alcohol-related crash
rates, followed by drivers between the ages of 25 to 34 as well as drivers ages 16 to 20. Rates among 21 to 24 year olds have been generally increasing since 2011.
• In 2012-14, the rates of alcohol-related motor vehicle crash fatalities were highest among 21 to 24 year olds, followed by 16 to 20 year olds. Rates among these age groups have observed general increases since 2008-10.
• In 2014, about one out of 20 calls to the poison center were related to substance abuse while almost one in seven poisonings were suspected as suicide attempts.
• In 2014, over half of overdose responses were related to drugs or medications. Drug/medication overdoses are most common among those between the ages 26 and 35 while alcohol-related overdose responses are most common among those who are between 46 and 55 years old.
• In 2014, a total of 829 patients received naloxone administrations from Maine EMS responders. Six out of ten patients receiving naloxone administrations were male and four out of ten patients were between the ages of 25 and 54.
• In 2014, there were 208 overdose deaths due to substance use in Maine; representing an 18 percent increase since 2013. In 2014, the vast majority of overdose deaths were related to pharmaceutical drugs. A dramatic increase (340%) in the number of illicit drug related overdose deaths was observed from 2011 to 2014.
• In 2014, nearly seven out of ten overdose deaths involved an opiate or opioid. More than one in three overdose deaths involved benzodiazepines while more than one in four involved heroin/morphine. In addition, one in five drug overdose deaths involved oxycodone or fentanyl. Since 2012, the number of deaths involving benzodiazepines or heroin/morphine has more than doubled.
• Adults between the ages of 30 to 34 had the highest rate of death due to substance abuse or overdose during 2014. Overdose deaths due to substance abuse have increased 39 percent from 2012 to 2014.
• Ischemic cerebrovascular (stroke) diseases were more prevalent among Mainers in 2014 than cardiovascular diseases and alcoholic cirrhosis. Cirrhosis and liver disease related to alcohol were almost three times more likely among men than women.
• In Maine, suicides are more prevalent than homicides. Rates of suicides have gradually increased since 2010 while homicide rates have remained stable. Suicides are more than four times as likely among men compared to women, and most prevalent among middle aged adults. Deaths due to homicide are almost twice as likely among men; rates are highest among younger adults between the ages of 21 and 29.
Hornby Zeller Associates, Inc. 3
Factors Contributing to Substance Use and Abuse
• Overall, about two out of three high school students think it would be easy to obtain alcohol; this represents a slight decrease since 2009.
• Social access appears to be a primary way that underage youth obtain alcohol. Of those students who obtained alcohol, more than a third reported that someone had given it to them.
• Half of parents of youth in 7th through 12th grade felt it was possible for their child to access alcohol purchased by the parent without their parents’ knowledge. This has increased steadily since 2011.
• More than a third (35%) of parents felt that, at home, their child would be able to access prescription medications that were not prescribed to the child, without their parents’ knowledge.
• In 2013, over half of high school students believed that marijuana is easy to obtain. This decreased slightly from 2009.
• More than one in five high school students were sold, offered or given an illegal drug on school property; this rate decreased slightly from 2011.
• From 2013 to 2014, the number of prescriptions for narcotics observed an eight percent increase due in part to some changes in data collection (see note on page 75). Since 2011, the number of prescriptions for stimulants has increased by 12 percent. The number of pills per capita for narcotics increased from 56 pills per person in 2009 to 60 pills per person in 2014.
• Most calls to the Poison Center requesting substance verification in 2014 involved opioids, followed by benzodiazepines. The numbers of requests for verification for opioids and benzodiazepines have decreased substantially since 2010.
• Although most high school students think there is moderate to great risk of harm from drinking alcohol regularly, almost two out of five students in 2013 did not think regular use was risky. Perception of harm from regular alcohol use decreased slightly from 2009 to 2013.
• The perception of risk of harm from binge drinking among high school students increased significantly from 2009 to 2013. While perceptions that binge drinking a few times a week posed a moderate to great risk of harm increased, more than seven out of ten young adults thought that binge drinking a few times a week was not risky.
• Perception of risk of harm from regular marijuana use decreased dramatically from 2009 to 2013 among high school students. In 2013, over half of students felt smoking marijuana on a regular basis was not risky. Rates of perception of risk from regular marijuana use have been declining steadily among adults as well. In 2012-13, nearly nine in ten 18 to 25 year olds did not perceive smoking marijuana at least once per month as risky.
• High school students think they are more likely to be caught by their parents for drinking alcohol than by the police. Perceptions of not getting caught by parents steadily decreased from 2009 to 2013.
Hornby Zeller Associates, Inc. 4

• The majority of high school students do not think they will be caught by police for smoking marijuana. Less than one in four students felt kids in their community would be caught by the police for smoking marijuana in 2013.
• In 2013, six out of ten high school students thought they would be seen as at least a little “cool” if drank alcohol or smoked marijuana. Rates have remained relatively stable since 2009.
• High school students generally believe that their parents and adults in their community think it would be wrong for them to drink alcohol. The perception of disapproval increased in both parents and adults in community from 2009 to 2013.
• Although high school students generally believe that their parents think it would be wrong for them to smoke marijuana, perceptions of disapproval decreased slightly from 2009 to 2013.
• In 2015, about one in six parents felt it would be okay if their teen used marijuana as long as they had a written certificate from a doctor. In 2015, conversely, one in three parents felt that is was never okay for their teen to use marijuana; this rate decreased substantially decrease since 2013.
• Almost nine in ten high school students in Maine report that their family has clear rules around alcohol and drug use.
• About one in four parents of high school students felt that their youth had ever consumed alcohol. Only three percent of parents thought their child had used within the past 30 days.
Mental Health, Suicide and Co-occurring Disorders
• About one in five adults in Maine report experiencing any mental illness in the past year while one in 20 report experiencing serious mental illness in the same time-frame. Major depressive episodes are most prevalent among 18 to 25 year olds with one in ten experiencing at least one episode within the past year.
• Nearly one in four adults in Maine reported having ever been diagnosed with depression compared to one in five reporting to have been diagnosed with anxiety. Adults ages 26 to 35 reported the highest rates of both depression and anxiety.
• In 2013, almost a quarter of high school students reported feeling sad or helpless during the past year.
• The proportion of students who reported seriously considering or planning suicide increased from 2011 to 2013. In 2013, about one in seven high school students in Maine had either seriously considered suicide or made a plan for suicide.
• In 2013, students who reported they had considered suicide seriously were about twice as likely to report they consumed alcohol within the past 30 days.
• In 2014, over half (58%) of all substance abuse treatment admissions also involved a mental health disorder; this rate has been increasing steadily over the past several years. Nearly one-third had received outpatient mental health services in the past year while one in ten had a psychiatric admission in the past two years.
Hornby Zeller Associates, Inc. 5

• In 2014, Maine 211 referral calls related to mental health services surpassed the number of calls related to housing/shelter, representing an eight percent increase from 2013.
Treatment Admissions for Substance Abuse
• In 2012-13, about one in seven 18 to 25 year olds needed but did not receive treatment for alcohol; nearly one in ten needed but did not receive treatment for illicit drug use. Young adults were about three times as likely to be perceived as needing but not receiving treatment for alcohol compared to those who were 26 and older.
• Alcohol continues to be the most frequent substance for which Mainers seek treatment, although the number of treatment admissions for alcohol has decreased since 2010. Since 2010, alcohol has accounted for a declining proportion of primary admissions.
• In 2014, one in four of all primary and secondary admissions was related to synthetic opiates. The proportion of primary treatment admissions involving synthetic opiates has steadily decreased since 2012.
• Marijuana tends to be listed as a secondary or tertiary substance for which treatment is sought. Almost one in three secondary and tertiary admissions is related to marijuana.
• Total treatment admissions for heroin or morphine have been steadily increasing since 2010. About one in four primary admissions and one in ten secondary admissions were due to heroin or morphine in 2014.
• The numbers as well as proportions of primary, secondary, and tertiary admissions in which treatment for crack or cocaine was sought have remained stable since 2010. About one in ten secondary and one in seven tertiary admissions were related to crack or cocaine.
• In 2014, about one in 20 (5%) of primary, secondary, and tertiary treatment admissions are due to methadone. Rates have remained relatively stable since 2010.
• Both the number and proportion of total treatment admissions involving benzodiazepines have remained relatively stable since 2010. Seven percent of tertiary admissions are related to benzodiazepines.
• There were 127 total treatment admissions related to bath salts in 2014; this was almost six times as many admissions as there were in 2011.
Hornby Zeller Associates, Inc. 6
Introduction
Overview of Maine The state of Maine had an estimated population of 1,330,089 people in 2014. Maine is considered an “aging” state, with 18 percent of the population being 65 years old and older, a higher proportion than the overall US population (14%). On the other hand, 19 percent of the state’s population is under the age of 18 years old, a lower proportion than the United States average (23%). According to the 2014 U.S. Census estimate, 95 percent of Maine’s population is White, non-Hispanic, followed by 1.4 percent Hispanic, 1.3 percent who are Black, 1.1 percent who are Asian, and 0.7 percent who are American Indian. There are five Native American tribal communities in Maine: the Penobscot, the Passamaquoddy (Pleasant Point and Indian Township), the Maliseet and the Micmac, whose numbers are likely underreported on the census. In Washington County, 5.1 percent of the population reports being Native American. Androscoggin and Cumberland counties are the most diverse communities, each home to communities with many ethnic backgrounds and national origins due in large part to refugee resettlement programs located there. Maine has four metropolitan areas throughout the state, numerous small towns and communities, and vast areas that are virtually unpopulated. While the average number of people per square mile was 43.1 in 2014, this greatly varies by county. The most populated counties were Cumberland with 337.2 people per square mile and Androscoggin with 230.2 persons per square mile, while the least densely populated counties were Piscataquis with 4.4, Aroostook with 10.8 and Washington with 12.8 persons per square mile. Maine is a diverse state economically. The median household income was $48,219 for the period of 2009-13, lower than the United States median income of $53,046. Income varies greatly by location in a similar fashion as population density. The southern coastal counties, such as Cumberland (where most of the population is located) have much higher median incomes than the northern, rural, and less densely populated counties such as Piscataquis and Washington. At $57,461, Cumberland has the highest median income and is one of only three Maine counties where the median income is higher than the United States median income (the others are Sagadahoc at $56,733 and York at $57,348). At the other end of this range, Washington County has the lowest median income at $37,236 a year. Piscataquis, the county with the lowest population density, has a median income of $36,646, the second lowest in the state. It is within the context of these demographic characteristics that substance abuse in Maine must be examined.
Hornby Zeller Associates, Inc. 7
Purpose of this Report This report takes into account the primary objectives of the Office of Substance Abuse and Mental Health Services (SAMHS): to identify substance abuse patterns in defined geographical areas, examine substance abuse trends, detect emerging substances, and provide information for policy development and program planning. It also highlights all the prevention priorities identified in the SAMHS strategic plan: underage drinking, high-risk drinking among 18-25 year olds, misuse of prescription drugs among 12-25 year olds, marijuana use in 12-25 year olds, and slowing the spread of methamphetamine abuse; as well as monitors the progress being made to address these priorities. This report includes data available through December 2014 and when possible updates the May 2014 report (which included data through December 2013). Older and unchanged data are included when more recent data were not available. Five major types of indicators are included: self-reported substance consumption, consequences of substance use, factors contributing to substance use, indicators about mental health and substance abuse, and treatment admissions. Previous reports are available at the www.maineosa.org website. For additional data and resources please visit the Maine State Epidemiological Outcomes Workgroup (SEOW) data dashboard at www.maineseow.com. Organization of the Report This report is used by a variety of people for many reasons. Some need a snapshot of the current status of a particular substance, while others are looking for longer-term trends. Still others may be seeking information on a particular population. Sometimes these points of view do not require new data, but rather special comparisons or presentations. To accommodate these diverse needs, the report is organized as follows:
• The Executive Summary provides the reader with a brief overview of the larger report. It includes statistics and findings, but does not contain graphical illustrations, long-term trends or comparative findings.
• The section Data Sources, Indicators and Selection Criteria describes the data sources and indicators that are included in the profile, as well as the process used to decide which indicators should be included in the profile.
• The Full Report presents the reader with more in-depth comparative and trend analyses for indicators that are critical to substance abuse and is broken into five major sections.
o Consumption trends and patterns among some of the most abused substances, in order to provide the reader a deeper understanding of those substances.
o Consequences related to substance use, such as traffic accidents and poisonings. o Factors that contribute to substance use overall, such as norms and perceptions. o Mental Health indicators and how they relate to substance abuse. o Recent trends in substance abuse treatment admissions.
Hornby Zeller Associates, Inc. 8
Data Sources, Indicators and Selection Criteria
This report includes data that was gathered from a number of sources. A detailed description of each source is provided below, consisting of information about the data included in each source, the strengths and weaknesses, and retrieval or contact information. The report includes data that were available through December 2014 and updates the May 2013 report. A number of criteria are used annually to determine what information should be included in this report. A small SEOW workgroup applies these standards to each indicator and selects the best possible data source (or sources) to be included. Indicators that are determined to be redundant, no longer useful, or too confusing are updated in order to provide the reader with a streamlined and more comprehensive report. Each criterion is defined below:
• Relevance: To be included, each of the indicators must be directly related to substance use. The indirect effects of substance use reach throughout society in such areas as crime, health and education. However, this report limits indicators to those which can be directly related to substance use (e.g., hospital admissions in which substance use was recorded as a factor, rather than generating an estimate of the percentage of all hospital admissions that could be related to substance use).
• Timeliness: Each of the indicators includes the most updated data available from the source. The timeliest data included are from the previous six months or year, but some data as old as three years may be included; this happens when the most recently collected data from the source are not yet available due to the timing of data collection and the publication of this report. The sources that reflect older information are included when they meet other important criteria. For example, the National Survey on Drug Use and Health, for which the most recent data available are from 2012-13, provides data that are highly relevant and reliable.
• Availability: For an indicator to be included in this report, data regarding its use must be available from a reliable source. That is, a question must be asked on a representative survey or an office must record incidents, and the source must be willing to release the results either to the general population, or the SEOW and/or its members. As stated above, the most recent data available from those sources are included in this report.
• Reliability: In order to include trended data in this report, the data available for each indicator must be reliable and comparable from year to year. They need to reflect the same indicator in the same manner for the same population each year.
• Trending: Trends are included in this survey for indicators in which reliable and comparable data are available from multiple years. In some instances, trending is limited or not possible due to limited availability of the data. For example, questions regarding the use of specific substances have been included and discontinued in use surveys as those substances have become more or less of a concern. Therefore, trending is only available for their use in the years those questions were included in the survey.
Hornby Zeller Associates, Inc. 9
As described previously, there are multiple purposes for this report. One is to provide a snapshot of the most recent data regarding substance abuse, while another is to examine trends over time. Therefore, each indicator may have multiple sources of data that are included. While each indicator provides a unique and important perspective on drug use in Maine, none should individually be interpreted as providing a full picture of drug trends in Maine. In particular, the percentages and figures from one data source do not always align with the data and percentages from a similar source. Older data are often included in order to examine an indicator among a specific population or to find trends over time. When discussing rates of prevalence, however, the user should rely upon the most recent data source available. Description of Data Sources Behavioral Risk Factor Surveillance System (BRFSS). The BRFSS is a national survey administered on an ongoing basis by the National Centers for Disease Control and Prevention (CDC) to adults in all 50 states and several districts and territories. The instrument collects data on adult risk behaviors, including alcohol abuse. BRFSS defines heavy drinking as adult men having more than two drinks per day and adult women having more than one drink per day, and binge drinking as males having five or more drinks on one occasion and females having four or more drinks on one occasion. The most recent data available are from 2013. Due to methodological changes in weighting and sampling, data prior to 2011 cannot be trended with more current data. Contact: Melissa Damren, Maine BRFSS Coordinator; [email protected]; (207) 287-1420. Maine Department of Public Safety (DPS), Bureau of Highway Safety (BHS), Maine Department of Transportation (MDOT). The Bureau of Highway Safety is responsible for tracking all fatalities that occur on Maine's highways and reporting this information through the Fatal Analysis Reporting System (FARS). The data represented provides information on highway crashes and fatalities. Much of this information is gathered from the FARS system, which records data on fatal crashes in Maine for input into a larger national record-keeping system of statistical data. FARS data is also used by BHS and the Maine State Police to analyze enforcement priorities and schedules. Impaired driving is one of the most serious traffic risks facing the nation, killing thousands every year. Contact: Duane Brunell, Safety Performance Analysis Manager; [email protected]; (207) 624-3278. Maine Department of Public Safety (DPS), Uniform Crime Reports (UCR). UCR data include drug and alcohol arrests. Drug arrests include sale and manufacturing as well as possession of illegal substances. Liquor arrests include all liquor law violations. OUI arrests are arrests for operating a motor vehicle under the influence of a controlled substance. DPS data are now available from 2013. Arrest data may reflect differences in resources or focus of law enforcement efforts, so may not be directly comparable from year to year. Retrieval: http://www.maine.gov/dps/cim/crime_in_maine/cim.htm For UCR statistical purposes, “arrests” also include those persons cited or summonsed for criminal acts in lieu of actual physical custody. These forms categorize the arrests by offense
Hornby Zeller Associates, Inc. 10
classification (both Part I and Part II crimes), and by age, sex and race. The same individual may be arrested several times over a period of time; each separate arrest is counted. A person may be arrested on several charges at one time; only one arrest is counted and is listed under the most serious charge. For UCR purposes, a juvenile is counted as “arrested” when the circumstances are such that if he or she were an adult, an arrest would result; in fact, there may not have been a formal charge. Maine Drug Enforcement Agency (MDEA). The MDEA through its regional multi-jurisdictional task forces is the lead state agency in confronting drug trafficking crime. The data included in this report represents those arrested for a drug offense but does not indicate what other drug(s) may have been seized. For example, a person may be arrested for the sale of cocaine but also be in possession of oxycodone and marijuana. It is important to note that arrests and multi-jurisdictional drug enforcement are resource-dependent; such funds fluctuate from year to year, and must be reallocated to combat highest priority threats. Contact: Roy E. McKinney, Director; [email protected]; (207) 626-3852. Maine Emergency Medical Services (EMS). Maine EMS is a bureau within the Maine Department of Public Safety (DPS) and is responsible for the coordination and integration of all state activities concerning Emergency Medical Services and the overall planning, evaluation, coordination, facilitation and regulation of EMS systems. EMS collects data statewide from the 272 licensed ambulance and non-transporting services. It is mandated that services submit an electronic patient care report to Maine EMS within one business day of patient contact. Data are compiled upon request. Contact: Jon Powers, Maine Emergency Medical Services; [email protected]; (207) 626-3860. Maine Health Data Organization (MHDO). MHDO data includes all inpatient admissions to all hospitals in Maine for calendar years 2010 and 2011. Data categories created by the authors include alcohol, opioids, illegal drugs, and pharmaceuticals. All drug categories include intoxication, abuse, dependence, and poisoning cases related to the drug. The opiate category includes methadone, heroin, and opiates. The illegal drug category includes crack/cocaine, cannabis, and hallucinogens. The pharmaceuticals category includes all other non-opioid medications (including stimulants and depressants). Contact: Maine Health Data Organization (MHDO), [email protected]; (207) 287-3225. Maine Integrated Youth Health Survey (MIYHS). The MIYHS is a statewide survey administered biennially through a collaborative partnership by the Maine Office of Substance Abuse and Mental Health Services (SAMHS) the Maine Center for Disease Control and Prevention and the Maine department of Education to students in grades 5 through 12. The survey collects information on student substance use, risk factors related to substance use, as well as consequences, perceptions and social risk factors related to substances, and collects information on many other health factors. MIYHS defines binge-drinking as consuming five or more drinks in a row. As of the date of this report, the most recent data available are from 2013. Contact: [email protected]; (207) 287-2964.
Hornby Zeller Associates, Inc. 11
Maine Office of the Chief Medical Examiner. The Maine Office of the Chief Medical Examiner maintains records of all deaths associated with drug overdose. Drug categories include methadone, cocaine, benzodiazepines, oxycodone, fentanyl, and heroin/morphine. The death data are compiled on an annual basis and must be finalized prior to release, and so are not available to track changes that may occur over shorter time frames. Contact: Dr. Marcella Sorg, Director, Rural Drug & Alcohol Research Program, Margaret Chase Smith Policy Center, University of Maine; [email protected]; (207) 581-2596. National Survey on Drug Use and Health (NSDUH). The NSDUH is a national survey administered annually by the Substance Abuse and Mental Health Services Administration (SAMHSA) to youth grades 6 through 12 and adults ages 18 and up. The instrument collects information on substance use and health at the national, regional and state levels. The advantage of NSDUH is that it allows comparisons to be made across the lifespan (that is, ages 12 and up). However, NSDUH is not as current as other data sources; as of this report, data at the state level are available from 2012-13. Older data are included for trending and comparative purposes. NSDUH defines Illicit Drugs as marijuana/hashish, cocaine (including crack), heroin, hallucinogens, inhalants, or any prescription-type psychotherapeutic used non-medically; Binge Alcohol Use as drinking five or more drinks on the same occasion (i.e., at the same time or within a couple of hours of each other) on at least one day in the past 30 days; Dependence or abuse based on definitions found in the fourth edition of the Diagnostic and Statistical Manual of Mental Disorders (DSM-IV); and Serious Mental Illness (SMI) as a diagnosable mental, behavioral, or emotional disorder that met the criteria found in the fourth edition of the Diagnostic and Statistical Manual of Mental Disorders (DSM-IV) and resulted in functional impairment that substantially interfered with or limited one or more major life activities. Retrieval: http://www.samhsa.gov/data/population-data-nsduh/reports Northern New England Poison Center (NNEPC). The Northern New England Poison Center provides services to Maine, New Hampshire, and Vermont. A poisoning case represents a single individual’s contact with a potentially toxic substance. Intentional poisoning includes those related to substance abuse, suicide and misuse. Data include the number of confirmed cases where exposures are judged to be substance abuse-related (i.e., an individual's attempt to get high). NNEPC collects detailed data on specific substances involved in poisonings, including the categories of stimulants/street drugs, alcohol, opioids, asthma/cold and cough, benzodiazepines, antidepressants, and pharmaceuticals, as well as other substances. The category of stimulants/street drugs includes marijuana and other cannabis, amphetamine and amphetamine-like substances, cocaine (salt and crack), amphetamine/dextroamphetamine, caffeine tablets/capsules, ecstasy, methamphetamine, GHB, and other/unknown stimulants/street drugs. The category alcohol includes alcohol-containing products such as mouthwash. The opioid category includes Oxycodone, Hydrocodone, buprenorphine, methadone, tramadol, morphine, propoxyphene, codeine, hydromorphone, stomach opioids, Meperidine (Demerol), heroin, Fentanyl, and other/unknown opioids.
Hornby Zeller Associates, Inc. 12
Data available from the poison center are reported on a continual daily basis and are included through December 2014. These data are only reflective of cases in which the Poison Center was contacted. Contact: Karen Simone, Director, Northern New England Poison Center; [email protected]; (207) 662-7221. Office of Child and Family Services (OCFS), Maine Automated Child Welfare Information System (MACWIS). The Office of Child and Family Services (OCFS) supports Maine's children and their families by providing Children's Behavioral Health, Child Welfare, Early Childhood, and Community services. The Maine Child Welfare Information System (MACWIS) serves as the single repository for all Maine child welfare information to assist Office of Child and Family Services (OCFS) workers in the recording, tracking, and processing of child welfare functions. MACWIS is the single repository for all electronic child welfare information. It actively manages 850,000 identified persons and 28,525 resources in the system; [email protected]; (207)-624-7911. Office of Data, Research and Vital Statistics (ODRVS). ODRVS is a program within the Maine CDC. The data include Maine resident deaths in which the death certificate statistical file included any mention that alcohol or drug use may have had a role. Data include unintentional, self-inflicted, assault and undetermined intent deaths. Contact: Kim Haggan, Office of Data, Research and Vital Statistics; [email protected]; (207) 287-5459. Parent Survey. In 2006, the Maine Office of Substance Abuse and Mental Health Services (SAMHS) and Ethos Marketing and Design commissioned Pan Atlantic Research, a Maine-based marketing research and consulting firm, to conduct a baseline quantitative market research with parents of teenagers throughout the state on a range of issues related to underage drinking. The 2006 research was a component of a broader project being conducted by the Ethos team in preparation for a parent social marketing campaign, the objective of which was to reduce teenage drinking in the State of Maine through improved parenting techniques and enhanced parental involvement. Pan Atlantic Research has subsequently conducted benchmarking research on this project for SAMHS in 2007, 2008, 2009, 2011, 2013, and now in 2015. The 2008 research was designed to be more directly comparable to the 2009 (and future) Maine Integrated Youth Health Surveys (MIYHS). Also since 2008, the sample has been stratified on a statewide basis according to Maine’s eight public health districts (150 surveys per PHD). Additionally, the sample composition since 2008 includes parents of 7th to 12th graders (200 per grade–1,200 total). Contact: Marisa Paraschak, Senior Research Analyst, Pan Atlantic Research; [email protected]; (207) 871-8622 ext.101. Pregnancy Risk Assessment Monitoring System (PRAMS). PRAMS is an ongoing, population-based surveillance system designed to identify and monitor selected maternal behaviors and experiences before, during, and after pregnancy among women who have recently given birth to a live infant. Data are collected monthly from women using a mail/telephone survey. Contact: Thomas Patenaude, PRAMS Coordinator, Maine CDC; [email protected]; (207) 287-5469.
Hornby Zeller Associates, Inc. 13
Prescription Monitoring Program (PMP). PMP maintains a database of all transactions for class C-II through C-IV drugs dispensed in the state of Maine. Drug categories used in this report include narcotics, tranquilizers, stimulants, and other prescriptions. Other prescriptions include those drugs that are not classified as narcotics, tranquillizers or stimulants, including products such as endocrine and metabolic drugs, analgesics and anesthetics, gastrointestinal agents, and nutritional products. Prescription counts do not reflect amounts in terms of dosage or quantity of pills, but rather represent the volume of active prescriptions during the time period. The counts included in this report represent the number of prescriptions filled between 2011 and 2014. Contact: John Lipovsky, PMP Coordinator, Substance Abuse and Mental Health Services; [email protected]; (207) 287-3363. Treatment Data System (TDS). TDS is a statewide database that includes information about clients admitted to treatment in SAMHS-funded facilities through December 2014. Analyses in this report are based on clients’ reported primary, secondary and tertiary drug(s) of choice as well as other demographic and background information that is collected at intake. It is important to note that the TDS system is not static; therefore 2014 numbers may be artificially low. Drug categories included in this report are alcohol, marijuana, cocaine, heroin, synthetic opiates, methadone/buprenorphine and benzodiazepines. Contact: Substance Abuse and Mental Health Services; (207) 287-6337. 2-1-1 Maine. 2-1-1 Maine is a telephone and internet based health and human service information and referral service. The state of Maine has over 300 hotlines and help lines and thousands of programs offering all types of health and human services (e.g. substance abuse services, mental health services, gambling addiction services, and housing services). 2-1-1 Call Center services operate 24 hours a day, seven days a week. The 2-1-1 directory is also accessible by Internet 24 hours a day, 7 days a week; [email protected]; (207) 874-1181.
Hornby Zeller Associates, Inc. 14

Consumption of Substances
Consuming harmful substances can have detrimental effects on an individual’s well-being, including increased risks of morbidity, addiction and mortality, and has a harmful effect on society as a whole including increased motor vehicle accidents and crime. However, it is the manner and frequency with which people drink, smoke, and use drugs that are often linked to particular substance-related consequences. To understand fully the magnitude of substance use consequences, it is important to first understand the prevalence of substance use consumption itself. Consumption includes overall use of substances, any use or heavy consumption, and consumption by high risk groups (e.g., youth, college students, 18 to 25 year olds, etc.) As demonstrated by the indicators below, alcohol remains the substance most often used by Mainers across the lifespan. In particular, high-risk drinking among the 18 to 25 year old population continues to be a concern, although it appears that the rates of use among those who are below the legal age to drink are declining. After alcohol, cigarettes, marijuana and prescription drugs are the next most commonly used drugs in Maine. With the exception of cigarettes, the young adult population rises to the top in terms of high rates of using these substances. It is worth mentioning that one in three Mainers ages 26 to 35 reported smoking cigarettes within the past month.
Hornby Zeller Associates, Inc. 15
Alcohol Indicator Description: CURRENT ALCOHOL USE AMONG YOUTH. This measure shows the percentage of high school students who reported having had one or more alcoholic drinks on one or more days within the past month. Why Indicator is Important: Alcohol is the most often used substance among youth in Maine. In addition to the risks alcohol consumption carries for adults, developing adolescent brains are especially susceptible to the health risks of alcohol consumption. Adolescents who consume alcohol are more likely to have poor grades and be at risk for experiencing social problems, depression, suicidal thoughts, assault, and violence. Data Source(s): MIYHS, 2009-2013 Summary: The proportion of high school students in Maine who reported consuming any alcohol in the past month decreased notably from 2009 to 2013.
Figure 1. Percent of high school students reporting alcohol use in the past month: 2009–2013
Source: MIYHS, 2009-2013
• The percentage of high school students consuming alcohol in the past month fell from 28 percent in 2011 to 26 percent in 2013.
• Although not shown, 26 percent of high school students who ever consumed alcohol reported having their first drink of alcohol before the age of 13.
32%
28% 26%
0%
10%
20%
30%
40%
50%
2009 2011 2013
Hornby Zeller Associates, Inc. 16

Indicator Description: CURRENT HIGH-RISK ALCOHOL USE AMONG YOUTH. This indicator presents the percentage of youth who reported having had five or more alcoholic drinks in a row in the past two weeks and on at least one day within the past month. Why Indicator is Important: Youth are more likely than adults to binge drink when they consume alcohol. High-risk alcohol use contributes to violence and motor vehicle crashes and can result in negative health consequences for the consumer, including injuries and chronic liver disease. Youth who engage in high-risk drinking are also more likely to use drugs and engage in risky and antisocial behavior. Data Source(s): MIYHS, 2009-2013. Summary: From 2009 to 2013, the proportion of high school students who reported binge drinking within the past month decreased.
Figure 2. Percent of high school students who had five or more drinks in a row at least once in the past month: 2009–2013
Source: MIYHS, 2009-2013
• The percentage of high school students who reported having consumed five or more drinks in a row (within a couple of hours) during the past 30 days fell from 19 percent in 2009 to 15 percent in 2013.
19% 17%
15%
0%
10%
20%
30%
40%
50%
2009 2011 2013
Hornby Zeller Associates, Inc. 17
Indicator Description: CURRENT ALCOHOL USE AMONG UNDERAGE ADULTS. This indicator portrays the percentage of adults between the age of 18 and 20 who reported having consumed one or more alcoholic drinks on one or more days within the past month. Why Indicator is Important: Alcohol is one of the most often-used substances by underage adults in Maine. Excessive and high-risk alcohol use may contribute to violence and result in many negative health consequences for the consumer. Moderate drinking can also have negative health effects and lead to such consequences as alcohol-related motor vehicle crashes and increased injuries. Data Source(s): BRFSS, 2011-12 and 2012-13 Summary: In 2012-13, among underage adults (18 to 20), about two in five reported any alcohol use in the past month while almost one in five had engaged in binge drinking at least once within the past month.
Figure 3. Percent of adults ages 18 to 20 reporting drinking in past 30 days by type of drinking: 2011–12 and 2012–13
Source: BRFSS, 2011-12 and 2012-13
• During the 2012-13 period, among Mainers between the ages of 18 and 20, 39 percent reported consuming any alcohol in the past 30 days, 20 percent reported binge drinking, and six percent were at risk from heavy alcohol use.1 Binge drinking among 18 to 20 year olds decreased by three percentage points from 2011-12 to 2012-13.
1 Heavy drinking is defined as more than two drinks per day for a man or more than one drink per day for a woman; heavy drinking increases a person’s risk for alcohol-related health and social consequences.
41%
23%
6%
39%
20%
6% 0%
10%
20%
30%
40%
50%
Past 30 day alcohol use Binge drinking At risk from heavydrinking
2011-12 2012-13
Hornby Zeller Associates, Inc. 18
Indicator Description: AT RISK FROM HEAVY ALCOHOL USE. This indicator examines the percentage of Maine residents who are at risk of suffering consequences from heavy drinking in the past month. Heavy drinking is defined as more than two drinks per day for a man or more than one drink per day for a woman. Why Indicator is Important: People who consume alcohol heavily are at increased risk for a variety of negative health consequences, including alcohol abuse and dependence, liver disease, certain cancers, pancreatitis, heart disease, and death. It has also been found that the more heavily a person drinks the greater the potential for problems at home, work, and with friends.2 Data Source(s): BRFSS, 2011-12 to 2012-13 Summary: In 2012-13, 18 to 25 year olds appeared to be at greatest risk from heavy alcohol use, with about one in ten reporting that they consumed at least one alcoholic drink per day in the past 30 days.
Figure 4. Percent of adults at risk from heavy alcohol use in past 30 days, by age group: 2011–12 and 2012–13
Source: BRFSS, 2011-12 and 2012-13
• During the period 2012-13, seven percent of adults 18 and over reported having consumed alcohol on a daily basis, putting them at risk from heavy alcohol use. Eighteen to 25 year olds reported the highest rate at nine percent while 26 to 35 year olds reported the second highest rate at seven percent. Rates of use among 18 to 25 year olds decreased by two percentage points from 2011-12 to 2012-13.
2 Citation from Alcoholscreening.org, a service of Join Together and the Boston University School of Public Health. Retrieved from http://www.alcoholscreening.org/Learn-More.aspx?topicID=8&articleID=26 on 7/16/2015.
7%
11% 9%
6% 6% 7% 9%
8% 7% 6%
0%
5%
10%
15%
20%
25%
18+ 18-25 26-35 36-49 50+
2011-12 2012-13
Hornby Zeller Associates, Inc. 19
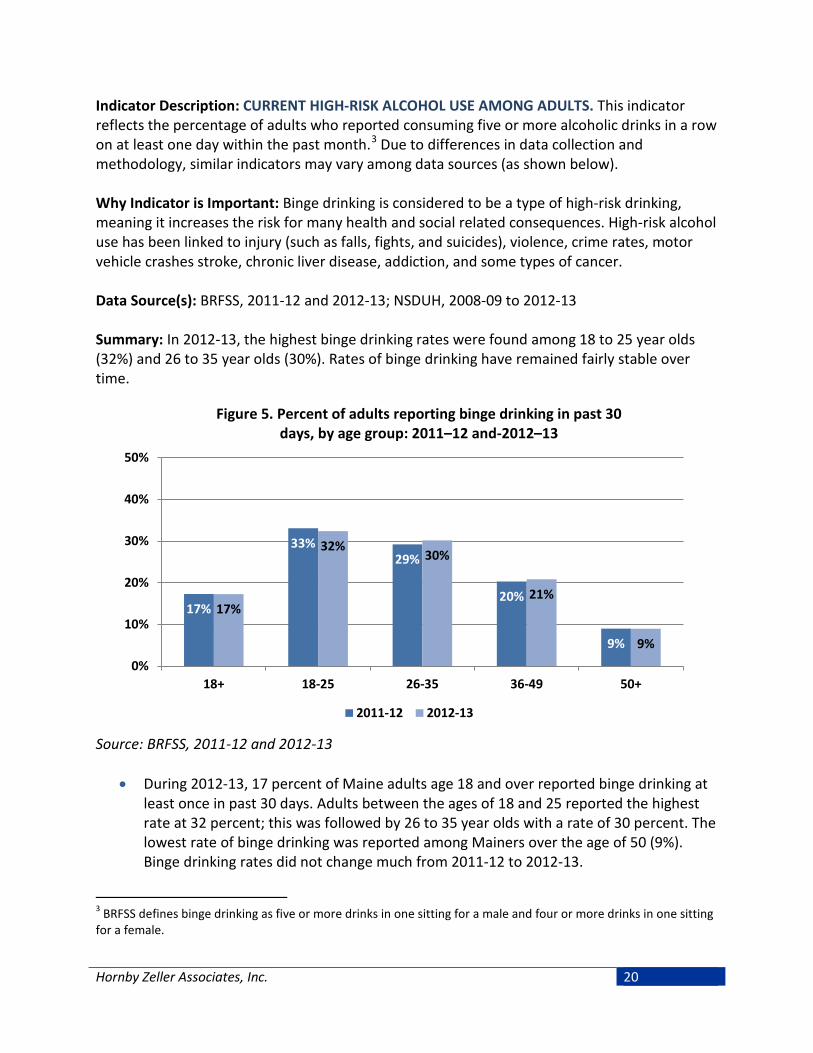
Indicator Description: CURRENT HIGH-RISK ALCOHOL USE AMONG ADULTS. This indicator reflects the percentage of adults who reported consuming five or more alcoholic drinks in a row on at least one day within the past month.3 Due to differences in data collection and methodology, similar indicators may vary among data sources (as shown below). Why Indicator is Important: Binge drinking is considered to be a type of high-risk drinking, meaning it increases the risk for many health and social related consequences. High-risk alcohol use has been linked to injury (such as falls, fights, and suicides), violence, crime rates, motor vehicle crashes stroke, chronic liver disease, addiction, and some types of cancer. Data Source(s): BRFSS, 2011-12 and 2012-13; NSDUH, 2008-09 to 2012-13 Summary: In 2012-13, the highest binge drinking rates were found among 18 to 25 year olds (32%) and 26 to 35 year olds (30%). Rates of binge drinking have remained fairly stable over time.
Figure 5. Percent of adults reporting binge drinking in past 30 days, by age group: 2011–12 and-2012–13
Source: BRFSS, 2011-12 and 2012-13
• During 2012-13, 17 percent of Maine adults age 18 and over reported binge drinking at least once in past 30 days. Adults between the ages of 18 and 25 reported the highest rate at 32 percent; this was followed by 26 to 35 year olds with a rate of 30 percent. The lowest rate of binge drinking was reported among Mainers over the age of 50 (9%). Binge drinking rates did not change much from 2011-12 to 2012-13.
3 BRFSS defines binge drinking as five or more drinks in one sitting for a male and four or more drinks in one sitting for a female.
17%
33% 29%
20%
9%
17%
32% 30%
21%
9% 0%
10%
20%
30%
40%
50%
18+ 18-25 26-35 36-49 50+
2011-12 2012-13
Hornby Zeller Associates, Inc. 20
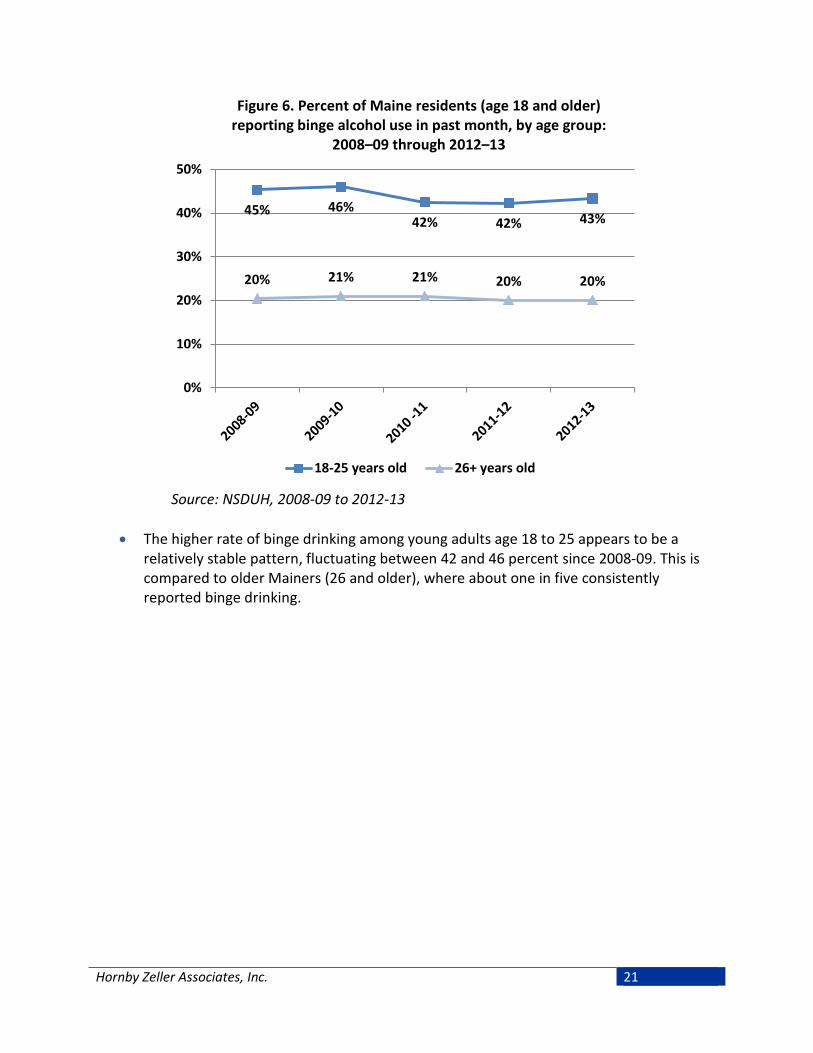
Figure 6. Percent of Maine residents (age 18 and older) reporting binge alcohol use in past month, by age group:
2008–09 through 2012–13
Source: NSDUH, 2008-09 to 2012-13
• The higher rate of binge drinking among young adults age 18 to 25 appears to be a
relatively stable pattern, fluctuating between 42 and 46 percent since 2008-09. This is compared to older Mainers (26 and older), where about one in five consistently reported binge drinking.
45% 46% 42% 42% 43%
20% 21% 21% 20% 20%
0%
10%
20%
30%
40%
50%
18-25 years old 26+ years old
Hornby Zeller Associates, Inc. 21
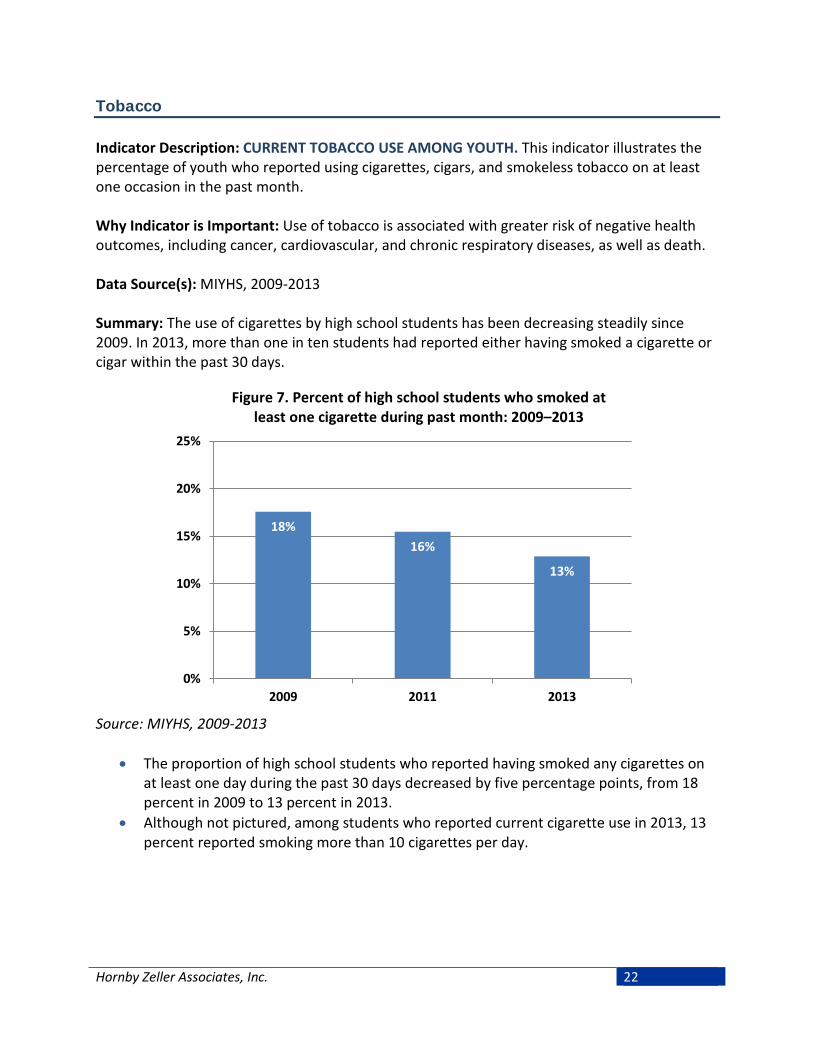
Tobacco Indicator Description: CURRENT TOBACCO USE AMONG YOUTH. This indicator illustrates the percentage of youth who reported using cigarettes, cigars, and smokeless tobacco on at least one occasion in the past month. Why Indicator is Important: Use of tobacco is associated with greater risk of negative health outcomes, including cancer, cardiovascular, and chronic respiratory diseases, as well as death. Data Source(s): MIYHS, 2009-2013 Summary: The use of cigarettes by high school students has been decreasing steadily since 2009. In 2013, more than one in ten students had reported either having smoked a cigarette or cigar within the past 30 days.
Figure 7. Percent of high school students who smoked at least one cigarette during past month: 2009–2013
Source: MIYHS, 2009-2013
• The proportion of high school students who reported having smoked any cigarettes on at least one day during the past 30 days decreased by five percentage points, from 18 percent in 2009 to 13 percent in 2013.
• Although not pictured, among students who reported current cigarette use in 2013, 13 percent reported smoking more than 10 cigarettes per day.
18% 16%
13%
0%
5%
10%
15%
20%
25%
2009 2011 2013
Hornby Zeller Associates, Inc. 22

Figure 8. Percent of high school students who used tobacco during past month, by tobacco type: 2009–2013
Source: MIYHS, 2009-2013
• In 2013, cigarettes continued to be the preferred form of tobacco for high school students during the previous 30 days (13%), closely followed by cigars (11%), and then smokeless tobacco (7%). The rate of cigarette and cigar use has steadily decreased between 2009 and 2013, while the use of smokeless tobacco has remained relatively stable.
18%
14%
8%
16% 13%
8%
13% 11%
7%
0%
5%
10%
15%
20%
25%
Cigarettes Cigars Smokeless Tobacco
2009 2011 2013
Hornby Zeller Associates, Inc. 23

Indicator Description: CIGARETTE USE AMONG ADULTS. This measure depicts cigarette use among adults who reported smoking at least one cigarette in the past month. Why Indicator is Important: Tobacco use has been linked to several negative health outcomes, including cancer, cardiovascular, and chronic respiratory diseases, as well as death. Second-hand smoke is also associated with many negative health outcomes, such as increased colds, flu, asthma, bronchitis, lung cancer, low birth weight babies. Data Source(s): BRFSS, 2011-12 and 2012-13 Summary: During 2012-13, one in five Mainers 18 and older reported smoking at least one cigarette within the past 30 days. Adults between the ages of 26 and 35 were the most likely to smoke cigarettes, with almost one in three having smoked at least one cigarette within the past 30 days.
Figure 9. Past month cigarette use among adults, by age group: BRFSS, 2011–12 and 2012–13
Source: BRFSS, 2011-12 and 2012-13
• During 2012-13, 20 percent of Maine adults reported smoking at least one cigarette in the past 30 days. Mainers ages 26 to 35 reported the highest rate of daily cigarette use, at 32 percent, followed by 18 to 25 year olds at 26 percent, and 36 to 49 year olds at 25 percent. Cigarette use among adults remained relatively stable since 2011-12.
21%
28% 33%
26%
14%
20%
26%
32%
25%
14%
0%
10%
20%
30%
40%
50%
18+ 18-25 26-35 36-49 50+
2011-12 2012-13
Hornby Zeller Associates, Inc. 24
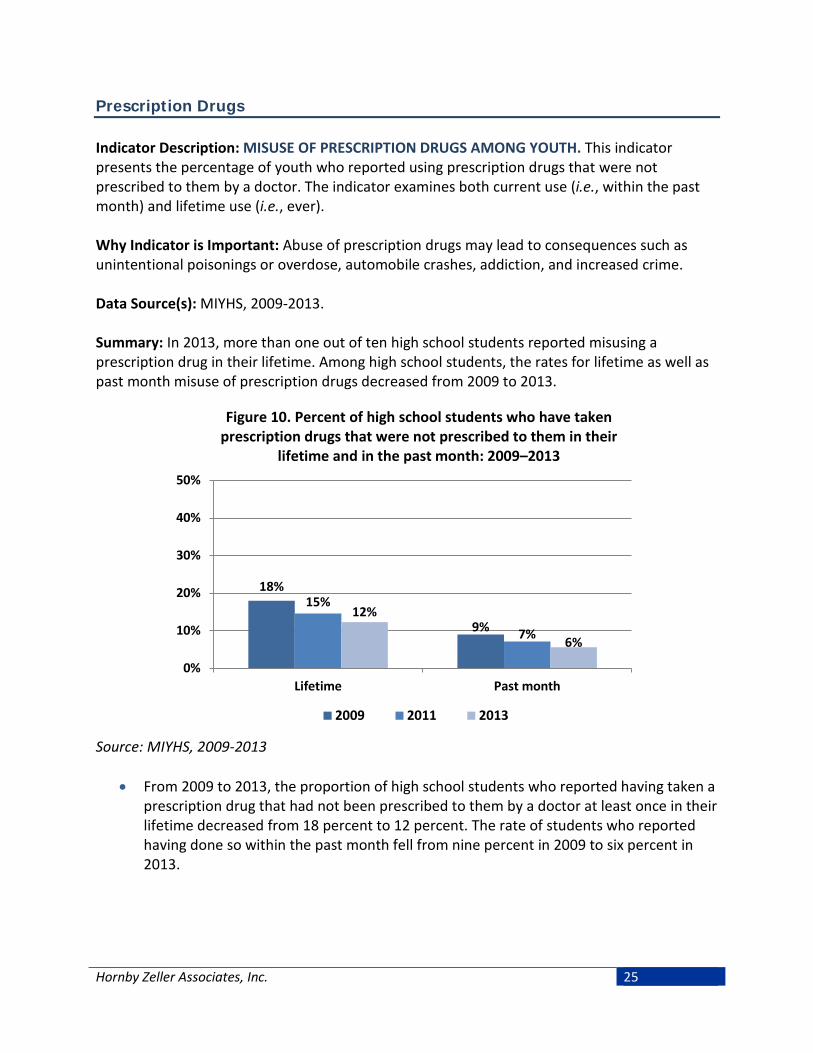
Prescription Drugs Indicator Description: MISUSE OF PRESCRIPTION DRUGS AMONG YOUTH. This indicator presents the percentage of youth who reported using prescription drugs that were not prescribed to them by a doctor. The indicator examines both current use (i.e., within the past month) and lifetime use (i.e., ever). Why Indicator is Important: Abuse of prescription drugs may lead to consequences such as unintentional poisonings or overdose, automobile crashes, addiction, and increased crime. Data Source(s): MIYHS, 2009-2013. Summary: In 2013, more than one out of ten high school students reported misusing a prescription drug in their lifetime. Among high school students, the rates for lifetime as well as past month misuse of prescription drugs decreased from 2009 to 2013.
Figure 10. Percent of high school students who have taken prescription drugs that were not prescribed to them in their
lifetime and in the past month: 2009–2013
Source: MIYHS, 2009-2013
• From 2009 to 2013, the proportion of high school students who reported having taken a prescription drug that had not been prescribed to them by a doctor at least once in their lifetime decreased from 18 percent to 12 percent. The rate of students who reported having done so within the past month fell from nine percent in 2009 to six percent in 2013.
18%
9%
15%
7%
12%
6%
0%
10%
20%
30%
40%
50%
Lifetime Past month
2009 2011 2013
Hornby Zeller Associates, Inc. 25

Indicator Description: NONMEDICAL USE OF PAIN RELEIVERS AMONG ADULTS. This measure reflects the percentage of adults who reported using prescription drugs, particularly prescription pain relievers, for reasons other than their intended purpose. Why Indicator is Important: Abuse of prescription drugs may lead to consequences such as unintentional poisonings, overdose, dependence and increased crime. Data Source(s): NSDUH, 2008-09 to 2012-13 Summary: Non-medical use of prescription pain relievers is more likely among young adults between the ages of 18 and 25 compared to adults age 26 and older. Nearly one in ten 18 to 25 year olds reported having misused pain relievers although this has been decreasing over time.
Figure 11. Non-medical use of pain relievers among Maine residents in the past year, by age group: 2007–08 through
2012–13
Source: NSDUH, 2008-09 to 2012-13
• Among Mainers 18 to 25 years old, nine percent reported non-medical use of pain relievers in the past year in 2011-12, a decrease of five percentage points since 2009-10. Use among those ages 26 and older was consistent at three percent across all years shown.
14% 14%
11% 11% 9%
3% 3% 3% 3% 3%
0%
5%
10%
15%
20%
25%
18-25 year olds 26+ year olds
Hornby Zeller Associates, Inc. 26
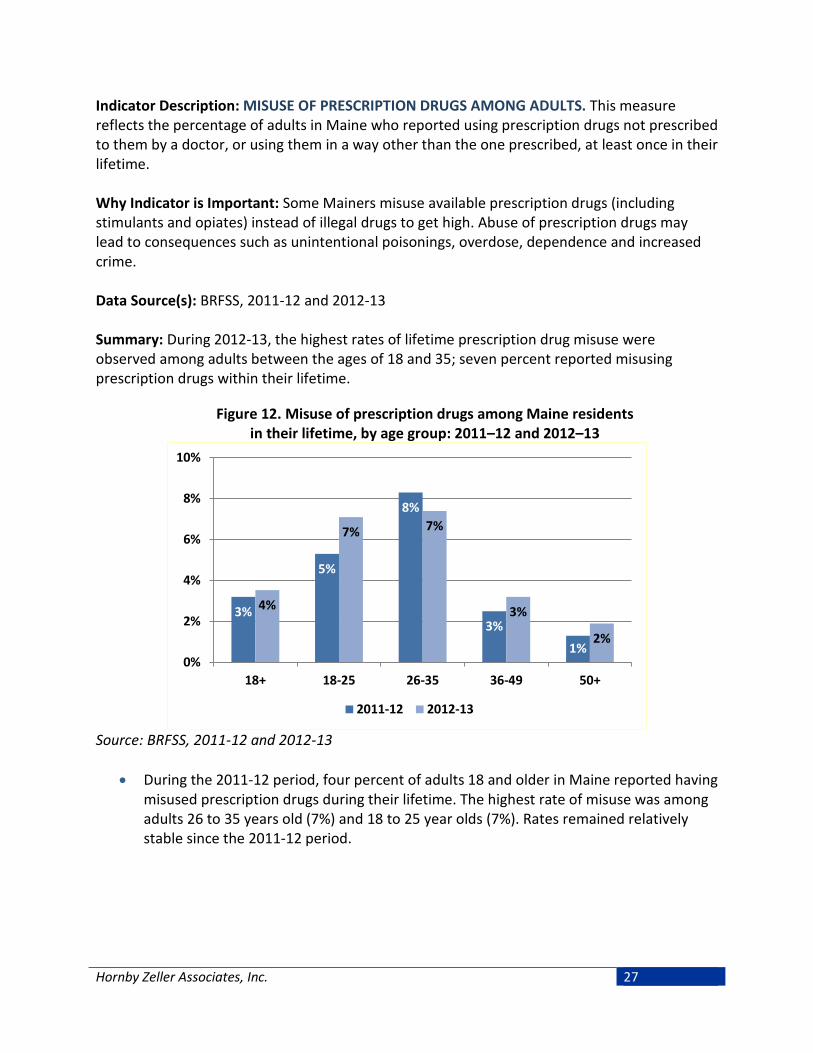
Indicator Description: MISUSE OF PRESCRIPTION DRUGS AMONG ADULTS. This measure reflects the percentage of adults in Maine who reported using prescription drugs not prescribed to them by a doctor, or using them in a way other than the one prescribed, at least once in their lifetime. Why Indicator is Important: Some Mainers misuse available prescription drugs (including stimulants and opiates) instead of illegal drugs to get high. Abuse of prescription drugs may lead to consequences such as unintentional poisonings, overdose, dependence and increased crime. Data Source(s): BRFSS, 2011-12 and 2012-13 Summary: During 2012-13, the highest rates of lifetime prescription drug misuse were observed among adults between the ages of 18 and 35; seven percent reported misusing prescription drugs within their lifetime.
Figure 12. Misuse of prescription drugs among Maine residents in their lifetime, by age group: 2011–12 and 2012–13
Source: BRFSS, 2011-12 and 2012-13
• During the 2011-12 period, four percent of adults 18 and older in Maine reported having misused prescription drugs during their lifetime. The highest rate of misuse was among adults 26 to 35 years old (7%) and 18 to 25 year olds (7%). Rates remained relatively stable since the 2011-12 period.
3%
5%
8%
3% 1%
4%
7% 7%
3%
2%
0%
2%
4%
6%
8%
10%
18+ 18-25 26-35 36-49 50+
2011-12 2012-13
Hornby Zeller Associates, Inc. 27

Other Illegal Drugs Indicator Description: CURRENT MARIJUANA USE. This measure shows the percentage of Mainers who reported using marijuana in the past month. This is presented for high school students and across the lifespan (i.e., among Mainers over the age of 12). Why Indicator is Important: Marijuana can be addictive and is associated with increased risk for respiratory illnesses and memory impairment. Also, youth who begin smoking marijuana at an early age are more likely to develop substance abuse and dependence later in life.4 Data Source(s): MIYHS 2009-2013; NSDUH, 2007-08 to 2011-12; BRFSS, 2011-2012 Summary: In 2013, more than one in five high school students reported using marijuana within the past month; similar rates are seen within the young adult (18 to 25) population. Rates of marijuana use among Mainers have remained stable over time. In 2013, one fifth of high school users started before the age of 13.
Figure 13. Percent of high school students who have used marijuana at least once in the past month: 2009–2013
Source: MIYHS, 2009-2013
• The percentage of high school students who used marijuana one or more times during the previous 30 days has maintained a rate of 22 percent from 2009 to 2013.
• Although not pictured, in 2013, among high school students who had ever used marijuana, 20 percent did so before the age of 13.
4 Kosterman, R., Hawkins, J. D., Guo, J., Catalano, R. F., & Abbott, R. D. (2000). The dynamics of alcohol and marijuana initiation: Patterns and predictors of first use in adolescence. American Journal of Public Health, 90, 360-366.
22% 22% 22%
0%
10%
20%
30%
40%
50%
2009 2011 2013
Hornby Zeller Associates, Inc. 28

Figure 14. Percent of Maine residents (age 18 and older) reporting marijuana use in past month, by age group:
2008–09 through 2012–13
Source: NSDUH, 2008-09 to 2012-13
• One in four (25%) Maine residents between the ages of 18 and 25 used marijuana in the past month in 2012-13, an increase of two percentage points since 2011-12. Marijuana use rates among those 26 and older also observed a slight increase from 2011-12 (6%) to 2012-13 (8%).
26% 27% 24% 23% 25%
8% 7% 6% 6%
8%
0%
10%
20%
30%
40%
50%
18-25 year olds 26+ year olds
Hornby Zeller Associates, Inc. 29
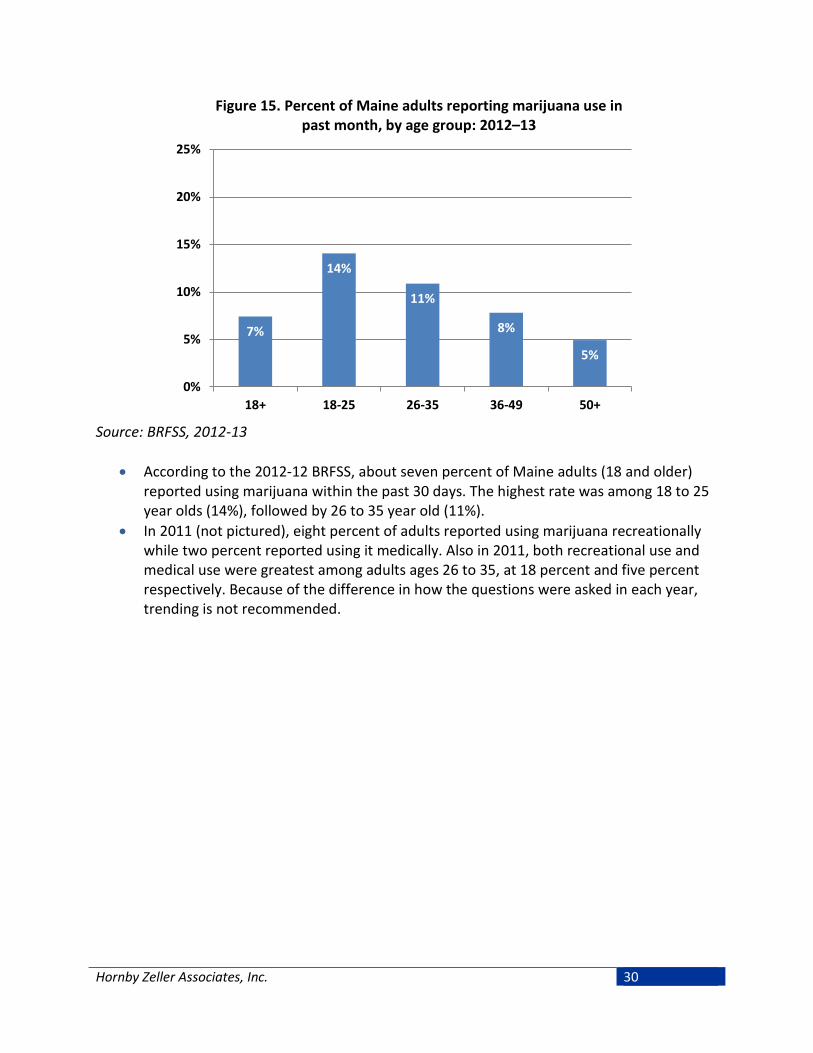
Figure 15. Percent of Maine adults reporting marijuana use in past month, by age group: 2012–13
Source: BRFSS, 2012-13
• According to the 2012-12 BRFSS, about seven percent of Maine adults (18 and older) reported using marijuana within the past 30 days. The highest rate was among 18 to 25 year olds (14%), followed by 26 to 35 year old (11%).
• In 2011 (not pictured), eight percent of adults reported using marijuana recreationally while two percent reported using it medically. Also in 2011, both recreational use and medical use were greatest among adults ages 26 to 35, at 18 percent and five percent respectively. Because of the difference in how the questions were asked in each year, trending is not recommended.
7%
14%
11%
8%
5%
0%
5%
10%
15%
20%
25%
18+ 18-25 26-35 36-49 50+
Hornby Zeller Associates, Inc. 30

Indicator Description: COCAINE USE. This indicator illustrates the percentage of Maine residents who used cocaine. For adults, the measure reflects rates of use within the past year. For youth, the measure shows rates of lifetime use (i.e., if a youth ever used cocaine). Why Indicator is Important: Cocaine is highly addictive. Use of cocaine is associated with adverse health effects such as cardiac events, seizures, and stroke. It also increases the risk of cognitive impairment, injury, and crime. Data Source(s): NSDUH, 2008-09 to 2012-13; MIYHS, 2009-2013 Summary: Among adults, those between the ages of 18 to 25 reported higher rates of cocaine use in the past year than adults 26 and older. The proportion of high school students who have used cocaine in their lifetime is low and decreased slightly from 2011 (7%) to 2013 (6%).
Figure 16. Percent of Maine residents (age 18 and older) reporting cocaine use in past year, by age group: 2008–09
through 2012–13
Source: NSDUH, 2008-09 to 2012-13
• In 2012-13, five percent of young adults ages 18 to 25 reported cocaine use in the past year, compared to just one percent among those 26 years old and older. Rates among 18 to 25 year olds have been declining since 2008-09.
• Although not shown, according to the Maine Integrated Youth Health Survey, the reported rates of lifetime cocaine use among high school students decreased slightly from seven percent in 2011 to six percent in 2013.
8% 7% 6% 6% 5%
2% 1% 1% 1% 1% 0%
5%
10%
15%
20%
25%
18-25 year olds 26+ year olds
Hornby Zeller Associates, Inc. 31
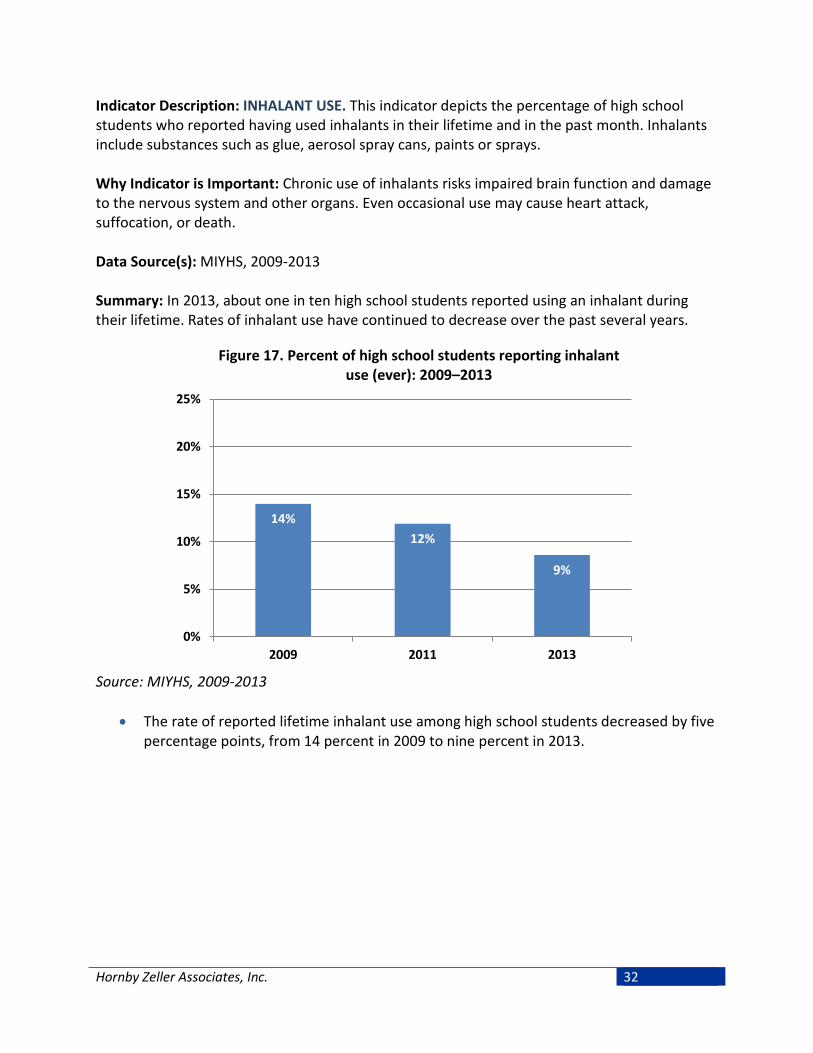
Indicator Description: INHALANT USE. This indicator depicts the percentage of high school students who reported having used inhalants in their lifetime and in the past month. Inhalants include substances such as glue, aerosol spray cans, paints or sprays. Why Indicator is Important: Chronic use of inhalants risks impaired brain function and damage to the nervous system and other organs. Even occasional use may cause heart attack, suffocation, or death. Data Source(s): MIYHS, 2009-2013 Summary: In 2013, about one in ten high school students reported using an inhalant during their lifetime. Rates of inhalant use have continued to decrease over the past several years.
Figure 17. Percent of high school students reporting inhalant use (ever): 2009–2013
Source: MIYHS, 2009-2013
• The rate of reported lifetime inhalant use among high school students decreased by five percentage points, from 14 percent in 2009 to nine percent in 2013.
14% 12%
9%
0%
5%
10%
15%
20%
25%
2009 2011 2013
Hornby Zeller Associates, Inc. 32

Consequences Resulting from Substance Use and Abuse
Both individuals and communities suffer the consequences of substance abuse in terms of increased health care and criminal justice needs, resources, and costs. While a great deal of information regarding substance use can be obtained from the data described in the previous section, information on the effects of that use on individuals and communities can be derived from what has come to be called “consequence” data. Consequences are defined as the social, economic, and health problems associated with the use of alcohol and illicit drugs. Examples of these include illnesses related to alcohol, drug overdose deaths, property and personal crimes, as well as driving accidents, poisonings, and suicides that involve alcohol or drugs. Alcohol and drugs/medications (particularly opiates) are involved in the majority of substance use-related consequences in Maine (e.g., drug affected babies, hospitalizations, poisonings and overdoses). In 2014, there were 961 reports to Child Protective Services regarding infants born affected by substance abuse and these have been steadily rising since 2010. In addition, drug/medication overdoses are most common among those between the ages 26 and 35 while alcohol related overdose responses are most common among those 46 to 55. Substance abuse-related diseases such as stroke, heart attack, or cirrhosis of the liver tend to be more prevalent among men than women; in 2014, men were almost three times as likely to have alcohol-related cirrhosis of the liver than women. Nearly one in four fatal motor vehicle crashes in 2014 were related to alcohol; rates are particularly high among drivers between the ages of 21 to 24. Overall, rates for liquor law violations and OUIs have been remained relatively stable among Maine residents over the past several years. Consequences as a result of street drugs such as heroin use have risen. In recent years, rates in treatment admissions due to heroin among pregnant women have increased significantly. Arrests related to heroin have also increased with one in three DEA drug offenses having involved heroin in 2014. In fact, Maine DEA arrests related to heroin quadrupled from 2010 to 2014. In addition, overdose deaths involving heroin/morphine have increased by 800 percent since 2010.
Hornby Zeller Associates, Inc. 33
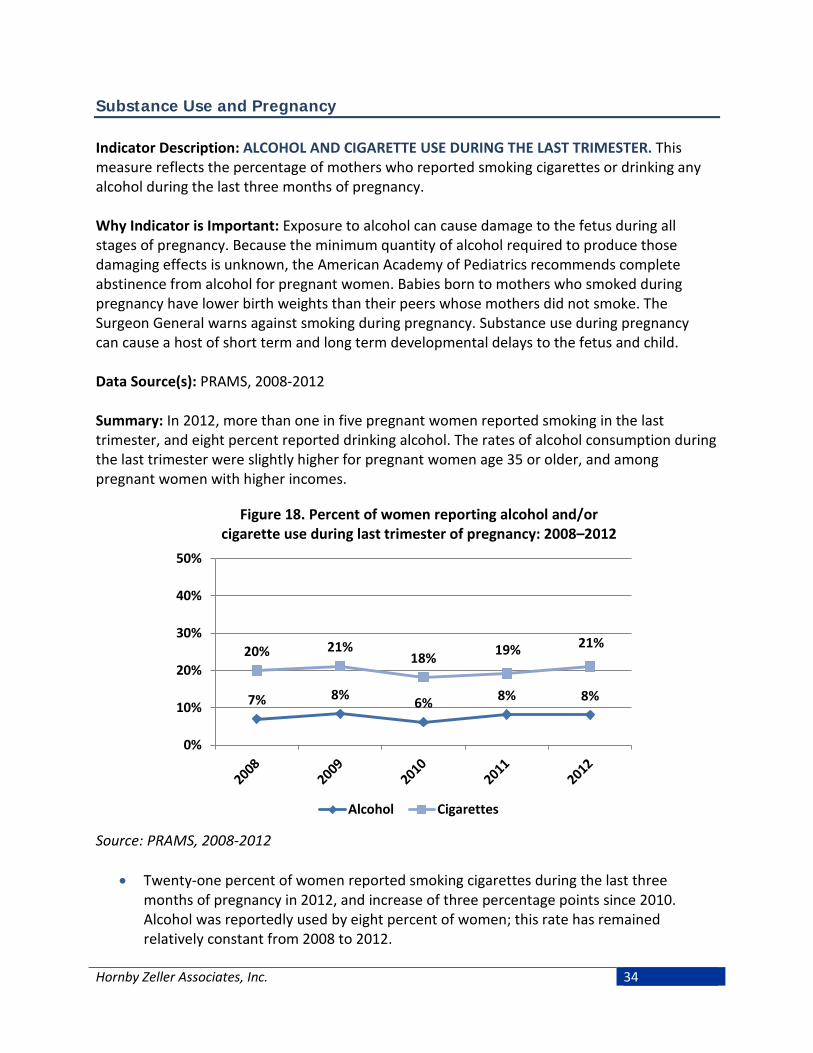
Substance Use and Pregnancy Indicator Description: ALCOHOL AND CIGARETTE USE DURING THE LAST TRIMESTER. This measure reflects the percentage of mothers who reported smoking cigarettes or drinking any alcohol during the last three months of pregnancy. Why Indicator is Important: Exposure to alcohol can cause damage to the fetus during all stages of pregnancy. Because the minimum quantity of alcohol required to produce those damaging effects is unknown, the American Academy of Pediatrics recommends complete abstinence from alcohol for pregnant women. Babies born to mothers who smoked during pregnancy have lower birth weights than their peers whose mothers did not smoke. The Surgeon General warns against smoking during pregnancy. Substance use during pregnancy can cause a host of short term and long term developmental delays to the fetus and child. Data Source(s): PRAMS, 2008-2012 Summary: In 2012, more than one in five pregnant women reported smoking in the last trimester, and eight percent reported drinking alcohol. The rates of alcohol consumption during the last trimester were slightly higher for pregnant women age 35 or older, and among pregnant women with higher incomes.
Figure 18. Percent of women reporting alcohol and/or cigarette use during last trimester of pregnancy: 2008–2012
Source: PRAMS, 2008-2012
• Twenty-one percent of women reported smoking cigarettes during the last three months of pregnancy in 2012, and increase of three percentage points since 2010. Alcohol was reportedly used by eight percent of women; this rate has remained relatively constant from 2008 to 2012.
7% 8% 6% 8% 8%
20% 21% 18% 19% 21%
0%
10%
20%
30%
40%
50%
Alcohol Cigarettes
Hornby Zeller Associates, Inc. 34

Figure 19. Percent of women who reported drinking alcohol during last trimester of pregnancy, by age group: 2007–08 to
2011–12
Source: PRAMS, 2007-08 to 2011-12
• Alcohol use during the last three months of pregnancy increased among pregnant women 35 years and older; from ten percent in 2010-11 to 13 percent in 2011-12. Rates among 25 to 34 year olds have remained stable overtime at eight percent. From 2007-08 to 2011-12, the lowest rates were among women who were 25 and younger, ranging between two and four percent.
2007-08 2008-09 2009-10 2010-11 2011-12<25 years old 4% 5% 4% 2% 4%25-34 years old 7% 8% 8% 8% 8%35+ years old 13% 11% 10% 10% 13%
0%
5%
10%
15%
20%
25%
Hornby Zeller Associates, Inc. 35

Figure 20. Percent of women who reported drinking alcohol during last trimester of pregnancy, by income: 2007–08 to
2011–12
Source: PRAMS, 2007-08 to 2011-12
• In 2011-12, 13 percent of women from households earning $50,000 or more had consumed alcohol during their last trimester, an increase three percentage points since 2009-10.
2007-08 2008-09 2009-10 2010-11 2011-12<$25,000 5% 5% 5% 4% 4%$25,000-$49,000 6% 8% 7% 6% 6%$50,000+ 10% 10% 10% 11% 13%
0%
5%
10%
15%
20%
25%
Hornby Zeller Associates, Inc. 36

Indicator Description: SUBSTANCE ABUSE TREATMENT ADMISSIONS WHILE PREGNANT. This indicator explores the primary substances for which pregnant women sought treatment. Why Indicator is Important: Exposure to alcohol and drugs damage a fetus during all stages of pregnancy. Babies born to mothers who used drugs during pregnancy are at greater risk of experiencing long-term behavioral difficulties and developmental delays. The American Academy of Pediatrics recommends complete abstinence from alcohol and drugs for pregnant women. However, medical professionals advise pregnant women suffering from addiction to seek treatment rather than attempt to quit without medical supervision. Data Source(s): TDS, 2010-2014 Summary: In 2014, almost three percent of all adult women admitted to substance abuse treatment were pregnant. Recently, the proportion of admissions primarily due to synthetic opioids has decreased while the proportion related to heroin has substantially increased.
Figure 21. Percent of pregnant treatment admissions, by primary substance: 2010–2014
Source: TDS, 2010-2014
• In 2014, 267 women admitted to substance abuse treatment were pregnant, a 19 percent decrease since 2013 (328). Of those 267, 42 percent were seeking treatment for synthetic opioids, followed by heroin/morphine (27%), and methadone/ buprenorphine (14%), as the primary reason.
2010 2011 2012 2013 2014Alcohol 11% 12% 9% 7% 8%Marijuana 6% 5% 5% 4% 3%Crack/Cocaine 5% 7% 3% 7% 3%Heroin/Morphine 10% 8% 8% 23% 27%Methadone/Buprenorphine 17% 11% 12% 11% 14%Synthetic Oipiods 50% 53% 60% 46% 42%
0%
20%
40%
60%
80%
Hornby Zeller Associates, Inc. 37

• The proportion of pregnant women who were admitted for treatment primarily due to synthetic opiates has decreased since 2012, from 60 percent to 42 percent. Over the same period, the proportion of pregnant women admitted for heroin increased by 19 percentage points, from eight percent in 2012 to 27 percent in 2014.
Hornby Zeller Associates, Inc. 38

Indicator Description: BABIES BORN AFFECTED BY SUBSTANCES. This measure reflects the number of infants born in Maine where a healthcare provider reported to OCFS that there was reasonable cause to suspect the baby may be affected by illegal substance abuse or demonstrating withdrawal symptoms resulting from prenatal drug exposure (illicit or prescribed) or who have fetal alcohol spectrum disorders. This measure potentially excludes instances where the infant was exposed to substances and did not show withdrawal symptoms after birth, instances where the birth of an infant affected by substances was not reported to OCFS, and any other instances in which there were discrepancies between reporters when interpreting Title 22, §4011-A; notification of prenatal exposure to drugs or having fetal alcohol spectrum disorders.
Why Indicator is Important: Prenatal exposure to alcohol, tobacco, and illicit drugs has the potential to cause a wide spectrum of physical, emotional, and developmental problems for these infants. The harm caused to the child can be significant and long-lasting, especially if the exposure is not detected and the effects are not treated as soon as possible.
Data Source(s): OCFS/MACWIS, 2010-2014
Summary: In 2014, there were 961 reports to Child Protective Services regarding infants born affected by substance abuse. Reports have been steadily rising since 2010.
Figure 22. Number of drug affected baby reports: 2010–2014
Source: OCFS/MACWIS, 2010-2014
• The number of reports to Child Protective Services regarding infants born affected by substance abuse or infants affected by prenatal exposure to drugs has increased dramatically from 2010 (572) to 2014 (961). This represents a 68 percent increase from 2010 to 2014.
572 667
779
927 961
0
250
500
750
1000
1250
2010 2011 2012 2013 2014
Hornby Zeller Associates, Inc. 39
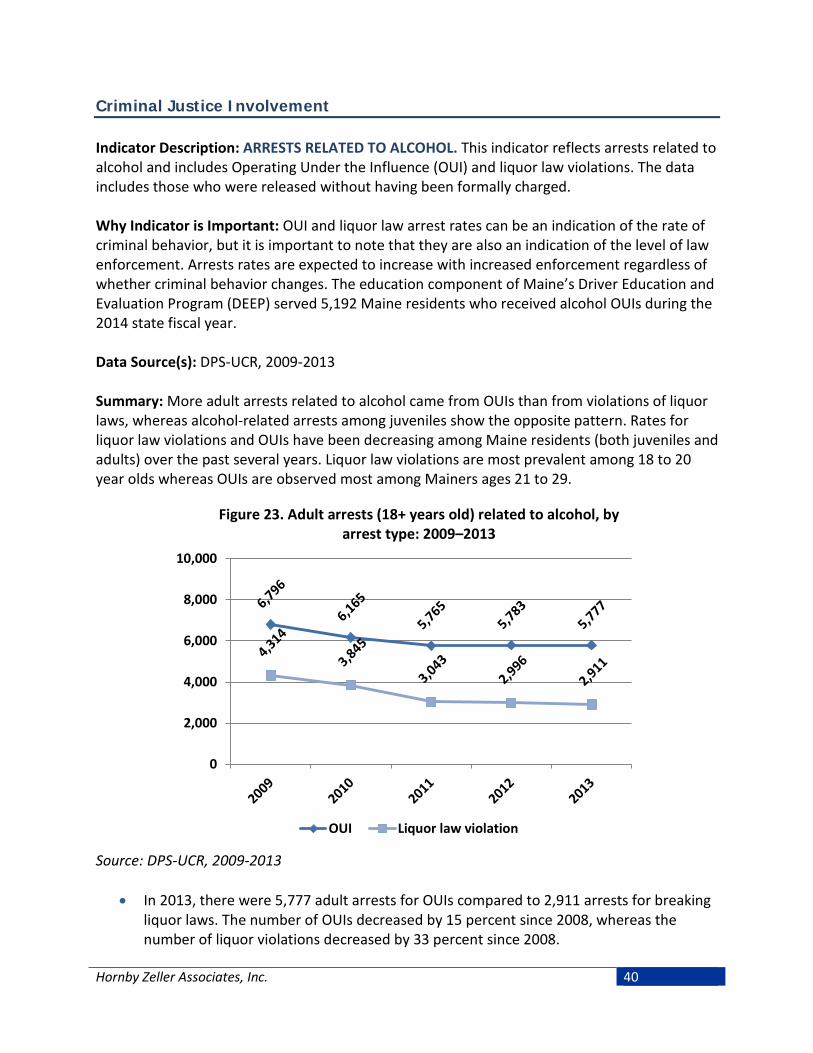
Criminal Justice Involvement Indicator Description: ARRESTS RELATED TO ALCOHOL. This indicator reflects arrests related to alcohol and includes Operating Under the Influence (OUI) and liquor law violations. The data includes those who were released without having been formally charged. Why Indicator is Important: OUI and liquor law arrest rates can be an indication of the rate of criminal behavior, but it is important to note that they are also an indication of the level of law enforcement. Arrests rates are expected to increase with increased enforcement regardless of whether criminal behavior changes. The education component of Maine’s Driver Education and Evaluation Program (DEEP) served 5,192 Maine residents who received alcohol OUIs during the 2014 state fiscal year. Data Source(s): DPS-UCR, 2009-2013 Summary: More adult arrests related to alcohol came from OUIs than from violations of liquor laws, whereas alcohol-related arrests among juveniles show the opposite pattern. Rates for liquor law violations and OUIs have been decreasing among Maine residents (both juveniles and adults) over the past several years. Liquor law violations are most prevalent among 18 to 20 year olds whereas OUIs are observed most among Mainers ages 21 to 29.
Figure 23. Adult arrests (18+ years old) related to alcohol, by arrest type: 2009–2013
Source: DPS-UCR, 2009-2013
• In 2013, there were 5,777 adult arrests for OUIs compared to 2,911 arrests for breaking liquor laws. The number of OUIs decreased by 15 percent since 2008, whereas the number of liquor violations decreased by 33 percent since 2008.
0
2,000
4,000
6,000
8,000
10,000
OUI Liquor law violation
Hornby Zeller Associates, Inc. 40

Figure 24. Juvenile arrests (<18 years old) related to alcohol, by arrest type: 2009–2013
Source: DPS-UCR, 2009-2013
• Alcohol-related arrests among juveniles differ from adult arrests related to alcohol in that there are more arrests for liquor law violations than OUIs. In 2013, there were 725 arrests for breaking liquor laws and 53 for OUI. Juvenile liquor law violations have decreased by about 40 percent since 2009, whereas juvenile OUI arrests have remained relatively stable.
0
250
500
750
1,000
1,250
1,500
OUI Liquor law violation
Hornby Zeller Associates, Inc. 41

Figure 25. Arrests related to alcohol, by age group: 2013
Source: DPS-UCR, 2013
• As previously noted, the number of arrests related to OUI and liquor law violations differs among adults and juveniles. This pattern remains when comparing the number of arrests among those of legal drinking age to those who are under 21. In 2013, there were 725 liquor law violations for people under 18 and 2,172 for people between the ages of 18 to 20. This is compared to 320 liquor law violations for those between the ages of 21 and 29, and even fewer among older age groups.
• Conversely, the opposite can be seen in OUI violations: in 2013, there were 53 arrests for those under the age of 18 and 315 for 18 to 20 year olds, compared to 2,064 OUIs for those between the ages of 21 and 29 (more than any other age group). The number of OUIs appears to decrease across the lifespan.
53 315
2,064
1,277 1,091
748
282
725
2,172
320 95 190 108 26
0
500
1000
1500
2000
2500
Under 18 18 to 20 21 to 29 30 to 39 40 to 49 50 to 59 60+
OUI Liquor law violation
Hornby Zeller Associates, Inc. 42

Indicator Description: LOCAL LAW ENFORCEMENT ARRESTS RELATED TO DRUGS. This indicator reflects the number of arrests made by local law enforcement agencies (not the Maine Drug Enforcement Agency) that were related to drugs and includes manufacturing, sales, and possession. Why Indicator is Important: Arrest rates for drug sales, manufacturing and drug possession can be an indication of the rate of criminal behavior, but it is important to note that they are also an indication of the level of law enforcement. Arrests rates are expected to increase with increased enforcement regardless of whether criminal behavior changes. Data Source(s): DPS-UCR, 2009-2013 Summary: Most drug-related offenses in 2013 were for possession rather than sale and manufacturing. Since 2009, it appears that adult arrests related to drugs have remained stable, while juvenile arrests have generally declined. Six out of ten drug offense arrests for possession are for marijuana.
Figure 26. Local law enforcement adult and juvenile drug offenses, by type: 2013
Source: DPS-UCR, 2013
• Most drug offenses in 2013 for both adults and juveniles were for possession (3,939 for adults, 420 for juveniles) rather than sales/manufacturing (1,159 for adults and 81 for juveniles).
3,939
420
1,159
81 0
1,000
2,000
3,000
4,000
5,000
Adult Juvenile
Possession Sales/manufacturing
Hornby Zeller Associates, Inc. 43
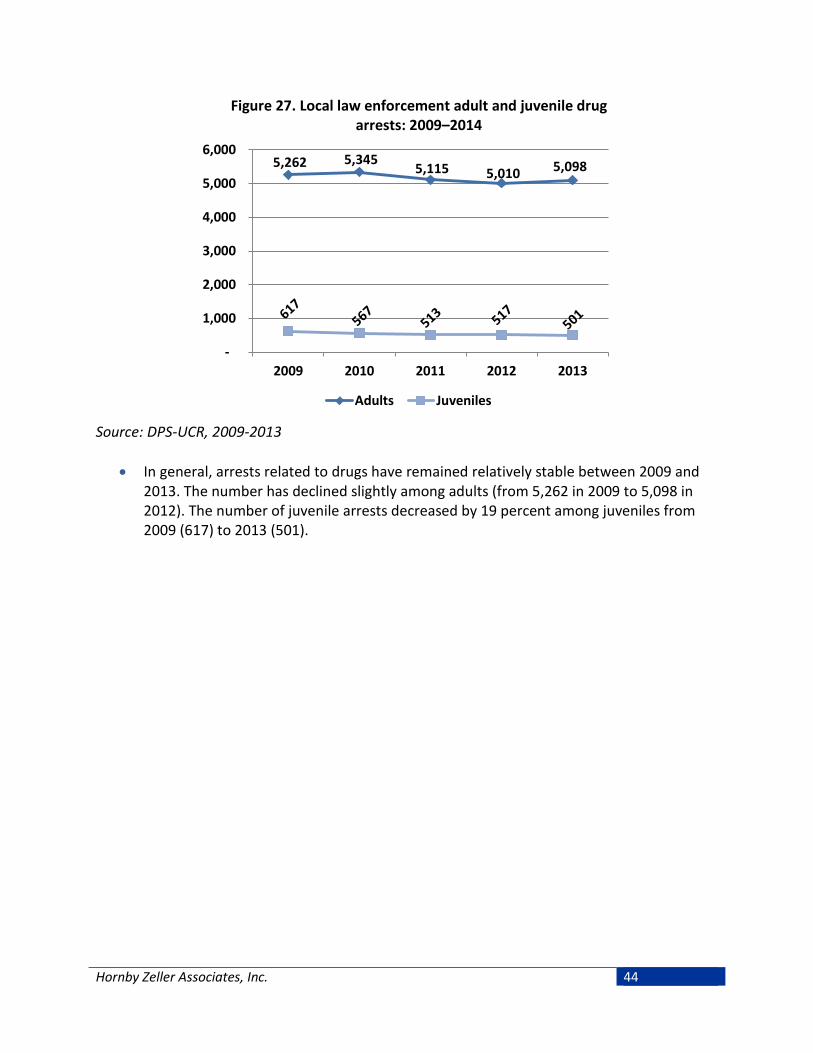
Figure 27. Local law enforcement adult and juvenile drug arrests: 2009–2014
Source: DPS-UCR, 2009-2013
• In general, arrests related to drugs have remained relatively stable between 2009 and 2013. The number has declined slightly among adults (from 5,262 in 2009 to 5,098 in 2012). The number of juvenile arrests decreased by 19 percent among juveniles from 2009 (617) to 2013 (501).
5,262 5,345 5,115 5,010 5,098
-
1,000
2,000
3,000
4,000
5,000
6,000
2009 2010 2011 2012 2013
Adults Juveniles
Hornby Zeller Associates, Inc. 44

Figure 28. Local law enforcement drug offense arrests (all ages) for possession, by drug type: 2009–2014
Source: DPS-UCR, 2009-2013
• In 2013, most drug-related offense arrests made by local law enforcement agencies (not the Maine DEA) for possession were for marijuana (2,769), followed by other dangerous non-narcotics (e.g. barbiturates, Benzedrine) at 656, opium/cocaine derivatives (e.g. morphine, heroin, codeine) at 563, and synthetic narcotics (e.g. Demerol, methadone) at 371. Trends for all drug types mentioned have remained relatively stable since 2009.
2009 2010 2011 2012 2013Opium, cocaine,and derivatives 439 401 486 467 563
Marijuana 2,900 2,872 2,663 2,734 2,769Synthetic narcotics 340 356 411 374 371Other dangerous
non-narcotics 735 761 833 786 656
0
500
1,000
1,500
2,000
2,500
3,000
3,500
Hornby Zeller Associates, Inc. 45
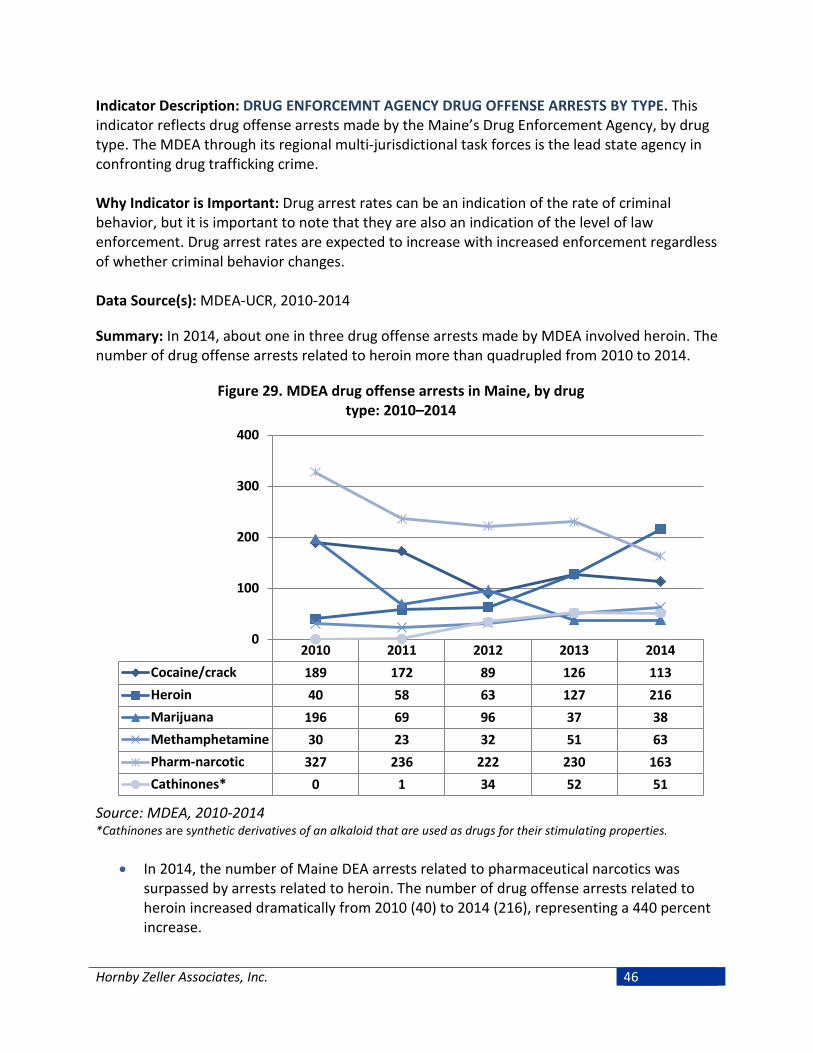
Indicator Description: DRUG ENFORCEMNT AGENCY DRUG OFFENSE ARRESTS BY TYPE. This indicator reflects drug offense arrests made by the Maine’s Drug Enforcement Agency, by drug type. The MDEA through its regional multi-jurisdictional task forces is the lead state agency in confronting drug trafficking crime. Why Indicator is Important: Drug arrest rates can be an indication of the rate of criminal behavior, but it is important to note that they are also an indication of the level of law enforcement. Drug arrest rates are expected to increase with increased enforcement regardless of whether criminal behavior changes. Data Source(s): MDEA-UCR, 2010-2014
Summary: In 2014, about one in three drug offense arrests made by MDEA involved heroin. The number of drug offense arrests related to heroin more than quadrupled from 2010 to 2014.
Figure 29. MDEA drug offense arrests in Maine, by drug type: 2010–2014
Source: MDEA, 2010-2014 *Cathinones are synthetic derivatives of an alkaloid that are used as drugs for their stimulating properties.
• In 2014, the number of Maine DEA arrests related to pharmaceutical narcotics was surpassed by arrests related to heroin. The number of drug offense arrests related to heroin increased dramatically from 2010 (40) to 2014 (216), representing a 440 percent increase.
2010 2011 2012 2013 2014Cocaine/crack 189 172 89 126 113Heroin 40 58 63 127 216Marijuana 196 69 96 37 38Methamphetamine 30 23 32 51 63Pharm-narcotic 327 236 222 230 163Cathinones* 0 1 34 52 51
0
100
200
300
400
Hornby Zeller Associates, Inc. 46

Indicator Description: PHARMACY ROBBERIES. This indicator reflects the number of pharmacy robberies in the state of Maine as tracked by the Maine Drug Enforcement Agency (MDEA). Why Indicator is Important: The number of pharmacy robberies can indicate the demand for pharmaceutical drugs. Pharmacy robberies contribute to a higher demand for law enforcement resources, lost earnings for retailers, and trauma to those involved. In addition, robberies increase the availability of prescription drugs in the community, which contributes to misuse by individuals without a prescription. Data Source(s): MDEA-UCR, 2010-2014
Summary: After observing a steady increase in pharmacy robberies from 2010 to 2012, Maine saw a dramatic decrease in 2013. In 2014, there were 20 pharmacy robberies in Maine.
Figure 30. Number of pharmacy robberies in Maine: 2010–2014
Source: MDEA, 2010-2014
• From 2011 to 2012, the number of pharmacy robberies spiked from 24 to 56. In 2014, there were 20 pharmacy robberies in Maine, representing a 64 percent decrease since 2012.
23 24
56
13 20
0
20
40
60
80
100
2010 2011 2012 2013 2014
Hornby Zeller Associates, Inc. 47

Motor Vehicle Crashes Involving Alcohol Indicator Description: MOTOR VEHICLE CRASHES INVOLVING ALCOHOL. This indicator shows the number of motor vehicle crashes in which alcohol was a factor, meaning at least one driver had consumed alcohol. Why Indicator is Important: About four percent of all reported motor vehicle crashes involve alcohol. However, the resulting injuries and fatalities from alcohol-related crashes tend to be much higher. Motor vehicle crashes are the second leading cause of traumatic brain injury, with 29 percent of traumatic brain injuries occurring from motor vehicle crashes.5 Data Source(s): MDOT, BHS, 2010-2014 Summary: While the number of alcohol-related motor vehicle crashes has fluctuated from year to year, the proportion of alcohol related motor vehicle crashes has observed an overall decrease within the past several years.
Figure 31. Number of motor vehicle crashes, by whether they involved alcohol: 2010–2014
Source: MDOT, BHS, 2010-2014
• Although the overall number of motor vehicle crashes has steadily increased from 2010 to 2014, crashes related to alcohol have decreased from 1,307 (4.7%) in 2010 to 1,203 (3.8%) in 2014.
5 2006 Maine Injury Report, Maine Center for Disease Control, Injury Prevention Program. Retrieved on 5/1/2014 from http://www.maine.gov/dhhs/mecdc/population-health/inj/documents/final08year3maine2006injuryreport.pdf
26,587 27,463 27,308 29,346 30,529
1307 1186 1215 1164 1203
-
5,000
10,000
15,000
20,000
25,000
30,000
35,000
2010 2011 2012 2013 2014
Non-Alcohol Related Alcohol Related
Hornby Zeller Associates, Inc. 48
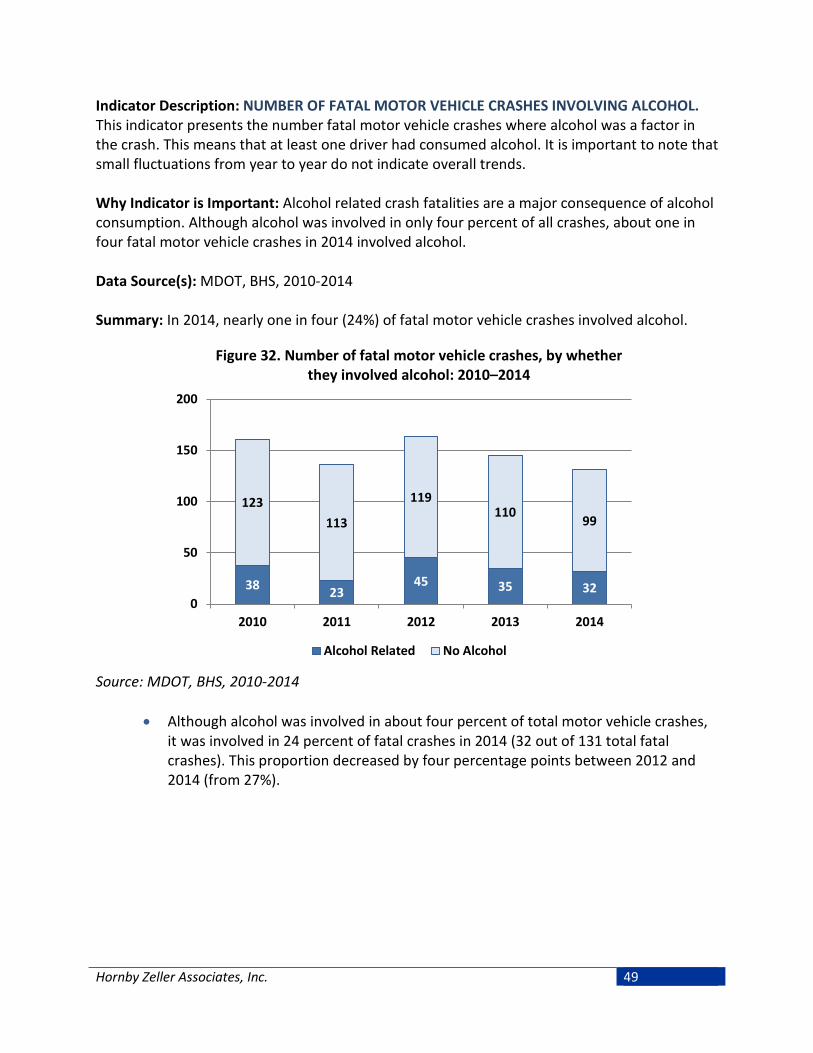
Indicator Description: NUMBER OF FATAL MOTOR VEHICLE CRASHES INVOLVING ALCOHOL. This indicator presents the number fatal motor vehicle crashes where alcohol was a factor in the crash. This means that at least one driver had consumed alcohol. It is important to note that small fluctuations from year to year do not indicate overall trends. Why Indicator is Important: Alcohol related crash fatalities are a major consequence of alcohol consumption. Although alcohol was involved in only four percent of all crashes, about one in four fatal motor vehicle crashes in 2014 involved alcohol. Data Source(s): MDOT, BHS, 2010-2014 Summary: In 2014, nearly one in four (24%) of fatal motor vehicle crashes involved alcohol.
Figure 32. Number of fatal motor vehicle crashes, by whether they involved alcohol: 2010–2014
Source: MDOT, BHS, 2010-2014
• Although alcohol was involved in about four percent of total motor vehicle crashes, it was involved in 24 percent of fatal crashes in 2014 (32 out of 131 total fatal crashes). This proportion decreased by four percentage points between 2012 and 2014 (from 27%).
38 23 45 35 32
123 113
119 110 99
0
50
100
150
200
2010 2011 2012 2013 2014
Alcohol Related No Alcohol
Hornby Zeller Associates, Inc. 49

Indicator Description: ALCOHOL RELATED MOTOR VEHICLE CRASH RATE. This indicator presents the number of motor vehicle crashes involving alcohol (drivers with a blood alcohol content of .08 or greater), relative to the licensed population. The rate per 100,000 allows us to see frequency with which an occurrence shows up within a population over time. In this case, the population is the number of licensees (among a particular age group) in Maine. Where applicable, the number of licensees used to calculate the rate reflects the relevant age group or gender. Why Indicator is Important: Nearly one in four of all motor vehicle crashes resulting in fatalities involve alcohol. Data Source(s): MDOT, BHS, 2010-2014 Summary: In 2014, drivers between the ages of 21 and 24 had the highest alcohol-related crash rates, followed by drivers between the ages of 25 to 34 as well as drivers 16 to 20. Rates among 21 to 24 year olds have been generally increasing since 2011.
Figure 33. Alcohol-related motor vehicle crash rate per 100,000 licensees, by age group: 2010–2014
Source: MDOT, BHS, 2010-2014
• Maine drivers ages 21 to 24 had the highest alcohol-related crash rate in 2014 (463.6 per 100,000 licensees), representing a substantial increase from 2013 (374.6 per 100,000 licensees).
• In 2014, the second highest rates of alcohol-related motor vehicle crashes were observed among drivers between the ages of 25 to 34 (199.3 per 100,000 licensees) and drivers ages 16 to 20 (199.2 per 100,000 licensees).
16+ 16-20 21-24 25-34 35-44 45-54 55+2010 126.5 217.9 432.7 237.7 145.2 95.1 31.52011 116.6 212.4 303.2 225.7 130.6 93.3 36.62012 119.9 176.9 389.2 222.9 132.1 96.8 37.42013 114.1 160.7 374.6 226.4 132.8 89.9 31.82014 118.1 199.2 463.6 199.3 137.9 91.7 34.3
0
100
200
300
400
500
Hornby Zeller Associates, Inc. 50
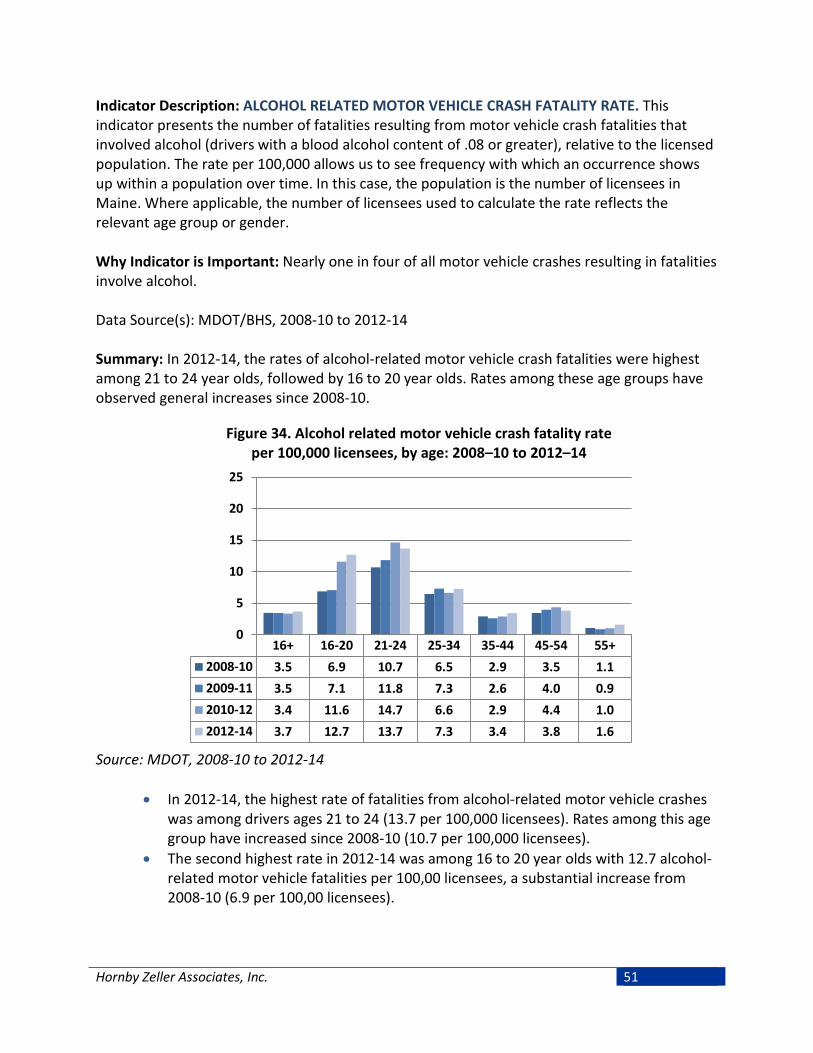
Indicator Description: ALCOHOL RELATED MOTOR VEHICLE CRASH FATALITY RATE. This indicator presents the number of fatalities resulting from motor vehicle crash fatalities that involved alcohol (drivers with a blood alcohol content of .08 or greater), relative to the licensed population. The rate per 100,000 allows us to see frequency with which an occurrence shows up within a population over time. In this case, the population is the number of licensees in Maine. Where applicable, the number of licensees used to calculate the rate reflects the relevant age group or gender. Why Indicator is Important: Nearly one in four of all motor vehicle crashes resulting in fatalities involve alcohol. Data Source(s): MDOT/BHS, 2008-10 to 2012-14 Summary: In 2012-14, the rates of alcohol-related motor vehicle crash fatalities were highest among 21 to 24 year olds, followed by 16 to 20 year olds. Rates among these age groups have observed general increases since 2008-10.
Figure 34. Alcohol related motor vehicle crash fatality rate per 100,000 licensees, by age: 2008–10 to 2012–14
Source: MDOT, 2008-10 to 2012-14
• In 2012-14, the highest rate of fatalities from alcohol-related motor vehicle crashes was among drivers ages 21 to 24 (13.7 per 100,000 licensees). Rates among this age group have increased since 2008-10 (10.7 per 100,000 licensees).
• The second highest rate in 2012-14 was among 16 to 20 year olds with 12.7 alcohol-related motor vehicle fatalities per 100,00 licensees, a substantial increase from 2008-10 (6.9 per 100,00 licensees).
16+ 16-20 21-24 25-34 35-44 45-54 55+2008-10 3.5 6.9 10.7 6.5 2.9 3.5 1.12009-11 3.5 7.1 11.8 7.3 2.6 4.0 0.92010-12 3.4 11.6 14.7 6.6 2.9 4.4 1.02012-14 3.7 12.7 13.7 7.3 3.4 3.8 1.6
0
5
10
15
20
25
Hornby Zeller Associates, Inc. 51
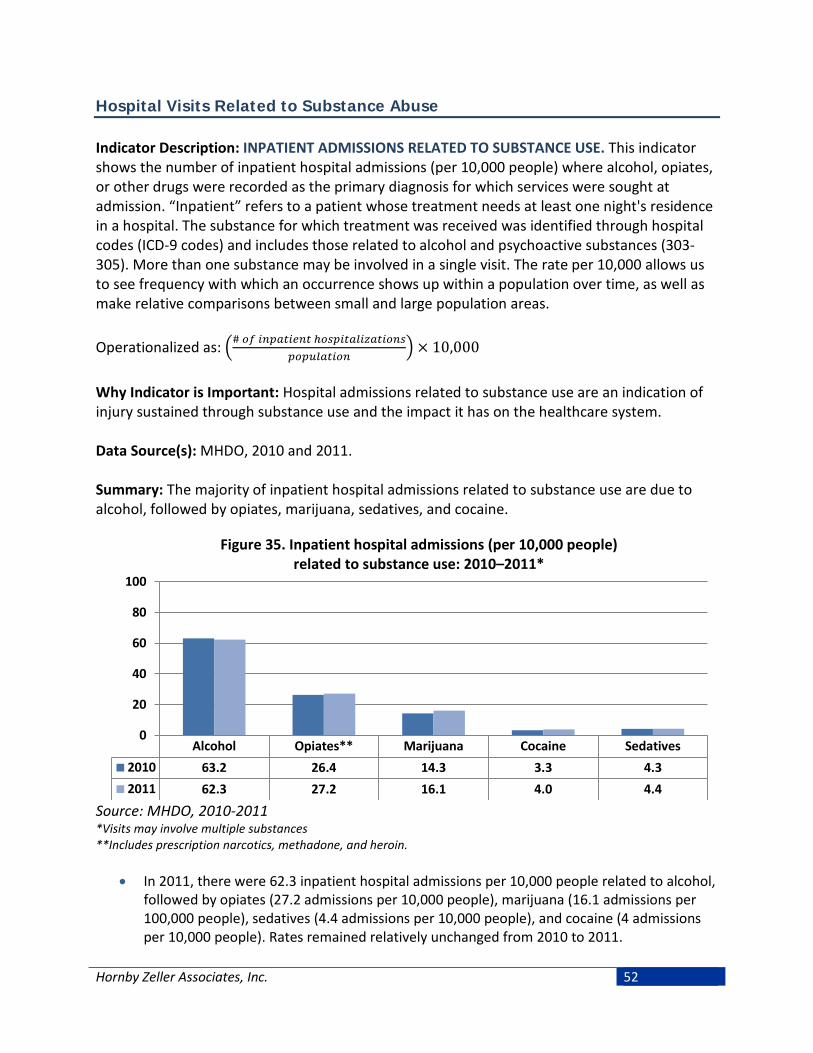
Hospital Visits Related to Substance Abuse Indicator Description: INPATIENT ADMISSIONS RELATED TO SUBSTANCE USE. This indicator shows the number of inpatient hospital admissions (per 10,000 people) where alcohol, opiates, or other drugs were recorded as the primary diagnosis for which services were sought at admission. “Inpatient” refers to a patient whose treatment needs at least one night's residence in a hospital. The substance for which treatment was received was identified through hospital codes (ICD-9 codes) and includes those related to alcohol and psychoactive substances (303-305). More than one substance may be involved in a single visit. The rate per 10,000 allows us to see frequency with which an occurrence shows up within a population over time, as well as make relative comparisons between small and large population areas. Operationalized as: �# 𝑜𝑜𝑜𝑜 𝑖𝑖𝑖𝑖𝑖𝑖𝑖𝑖𝑖𝑖𝑖𝑖𝑖𝑖𝑖𝑖𝑖𝑖 ℎ𝑜𝑜𝑜𝑜𝑖𝑖𝑖𝑖𝑖𝑖𝑖𝑖𝑜𝑜𝑖𝑖𝑜𝑜𝑖𝑖𝑖𝑖𝑖𝑖𝑜𝑜𝑖𝑖𝑜𝑜
𝑖𝑖𝑜𝑜𝑖𝑖𝑝𝑝𝑜𝑜𝑖𝑖𝑖𝑖𝑖𝑖𝑜𝑜𝑖𝑖� × 10,000
Why Indicator is Important: Hospital admissions related to substance use are an indication of injury sustained through substance use and the impact it has on the healthcare system. Data Source(s): MHDO, 2010 and 2011. Summary: The majority of inpatient hospital admissions related to substance use are due to alcohol, followed by opiates, marijuana, sedatives, and cocaine.
Figure 35. Inpatient hospital admissions (per 10,000 people) related to substance use: 2010–2011*
Source: MHDO, 2010-2011 *Visits may involve multiple substances **Includes prescription narcotics, methadone, and heroin.
• In 2011, there were 62.3 inpatient hospital admissions per 10,000 people related to alcohol, followed by opiates (27.2 admissions per 10,000 people), marijuana (16.1 admissions per 100,000 people), sedatives (4.4 admissions per 10,000 people), and cocaine (4 admissions per 10,000 people). Rates remained relatively unchanged from 2010 to 2011.
Alcohol Opiates** Marijuana Cocaine Sedatives2010 63.2 26.4 14.3 3.3 4.32011 62.3 27.2 16.1 4.0 4.4
0
20
40
60
80
100
Hornby Zeller Associates, Inc. 52

Indicator Description: OUTPATIENT HOSPITAL VISITS RELATED TO SUBSTANCE USE. This indicator shows the number of outpatient hospital admissions (per 10,000 people) where alcohol, opiates, or other drugs was recorded as the primary diagnosis for which services were received. “Outpatient” refers to patients who receive treatment at a hospital or clinic but are not admitted overnight. The substance for which treatment was received was identified through hospital codes (ICD-9 codes) and includes those related to alcohol psychoactive substances (303-305). The rate per 10,000 allows us to see frequency with which an occurrence shows up within a population over time, as well as make relative comparisons between small and large population areas. Operationalized as: �# 𝑜𝑜𝑜𝑜 𝑜𝑜𝑝𝑝𝑖𝑖𝑖𝑖𝑖𝑖𝑖𝑖𝑖𝑖𝑖𝑖𝑖𝑖𝑖𝑖 ℎ𝑜𝑜𝑜𝑜𝑖𝑖𝑖𝑖𝑖𝑖𝑖𝑖𝑜𝑜𝑖𝑖𝑜𝑜𝑖𝑖𝑖𝑖𝑖𝑖𝑜𝑜𝑖𝑖𝑜𝑜
𝑖𝑖𝑜𝑜𝑖𝑖𝑝𝑝𝑜𝑜𝑖𝑖𝑖𝑖𝑖𝑖𝑜𝑜𝑖𝑖� × 10,000
Why Indicator is Important: Outpatient hospital visits related to substance use are an indication of injury sustained through substance use and the impact it has on the healthcare system. Data Source(s): MHDO, 2010 and 2011 Summary: In 2010 and 2011, most outpatient hospital admissions related to substance use were due to opiates and alcohol, followed by marijuana, cocaine, and sedatives.
Figure 36. Outpatient hospital admissions (per 10,000 people) related to substance use (2010–2011)*
Source: MHDO, 2010-2011 *Visits may involve multiple substances **Includes prescription narcotics, methadone, and heroin.
• In 2011, there were 300.4 inpatient hospital admissions per 10,000 people related to opiates, followed closely by alcohol (291.1 admissions per 10,000 people), marijuana (61.8 admissions per 100,000 people), cocaine (21.3 admissions per 10,000 people), and sedatives (19.7 admissions per 10,000 people). Rates remained relatively stable from 2010 to 2011.
Opiates** Alcohol Marijuana Cocaine Sedative2010 322.4 286.5 55.6 18.5 12.72011 300.4 291.1 61.8 21.3 19.7
0
100
200
300
400
500
Hornby Zeller Associates, Inc. 53

Indicator Description: POISONING CASES DOCUMENTED BY THE POISON CENTER. This measure reflects the number of calls to the Northern New England Poison Center in which the Center determined that a poisoning occurred. These calls are for the state of Maine only. The Center reports poisonings in three categories: unintentional (i.e., accidental); suspected substance abuse cases (i.e., intent is for an individual to get high); and suspected suicides (i.e., individual attempted suicide). The categories reflect the Center’s determination based on the caller’s self-report and are not considered clinical or medical diagnoses. Why Indicator is Important: The exposure to and ingestion of damaging substances can have many physiologic side effects. Poisonings can be influenced by programs to prevent substance abuse, accidental poisoning, suicide and fatal interaction among medications. Data Source(s): NNEPC, 2010-2014 Summary: In 2014, about one out of 20 calls to the poison center were related to substance abuse while almost one in seven poisonings were suspected as suicide attempts.
Figure 37. Poisonings reported to Northern New England Poison Center, by intent: 2010–2014
Source: NNEPC, 2010-2014
• The majority of calls to the Northern New England Poison Center between 2010 and
2014 in which a poisoning occurred were related to unintentional poisonings. It appears that the number of poisonings related to substance abuse have decreased by 23 percent from 2012 (557) to 2014 (427). About four percent of all poisoning calls received in 2014 were related to substance abuse.
• In 2013, 15 percent of poisoning cases involved suspected suicide. The number of suspected suicide cases has remained relatively stable for the past several years.
11,069 10,706 9,751 9,089 8,747
1,479 1,598 1,635
1,608 1,613
378 532 557
395 427
0
2,500
5,000
7,500
10,000
12,500
15,000
2010 2011 2012 2013 2014
Unintentional Suspected suicide Substance abuse
Hornby Zeller Associates, Inc. 54

Overdoses and Related Deaths Indicator Description: OVERDOSES. This indicator shows the number of persons receiving help from Emergency Medical Services (EMS) related to an overdose from 2011 to 2014. Why Indicator is Important: Overdosing on a substance can cause serious physical harm resulting in hospitalization and even death. Responding to overdoses also uses valuable EMS resources. Data Source(s): Emergency Medical Services, 2011-2014 Summary: In 2014, over half of overdose responses were related to drugs or medications. Drug/medication overdoses are most common among those between the ages 26 and 35 while alcohol-related overdose responses are most common among those who are between 46 and 55 years old.
Figure 38. Number of overdose EMS responses, by type: 2011–2014
Source: EMS, 2011-2014
• In 2014, Emergency Medical Services helped 5,296 individuals experiencing an overdose, a 24 percent increase since 2011 (4,260). The majority of overdose responses during 2014 were related to drugs or medications. In 2014, drug or medication related overdose responses accounted for 56 percent of total overdose responses, up from 51 percent in 2011.
• Overdose responses related to alcohol decreased by ten percent from 2013 (2,468) to 2014 (2,209). In 2014, responses related to alcohol accounted for about 42 percent of total overdose responses; this proportion has remained relatively stable since 2011.
2011 2012 2013 2014Drug/Medication 2,189 3,465 3,217 2,947Alcohol 2,031 2,469 2,468 2,209
-
1,000
2,000
3,000
4,000
Hornby Zeller Associates, Inc. 55
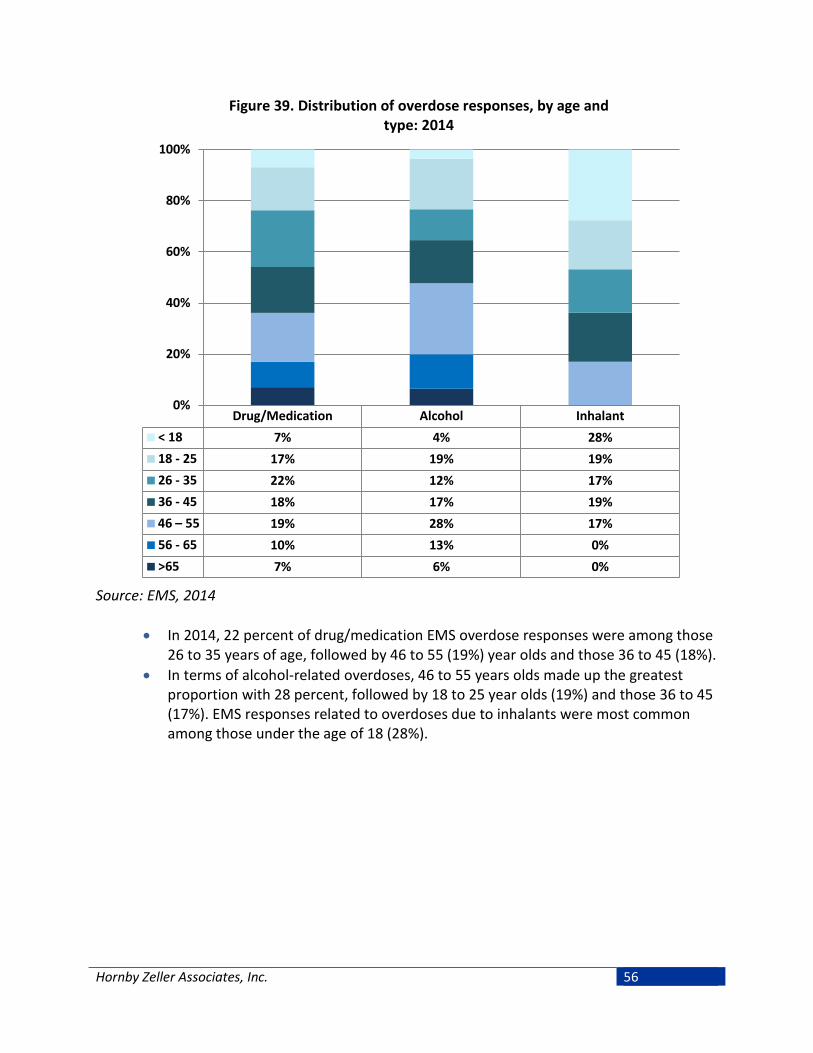
Figure 39. Distribution of overdose responses, by age and type: 2014
Source: EMS, 2014
• In 2014, 22 percent of drug/medication EMS overdose responses were among those 26 to 35 years of age, followed by 46 to 55 (19%) year olds and those 36 to 45 (18%).
• In terms of alcohol-related overdoses, 46 to 55 years olds made up the greatest proportion with 28 percent, followed by 18 to 25 year olds (19%) and those 36 to 45 (17%). EMS responses related to overdoses due to inhalants were most common among those under the age of 18 (28%).
Drug/Medication Alcohol Inhalant< 18 7% 4% 28%18 - 25 17% 19% 19%26 - 35 22% 12% 17%36 - 45 18% 17% 19%46 – 55 19% 28% 17%56 - 65 10% 13% 0%>65 7% 6% 0%
0%
20%
40%
60%
80%
100%
Hornby Zeller Associates, Inc. 56
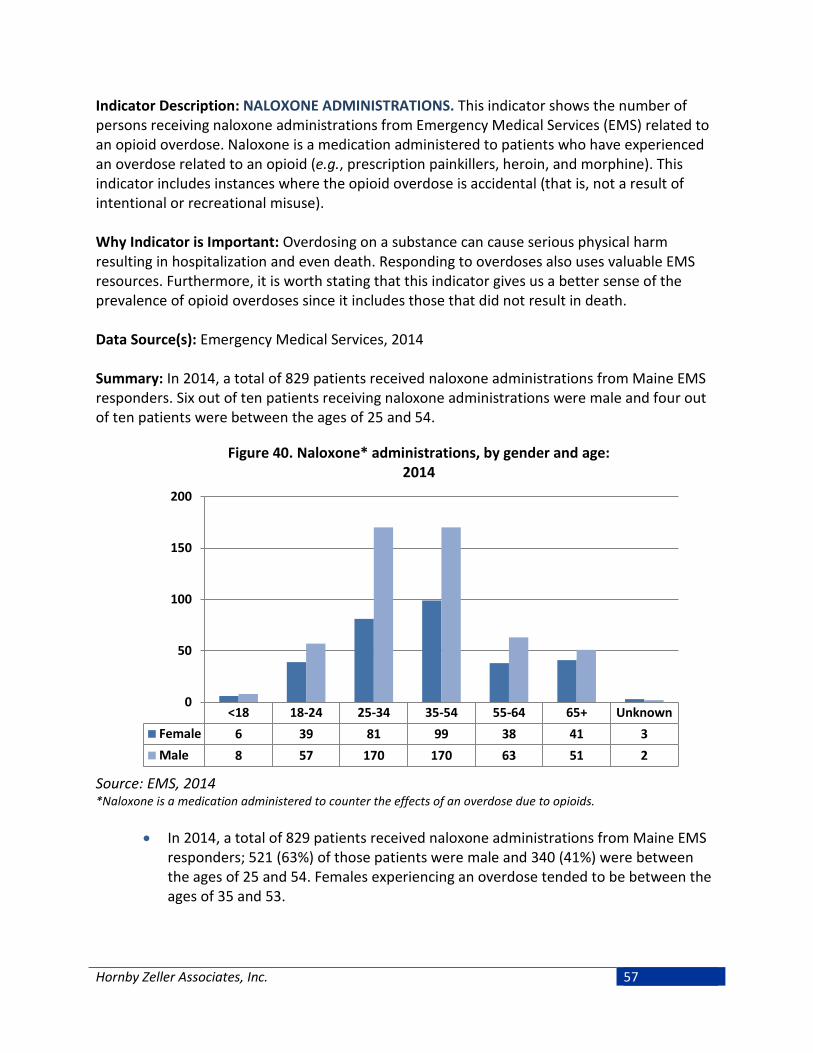
Indicator Description: NALOXONE ADMINISTRATIONS. This indicator shows the number of persons receiving naloxone administrations from Emergency Medical Services (EMS) related to an opioid overdose. Naloxone is a medication administered to patients who have experienced an overdose related to an opioid (e.g., prescription painkillers, heroin, and morphine). This indicator includes instances where the opioid overdose is accidental (that is, not a result of intentional or recreational misuse). Why Indicator is Important: Overdosing on a substance can cause serious physical harm resulting in hospitalization and even death. Responding to overdoses also uses valuable EMS resources. Furthermore, it is worth stating that this indicator gives us a better sense of the prevalence of opioid overdoses since it includes those that did not result in death. Data Source(s): Emergency Medical Services, 2014 Summary: In 2014, a total of 829 patients received naloxone administrations from Maine EMS responders. Six out of ten patients receiving naloxone administrations were male and four out of ten patients were between the ages of 25 and 54.
Figure 40. Naloxone* administrations, by gender and age: 2014
Source: EMS, 2014 *Naloxone is a medication administered to counter the effects of an overdose due to opioids.
• In 2014, a total of 829 patients received naloxone administrations from Maine EMS responders; 521 (63%) of those patients were male and 340 (41%) were between the ages of 25 and 54. Females experiencing an overdose tended to be between the ages of 35 and 53.
<18 18-24 25-34 35-54 55-64 65+ UnknownFemale 6 39 81 99 38 41 3Male 8 57 170 170 63 51 2
0
50
100
150
200
Hornby Zeller Associates, Inc. 57

Indicator Description: DEATHS DUE TO OVERDOSE. This measure reflects the number of deaths where the cause of death was directly related to the consumption of one or more substances. This excludes deaths where a substance may have been ingested prior to engaging in a behavior that resulted in death (e.g., drunk driving) or where lifetime substance use and abuse may have impacted health (e.g., cirrhosis). Pharmaceuticals are drugs used in medical treatment; illicit drugs are those illegally produced and sold outside of medical channels. Why Indicator is Important: One of the most extreme consequences of alcohol and drug abuse is overdose death, where the substance(s) played a direct role in an individual’s death. These are seen as potentially preventable deaths. Data Source(s): Office of Chief Medical Examiner, 2010-20146 Summary: In 2014, there were 208 overdose deaths due to substance use in Maine; representing an 18 percent increase since 2013. In 2014, the vast majority of overdose deaths were related to pharmaceutical drugs. A dramatic increase (340%) in the number of illicit drug-related overdose deaths was observed from 2011 to 2014.
Figure 41. Number of deaths* caused by pharmaceuticals and/or illicit drugs: 2010–2014
Source: Office of the Chief Medical Examiner, 2010-2014 *Deaths involving pharmaceuticals and illicit drugs are not mutually exclusive.
• The overall number of overdose deaths increased from 155 in 2011 to 208 in 2014, representing a 34 percent increase. In 2014, 186 overdose deaths (89%) were related to pharmaceutical drugs. The number of overdose deaths related to illicit drugs saw a dramatic increase from 2011 (17) to 2014 (75), which represents a 340 percent increase.
6 Sorg, Marcella H. Margaret Chase Smith Policy Center, University of Maine.
2010 2011 2012 2013 2014Pharmaceutical 160 140 140 105 186Illicit 17 17 39 47 75All 167 155 163 176 208
0
50
100
150
200
250
Hornby Zeller Associates, Inc. 58
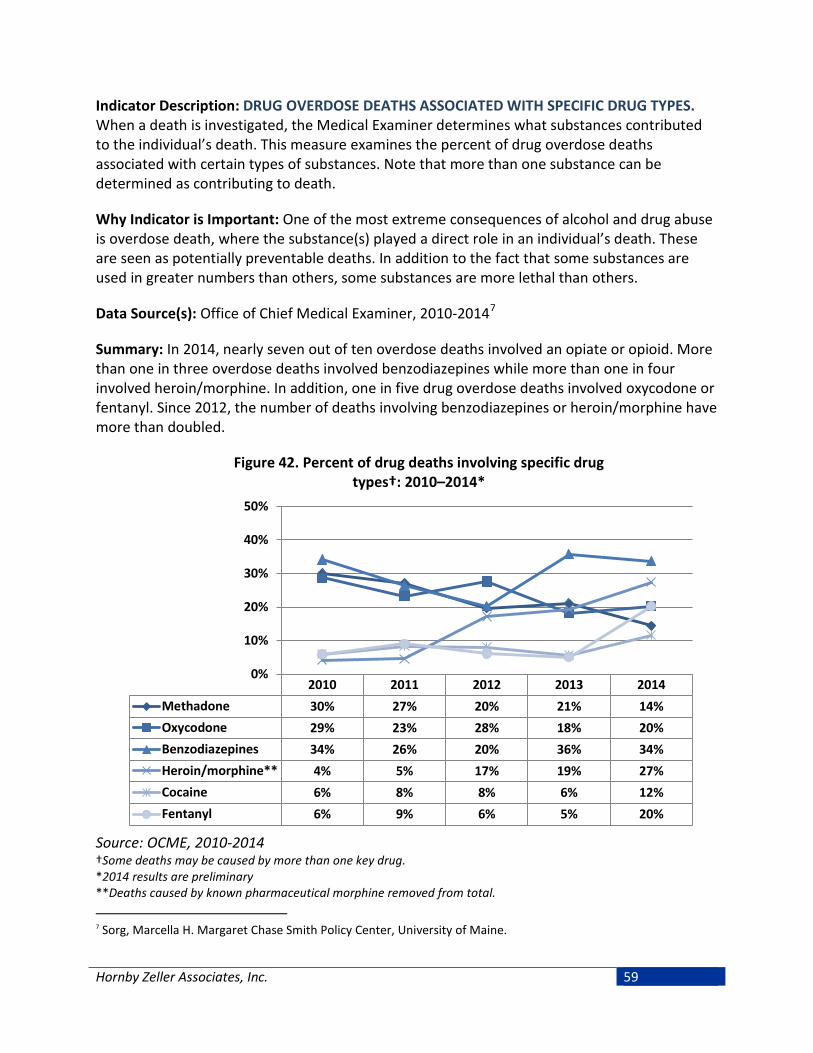
Indicator Description: DRUG OVERDOSE DEATHS ASSOCIATED WITH SPECIFIC DRUG TYPES. When a death is investigated, the Medical Examiner determines what substances contributed to the individual’s death. This measure examines the percent of drug overdose deaths associated with certain types of substances. Note that more than one substance can be determined as contributing to death. Why Indicator is Important: One of the most extreme consequences of alcohol and drug abuse is overdose death, where the substance(s) played a direct role in an individual’s death. These are seen as potentially preventable deaths. In addition to the fact that some substances are used in greater numbers than others, some substances are more lethal than others. Data Source(s): Office of Chief Medical Examiner, 2010-20147 Summary: In 2014, nearly seven out of ten overdose deaths involved an opiate or opioid. More than one in three overdose deaths involved benzodiazepines while more than one in four involved heroin/morphine. In addition, one in five drug overdose deaths involved oxycodone or fentanyl. Since 2012, the number of deaths involving benzodiazepines or heroin/morphine have more than doubled.
Figure 42. Percent of drug deaths involving specific drug types†: 2010–2014*
Source: OCME, 2010-2014 †Some deaths may be caused by more than one key drug. *2014 results are preliminary **Deaths caused by known pharmaceutical morphine removed from total.
7 Sorg, Marcella H. Margaret Chase Smith Policy Center, University of Maine.
2010 2011 2012 2013 2014Methadone 30% 27% 20% 21% 14%Oxycodone 29% 23% 28% 18% 20%Benzodiazepines 34% 26% 20% 36% 34%Heroin/morphine** 4% 5% 17% 19% 27%Cocaine 6% 8% 8% 6% 12%Fentanyl 6% 9% 6% 5% 20%
0%
10%
20%
30%
40%
50%
Hornby Zeller Associates, Inc. 59

• Benzodiazepines were present in 34 percent of deaths due to overdose, followed by heroin/morphine (27%), oxycodone (20%), and fentanyl (20%). Although not shown, in 2014, most drug overdose deaths involved an opiate or opioid (69%).
• According to an analysis conducted by Dr. Sorg from the Margaret Chase Smith Policy Center, Benzodiazepines have been involved as a co-intoxicant in about a third of drug deaths since 2009, usually when the primary cause of death is an opiate. There was a significant dip to 20% in 2011 and a relative spike to 38% in 2013. Benzodiazepines are fairly inexpensive and widely available on the street, and are frequently used by abusers to moderate or enhance the effects of opiates, so the two types of drugs are often found together. Although not shown, benzodiazepines are often mentioned as a secondary problem for people admitted for opiate addiction treatment.
Figure 43. Number of drug deaths involving specific drug types†: 2010–2014*
Source: OCME, 2010-2014 †Some deaths may be caused by more than one key drug. *2014 results are preliminary **Deaths caused by known pharmaceutical morphine removed from total.
• With the exception of methadone, overdose deaths involving all drugs included in the chart above increased from 2013 to 2014. Benzodiazepines were a factor in 70 overdose deaths in 2014, compared to 33 overdose deaths in 2012, representing a 112 percent increase. In 2014, heroin/morphine contributed to 57 overdose deaths, a 530 percent increase since 2011.
2010 2011 2012 2013 2014Methadone 50 42 32 37 30Oxycodone 48 36 45 32 42Benzodiazepines 57 41 33 63 70Heroin/morphine** 7 9 28 34 57Cocaine 10 13 13 10 24Fentanyl 10 14 10 9 43
0
20
40
60
80
100
Hornby Zeller Associates, Inc. 60

• In 2014, fentanyl was involved in 43 overdose deaths, compared to nine in 2013, representing a 377 percent increase. According to an analysis conducted by Dr. Sorg from the Margaret Chase Smith Policy Center, the spike in drug overdoses involving fentanyl was mainly due to non-pharmaceutical fentanyl being sold on the streets as white powder.
Hornby Zeller Associates, Inc. 61

Indicator Description: RATE OF DEATHS DUE TO SUBSTANCE ABUSE. This measure estimates the rate of deaths due to substance abuse or overdose per 100,000 people. The rate per 100,000 allows us to see the frequency with which an occurrence shows up within a population over time. Why Indicator is Important: Drug-induced deaths are influenced by programs to prevent substance abuse, accidental poisoning, suicide and fatal interaction among medications. Data Source(s): ODRVS, 2010-2014* Summary: Adults between the ages of 30 to 34 had the highest rate of death due to substance abuse or overdose during 2014. Overdose deaths due to substance abuse have increased 39 percent from 2012 to 2014.
Figure 44. Substance abuse and overdose deaths, per 100,000, by age group: 2010–2014*
Source: ODRVS, 2010-2014* *2014 results are preliminary
• At 39.3 deaths per 100,000, people between the ages of 30 to 34 had the highest rate of death due to substance abuse or overdose during 2014. The second highest rate was among people between the ages of 35 to 54 years old at 26.9 per 100,000.
• Notably, the substance abuse and overdose death rates among 21 to 29 year olds and 30 to 34 year olds increased dramatically from 2013 to 2014. Although not shown, the total number of overdose deaths due to substance abuse have also increased 39 percent from 2012 (148) to 2014 (204).
2010 2011 2012 2013 2014*12-20 3.9 1.3 2.7 1.3 2.021-29 14.8 14.7 15.3 14.6 24.830-34 23.6 20.6 17.6 23.1 39.335-54 22.6 20.2 23.9 22.3 26.955-64 6.8 10.5 6.9 16.9 13.965+ 4.7 4.6 3.1 6.2 4.4All ages 11.6 10.9 11.1 12.9 15.3
0
10
20
30
40
Rate
per
100
,000
Hornby Zeller Associates, Inc. 62
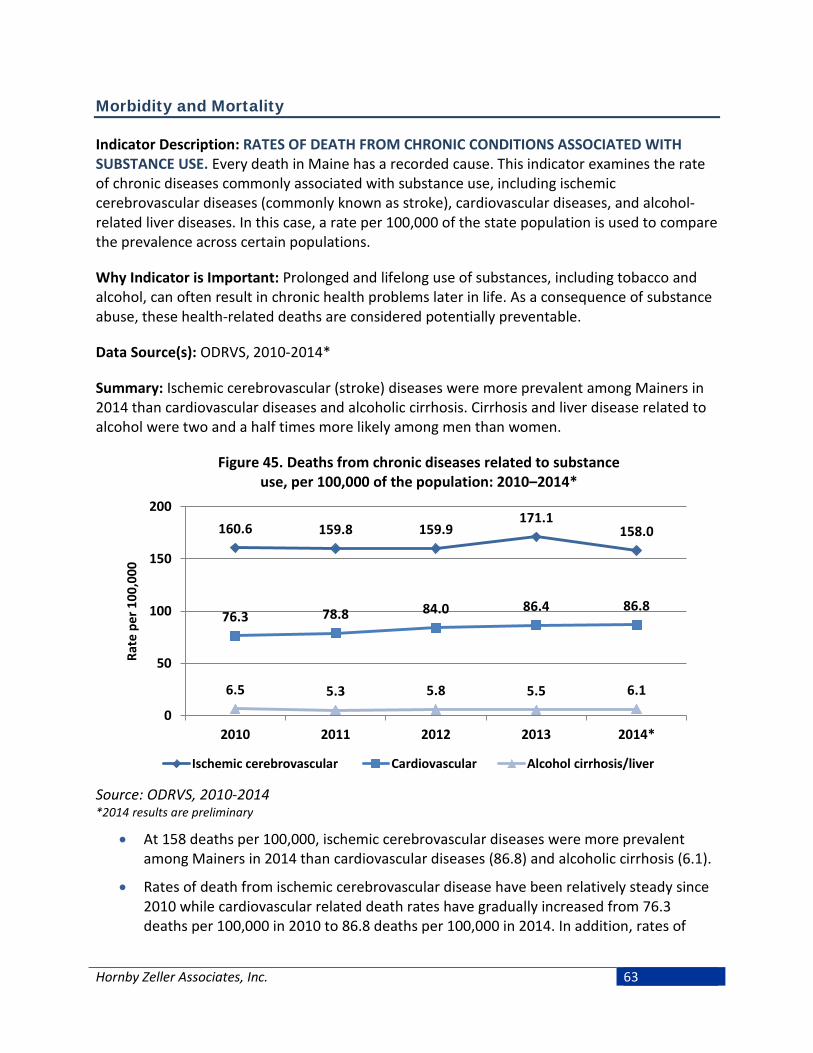
Morbidity and Mortality Indicator Description: RATES OF DEATH FROM CHRONIC CONDITIONS ASSOCIATED WITH SUBSTANCE USE. Every death in Maine has a recorded cause. This indicator examines the rate of chronic diseases commonly associated with substance use, including ischemic cerebrovascular diseases (commonly known as stroke), cardiovascular diseases, and alcohol-related liver diseases. In this case, a rate per 100,000 of the state population is used to compare the prevalence across certain populations. Why Indicator is Important: Prolonged and lifelong use of substances, including tobacco and alcohol, can often result in chronic health problems later in life. As a consequence of substance abuse, these health-related deaths are considered potentially preventable. Data Source(s): ODRVS, 2010-2014* Summary: Ischemic cerebrovascular (stroke) diseases were more prevalent among Mainers in 2014 than cardiovascular diseases and alcoholic cirrhosis. Cirrhosis and liver disease related to alcohol were two and a half times more likely among men than women.
Figure 45. Deaths from chronic diseases related to substance use, per 100,000 of the population: 2010–2014*
Source: ODRVS, 2010-2014 *2014 results are preliminary
• At 158 deaths per 100,000, ischemic cerebrovascular diseases were more prevalent among Mainers in 2014 than cardiovascular diseases (86.8) and alcoholic cirrhosis (6.1).
• Rates of death from ischemic cerebrovascular disease have been relatively steady since 2010 while cardiovascular related death rates have gradually increased from 76.3 deaths per 100,000 in 2010 to 86.8 deaths per 100,000 in 2014. In addition, rates of
160.6 159.8 159.9 171.1
158.0
76.3 78.8 84.0 86.4 86.8
6.5 5.3 5.8 5.5 6.1
0
50
100
150
200
2010 2011 2012 2013 2014*
Rate
per
100
,000
Ischemic cerebrovascular Cardiovascular Alcohol cirrhosis/liver
Hornby Zeller Associates, Inc. 63

death from alcoholic cirrhosis/liver disease have remained stable over the past several years.
• Although not pictured, deaths from cerebrovascular and cardiovascular diseases afflict the older population (those 60 and older) at higher rates, whereas alcoholic cirrhosis/liver disease has a higher rate of incidence among adults between the ages of 35 and 64.
Figure 46. Deaths from alcoholic cirrhosis and liver disease per 100,000 of the population, by gender: 2010–2014*
Source: ODRVS, 2010-2014 *2014 results are preliminary
• In 2014, deaths related to alcoholic cirrhosis and liver diseases were much more likely
among men (8.8 deaths per 100,000) than women (3.5 deaths per 100,000). Rates among men have remained relatively stable since 2012.
8.3 7.8 8.8 9.1 8.8
4.7
2.8 2.9 2.1
3.5
0
2
4
6
8
10
Rate
per
100
,000
Males Females
Hornby Zeller Associates, Inc. 64
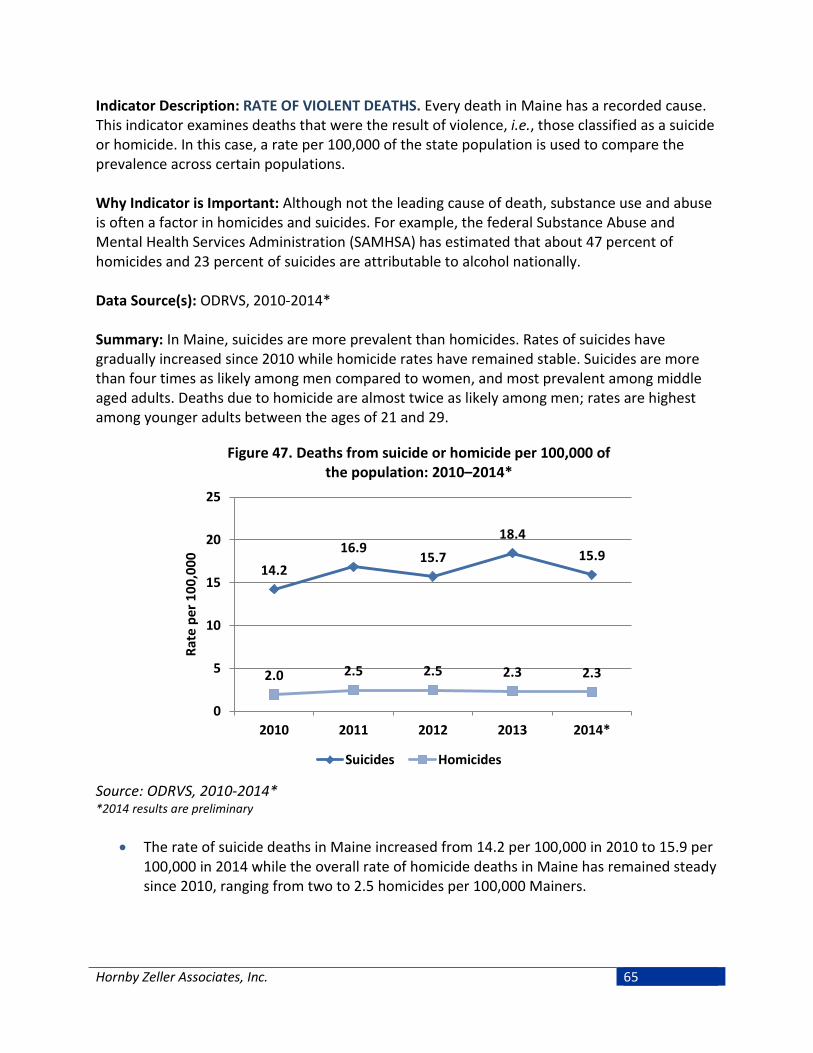
Indicator Description: RATE OF VIOLENT DEATHS. Every death in Maine has a recorded cause. This indicator examines deaths that were the result of violence, i.e., those classified as a suicide or homicide. In this case, a rate per 100,000 of the state population is used to compare the prevalence across certain populations. Why Indicator is Important: Although not the leading cause of death, substance use and abuse is often a factor in homicides and suicides. For example, the federal Substance Abuse and Mental Health Services Administration (SAMHSA) has estimated that about 47 percent of homicides and 23 percent of suicides are attributable to alcohol nationally. Data Source(s): ODRVS, 2010-2014* Summary: In Maine, suicides are more prevalent than homicides. Rates of suicides have gradually increased since 2010 while homicide rates have remained stable. Suicides are more than four times as likely among men compared to women, and most prevalent among middle aged adults. Deaths due to homicide are almost twice as likely among men; rates are highest among younger adults between the ages of 21 and 29.
Figure 47. Deaths from suicide or homicide per 100,000 of the population: 2010–2014*
Source: ODRVS, 2010-2014* *2014 results are preliminary
• The rate of suicide deaths in Maine increased from 14.2 per 100,000 in 2010 to 15.9 per 100,000 in 2014 while the overall rate of homicide deaths in Maine has remained steady since 2010, ranging from two to 2.5 homicides per 100,000 Mainers.
14.2 16.9
15.7
18.4 15.9
2.0 2.5 2.5 2.3 2.3
0
5
10
15
20
25
2010 2011 2012 2013 2014*
Rate
per
100
,000
Suicides Homicides
Hornby Zeller Associates, Inc. 65

Figure 48. Deaths from suicide or homicide per 100,000 of the population, by age groups: 2011–13
Source: ODRVS, 2011-13
• In 2011-13, deaths from suicide were most prevalent among the 35 to 54 year old population at a rate of 25.2 per 100,000, followed by 55 to 64 year olds at 20.7 per 100,000. As for homicides, 21 to 29 year olds held the highest rate at 5.1 per 100,000, followed closely by 30 to 34 year olds at 3.2 per 100,000.
4.1
18.2 15.8
25.2
20.7 18.1 17.0
1.5
5.1 3.2 3.0
1.5 1.5 2.4
0
5
10
15
20
25
30
0 to20
21 to29
30 to34
35 to54
55 to64
65+ Allages
0 to20
21 to29
30 to34
35 to54
55 to64
65+ Allages
Suicides Homicides
Rate
per
100
,000
Hornby Zeller Associates, Inc. 66

Figure 49. Deaths from suicide or homicide per 100,000 of the population, by gender: 2011–13
Source: ODRVS, 2011-13
• Suicide deaths were much more common among men in 2011-13 (27.7 per 100,000),
compared to women (6.7per 100,000). • Although the homicide rate is much lower, the rate for men was nearly double the
homicide rate for women in 2011-13 at three per 100,000 and 1.8 per 100,000 respectively.
6.7
27.7
1.8 3.0
0
5
10
15
20
25
30
Female Male Female Male
Suicides Homicides
Rate
per
100
,000
Hornby Zeller Associates, Inc. 67

Hornby Zeller Associates, Inc. 68

Factors Contributing to Substance Use and Abuse
A body of substance abuse prevention research has identified certain groups of factors that “cause” or have an impact on substance use and the consequences related to use. That is, they appear to influence the occurrence and magnitude of substance use and its related consequences. Generically, these causal factors (also known as contributing factors) are categorized into groups which include:
• Social Access (e.g., getting drugs and alcohol from friends or family); • Retail Availability (e.g., retailer not carding properly, over-prescribing/dispensing, outlet
density); • Pricing and Promotion (e.g., two-for-one specials, industry sponsorships or signage); • Social/Community Norms (e.g., parental/community attitudes and beliefs); • Enforcement (e.g., lack of compliance checks, lack of enforcing policies, laws); • Perceptions of Harm (e.g., individuals’ belief that using a substance is harmful); and • Perceived Risk of Being Caught (e.g., individuals’ belief that s/he will be caught by
parents or police).8, 9 Substance abuse prevention in Maine is undertaken with the assumption that making changes to these factors at the community level will result in changing behaviors around substance use and related problems. It is through positively impacting these factors that Maine can achieve population-level changes in substance consumption and consequences. Although most high school students perceive that regular use of substances pose a risk of harm and that their parents and community think it is wrong, few think they will be caught by the police and most think it is easy to obtain alcohol and marijuana. Among adults, young adults are least likely to perceive risks of harm from using alcohol and marijuana regularly. In recent years, perceptions of harm from marijuana use has been declining steadily among youth and adults, reinforcing a more permissive attitude among parents and communities. In 2015, about one in six parents felt it would be okay if their teen used marijuana as long as they had a written certificate from a doctor. While perception of harm regarding the misuse of prescription drugs has increased among youth and adults, there is still concern over availability and ease of access. From 2013 to 2014, both the number of prescriptions for narcotics as well as stimulants observed increases. In addition, most calls to the Northern New England Poison Center requesting substance verification involved opioids, followed by benzodiazepines. Finally, over a third of parents felt it would be possible for their teen to access prescription drugs at home without their knowledge.
8A General Causal Model to Guide Alcohol, Tobacco and Illicit Drug Prevention: Assessing the Research Evidence. Multi-State Technical Assistance Workshop. Washington, DC. March 16, 2006. 9 Bonnie, R. J. (Ed.). (2004). Reducing underage drinking: A collective responsibility. National Academies Press.
Hornby Zeller Associates, Inc. 69
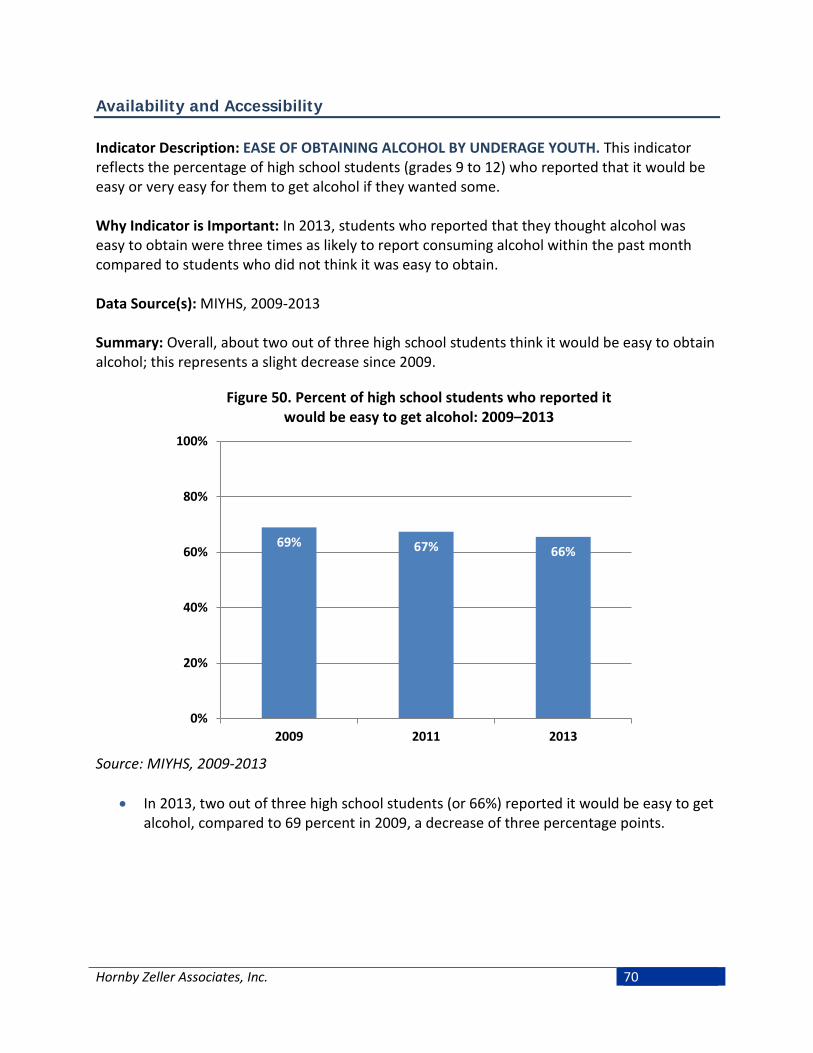
Availability and Accessibility Indicator Description: EASE OF OBTAINING ALCOHOL BY UNDERAGE YOUTH. This indicator reflects the percentage of high school students (grades 9 to 12) who reported that it would be easy or very easy for them to get alcohol if they wanted some. Why Indicator is Important: In 2013, students who reported that they thought alcohol was easy to obtain were three times as likely to report consuming alcohol within the past month compared to students who did not think it was easy to obtain. Data Source(s): MIYHS, 2009-2013 Summary: Overall, about two out of three high school students think it would be easy to obtain alcohol; this represents a slight decrease since 2009.
Figure 50. Percent of high school students who reported it would be easy to get alcohol: 2009–2013
Source: MIYHS, 2009-2013
• In 2013, two out of three high school students (or 66%) reported it would be easy to get alcohol, compared to 69 percent in 2009, a decrease of three percentage points.
69% 67% 66%
0%
20%
40%
60%
80%
100%
2009 2011 2013
Hornby Zeller Associates, Inc. 70
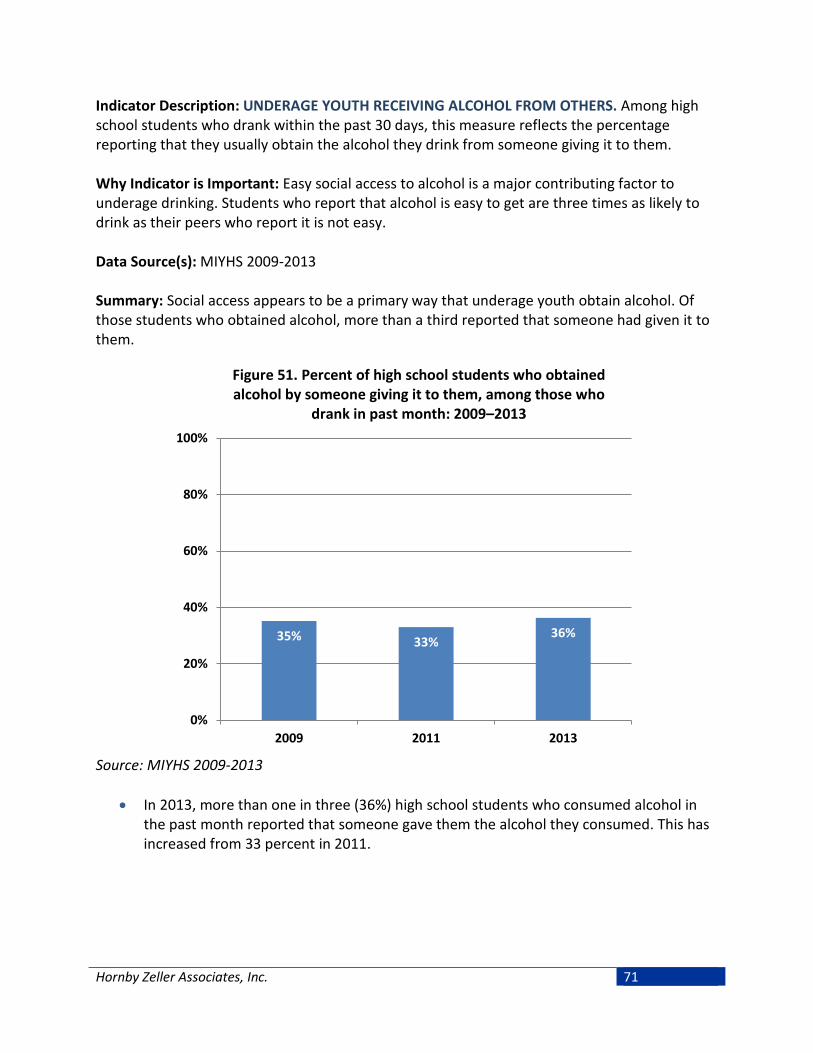
Indicator Description: UNDERAGE YOUTH RECEIVING ALCOHOL FROM OTHERS. Among high school students who drank within the past 30 days, this measure reflects the percentage reporting that they usually obtain the alcohol they drink from someone giving it to them. Why Indicator is Important: Easy social access to alcohol is a major contributing factor to underage drinking. Students who report that alcohol is easy to get are three times as likely to drink as their peers who report it is not easy. Data Source(s): MIYHS 2009-2013 Summary: Social access appears to be a primary way that underage youth obtain alcohol. Of those students who obtained alcohol, more than a third reported that someone had given it to them.
Figure 51. Percent of high school students who obtained alcohol by someone giving it to them, among those who
drank in past month: 2009–2013
Source: MIYHS 2009-2013
• In 2013, more than one in three (36%) high school students who consumed alcohol in the past month reported that someone gave them the alcohol they consumed. This has increased from 33 percent in 2011.
35% 33% 36%
0%
20%
40%
60%
80%
100%
2009 2011 2013
Hornby Zeller Associates, Inc. 71

Indicator Description: PARENT PERCEPTION OF ACCESSIBILITY OF ALCOHOL AT HOME. This indicator measures the percentage of parents reporting that their teen would be able to access alcohol they had purchased without their knowledge. This data comes from the Maine Parent Survey administered by Pan Atlantic for the Maine Office of Substance of Abuse and Mental Health Services. Why Indicator is Important: Easy access to alcohol at home is a major contributing factor to underage drinking. Data Source(s): Parent Survey 2008-2015 Summary: Among parents of middle and high school youth, half felt it was possible for their children to access alcohol they had purchased without their knowledge. This has increased steadily since 2011.
Figure 52. Parent perceptions of accessibility of parent-purchased alcohol without parental knowledge: 2008–2015
Source: Parent Survey 2008-2015
• The percentage of parents reporting that their child would be able to access alcohol purchased by the parent without their parents’ knowledge has increased since 2011, from 42 percent to 50 percent in 2015. About one in 20 parents reported they did not have alcohol in their home.
2008 2009 2011 2013 2015Yes 43% 45% 42% 47% 50%No 48% 50% 51% 48% 45%No alcohol in house 9% 6% 6% 5% 5%
0%
10%
20%
30%
40%
50%
60%
Hornby Zeller Associates, Inc. 72

Indicator Description: PARENT PERCEPTION OF ACCESSIBILITY OF RX DRUGS AT HOME. This indicator measures the percentage of parents reporting that their teen would be able to access prescription medication (not prescribed to their child) without their knowledge. This data comes from the Maine Parent Survey administered by Pan Atlantic for the Maine Office of Substance of Abuse and Mental Health Services. Why Indicator is Important: Easy access to prescription drugs at home is a major contributing factor to prescription drug misuse. Data Source(s): Parent Survey 2008-2015 Summary: More than a third (35%) of parents felt that, at home, their child would be able to access prescription medications that were not prescribed to the child, without their parents’ knowledge.
Figure 53. Parent perception of teen accessibility of prescription drugs at home without parental knowledge: 2015
Source: Parent Survey 2015
• About a third (35%) of parents reported that, at home, their teen would be able to access prescription medications without their knowledge. About six percent of parents surveyed reported that there was no prescription medication in their home.
• Although not shown, parents with a four year degree were more likely to report that their teen could access medication (42%), followed by parents with household incomes of $100,000 or more (41%), and parents 45 and older (40%).
35%
59%
6% 0%
0%
20%
40%
60%
80%
100%
Yes No No medication inhouse
Don't know
Hornby Zeller Associates, Inc. 73
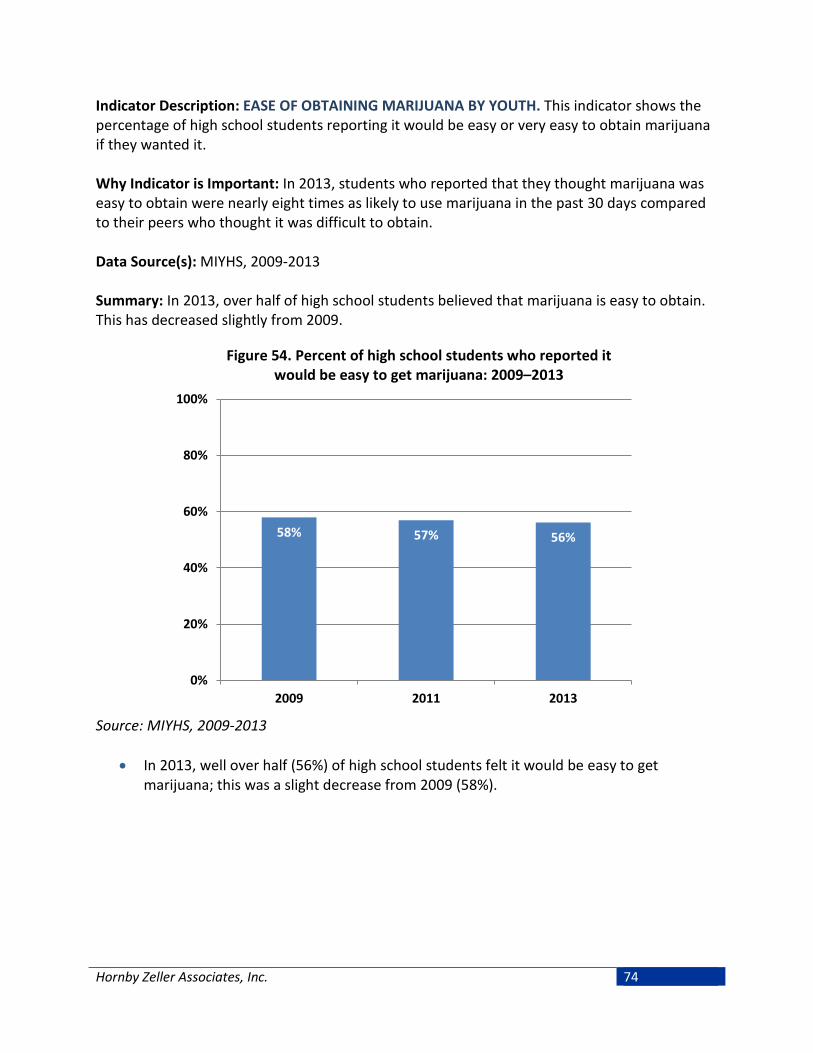
Indicator Description: EASE OF OBTAINING MARIJUANA BY YOUTH. This indicator shows the percentage of high school students reporting it would be easy or very easy to obtain marijuana if they wanted it. Why Indicator is Important: In 2013, students who reported that they thought marijuana was easy to obtain were nearly eight times as likely to use marijuana in the past 30 days compared to their peers who thought it was difficult to obtain. Data Source(s): MIYHS, 2009-2013 Summary: In 2013, over half of high school students believed that marijuana is easy to obtain. This has decreased slightly from 2009.
Figure 54. Percent of high school students who reported it would be easy to get marijuana: 2009–2013
Source: MIYHS, 2009-2013
• In 2013, well over half (56%) of high school students felt it would be easy to get
marijuana; this was a slight decrease from 2009 (58%).
58% 57% 56%
0%
20%
40%
60%
80%
100%
2009 2011 2013
Hornby Zeller Associates, Inc. 74
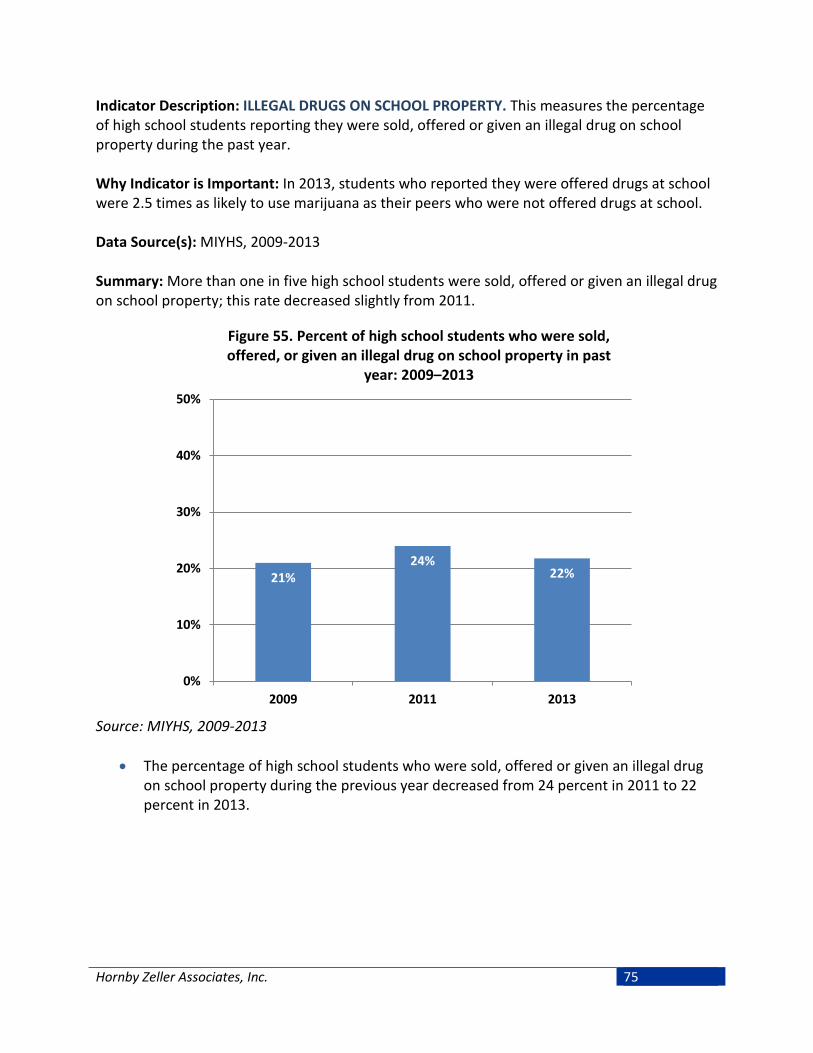
Indicator Description: ILLEGAL DRUGS ON SCHOOL PROPERTY. This measures the percentage of high school students reporting they were sold, offered or given an illegal drug on school property during the past year. Why Indicator is Important: In 2013, students who reported they were offered drugs at school were 2.5 times as likely to use marijuana as their peers who were not offered drugs at school. Data Source(s): MIYHS, 2009-2013 Summary: More than one in five high school students were sold, offered or given an illegal drug on school property; this rate decreased slightly from 2011.
Figure 55. Percent of high school students who were sold, offered, or given an illegal drug on school property in past
year: 2009–2013
Source: MIYHS, 2009-2013
• The percentage of high school students who were sold, offered or given an illegal drug on school property during the previous year decreased from 24 percent in 2011 to 22 percent in 2013.
21% 24%
22%
0%
10%
20%
30%
40%
50%
2009 2011 2013
Hornby Zeller Associates, Inc. 75

Indicator Description: NUMBER OF SCHEDULE II PRESCRIPTIONS AND PILLS PER CAPITA. These indicators reflect the number of narcotic, tranquilizer, and stimulant prescriptions filled as well as the pill counts per capita for each drug type. This includes only prescription drugs that are classified “Schedule II” drugs, meaning those with a high potential for abuse. It is important to note that the number of prescriptions and pill counts per capita do not indicate the size/dosage of the pills. All pharmacies in Maine report to the Prescription Monitoring Program. Why Indicator is Important: The number of prescriptions filled and pill counts per capita indicate the volume of prescription drugs potentially available in the community for diversion (e.g., gift, sale, or theft). A higher level of availability contributes to misuse by individuals without a prescription. Data Source(s): PMP, 2010-2014 Summary: From 2013 to 2014, the number of prescriptions for narcotics observed an eight percent increase due in part to some changes in data collection (see note below). Since 2011, the number prescription for stimulants has increased by 12 percent. The number of pills per capita for narcotics increased from 56 pills per person in 2009 to 60 pills per person in 2014.
Figure 56. Number of prescriptions filled in Maine, by type: 2011-2014*
Source: PMP, 2010-2014 * The increase observed in 2014 in number of narcotic pills prescribed per capita was due in part to the inclusion of the previously unscheduled drug Tramadol (as of 8/18/2014) as well as the inclusion of data submitted via the Veterans Administration (as of 10/31/2014). Data shown only includes two months of VA data, therefore rates are expected to increase in coming years.
1,223,163 1,204,726 1,138,374 1,224,087
658,753 659,926 624,781 627,477
346,479 372,833 377,622 395,387
0
200,000
400,000
600,000
800,000
1,000,000
1,200,000
1,400,000
2011 2012 2013 2014*
Narcotics Tranquilizers Stimulants
Hornby Zeller Associates, Inc. 76
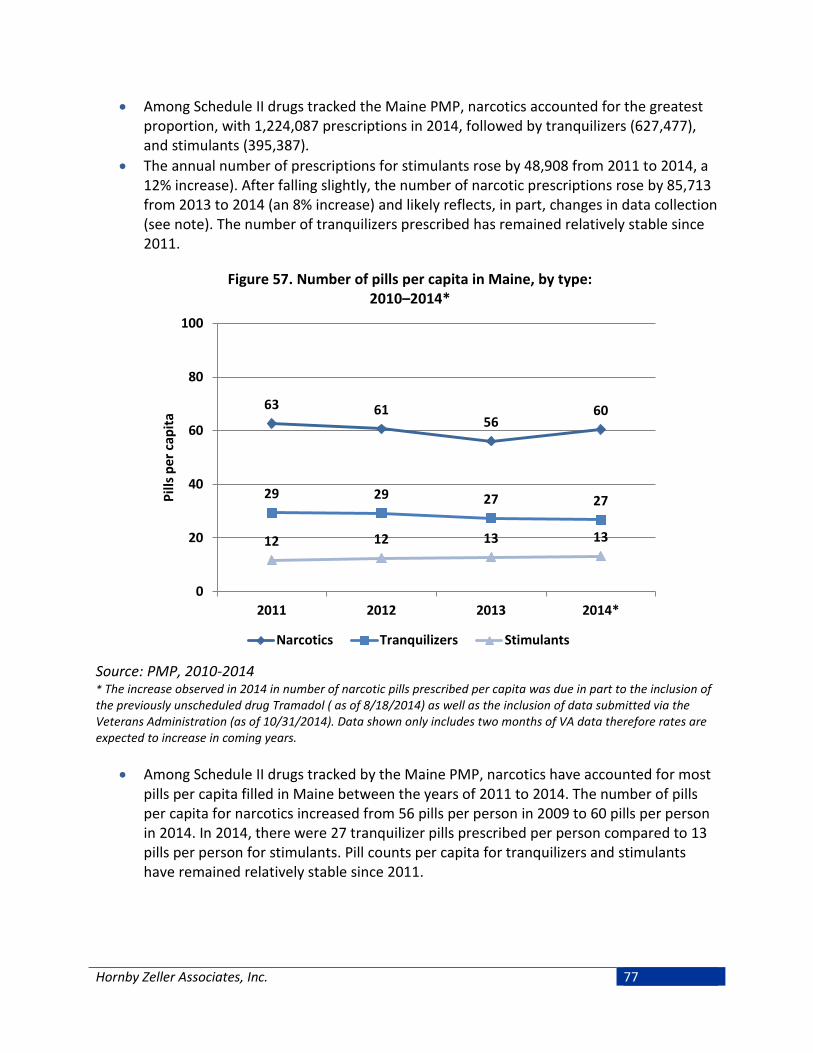
• Among Schedule II drugs tracked the Maine PMP, narcotics accounted for the greatest proportion, with 1,224,087 prescriptions in 2014, followed by tranquilizers (627,477), and stimulants (395,387).
• The annual number of prescriptions for stimulants rose by 48,908 from 2011 to 2014, a 12% increase). After falling slightly, the number of narcotic prescriptions rose by 85,713 from 2013 to 2014 (an 8% increase) and likely reflects, in part, changes in data collection (see note). The number of tranquilizers prescribed has remained relatively stable since 2011.
Figure 57. Number of pills per capita in Maine, by type: 2010–2014*
Source: PMP, 2010-2014 * The increase observed in 2014 in number of narcotic pills prescribed per capita was due in part to the inclusion of the previously unscheduled drug Tramadol ( as of 8/18/2014) as well as the inclusion of data submitted via the Veterans Administration (as of 10/31/2014). Data shown only includes two months of VA data therefore rates are expected to increase in coming years.
• Among Schedule II drugs tracked by the Maine PMP, narcotics have accounted for most pills per capita filled in Maine between the years of 2011 to 2014. The number of pills per capita for narcotics increased from 56 pills per person in 2009 to 60 pills per person in 2014. In 2014, there were 27 tranquilizer pills prescribed per person compared to 13 pills per person for stimulants. Pill counts per capita for tranquilizers and stimulants have remained relatively stable since 2011.
63 61 56
60
29 29 27 27
12 12 13 13
0
20
40
60
80
100
2011 2012 2013 2014*
Pills
per
cap
ita
Narcotics Tranquilizers Stimulants
Hornby Zeller Associates, Inc. 77

Indicator Description: SUBSTANCES REQUESTED FOR VERIFICATION. This indicator shows the number of requests by non-law enforcement for medication verification through the Northern New England Poison Center. A person may call the NNEPC for many reasons, one being to help identify a medication or substance which another person has consumed or that has been found. The calls reflected in this indicator have been characterized by NNEPC as likely related to substance abuse, although NNEPC staff do not make a formal or clinical assessment. Why Indicator is Important: The increased volume of medication verification calls suggests a greater availability of those drugs in the community. This measure also suggests that there is a higher awareness among the community and parents for potential misuse of prescription pills which is prompting calls. Data Source(s): NNEPC, 2010-2014 Summary: Most calls to NNEPC requesting substance verification in 2014 involved opioids, followed by benzodiazepines. The numbers of requests for verification for opioids and benzodiazepines have decreased substantially since 2010.
Figure 58. Substances most frequently requested for medication verification by non-law enforcement, by type: 2010–2014
Source: NNEPC, 2010-2014
• In 2014, the Poison Center received 5,416 calls requesting verification for substances
that were identified as opioids, followed by benzodiazepines (3,438), and stimulant/street drugs (1,461). The volume of calls for these substances has decreased steadily since 2010. Although not shown explicitly, requests verifying opioids decreased by 72 percent from 2010 to 2013, while requests verifying benzodiazepines fell by 60 percent during the same period.
2010 2011 2012 2013 2014Antidepressants 2,551 2,012 1,762 1,191 863Benzodiazepines 8,593 6,982 5,361 3,859 3,438Opioids 19,548 13,751 10,587 7,360 5,416Skeletal Muscle Relaxants 2,220 1,660 1,278 921 669Stimulants and Street Drugs 2,986 2,841 2,418 1,697 1,461
-
5,000
10,000
15,000
20,000
25,000
Hornby Zeller Associates, Inc. 78

Perceived Harm Indicator Description: PERCEIVED RISK FROM REGULAR ALCOHOL USE. This indicator reflects the percentage of high school students who report that there is moderate to great risk of harm from drinking one or two alcoholic beverages every day. Why Indicator is Important: High school students who do not perceive regular alcohol use (one to two drinks per day) as risky were almost twice as likely to drink in the past month than students who did perceive harm. Data Source(s): MIYHS, 2009-2013 Summary: Although most high school students think there is moderate to great risk of harm from drinking alcohol regularly, almost two out of five students in 2013 did not think regular use was risky. Perception of harm from regular alcohol use decreased slightly from 2009 to 2013.
Figure 59. Percent of high school students perceiving moderate to great risk from drinking 1–2 drinks every day:
2009–2013
Source: MIYHS, 2009-2013
• The proportion of high students who reported that people risk harming themselves if they drink one or two drinks every day has decreased by three percentage points from 2009 (61%) to 2013 (58%).
61% 59% 58%
0%
20%
40%
60%
80%
100%
2009 2011 2013
Hornby Zeller Associates, Inc. 79

Indicator Description: PERCEIVED RISK FROM BINGE DRINKING. This indicator reflects the percentage of individuals (high school students and adults) who perceive that there is moderate to great risk from drinking five or more drinks in a row once or twice per week. Why Indicator is Important: High school students who do not perceive a moderate to great risk of harm from binge drinking once or twice a week are more than twice as likely to drink in the past month as high school students who do perceive risk of harm. Perceptions around the risks of binge drinking are related to high-risk alcohol use among adults as well. Summary: The perception of risk of harm from binge drinking among high school students has increased significantly from 2009 to 2013. While perceptions that binge drinking a few times a week posed a moderate to great risk of harm has increased, more than seven out of ten young adults thought that binge drinking a few times a week was not risky.
Figure 60. Percent of high school students perceiving moderate to great risk from drinking five or more drinks
once or twice per week: 2009–2013
Source: MIYHS, 2009-2013
• In 2013, eight out of ten (81%) of high school students reported that people risk harming themselves if they consume five or more alcoholic drinks in a row once or twice a week. This represents a substantial increase since 2009 from 73 percent.
73% 79% 81%
0%
20%
40%
60%
80%
100%
2009 2011 2013
Hornby Zeller Associates, Inc. 80

Figure 61. Maine residents (age 18 and older) perceiving great risk from drinking five or more drinks once or twice per
week, by age group: 2008–09 through 2012–13
Source: NSDUH 2008-09 to 2012-13
• In 2012-13, 38 percent of Mainers ages 26 and older reported that drinking five or more drinks once or twice per week posed some risk of harm. Young adults ages 18 to 25 were much less likely to perceive a great risk of harm from drinking five or more drinks once or twice a week, at 28 percent in 2012-13. These trends have remained generally stable since 2008-09.
26% 27% 29% 28% 28%
39% 40% 40% 38% 38%
0%
10%
20%
30%
40%
50%
18-25 year olds 26+ year olds
Hornby Zeller Associates, Inc. 81

Indicator Description: PERCEIVED RISK OF REGULAR MARIJUANA USE. This measure demonstrates the percentage of individuals (high school students and adults) who perceive a moderate to great risk of harm from smoking marijuana regularly. Why Indicator is Important: High school students who do not believe there is moderate to great risk in smoking marijuana regularly are almost eight times as likely to smoke marijuana as their peers who do perceive risk of harm. A similar relationship exists between adult perceptions and consumption. Data Source(s): MIYHS, 2009-2013; NSDUH, 2008-09 to 2012-13 Summary: Perception of risk of harm from regular marijuana use has decreased dramatically from 2009 to 2013 among high school students. In 2013, over half of students felt smoking marijuana on a regular basis was not risky. Rates of perception of risk from regular marijuana use have been declining steadily among adults as well. In 2012-13, nearly nine in ten 18 to 25 year olds did not perceive smoking marijuana at least once per month as risky.
Figure 62. Percent of high school students perceiving moderate to great risk from smoking marijuana regularly: 2009–2013
Source: MIYHS, 2009-2013
• The proportion of high school students who perceived a moderate to great risk of harm from smoking marijuana regularly, decreased by 13 percentage points from 2009 (61%) to 2013 (48%). Conversely, this means that in 2013, 52 percent felt that there was little to no risk of harm involved.
61% 56%
48%
0%
20%
40%
60%
80%
100%
2009 2011 2013
Hornby Zeller Associates, Inc. 82
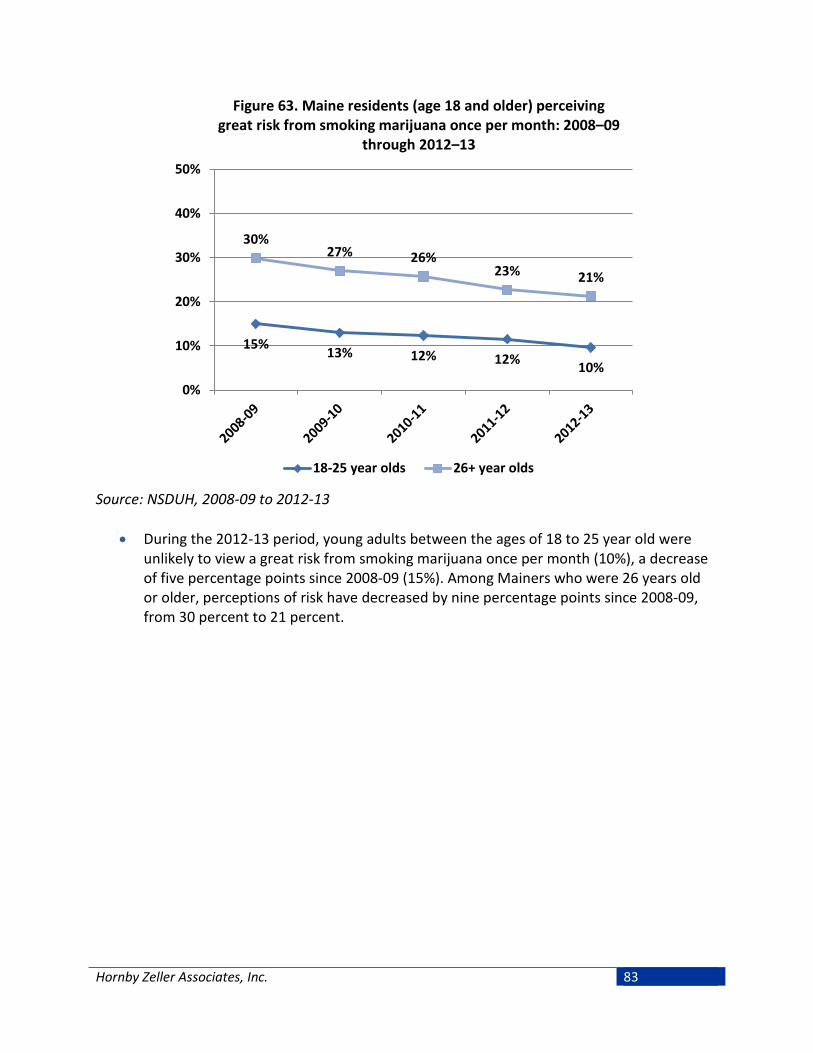
Figure 63. Maine residents (age 18 and older) perceiving great risk from smoking marijuana once per month: 2008–09
through 2012–13
Source: NSDUH, 2008-09 to 2012-13
• During the 2012-13 period, young adults between the ages of 18 to 25 year old were unlikely to view a great risk from smoking marijuana once per month (10%), a decrease of five percentage points since 2008-09 (15%). Among Mainers who were 26 years old or older, perceptions of risk have decreased by nine percentage points since 2008-09, from 30 percent to 21 percent.
15% 13% 12% 12% 10%
30% 27% 26%
23% 21%
0%
10%
20%
30%
40%
50%
18-25 year olds 26+ year olds
Hornby Zeller Associates, Inc. 83
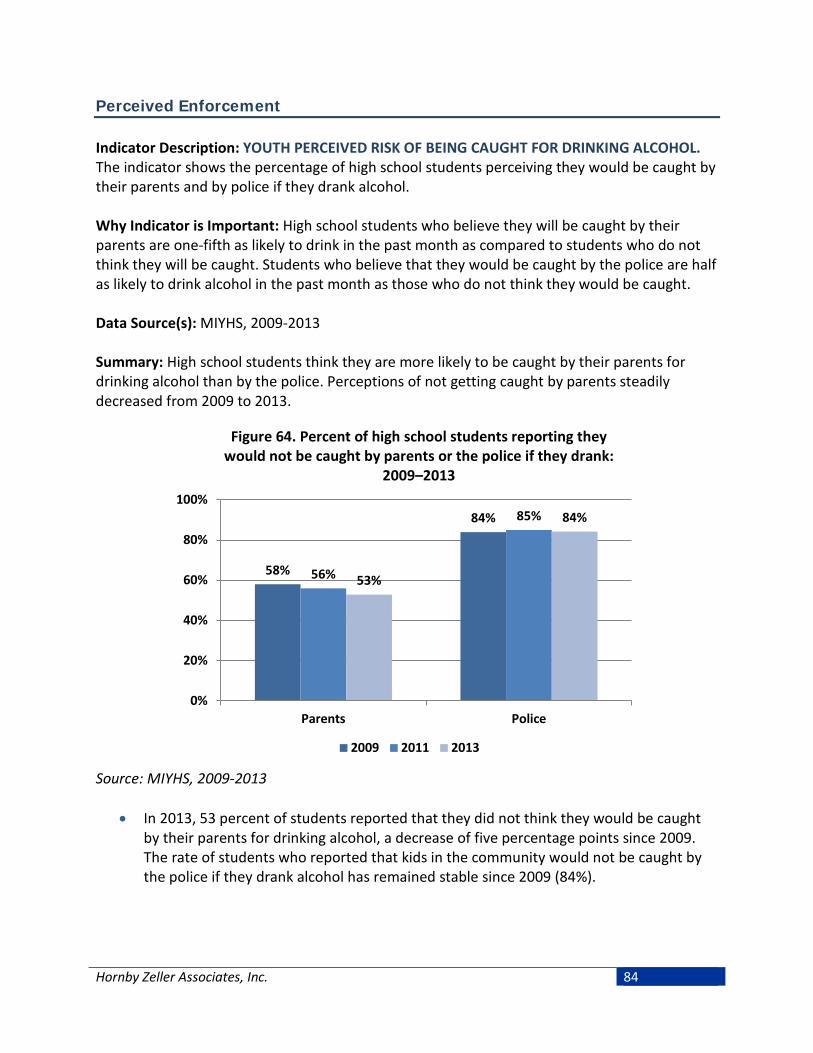
Perceived Enforcement Indicator Description: YOUTH PERCEIVED RISK OF BEING CAUGHT FOR DRINKING ALCOHOL. The indicator shows the percentage of high school students perceiving they would be caught by their parents and by police if they drank alcohol. Why Indicator is Important: High school students who believe they will be caught by their parents are one-fifth as likely to drink in the past month as compared to students who do not think they will be caught. Students who believe that they would be caught by the police are half as likely to drink alcohol in the past month as those who do not think they would be caught. Data Source(s): MIYHS, 2009-2013 Summary: High school students think they are more likely to be caught by their parents for drinking alcohol than by the police. Perceptions of not getting caught by parents steadily decreased from 2009 to 2013.
Figure 64. Percent of high school students reporting they would not be caught by parents or the police if they drank:
2009–2013
Source: MIYHS, 2009-2013
• In 2013, 53 percent of students reported that they did not think they would be caught by their parents for drinking alcohol, a decrease of five percentage points since 2009. The rate of students who reported that kids in the community would not be caught by the police if they drank alcohol has remained stable since 2009 (84%).
58%
84%
56%
85%
53%
84%
0%
20%
40%
60%
80%
100%
Parents Police
2009 2011 2013
Hornby Zeller Associates, Inc. 84

Indicator Description: YOUTH PERCEIVED RISK OF BEING CAUGHT FOR SMOKING MARIJUANA. This indicator presents the percentage of high school students perceiving they would be caught by police if they smoked marijuana. Why Indicator is Important: High school students who believe they would be caught by the police are less than half as likely to smoke marijuana as their peers. Data Source(s): MIYHS, 2009-2013 Summary: The majority of high school students do not think they will be caught by police for smoking marijuana. Less than one in four students felt kids in their community would be caught by the police for smoking marijuana.
Figure 65. Percent of high school students reporting they would not get caught by the police if they smoked marijuana:
2009–2013
Source: MIYHS, 2009-2013
• In 2013, 77 percent of high school students felt kids in the community would not be caught by police for smoking marijuana; this represents an increase of two percentage points since 2011 (75%). Conversely, this means that in 2013, 23 percent of students felt they would be caught.
75% 75% 77%
0%
20%
40%
60%
80%
100%
2009 2011 2013
Hornby Zeller Associates, Inc. 85
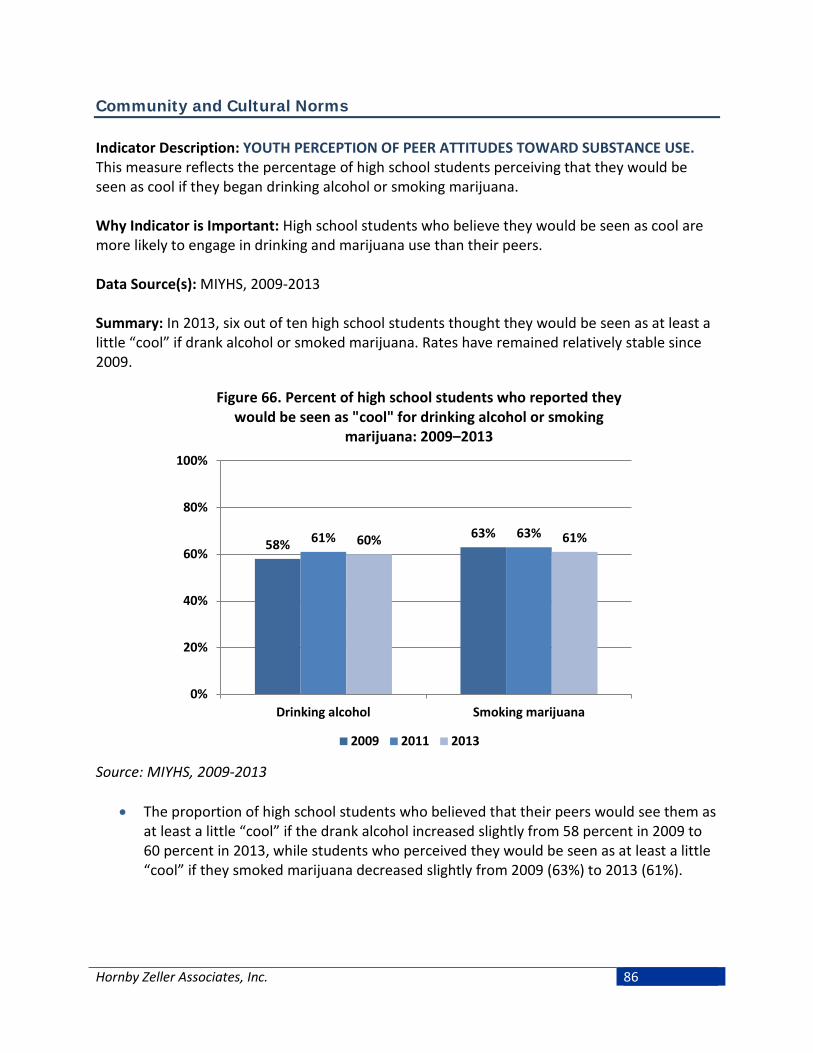
Community and Cultural Norms Indicator Description: YOUTH PERCEPTION OF PEER ATTITUDES TOWARD SUBSTANCE USE. This measure reflects the percentage of high school students perceiving that they would be seen as cool if they began drinking alcohol or smoking marijuana. Why Indicator is Important: High school students who believe they would be seen as cool are more likely to engage in drinking and marijuana use than their peers. Data Source(s): MIYHS, 2009-2013 Summary: In 2013, six out of ten high school students thought they would be seen as at least a little “cool” if drank alcohol or smoked marijuana. Rates have remained relatively stable since 2009.
Figure 66. Percent of high school students who reported they would be seen as "cool" for drinking alcohol or smoking
marijuana: 2009–2013
Source: MIYHS, 2009-2013
• The proportion of high school students who believed that their peers would see them as at least a little “cool” if the drank alcohol increased slightly from 58 percent in 2009 to 60 percent in 2013, while students who perceived they would be seen as at least a little “cool” if they smoked marijuana decreased slightly from 2009 (63%) to 2013 (61%).
58% 63% 61% 63% 60% 61%
0%
20%
40%
60%
80%
100%
Drinking alcohol Smoking marijuana
2009 2011 2013
Hornby Zeller Associates, Inc. 86
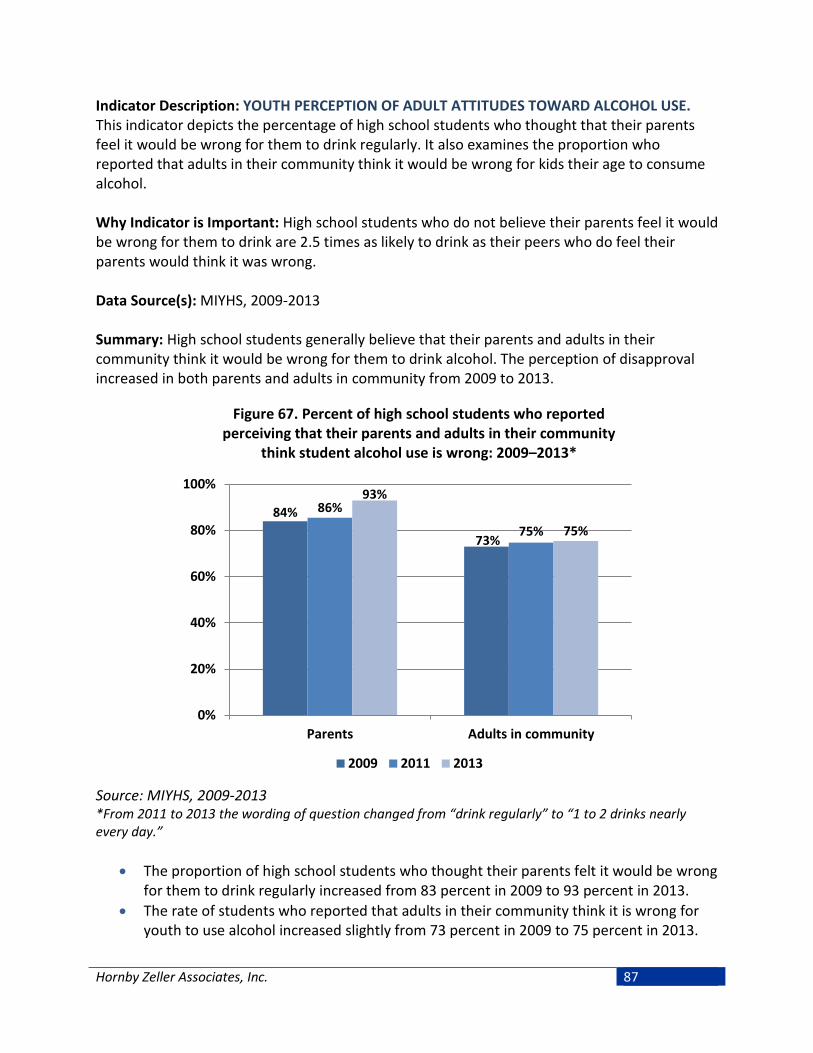
Indicator Description: YOUTH PERCEPTION OF ADULT ATTITUDES TOWARD ALCOHOL USE. This indicator depicts the percentage of high school students who thought that their parents feel it would be wrong for them to drink regularly. It also examines the proportion who reported that adults in their community think it would be wrong for kids their age to consume alcohol. Why Indicator is Important: High school students who do not believe their parents feel it would be wrong for them to drink are 2.5 times as likely to drink as their peers who do feel their parents would think it was wrong. Data Source(s): MIYHS, 2009-2013 Summary: High school students generally believe that their parents and adults in their community think it would be wrong for them to drink alcohol. The perception of disapproval increased in both parents and adults in community from 2009 to 2013.
Figure 67. Percent of high school students who reported perceiving that their parents and adults in their community
think student alcohol use is wrong: 2009–2013*
Source: MIYHS, 2009-2013 *From 2011 to 2013 the wording of question changed from “drink regularly” to “1 to 2 drinks nearly every day.”
• The proportion of high school students who thought their parents felt it would be wrong for them to drink regularly increased from 83 percent in 2009 to 93 percent in 2013.
• The rate of students who reported that adults in their community think it is wrong for youth to use alcohol increased slightly from 73 percent in 2009 to 75 percent in 2013.
84%
73%
86%
75%
93%
75%
0%
20%
40%
60%
80%
100%
Parents Adults in community
2009 2011 2013
Hornby Zeller Associates, Inc. 87

Indicator Description: YOUTH PERCEPTION OF PARENTAL ATTITUDES TOWARD MARIJUANA USE. This indicator shows the percentage of high school students who reported that their parents feel it would be wrong for them to smoke marijuana. Why Indicator is Important: High school students who believe their parents feel it is wrong for them to smoke marijuana are one fourth as likely to use marijuana as students who do not believe their parents would think it is wrong. Data Source(s): MIYHS, 2009-2013 Summary: Although high school students generally believe that their parents think it would be wrong for them to smoke marijuana, perceptions of disapproval decreased slightly from 2009 to 2013.
Figure 68. Percent of high school students who reported that parents would think it was wrong to use marijuana:
2009–2013
Source: MIYHS, 2009-2013
• The proportion of high school students who reported their parents feel it would be wrong for them to smoke marijuana decreased slightly from 87 percent in 2009 to 85 percent in 2013. Conversely, this means that 15 percent of students believed their parents would not feel that it wrong for their child to smoke marijuana.
87% 84% 85%
0%
20%
40%
60%
80%
100%
2009 2011 2013
Hornby Zeller Associates, Inc. 88
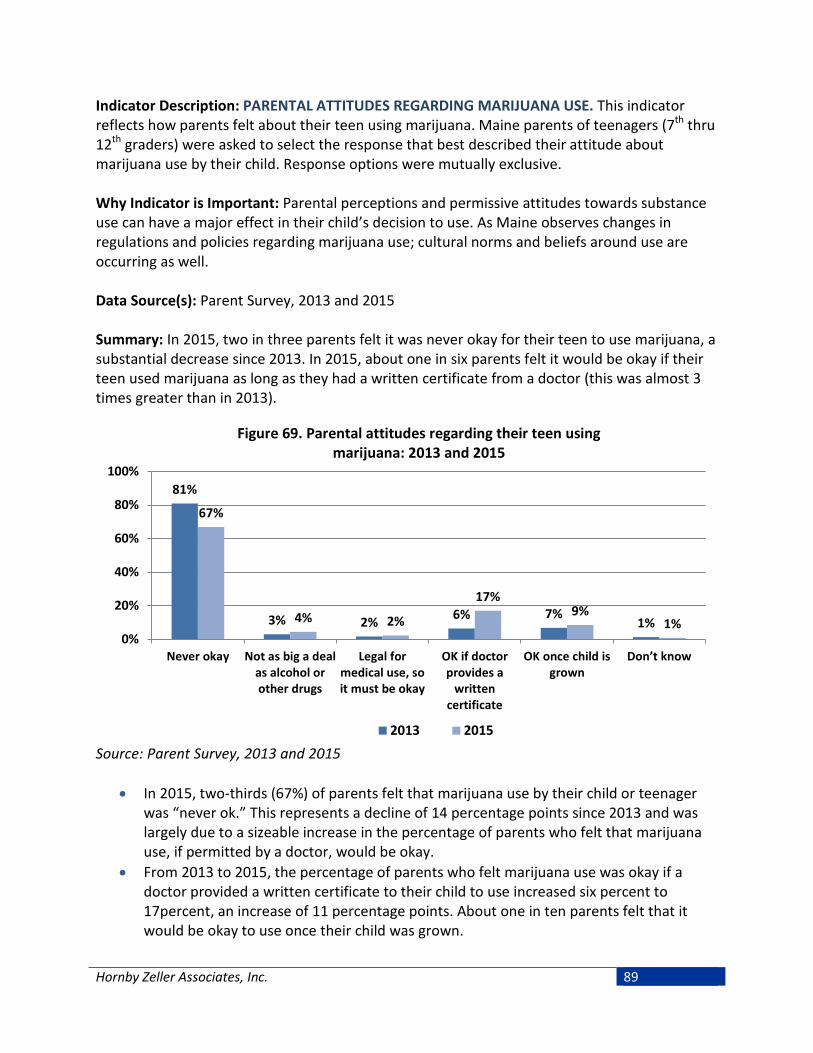
Indicator Description: PARENTAL ATTITUDES REGARDING MARIJUANA USE. This indicator reflects how parents felt about their teen using marijuana. Maine parents of teenagers (7th thru 12th graders) were asked to select the response that best described their attitude about marijuana use by their child. Response options were mutually exclusive. Why Indicator is Important: Parental perceptions and permissive attitudes towards substance use can have a major effect in their child’s decision to use. As Maine observes changes in regulations and policies regarding marijuana use; cultural norms and beliefs around use are occurring as well. Data Source(s): Parent Survey, 2013 and 2015 Summary: In 2015, two in three parents felt it was never okay for their teen to use marijuana, a substantial decrease since 2013. In 2015, about one in six parents felt it would be okay if their teen used marijuana as long as they had a written certificate from a doctor (this was almost 3 times greater than in 2013).
Figure 69. Parental attitudes regarding their teen using marijuana: 2013 and 2015
Source: Parent Survey, 2013 and 2015
• In 2015, two-thirds (67%) of parents felt that marijuana use by their child or teenager was “never ok.” This represents a decline of 14 percentage points since 2013 and was largely due to a sizeable increase in the percentage of parents who felt that marijuana use, if permitted by a doctor, would be okay.
• From 2013 to 2015, the percentage of parents who felt marijuana use was okay if a doctor provided a written certificate to their child to use increased six percent to 17percent, an increase of 11 percentage points. About one in ten parents felt that it would be okay to use once their child was grown.
81%
3% 2% 6% 7% 1%
67%
4% 2%
17% 9%
1% 0%
20%
40%
60%
80%
100%
Never okay Not as big a dealas alcohol orother drugs
Legal formedical use, soit must be okay
OK if doctorprovides a
writtencertificate
OK once child isgrown
Don’t know
2013 2015
Hornby Zeller Associates, Inc. 89
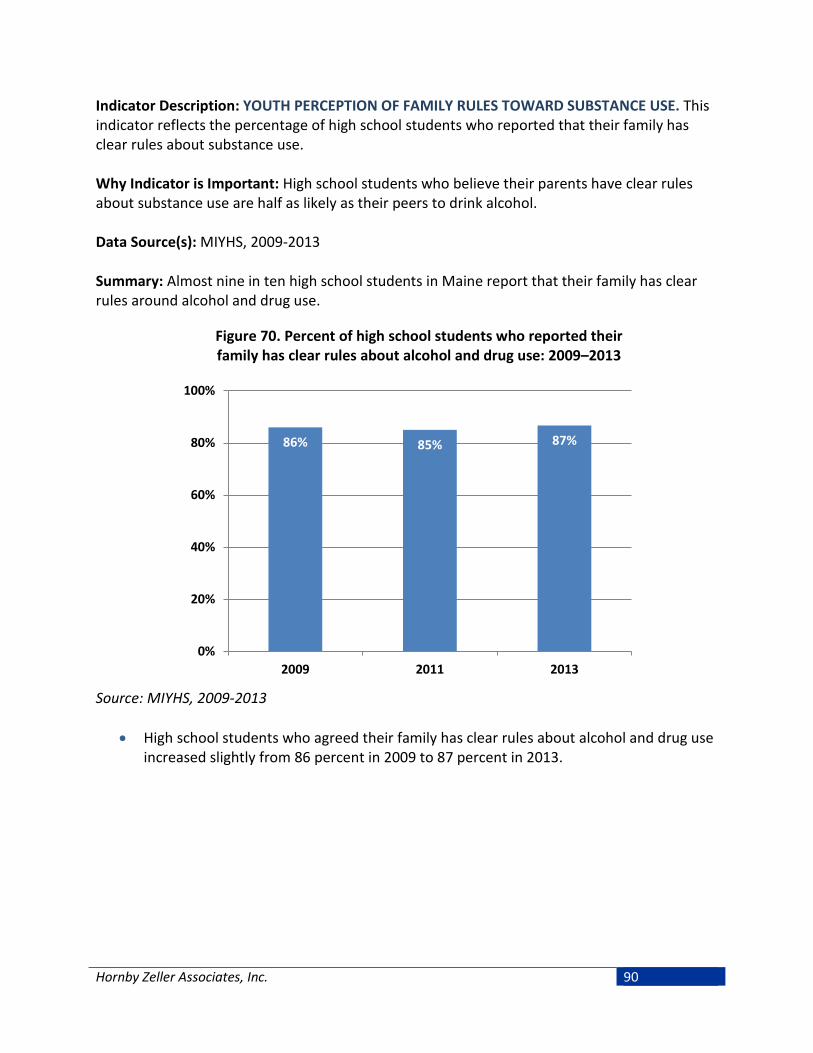
Indicator Description: YOUTH PERCEPTION OF FAMILY RULES TOWARD SUBSTANCE USE. This indicator reflects the percentage of high school students who reported that their family has clear rules about substance use. Why Indicator is Important: High school students who believe their parents have clear rules about substance use are half as likely as their peers to drink alcohol. Data Source(s): MIYHS, 2009-2013 Summary: Almost nine in ten high school students in Maine report that their family has clear rules around alcohol and drug use.
Figure 70. Percent of high school students who reported their family has clear rules about alcohol and drug use: 2009–2013
Source: MIYHS, 2009-2013
• High school students who agreed their family has clear rules about alcohol and drug use increased slightly from 86 percent in 2009 to 87 percent in 2013.
86% 85% 87%
0%
20%
40%
60%
80%
100%
2009 2011 2013
Hornby Zeller Associates, Inc. 90

Indicator Description: PARENT PERCEPTION OF YOUTH ALCOHOL USE. This indicator reflects the percentage of parents of 9th through 12th graders who perceived that their child has ever consumed alcohol (more than a few sips) or used alcohol within the past 30 days. Why Indicator is Important: Parental perceptions of child behaviors compared to the actual behaviors reported by youth often differ from one another. This disconnect can be challenging to reconcile, especially when confronting youth substance use and parental monitoring. Data Source(s): Parent Survey, 2009-2013 Summary: About one in four parents of high school students felt that their child had ever consumed alcohol. Only three percent of parents thought their youth had used within the past 30 days.
Figure 71. Parent’s (of high school students) perception of youth alcohol use: 2009–2015
Source: Parent Survey, 2008-2015
• In 2015, 23 percent of parents of high school students thought that their child had ever consumed alcohol (more than a few sips); and only three percent of parents thought their child had consumed alcohol in the past thirty days. Parental perceptions regarding alcohol use have declined since 2011.
• According to the 2013 Maine Integrated Youth Health Survey (see figure 1), 54 percent of high school student reported having ever consumed alcohol, and 26 percent reported having used alcohol within the past 30 days.
28% 27% 27% 26% 23%
6% 5% 6% 5% 3%
0%
10%
20%
30%
40%
50%
2008 2009 2011 2013 2015
Lifetime use Past 30 day use
Hornby Zeller Associates, Inc. 91

Hornby Zeller Associates, Inc. 92
Mental Health, Suicide and Co-occurring Disorders
The relationship between substance use and mental health has been well documented. There are great efforts underway at the federal Substance Abuse Mental Health Services Administration (SAMHSA) and throughout Maine to better integrate mental health promotion and substance abuse prevention. At the individual level, it is important to know if one exists because the symptoms of each can affect the other; that is, a person who is depressed may abuse alcohol in an effort to feel better. At the community level, it is important to understand how the prevalence of one interacts with the other so that prevention and intervention efforts can better address the needs of both. The data indicators included below represent multiple mental health indicators that can be routinely monitored in relation to substance abuse in hopes that this will lead to better prevention and intervention. About one in five adults in Maine reported having ever been diagnosed with anxiety, while one in four reported having been diagnosed with depression. Rates of anxiety and depression tend to be higher among adults ages 26 to 35. It appears that young adults (18 to 25 years old) are more likely to report experiencing at least one major depressive disorder within the past year (one in ten). As noted in the consequence section of this report, suicide rates have been increasing in the past several years, especially among younger adults and men in general. Higher rates of mental illness and substance use among particular age groups have likely contributed to the increase rates in suicide and suicide ideation. In 2014, referral calls via 2-1-1 Maine (a telephone and web-based health and human services referral resource) seeking mental health-related services surpassed those related to substance abuse services. As for youth, one quarter reported feeling sad or hopeless for at least two weeks in the past year and about one in seven had seriously considered or planned suicide in 2013. Mental illness is also prevalent among Mainers who needed treatment for substance use with over half of all substance abuse treatment admissions in 2014 involving a mental health disorder and nearly one-third receiving outpatient mental health services in the past year.
Hornby Zeller Associates, Inc. 93

Mental Illness, Depression and Anxiety Indicator Description: MENTAL ILLNESS AND DEPRESSIVE EPISODES AMONG ADULTS. This indicator reflects the percentage of Maine residents age 18 and older reporting experiencing any mental illness, serious mental illness or having experienced at least one major depressive episode.10 Why Indicator is Important: Experiencing psychological distress in the past year is associated with higher rates of substance abuse. Data Source(s): NSDUH, 2012-13 Summary: About one in five adults in Maine report experiencing any mental illness in the past year while one in 20 report experiencing serious mental illness in the past year. Major depressive episodes are most prevalent among 18 to 25 year olds with one in ten experiencing at least one episode within the past year.
Figure 72. Percent of Maine residents (age 18 and older) experiencing any mental illness or serious mental illness in
past year, by age group: 2012–13
Source: NSDUH, 2012-13
• In 2012-13, 21 percent of adults age 18 and over reported experiencing any mental illness in the past year and five percent reported experiencing serious mental illness in the past year; rates did not vary much among age groups.
10 Any mental illness is a diagnosable mental, behavioral, or emotional disorder, other than a substance use disorder, that met the criteria found in the 4th edition of the Diagnostic and Statistical Manual of Mental Disorders (DSM-IV). Serious mental illness is a diagnosable mental, behavioral, or emotional disorder, other than a developmental or substance use disorder, that met the DSM-IV criteria and resulted in serious functional impairment. Major depressive episode is defined as a period of at least two weeks when a person experienced a depressed mood or loss of interest or pleasure in daily activities and had a majority of specified depression symptoms.
21%
5%
21%
5%
21%
5%
0%
5%
10%
15%
20%
25%
Any mental illness Serious mental illness
18 and older 18-25 year olds 26+ year olds
Hornby Zeller Associates, Inc. 94
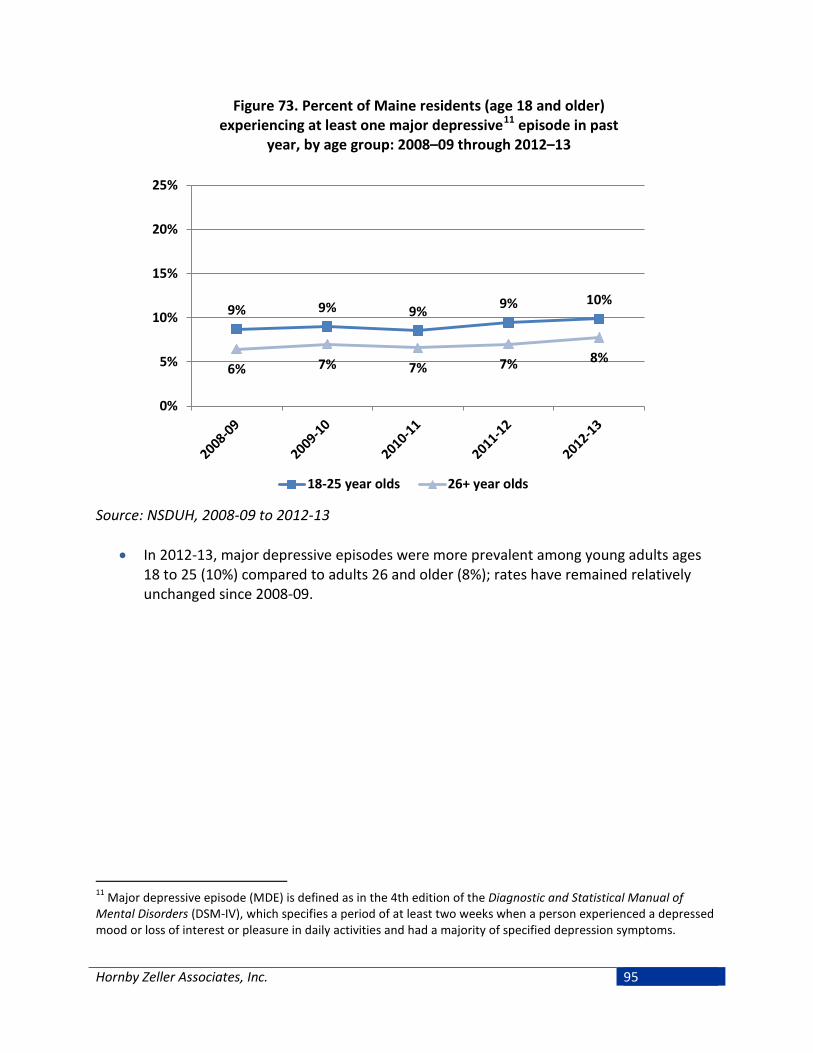
Figure 73. Percent of Maine residents (age 18 and older) experiencing at least one major depressive11 episode in past
year, by age group: 2008–09 through 2012–13
Source: NSDUH, 2008-09 to 2012-13
• In 2012-13, major depressive episodes were more prevalent among young adults ages
18 to 25 (10%) compared to adults 26 and older (8%); rates have remained relatively unchanged since 2008-09.
11 Major depressive episode (MDE) is defined as in the 4th edition of the Diagnostic and Statistical Manual of Mental Disorders (DSM-IV), which specifies a period of at least two weeks when a person experienced a depressed mood or loss of interest or pleasure in daily activities and had a majority of specified depression symptoms.
9% 9% 9% 9% 10%
6% 7% 7% 7% 8%
0%
5%
10%
15%
20%
25%
18-25 year olds 26+ year olds
Hornby Zeller Associates, Inc. 95

Indicator Description: DIAGNOSIS OF ANXIETY AND DEPRESSION AMONG ADULTS. This indicator examines the percentage of Maine residents age 18 and older who have been told they have a depression or anxiety disorder. Why Indicator is Important: The link between mental health and substance abuse is well documented. Experiencing anxiety or depression in the past year is associated with higher rates of substance abuse. Data Source(s): BRFSS, 2012-13 Summary: Nearly one in four adults in Maine reported having ever been diagnosed with depression compared to one in five reporting to have been diagnosed with anxiety. Adults ages 26 to 35 reported the highest rates of both depression and anxiety.
Figure 74. Percent of adults who have been told they have a depression or anxiety disorder by age group: 2012–13
Source: BRFSS 2012-13
• In 2012-13, 23 percent of adults in Maine reported having ever been diagnosed with depression, while 19 percent reported having ever been diagnosed with anxiety. Adults ages 26 to 35 reported the highest rates of depression (27%) as well as anxiety (26%).
19% 22% 26%
22%
16%
23% 22%
27% 26% 22%
0%
10%
20%
30%
40%
50%
18+ 18-25 26-35 36-49 50+
Anxiety Depression
Hornby Zeller Associates, Inc. 96
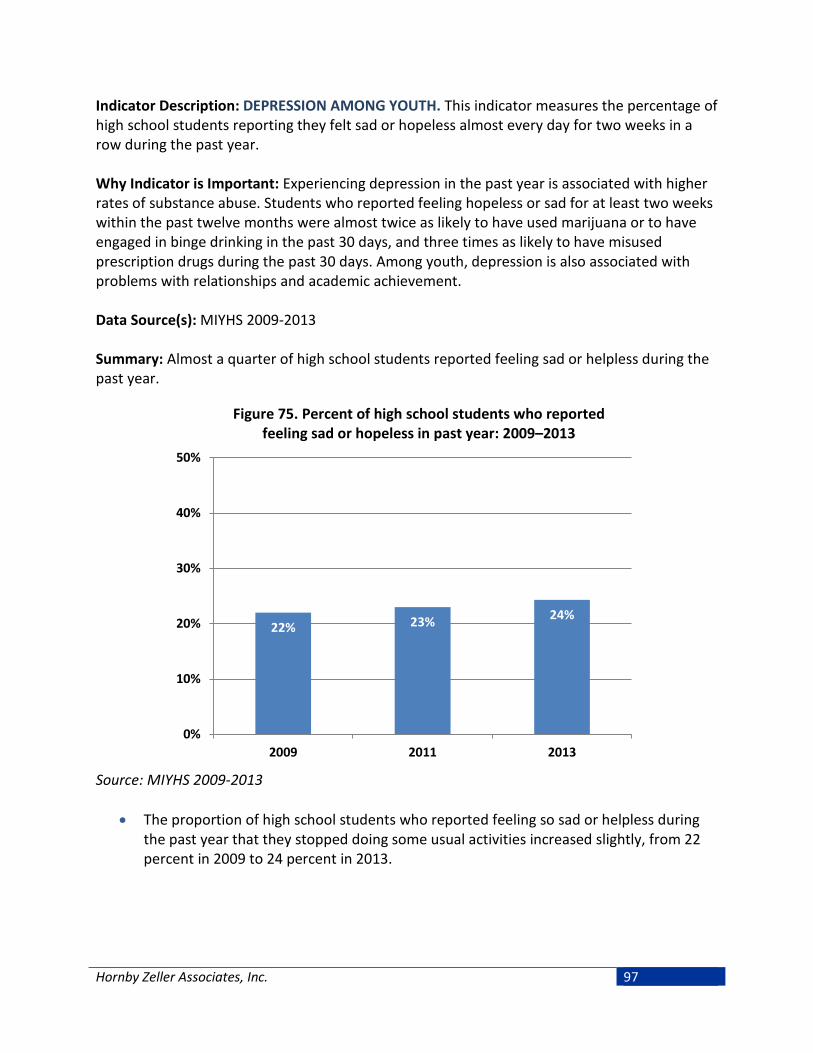
Indicator Description: DEPRESSION AMONG YOUTH. This indicator measures the percentage of high school students reporting they felt sad or hopeless almost every day for two weeks in a row during the past year. Why Indicator is Important: Experiencing depression in the past year is associated with higher rates of substance abuse. Students who reported feeling hopeless or sad for at least two weeks within the past twelve months were almost twice as likely to have used marijuana or to have engaged in binge drinking in the past 30 days, and three times as likely to have misused prescription drugs during the past 30 days. Among youth, depression is also associated with problems with relationships and academic achievement. Data Source(s): MIYHS 2009-2013 Summary: Almost a quarter of high school students reported feeling sad or helpless during the past year.
Figure 75. Percent of high school students who reported feeling sad or hopeless in past year: 2009–2013
Source: MIYHS 2009-2013
• The proportion of high school students who reported feeling so sad or helpless during the past year that they stopped doing some usual activities increased slightly, from 22 percent in 2009 to 24 percent in 2013.
22% 23% 24%
0%
10%
20%
30%
40%
50%
2009 2011 2013
Hornby Zeller Associates, Inc. 97
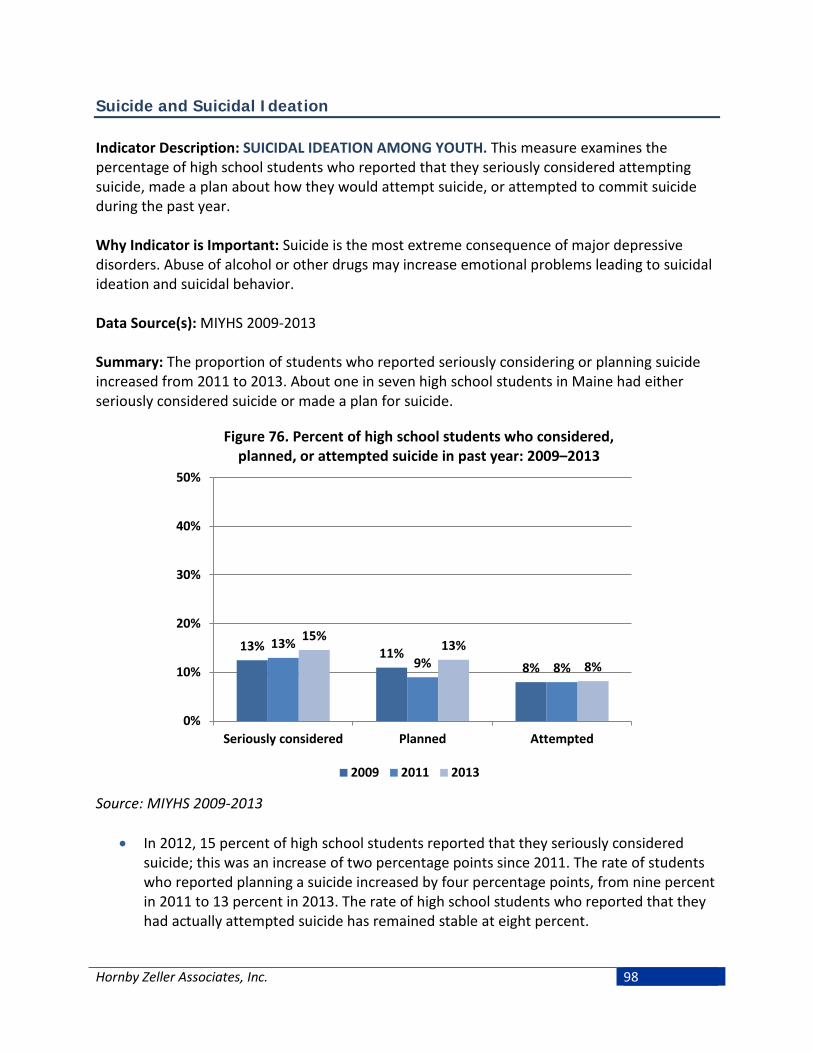
Suicide and Suicidal Ideation Indicator Description: SUICIDAL IDEATION AMONG YOUTH. This measure examines the percentage of high school students who reported that they seriously considered attempting suicide, made a plan about how they would attempt suicide, or attempted to commit suicide during the past year. Why Indicator is Important: Suicide is the most extreme consequence of major depressive disorders. Abuse of alcohol or other drugs may increase emotional problems leading to suicidal ideation and suicidal behavior. Data Source(s): MIYHS 2009-2013 Summary: The proportion of students who reported seriously considering or planning suicide increased from 2011 to 2013. About one in seven high school students in Maine had either seriously considered suicide or made a plan for suicide.
Figure 76. Percent of high school students who considered, planned, or attempted suicide in past year: 2009–2013
Source: MIYHS 2009-2013
• In 2012, 15 percent of high school students reported that they seriously considered suicide; this was an increase of two percentage points since 2011. The rate of students who reported planning a suicide increased by four percentage points, from nine percent in 2011 to 13 percent in 2013. The rate of high school students who reported that they had actually attempted suicide has remained stable at eight percent.
13% 11% 8%
13% 9% 8%
15% 13%
8%
0%
10%
20%
30%
40%
50%
Seriously considered Planned Attempted
2009 2011 2013
Hornby Zeller Associates, Inc. 98
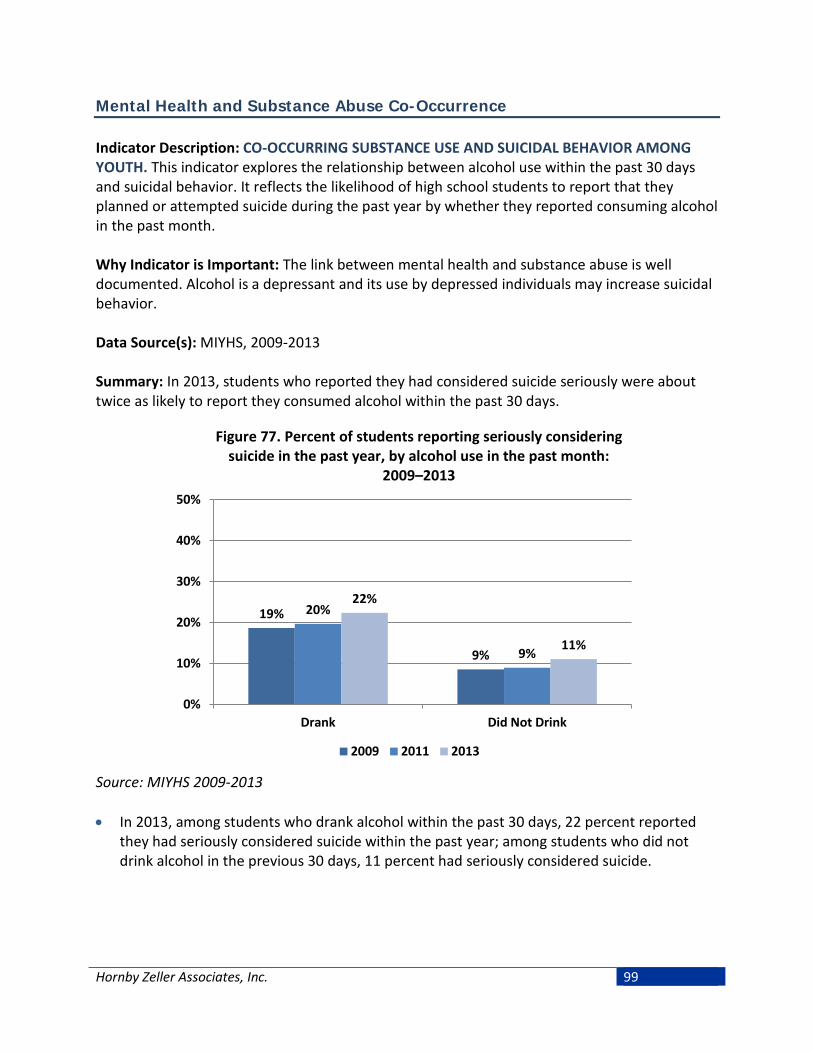
Mental Health and Substance Abuse Co-Occurrence Indicator Description: CO-OCCURRING SUBSTANCE USE AND SUICIDAL BEHAVIOR AMONG YOUTH. This indicator explores the relationship between alcohol use within the past 30 days and suicidal behavior. It reflects the likelihood of high school students to report that they planned or attempted suicide during the past year by whether they reported consuming alcohol in the past month. Why Indicator is Important: The link between mental health and substance abuse is well documented. Alcohol is a depressant and its use by depressed individuals may increase suicidal behavior. Data Source(s): MIYHS, 2009-2013 Summary: In 2013, students who reported they had considered suicide seriously were about twice as likely to report they consumed alcohol within the past 30 days.
Figure 77. Percent of students reporting seriously considering suicide in the past year, by alcohol use in the past month:
2009–2013
Source: MIYHS 2009-2013 • In 2013, among students who drank alcohol within the past 30 days, 22 percent reported
they had seriously considered suicide within the past year; among students who did not drink alcohol in the previous 30 days, 11 percent had seriously considered suicide.
19%
9%
20%
9%
22%
11%
0%
10%
20%
30%
40%
50%
Drank Did Not Drink
2009 2011 2013
Hornby Zeller Associates, Inc. 99

Indicator Description: CO-OCCURRING MENTAL HEALTH AND SUBSTANCE ABUSE TREATMENT. This indicator reflects the proportion of treatment admissions for substance abuse where the individual has a mental health diagnosis or has previously received mental health services. Why Indicator is Important: The link between mental health and substance abuse is well documented. In terms of treatment, it is important to know if one exists since the symptoms of each can affect the other. Data Source(s): TDS, 2010-2014 Summary: In 2014, over half (58%) of all substance abuse treatment admissions also involved a mental health disorder; this rate has been increasing steadily over the past several years. Nearly one-third had received outpatient mental health services in the past year while one in ten had a psychiatric admission in the past two years.
Figure 78. Percent of total treatment admissions with reported mental health disorders: 2010–2014
Source: TDS, 2010-2014 • In 2014, 58 percent of all substance abuse treatment admissions also had a diagnosed
mental health disorder; this rate has increased by eight percentage points since 2010. It is worth noting that beginning in 2007 Maine engaged in an initiative to better diagnose and treat individuals with co-occurring substance abuse and mental health disorders.
50% 53% 54% 57% 58%
0%
20%
40%
60%
80%
100%
2010 2011 2012 2013 2014
Hornby Zeller Associates, Inc. 100

Figure 79. Percent of total treatment admissions where individuals received previous mental health services, by
type: 2010–2014
Source: TDS, 2010-2014 • In 2014, 29 percent of all substance abuse treatment admissions had received outpatient
mental health services in the past year. • Ten percent of substance abuse treatment admissions in 2014 reported a psychiatric
admission (meaning hospitalization due to mental health) within the past two years. This has remained stable since 2010.
28% 29% 29% 30% 29%
9% 9% 9% 10% 10%
0%
10%
20%
30%
40%
50%
2010 2011 2012 2013 2014
Outpatient (past year) Psychiatric (past two years)
Hornby Zeller Associates, Inc. 101
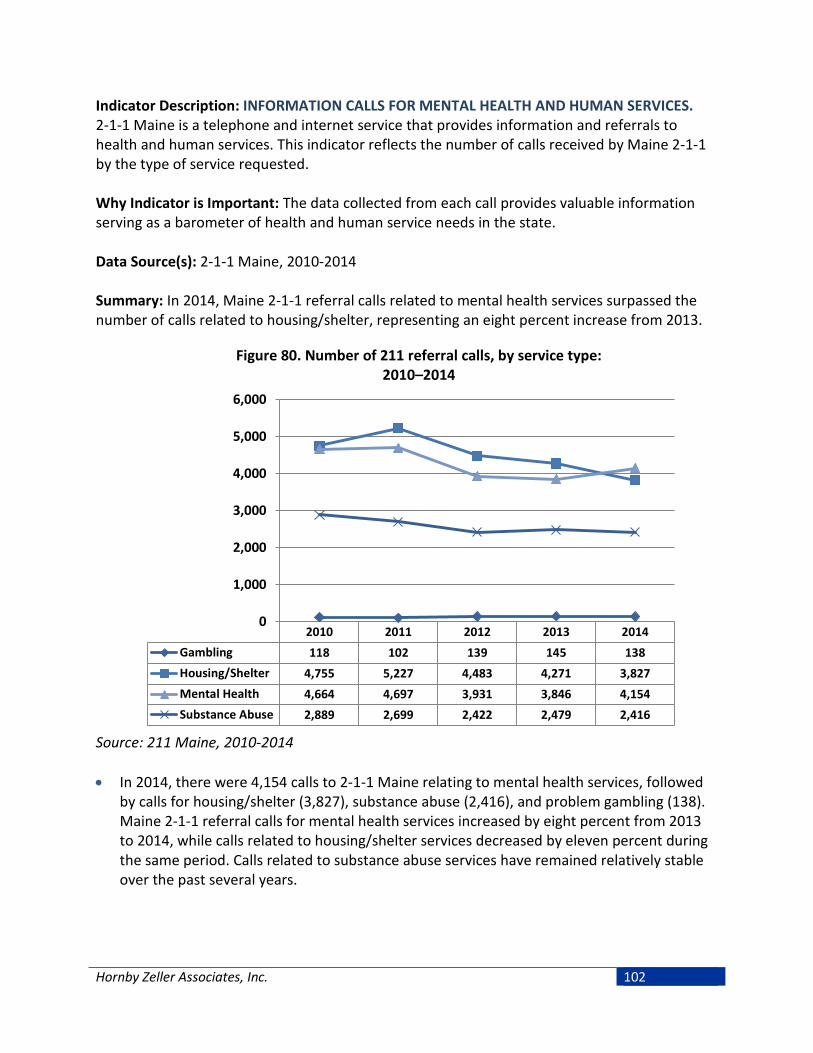
Indicator Description: INFORMATION CALLS FOR MENTAL HEALTH AND HUMAN SERVICES. 2-1-1 Maine is a telephone and internet service that provides information and referrals to health and human services. This indicator reflects the number of calls received by Maine 2-1-1 by the type of service requested. Why Indicator is Important: The data collected from each call provides valuable information serving as a barometer of health and human service needs in the state. Data Source(s): 2-1-1 Maine, 2010-2014 Summary: In 2014, Maine 2-1-1 referral calls related to mental health services surpassed the number of calls related to housing/shelter, representing an eight percent increase from 2013.
Figure 80. Number of 211 referral calls, by service type: 2010–2014
Source: 211 Maine, 2010-2014 • In 2014, there were 4,154 calls to 2-1-1 Maine relating to mental health services, followed
by calls for housing/shelter (3,827), substance abuse (2,416), and problem gambling (138). Maine 2-1-1 referral calls for mental health services increased by eight percent from 2013 to 2014, while calls related to housing/shelter services decreased by eleven percent during the same period. Calls related to substance abuse services have remained relatively stable over the past several years.
2010 2011 2012 2013 2014Gambling 118 102 139 145 138Housing/Shelter 4,755 5,227 4,483 4,271 3,827Mental Health 4,664 4,697 3,931 3,846 4,154Substance Abuse 2,889 2,699 2,422 2,479 2,416
0
1,000
2,000
3,000
4,000
5,000
6,000
Hornby Zeller Associates, Inc. 102

Treatment Admissions for Substance Abuse
Treatment related to substance abuse is measured in two forms: substance abuse treatment program admissions and general hospital admissions related to substance abuse problems. The latter were presented in the earlier section involving consequences. This section primarily presents admissions to substance abuse treatment programs, which can be voluntary or court-ordered. All agencies that provide substance abuse treatment services through a contract with SAMHS or Maine Care, or that are licensed to provide those services in Maine, are required to submit information about their clients to the state. Substance abuse treatment admissions are an indicator of how many people receive treatment for a substance abuse problem. Treatment admission data should not be used as an indicator of the magnitude of the problems related to substance abuse within Maine. Rather, treatment admissions should be seen a major consequence stemming from substance use and one that requires many resources. Information regarding treatment admissions also provides useful information about the patterns of substance use among various populations. Mainers continue to seek out treatment for abuse involving a wide array of substances besides alcohol; in 2014 3,589 clients were admitted for alcohol as the primary substance. This was followed by synthetic opioids (2,663) and heroin (2,538).
Figure 81. Primary treatment admissions by substance: 2014*
Source: TDS, 2014 *TDS system is not static; therefore 2014 numbers may be artificially low. Data were retrieved 1/28/2015
3,589
2,663
2,538
575
542
341
64
53
49
49
0 1,000 2,000 3,000 4,000
Alcohol
Synthetic Oipiods
Heroin/Morphine
Methadone/Buprenorphine
Marijuana
Crack/Cocaine
Bath Salts
Methamphetamine
Benzodiazepines
Stimulants
Hornby Zeller Associates, Inc. 103
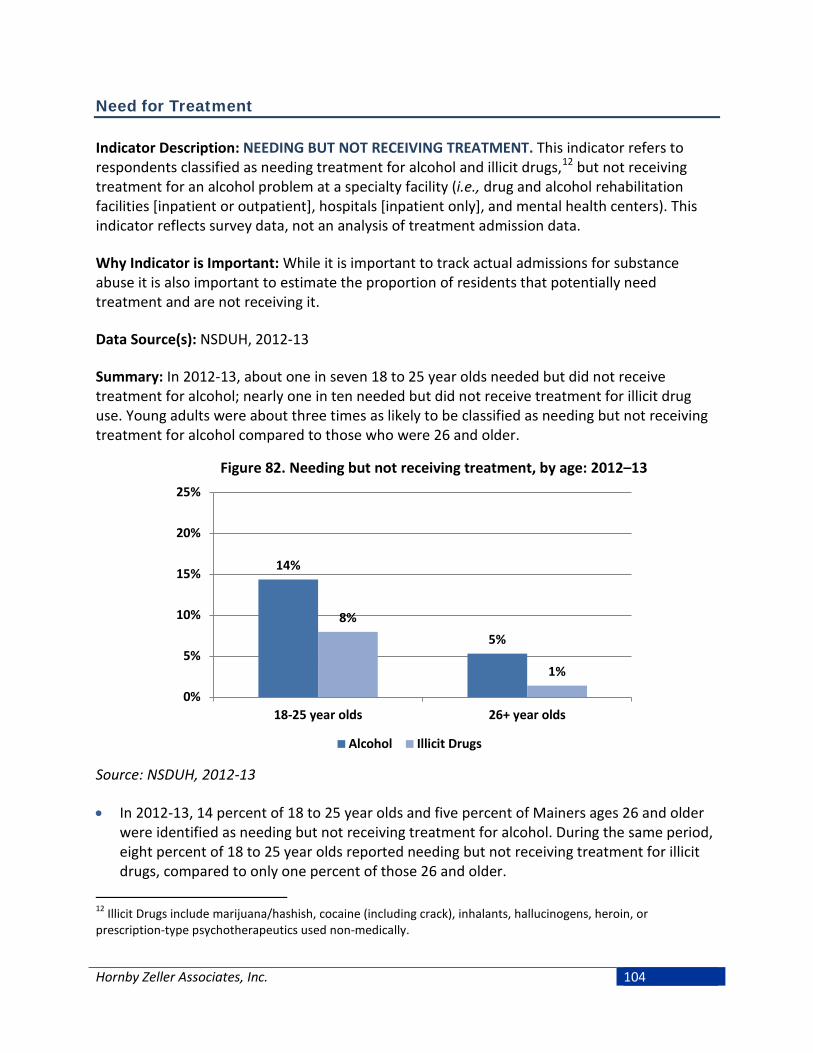
Need for Treatment Indicator Description: NEEDING BUT NOT RECEIVING TREATMENT. This indicator refers to respondents classified as needing treatment for alcohol and illicit drugs,12 but not receiving treatment for an alcohol problem at a specialty facility (i.e., drug and alcohol rehabilitation facilities [inpatient or outpatient], hospitals [inpatient only], and mental health centers). This indicator reflects survey data, not an analysis of treatment admission data. Why Indicator is Important: While it is important to track actual admissions for substance abuse it is also important to estimate the proportion of residents that potentially need treatment and are not receiving it. Data Source(s): NSDUH, 2012-13 Summary: In 2012-13, about one in seven 18 to 25 year olds needed but did not receive treatment for alcohol; nearly one in ten needed but did not receive treatment for illicit drug use. Young adults were about three times as likely to be classified as needing but not receiving treatment for alcohol compared to those who were 26 and older.
Figure 82. Needing but not receiving treatment, by age: 2012–13
Source: NSDUH, 2012-13 • In 2012-13, 14 percent of 18 to 25 year olds and five percent of Mainers ages 26 and older
were identified as needing but not receiving treatment for alcohol. During the same period, eight percent of 18 to 25 year olds reported needing but not receiving treatment for illicit drugs, compared to only one percent of those 26 and older.
12 Illicit Drugs include marijuana/hashish, cocaine (including crack), inhalants, hallucinogens, heroin, or prescription-type psychotherapeutics used non-medically.
14%
5% 8%
1%
0%
5%
10%
15%
20%
25%
18-25 year olds 26+ year olds
Alcohol Illicit Drugs
Hornby Zeller Associates, Inc. 104
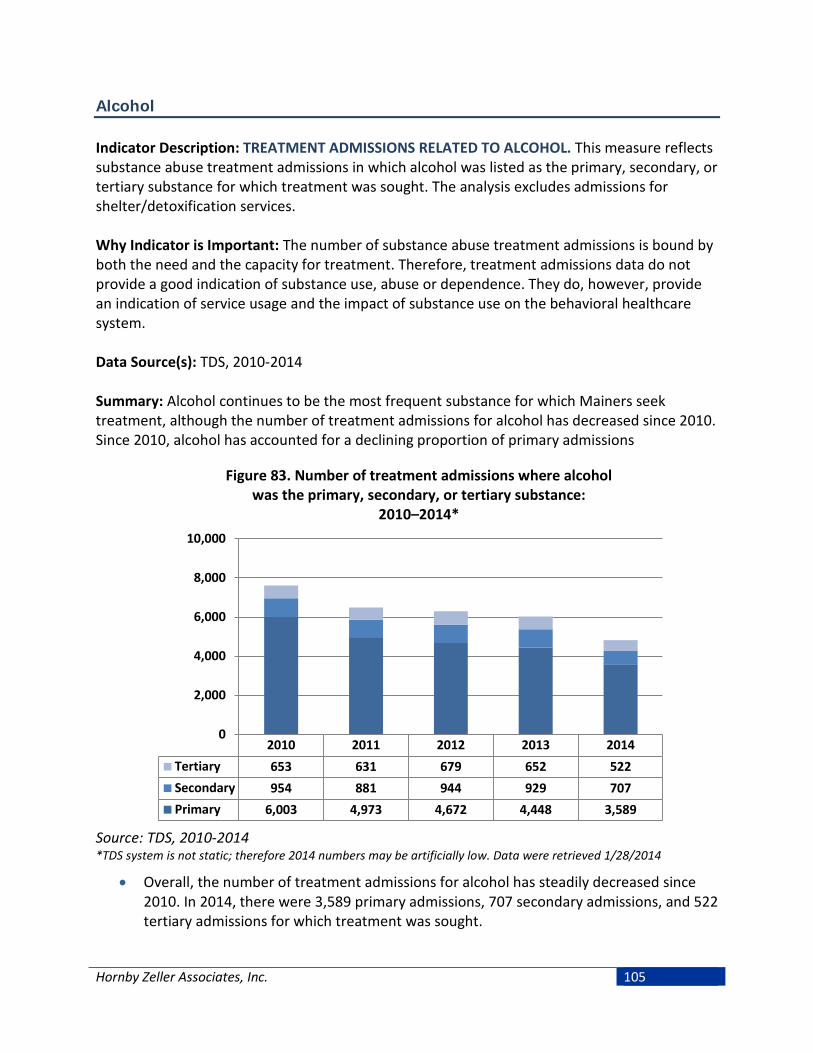
Alcohol Indicator Description: TREATMENT ADMISSIONS RELATED TO ALCOHOL. This measure reflects substance abuse treatment admissions in which alcohol was listed as the primary, secondary, or tertiary substance for which treatment was sought. The analysis excludes admissions for shelter/detoxification services. Why Indicator is Important: The number of substance abuse treatment admissions is bound by both the need and the capacity for treatment. Therefore, treatment admissions data do not provide a good indication of substance use, abuse or dependence. They do, however, provide an indication of service usage and the impact of substance use on the behavioral healthcare system. Data Source(s): TDS, 2010-2014 Summary: Alcohol continues to be the most frequent substance for which Mainers seek treatment, although the number of treatment admissions for alcohol has decreased since 2010. Since 2010, alcohol has accounted for a declining proportion of primary admissions
Figure 83. Number of treatment admissions where alcohol was the primary, secondary, or tertiary substance:
2010–2014*
Source: TDS, 2010-2014 *TDS system is not static; therefore 2014 numbers may be artificially low. Data were retrieved 1/28/2014
• Overall, the number of treatment admissions for alcohol has steadily decreased since 2010. In 2014, there were 3,589 primary admissions, 707 secondary admissions, and 522 tertiary admissions for which treatment was sought.
2010 2011 2012 2013 2014Tertiary 653 631 679 652 522Secondary 954 881 944 929 707Primary 6,003 4,973 4,672 4,448 3,589
0
2,000
4,000
6,000
8,000
10,000
Hornby Zeller Associates, Inc. 105
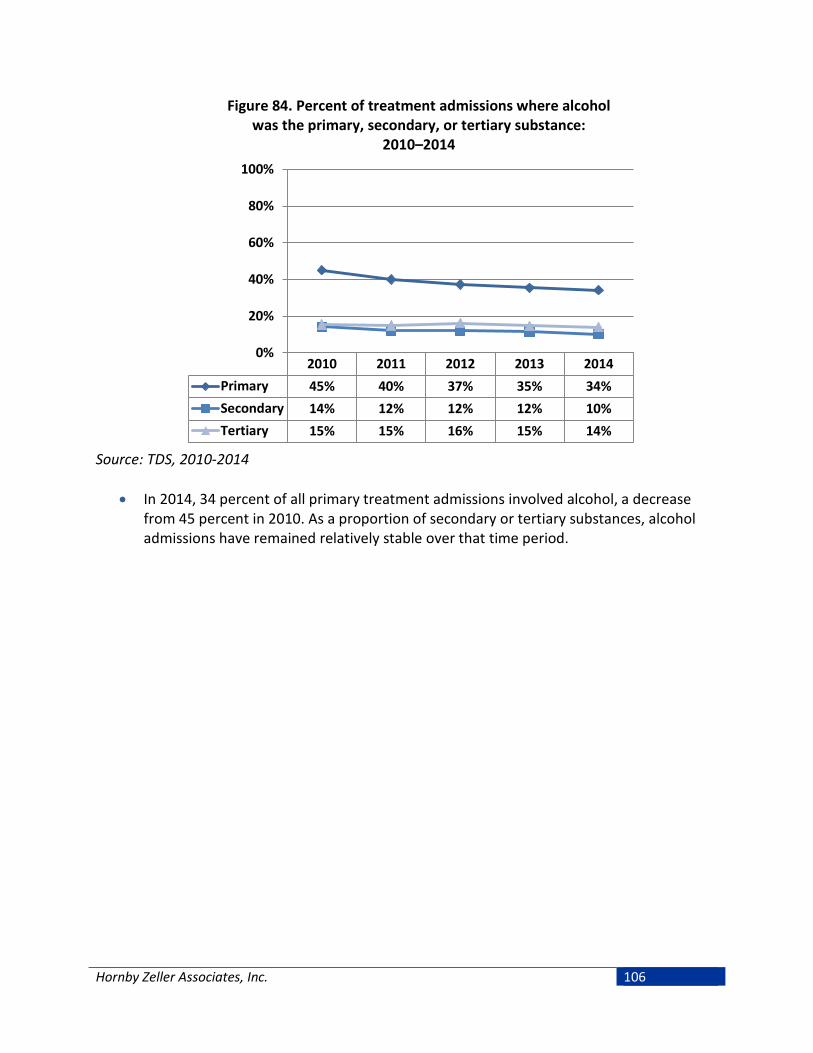
Figure 84. Percent of treatment admissions where alcohol was the primary, secondary, or tertiary substance:
2010–2014
Source: TDS, 2010-2014
• In 2014, 34 percent of all primary treatment admissions involved alcohol, a decrease from 45 percent in 2010. As a proportion of secondary or tertiary substances, alcohol admissions have remained relatively stable over that time period.
2010 2011 2012 2013 2014Primary 45% 40% 37% 35% 34%Secondary 14% 12% 12% 12% 10%Tertiary 15% 15% 16% 15% 14%
0%
20%
40%
60%
80%
100%
Hornby Zeller Associates, Inc. 106
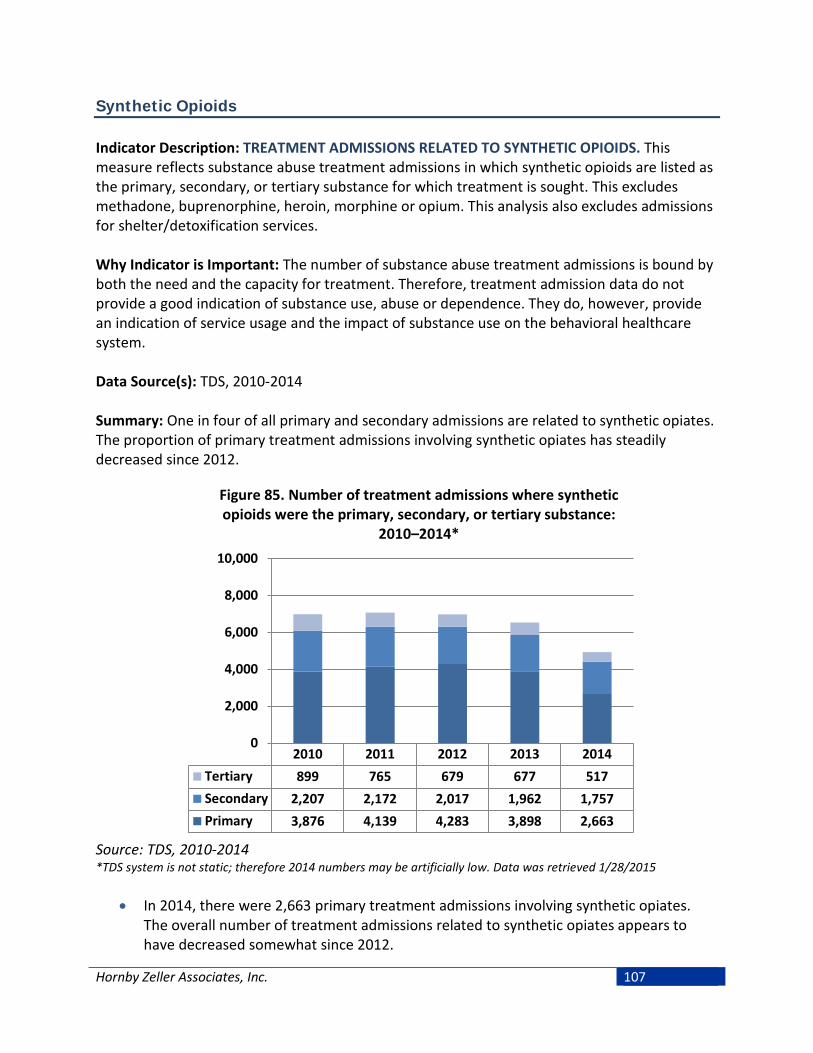
Synthetic Opioids Indicator Description: TREATMENT ADMISSIONS RELATED TO SYNTHETIC OPIOIDS. This measure reflects substance abuse treatment admissions in which synthetic opioids are listed as the primary, secondary, or tertiary substance for which treatment is sought. This excludes methadone, buprenorphine, heroin, morphine or opium. This analysis also excludes admissions for shelter/detoxification services. Why Indicator is Important: The number of substance abuse treatment admissions is bound by both the need and the capacity for treatment. Therefore, treatment admission data do not provide a good indication of substance use, abuse or dependence. They do, however, provide an indication of service usage and the impact of substance use on the behavioral healthcare system. Data Source(s): TDS, 2010-2014 Summary: One in four of all primary and secondary admissions are related to synthetic opiates. The proportion of primary treatment admissions involving synthetic opiates has steadily decreased since 2012.
Figure 85. Number of treatment admissions where synthetic opioids were the primary, secondary, or tertiary substance:
2010–2014*
Source: TDS, 2010-2014 *TDS system is not static; therefore 2014 numbers may be artificially low. Data was retrieved 1/28/2015
• In 2014, there were 2,663 primary treatment admissions involving synthetic opiates. The overall number of treatment admissions related to synthetic opiates appears to have decreased somewhat since 2012.
2010 2011 2012 2013 2014Tertiary 899 765 679 677 517Secondary 2,207 2,172 2,017 1,962 1,757Primary 3,876 4,139 4,283 3,898 2,663
0
2,000
4,000
6,000
8,000
10,000
Hornby Zeller Associates, Inc. 107

Figure 86. Percent of total treatment admissions where synthetic opioids were the primary, secondary, or tertiary
substance: 2010–2014
Source: TDS, 2010-2014
• In 2014, synthetic opiates were the primary substance for which treatment was sought in 25 percent of all treatment admissions; they were also listed as the secondary substance in 25 percent of admissions that listed a second substance. After steadily increasing from 2010 (29%) to 2012 (33%), the proportion of primary treatment admissions due to synthetic opiates decreased by nine percentage points from 2012 to 2014.
2010 2011 2012 2013 2014Primary 29% 32% 34% 31% 25%Secondary 27% 28% 26% 25% 25%Tertiary 21% 18% 15% 16% 14%
0%
10%
20%
30%
40%
50%
Hornby Zeller Associates, Inc. 108

Marijuana Indicator Description: TREATMENT ADMISSIONS RELATED TO MARIJUANA. This measure reflects substance abuse treatment admissions in which marijuana is listed as the primary, secondary, or tertiary substance for which treatment is sought. This analysis excludes admissions for shelter/detoxification services. Why Indicator is Important: The number of substance abuse treatment admissions is bound by both the need and the capacity for treatment. Therefore, treatment admissions data do not provide a good indication of substance use, abuse or dependence. They do, however, provide an indication of service usage and the impact of substance use on the behavioral healthcare system. Data Source(s): TDS, 2010-2014 Summary: Marijuana tends to be listed as a secondary or tertiary substance for which treatment is sought. Almost one in three secondary and tertiary admissions is related to marijuana.
Figure 87. Number of treatment admissions where marijuana was the primary, secondary, or tertiary substance:
2010–2014*
Source: TDS, 2010-2014 *TDS system is not static; therefore 2014 numbers may be artificially low. Data were retrieved 1/28/2015
• In 2014, marijuana was listed as a secondary substance in more treatment admissions than as a primary substance (1,985 compared to 542). This pattern has remained relatively consistent since 2010.
2010 2011 2012 2013 2014Tertiary 1,133 1,163 1,176 1,209 1,141Secondary 2,432 2,176 2,389 2,360 1,985Primary 920 864 777 691 542
0
2,000
4,000
6,000
8,000
10,000
Hornby Zeller Associates, Inc. 109

Figure 88. Percent of total treatment admissions where marijuana was the primary, secondary, or tertiary substance:
2010–2014
Source: TDS, 2010-2014
• In 2014, marijuana accounted for a small proportion of primary treatment admissions (5%), but accounted for 29 percent of secondary admissions and 30 percent of tertiary admissions. Primary, secondary, and tertiary rates have remained relatively stable since 2010.
2010 2011 2012 2013 2014Primary 7% 7% 6% 6% 5%Secondary 31% 29% 30% 30% 29%Tertiary 27% 27% 28% 28% 30%
0%
10%
20%
30%
40%
50%
Hornby Zeller Associates, Inc. 110

Heroin/Morphine Indicator Description: TREATMENT ADMISSIONS RELATED TO HEROIN/MORPHINE. This measure reflects substance abuse treatment admissions in which heroin or morphine is listed as the primary, secondary, or tertiary substance for which treatment is sought. This analysis excludes admissions for shelter/detoxification services. Why Indicator is Important: The number of substance abuse treatment admissions is bound by both the need and the capacity for treatment. Therefore, treatment admissions data do not provide a good indication of substance use, abuse or dependence. They do, however, provide an indication of service usage and the impact of substance use on the behavioral healthcare system. Data Source(s): TDS, 2010-2014 Summary: Total treatment admissions for heroin or morphine have been steadily increasing since 2010. About one in four primary admissions and one in ten secondary admissions were due to heroin or morphine in 2014.
Figure 89. Number of treatment admissions where heroin or morphine were the primary, secondary, or tertiary
substance: 2010–2014*
Source: TDS, 2010-2014 *TDS system is not static; therefore 2014 numbers may be artificially low. Data were retrieved 1/28/2015
• In 2014, there were 2,538 admissions in which heroin or morphine were the primary substance for which treatment was sought; they were listed as a secondary substance in 769 cases. The total number of admissions related to heroin/morphine has been steadily increasing since 2010; representing a 90 percent increase.
2010 2011 2012 2013 2014Tertiary 243 232 233 264 218Secondary 583 575 625 757 769Primary 955 1,098 1,432 2,075 2,538
0
1,000
2,000
3,000
4,000
5,000
Hornby Zeller Associates, Inc. 111

Figure 90. Percent of total treatment admissions where heroin/morphine was the primary, secondary, or tertiary
substance: 2010-2014
Source: TDS, 2010-2014
• Heroin was listed as the primary substance in 24 percent of all treatment admissions in 2013, representing a substantial increase of 17 percentage points since 2010. Secondary admissions for heroin have also seen a rise, from eight percent in 2010 to 11 percent in 2014.
2010 2011 2012 2013 2014Primary 7% 9% 11% 17% 24%Secondary 8% 8% 8% 10% 11%Tertiary 6% 5% 6% 6% 6%
0%
5%
10%
15%
20%
25%
Hornby Zeller Associates, Inc. 112
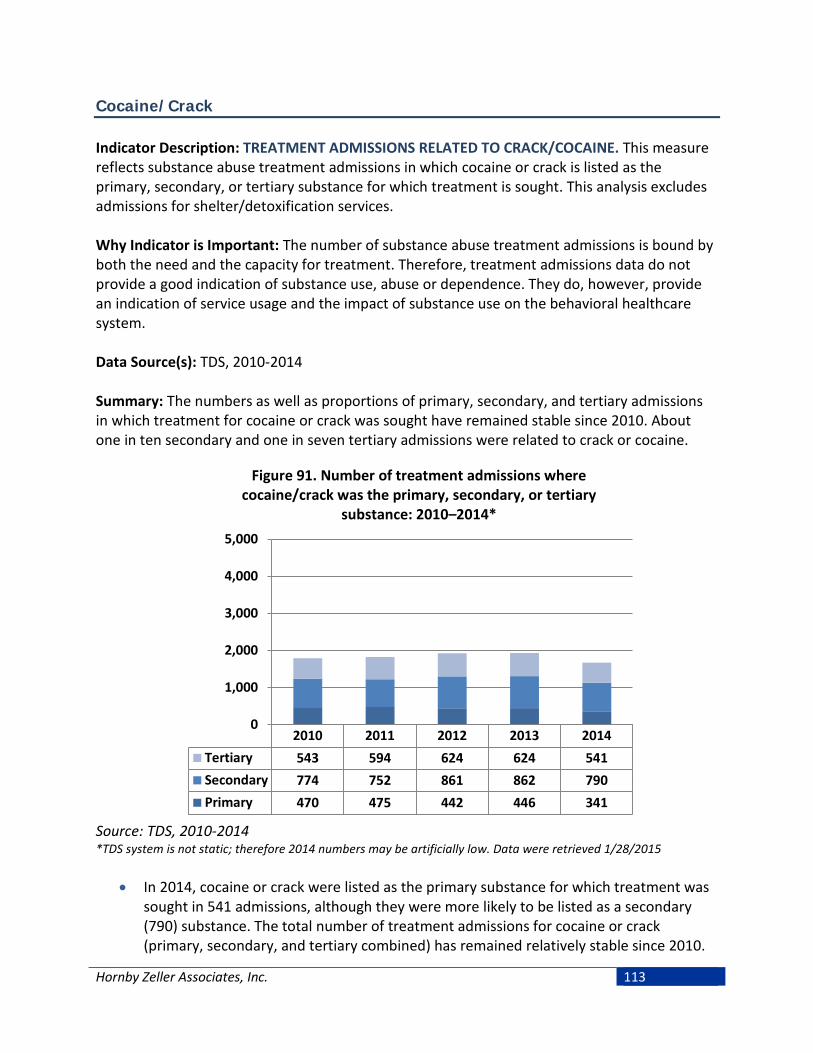
Cocaine/Crack Indicator Description: TREATMENT ADMISSIONS RELATED TO CRACK/COCAINE. This measure reflects substance abuse treatment admissions in which cocaine or crack is listed as the primary, secondary, or tertiary substance for which treatment is sought. This analysis excludes admissions for shelter/detoxification services. Why Indicator is Important: The number of substance abuse treatment admissions is bound by both the need and the capacity for treatment. Therefore, treatment admissions data do not provide a good indication of substance use, abuse or dependence. They do, however, provide an indication of service usage and the impact of substance use on the behavioral healthcare system. Data Source(s): TDS, 2010-2014 Summary: The numbers as well as proportions of primary, secondary, and tertiary admissions in which treatment for cocaine or crack was sought have remained stable since 2010. About one in ten secondary and one in seven tertiary admissions were related to crack or cocaine.
Figure 91. Number of treatment admissions where cocaine/crack was the primary, secondary, or tertiary
substance: 2010–2014*
Source: TDS, 2010-2014 *TDS system is not static; therefore 2014 numbers may be artificially low. Data were retrieved 1/28/2015
• In 2014, cocaine or crack were listed as the primary substance for which treatment was sought in 541 admissions, although they were more likely to be listed as a secondary (790) substance. The total number of treatment admissions for cocaine or crack (primary, secondary, and tertiary combined) has remained relatively stable since 2010.
2010 2011 2012 2013 2014Tertiary 543 594 624 624 541Secondary 774 752 861 862 790Primary 470 475 442 446 341
0
1,000
2,000
3,000
4,000
5,000
Hornby Zeller Associates, Inc. 113
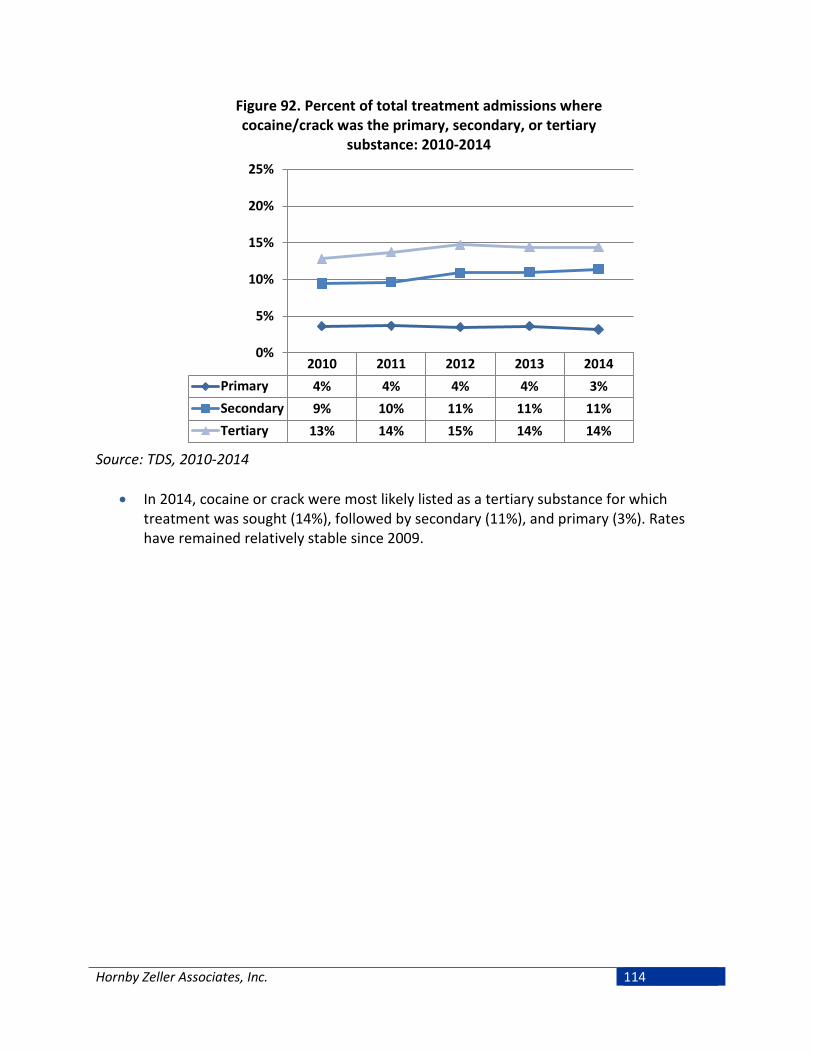
Figure 92. Percent of total treatment admissions where cocaine/crack was the primary, secondary, or tertiary
substance: 2010-2014
Source: TDS, 2010-2014
• In 2014, cocaine or crack were most likely listed as a tertiary substance for which treatment was sought (14%), followed by secondary (11%), and primary (3%). Rates have remained relatively stable since 2009.
2010 2011 2012 2013 2014Primary 4% 4% 4% 4% 3%Secondary 9% 10% 11% 11% 11%Tertiary 13% 14% 15% 14% 14%
0%
5%
10%
15%
20%
25%
Hornby Zeller Associates, Inc. 114
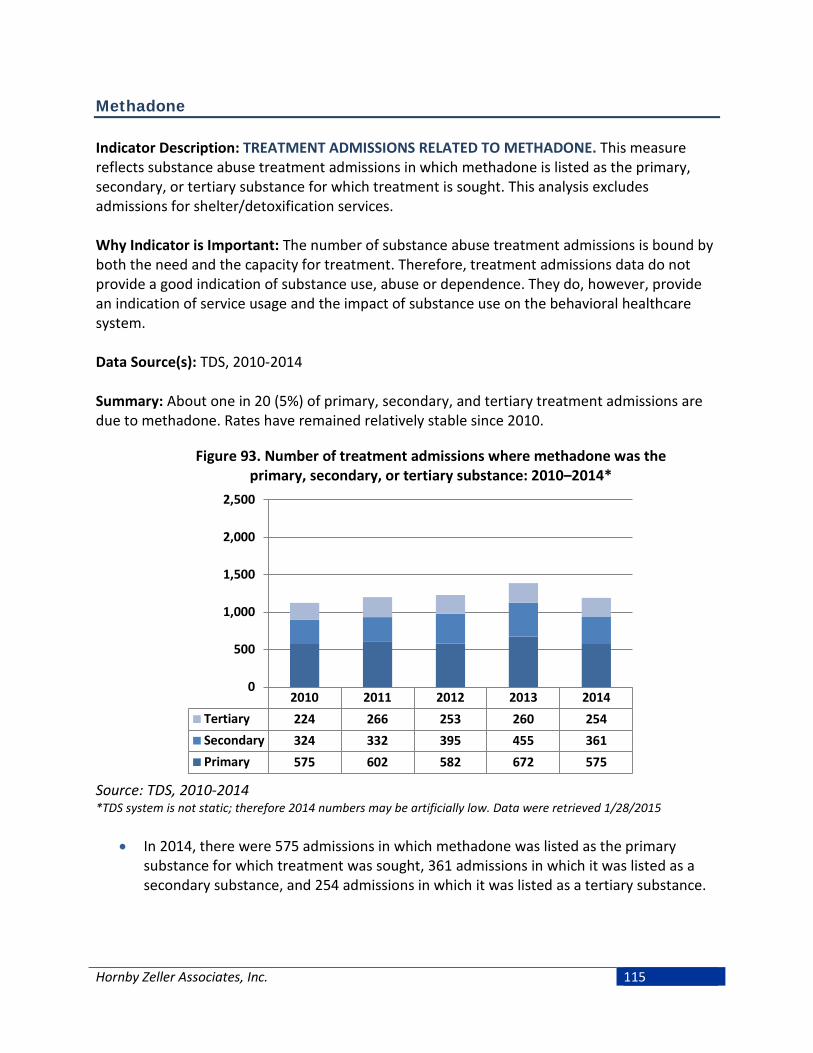
Methadone Indicator Description: TREATMENT ADMISSIONS RELATED TO METHADONE. This measure reflects substance abuse treatment admissions in which methadone is listed as the primary, secondary, or tertiary substance for which treatment is sought. This analysis excludes admissions for shelter/detoxification services. Why Indicator is Important: The number of substance abuse treatment admissions is bound by both the need and the capacity for treatment. Therefore, treatment admissions data do not provide a good indication of substance use, abuse or dependence. They do, however, provide an indication of service usage and the impact of substance use on the behavioral healthcare system. Data Source(s): TDS, 2010-2014 Summary: About one in 20 (5%) of primary, secondary, and tertiary treatment admissions are due to methadone. Rates have remained relatively stable since 2010.
Figure 93. Number of treatment admissions where methadone was the primary, secondary, or tertiary substance: 2010–2014*
Source: TDS, 2010-2014 *TDS system is not static; therefore 2014 numbers may be artificially low. Data were retrieved 1/28/2015
• In 2014, there were 575 admissions in which methadone was listed as the primary substance for which treatment was sought, 361 admissions in which it was listed as a secondary substance, and 254 admissions in which it was listed as a tertiary substance.
2010 2011 2012 2013 2014Tertiary 224 266 253 260 254Secondary 324 332 395 455 361Primary 575 602 582 672 575
0
500
1,000
1,500
2,000
2,500
Hornby Zeller Associates, Inc. 115

Figure 94. Percent of total treatment admissions where methadone was the primary, secondary, or tertiary
substance: 2010–2014
Source: TDS, 2010-2014
• In 2014, methadone accounted for six percent of primary admissions, five percent of secondary admissions, and seven percent of tertiary admissions. Rates have remained relatively stable since 2010.
2010 2011 2012 2013 2014Primary 4% 5% 5% 5% 6%Secondary 4% 4% 5% 6% 5%Tertiary 5% 6% 6% 6% 7%
0%
5%
10%
15%
20%
25%
Hornby Zeller Associates, Inc. 116
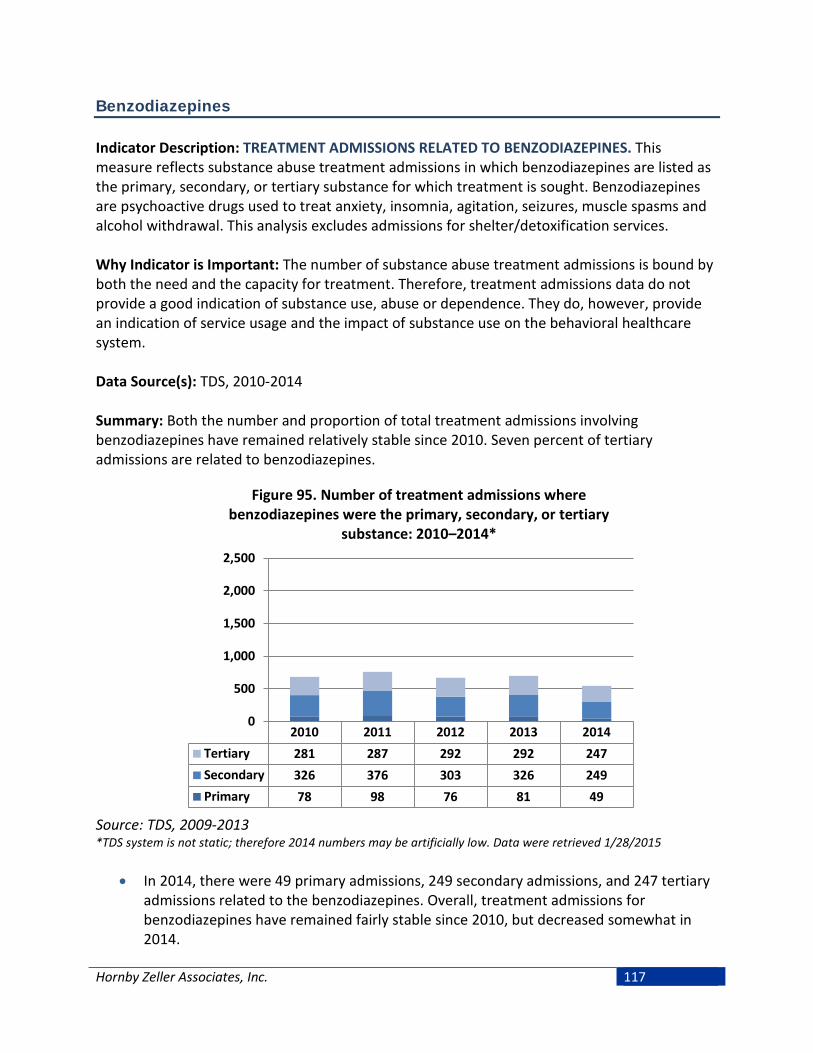
Benzodiazepines Indicator Description: TREATMENT ADMISSIONS RELATED TO BENZODIAZEPINES. This measure reflects substance abuse treatment admissions in which benzodiazepines are listed as the primary, secondary, or tertiary substance for which treatment is sought. Benzodiazepines are psychoactive drugs used to treat anxiety, insomnia, agitation, seizures, muscle spasms and alcohol withdrawal. This analysis excludes admissions for shelter/detoxification services. Why Indicator is Important: The number of substance abuse treatment admissions is bound by both the need and the capacity for treatment. Therefore, treatment admissions data do not provide a good indication of substance use, abuse or dependence. They do, however, provide an indication of service usage and the impact of substance use on the behavioral healthcare system. Data Source(s): TDS, 2010-2014 Summary: Both the number and proportion of total treatment admissions involving benzodiazepines have remained relatively stable since 2010. Seven percent of tertiary admissions are related to benzodiazepines.
Figure 95. Number of treatment admissions where benzodiazepines were the primary, secondary, or tertiary
substance: 2010–2014*
Source: TDS, 2009-2013 *TDS system is not static; therefore 2014 numbers may be artificially low. Data were retrieved 1/28/2015
• In 2014, there were 49 primary admissions, 249 secondary admissions, and 247 tertiary admissions related to the benzodiazepines. Overall, treatment admissions for benzodiazepines have remained fairly stable since 2010, but decreased somewhat in 2014.
2010 2011 2012 2013 2014Tertiary 281 287 292 292 247Secondary 326 376 303 326 249Primary 78 98 76 81 49
0
500
1,000
1,500
2,000
2,500
Hornby Zeller Associates, Inc. 117
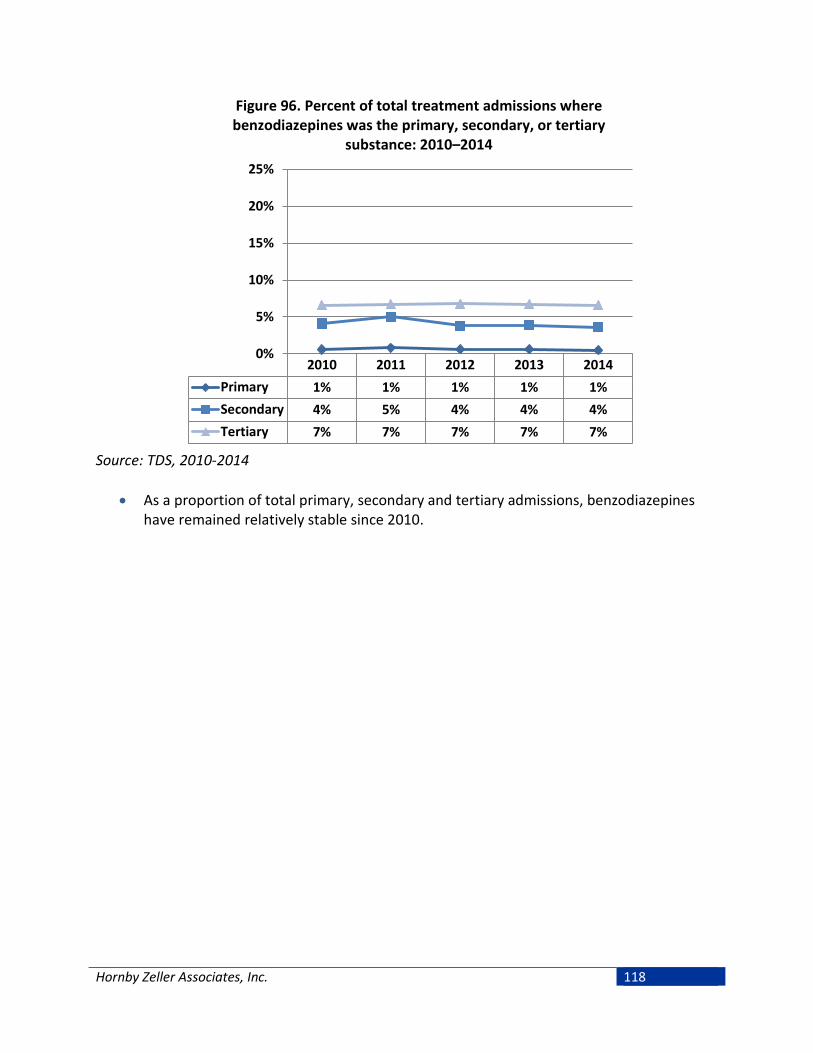
Figure 96. Percent of total treatment admissions where benzodiazepines was the primary, secondary, or tertiary
substance: 2010–2014
Source: TDS, 2010-2014
• As a proportion of total primary, secondary and tertiary admissions, benzodiazepines have remained relatively stable since 2010.
2010 2011 2012 2013 2014Primary 1% 1% 1% 1% 1%Secondary 4% 5% 4% 4% 4%Tertiary 7% 7% 7% 7% 7%
0%
5%
10%
15%
20%
25%
Hornby Zeller Associates, Inc. 118
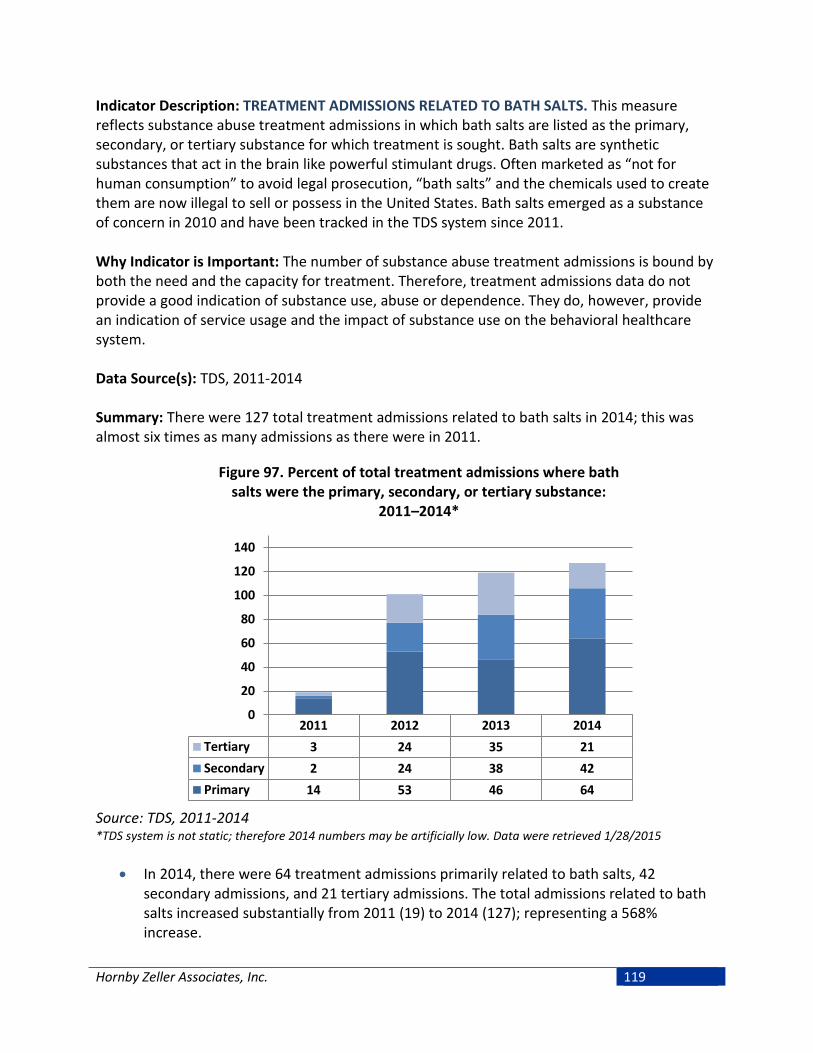
Indicator Description: TREATMENT ADMISSIONS RELATED TO BATH SALTS. This measure reflects substance abuse treatment admissions in which bath salts are listed as the primary, secondary, or tertiary substance for which treatment is sought. Bath salts are synthetic substances that act in the brain like powerful stimulant drugs. Often marketed as “not for human consumption” to avoid legal prosecution, “bath salts” and the chemicals used to create them are now illegal to sell or possess in the United States. Bath salts emerged as a substance of concern in 2010 and have been tracked in the TDS system since 2011. Why Indicator is Important: The number of substance abuse treatment admissions is bound by both the need and the capacity for treatment. Therefore, treatment admissions data do not provide a good indication of substance use, abuse or dependence. They do, however, provide an indication of service usage and the impact of substance use on the behavioral healthcare system. Data Source(s): TDS, 2011-2014 Summary: There were 127 total treatment admissions related to bath salts in 2014; this was almost six times as many admissions as there were in 2011.
Figure 97. Percent of total treatment admissions where bath salts were the primary, secondary, or tertiary substance:
2011–2014*
Source: TDS, 2011-2014 *TDS system is not static; therefore 2014 numbers may be artificially low. Data were retrieved 1/28/2015
• In 2014, there were 64 treatment admissions primarily related to bath salts, 42 secondary admissions, and 21 tertiary admissions. The total admissions related to bath salts increased substantially from 2011 (19) to 2014 (127); representing a 568% increase.
2011 2012 2013 2014Tertiary 3 24 35 21Secondary 2 24 38 42Primary 14 53 46 64
0
20
40
60
80
100
120
140
Hornby Zeller Associates, Inc. 119

Hornby Zeller Associates, Inc. 120
Conclusion
Alcohol is the substance most often used by Mainers across the lifespan and the substance for which most seek treatment. Great progress has been made towards reducing the rate of alcohol use among Maine’s youth, as evidenced by the most recent data trends that show an overall decline in both past month rates of any alcohol use and binge drinking. While consumption rates are down, most teens still feel it is easy to get alcohol. In addition, there continues to be a large discrepancy between parental perceptions of their child’s behaviors compared to the actual behaviors reported by youth. This disconnect continues to be a challenge, especially concerning confronting youth substance use and parental monitoring. Among adults, 18 to 25 year olds as well as those 26 to 35 are the most likely to binge drink and to drink heavily. Perceptions of harm regarding alcohol among these groups continues to be a challenge. These age groups also have the highest rates of motor vehicle crashes and crash fatalities. Nearly one in four fatal motor vehicle crashes in 2014 were related to alcohol. Prescription drugs continue to represent a serious public health concern for Maine. In 2013, more than one in ten high school students reported misusing prescription drugs in their lifetime. Fortunately, the rates for lifetime as well as past month misuse of prescription drugs among students decreased from 2009 to 2013. Among adults, Mainers between the ages of 18 and 35 continue to have the highest rates of prescription drug and pain reliever misuse . Prescription drug misuse also continues to have a large impact on treatment, hospitalizations, and crime in Maine. In addition, the vast majority of overdose deaths were related to pharmaceutical drugs and most drug overdose ambulance responses were due to illicit drugs and/or medication. Furthermore, one in four of all primary and one in four of all secondary admissions are due to synthetic opiates. In terms of illicit drugs, the most commonly used illegal drug in Maine is marijuana. More than one in five high school students reported using marijuana within the past month; similar rates are seen within the young adult (18 to 25) population. Perception of harm from marijuana use has been declining steadily among youth and adults, reinforced by a more permissive attitude among parents and communities. Over half of all high school students think that regular use of marijuana is not risky. Students who do not believe there is moderate to great risk in smoking marijuana regularly are almost eight times as likely to smoke marijuana. In recent years, as the availablity of prescription narcotics has leveled off, heroin use and the consequences thereof have been on the rise. Overdose deaths due to heroin/morphine increased by 500 percent since 2011. Accodring to overdose data, heroin use is most common among Mainers 25 to 54 years old. Rates in EMS nalaxone administrations as well as treatment admissions related to heroin have increased substantially. Furthermore, arrests related to heroin have also increased with one in three DEA drug offenses in 2014 involving heroin.
Hornby Zeller Associates, Inc. 121
Overdose deaths in Maine involving benzodiazepines and fentanyl spiked in 2014. Benzodiazepines, often prescribed to treat anxiety and sleep disorders were involved in one third of drug overdose deaths while fentanyl, a very potent opioid, was a factor in one fifth of drug overdose deaths. Both drugs are available on the street and often abused in conjunction with other drugs such as heroin to moderate or enhance effects. It is vital that we continue to carefully monitor the prevalence and availability of these drugs as well as other dangerous and potentially lethal co-intoxicants. The relationship between substance use and mental health has been well documented. About one fourth of adults in Maine report having ever been diagnosed with depression and one fifth diagnosed with anxiety. Rates of anxiety and depression tend to be higher among adults under 50. As for youth, one quarter reported feeling sad or hopeless for at least two weeks in the past year and about one in seven had seriously considered or planned suicide in 2013. Suicide rates in Maine have been generally increasing in the past several years, especially among middle aged adults and men in general. Over half of all substance abuse treatment admissions in 2014 also involved a mental health disorder. In 2014 211 Maine calls related to mental health services surpassed those related to housing/shelter. These mental health indicators should continue to be monitored in terms of the relationship they have with substance use and abuse.
Hornby Zeller Associates, Inc. 122


