
Stock Market Indexes
What are they? What do they do?

Indices: What are They?
• An index takes a small cross-section of a larger population as an indicator for that larger population.
• It accomplishes the same thing as an election poll… asking a few voters in order to get an indication of the larger masses.
Indices: What are They?
• An index thus is a representation of the market as a whole.
• Indexes may be very broad, virtually covering the entire market, or very narrow, measuring a small sector of the economy such as oil drilling stocks.

Indices: Terminology
Before going further, in order to understand the indices, you need to understand the term
capitalization.
Capitalization is a way to measure the size of a company.

Indices: Capitalization
Capitalization (aka “Cap”)
= # of shares outstanding x price per share
Stocks are often segregated and referred to by their capitalization, such as Large Cap, Mid Cap, Small Cap, Micro Cap

Indices: Capitalization
Generally speaking…Older companies with high share prices - such as IBM, Microsoft, GE, and Exxon – would fall into the large cap arena.
Less well-known companies would fall into the small-cap arena.
Indices: How many are there?
• There are hundreds of indices from the very broad, to the narrow
• There are 7 major indices that we will study
The Major Indices
• Dow Jones Industrial Average (DJIA)
• S&P 500
• Russell 2000
• S&P 400
• NASDAQ Composite
• Wilshire 5000
• Value Line Geometric Index

Index vs. Exchange
Many beginning investors confuse exchanges with indexes. The exchange is the location at which
the stock is traded, whereas the index is simply a representation of a segment of the stock market.
Index vs. Exchange
For example, IBM trades on the New York Stock Exchange, but is part of several indexes such as
the…
Wilshire 5000, Dow Jones Industrial Average, and the S&P 500.

The Dow Jones
• The DJIA (Dow Jones Industrial Average) is the oldest and most recognized American index.
• It is an index that consists of large cap, blue chip companies.

The Dow Jones Components
Despite the recognition, the index is not a particularly good representation of the broad market because it consists of only 30 companies.
Wal Mart Alcoa Home DepotMcDonalds DuPont JP MorganMicrosoft General Electric 3MExxon Citigroup Johnson & JohnsonInternational Paper AT+T MerckHewlett Packard Coca Cola SBC Comm.United Technologies General Motors Phillip MorrisCaterpillar IBM BoeingAmerican Express Honeywell Proctor & Gamble

Dow Jones Performance
Time Average Annual
3 Years 2.8%
10 years 12.2%
20 Years 12.9%
Since 1950 7.6%
Ending 12/31/01

THE S&P 500
• S&P stands for Standard and Poor’s
• Most of the stocks in this index would be considered large cap growth stocks.
• The average capitalization is 8 billion
• Typically, all the stocks in the Dow are also in the S&P 500

THE S&P 500
• The S&P 500 is a broader index than the DJIA because it comprises 500 stocks in 13 different industries.
• Because it is broader than the DJIA, it is probably a better performance gauge of companies in the large cap arena.

S&P 500 Contents
There are 13 industries represented in the S&P 500, with various weightings that change according to performance.
Sector Weight Sector Weight
Basic Materials 4% Healthcare 15%
Consumer Cyclical 9% Telecommunications 4%
Consumer Non-Cyclical 9% Technology 16%
Energy 7% Commercial Services 5%
Industrials 3% Financials 20%
Utilities 2% Consumer Services 5%
Transportation 1%

S&P 500 Performance
Time Average Annual3 Years -3.5%
10 years 10.6%
20 Years 11.8%
Life (1950) 8.2%
Ending 12/31/01

Russell 2000
• The Russell 2000 consists of 2000 stocks and measures the performance in the small cap segment of the stock market.
• Average capitalization is around 1 billion.

Russell 2000 Performance
Time Average Annual3 Years 5.1%
10 years 9.89%
Life (1987) 10.53%
Ending 12/31/01

S&P 400
• Measures 400 stocks that are meant to represent the mid-cap stocks in the market
• Average capitalization is about 2-4 billion

S&P 400 Performance
Time Average Annual3 Years 12.1%
5 years 17.28%
Life (1992) 12.78%
Ending 12/31/01

NASDAQ Composite
• The NASDAQ represents primarily the technology segment of the market, but also contains retail and financial companies.
• There are approximately 3500 stocks that are represented in this index
• The capitalization's of these stocks can vary widely

NASDAQ Contents
The NASDAQ primarily consists of 5 technology sub-segments:
• Telecommunications• Semiconductors• Software• Networking• Biotechnology

NASDAQ 100
• The NASDAQ 100 is the 100 largest capitalization companies from within the NASDAQ Composite
• It is re-weighted every January
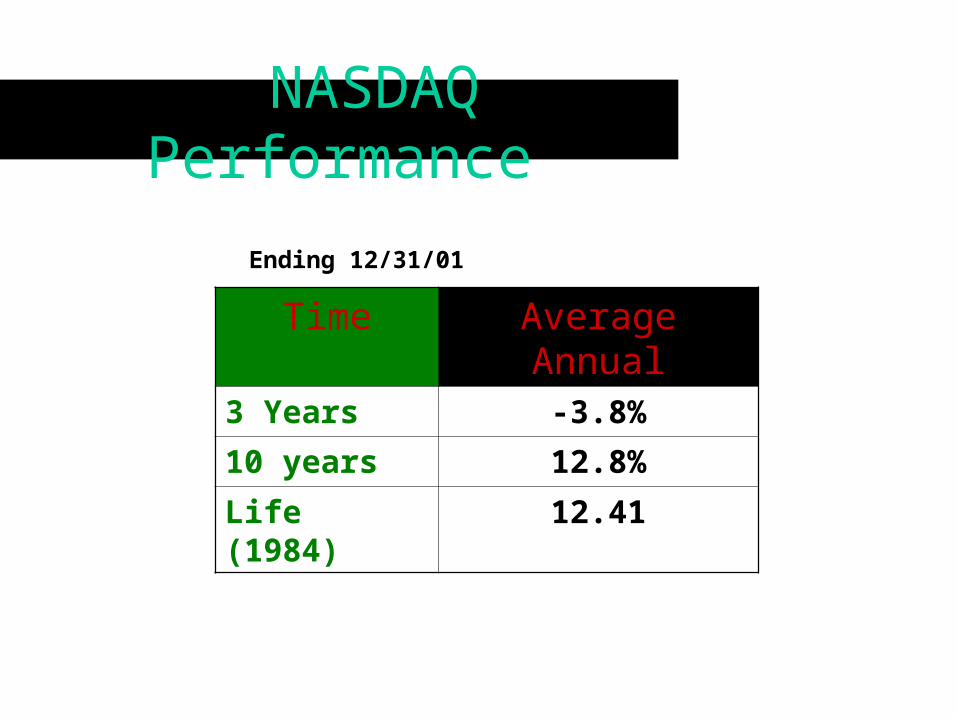
NASDAQ Performance
Time Average Annual3 Years -3.8%
10 years 12.8%
Life (1984) 12.41
Ending 12/31/01
Wilshire 5000
• Measure of 5000 companies in a wide variety of industries, with a wide variety of capitalizations
• Because of this breadth, it is considered on of the best indicators of the overall health of the American stock market
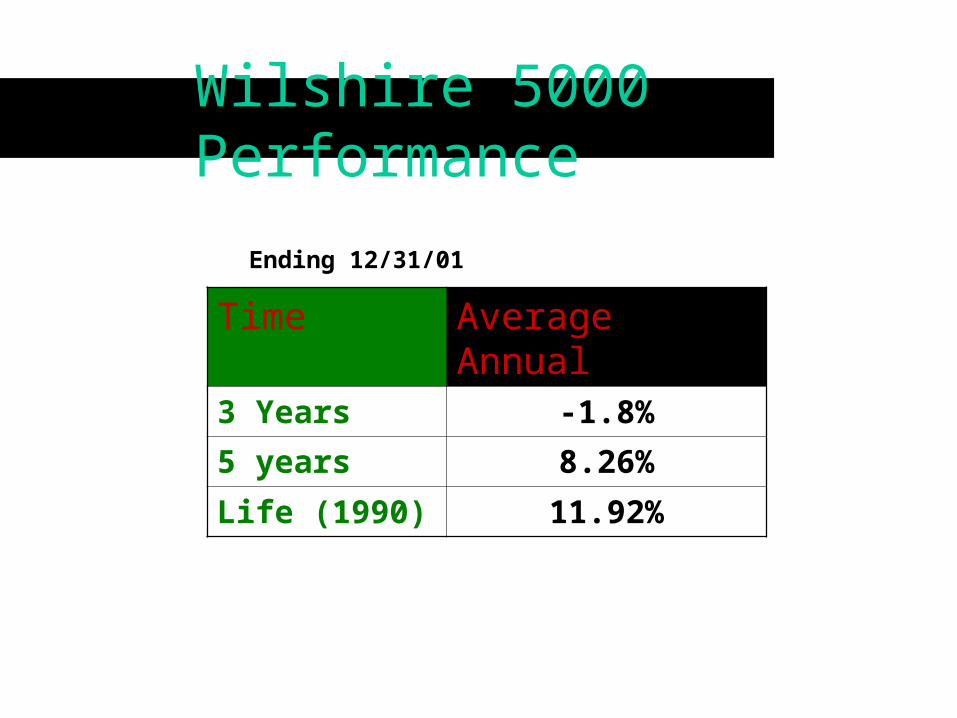
Wilshire 5000 Performance
Time Average Annual3 Years -1.8%
5 years 8.26%
Life (1990) 11.92%
Ending 12/31/01

Capitalization Effects
• All major indexes, with the exception of the DJIA, are capitalization-weighted.
• The effect of this is that larger companies within the index tend to dictate the movement of the index.

Example: Capitalization
Let’s create a very simplistic example of a capitalization weighted index comprising of 5 stocks: A,B,C,D,E. All have the same share price of $10.
A B C D E
Shares Outstanding
100 10 10 10 10
Share Price $10 $10 $10 $10 $10
Capitalization 1000 100 100 100 100

Example: Capitalization
Company A is a much larger capitalized company with 10 times the number of shares outstanding than B,C,D, and E.
A B C D E
Shares Outstanding
100 10 10 10 10
Share Price $10 $10 $10 $10 $10
Capitalization 1000 100 100 100 100
Thus, since they all have the same share price, company A’s capitalization is 10 times as large as the others, and
will have 10 times the impact on the index.

Example: Capitalization
A B C D E
Shares Outstanding 100 10 10 10 10
Share Price $10 $10 $10 $10 $10
Capitalization 1000 100 100 100 100
The total value of this index would be the sum of all the capitalization’s (shares x price), which is…
1000 + 100 + 100 + 100 + 100 = 1400

Example: Capitalization
Now let’s say the price of Company A decreased by $1, and the prices of B,C,D, and E all increased by $1.
A B C D E
Shares Outstanding
100 10 10 10 10
Share Price $9 $11 $11 $11 $11
Capitalization 900 110 110 110 110
The NEW value of this index would be the sum of all the capitalization’s, which is…
900 + 110 + 110 + 110 + 110 = 1340
-60 change

What Happened?
4 of the 5 stocks in our index went up, yet the index fell in value!!
How?
Capitalization! It doesn’t matter how many stock went up or down, the indexes measure the overall change in total capitalization.

What This Means
It means simply that larger stocks will have more impact on the direction of the index
than do the smaller stocks in the index.

More Terminology
Often times indexes will move up for extended periods, even though more stocks are declining than are gaining…
this is known as a thin, or narrow market.
Removing Capitalization Effect
• The DJIA is the only major index that is controlled by the share price rather than the capitalization. (But since only 30 companies make up the index, one or two stocks can have a very large impact on the value).
• The Wilshire 4500 and the Value Line Geometric indices also mitigate the effect of capitalization

Wilshire 4500
• The Wilshire 4500 removes the dominating capitalizations from the Wilshire 5000.
• The 500 stocks that comprise the S&P 500, which have very large capitalizations, are removed from the 5000, which leaves 4500.

Value Line Geometric Index
• Comprised of 1500 stocks of varying capitalization from various market segments
• Treats each stock as 1. Thus, if more stocks go up than down, regardless of capitalization, then the index will go up.
• Is often used to determine the breadth, or overall participation of stocks, during market advances or declines.

Changing The Indexes
All indexes will change their composition from time to time, but generally the stocks within the index remain fairly static.
Why change a company at all?– Changes in capitalization– No longer representative of the industry– Mergers– Bankruptcies
Using The Indexes
• Indexes should be used as a barometer to measure the performance of mutual funds.
• An index is normally quite static, in that the 500 stocks in the S&P 500 don’t change very often.
• If your mutual fund, which is professionally managed, cannot outperform a static index, you should ask yourself what you are paying for.

Comparing Apples
• When comparing fund to an index, be sure you use the right comparisons
• A small cap growth fund would be compared to the Russell 2000, not the S&P 500.

About Index Funds
What is it?– An index fund simply buys all the exact same stocks that
are in the underlying index.
– An S&P 500 index fund would simply own all 500 stocks that are in the S&P 500 index.
– An index fund is simply a clone of the index which investors can buy very easily.

Why Use Index Funds
– An index fund has very low internal expenses. Since the portfolio is rarely changed, transaction costs are very low and there is no need to hire a professional advisor.
– With these lower expenses, index funds often have a 1% head start over actively managed funds.


