Download - STEPHANSEN June 0611

S T R I C T L Y P R I V A T E A N D C O N F I D E N T I A L
GIC Presentation Kathleen StephansenManaging DirectorHead of Economic Strategy AIG Asset Management
Helsinki- June 6, 2011

S T R I C T L Y P R I V A T E A N D C O N F I D E N T I A L
Risk appetite correction
2
Main takeaways: - The commodity price correction, increasingly difficult sovereign bail-out negotiations, the slowdown in global output growth and end of QE2 have all triggered risk aversion and market choppiness. - We view the economic slowdown as temporary within an otherwise moderate self-sustained cycle.
Global growth remains on a firm growth trajectory of close to 4%, down from 5% in 2010. Recent Purchasing Managers Indices (PMI) indicate a more pronounced slowdown in advanced than in emerging economies. We note the PMI declines in the US and the UK, and the moderation in the Euro area. If the Japanese earthquake played any role in the manufacturing slowdown, comfort should be drawn from the sharp rise in Japan’s May PMI. In emerging markets, Russia led the decline, with China and India posting only a moderate slowdown in their May PMIs. Of note, China will likely see a slowdown in industrial output and in consumer spending growth, while the hiatus in the construction of high speed trains and nuclear plants may slow investment spending. That said, monetary normalization should continue and the anticipated slowdown in growth should ease the pressure on commodity prices.
The US economic expansion remains moderate. The key drivers of the cycle are industrial production, investment, and exports. The virtuous cycle of corporate profits-job creation is in place but evolving slowly. A modest Q2 GDP rebound should be expected, thanks to these dynamics and to less of a drag from energy costs. We note headwinds: Households will continue rebuilding their net worth positions in light of still falling house prices; Poor asset quality of smaller banks will tend to curtail their lending activity. These are reminders that the US economy is not yet operating on all cylinders and therefore is lagging other cycles in terms of strength. Hence, the Fed’s ongoing policy assist.
Inflation is normalizing.
The Fed keeps monetary accommodation in place. However, the Fed will focus more on inflation than on the unemployment rate in determining when to normalize policy.
Risks: a) Sovereign restructuring risks (Greece); and b) US debt ceiling and fiscal policy risks; c) Regulatory risks.

S T R I C T L Y P R I V A T E A N D C O N F I D E N T I A L
Risk aversion was triggered initially by the commodity price sell-off and renewed sovereign risk concerns…
3Sources : Bloomberg
Exhibit 2: CRB Index
Exhibit 3: Crude Oil (WTI)
Exhibit 1: Silver
0
200
400
600
800
1000
1200
1400
Spain
Italy
Greece
Belgium
Ireland
Portugal
Source: Bloomberg
Exhibit 4: GIIPS 10YR Cash Spreads vs. Bund
12
17
22
27
32
37
42
47
52
1/1/
10
2/1/
10
3/1/
10
4/1/
10
5/1/
10
6/1/
10
7/1/
10
8/1/
10
9/1/
10
10/1
/10
11/1
/10
12/1
/10
1/1/
11
2/1/
11
3/1/
11
4/1/
11
5/1/
11
6/1/
11
$36.802/oz 6/1/11
250
270
290
310
330
350
370
390
8/2/10 9/2/10 10/2/10 11/2/10 12/2/10 1/2/11 2/2/11 3/2/11 4/2/11 5/2/11
$345.92 6/1/11
70
75
80
85
90
95
100
105
110
115
120
8/2/10 9/2/10 10/2/10 11/2/10 12/2/10 1/2/11 2/2/11 3/2/11 4/2/11 5/2/11
$99.85/bbl 6/1/11

S T R I C T L Y P R I V A T E A N D C O N F I D E N T I A L
… followed by signs of a synchronized global slowdown, which affected advanced more than emerging economies
4Sources : Markit; Credit Suisse; Capital Economics
Exhibit 6: The downward adjustment driven by advanced economies rather than emerging economies
Exhibit 5: Global Manufacturing PMI Index declined to 52.9 in May from 55 in April
Exhibit 7: Global new orders and exports declined in recent months, posing a downside risk to the outlook
Exhibit 8: China: Electricity output fell slightly in March but does not look weak

S T R I C T L Y P R I V A T E A N D C O N F I D E N T I A L
If the Japanese earthquake played any role in the global manufacturing slowdown, we are then encouraged by the sharp rise in Japan’s May PMI. Input prices are easing.
5Sources : Markit;
Exhibit 10: The slowdown in the BRIC was led by RussiaExhibit 9: The rebound in the Japanese PMI is encouraging
Exhibit 11: Global input prices are easing, though remain elevated

S T R I C T L Y P R I V A T E A N D C O N F I D E N T I A L
How worrisome is the current economic soft patch?
6
The risk appetite sell-off underscores market fears of last year’s “double-dip” scare.
Growth momentum has softened but conditions of a double-dip are not present.- The US economic expansion is driven by manufacturing activity, investment and exports- The labor market is recovery, though very slowly- The corporate sector is solid- Economic growth will likely firm moderately in Q2- Inflation is normalizing
Headwinds remain, and that is why growth is not on a 4% growth trajectory, but rather closer to 3%. - Household wealth needs to be rebuilt- Housing sector recovery is lagging- Small banks are recapitalizing
The cycle is not a “typical” one, because: - Its strength remains moderate relative to recent ones (hence the on-going Fed policy assist)- It displays more volatility (i.e., more frequent slowdown/acceleration phases)

S T R I C T L Y P R I V A T E A N D C O N F I D E N T I A L
Production and Investment are the drivers of the cycle: The Manufacturing ISM adjusted back closer to its long-run average following four consecutive reads above 60%, which is a rare cyclical event
7
Exhibit 13: Industrial Production and Manufacturing Index (SA, 2002=100) % Change - Year to Year Exhibit 12: ISM manufacturing composite indices (SA, 50+=Increasing)
Exhibit 14: Equipment and Software and nonfarm private payrolls (rhs) Y/Y % change
Sources: Federal Reserve; ISM; Bureau of Economic Analysis; Bureau of Labor Statistics
Exhibit 15: Exports and Imports of Goods and Services (SAAR, Bil.$) y/y % change
-18.00
-13.00
-8.00
-3.00
2.00
7.00
IP IP-Manuf
30.00
35.00
40.00
45.00
50.00
55.00
60.00
65.00
Jan- 90 Jan- 92 Jan- 94 Jan- 96 Jan- 98 Jan- 00 Jan- 02 Jan- 04 Jan- 06 Jan- 08 Jan- 10
ISM Boom/Bust Level 20-Year Avge 60-level
51.6
S T R I C T L Y P R I V A T E A N D C O N F I D E N T I A L
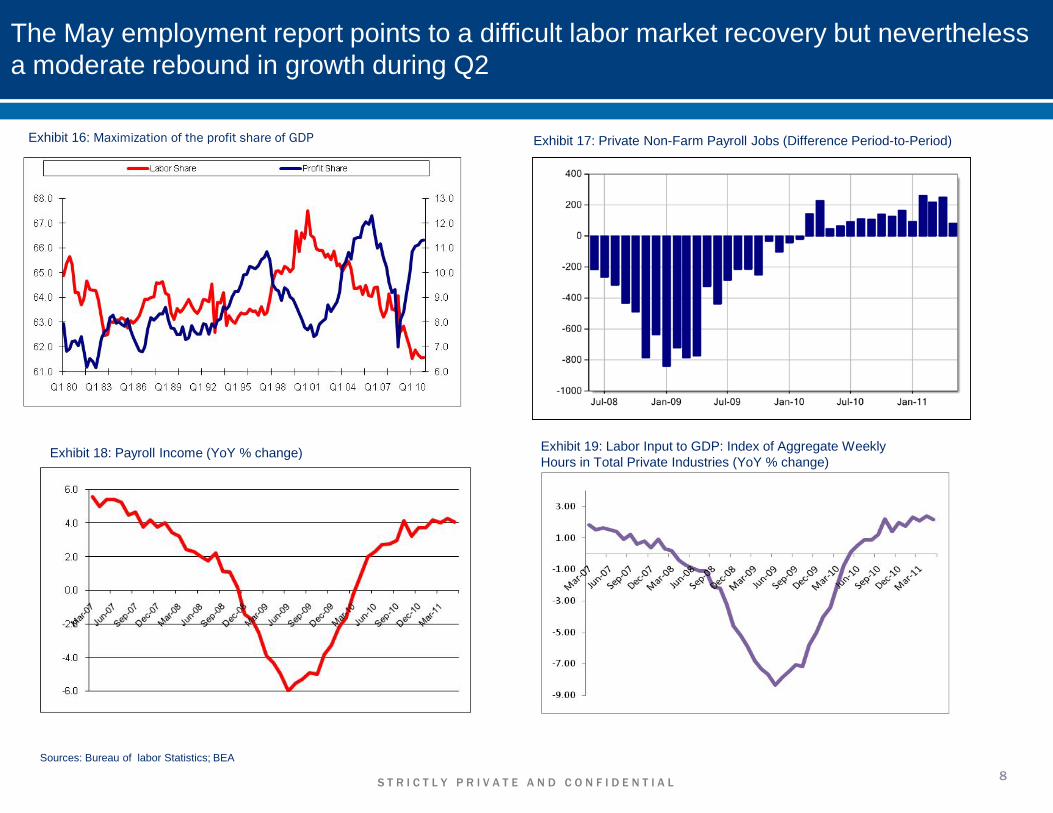
The May employment report points to a difficult labor market recovery but nevertheless a moderate rebound in growth during Q2
8
Exhibit 17: Private Non-Farm Payroll Jobs (Difference Period-to-Period)Exhibit 16: Maximization of the profit share of GDP
Exhibit 18: Payroll Income (YoY % change)
Sources: Bureau of labor Statistics; BEA
Exhibit 19: Labor Input to GDP: Index of Aggregate Weekly Hours in Total Private Industries (YoY % change)

S T R I C T L Y P R I V A T E A N D C O N F I D E N T I A L
The consumer is on the mend but persistent high gasoline prices represent a downside risk
9
Exhibit 22: Retail Sales: Total (BLUE) and EX Motor Vehicles (RED) (SA, Mil.$) % Change - Year to Year
Exhibit 21: Consumer Confidence Index
Sources: Census; Conference Board
Exhibit 20: Monthly: Wages and Salary (Blue) and Disposable Income (Red) YoY % change

S T R I C T L Y P R I V A T E A N D C O N F I D E N T I A L
The consumer is on the mend (2): Credit demand is picking up
10
Exhibit 25: Looser Standards: Credit card and other consumer loans
Exhibit 24: Consumer Credit Outstanding (EOP, SA, Bil.$) % Change - Year to Year Total (blue), Revolving (red), non revolving (green)
Sources: Bureau of Economic Analysis; Macroeconomic Advisors; Federal Reserve
Exhibit 23: Real PCE Growth and Saving Rate
-4
-2
0
2
4
6
8
-4
-2
0
2
4
6
8
1989 1992 1995 1998 2001 2004 2007 2010
H F
Real PCE
Saving Rate (%)
4-qtr % chg., Percent

S T R I C T L Y P R I V A T E A N D C O N F I D E N T I A L
Inflation is normalizing as short-term trends pick up…
11
Exhibit 26: CPI-U: All Items (blue) and Core (red) (1984=100 NSA) % Change - Year to Year
Exhibit 28: Owners' Equivalent Rent Prices (red) and Rental Vacancy Rates (green, Rhs,) % Change - Year to Year Exhibit 29: PPI core finished goods and core CPI (Y/Y % change)
Sources: Bureau of Labor Statistics; NAAR
Exhibit 27: Core CPI 3-month annualized % change (all items less food and energy, SA)

S T R I C T L Y P R I V A T E A N D C O N F I D E N T I A L
Long-term expectations remain well anchored, for now
12
Exhibit 30: Households Inflation Expectations
Sources: Federal Reserve Bank of St. Louis; Federal Reserve Bank of Cleveland; Credit Suisse
Exhibit 31: Sticky Prices (red) and Flexible Prices CPI (blue) % Change - Year /Year
-2.50
-1.50
-0.50
0.50
1.50
2.50
3.50
4.50
Jan-
00
Jan-
01
Jan-
02
Jan-
03
Jan-
04
Jan-
05
Jan-
06
Jan-
07
Jan-
08
Jan-
09
Jan-
10
Jan-
11
Exhibit 32: Real Oil Prices: A secular shift?

S T R I C T L Y P R I V A T E A N D C O N F I D E N T I A L
Headwinds remain: The wealth re-build continues while housing remains depressed
13
Exhibit 33: Households Net Worth as a % of Disposable Income:
Sources: S&P/Case-Shiller; FHFA; Federal Reserve; Macroeconomic Advisors; JP Morgan
Exhibit 35: S&P/Case-Shiller Home Price Index (BLUE): Composite 20 (NSA, Jan-00=100) FHFA House Price Index (RED): Purchase Only, (NSA, Q1-91=100) Y/Y % change
1.5
2.5
3.5
4.5
5.5
6.5
7.5
47Q
1
50Q
1
53Q
1
57Q
1
60Q
1
63Q
1
67Q
1
70Q
1
73Q
1
77Q
1
80Q
1
83Q
1
87Q
1
90Q
1
93Q
1
97Q
1
00Q
1
03Q
1
07Q
1
10Q
1
Exhibit 34: Household Net Worth, $T
Exhibit 36: Residential Share of GDP, %

S T R I C T L Y P R I V A T E A N D C O N F I D E N T I A L
QE2 achieved the objective of “portfolio re-balancing”, with rising risk appetite having led to the rise in equity prices and compression of corporate spreads
14
Exhibit 37: S&P 500 (red) and IG Corp. OAS (green, rhs, bps) Exhibit 38: 10-Year note yield (%)
Sources: Bloomberg, Barc
Exhibit 39: USD vs. Euro (inverted)
130
140
150
160
170
180
190
200
210
1000
1050
1100
1150
1200
1250
1300
1350
1400
Jan-10 Mar-10 May-10 Jul-10 Sep-10 Nov-10 Jan-11 Mar-11 May-11
Double dip scare QE2 signaled
QE2announced
2.3
2.5
2.7
2.9
3.1
3.3
3.5
3.7
3.9
4.1
Jan-10 Mar-10 May-10 Jul-10 Sep-10 Nov-10 Jan-11 Mar-11 May-11
Double dip scare QE2announced
Yield is about 30 bps higher from 8/27/10 to 6/1/11
QE2 signaled
1.25
1.30
1.35
1.40
1.45
1.508/2/10 9/2/10 10/2/10 11/2/10 12/2/10 1/2/11 2/2/11 3/2/11 4/2/11 5/2/11

S T R I C T L Y P R I V A T E A N D C O N F I D E N T I A L
The risk appetite come-back: Profit margins may stay elevated for longer, if unit labor costs recover only gradually
15
Exhibit 40: Non-financial Corporate profit share as a percent of the sector's output Exhibit 41: Nonfinancial Corporate Unit Labor Costs year/year percent change
Sources: BEA; Federal Reserve; Credit Suisse
Exhibit 42: US profit margins tend to peak when the output gap closes

S T R I C T L Y P R I V A T E A N D C O N F I D E N T I A L
Conclusion
16
The business cycle is atypical:- Its strength remains moderate relative to recent ones.- It displays more volatility (i.e., more frequent slowdown/acceleration phases).
The risk appetite cycle will remain on a on/off mode.
The combination of firming growth momentum, low interest rates and on-going Fed policy accommodation should trigger a comeback in risk appetite, as investors resume their search for higher returns in riskier assets. This implies some asset re-pricing from current levels.
This dynamic will continue until the Fed signals an exit, an event that will likely take place in 2012.

S T R I C T L Y P R I V A T E A N D C O N F I D E N T I A L
Appendix: Total Return
US Aggregate: a broad-based benchmark that measures the investment grade, US dollar-denominated, fixed rate taxable bond market, including Treasuries, government-related and corporate securities, MBS (agency fixed-rate and hybrid ARM pass-throughs), ABS, and CMBS.US Treasury: includes public obligations of the US Government. T-bills are excluded by the maturity constraint but are part of a separate Short Treasury Index. In addition, certain special issues, such as SLGs, as well as US TIPS, are excluded.US Credit: comprises the US Corporate Index and a non-corporate component that includes foreign agencies, sovereigns, supranationals, and local authorities. US Government-Related: includes non-native currency agency bonds, sovereigns, supranationals, and local authority debt.US Corporate: a broad-based benchmark that measures the investment grade, fixed-rate, taxable, corporate bond market. It includes USD-denominated securities publicly issued by US and non-US industrial, utility, and financial issuers that meet specified maturity, liquidity, and quality requirements.US MBS: covers agency mortgaged-backed pass-through securities (both fixed-rate & hybrid ARM) issued by GNMA, FNMA, and FHLMC.US CMBS Erisa: The Barclays Capital CMBS ERISA-Eligible Index is the ERISA-eligible component of the Barclays Capital CMBS Index. This index, which includes investment grade securities that are ERISA eligible under the underwriter’s exemption, is the only CMBS sector that is included in the U.S. Aggregate Index.US ABS: three sub-sectors: credit and charge cards, autos, utility. The index includes pass-through, bullet, and controlled amortization structures. The ABS Index includes only the senior class of each ABS issue and the ERISA-eligible B and C tranche. The Manufactured Housing sector was removed as of January 1, 2008, and the Home Equity Loan sector was removed as of October 1, 2009.US HY: measures the market USD-denominated, non-investment grade, fixed rate, taxable corporate bonds. Excludes emerging market debt.S&P 500: Total return includes gross dividends reinvested into the index.Oil & Gold: Price appreciation.
Sources: Barclays POINT, Bloomberg, AMG Economic Strategy
1mo Prior mo. 3mos YTD 1yr 3yrs 10yrs
WEIGHTS4/29/11-5/31/11
3/31/11- 4/29/11
2/28/11-5/31/11
12/31/10-5/31/11
5/31/10-5/31/11
5/30/08-5/31/11
5/31/01-5/31/11
1. US Aggregate 100.0 1.31 1.27 2.65 3.02 5.84 20.91 75.99 US Treasury 32.8 1.56 1.15 2.67 2.57 4.49 17.42 71.39 US Credit 31.6 1.53 1.69 3.21 4.17 9.08 27.02 87.29 US Government-Related 11.8 1.23 1.12 2.57 2.95 5.07 18.43 74.87 US Taxable Munis 1.3 4.09 3.76 8.38 11.01 9.39 20.38 51.87 US Taxable Munis - ex BABs 3.27 3.15 7.39 9.53 7.31 18.30 49.24 US Taxable Munis - BABs 4.44 4.03 8.81 11.63 10.43 23.53 23.53 US Corporate 19.8 1.44 1.72 3.05 4.07 9.51 28.24 87.38 US Credit Industrial 10.5 1.62 1.68 3.22 3.88 8.60 31.28 95.13 US Credit Utility 2.1 2.17 1.79 3.87 4.60 9.53 34.67 84.06 US Credit Finance 7.2 0.98 1.76 2.56 4.21 10.88 24.28 81.56 US Securitized 35.6 1.02 1.18 2.43 2.92 5.59 21.67 75.13 US MBS 33.0 1.07 1.10 2.47 2.78 4.84 21.81 75.87 US CMBS Erisa 2.3 0.30 2.36 2.03 4.77 14.68 29.14 92.91 US ABS 0.3 0.79 0.95 1.75 2.39 4.91 20.69 58.122. US HY 0.49 1.55 2.38 6.01 18.22 40.43 132.223. S&P 500 Index -0.01 2.96 0.02 0.08 0.28 0.04 0.304. Crude Oil (CL1) -9.53 6.76 5.91 12.39 41.50 -19.61 262.005. Gold (GOLDS) -0.62 9.17 8.81 8.10 26.28 72.29 477.69
Cumulative Total Return %
S T R I C T L Y P R I V A T E A N D C O N F I D E N T I A L 18
AIG Asset Management comprises a global team of investment professionals that provide investment advisory and asset management services to American International Group, Inc. (“AIG”) and its businesses. AIG Asset Management is not soliciting or recommending any action based on any information in this document. This information is proprietary and cannot be reproduced or distributed.
Certain statements provided herein are based solely on the opinions of AIG Asset Management and are being provided for general information purposes only. Any opinions provided on economic trends should not be relied upon for investment decisions and are solely the opinion of AIG Asset Management. Certain information may be based on information received from sources AIG Asset Management considers reliable; AIG Asset Management does not represent that such information is accurate or complete. Certain statements contained herein may constitute “projections,” “forecasts” and other “forward-looking statements” which do not reflect actual results and are based primarily upon applying retroactively a hypothetical set of assumptions to certain historical financial information. Any opinions, projections, forecasts and forward-looking statements presented herein are valid only as of the date of this document and are subject to change.


