8/3/2019 Spotlight on Prime Central London Residential Oct 2011
http://slidepdf.com/reader/full/spotlight-on-prime-central-london-residential-oct-2011 1/15
Savills Research | Residential Autumn 2011
SavillsResearch
savills.co.uk/research
PrimeCentral LondonResidentialSpotlight
Six years of volatility A performance review2005 to 2011

8/3/2019 Spotlight on Prime Central London Residential Oct 2011
http://slidepdf.com/reader/full/spotlight-on-prime-central-london-residential-oct-2011 2/15
Ths pblcto
This document was published in October 2011. It contains a review o all the key housing market
indicators and news to the end o September 2011. The data used in the charts and tables is the
latest available at the time o going to press. Sources are included or all the charts. We have used a
standard set o notes and abbreviations throughout the document.
Glossr o trms
nMstrm: mainstream property reers to the bulk o the UK housing market with, or example,
price movements monitored by reerence to national and regional average values.
nPrm: the prime market consists o the most desirable and aspirational property by reerence to
location, standards o accommodation, aesthetics and value. Typically it comprises properties in
the top ve per cent o the market by house price.
nThe Savills PCL index ocuses on resale properties so average values given in this document donot refect the prices being achieved or some o the very high quality new build schemes in core
prime central London locations.
nPCL = Prime central London

8/3/2019 Spotlight on Prime Central London Residential Oct 2011
http://slidepdf.com/reader/full/spotlight-on-prime-central-london-residential-oct-2011 3/15
“Prime central London’sresidential stock hasseparated into grades.”Savills Research
Svlls Rsrch | Prime Central London Residential 2005/2011
Wh w strt
th prm ctrl
Loo x
th lt 1970s, w
s tht ‘prm’
ws th bst proprt th bst
loctos. Lttl col w hv
thoght t th tm how mch ths
prm mrkt wol chg
sbsqt cs.
When I started analysing property
markets in the 1980s, prime London
centred around Knightsbridge.
The markets o South Kensington,
Chelsea and Belgravia were its‘acolytes’ while Mayair (now the
star perormer o ultra prime) and
Kensington were distinctly ‘ringe’.
Most o Notting Hill and Marylebone
was denitely ‘beyond the ringe’.
The Savills prime London index has
thereore changed and expanded
over the years to refect these new
prime geographies.
What we have seen is the real
estate equivalent o the continuous
replacement o old companies with
new ones within the FT100 share
index to refect the share prices o onlythe biggest companies. In 2010, we
replaced our old sample o lower grade
properties with higher grade ones.
The ongoing reurbishment and
renewal o stock means a property
that might have been highly desirable
in the 1980s simply doesn’t cut the
mustard now. Prime central London’s
residential stock has separated into
grades, an evolution that has had as
proound an eect as the physical
expansion o prime central London.
Last year we changed our sampleo index properties to refect this.
Dark basement fats and second-
foor walk-ups disappeared and
we increased the weighting o now
more numerous lateral conversions,
reurbished, high quality and new
developments that have changed the
ace o certain neighbourhoods – and
in many ways changed the nature o
what we now call prime.
These ‘grade A starred’ properties
are among the World Class property
‘gold standard’. In seeking to
understand the prime central London
market it is important to understand
the divergent perormances o the
dierent grades. Lucian Cook’s
excellent new analysis (page 8)
reveals the huge disparity betweenthe perormance o top grade and
lower grade properties.
It is this disparity in perormance that
has led us to review retrospectively
and re-state our prime central London
index, using the 2010 sample and
rebasing it at 100 in June 2005. This
was a relatively stable date in the
otherwise volatile market o the last
decade and a good place at which to
base our review o the last six years.
Replacing our old sample with the
new, ‘upgraded’ sample rom this date
has had the eect o liting the index tonew heights.
Like the shares within the FT 100
share index, the sample o properties
within the Savills indices will continue
to change in order to refect the
changing nature o the prime London
market. Our analysis o the market
rom the point o view o grades, as
well as location; looking at values,
not just prices; and considering all
stock, not just traded properties, has
given us a multidimensional view o
the market. This helps us to makesense o the, sometimes surprising,
market movements o the last ew
years and the nature o the market
going orward. n
Foreword
HiGH fLyeRS
GeT an uPGRade
The Savills prime London index has changed andexpanded over the years to refect the new primegeography o London’s gold standard property
yol Brs
Head o Residential
Research020 7409 8899
Contents04 Evolution and expansion
06 Six years o volatility
08 A divergence in perormance
10 All prime but not all equal
12 Prime Central London ranking
14 What lies ahead or PCL?
www.savills.co.uk/research 03
8/3/2019 Spotlight on Prime Central London Residential Oct 2011
http://slidepdf.com/reader/full/spotlight-on-prime-central-london-residential-oct-2011 4/15
04
Market prole
evolution and
expansion
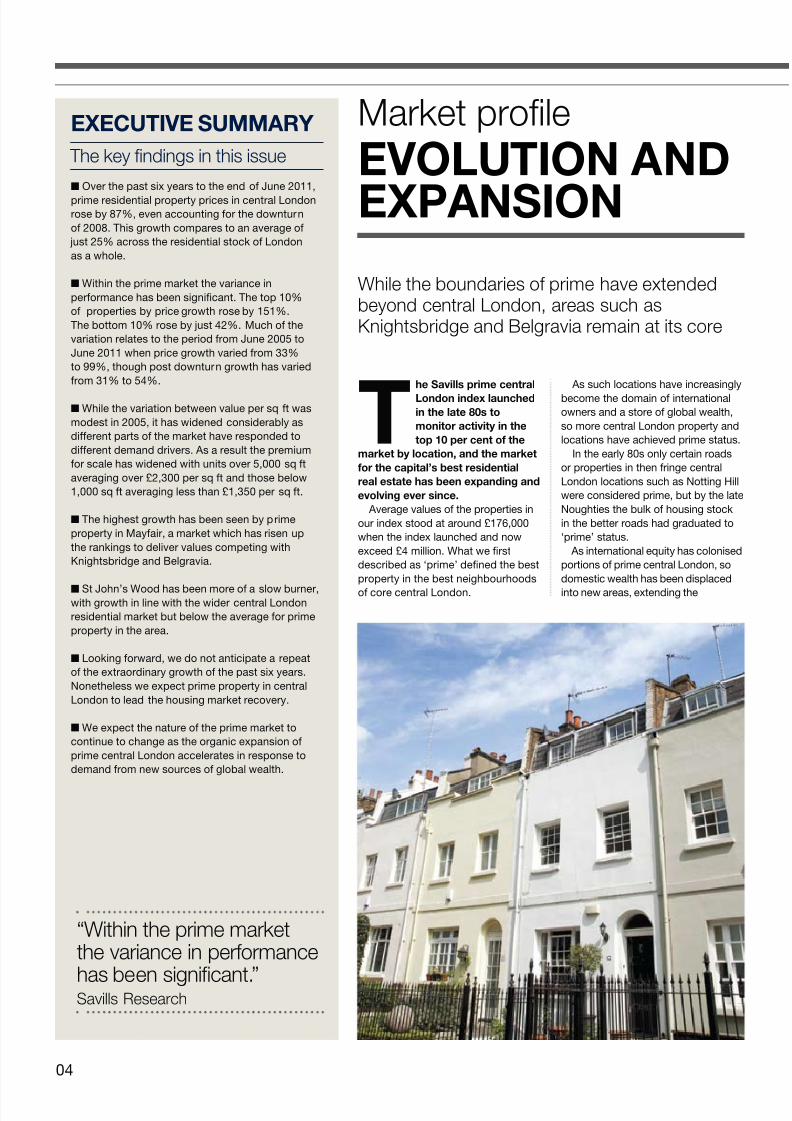
While the boundaries o prime have extendedbeyond central London, areas such asKnightsbridge and Belgravia remain at its core
th s rm r
l h
h 80
mr y h
10 r f h
mrk by , h mrk
fr h ’ b r
r h b g
g r .
Average values o the properties in
our index stood at around £176,000
when the index launched and now
exceed £4 million. What we frst
described as ‘prime’ defned the best
property in the best neighbourhoods
o core central London.
As such locations have increasingly
become the domain o international
owners and a store o global wealth,
so more central London property and
locations have achieved prime status.
In the early 80s only certain roads
or properties in then ringe central
London locations such as Notting Hill
were considered prime, but by the late
Noughties the bulk o housing stock
in the better roads had graduated to
‘prime’ status.
As international equity has colonised
portions o prime central London, so
domestic wealth has been displaced
into new areas, extending the
■Over the past six years to the end o June 2011,
prime residential property prices in central Londonrose by 87%, even accounting or the downturn
o 2008. This growth compares to an average o
just 25% across the residential stock o London
as a whole.
■Within the prime market the variance in
perormance has been signifcant. The top 10%
o properties by price growth rose by 151%.
The bottom 10% rose by just 42%. Much o the
variation relates to the period rom June 2005 to
June 2011 when price growth varied rom 33%
to 99%, though post downturn growth has varied
rom 31% to 54%.
■While the variation between value per sq t was
modest in 2005, it has widened considerably as
dierent parts o the market have responded to
dierent demand drivers. As a result the premium
or scale has widened with units over 5,000 sq t
averaging over £2,300 per sq t and those below
1,000 sq t averaging less than £1,350 per sq t.
■The highest growth has been seen by prime
property in Mayair, a market which has risen up
the rankings to deliver values competing with
Knightsbridge and Belgravia.
■St John’s Wood has been more o a slow burner,with growth in line with the wider central London
residential market but below the average or prime
property in the area.
■Looking orward, we do not anticipate a repeat
o the extraordinary growth o the past six years.
Nonetheless we expect prime property in central
London to lead the housing market recovery.
■We expect the nature o the prime market to
continue to change as the organic expansion o
prime central London accelerates in response to
demand rom new sources o global wealth.
executive suMMaRY
The key ndings in this issue
“Within the prime marketthe variance in perormance
has been signicant.”Savills Research

8/3/2019 Spotlight on Prime Central London Residential Oct 2011
http://slidepdf.com/reader/full/spotlight-on-prime-central-london-residential-oct-2011 5/15
s Rrh | Prime Central London Residential 2005/2011
savills.co.uk/research 05
“A location-sensitive and
property-sensitive, ultra primemarket has emerged.”Lucian Cook, Savills Research
boundaries o prime beyond central
London. Swathes o south-west
London have been gentrifed and
‘primed’. First locations such
as Fulham and, more recently,
areas such as Clapham and
Wandsworth. New developments
have oten played their part in
extending prime boundaries or, as
with Wapping and Canary Whar,
created new prime markets. But,
without doubt, it is central London
that remains core prime.
cr l yTwo boroughs, Kensington and
Chelsea and the City o Westminster,
contain just 6.3% o London’s housing
stock but account or 15.6% o its
value. Each hectare o Kensington and
Chelsea has on average more than
£50 million o housing stock and that
despite all the parks and green spaces
within the borough.
Other boroughs across prime
central London do not have the same
concentration o high value residential
real estate and the depth o the
prime market varies signifcantly rom
neighbourhood to neighbourhood.
Within core locations such as
Knightsbridge and Belgravia the
prime market is at its deepest. Away rom these areas the prime
market is more diluted, and there is
considerable variation in the nature
o housing stock.
Dierent grades o prime have
developed which have reacted
dierently to the volatile market orces
o the past six years. In this report we
explain how the importance o grade
has increased. Growth in prime central
London values has been signifcant
over the period, even accounting or
the downturn o 2008. But our new
analysis demonstrates that averagestell only part o the story.
A location-sensitive and property–
sensitive ultra prime market has
emerged where addresses matter.
Certain markets, such as those
in Mayair, have risen rapidly up the
rankings in the past six years. Others,
such as St John’s Wood, are yet to
achieve quite such ashionable status
MAP 1.1
arg r l (r £750,000) Values refect the depth o the prime market
and have seen much lower growth
and arguably, thereore, have greater
potential or mid term growth.
Other locations which saw
gentrifcation and associated huge
value growth in the 90s, such as
Kensington and Holland Park, were
less responsive to the growth drivers
o 2006/07 than prime central London
as a whole. Subsequently they were
more aected by the downturn and
less responsive to recovery drivers.
Against this context we have
conducted a detailed review o the
composition o our prime central
London index and the perormance
o individual properties within it.
This has allowed us to urther our
understanding o the market and itsdiversity and nuances. Our fndings
are detailed in the ollowing pages ■
Data source: Land Registry / Savills Research
£1.5m b
£1.0m £1.5m
£750k £1.0m
arg pr
Hyde Park
Regent’s Park
Rg’ prk
creates value hotspot
Myfr has developed
as a prime location over
the past six years
Kghbrg and
Bgr remain core
locations or overseas
investment
s Jh’ W yet to
maximise value potential
Kg and Hprk less responsive to
growth drivers since 2005
R i v e r T h
a m e s
8/3/2019 Spotlight on Prime Central London Residential Oct 2011
http://slidepdf.com/reader/full/spotlight-on-prime-central-london-residential-oct-2011 6/15
06
Perormance history
Six YearS
o volatilitY
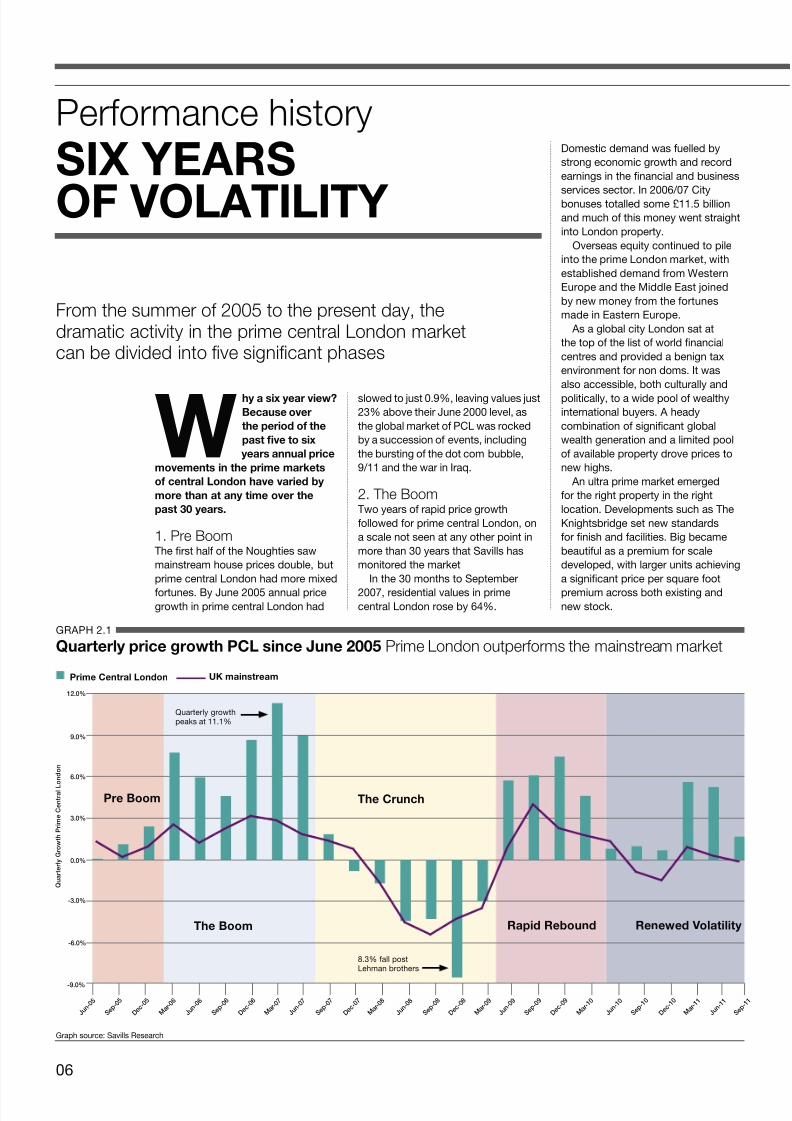
From the summer o 2005 to the present day, thedramatic activity in the prime central London marketcan be divided into fve signifcant phases
Why s y w?
Bcus
h pd h
ps f s
ys nnu pc
mmns n h pm mks
cn lndn h d by
m hn ny m h
ps 30 ys.
1. Pre BoomTe st al o te Nougties saw
mainsteam ouse pices double, but
pime cental London ad moe mixed
otunes. By June 2005 annual picegowt in pime cental London ad
Domestic demand was uelled by
stong economic gowt and ecod
eanings in te nancial and business
sevices secto. In 2006/07 City
bonuses totalled some £11.5 billion
and muc o tis money went staigt
into London popety.
Oveseas equity continued to pile
into te pime London maket, wit
establised demand om Westen
Euope and te Middle East joined
by new money om te otunes
made in Easten Euope.
As a global city London sat at
te top o te list o wold nancial
centes and povided a benign tax
envionment o non doms. It was
also accessible, bot cultually and
politically, to a wide pool o wealty
intenational buyes. A eady
combination o signicant global
wealt geneation and a limited pool
o available popety dove pices to
new igs.
An ulta pime maket emeged
o te igt popety in te igt
location. Developments suc as Te
Knigtsbidge set new standads
o nis and acilities. Big became
beautiul as a pemium o scale
developed, wit lage units acieving
a signicant pice pe squae oot
pemium acoss bot existing andnew stock.
slowed to just 0.9%, leaving values just
23% above tei June 2000 level, as
te global maket o PCL was ocked
by a succession o events, including
te busting o te dot com bubble,
9/11 and te wa in Iaq.
2. The BoomTwo yeas o apid pice gowt
ollowed o pime cental London, on
a scale not seen at any ote point in
moe tan 30 yeas tat Savills as
monitoed te maket
In te 30 monts to Septembe
2007, esidential values in pimecental London ose by 64%.
GrAPh 2.1
Quy pc gwh PCl snc Jun 2005 Prime London outperorms the mainstream market
Gap souce: Savills reseac
J u n - 0 5
S e p - 0 5
D e c - 0 5
M a r
- 0 6
J u n - 0 6
S e p - 0 6
D e c - 0 6
M a r
- 0 7
J u n - 0 7
S e p - 0 7
D e c - 0 7
M a r
- 0 8
J u n - 0 8
S e p - 0 8
D e c - 0 8
M a r
- 0 9
J u n - 0 9
S e p - 0 9
D e c - 0 9
M a r
- 1 0
J u n - 1 0
S e p - 1 0
D e c - 1 0
M a r
- 1 1
J u n - 1 1
S e p - 1 1
-6.0%
-3.0%
0.0%
3.0%
6.0%
9.0%
12.0%
-9.0%
Pm Cn lndn UK mnsm
Q u a r t e r l y G r o w t h P r i m e C e n t r a l L
o n d o n
P Bm
Quately gowtpeaks at 11.1%
8.3% all postLeman botes
th Cunch
rpd rbund rnwd vyth Bm
8/3/2019 Spotlight on Prime Central London Residential Oct 2011
http://slidepdf.com/reader/full/spotlight-on-prime-central-london-residential-oct-2011 7/15
Ss rsch | Pime Cental London residential 2005/2011
savills.co.uk/eseac 07
“It is unlikely that we have seen the end o
price volatility even though the undamentalslook sound in the medium term.”
Yolande Barnes, Savills Research
3. The CrunchTe cedit cunc bougt tis
dizzying gowt to an adupt alt.
As City eanings and employment
secuity plummeted and te wealt
o te intenational elite was eoded,
so tansaction levels ell damaticallyand buye condence in te
undelying wot o cental London
popety waned. Values ell 21% in
just 18 monts, ecoding a single
quate all o 8.3% in te wake o te
Leman Botes collapse.
4. Rapid ReboundIn Mac 2009 pospects looked bleak
and ew commentatos anticipated
te tunaound to come – as a
staggeing pice gowt o 25.5%
occued in just 12 monts.
Te excange ate advantage tataccompanied te weakness in te UK
economy was a stong ealy catalyst
o oveseas investment, mioing
wat ad been seen ate pevious
maket downtuns.
Pime cental London esidential
popety came to be viewed as a
distinctly sae aven o intenational
wealt and an attactive altenative
to gold. Even te intoduction o a
non doms levy ad little i any impact
on sentiment.
Economic uncetainty in te
Euozone dove wealt to te makettoug 2009 and 2010. Demand
came om acoss Westen Euope,
but most notably om Italy as a tax
amnesty at ome tiggeed an infux
o Italian money eleased om Swiss
bank accounts, and om Geece,
as it became evident tei domestic
economy was singled out as te
most likely to deault.
Te ebuilding o global wealt onte back o stong commodity makets
pumped moe equity into cental
London. By 2010/11 bot te numbe
and collective wealt o US dolla
billionaies ad isen above its 2007/08
level accoding to Fobes.
In bie, demand om tose looking
to potect existing wealt was again
joined by tose looking to invest new
money eaned lagely outside o te
westen economy.
A unnelling o demand allowed
new luxuy developments to take
advantage o a sotage o top endnew build stock. New developments,
most notably One hyde Pak, ave
done muc to ewite te istoy o
pime cental London, and even in te
wake o te cedit cunc new ecods
o picing wee being set.
5. Renewed Volatility Volatility in pice gowt as been
one o te key eatues o te pime
cental London maket in te past six
yeas and was expected to impact
negatively on values ealy tis yea.
Te second al o 2010 saw pice
gowt slow on te tail o a secondslip in UK mainsteam pices, but
signicant pice gowt etuned,
unexpectedly, to London in te st
two quates o 2011.
Te ‘sae aven eect’ as
been ute einoced by political
uncetainty in te Middle East,
attacting buyes om a egion
long-amilia wit cental London,
wile continued uncetainty in te
Euozone as ute enanced
London’s appeal elative to ote
Euopean capitals.
heigtened concens ove teglobal economy and te eosion
o wealt eld in te wold’s stock
makets could test te ‘sae aven’
eect on values, and impact on
undelying demand.
It is unlikely tat we ave seen te
end o pice volatility even toug
te undamentals look sound in te
medium tem. n
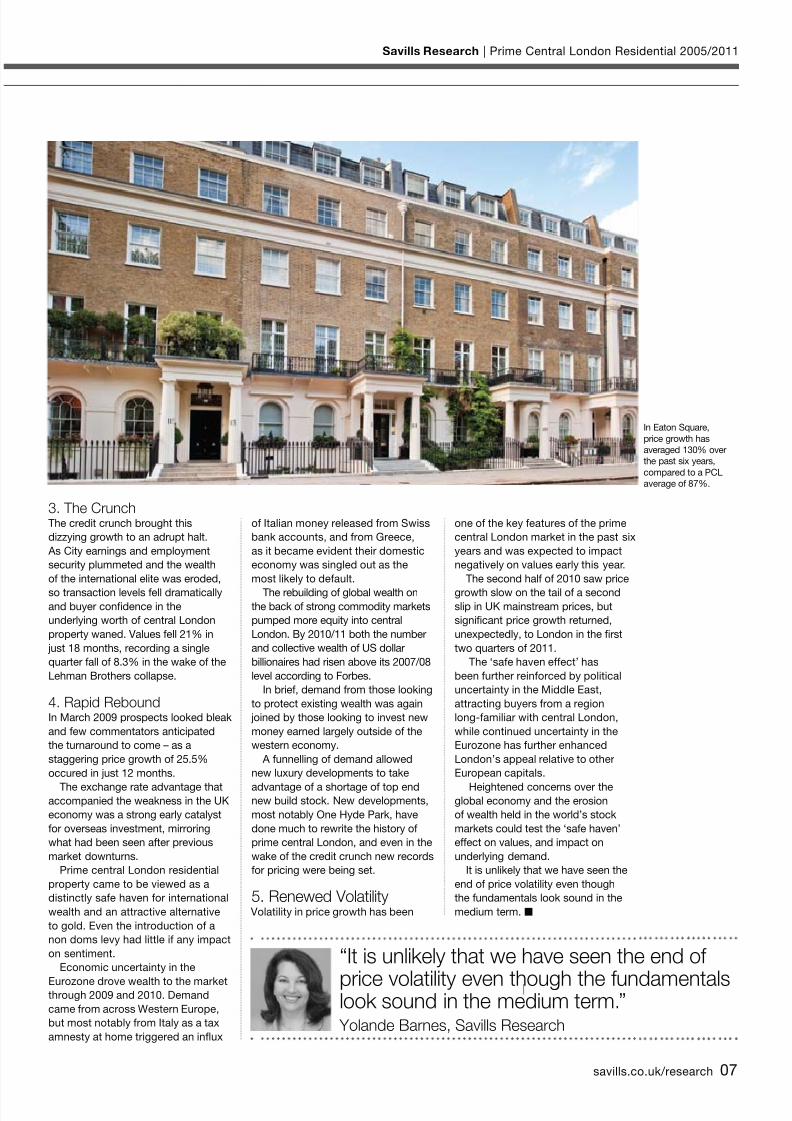
In Eaton Squae,pice gowt asaveaged 130% ovete past six yeas,compaed to a PCLaveage o 87%.

8/3/2019 Spotlight on Prime Central London Residential Oct 2011
http://slidepdf.com/reader/full/spotlight-on-prime-central-london-residential-oct-2011 8/15
08
Market segmentation
a divergence
in perormance
Value growth across the many different grades of prime central London residential real estate has varieddramatically, with ultra-prime property blazing a trail
Wht sttuts
‘’ s
stt stt
fux. dt
lts
ty tys wth
tl L s y
tly t t s,
whh ulttly sults th
y t
s ty.
Nw, dtaild analysis o th
individual omanc o ach
oty in th Savills im cntal
London indx nabls us to valth xtnt o th divgnc in
omanc btwn th dint
accoding to ic gowth w can s
th divgnc btwn th bst and
th st, analysis that highlights th
imotanc o looking byond
th avag.
Btwn Jun 2005 to Jun 2011
th to 10% o otis dlivd
ic gowth o 151%. At th oth
nd o th scal, th bottom dcil
oducd lss than a thid o this
agggat gowth, at just 42%.
Th gowth codd by th
to and bottom dcils vais
considably om th st o th
saml – thy could b considd
xtms comad to th st o th
saml wh gowth is mo closly
goud. But th signifcant vaiation
in omanc is not confnd to
vy bst and vy wost. Gowth
o th scond bst oming 10%
o otis is still twic that o th
scond wost oming 10%, at
119% comad to 60%.
Wh why A study o ic gowth in th ky
iods vals how that divgnc
has built u.
1 Pre crunch: Jun 05-Sep 07Much o th divgnc in ic
gowth omanc occudduing th initial iod o damatic
ic gowth.
locations and dint gads o
oty in th caital.
On manistation o this has bn
th outomanc by th to nd
o th makt. In th six yas to
Jun 2011 th valu o ulta im
otis in th Savills indx os
by 107%, against an avag 87%
gowth acoss th im cntal
London as a whol.
By th sHadlin gowth fgus ovid a
guid to th avag, but ou nw
analysis vals th ull xtnt o thvaiation aound that avag. By
dividing ou indx into tn qual ats
GrApH 3.1
d ss p ctl
Gah souc: Savills rsach
J u n - 0 5
S e p - 0 5
D e c - 0 5
M a r
- 0 6
J u n - 0 6
S e p - 0 6
D e c - 0 6
M a r
- 0 7
J u n - 0 7
S e p - 0 7
D e c - 0 7
M a r
- 0 8
J u n - 0 8
S e p - 0 8
D e c - 0 8
M a r
- 0 9
J u n - 0 9
S e p - 0 9
D e c - 0 9
M a r
- 1 0
J u n - 1 0
S e p - 1 0
D e c - 1 0
M a r
- 1 1
J u n - 1 1
70
90
110
130
150
170
190
210
230
250
50
T 10% Btt 10%
V a l u e
I n d e x
( J u n
2 0 0 5
= 1
0 0
)
To 10% o saml showssix ya gowth o 151%
Bottom 10% o saml showssix ya gowth o 42%
rang o th maining saml om 60% to 119%
100

8/3/2019 Spotlight on Prime Central London Residential Oct 2011
http://slidepdf.com/reader/full/spotlight-on-prime-central-london-residential-oct-2011 9/15
Slls rsh | pim Cntal London rsidntial 2005/2011
savills.co.uk/sach 09
Th ofl o dmand damatically
changd, and th makt sondd
aidly and sggatd to th
gatst dg. pics os by
a thid in th bottom dcil but
doubld in th to dcil.
2 Market crash: Sep 07-Mar 09Th subsqunt iod o ic
alls oducd much low lvls
o vaianc, anging om 24% alls
among som o th wost oms
to 18% alls in th sgmnts that had
omd bst io to th downtun.
No location o oty ty was
immun to alls.
3 Recovery: Mar 09-Jun 11Sinc Mach 2009 omanc
has vaid much lss, though th
has bn idntifabl nwd
outomanc in th to 30%
o th saml.
Th bound has bn divn by
ovsas dmand and otis
ftting th ofl o that dmand hav
ld th way.
Looking owad a combination
o global conomic and social
actos will dtmin whth w
a nting a iod o low gowth
o nwd volatility. Whichv, a
continuation o th signifcant gowthsn in th ast 18 months sms
unlikly in th shot tm. n
TABLe 3.1
Th sx-y wth tl
Data souc: Savills rsach
a more
diScerningmarkeT
On o th main consquncs
o this divgnc is that th
is much gat vaiation in th
valus o dint otis in
dint locations.
In Jun 2005, th avag
ic o otis within tn
sgmnts o th makt angd
om £850 to £1,000 squa
oot. By Jun 2010, that ang
had ond u to £1,400 to£2,350 squa oot o th
to 10% o th makt.
Undstanding ths
dincs is citical to
thos invsting in this
makt. In th ight locations
th gatst ootunitis
to add valu com though
ubishmnt, modifcation and
th amalgamation o otis
to cat th holy gail - scal.
Fo dvlos, a ailu to
match oduct to dmand, by
cating duability o quality andamnitis, will os isks.
Th t ts
th t
Ttl sx y
wth t Ju 2011
p wth by
Ju 05 - St 07 St 07 - m 09 m 09 - Ju 11
Top 10% 151% 98% -18% 54%
2nd Decile 119% 82% -18% 47%
3rd Decile 108% 71% -19% 49%
4th Decile 98% 78% -23% 45%
5th Decile 90% 70% -19% 38%
6th Decile 83% 65% -22% 42%
7th Decile 75% 57% -24% 47%
8th Decile 68% 53% -21% 40%
9th Decile 60% 46% -23% 44%
Bottom 10% 42% 33% -19% 31%
Average 87% 64% 20.3% 43%

8/3/2019 Spotlight on Prime Central London Residential Oct 2011
http://slidepdf.com/reader/full/spotlight-on-prime-central-london-residential-oct-2011 10/15
10
PCL performance
all prime but
not all equal
Prime houses in central Londonhave comfortably outperformed theremainder of the market. But whatlessons can be learnt from both the
best and the worst performers?
th c
dvd y
w dd y
d cs, sch
s c, y
y d sz, y dc,
y fsh d c d
gs hs.
These actors combined determine
whether a property is attractive to
the deepest and strongest strands
o demand and how it is judged, and
thereore priced, relative to competing
stock on the market.
Houses in prime central London
have substantially outperormed, with
average price growth o 92% in the
six years to June 2011. This compares
to an average price growth o 69%
across all residential sales in theboroughs o Kensington & Chelsea
and City o Westminster, as recorded
by the Land Registry.
While average growth or prime ats
is much more in line with the market as
a whole at 84%, there are clear sectors
o the ats market that have perormed
particularly strongly.
By studying the distribution o the
properties in the top and bottom
25% o our sample, we can build an
understanding o what has separated
the best and worst perorming.
The top perormer over the pastsix years has been Mayair, where
average prices have risen by 117%,
such that it is now competing with
some o the highest value locations
in central London. This is ollowed by
Marylebone at 107%, which remains
a slightly less mature market. Mayair
in particular has seen a signifcant
level o new capital investment and,
on the back o improved amenities or
residents, has the greatest share o
properties within the top perorming
quartile o our sample.By contrast, lowest placed St
John’s Wood saw average values rise
by only 69% in the six year period
and has 56% o its properties in the
bottom perorming quartile o our
sample. This suggests an area with a
greater mix o property grades, and
one with potentially greater scope orgrowth over the next ew years.
my vMayair sits right at the top o the
high perormers league and a high
proportion o both ats and houses
there have shown strong growth.
Detailed analysis shows size really
matters. Large Mayair houses, in
excess o 10,000 square oot, in
locations close to the amous Berkeley
and Grosvenor Squares (eg. Charles
Street, Hill Street and Upper Brook
Street), witnessed some o the highest
price growth, averaging 150%.
Average values or such properties
have risen to between £2,500 and
£3,000 per square oot, compared
to fgures o between £1,800 and
£2,500 per square oot or the best
perorming one and 2-bedroom ats,
in locations such as Mount Street.
The size phenomenon has been
repeated across prime central London.
The top 10% o properties by price
growth have been shown to be 29%
larger than the average or the sampleas a whole.
Kghsdg High proportions o ats within
Knightsbridge and Belgravia have
also eatured among the best
perormers. It is no coincidence
that these areas attract buyers rom
the Middle East / North Arica and
Eastern Europe / CIS regions to a
degree that is unmatched elsewhere
in central London.
Knightsbridge has become
a magnet or high net worthinternational buyers and a number o
high profle new build schemes have
broken all records.
The highest perorming ats in
Knightsbridge and Belgravia typically
all into two categories:
n Firstly, there are those developed
to meet the demands o the new
breed o ultra wealthy international
buyer. Flats in The Knightsbridge,
199 Knightsbridge, a new addition to
our index, are a good example. Here,
current values o between £3,500and £5,000 per square oot stand
head and shoulder above similar
sized traditional resale stock, and
are testament to a standard o
“The average price movement forMayfair properties is the greatest
of any over the period
from mid 2005 to mid2011.” Sophie Chick,
Savills Research

8/3/2019 Spotlight on Prime Central London Residential Oct 2011
http://slidepdf.com/reader/full/spotlight-on-prime-central-london-residential-oct-2011 11/15
Svs rsch | Prime Central London Residential 2005/2011
savills.co.uk/research 11
fnish, range o amenities and level
o additional services that the more
traditional London stock cannot match.
Undoubtedly, however, as newluxury developments such as One
Hyde Park have broken new price
barriers, so values or the closest
comparable product have been
pulled up in their slipstream.
n Secondly, there are ats within the
most celebrated and aspirational
streets and squares where premiums
are well-established. Eaton Square,
where price growth has averaged
130% over the past six years, is a
perect example o this phenomenon.
th sw sBeyond the core o central London,
both the at and house markets o
St John’s Wood and Regent’s Park
have shown less aggressive growth
at around 75% on average across the
two areas over the past six years.
This relative perormance is
perhaps unsurprising, since they lie
to the north o central London, where
‘prime’ is less all-encompassing. This
results in a greater spread o values
and o quality o stock and location.
Elsewhere, a high proportion oKensington and Holland Park ats
are in the bottom quartile in terms o
price growth in the six years to mid
2011. These markets have seen less
high-value international demand
than core prime central London. In
the run up to the banking crisis they
relied more heavily on domestic
buyers employed in the fnancial
and business services sector. As a
result transactions were particularly
aected by the downturn.
Their dierent buyer profle is
also reected in much lower levelso investment and second home
purchase than in some o the top
perormers. Also, these areas have
seen ar lower levels o proft-driven
reurbishment and redevelopment
than the at markets in areas such
as Knightsbridge and Belgravia.
mk dsdgOver the past six years the depth and
nature o demand have dictated how
dierent properties have perormed
in a volatile market. Stock selectionhas been key to value growth in a
given location. All indications are that
this will continue to be the case. n
GRAPH 4.2
ics vg £ s y y sz
0 500 1,000 1,500 2,000 2,500
S i z e
o f p r o p e r t y
Average £ per sq ft
J 05 J 11
Data source: Savills Research (based on index valuation sample o resale properties)
Over 5,000 sq ft
4,000-5,000 sq ft
3,000-4,000 sq ft
2,000-3,000 sq ft
1,000-2,000 sq ft
Up to 1,000 sq ft
1,068
977
945
796
736
1,187 2,374
1,974
1,819
1,814
1,490
1,319
GRAPH 4.1
t cs kd y vg £ s s y
The core PCL locations of Knightsbridge and Belgravia continue to lead the rankings
It should be noted that the index ocuses on resale properties so the average values do not reect prices achieved or some
o the very high quality new build schemes. The limited pipeline has continued to apply upward pressure on the value o these
developments. Data source: Savills Research (based on valuation sample only)
1,039
1,023
902
898
928
904
848
825
826
608
2,007
1,982
1,960
1,713
1,672
1,601
1,593
1,558
1,393
1,256
Kghsdg1
bgv2
my3
Chs4
Ksg/Hd pk5
ShKsg6
rg’s pk7
ng H8
S Jh’s Wd9
my10
rank location Jun 05 Jun 11
8/3/2019 Spotlight on Prime Central London Residential Oct 2011
http://slidepdf.com/reader/full/spotlight-on-prime-central-london-residential-oct-2011 12/15
12
Performance split
■T 25% t
■2 Qut
■3 Qut
■Btt 25% t
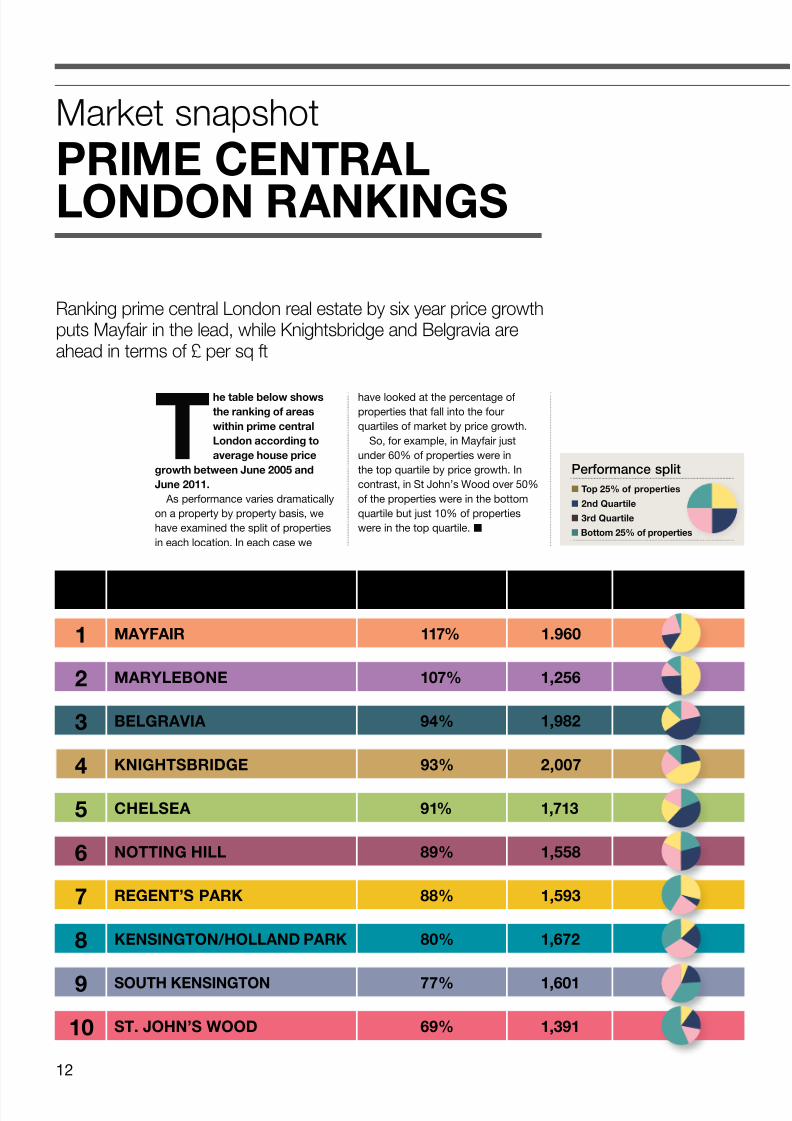
Market snapshot
prime cenTral
london rankings
Ranking prime central London real estate by six year price growthputs Mayfair in the lead, while Knightsbridge and Belgravia areahead in terms of £ per sq ft
T tb b
t
t t
l t
u
t bt Ju 2005
Ju 2011.
As performance varies dramatically
on a property by property basis, we
have examined the split of properties
in each location. In each case we
Locationrank
mayfair
maryleBone
Belgravia
knighTsBridge
chelsea
noTTing hill
regenT’s park
kensingTon/holland park
souTh kensingTon
sT. John’s wood
June 05 - June 11
117%
107%
94%
93%
91%
89%
88%
80%
77%
69%
£ per sq ft
1.960
1,256
1,982
2,007
1,713
1,558
1,593
1,672
1,601
1,391
performance
spLit
have looked at the percentage of
properties that fall into the four
quartiles of market by price growth.
So, for example, in Mayfair just
under 60% of properties were in
the top quartile by price growth. In
contrast, in St John’s Wood over 50%
of the properties were in the bottom
quartile but just 10% of properties
were in the top quartile. ■
1
2
3
4
5
6
7
8
9
10

8/3/2019 Spotlight on Prime Central London Residential Oct 2011
http://slidepdf.com/reader/full/spotlight-on-prime-central-london-residential-oct-2011 13/15
s r | Prime Central London Residential 2005/2011
savills.co.uk/research 13
MAP 5.1
d t l b bu
st. J’ w
rt’ p
mb
m
B
c
ktb
sut kt
ntt h
kt/h p
1
107
2
34
5
9
86
Hyde
Park
Westminster
Battersea
Islington
King’s Cross
Paddington
Waterloo
Belsize Park
Queen’sPark
Hammersmith
Regent’sPark
N
S
E W
R i v e r T h a m e s
Fulham

8/3/2019 Spotlight on Prime Central London Residential Oct 2011
http://slidepdf.com/reader/full/spotlight-on-prime-central-london-residential-oct-2011 14/15
14
Market outlook
what lies ahead for pcl?
Prime central London is set to outperorm the resto the UK housing market over the next fve years,but which areas are most likely to rise up the rankings?
w
mn
m n
lnn u
bu uu?
There are reasons to be confdent
that prime central London will
outperorm the rest o the UK housing
market over the next fve years, much
the same way as it has done in all
the early stages o previous housing
market cycles.
There is signifcant equity already
locked into the prime markets
meaning they are largely unshackledby the constraints o mortgage fnance
which dog the rest o us.
There are also urther prospects o
equity being introduced rom overseas
buyers, particularly rom emerging
economies. These have the greatest
o job losses in the banking sector all
contribute to the risk o slower growth
prices in the immediate uture.
Our index results or the third quarter
o 2011, show the immediate response
to these uncertainties has been slower
growth. Prices rose by 5.5% and 5.2%
in the frst and second quarters o 2011
respectively, but in the third quarter
they rose by 1.7%.
an ngng vunWill there be continued variation in
perormance? We believe so, i only
because ashions in prime property
change with almost the requency o
the seasons in haute couture.
The next set o winners and
losers will be determined by two key
drivers; the nature o demand and
buyer preerence in terms o product
and location.
Increased demand will almost
certainly continue to come rom newly
wealthy Asians and their preerences
will shape the market. Past evidence
shows this will accelerate the organic
extension o central London – already
underway in St James’ and ‘peripheral
Belgravia’ leading into northern Pimlico.
New demand is likely to avour new
developments which oer a superior
level o amenities and security. Suchdevelopments have the potential to
completely redefne areas – as has
been seen in Knightsbridge – or to
extend the boundaries o core prime.
The Lancasters may pave the way or a
greater international ocus on Bayswater,
while Chelsea Barracks is the one to
watch over the next ew years.
Ultimately, it is clear that the prime
London market will continue to evolve.
This will require our indices to evolve
with them as they approach their 40th
birthday over the next fve years. n
capacity to generate new wealth, and
have been seen to avour London as
a ‘sae haven’ store o wealth. There
is little to suggest they will cease to
view London in this way, especially
with global eyes on the 2012 Olympics.
Having said that, it would be unwise
to expect repeat levels o price growth
seen in the past fve years.
Recent price growth leaves London
looking near ull value in a global
context. Our World Cities review
suggests that it is second only to Hong
Kong in pricing among its peers.
Equally, uncertainty surrounds boththe global and domestic economy
meaning the potential wealth drivers
are more subdued. Domestic wealth
generated rom within the fnancial and
business services sector is likely to
underpin demand, but only as the UK
economy recovers. Uncertainty in the
UK economy will mean we have not
seen the end o the volatility that has
been a key eature o the market over
the period o this review.
Difculties in the economies o the
Eurozone and the US and the prospect
sv r m
Please contact us or urther inormation
Yn Bn
Head o Research
020 7409 8899
lun ck
Director
020 7016 3837
s ck
Analyst
020 7016 3786
sv Savills is a leading global real estate service provider listed on the LondonStock Exchange. The company established in 1855, has a rich heritage withunrivalled growth. It is a company that leads rather than ollows, and nowhas over 200 ofces and associates throughout the Americas, Europe, AsiaPacifc, Arica and the Middle East.
This report is or general inormative purposes only. It may not be published,reproduced or quoted in part or in whole, nor may it be used as a basis
or any contract, prospectus, agreement or other document without priorconsent. While every eort has been made to ensure its accuracy, Savillsaccepts no liability or any direct or consequential loss arising rom its use.The content is strictly copyright and reproduction o the whole or part o itin any orm is prohibited without written permission rom Savills Research.
“Ultimately, it is clear thatthe prime London marketwill continue to evolve.”

8/3/2019 Spotlight on Prime Central London Residential Oct 2011
http://slidepdf.com/reader/full/spotlight-on-prime-central-london-residential-oct-2011 15/15
sv r | Prime Central London Perormance 2005/2011
UnubbTo unsubscribe rom receiving this mailing please contact Jennier Lane
and we will ensure you are removed rom our database. I your details have
changed or they are incorrect please also contact Jennier Lane and we will
ensure these are amended.
Jennier Lane, Savills, Lansdowne House
57 Berkeley Square, London W1 6ER
T: 0207 016 3886 E: [email protected]
sv
Savills is a leading global real estate service provider listed on the London
Stock Exchange. The company established in 1855, has a rich heritage with
unrivalled growth. It is a company that leads rather than ollows, and now has
over 200 ofces and associates throughout the Americas, Europe, Asia Pacifc,
Arica and the Middle East.
This report is or general inormative purposes only. It may not be published,
reproduced or quoted in part or in whole, nor may it be used as a basis orany contract, prospectus, agreement or other document without prior consent.
While all eort has been made to ensure its accuracy, Savills accepts no liability
whatsoever or any direct or consequential loss arising rom its use.
The content is strictly copyright and reproduction o the whole or part o it in
any orm is prohibited without written permission rom Savills Research.
r ubnOur latest reports
n dvmn, invmn n N hm fu
n rn py fu
n ing | w c rv
For more inormation, visit savills.co.uk/research


