
1Q19 Performance & Outlook
16 May 2019
SET Opportunity Day
2/2019
2 © 2019 ERAWAN. All rights reserved.
The views expressed here contain some information derived from publicly available sources
that have not been independently verified. No representation or warranty is made as to the
accuracy, completeness or reliability of the information. Any forward looking information in
this presentation has been prepared on the basis of a number of assumptions which may
prove to be incorrect. This presentation should not be relied upon as a recommendation or
forecast by The Erawan Group PLC. Nothing in this release should be construed as either
an offer to sell or a solicitation of an offer to buy or sell shares in any jurisdiction.

3 © 2019 ERAWAN. All rights reserved.
1Q19 Executive Summary
10.8 million
international tourist
arrival
1% Growth from 1Q18
Tourism Industry Hotels Statistic*
86% Occupancy with
-6% ARR growth
1Q Results
-1% Total Revenue
-7% EBITDA
-18% Net Profit
Hotel Development
*Total group ex. HOP INN
9 Hotels
To be opened
in 2H19

44 © 2019 ERAWAN. All rights reserved.
Industry Update

5 © 2019 ERAWAN. All rights reserved.
International Tourist Arrivals by Quarter
Source : Department of Tourism as of Mar-19
9.0
7.6
8.27.8
9.2
8.1
8.89.3
10.6
8.9 9.1
9.7
10.8
Q1 Q2 Q3 Q4
2016 2017 2018 2019
1%

6 © 2019 ERAWAN. All rights reserved.
0.0
0.5
1.0
1.5
2.0
2.5
3.0
3.5
4.0
4.5
Jan Feb Mar Apr May June July Aug Sep Oct Nov Dec
2016 YTD 9.0 M 2017 YTD 9.2 M
2018 YTD 10.6 M 2019 YTD 10.8 M
YoY 2019-2018
International Tourist Arrivals
YTD-Mar19 10.8 millions, +1% y-y
Millions
Jan Feb Mar Apr May June July Aug Sep Oct Nov Dec
+5% - -1% %YoY
Source : Department of Tourism as of Mar-19
7 © 2019 ERAWAN. All rights reserved.
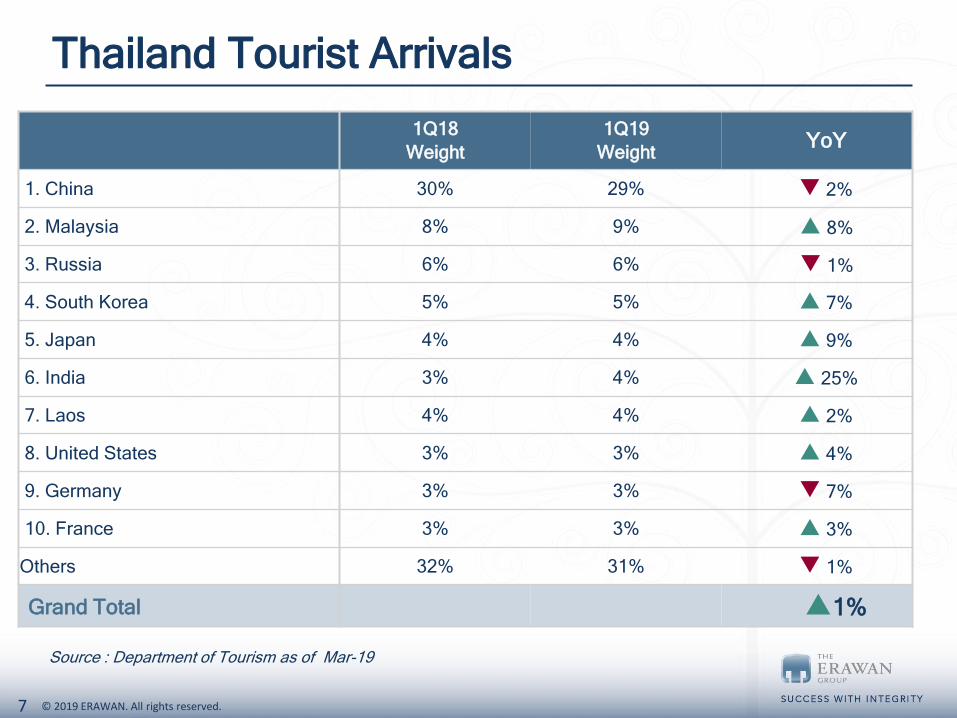
Thailand Tourist Arrivals
Source : Department of Tourism as of Mar-19
1Q18
Weight
1Q19
WeightYoY
1. China 30% 29% 2%
2. Malaysia 8% 9% 8%
3. Russia 6% 6% 1%
4. South Korea 5% 5% 7%
5. Japan 4% 4% 9%
6. India 3% 4% 25%
7. Laos 4% 4% 2%
8. United States 3% 3% 4%
9. Germany 3% 3% 7%
10. France 3% 3% 3%
Others 32% 31% 1%
Grand Total 1%
8 © 2019 ERAWAN. All rights reserved.
Performance Review 1Q19

9 © 2019 ERAWAN. All rights reserved.
1Q19 Core Performance Summary
Group
Operating Income
EBITDA 658 561 612
286 180 235
1% YoY
Net Profit
YoY
1,776 1,701 1,758
1Q18 4Q18 1Q19QoQ
3% YoY
7% YoY
18% YoY
9% YoY
31% YoY
10 © 2019 ERAWAN. All rights reserved.
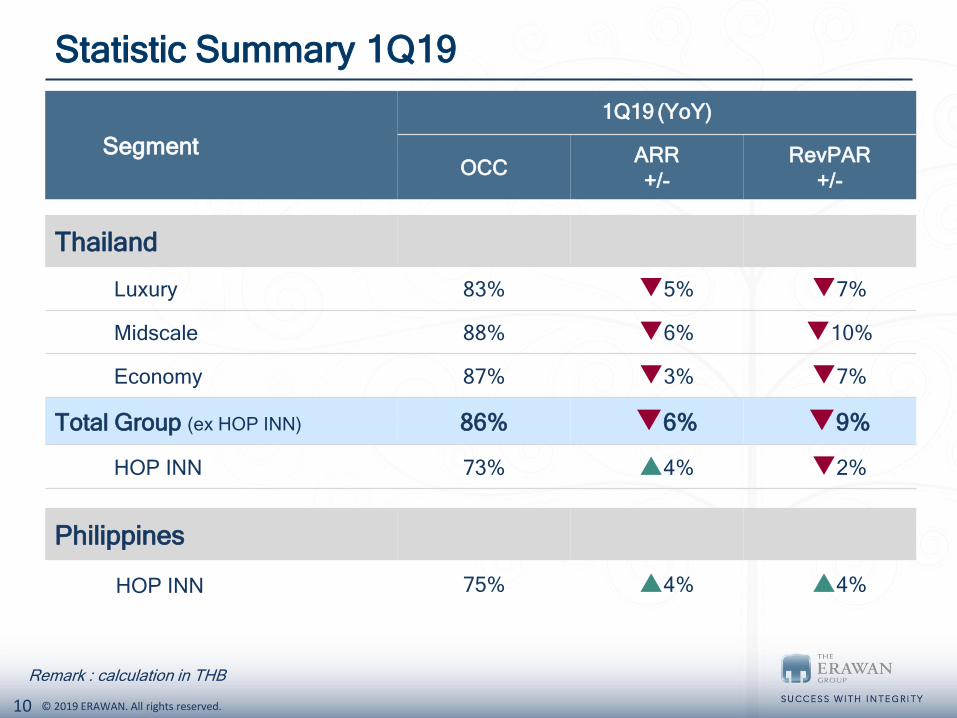
Statistic Summary 1Q19
Segment
1Q19 (YoY)
OCCARR
+/-
RevPAR
+/-
Thailand
Luxury 83% 5% 7%
Midscale 88% 6% 10%
Economy 87% 3% 7%
Total Group (ex HOP INN) 86% 6% 9%
HOP INN 73% 4% 2%
Philippines
HOP INN 75% 4% 4%
Remark : calculation in THB

11 © 2019 ERAWAN. All rights reserved.
Hotel Revenue by Room & F&B
(Unit in MB)
1% 6%
1,7191,702
1Q19
1% YoY
Bangkok hotels revenue still grew

12 © 2019 ERAWAN. All rights reserved.
1Q19 Performance Summary
• Luxury BKK occupancy was in line with 1Q18
but ARR was slightly dropped. In addition F&B
decrease due to the drop in MICE market
• Luxury resort recorded soft performance due to
slowdown of Chinese and European markets
and Pabuk storm in Jan-19
Luxury Revenue 8% Midscale Revenue 2%
Economy Revenue 1%
• ibis Styles Sukhumvit 4 opened in 4Q18 with
OCC >80% in this quarter
• Non BKK hotels were impacted from slowdown
of Chinese & Russian
HOP INN Revenue 8%
• Novotel Sukhumvit 4 opened in 4Q18 with
OCC >80% in this quarter
• Midscale BKK was impact from slowdown of
USA & Europe while Non-BKK was impacted
from slowdown of Chinese & India
• HOP INN room rate improvement at 4%
• The declined of occupancy rate was resulted
from pricing strategy and air pollution crisis in
northern of Thailand

13 © 2019 ERAWAN. All rights reserved.
RevPAR Total Revenue EBITDA
HOP INN Philippines
1Q19 Performance Growth
• Room rate increased 4% from 1Q18
• OCC posted at 75% in line with LY despite additional
531 room inventory
• Organic hotels posted RevPAR growth at 13% and
revenue growth at 14 %
• Generate net profit in 1Q19
1Q19 Performance Highlight
4%
183%
412%

14 © 2019 ERAWAN. All rights reserved.
Consolidate Profit & Loss StatementIn Baht Millions 1Q18 1Q19 %YoY
Hotel Operating Income 1,719 1,702 1%
Rental and Service Income 57 56 3%
Total Operating Income 1,776 1,758 1%
Other Income 10 17 75%
Total Income 1,786 1,775 1%
Operating Expenses (1,128) (1,163) 3%
EBITDA 658 612 7%
Depreciation & Amortization (183) (206)
Finance Costs (84) (96)
Taxes (71) (61)
Minority Interest (20) (17)
Normalized Net Profit / (Loss) 300 232 23%
Extraordinary Items
Share of Profit/(Loss) from ERWPF (14) 3 123%
Net Profit / (Loss) 286 235 18%
EBITDA Margin 36.9% 34.5% 2.4%
15 © 2019 ERAWAN. All rights reserved.
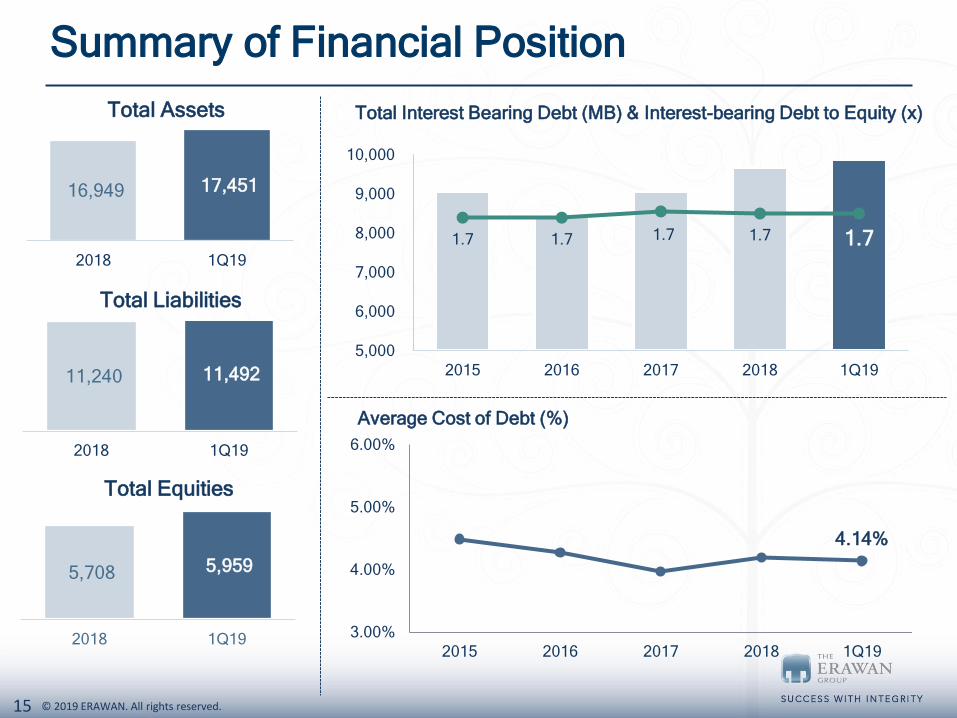
16,949 17,451
2018 1Q19
Total Assets
Summary of Financial Position
11,240 11,492
2018 1Q19
Total Liabilities
5,708 5,959
2018 1Q19
Total Equities
1.7 1.7 1.7 1.7 1.7
1.0
1.2
1.4
1.6
1.8
2.0
5,000
6,000
7,000
8,000
9,000
10,000
2015 2016 2017 2018 1Q19
Total Interest Bearing Debt (MB) & Interest-bearing Debt to Equity (x)
3.00%
4.00%
5.00%
6.00%
2015 2016 2017 2018 1Q19
Average Cost of Debt (%)
4.14%

16 © 2019 ERAWAN. All rights reserved.
Phuket, Kata
Outlook
17 © 2019 ERAWAN. All rights reserved.
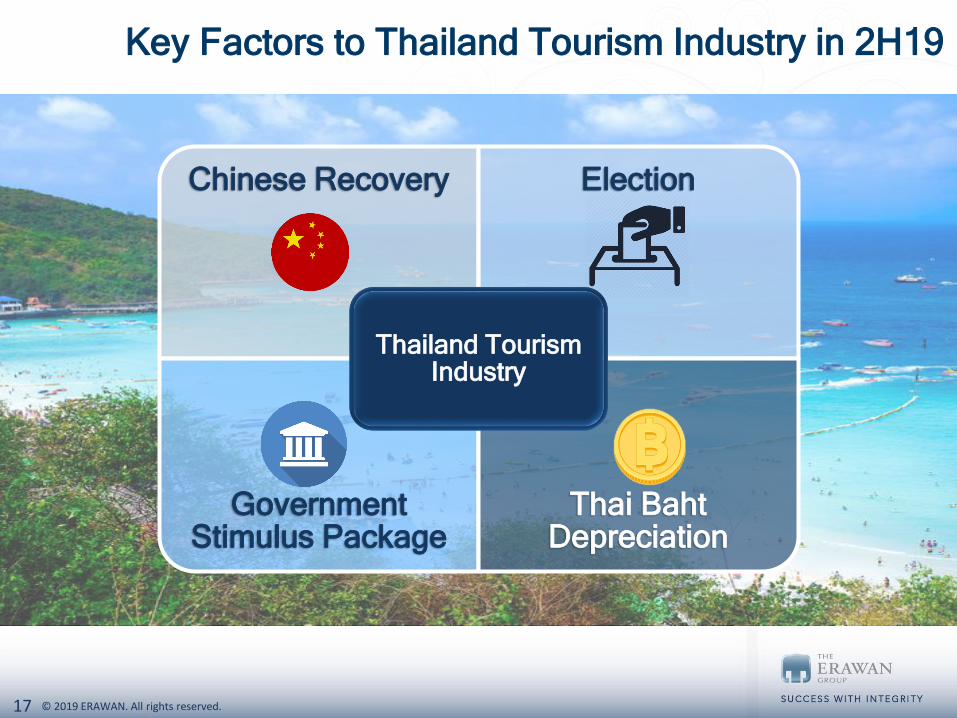
Key Factors to Thailand Tourism Industry in 2H19
Chinese Recovery Election
Government Stimulus Package
Thai Baht Depreciation
Thailand Tourism Industry

18 © 2019 ERAWAN. All rights reserved.
2019 Outlook
Update 2019 Outlook
Tourist Arrival
41.1 Million
Occupancy Rate
~ 80%
2019 Hotel
Opening
9 Hotels
Revenue Growth
7%-10%

19 © 2019 ERAWAN. All rights reserved.
Hotels Growth Strategy
Return Enhancing Strategy
JW Marriott Room Renovation 3rd Phase 133 Rooms 2Q19-3Q19
JW Marriott F&B Outlet renovation Manho & Tsu 2Q19
Ibis Soft Renovation Patong, Samui, Sathorn 2Q19-3Q19
HOP INN Khon Kaen - Mittraphap Road (3rd Branches) 79 Rooms
Jul-19
HOP INN BKK - Changwattana 108 Rooms
HOP INN Rayong - Sukhumvit Road (2nd Branches) 79 Rooms
Aug-19
HOP INN Chiang Rai - Clock Tower (2nd Branched) 70 Rooms
HOP INN Hat Yai (2nd Branches) 79 Rooms
4Q19
HOP INN BKK - Rangsit 79 Rooms
HOP INN Nakorn Pathom 79 Rooms
Mercure Sukhumvit 24 201 Rooms
ibis Sukhumvit 24 300 Rooms
21 © 2019 ERAWAN. All rights reserved.
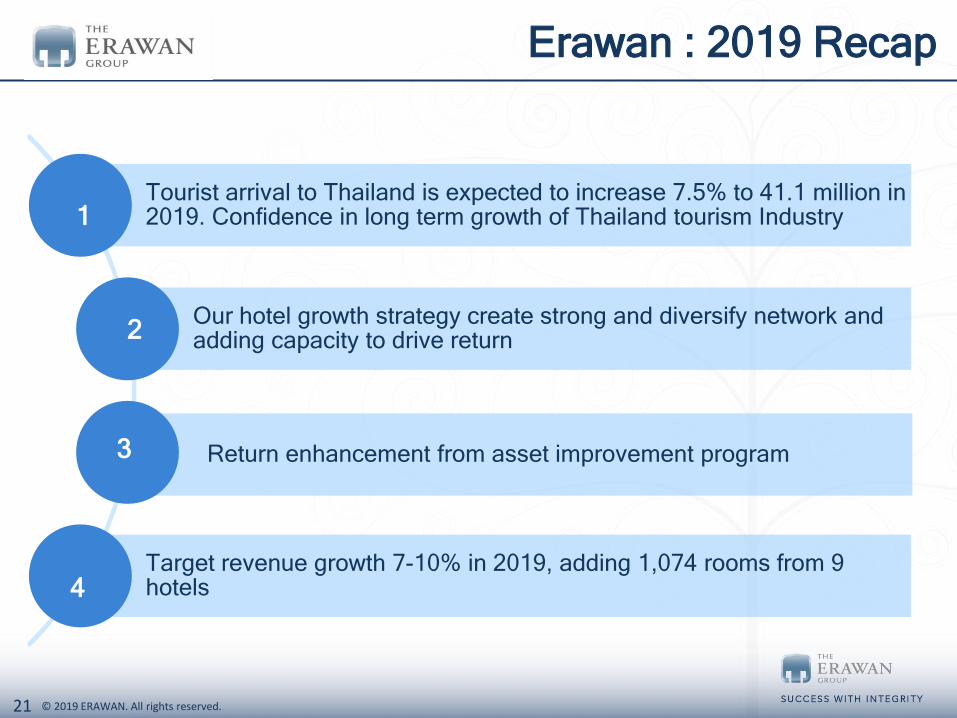
Erawan : 2019 Recap
Tourist arrival to Thailand is expected to increase 7.5% to 41.1 million in 2019. Confidence in long term growth of Thailand tourism Industry
Our hotel growth strategy create strong and diversify network and adding capacity to drive return
Return enhancement from asset improvement program
Target revenue growth 7-10% in 2019, adding 1,074 rooms from 9 hotels
1
2
3
4
22 © 2019 ERAWAN. All rights reserved.
Q & A

23 © 2019 ERAWAN. All rights reserved.
Success with Integrity

2424 © 2019 ERAWAN. All rights reserved.
Appendix
1Q19 Review

2525 © 2019 ERAWAN. All rights reserved.
1Q19 Hotel Statistic by Segment
Hotel Properties Rooms Occupancy ARR (Bt/room/night) RevPAR (Bt/room/night)
YoY 1Q18 1Q19 1Q18 1Q19 +/- LY 1Q18 1Q19 +/- LY 1Q18 1Q19 +/- LY
Thailand
Luxury 979 979 85% 83% 2% 6,325 5,978 5% 5,361 4,965 7%
Midscale 1,282 1,467 92% 88% 3% 3,146 2,945 6% 2,881 2,595 10%
Economy 2,253 2,386 91% 87% 4% 1,538 1,496 3% 1,393 1,296 7%
Total Group ex.HOP INN 4,514 4,832 90% 86% 3% 2,987 2,818 6% 2,676 2,434 9%
HOP INN Thailand 2,573 2,810 78% 73% 5% 574 600 4% 447 439 2%
Philippines
HOP INN Philippines 312 843 75% 75% - 960 996 4% 718 745 4%

26 © 2019 ERAWAN. All rights reserved.
Operating Income by Segment
1Q19
Contribution Y-Y
Luxury 44% 8%
Midscale 24% 2%
Economy 19% 1%
HOP INN Thailand 6% 8%
HOP INN Philippines 4% 183%
Rental 3% 3%
Total Group 1%
27 © 2019 ERAWAN. All rights reserved.
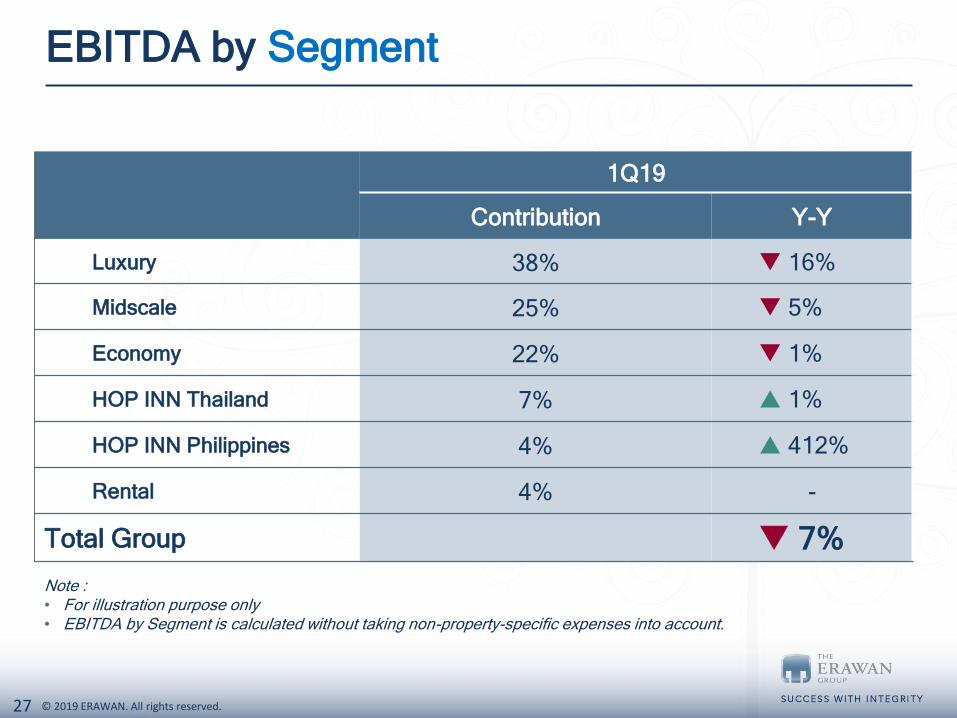
EBITDA by Segment
Note :• For illustration purpose only• EBITDA by Segment is calculated without taking non-property-specific expenses into account.
1Q19
Contribution Y-Y
Luxury 38% 16%
Midscale 25% 5%
Economy 22% 1%
HOP INN Thailand 7% 1%
HOP INN Philippines 4% 412%
Rental 4% -
Total Group 7%

28 © 2019 ERAWAN. All rights reserved.
ERW Room Revenue by Key Source Markets
Remark : Exclude Philippines
Key Source Markets1Q18
Weight
1Q19
WeightYoY
1. Thailand 15% 17% 10%
2. China 15% 15% 2%
3. United States 9% 10% -
4. Russia 7% 5% 23%
5. Singapore 5% 5% 5%
6. India 5% 5% 7%
7. Germany 4% 4% 11%
8. Hong Kong 4% 4% 4%
9. United Kingdom 3% 3% 3%
10. South Korea 3% 3% 7%
Other 30% 30% 2%

29 © 2019 ERAWAN. All rights reserved.
Category Hotel City Rooms Year Operate Ownership
Luxury Hotel Grand Hyatt Erawan Bangkok 380 1991 74%(1)
2 hotels | 821 rooms JW Marriott Bangkok 441 1997 100%
Luxury Resort Renaissance Koh Samui Samui 78 2005 100%
2 hotels | 158 rooms The Naka Island a Luxury Collection Phuket 80 Dec-08/Nov-17 100%
Midscale Hotel Courtyard by Marriott Bangkok 316 Nov-07 100%
3 hotels | 690 rooms Mercure Siam Bangkok 189 Dec-12 100%
Novotel Sukhunvit 4 Bangkok 185 Oct-18 100%
Midscale Resort Holiday Inn Pattaya Pattaya 567 Oct-09 100%
2 hotels | 777 rooms Mercure Pattaya Ocean Resort Pattaya 210 Dec-14 100%
Economy Hotel Ibis Sathorn Bangkok 213 Sep-08 100%
5 hotels | 1,001 rooms Ibis Nana Bangkok 200 Mar-09 100%
Ibis Riverside Bangkok 266 Nov-10 100%
Ibis Siam Bangkok 189 Dec-12 100%
Ibis Style Sukhumvit 4 Bangkok 133 Oct-18 100%
Economy Resort Ibis Patong Phuket 258 May-08 20%(2)
6 hotels | 1,385 rooms Ibis Pattaya Pattaya 254 Jul-08 20%(2)
Ibis Samui Samui 209 Oct-08 100%
Ibis Kata Phuket 258 Dec-09 100%
Ibis Huahin Huahin 200 Jan-12 100%
Ibis Styles Krabi Ao Nang Krabi 206 Nov-14 100%
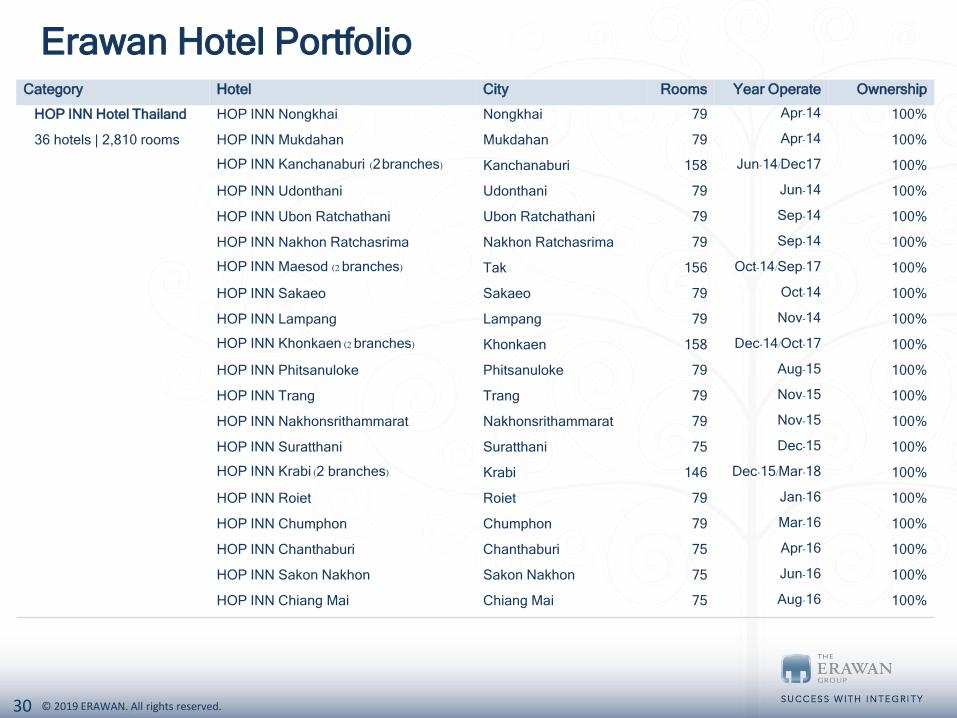
Erawan Hotel Portfolio
30 © 2019 ERAWAN. All rights reserved.
Category Hotel City Rooms Year Operate Ownership
HOP INN Hotel Thailand HOP INN Nongkhai Nongkhai 79 Apr-14 100%
36 hotels | 2,810 rooms HOP INN Mukdahan Mukdahan 79 Apr-14 100%
HOP INN Kanchanaburi (2branches) Kanchanaburi 158 Jun-14/Dec17 100%
HOP INN Udonthani Udonthani 79 Jun-14 100%
HOP INN Ubon Ratchathani Ubon Ratchathani 79 Sep-14 100%
HOP INN Nakhon Ratchasrima Nakhon Ratchasrima 79 Sep-14 100%
HOP INN Maesod (2 branches) Tak 156 Oct-14/Sep-17 100%
HOP INN Sakaeo Sakaeo 79 Oct-14 100%
HOP INN Lampang Lampang 79 Nov-14 100%
HOP INN Khonkaen (2 branches) Khonkaen 158 Dec-14/Oct-17 100%
HOP INN Phitsanuloke Phitsanuloke 79 Aug-15 100%
HOP INN Trang Trang 79 Nov-15 100%
HOP INN Nakhonsrithammarat Nakhonsrithammarat 79 Nov-15 100%
HOP INN Suratthani Suratthani 75 Dec-15 100%
HOP INN Krabi (2 branches) Krabi 146 Dec-15/Mar-18 100%
HOP INN Roiet Roiet 79 Jan-16 100%
HOP INN Chumphon Chumphon 79 Mar-16 100%
HOP INN Chanthaburi Chanthaburi 75 Apr-16 100%
HOP INN Sakon Nakhon Sakon Nakhon 75 Jun-16 100%
HOP INN Chiang Mai Chiang Mai 75 Aug-16 100%
Erawan Hotel Portfolio

31 © 2019 ERAWAN. All rights reserved.
Category Hotel City Rooms Year Operate Ownership
HOP INN Thailand HOP INN Hat Yai Hat Yai 79 Oct-16 100%
36 hotels | 2,810 rooms HOP INN Phuket Phuket 79 Dec-16 100%
HOP INN Burirum Burirum 79 Mar-17 100%
HOP INN Rayong Rayong 75 Apr-17 100%
HOP INN Chiang Rai Chiang Rai 79 May-17 100%
HOP INN Lampang City Center Lampang 79 Jun-17 100%
HOP INN Huahin Prachuap Khiri Khan 79 Sep-17 100%
HOP INN Nakornsawan Nakorn Sawan 79 Dec-17 100%
HOP INN Lopburi Lopburi 79 Dec-17 100%
HOP INN Surin Surin 79 Apr-18 100%
HOP INN Chonburi Choburi 79 Aug-18 100%
HOP INN Chiangmai Superhighway Chiang Mai 79 Oct-18 100%
HOP INN Philippines HOP INN Ermita Manila 168 Dec-16 100%
5 hotels | 843 rooms HOP INN Makati Manila 144 Aug-17 100%
HOP INN Aseana Manila 196 Apr-18 100%
HOP INN Alabang Manila 168 Jul-18 100%
HOP INN Quezon Manila 167 Dec-18 100%
Erawan Hotel Portfolio

32 © 2019 ERAWAN. All rights reserved.
For More information Please visit www.theerawan.com
or contact [email protected]


