Sequence analysis.Cluster analysis.
Meelis [email protected]
Lecture 5Bioinformatics MTAT.03.239
University of Tartu2010 Fall

Sequence Analysis:DNA, RNA, Protein

Aperiodic crystals store information
• Erwin Schrödinger“What is Life? The Physical Aspect of the Living Cell”1944
• In the book, Schrödinger introduced the idea of an "aperiodic crystal" that contained genetic information in its configuration of covalent chemical bonds
• Note that this is before discovery of the helical structure of DNA in 1953 by Watson & Crick
Sequence Information
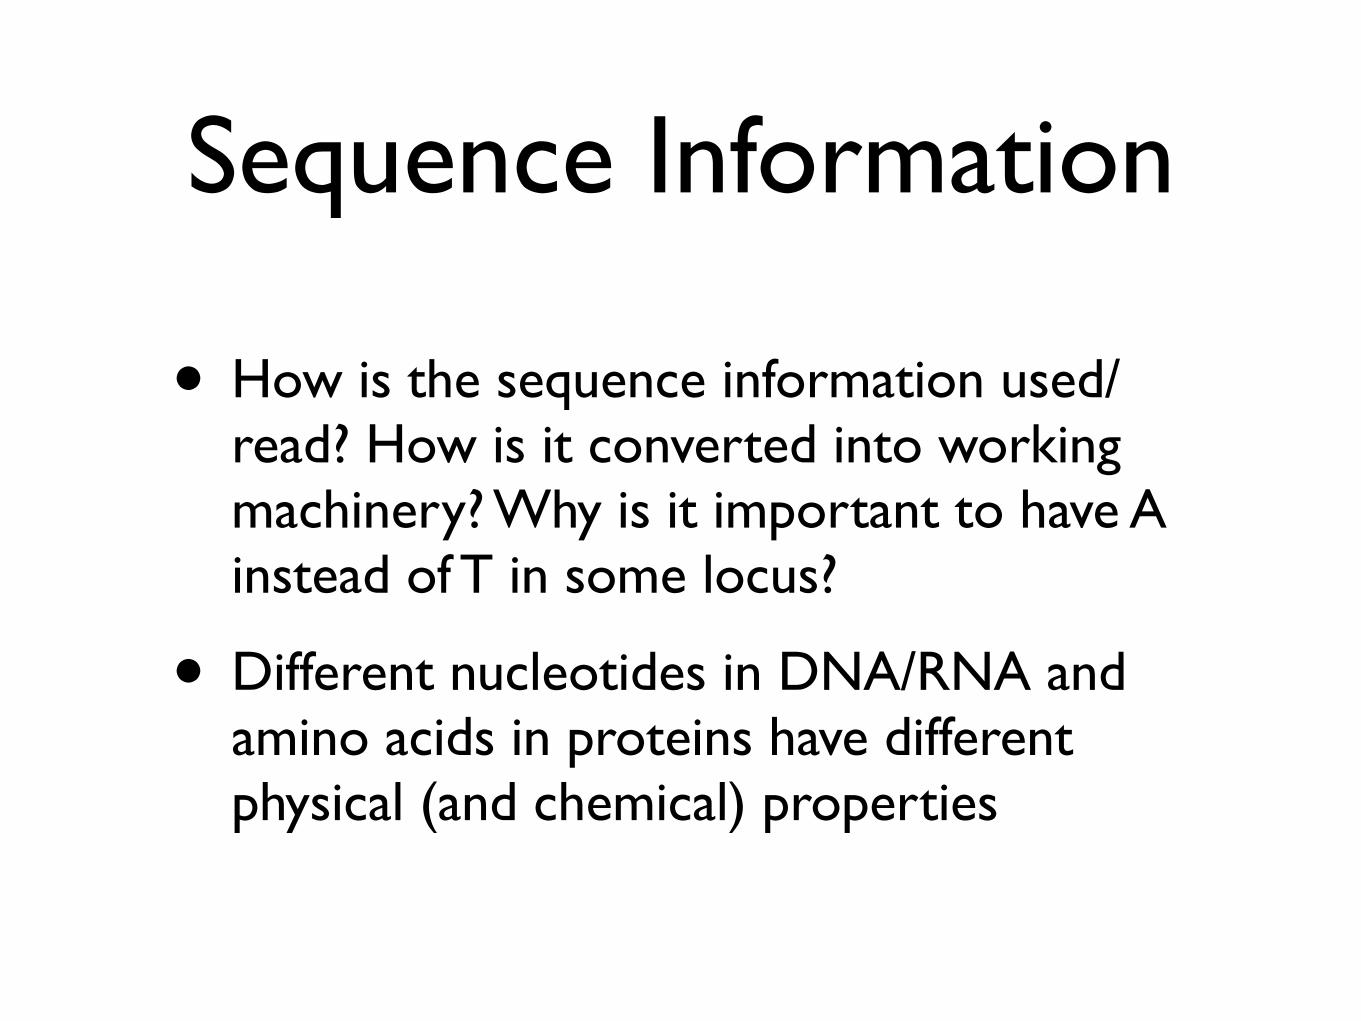
• How is the sequence information used/read? How is it converted into working machinery? Why is it important to have A instead of T in some locus?
• Different nucleotides in DNA/RNA and amino acids in proteins have different physical (and chemical) properties
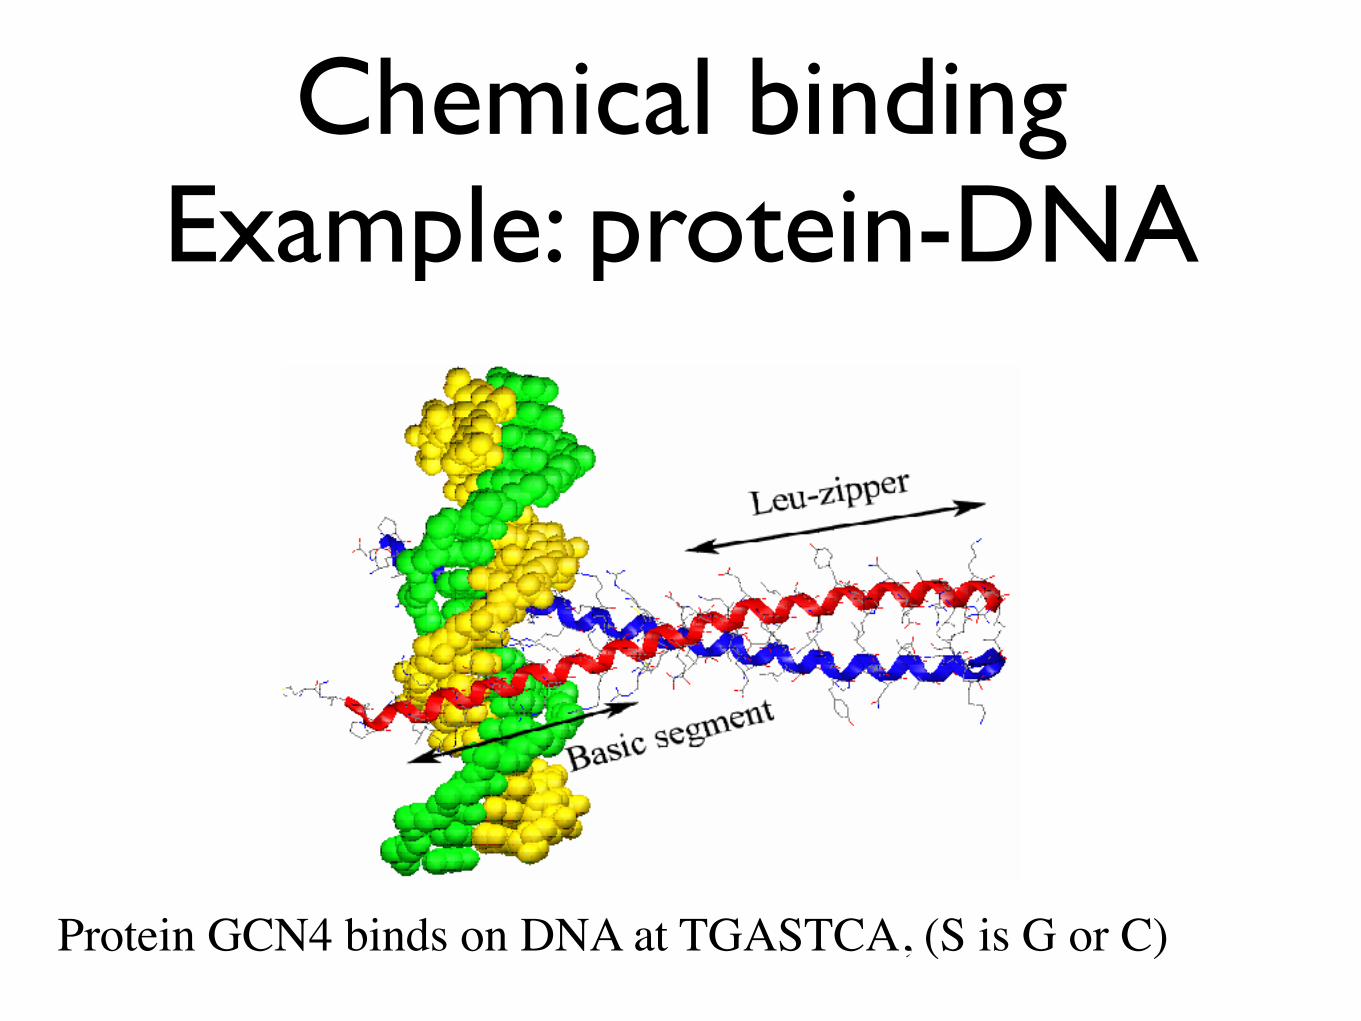
Chemical bindingExample: protein-DNA
Protein GCN4 binds on DNA at TGASTCA, (S is G or C)
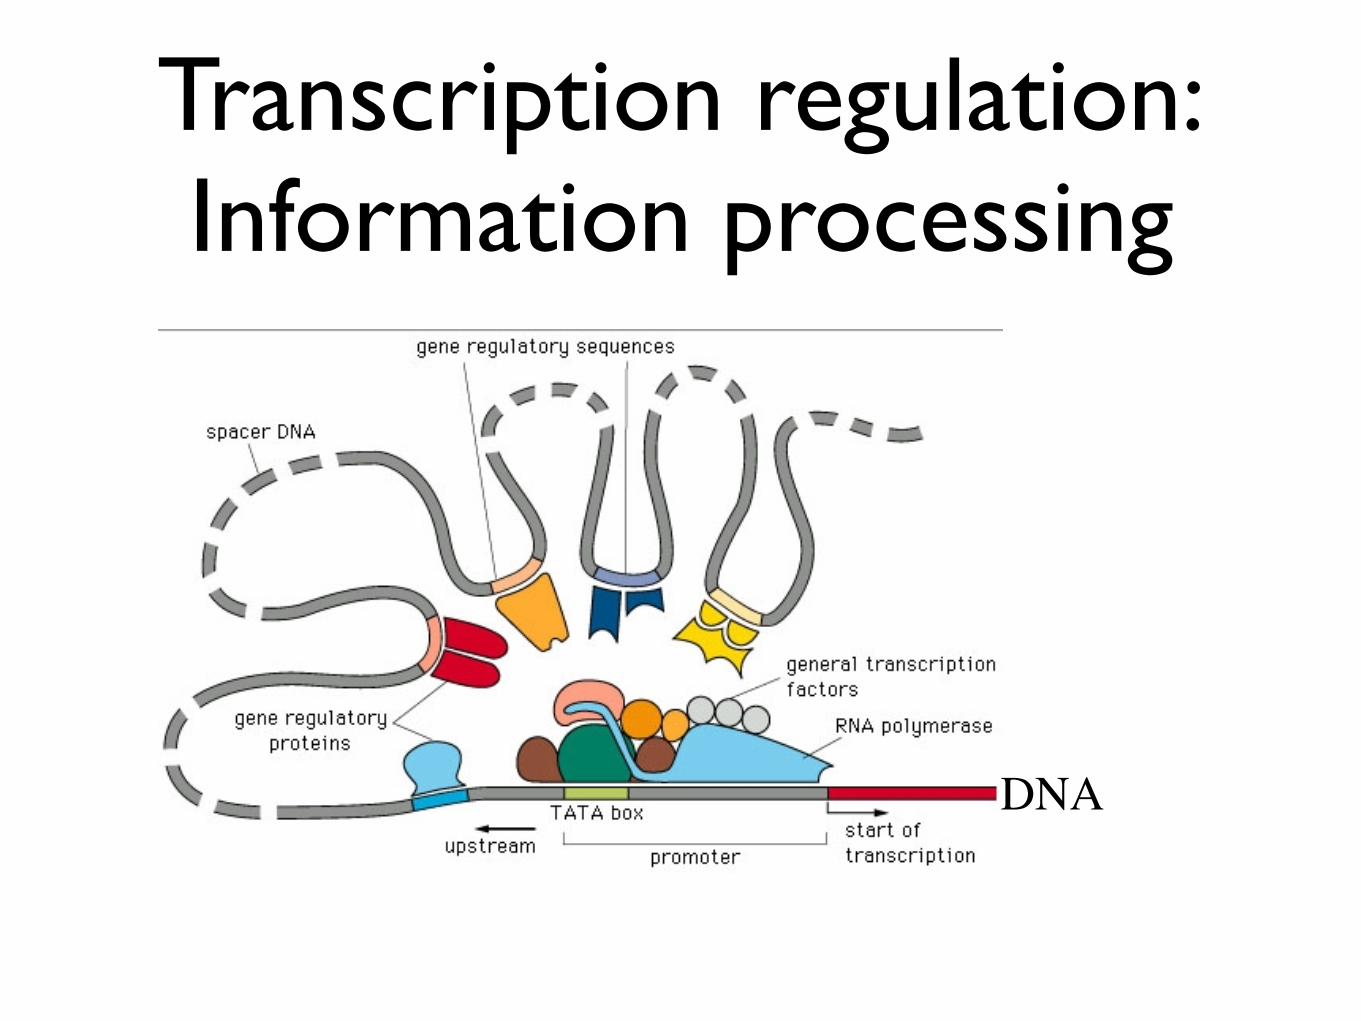
Transcription regulation:Information processing
DNA
Sequence annotation
• How do the nucleotides in the genome contribute to the life of the cell?
• One of the main objectives in bioinformatics (and biology)
• Sequence annotation is the next major challenge for the Human Genome Project
• ENCyclopedia Of DNA Elements (ENCODE)
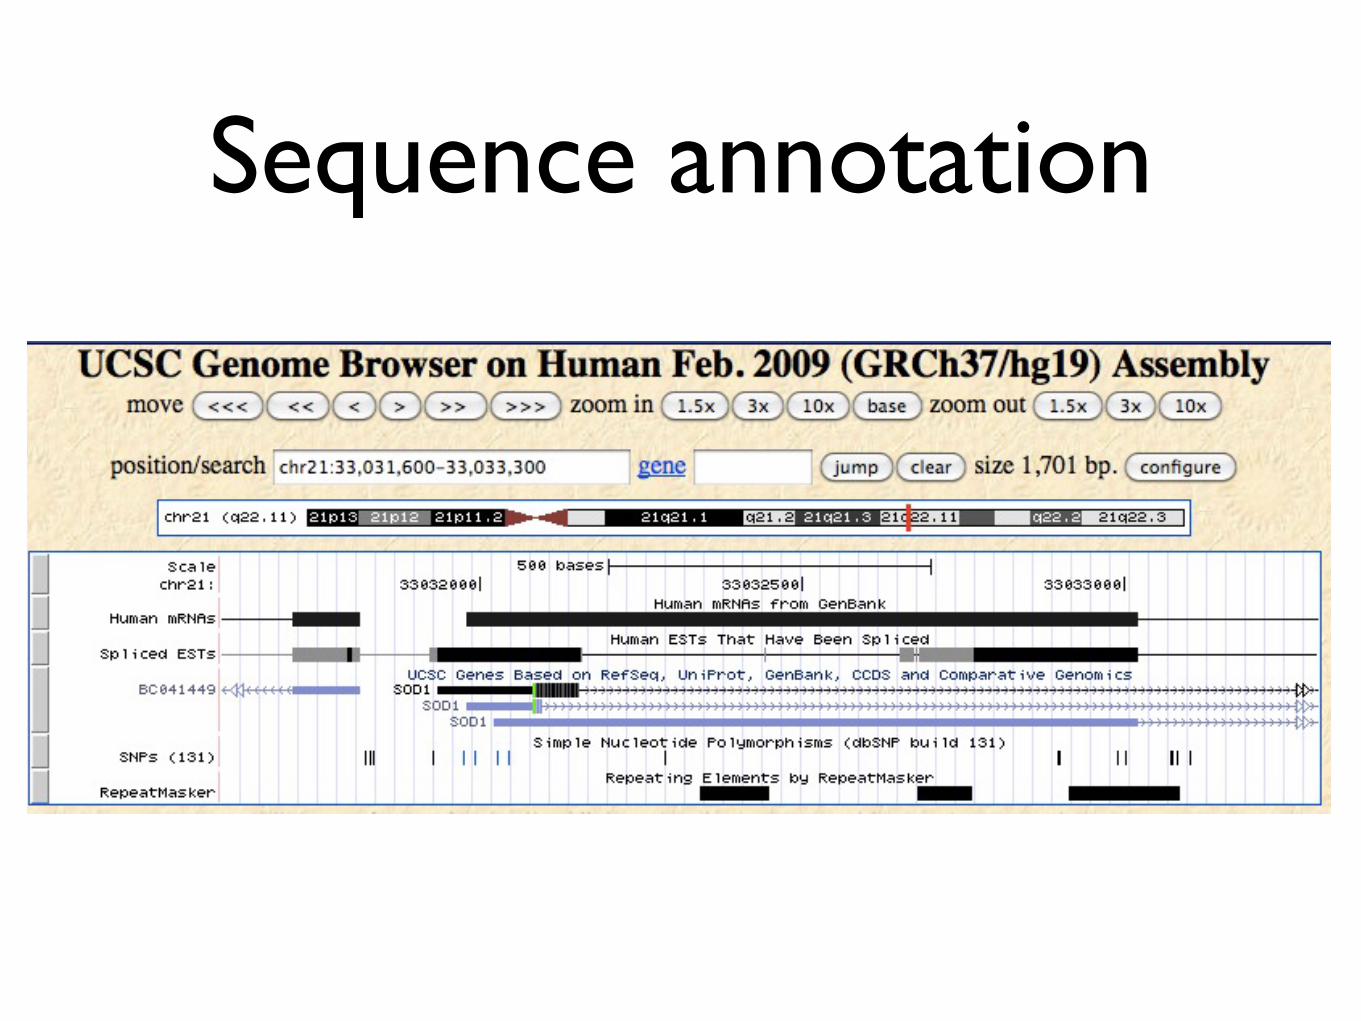
Sequence annotation

How to get annotations for the genome?
• Evidence from case studies (Biology)
• Large scale experiments (Biology with Bioinformatics support)
• Predictions based on existing annotations (Bioinformatics)
• Experimental verification of predictions (Biology)

Finding TFBS - Transcription Factor Binding Sites
DNA

Transcription Factor binding on DNA
Protein GCN4 binds on DNA at TGASTCA, (S is G or C)
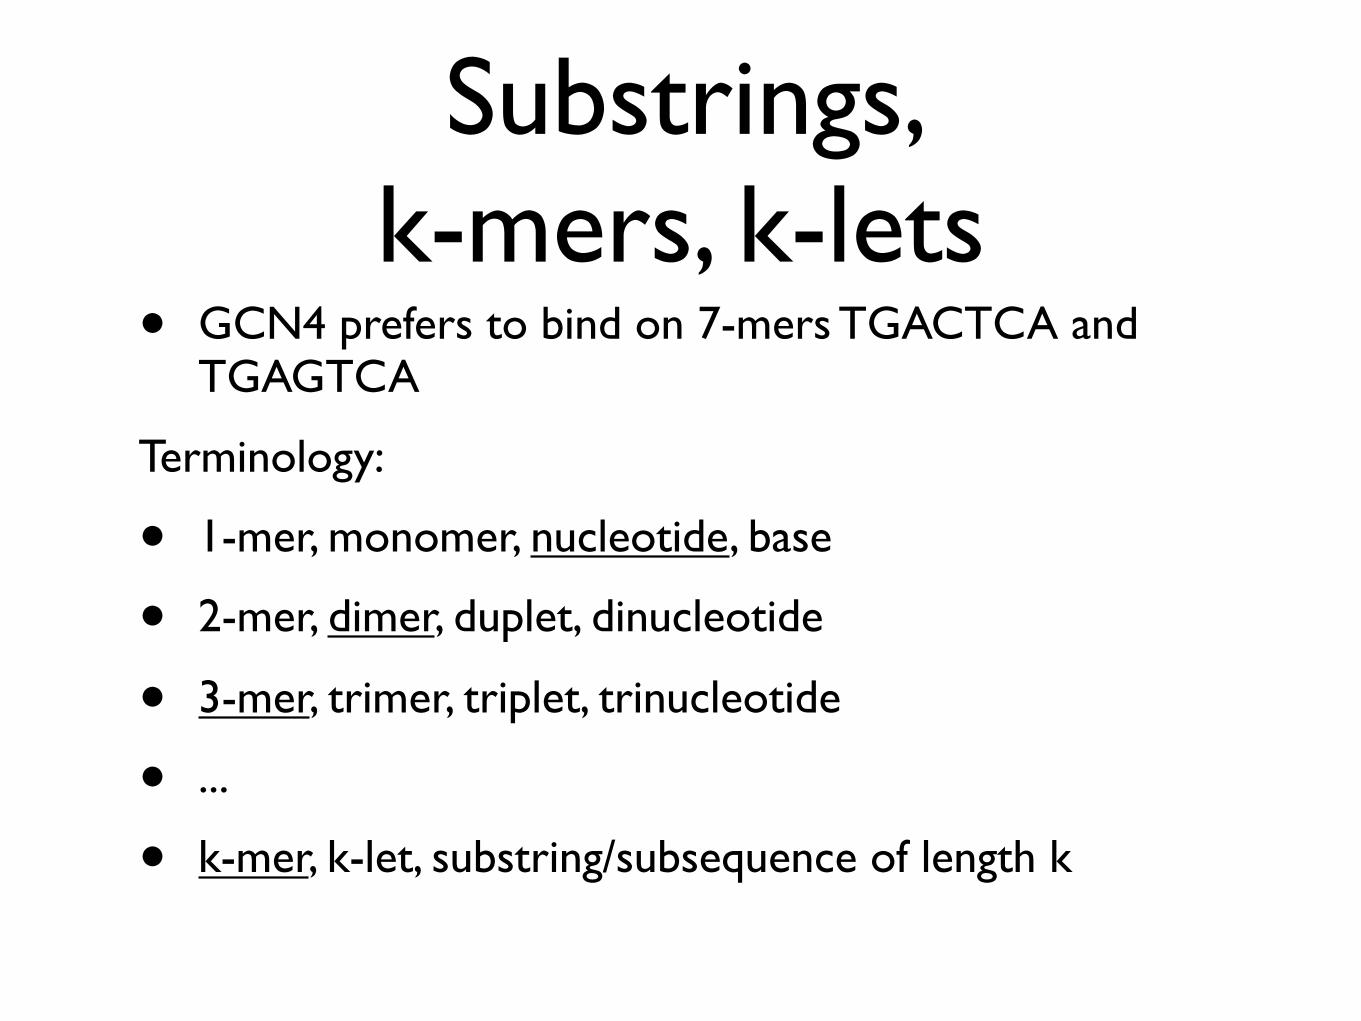
Substrings, k-mers, k-lets
• GCN4 prefers to bind on 7-mers TGACTCA and TGAGTCA
Terminology:
• 1-mer, monomer, nucleotide, base
• 2-mer, dimer, duplet, dinucleotide
• 3-mer, trimer, triplet, trinucleotide
• ...
• k-mer, k-let, substring/subsequence of length k
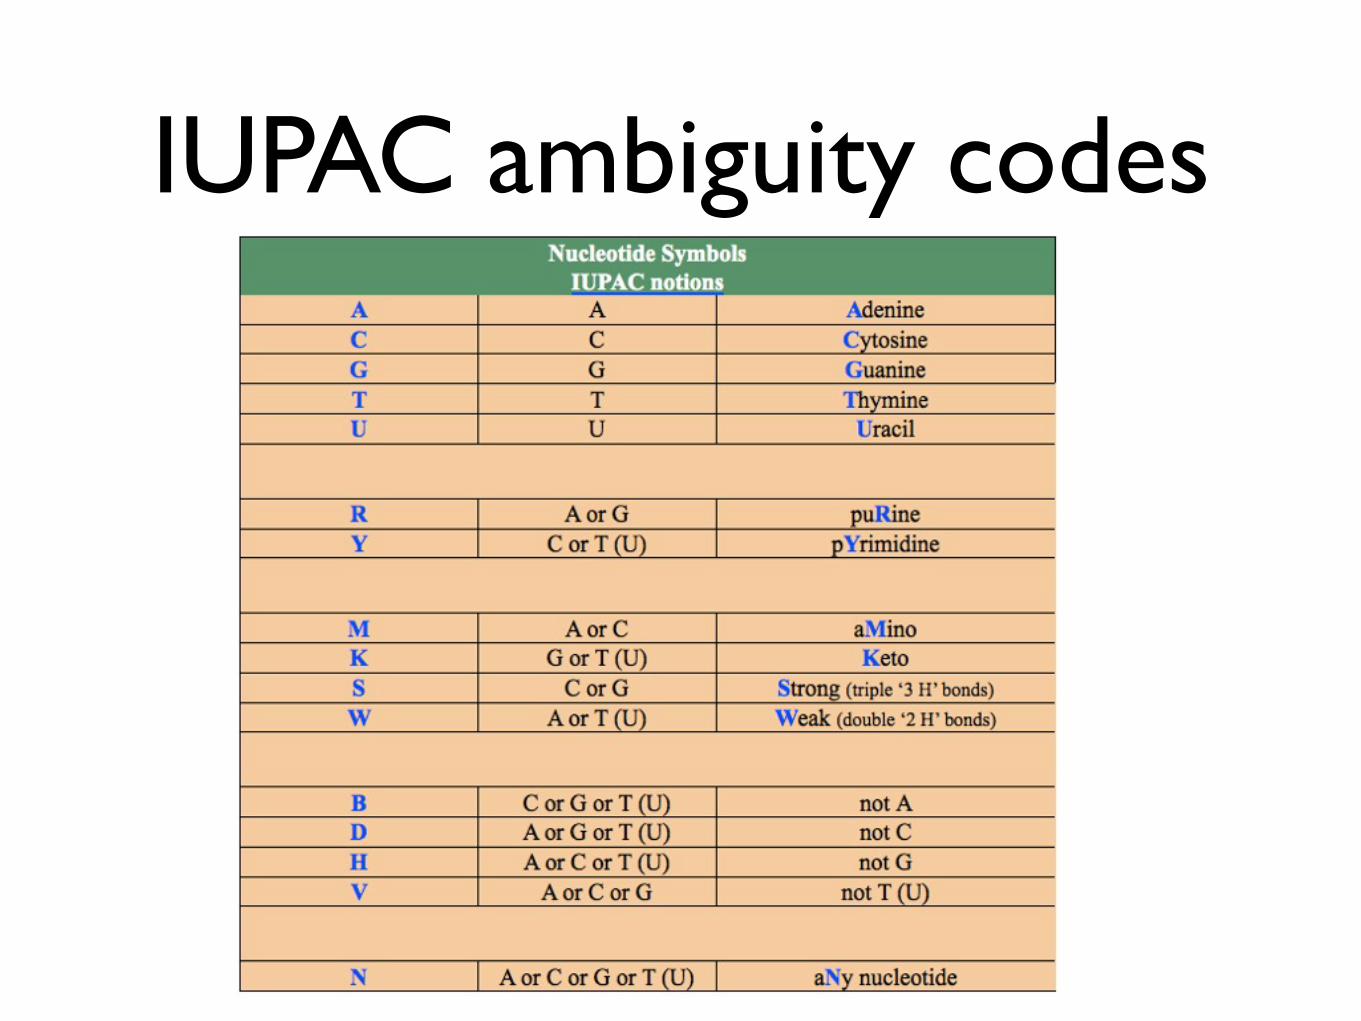
IUPAC ambiguity codes
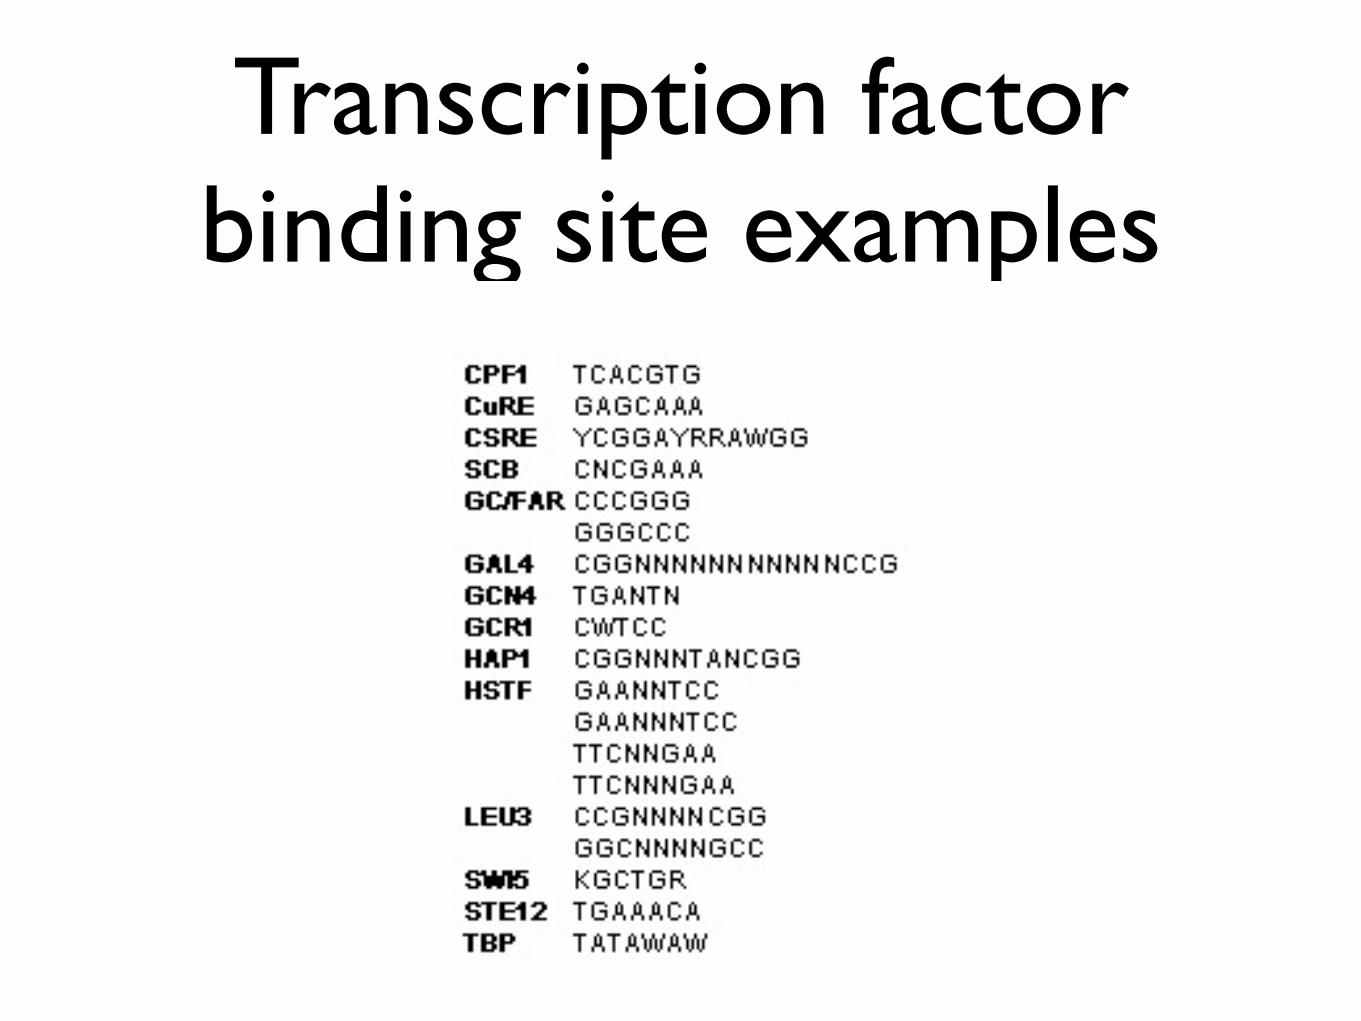
Transcription factor binding site examples

Models for aDNA sequence
• Consensus sequence
• k-mer
• IUPAC k-mer
• RegExp - Regular expression
• e.g. CG[GT]N{5,10}CCG
• PWM - Position Weight Matrix
• HMM - Hidden Markov Model

PWM - Position Weight Matrix• TBP - TATA-binding protein
Binding TATAWAW where W is T or A
A [ 61 16 352 3 354 268 360 222 155 56 83 82 82 68 77 ]C [145 46 0 10 0 0 3 2 44 135 147 127 118 107 101 ]G [152 18 2 2 5 0 20 44 157 150 128 128 128 139 140 ]T [ 31 309 35 374 30 121 6 121 33 48 31 52 61 75 71 ]-----------------------------------------------------------------SUM 389 389 389 389 389 389 389 389 389 389 389 389 389 389 389
PWM logoCount matrix,
not PWM
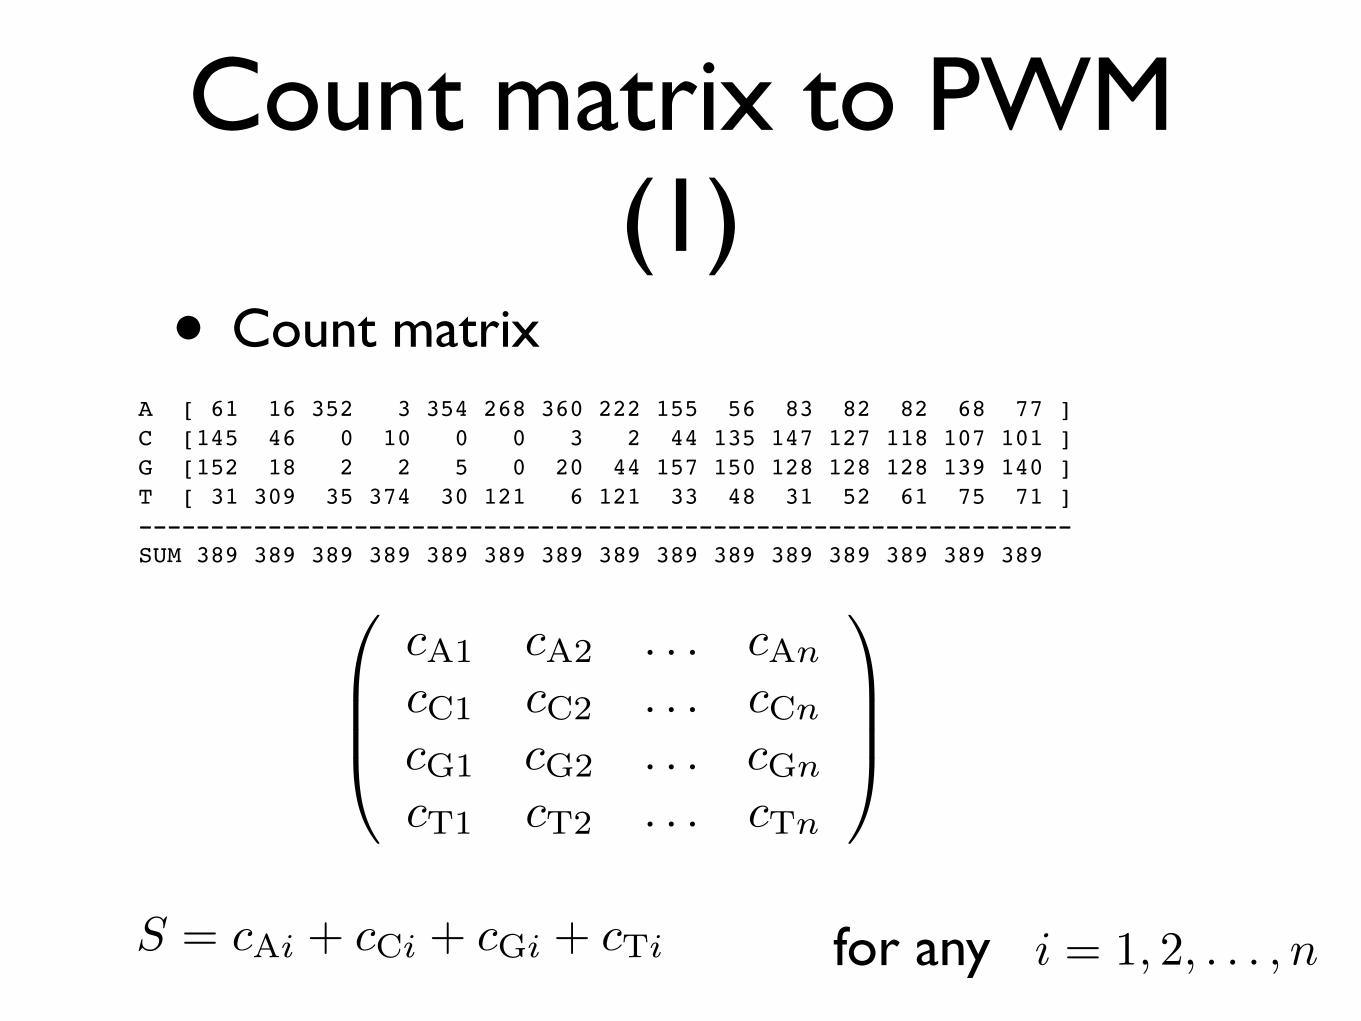
Count matrix to PWM (1)
• Count matrixA [ 61 16 352 3 354 268 360 222 155 56 83 82 82 68 77 ]C [145 46 0 10 0 0 3 2 44 135 147 127 118 107 101 ]G [152 18 2 2 5 0 20 44 157 150 128 128 128 139 140 ]T [ 31 309 35 374 30 121 6 121 33 48 31 52 61 75 71 ]-----------------------------------------------------------------SUM 389 389 389 389 389 389 389 389 389 389 389 389 389 389 389
for any i = 1, 2, . . . , nS = cAi + cCi + cGi + cTi
cA1 cA2 . . . cAn
cC1 cC2 . . . cCn
cG1 cG2 . . . cGn
cT1 cT2 . . . cTn

Count matrix to PWM (2)
• Probability matrixA [ .16 .05 .87 .02 .88 .67 .89 .56 .39 .15 .22 .21 .21 .18 .20 ]C [ .37 .12 .01 .04 .01 .01 .02 .02 .12 .34 .37 .32 .30 .27 .26 ]G [ .38 .06 .02 .02 .02 .01 .06 .12 .40 .38 .33 .33 .33 .35 .35 ]T [ .09 .77 .10 .93 .09 .31 .03 .31 .09 .13 .09 .14 .16 .20 .19 ]-----------------------------------------------------------------SUM 1.0 1.0 1.0 1.0 1.0 1.0 1.0 1.0 1.0 1.0 1.0 1.0 1.0 1.0 1.0
for anyi = 1, 2, . . . , n
X = A,C,G,T
pA1 pA2 . . . pAn
pC1 pC2 . . . pCn
pG1 pG2 . . . pGn
pT1 pT2 . . . pTn
bAbCbGbT
pXi =cXi + bX
√S
S +√S
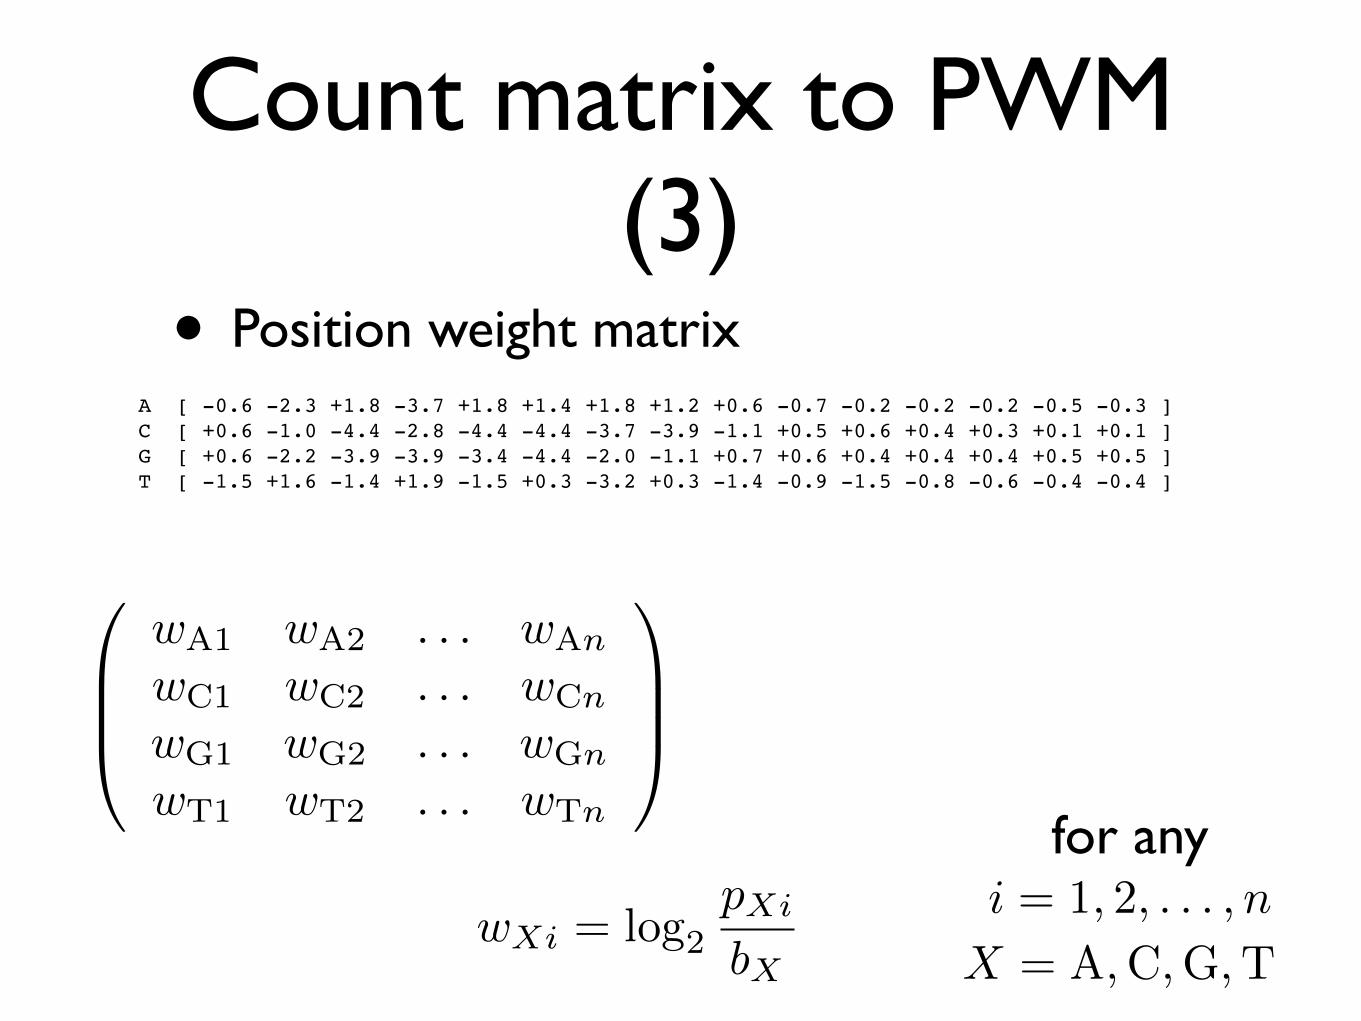
Count matrix to PWM (3)
• Position weight matrixA [ -0.6 -2.3 +1.8 -3.7 +1.8 +1.4 +1.8 +1.2 +0.6 -0.7 -0.2 -0.2 -0.2 -0.5 -0.3 ]C [ +0.6 -1.0 -4.4 -2.8 -4.4 -4.4 -3.7 -3.9 -1.1 +0.5 +0.6 +0.4 +0.3 +0.1 +0.1 ]G [ +0.6 -2.2 -3.9 -3.9 -3.4 -4.4 -2.0 -1.1 +0.7 +0.6 +0.4 +0.4 +0.4 +0.5 +0.5 ]T [ -1.5 +1.6 -1.4 +1.9 -1.5 +0.3 -3.2 +0.3 -1.4 -0.9 -1.5 -0.8 -0.6 -0.4 -0.4 ]
for anyi = 1, 2, . . . , n
X = A,C,G,T
wA1 wA2 . . . wAn
wC1 wC2 . . . wCn
wG1 wG2 . . . wGn
wT1 wT2 . . . wTn
wXi = log2pXi
bX
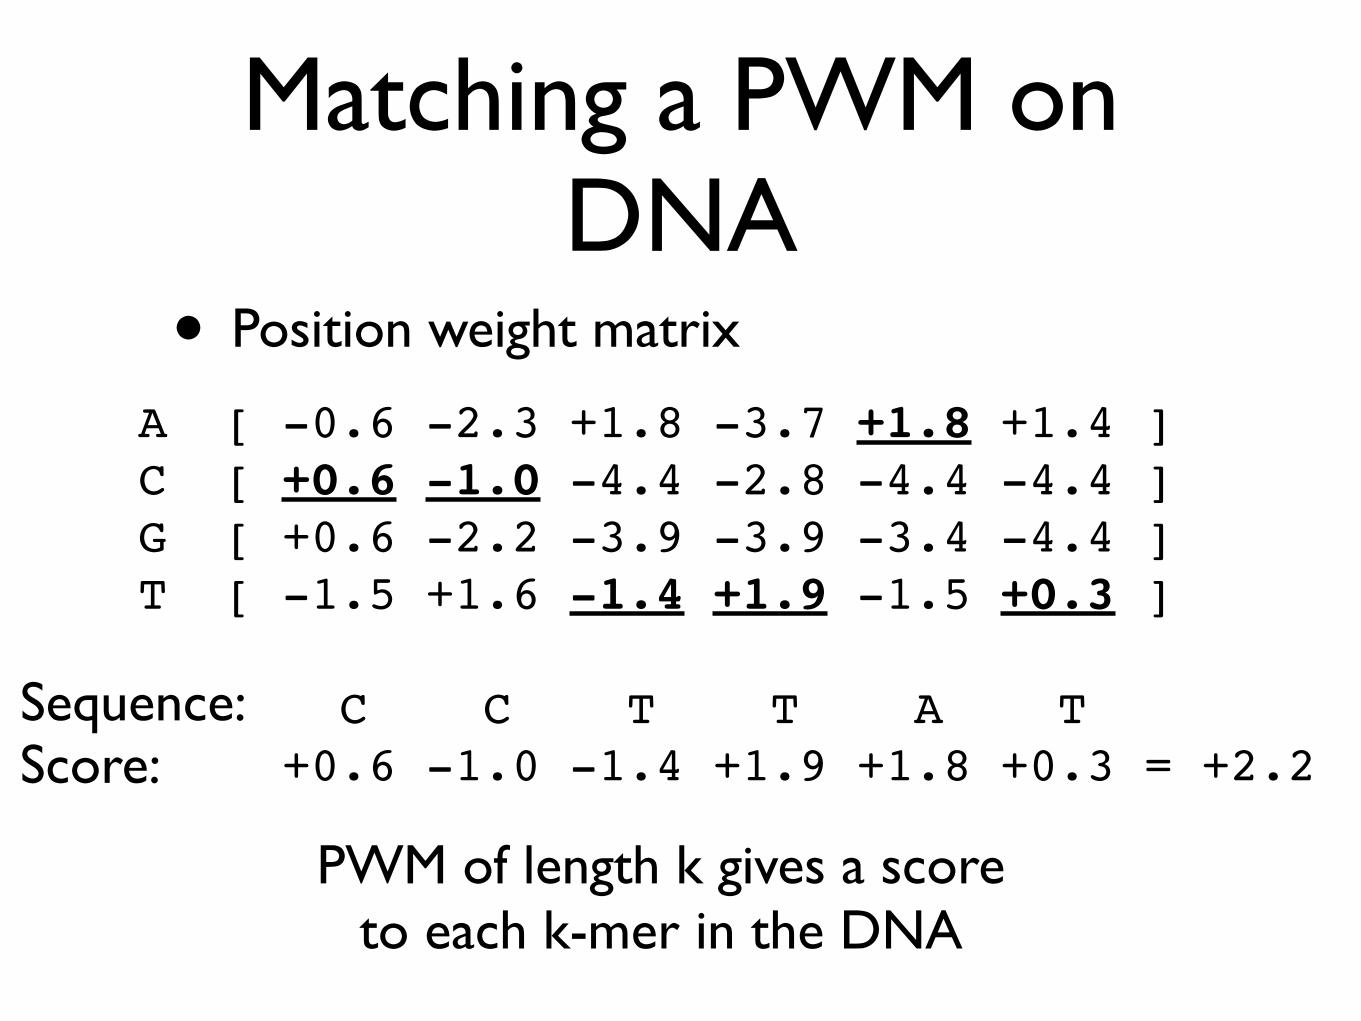
Matching a PWM on DNA
• Position weight matrix
A [ -0.6 -2.3 +1.8 -3.7 +1.8 +1.4 ]C [ +0.6 -1.0 -4.4 -2.8 -4.4 -4.4 ]G [ +0.6 -2.2 -3.9 -3.9 -3.4 -4.4 ]T [ -1.5 +1.6 -1.4 +1.9 -1.5 +0.3 ]
C C T T A T +0.6 -1.0 -1.4 +1.9 +1.8 +0.3 = +2.2
Sequence:Score:
PWM of length k gives a score to each k-mer in the DNA
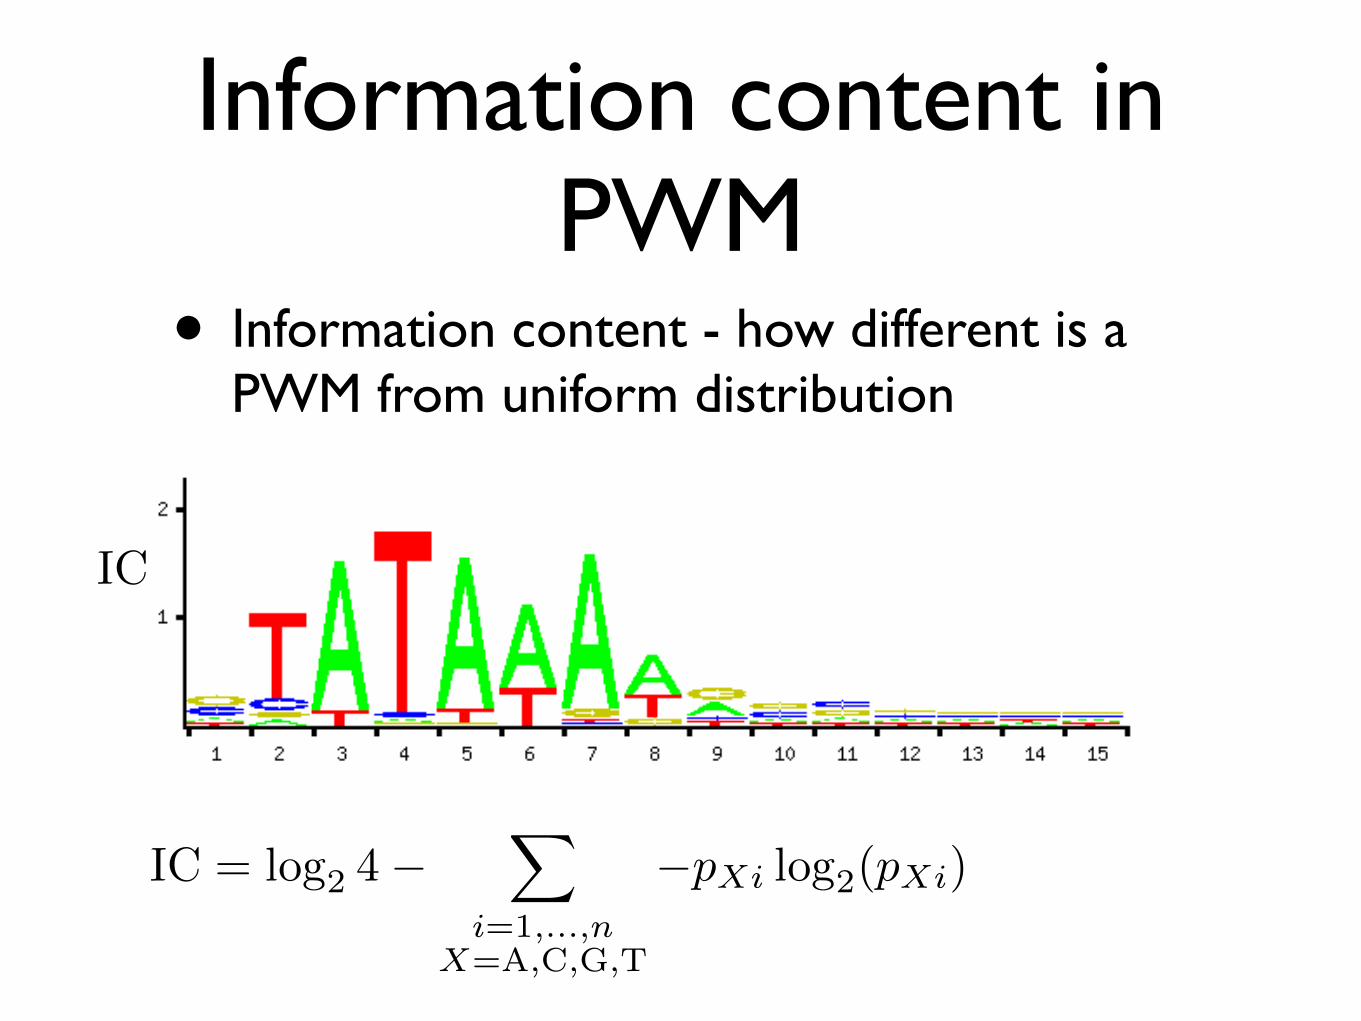
Information content in PWM
• Information content - how different is a PWM from uniform distribution
IC
IC = log2 4−�
i=1,...,nX=A,C,G,T
−pXi log2(pXi)

Observations: Sunny, Rainy, Sunny, Sunny, Rainy, Snowy, Snowy, ...Hidden states: Summer, Fall, Fall, Fall, Fall, Winter, Winter,...
HMMs - Hidden Markov Models
http://webdocs.cs.ualberta.ca/~colinc/cmput606/606FinalPres.ppt
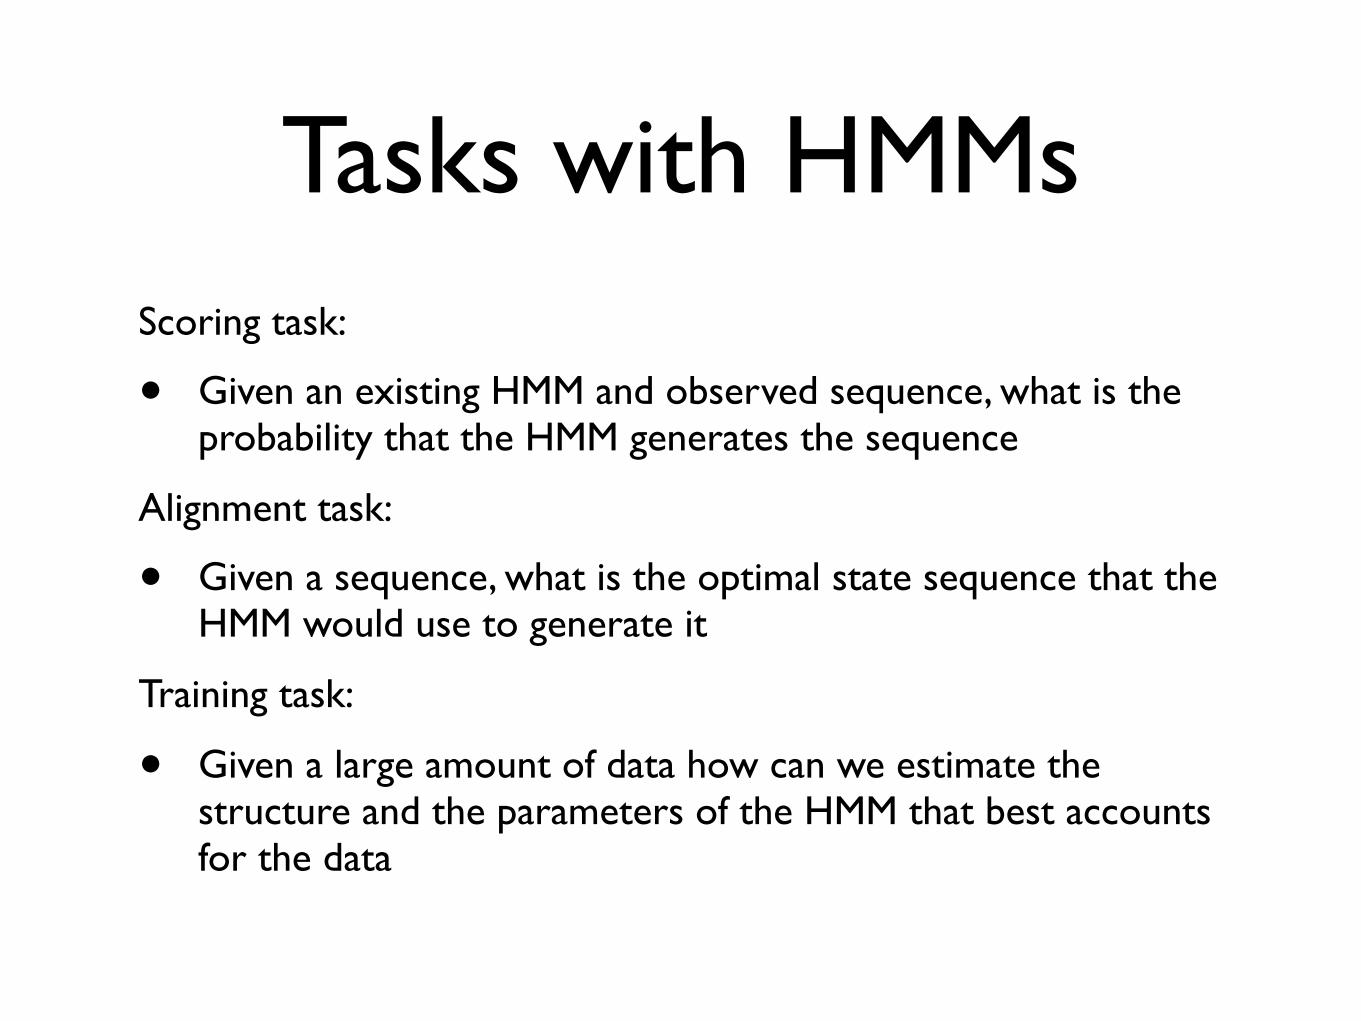
Tasks with HMMsScoring task:
• Given an existing HMM and observed sequence, what is the probability that the HMM generates the sequence
Alignment task:
• Given a sequence, what is the optimal state sequence that the HMM would use to generate it
Training task:
• Given a large amount of data how can we estimate the structure and the parameters of the HMM that best accounts for the data
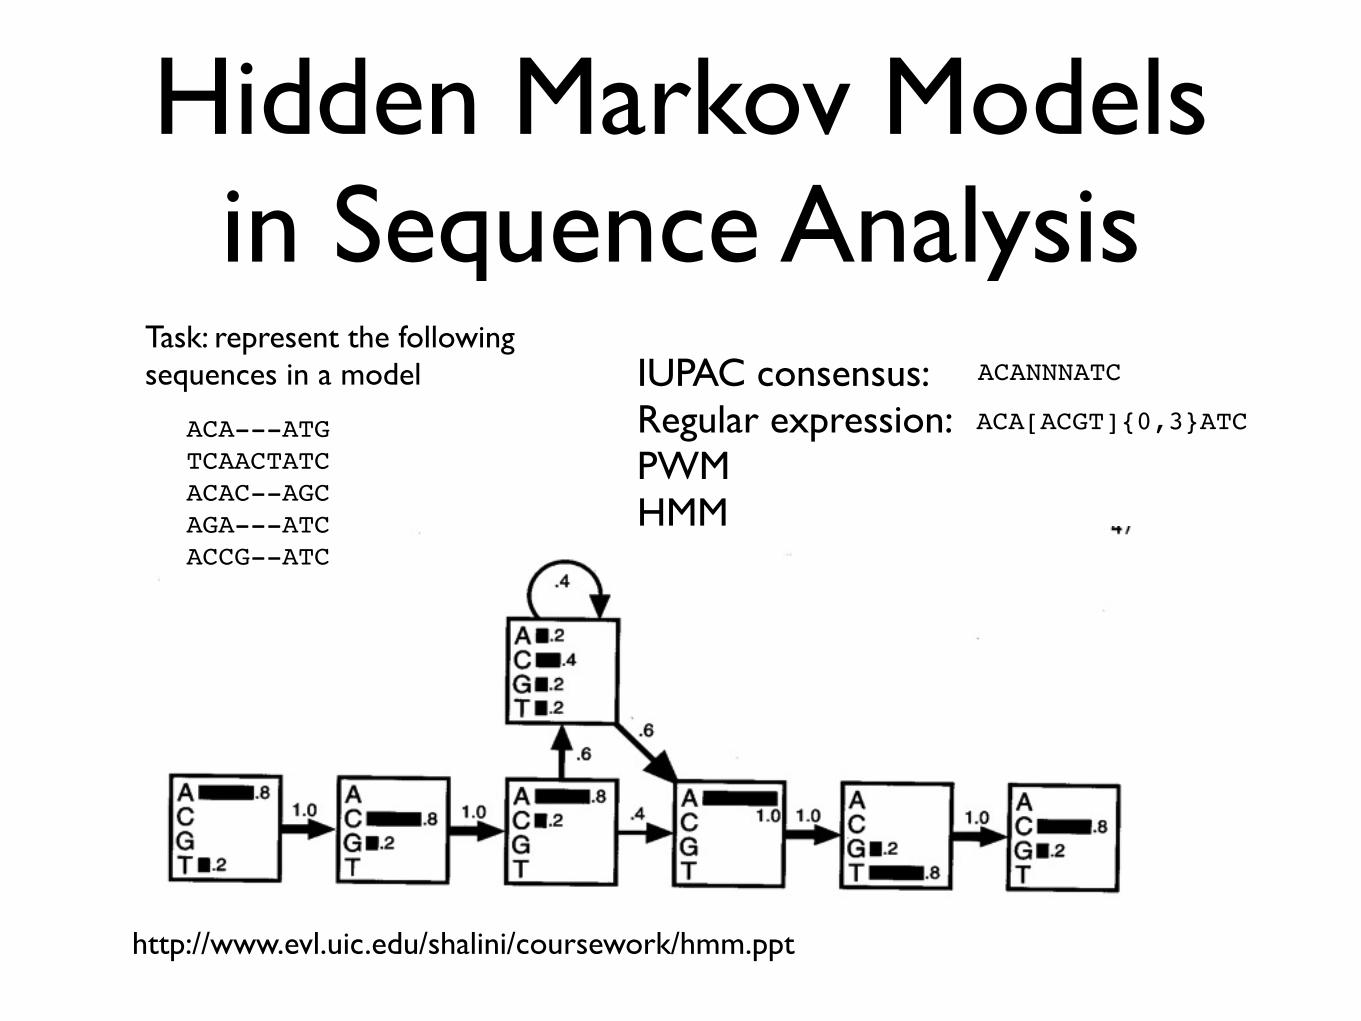
Hidden Markov Models in Sequence Analysis
ACA---ATG TCAACTATCACAC--AGCAGA---ATCACCG--ATC
http://www.evl.uic.edu/shalini/coursework/hmm.ppt
ACANNNATC
ACA[ACGT]{0,3}ATC
Task: represent the following sequences in a model IUPAC consensus:
Regular expression:PWMHMM
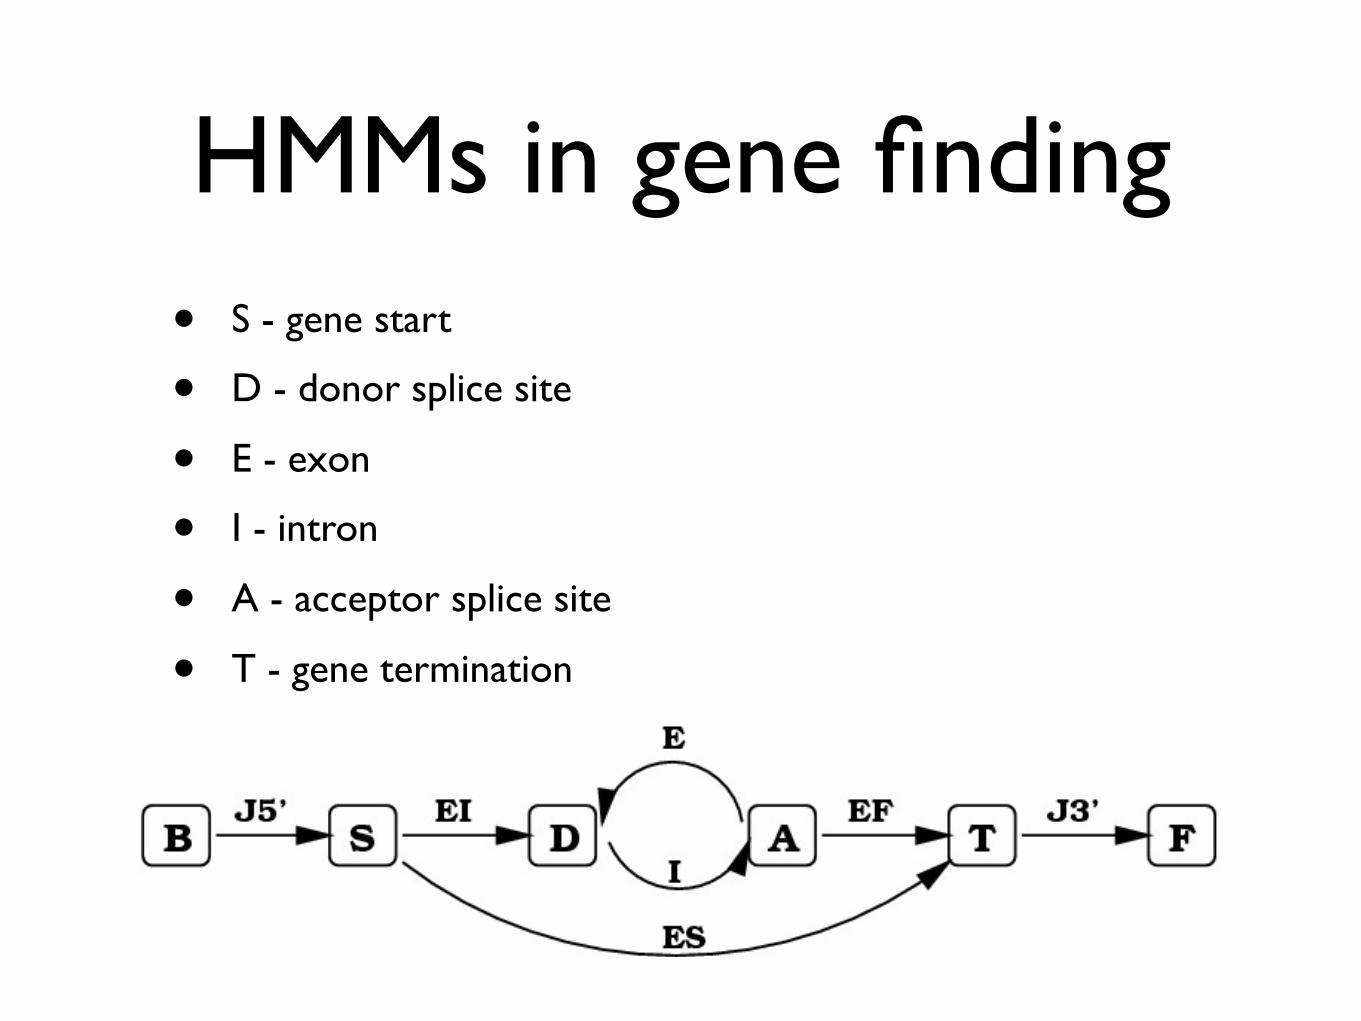
HMMs in gene finding• S - gene start
• D - donor splice site
• E - exon
• I - intron
• A - acceptor splice site
• T - gene termination
DNA sequence analysis
... is mostly about:
• building a model for some DNA feature (or often just learning the parameters)
• searching for sites which match a model (or match it well enough)
• statistical analysis about what features are over-represented in some region of DNA

Common tasks in DNA sequence analysis• GC-content
• CpG islands
• Masking repeats
• Melting temperature
• PCR primer design
• TFBS motif discovery
• TFBS search
• Gene search
• Codon usage
• Sequence alignment
• and many more

Clustering
What is Cluster Analysis?
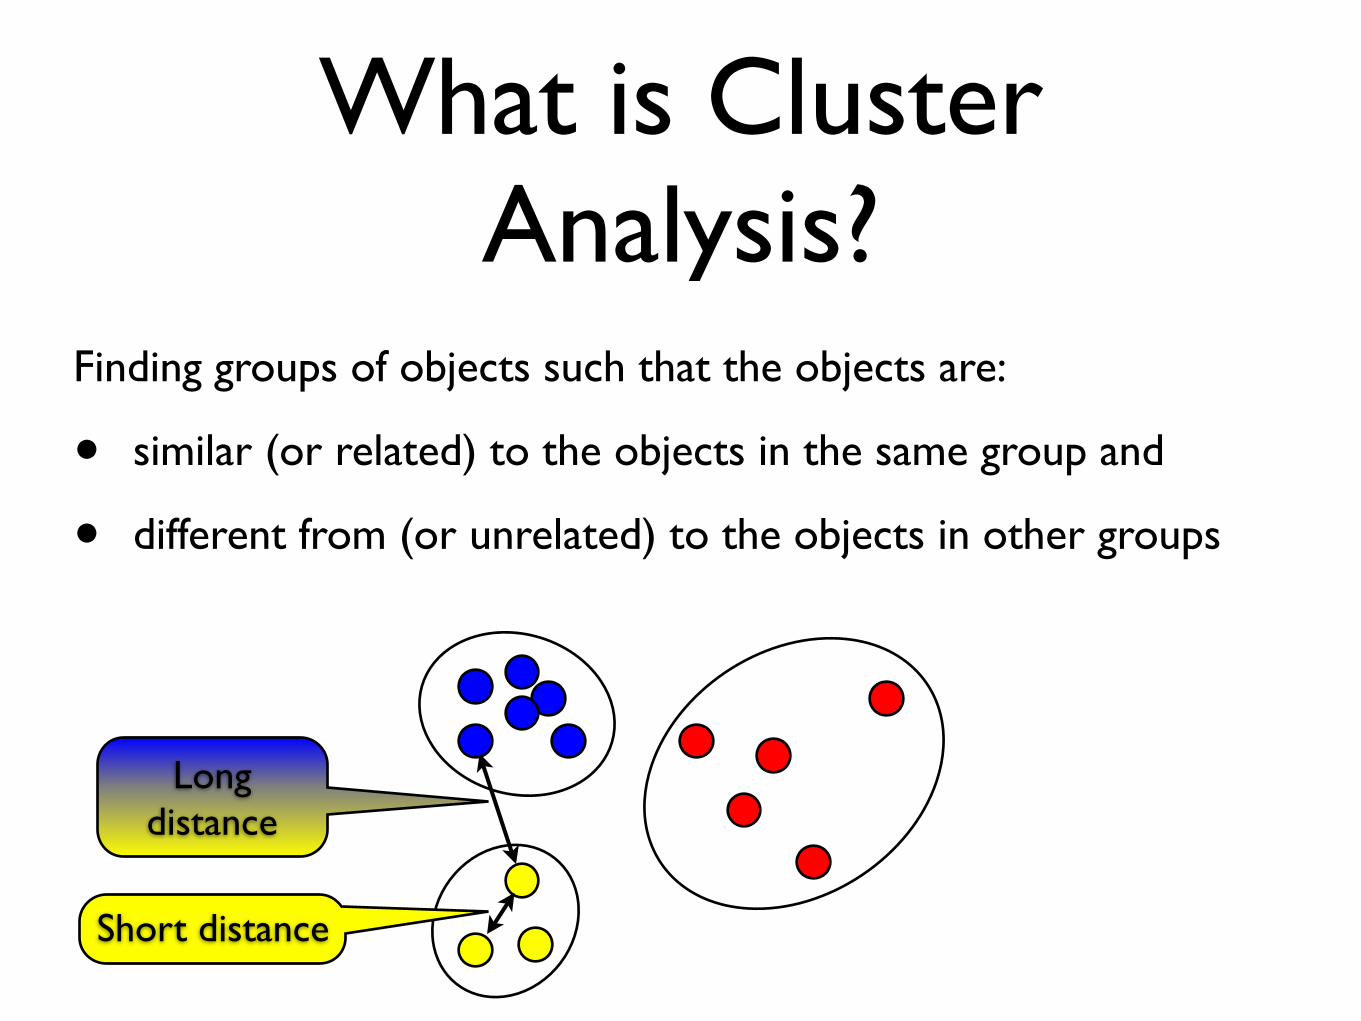
Finding groups of objects such that the objects are:
• similar (or related) to the objects in the same group and
• different from (or unrelated) to the objects in other groups
Short distance
Long distance
Why to cluster biological data?
• Intuition building
• Hypothesis generation
• Summarizing / compressing large data
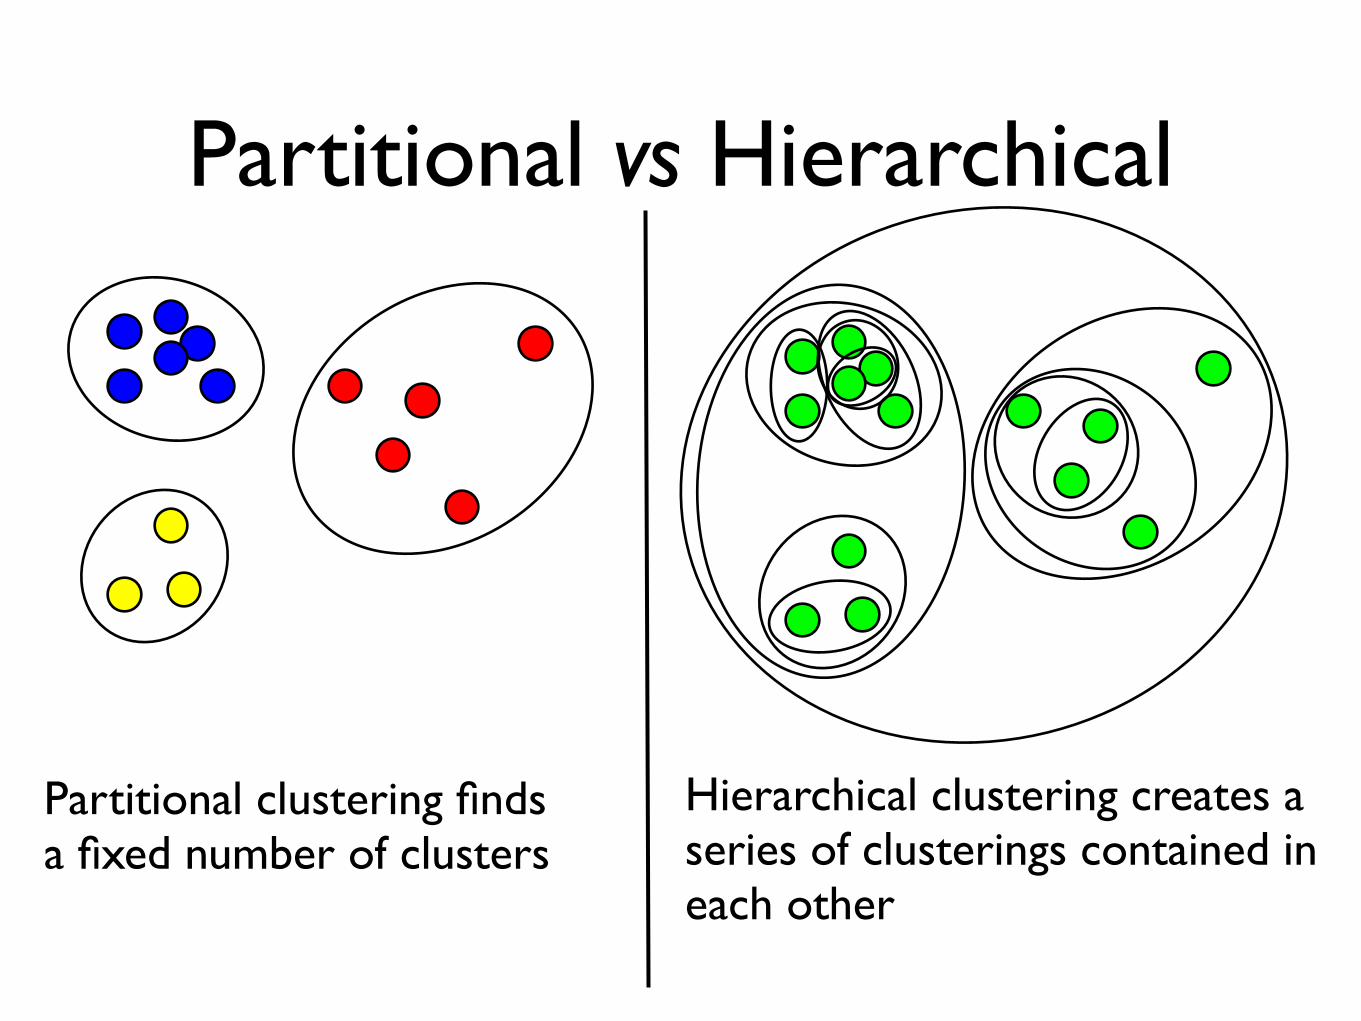
Partitional vs Hierarchical
Partitional clustering findsa fixed number of clusters
Hierarchical clustering creates a series of clusterings contained in each other
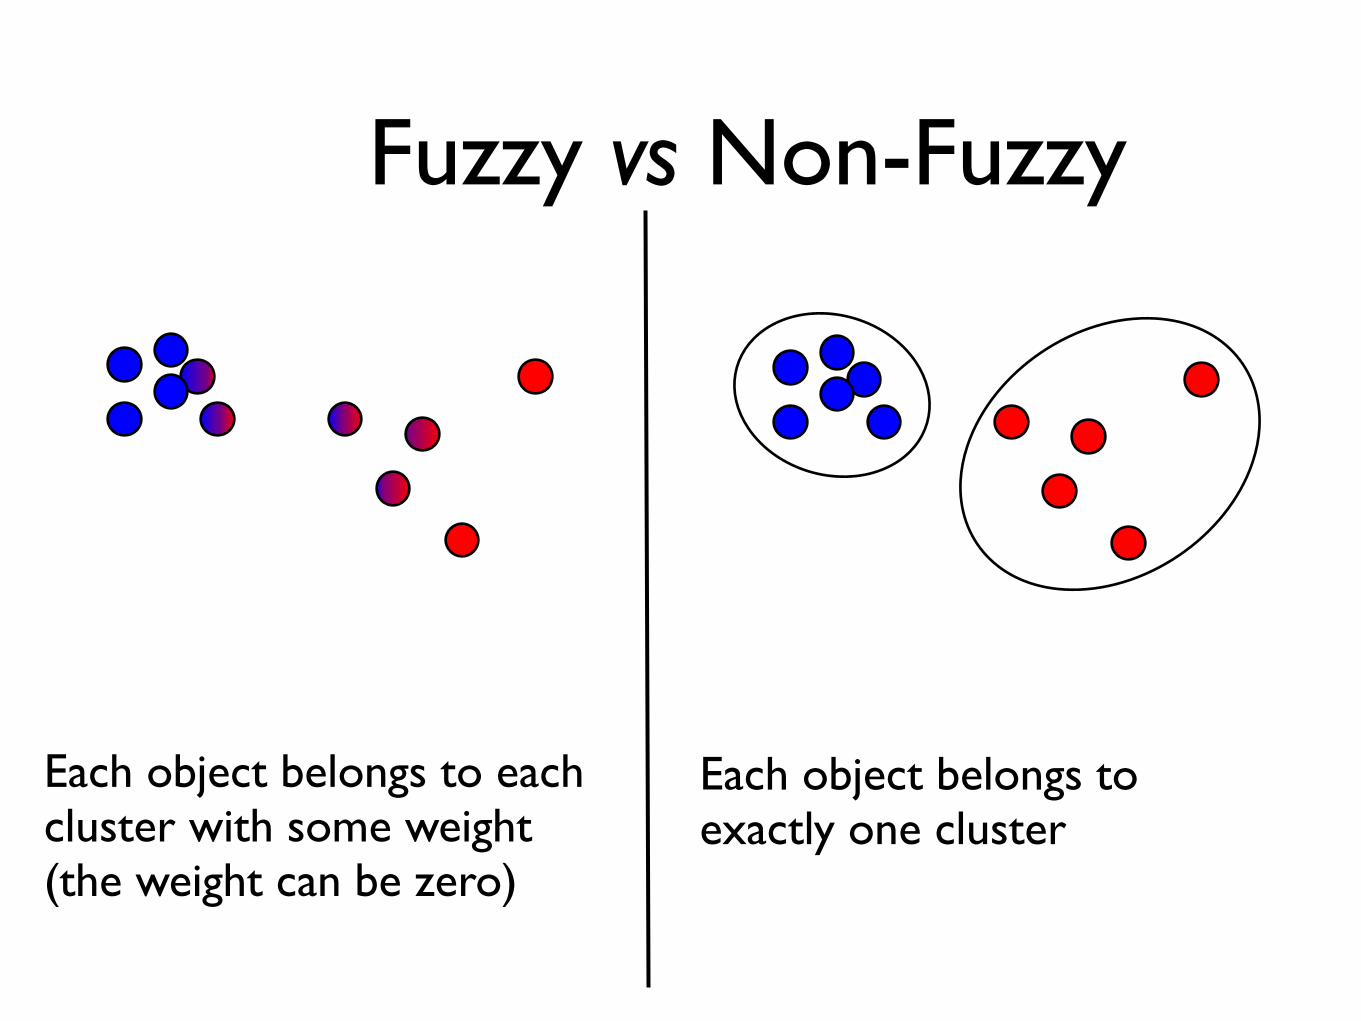
Fuzzy vs Non-Fuzzy
Each object belongs to eachcluster with some weight(the weight can be zero)
Each object belongs to exactly one cluster
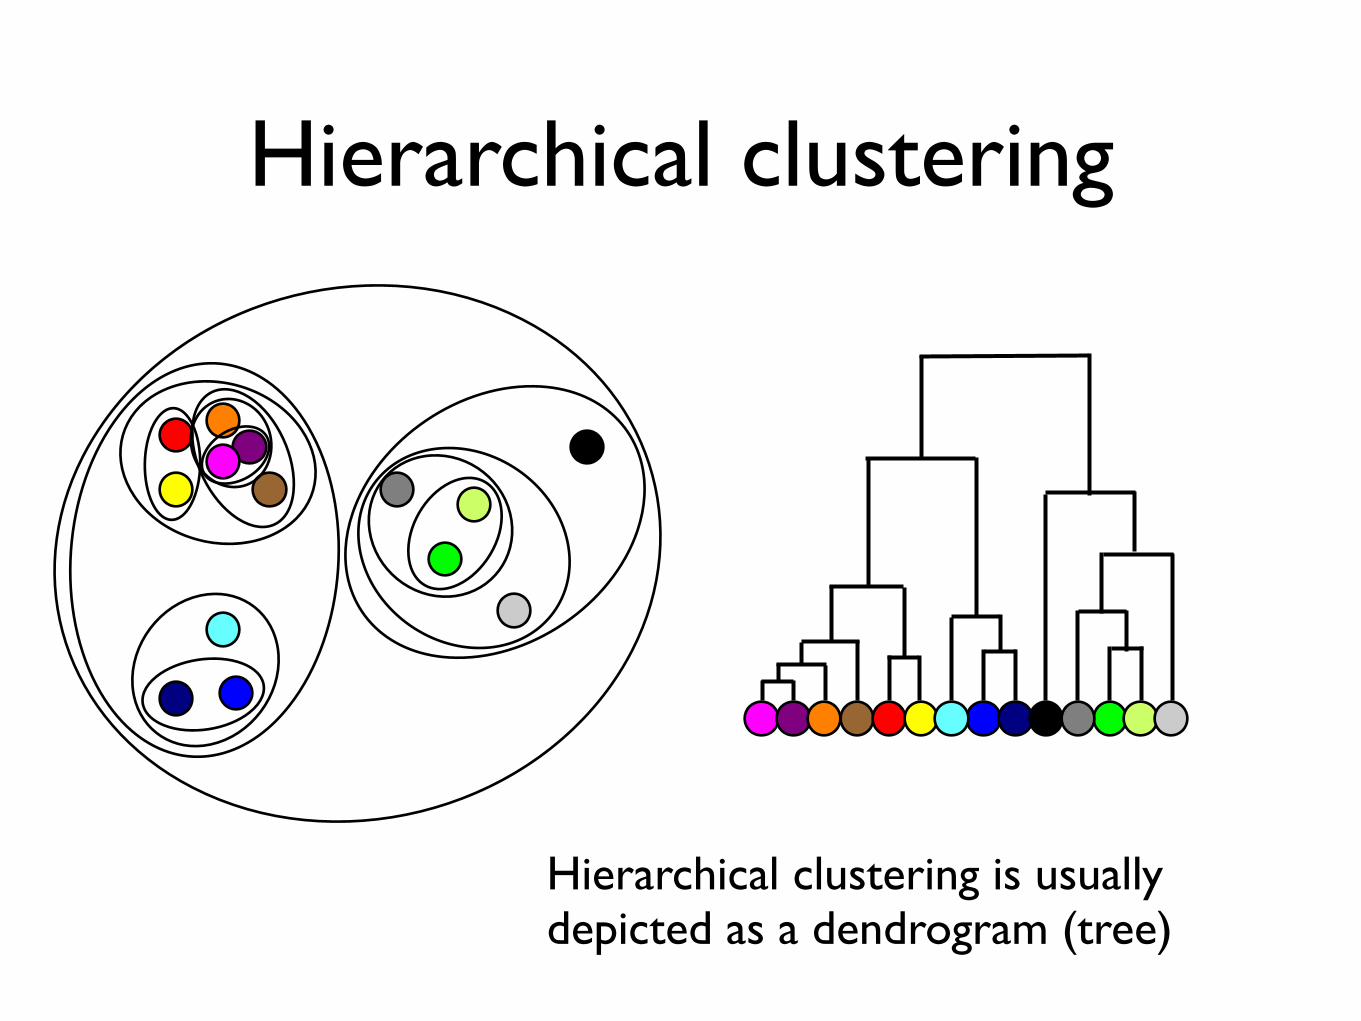
Hierarchical clustering
Hierarchical clustering is usually depicted as a dendrogram (tree)

Hierarchical clustering
• Each subtree corresponds to a cluster• Height of branching shows distance
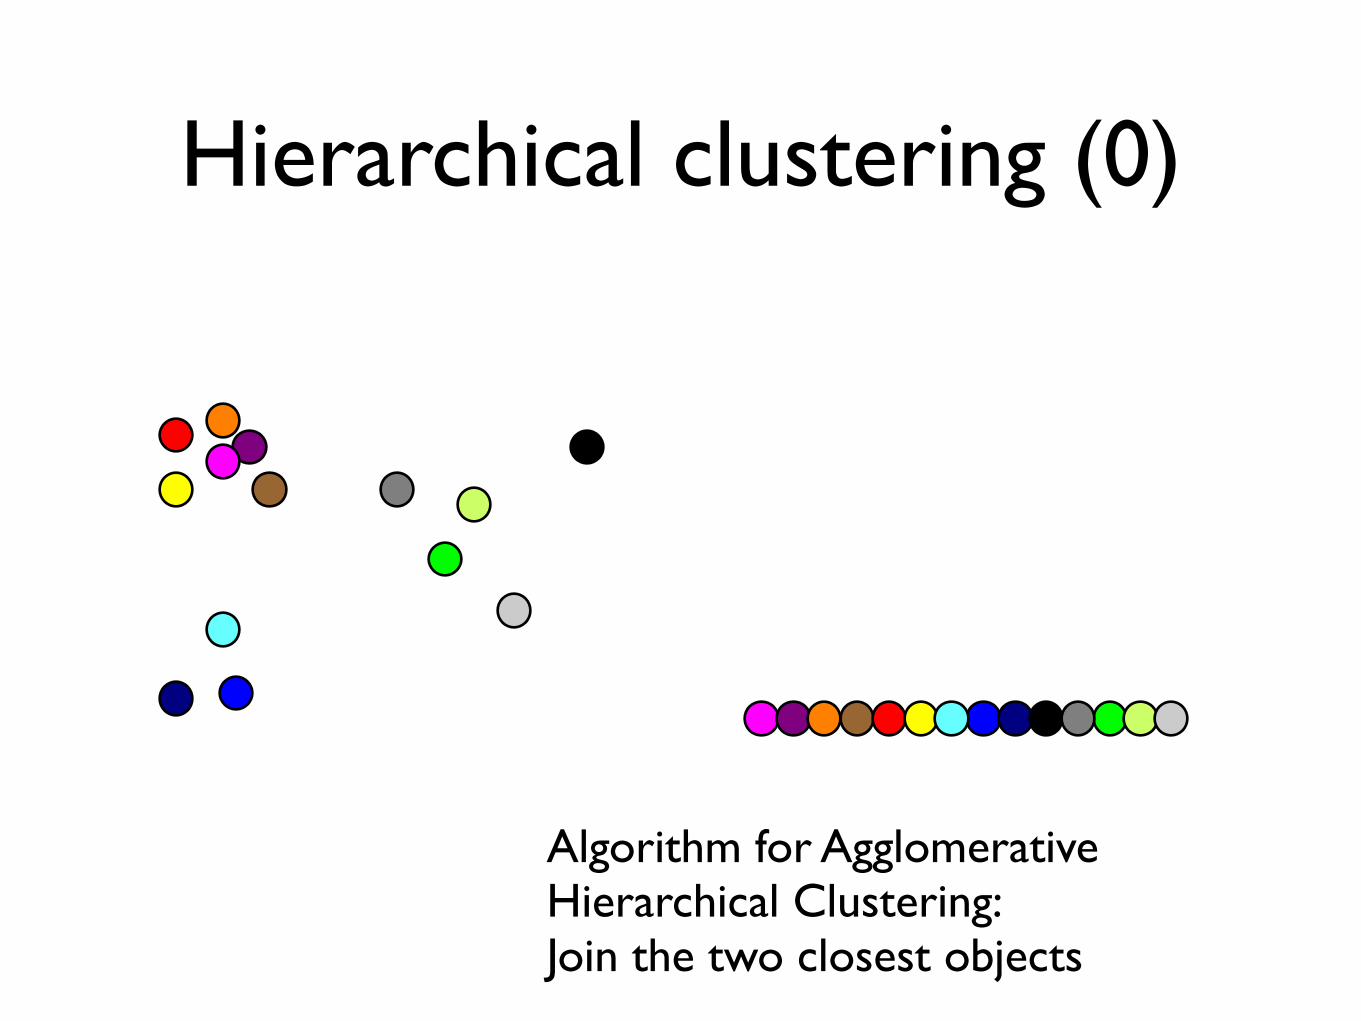
Hierarchical clustering (0)
Algorithm for Agglomerative Hierarchical Clustering:Join the two closest objects

Hierarchical clustering (1)
Join the two closest objects

Hierarchical clustering (2)
Keep joining the closest pairs
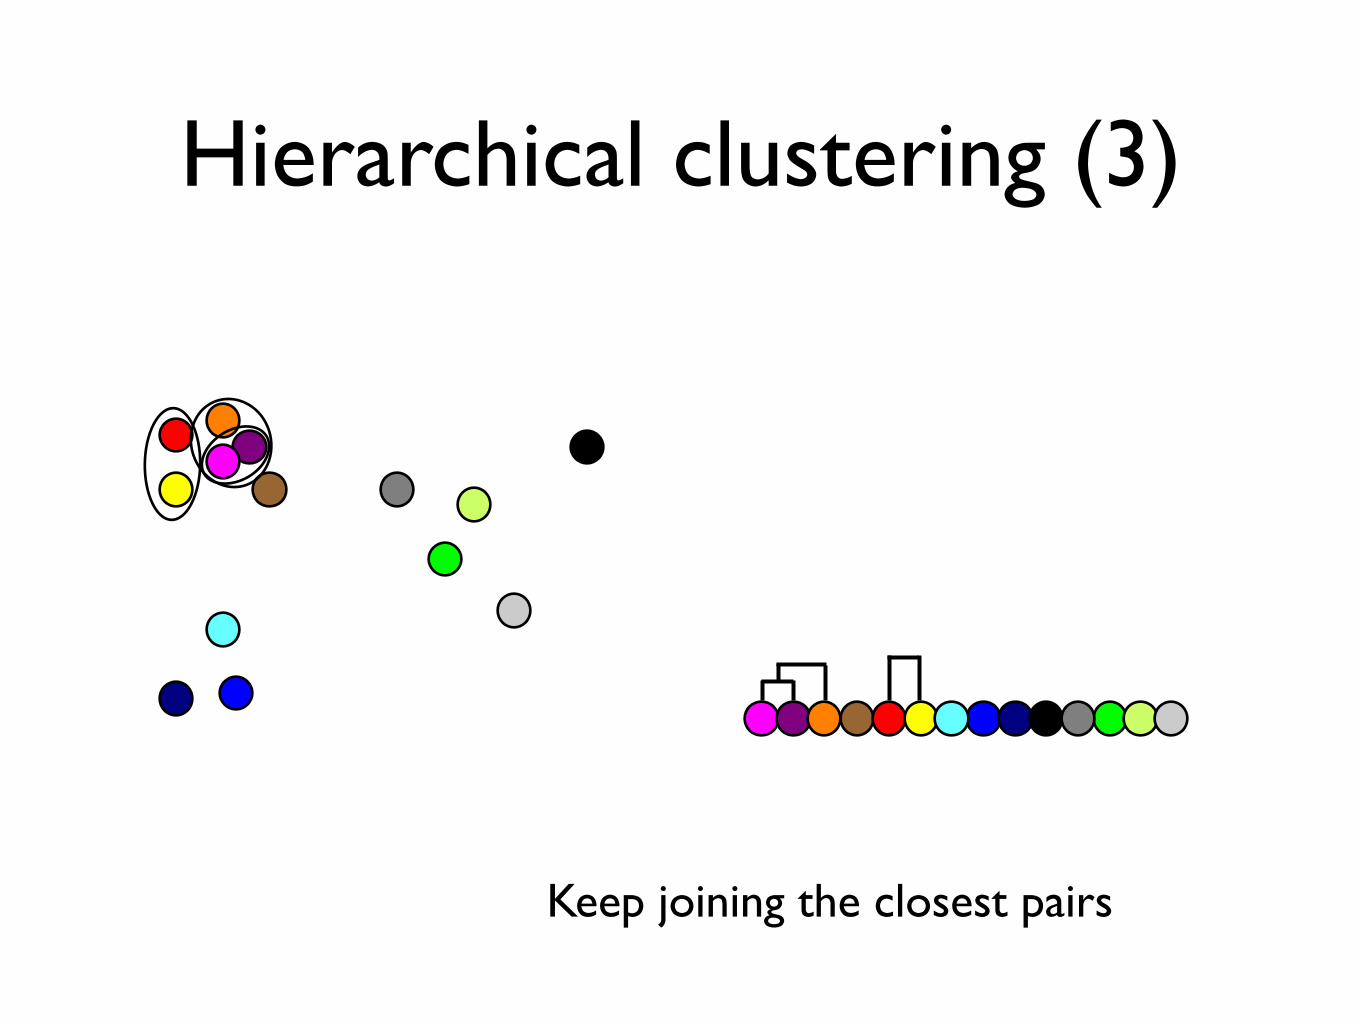
Hierarchical clustering (3)
Keep joining the closest pairs
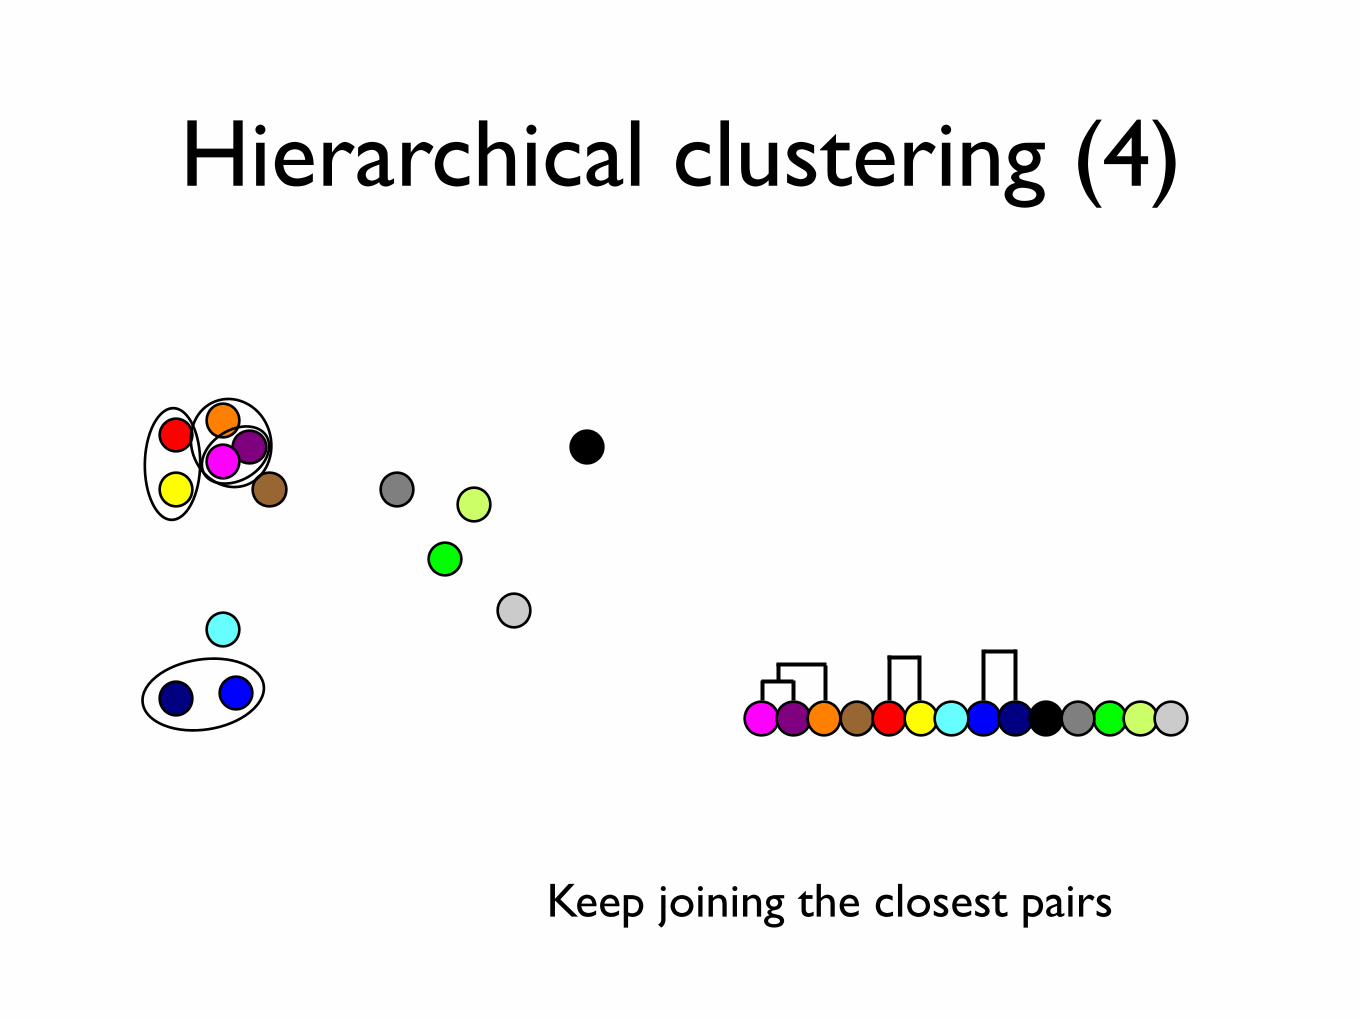
Hierarchical clustering (4)
Keep joining the closest pairs

Hierarchical clustering (5)
Keep joining the closest pairs
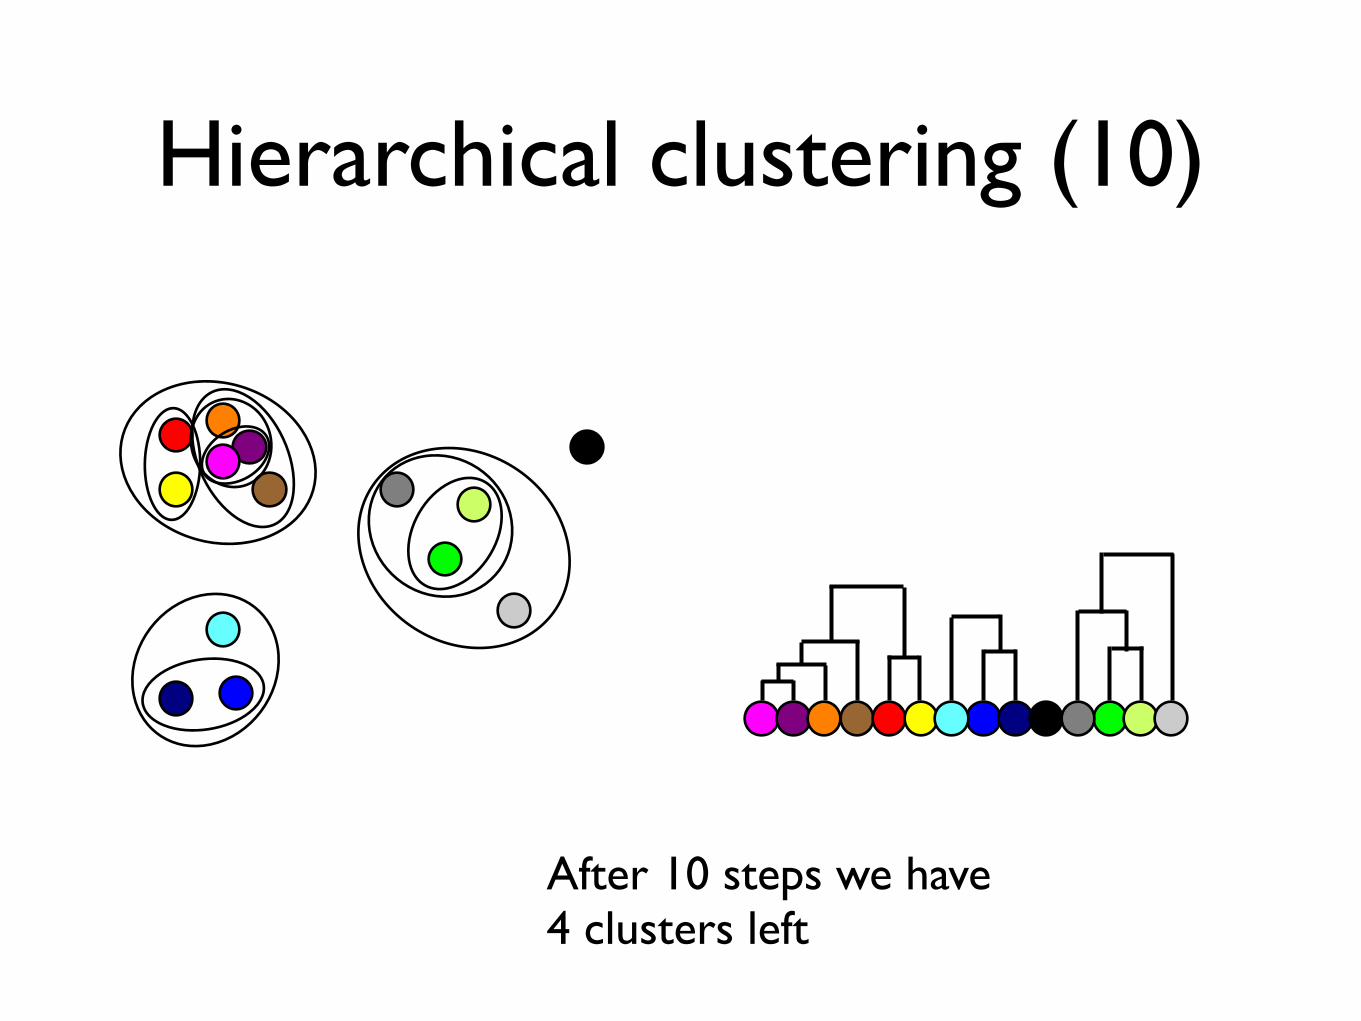
Hierarchical clustering (10)
After 10 steps we have 4 clusters left
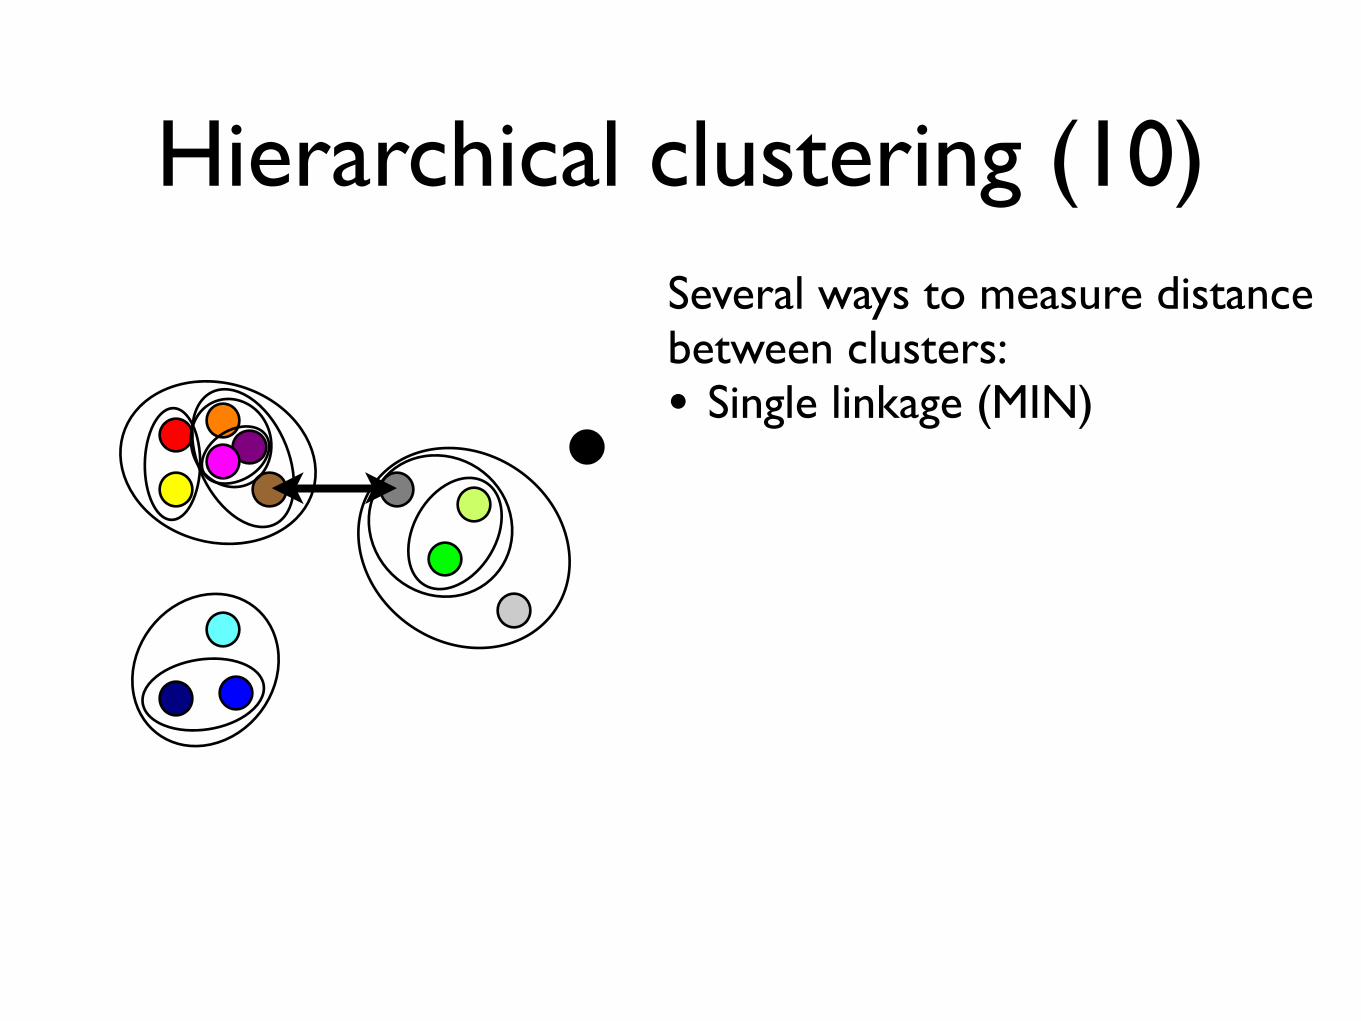
Hierarchical clustering (10)Several ways to measure distancebetween clusters:• Single linkage (MIN)

Hierarchical clustering (10)Several ways to measure distancebetween clusters:• Single linkage (MIN) • Complete linkage (MAX)
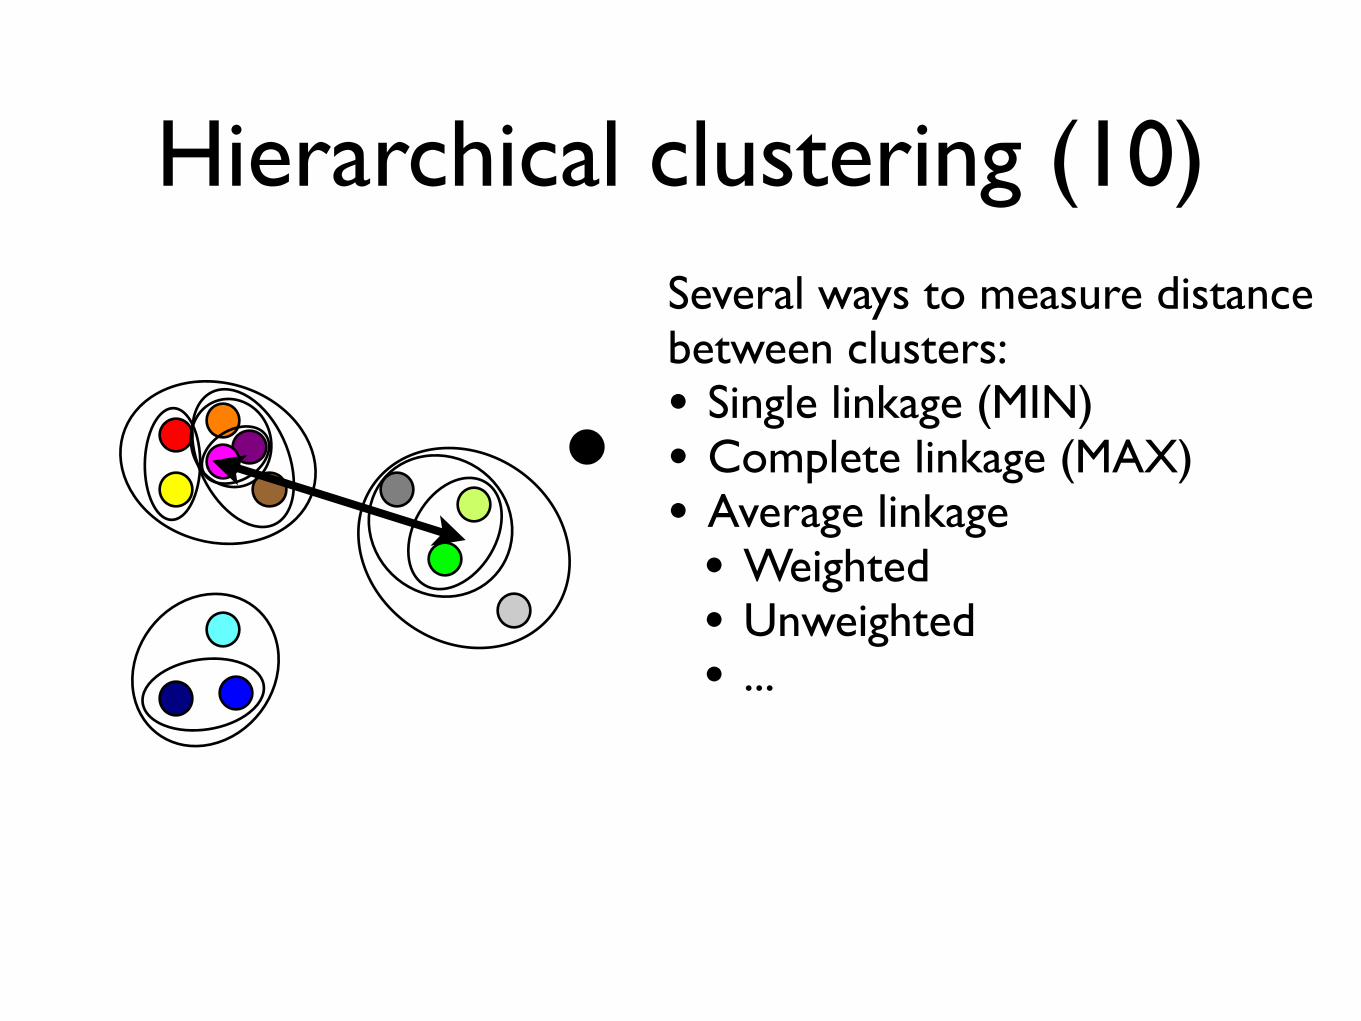
Hierarchical clustering (10)Several ways to measure distancebetween clusters:• Single linkage (MIN) • Complete linkage (MAX)• Average linkage• Weighted• Unweighted• ...
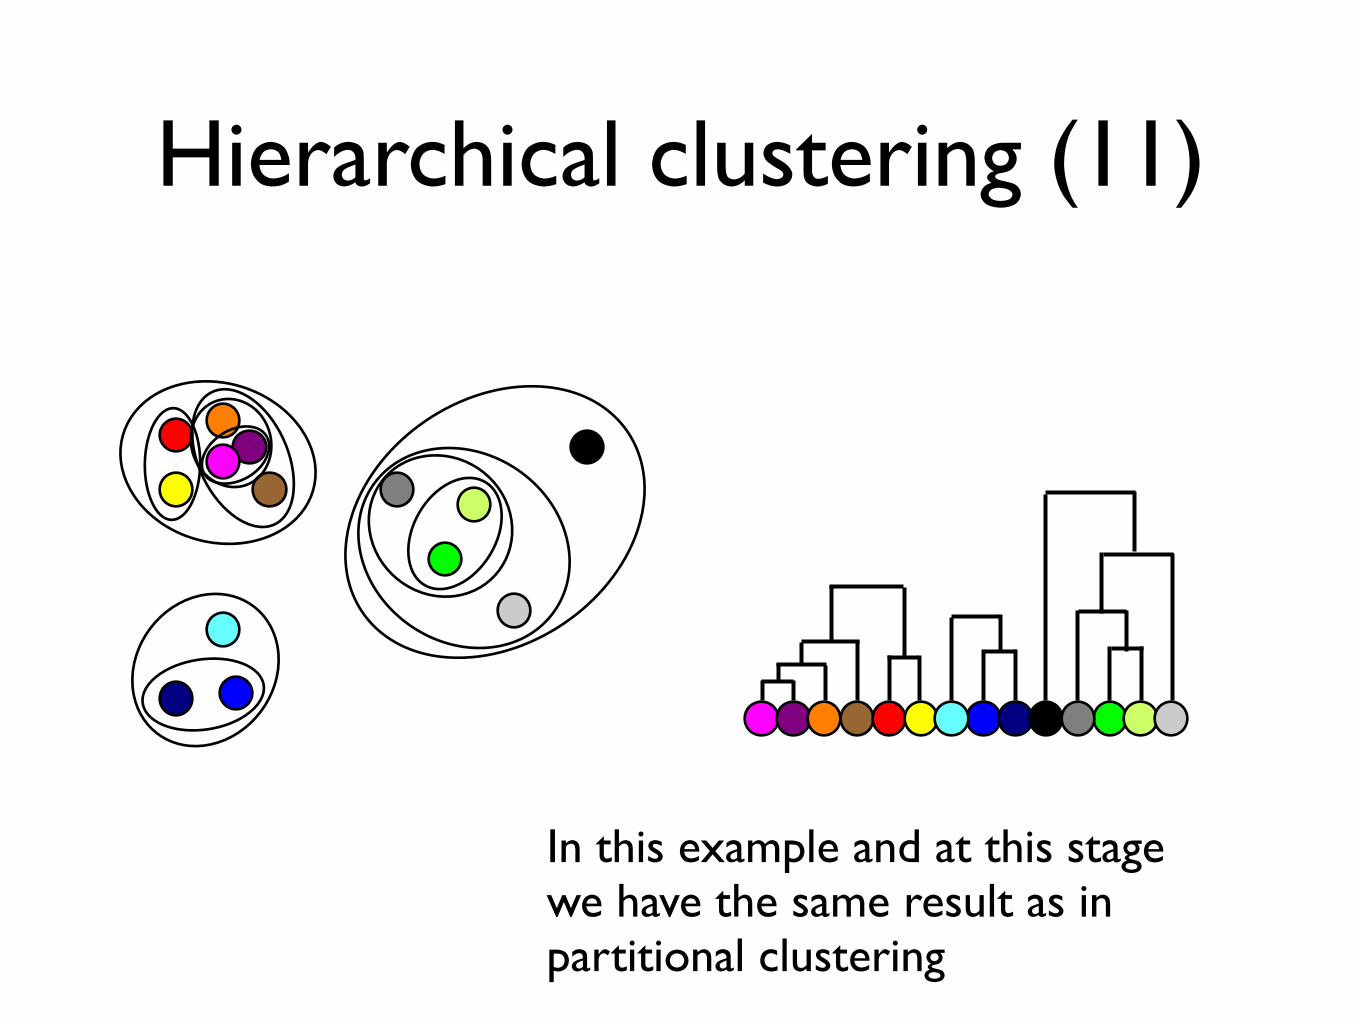
Hierarchical clustering (11)
In this example and at this stage we have the same result as in partitional clustering

Hierarchical clustering (12)
In the final step the two remaining clusters are joined into a single cluster
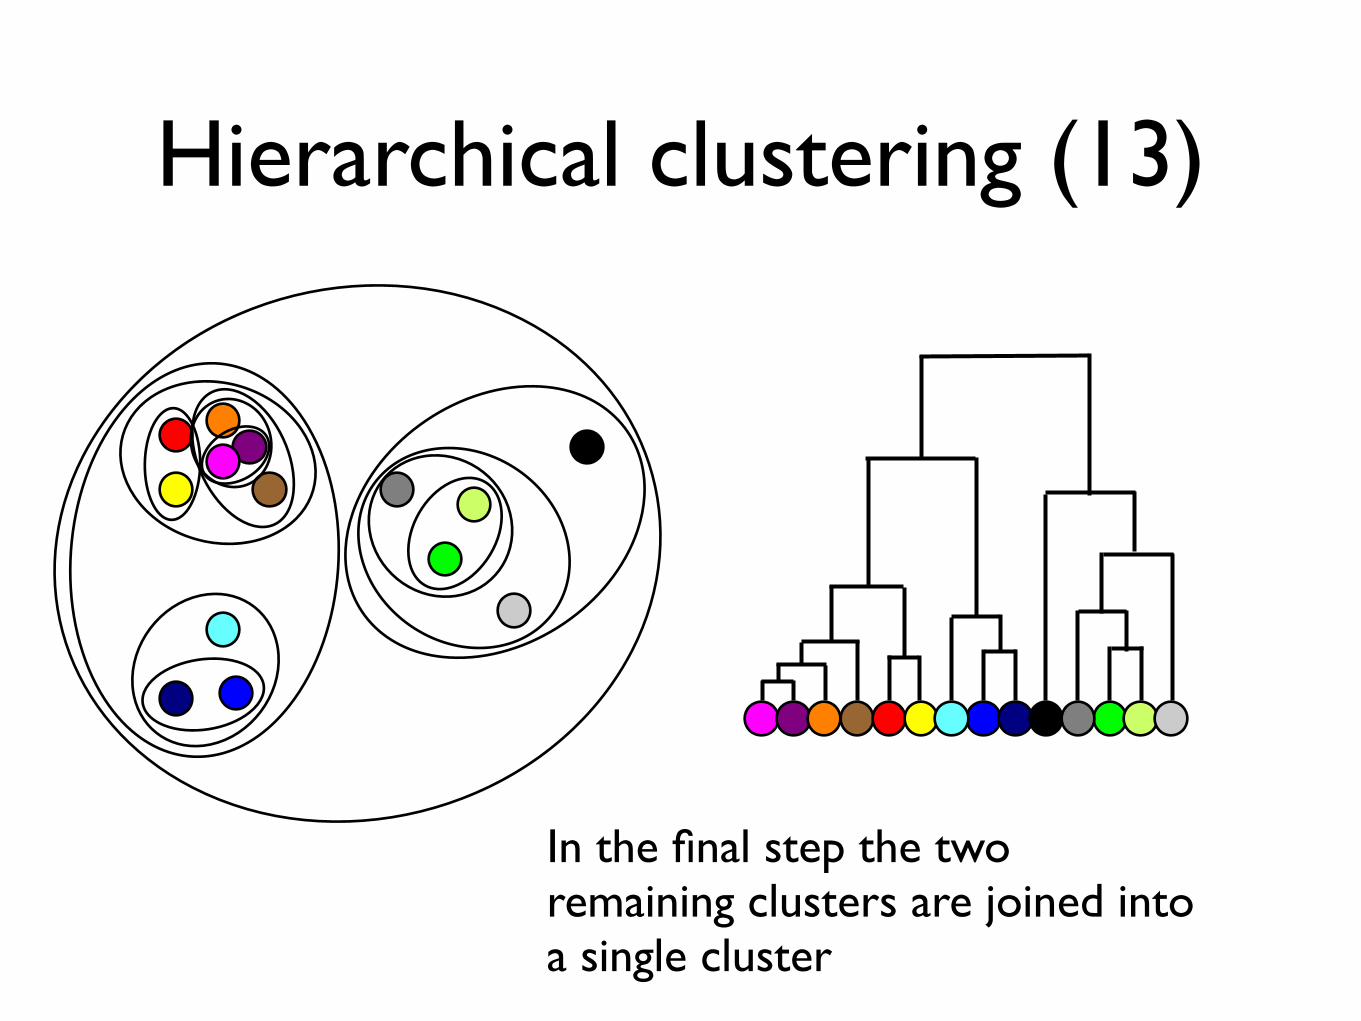
Hierarchical clustering (13)
In the final step the two remaining clusters are joined into a single cluster

Examples of Hierarchical Clustering in Bioinformatics
PhylogenyGene expression clustering
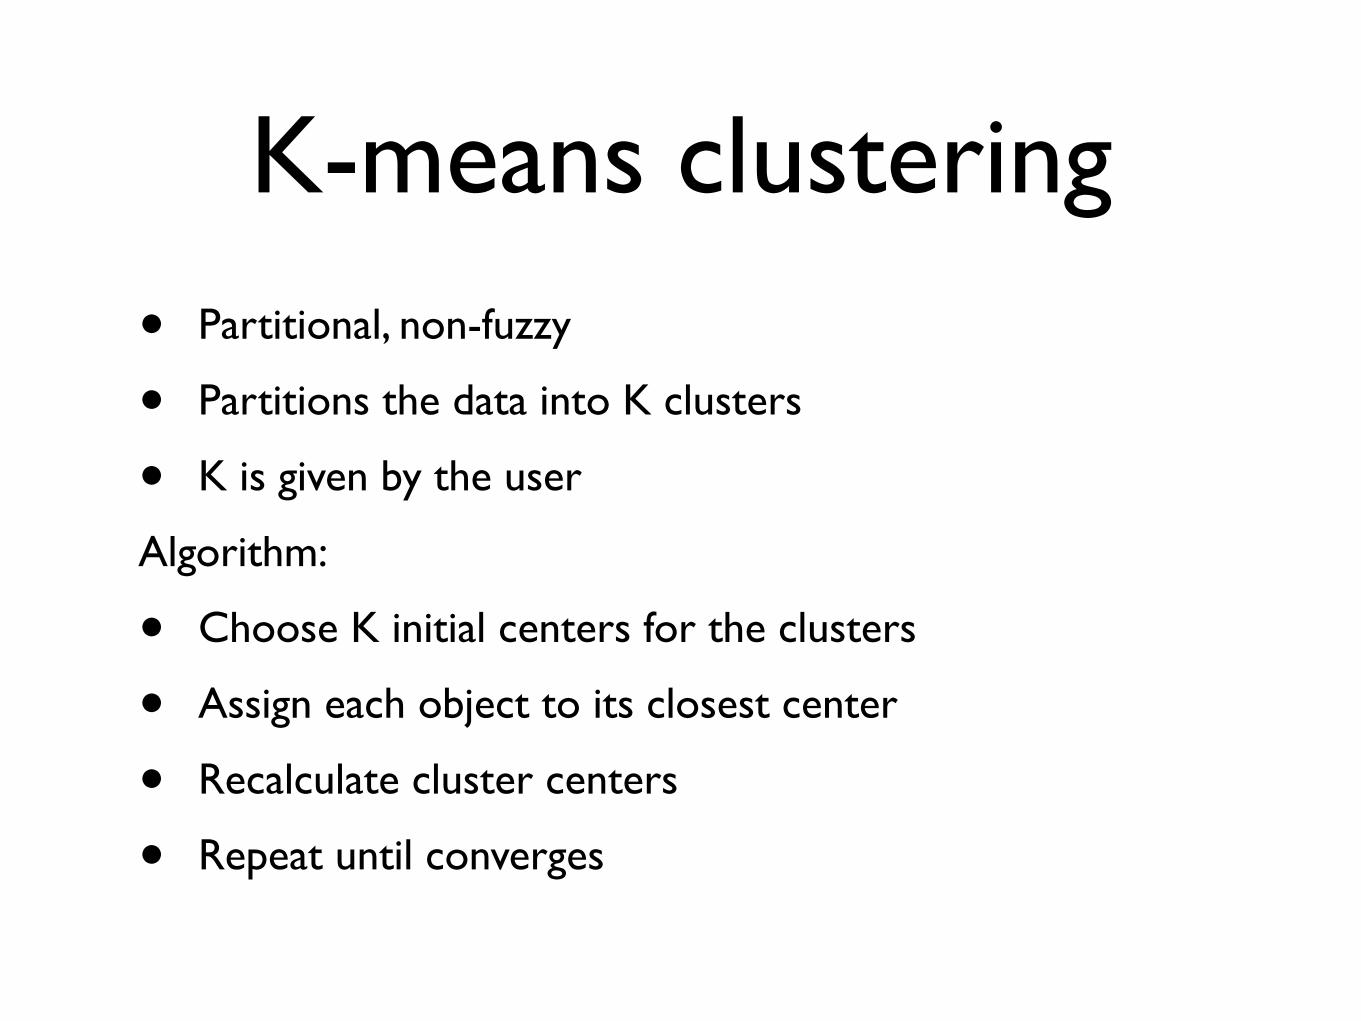
• Partitional, non-fuzzy
• Partitions the data into K clusters
• K is given by the user
Algorithm:
• Choose K initial centers for the clusters
• Assign each object to its closest center
• Recalculate cluster centers
• Repeat until converges
K-means clustering
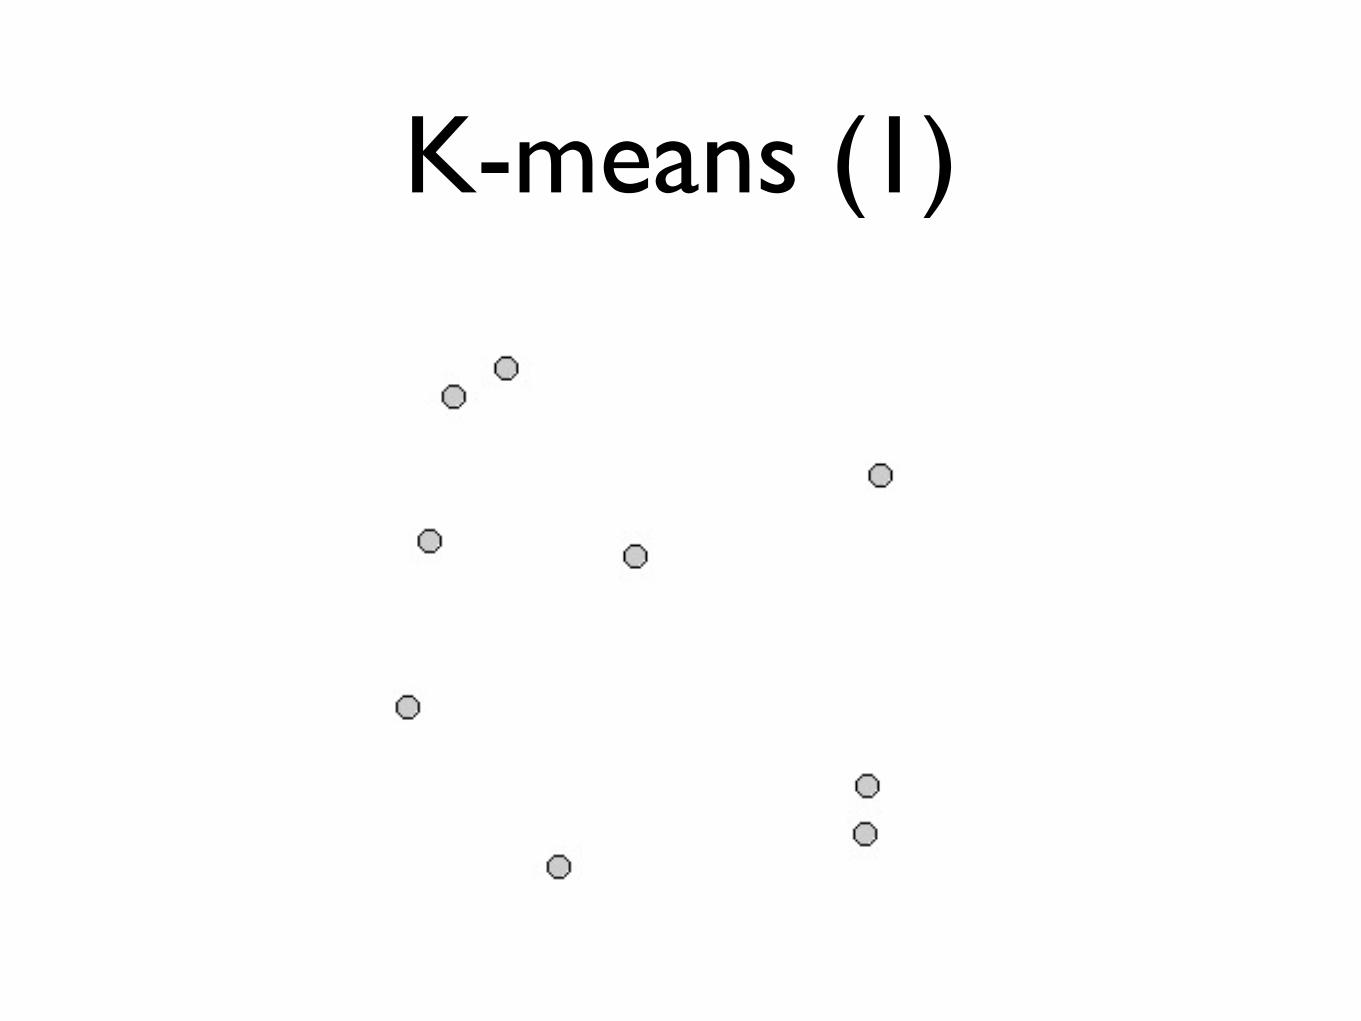
K-means (1)
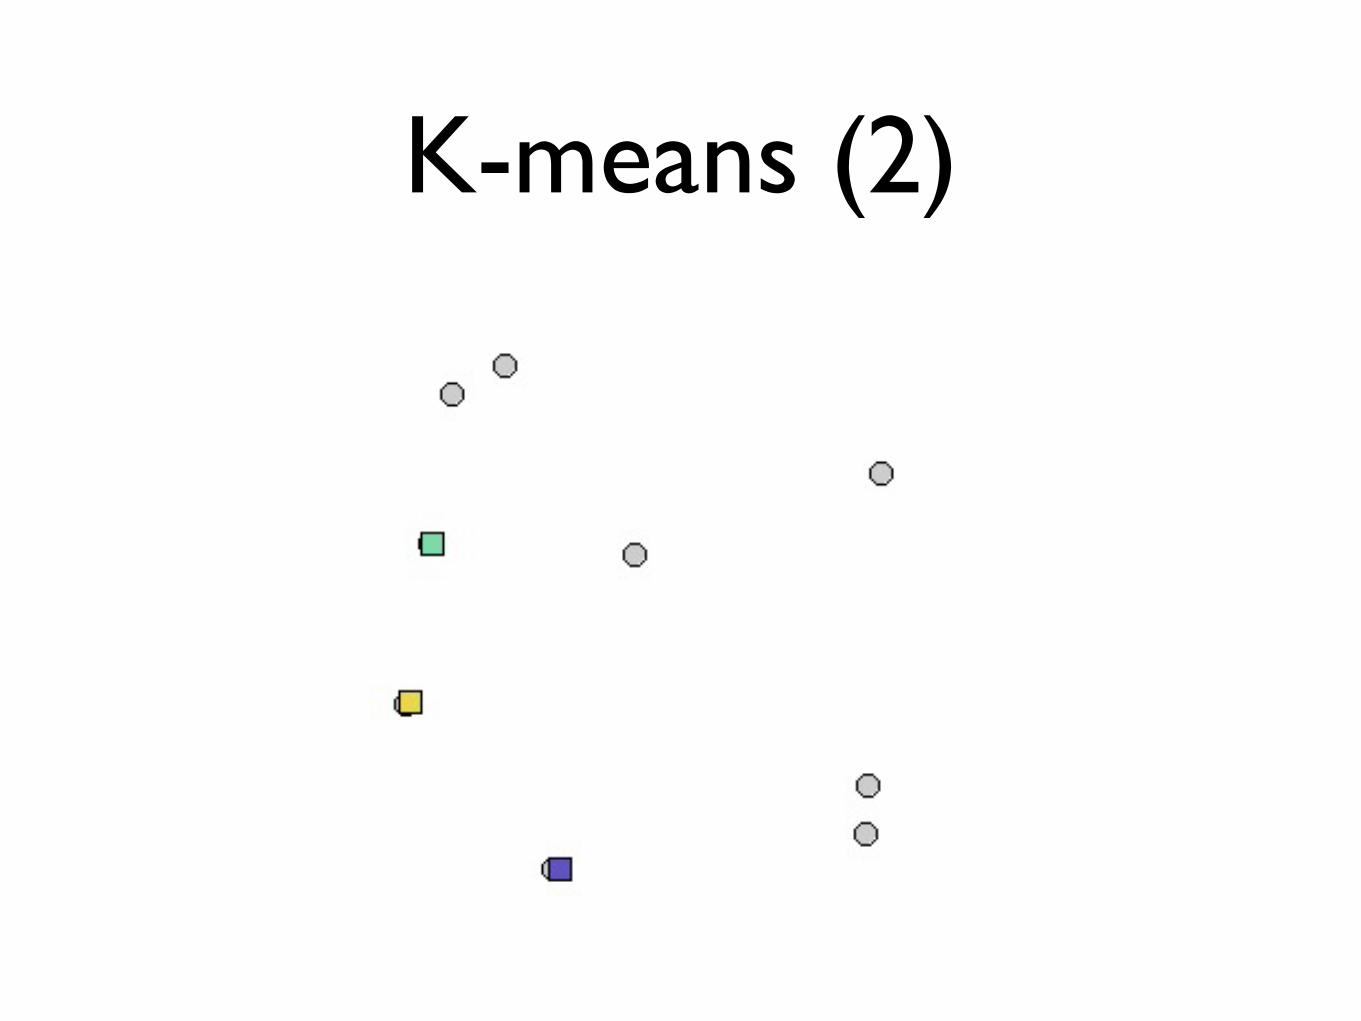
K-means (2)
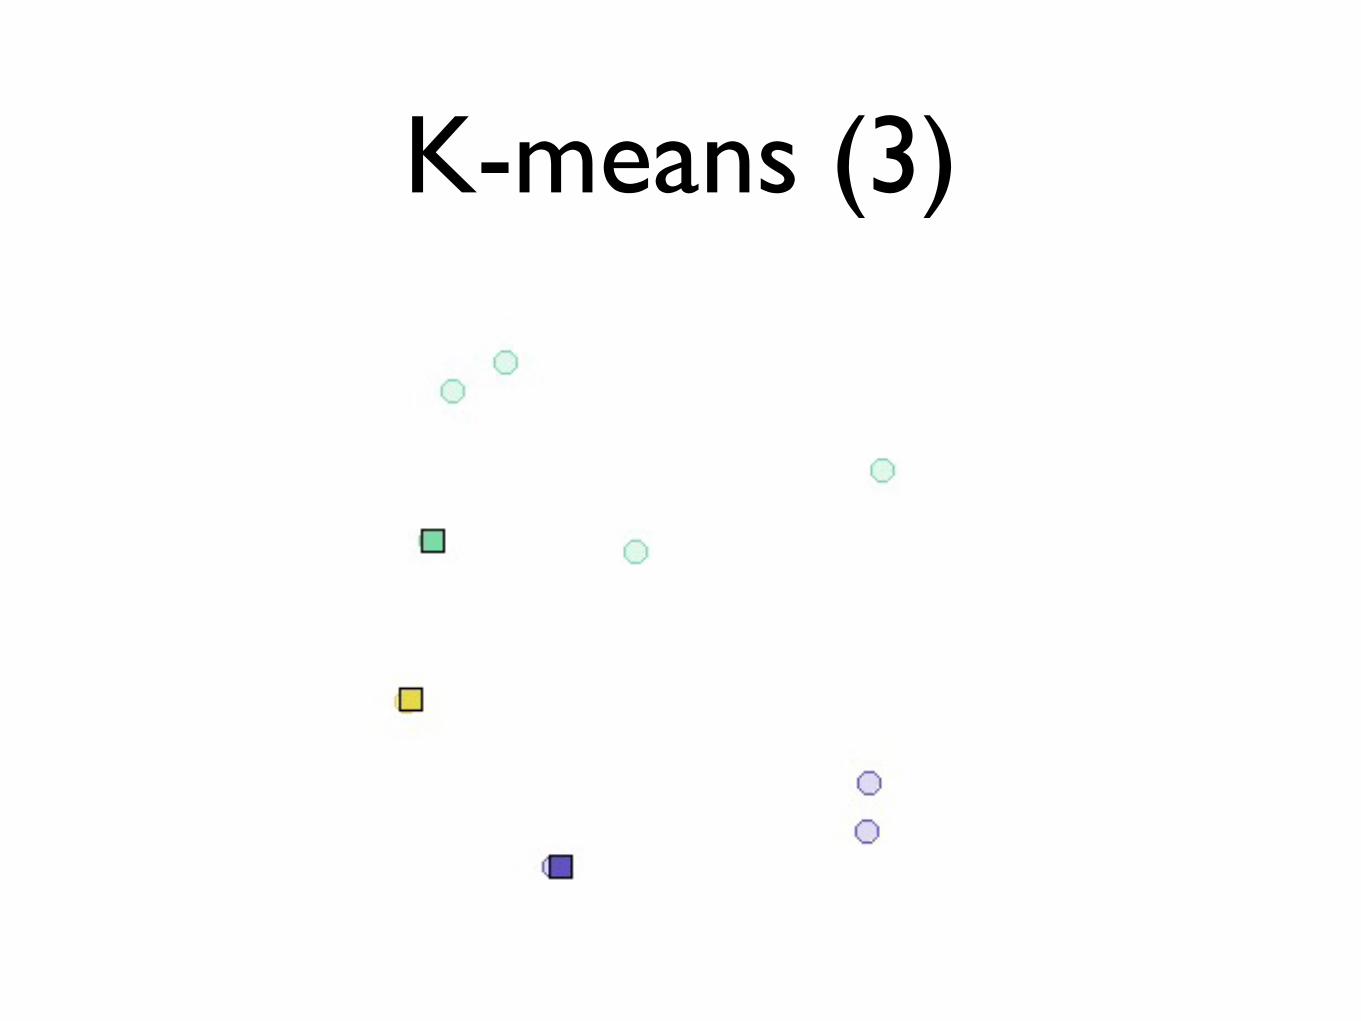
K-means (3)

K-means (4)
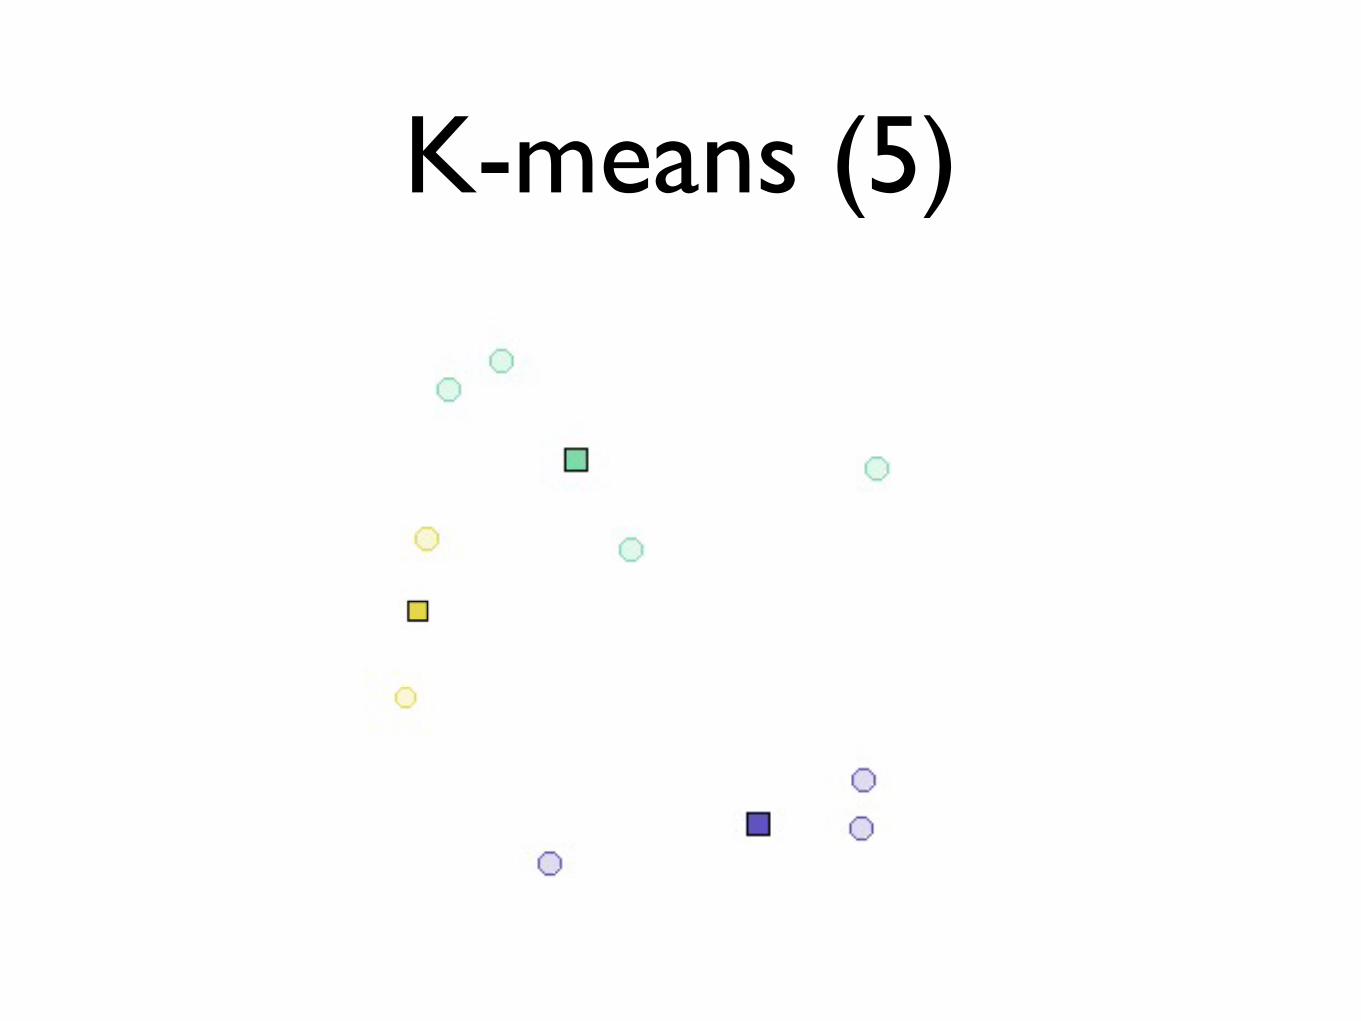
K-means (5)
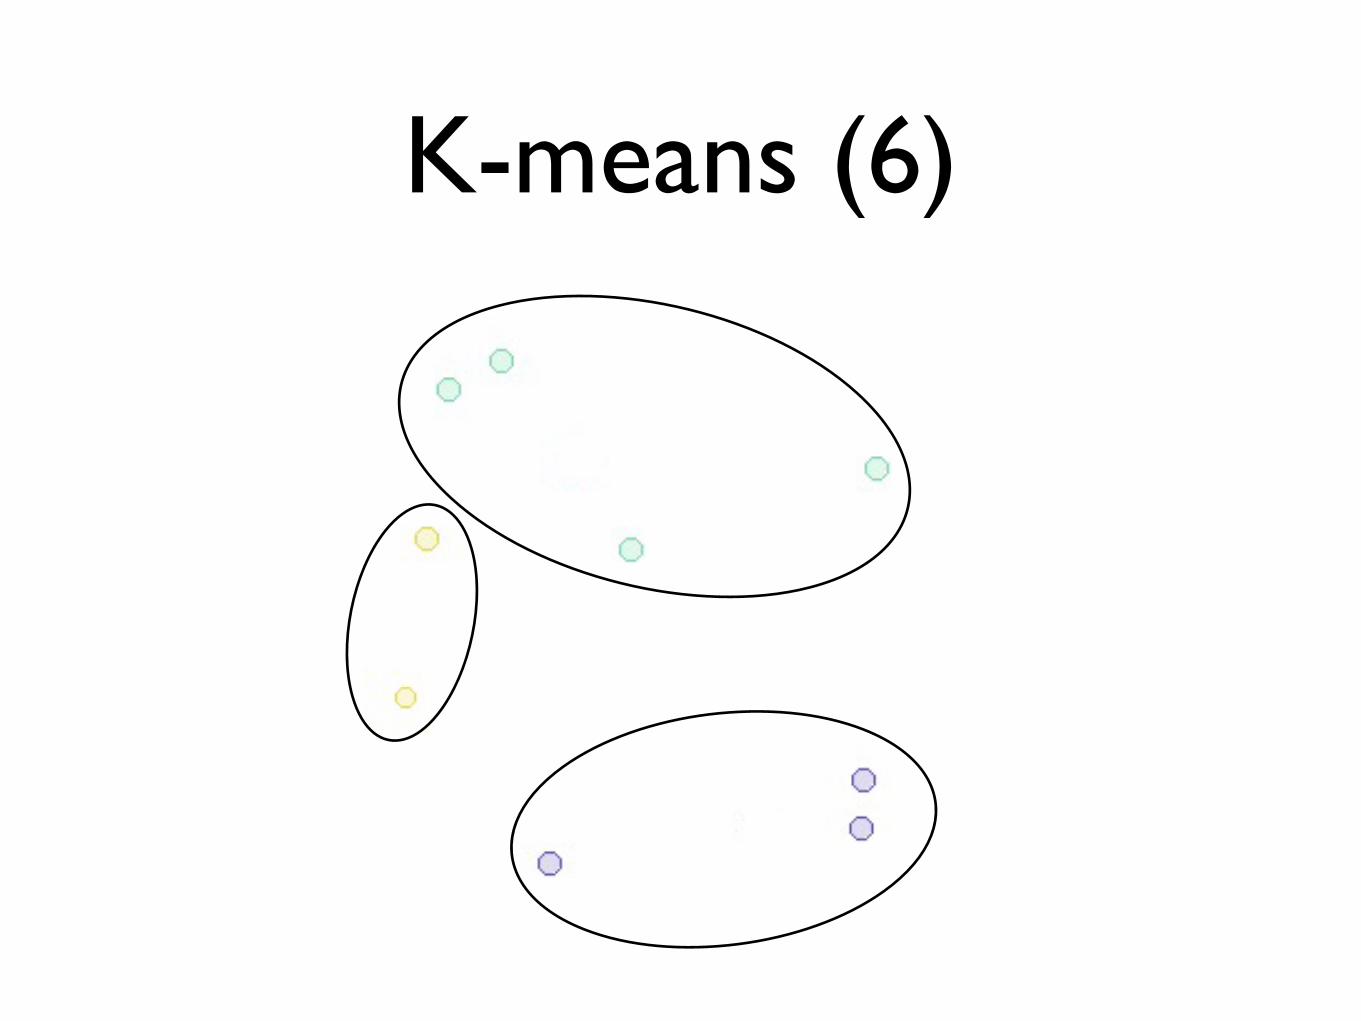
K-means (6)
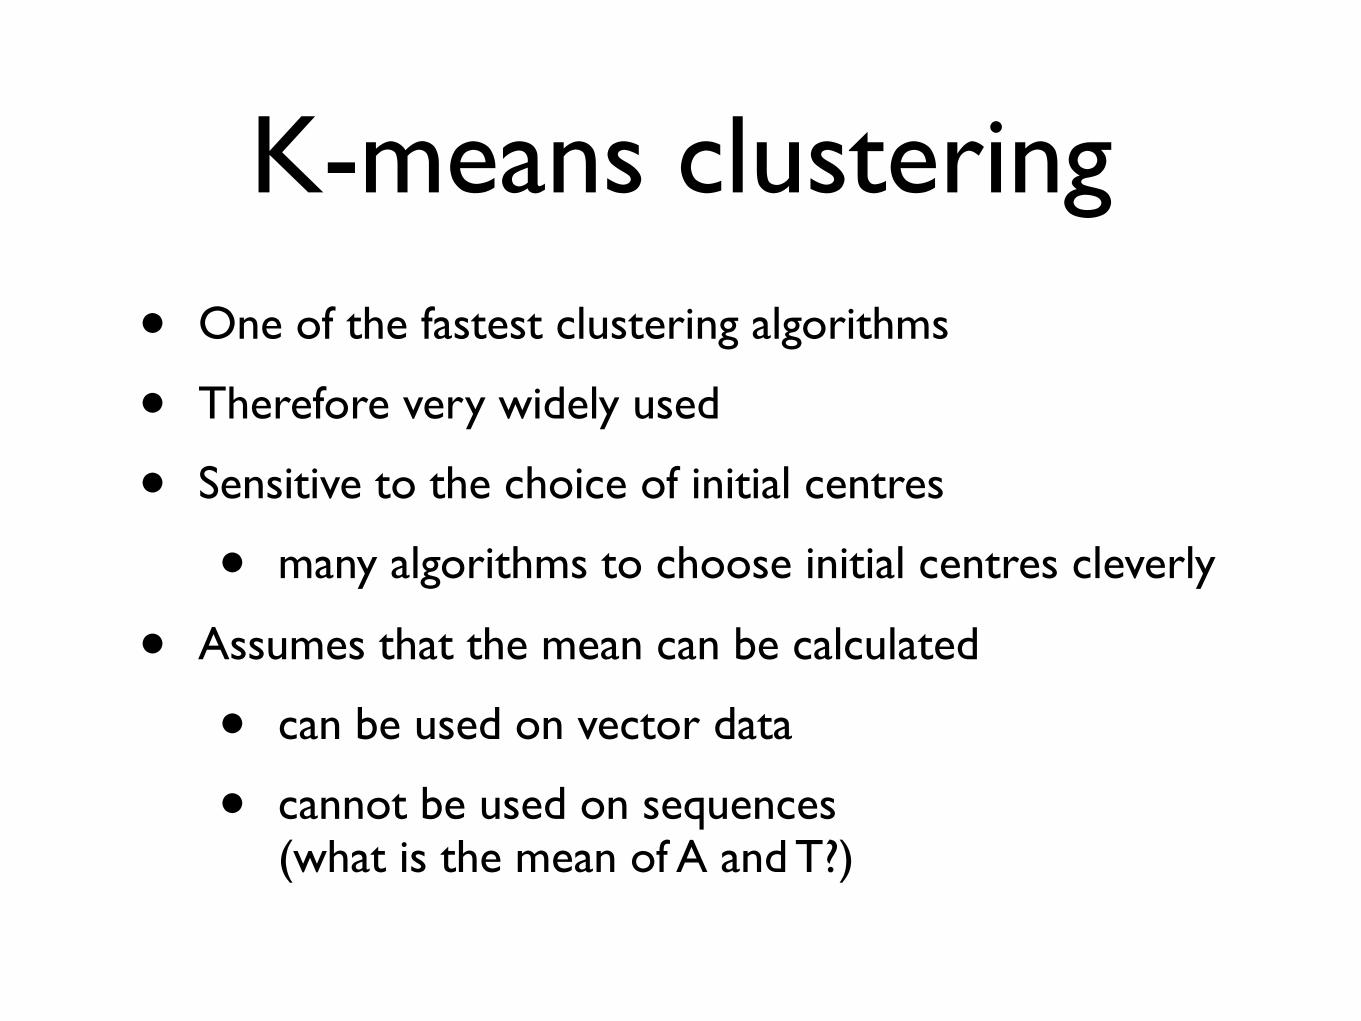
• One of the fastest clustering algorithms
• Therefore very widely used
• Sensitive to the choice of initial centres
• many algorithms to choose initial centres cleverly
• Assumes that the mean can be calculated
• can be used on vector data
• cannot be used on sequences (what is the mean of A and T?)
K-means clustering
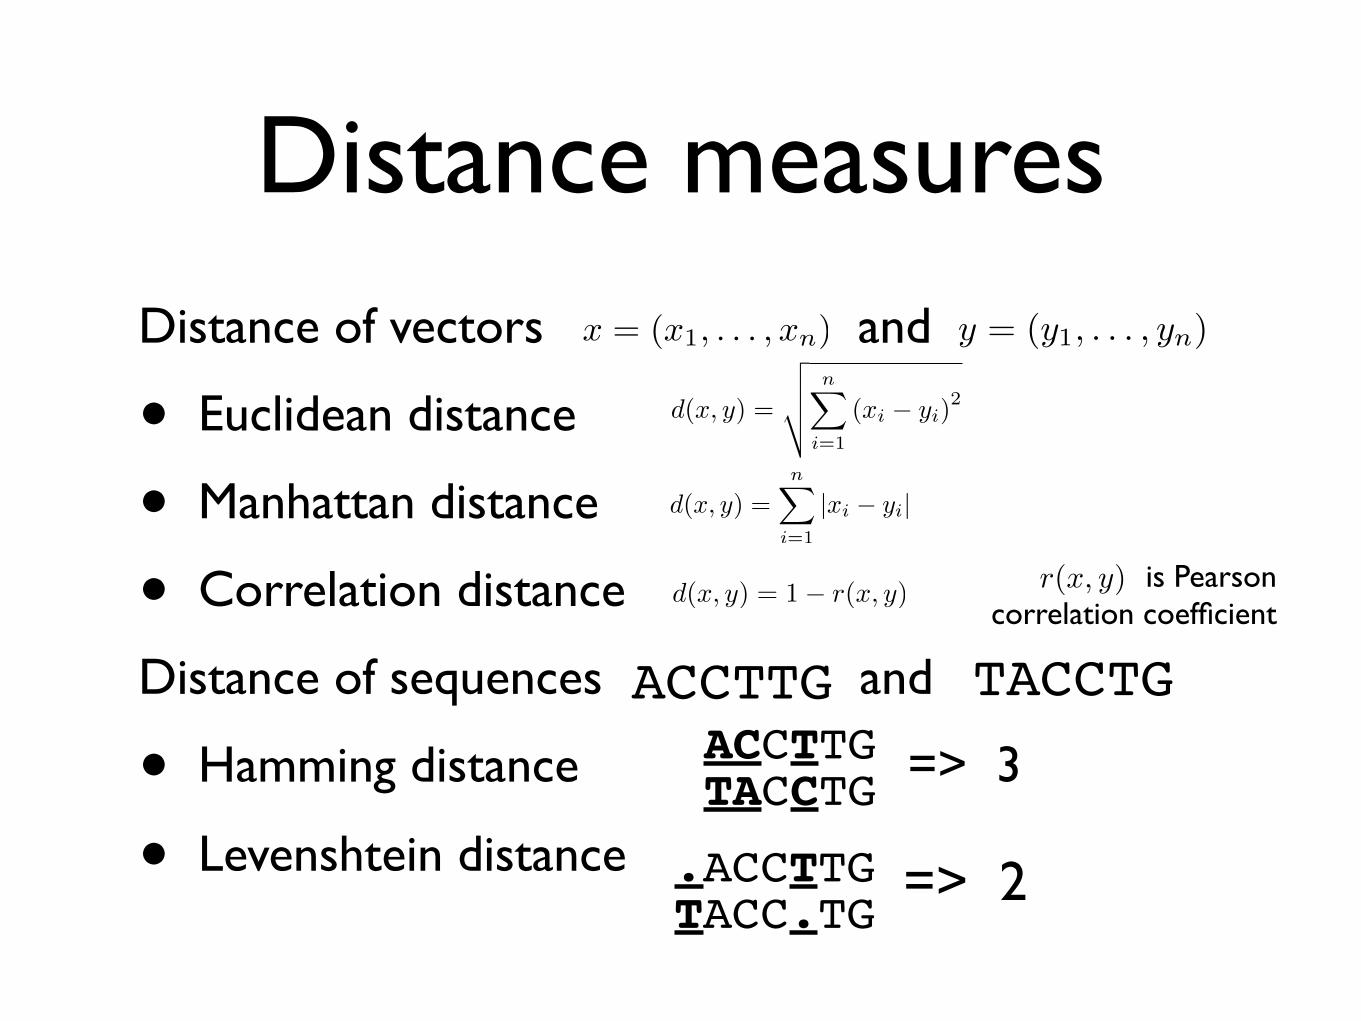
Distance measuresDistance of vectors and
• Euclidean distance
• Manhattan distance
• Correlation distance
Distance of sequences and
• Hamming distance => 3
• Levenshtein distance
x = (x1, . . . , xn) y = (y1, . . . , yn)
d(x, y) =
����n�
i=1
(xi − yi)2
d(x, y) =n�
i=1
|xi − yi|
d(x, y) = 1− r(x, y)is Pearson
correlation coefficientr(x, y)
ACCTTG TACCTGACCTTGTACCTG
.ACCTTGTACC.TG => 2
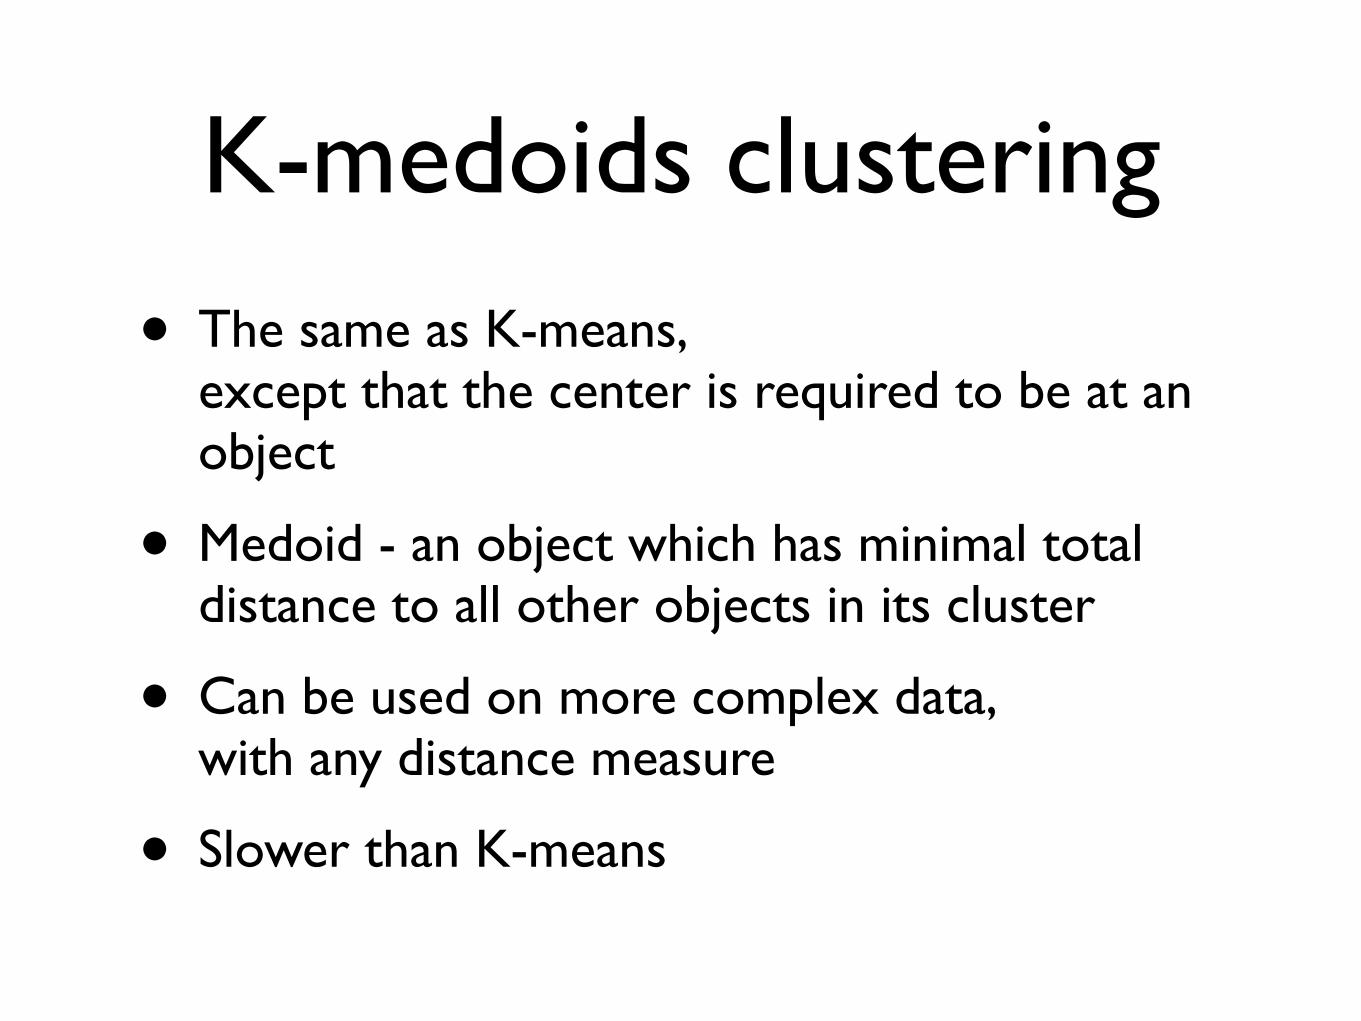
• The same as K-means, except that the center is required to be at an object
• Medoid - an object which has minimal total distance to all other objects in its cluster
• Can be used on more complex data, with any distance measure
• Slower than K-means
K-medoids clustering

K-medoids (1)
K-medoids (2)

K-medoids (3)

K-medoids (4)

K-medoids (5)
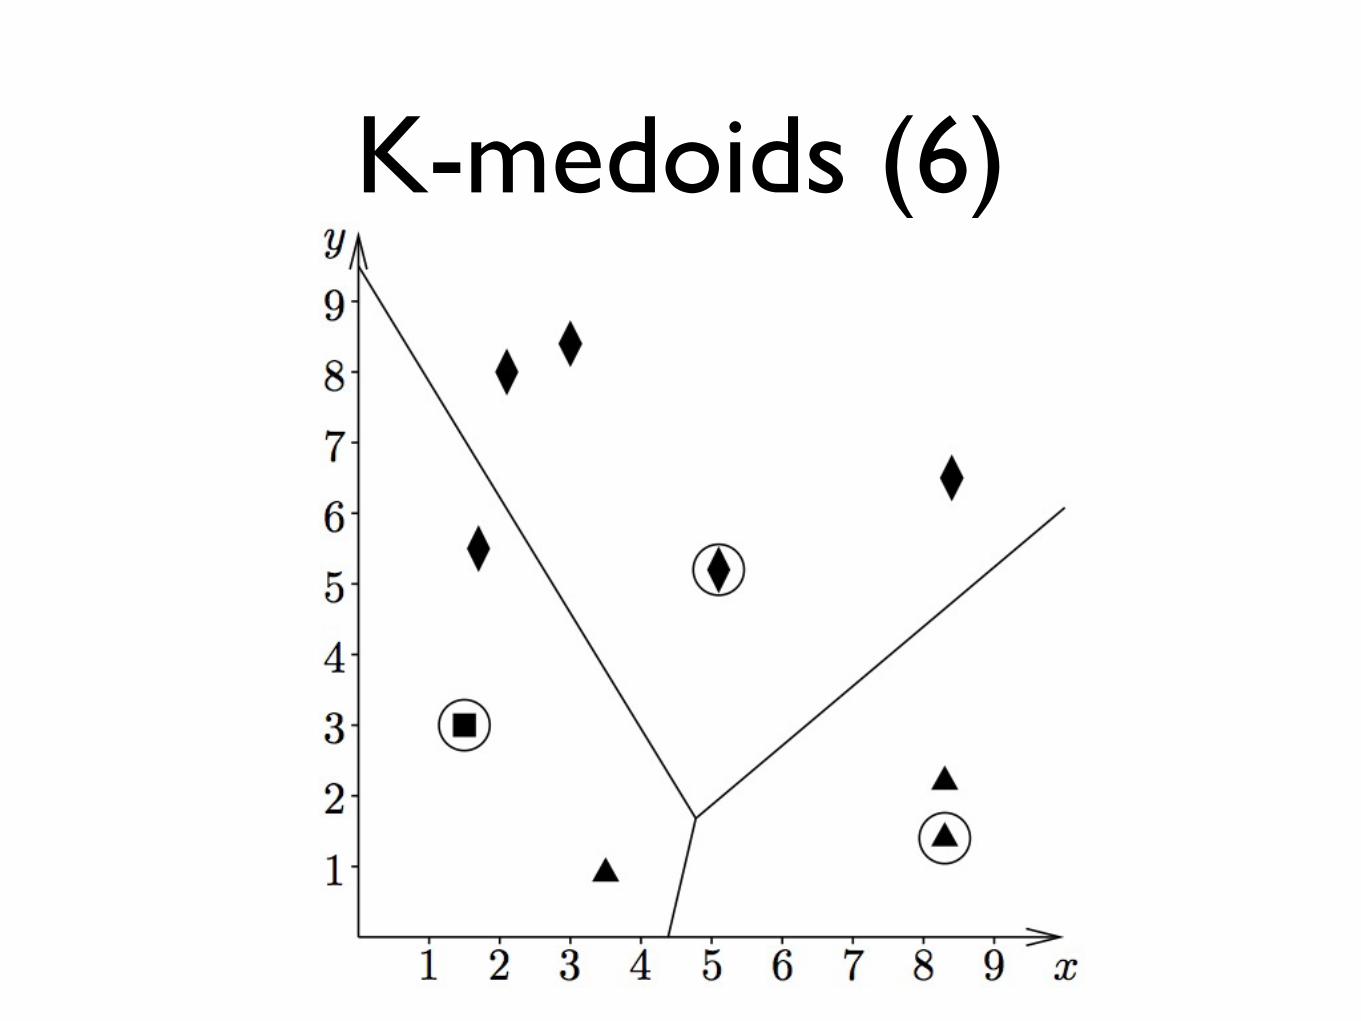
K-medoids (6)
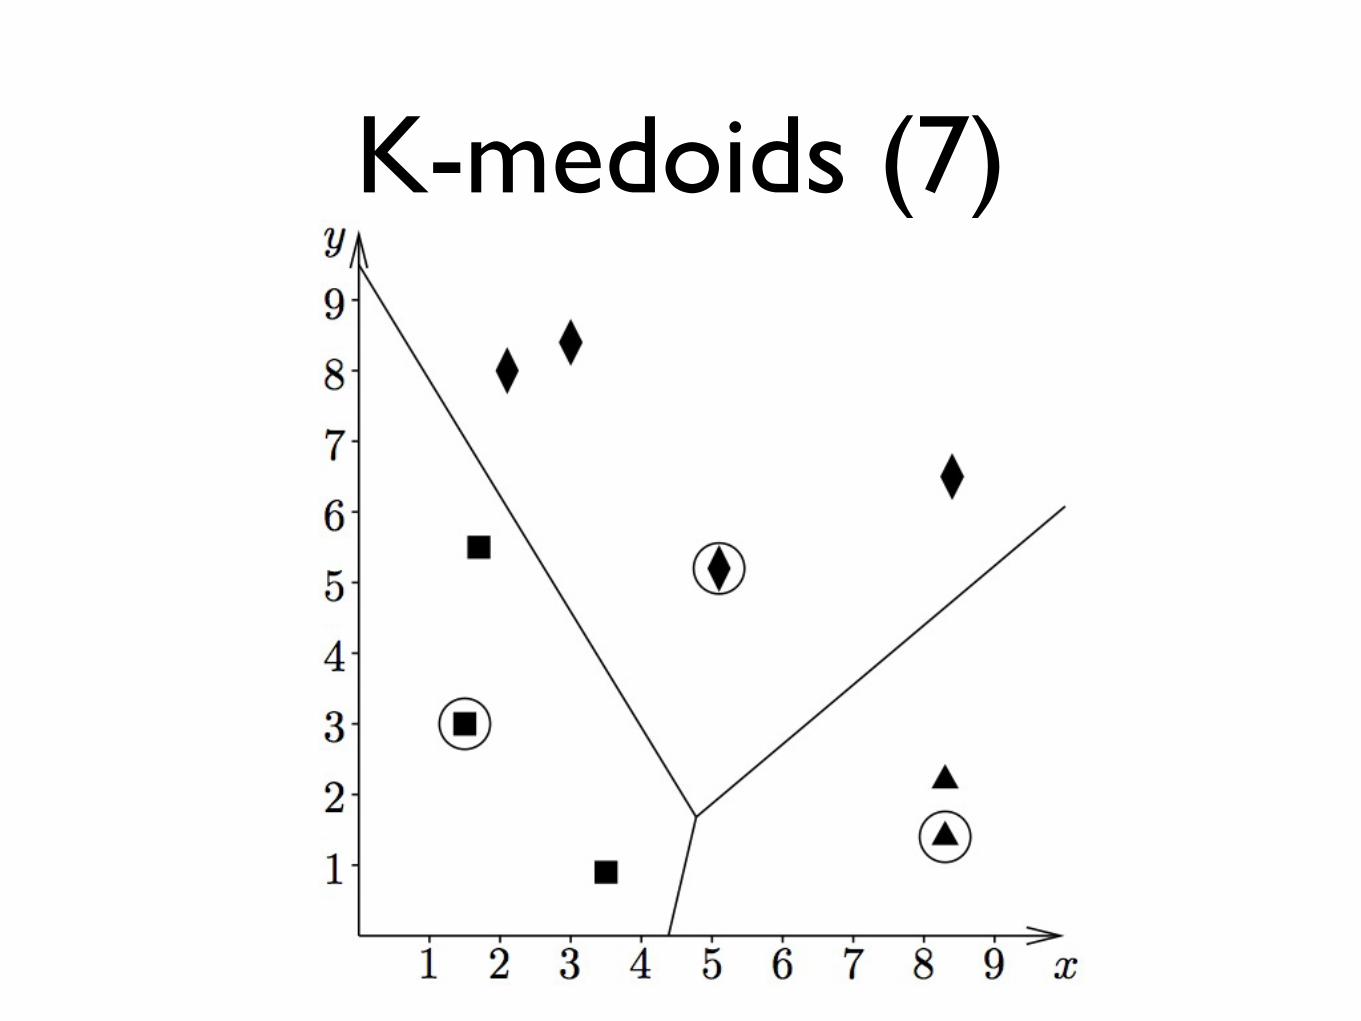
K-medoids (7)
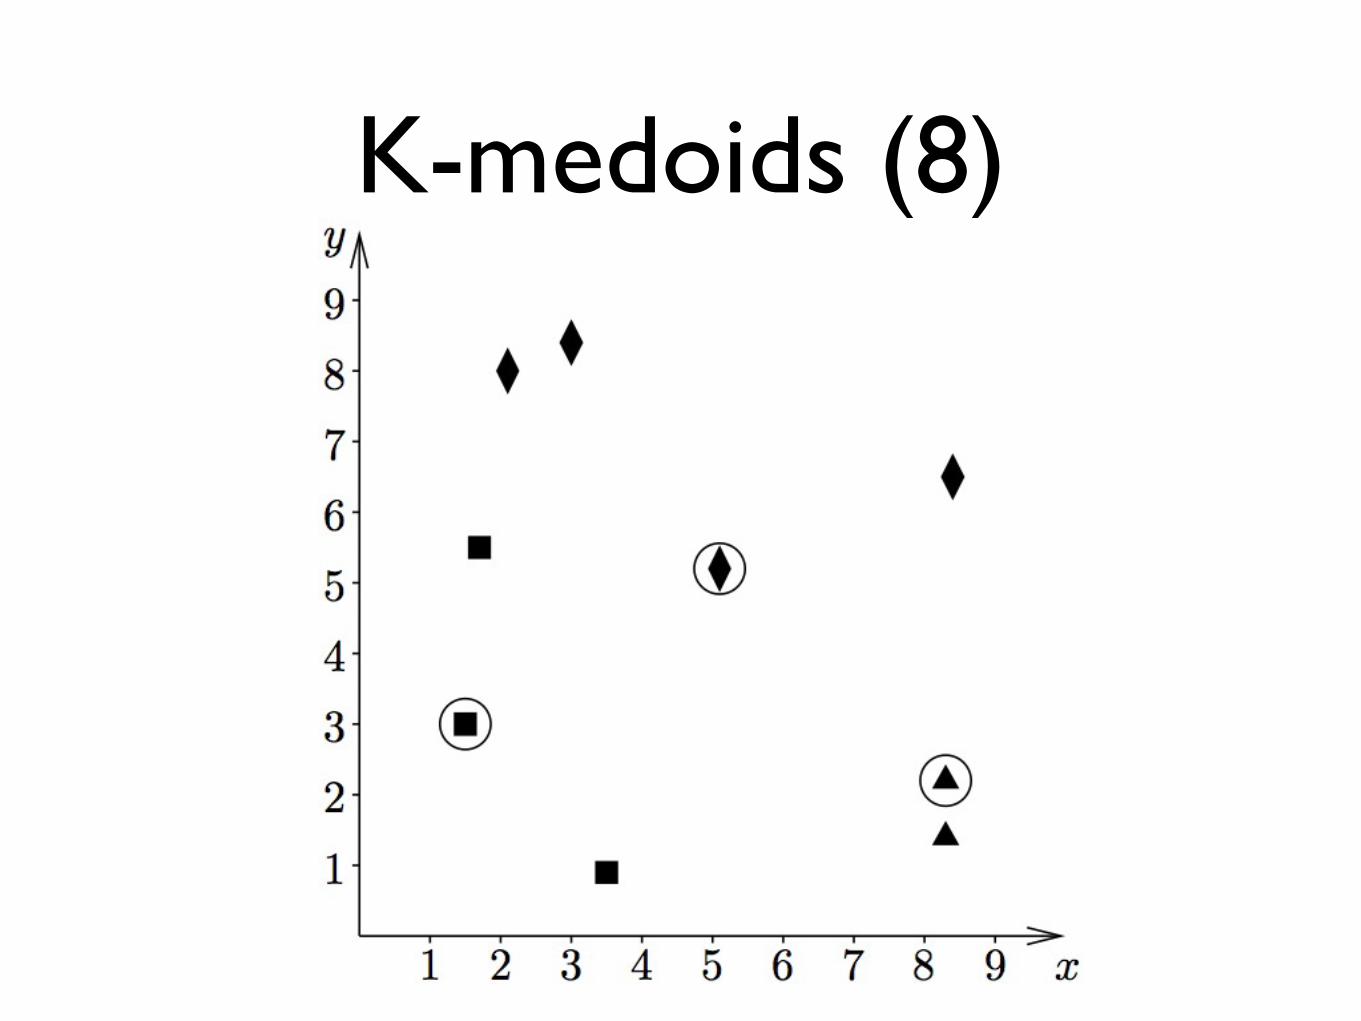
K-medoids (8)
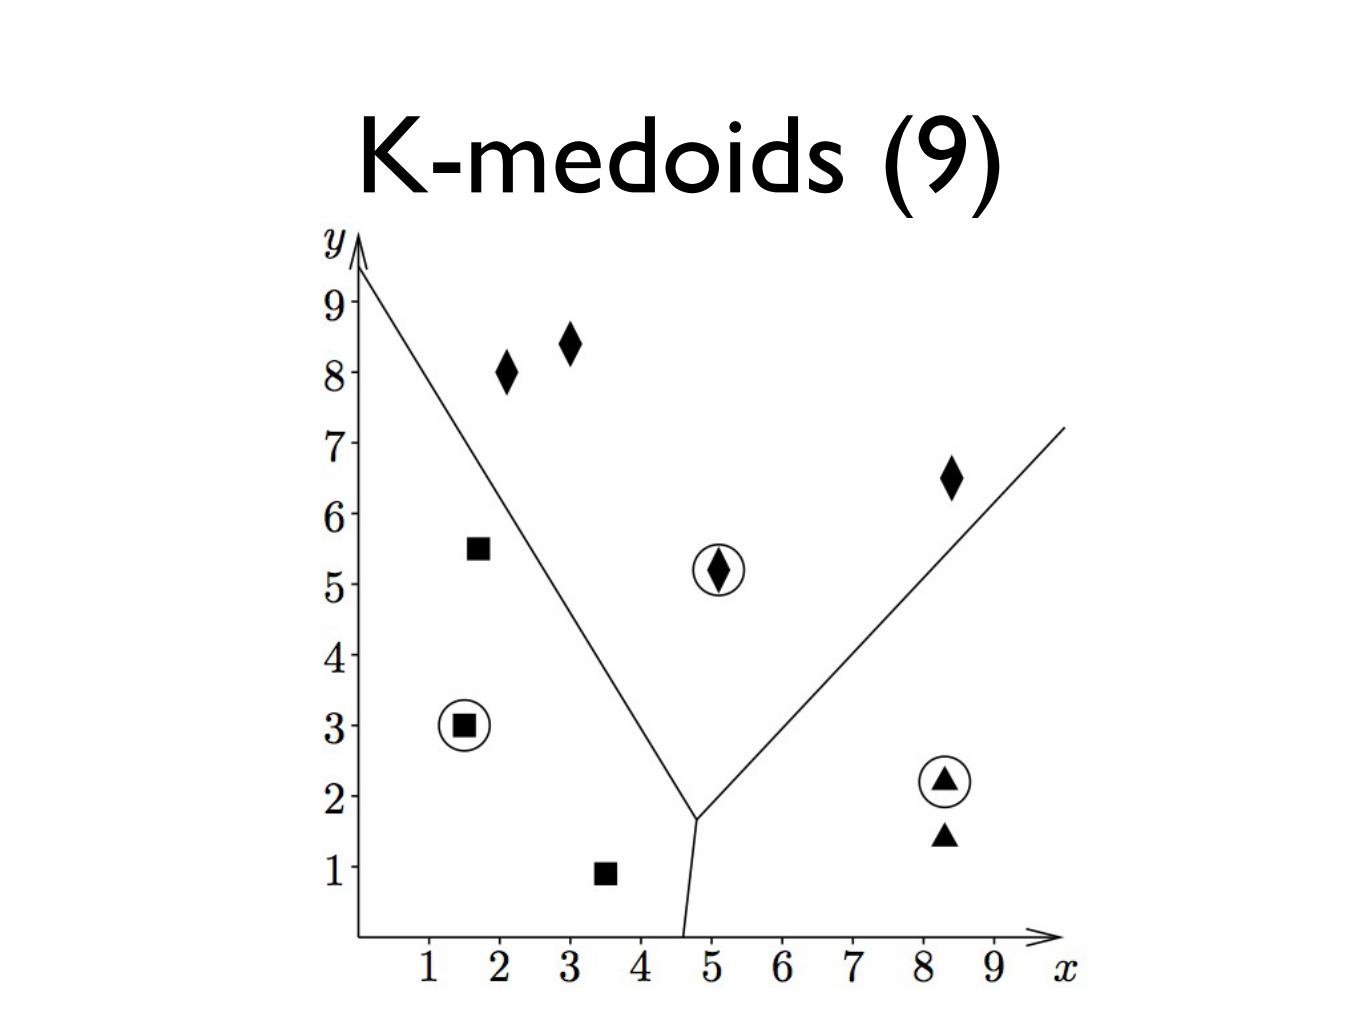
K-medoids (9)
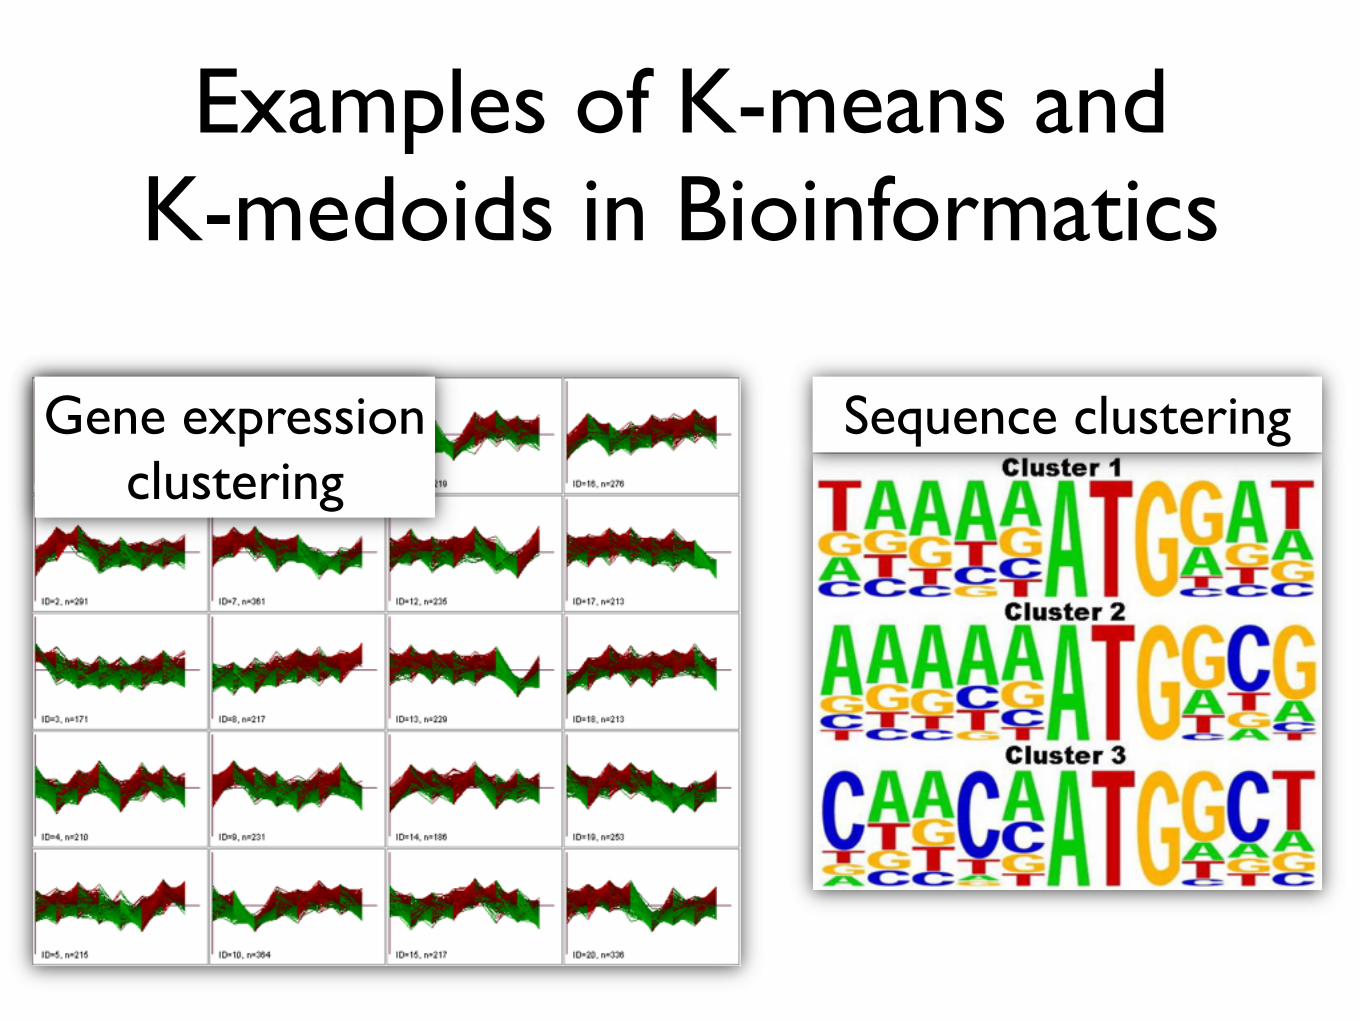
Examples of K-means and K-medoids in Bioinformatics
Gene expression clustering
Sequence clustering
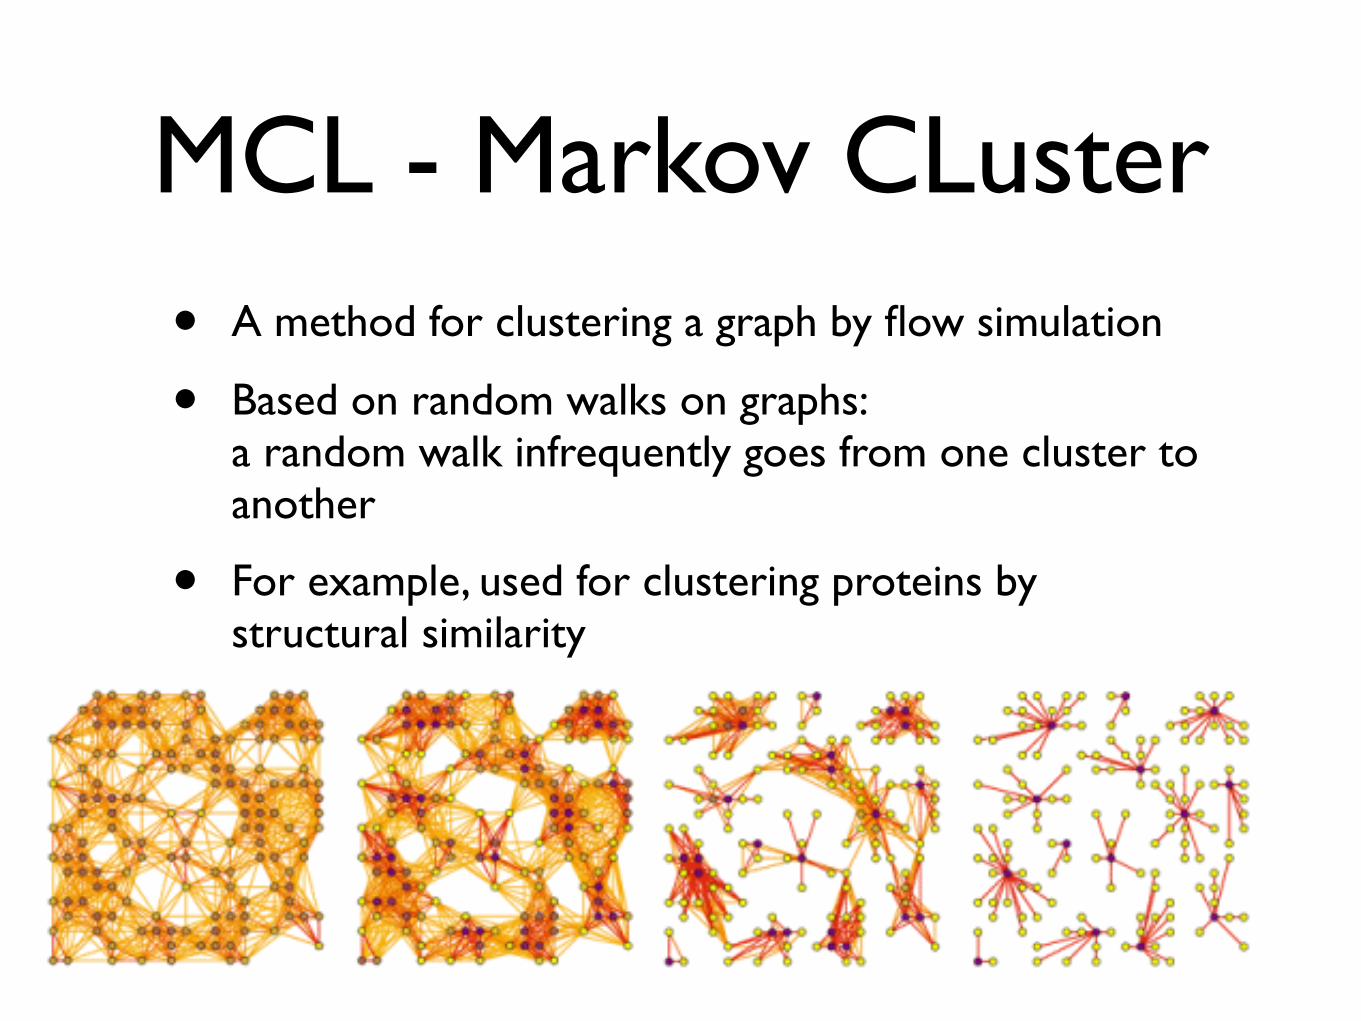
MCL - Markov CLuster• A method for clustering a graph by flow simulation
• Based on random walks on graphs:a random walk infrequently goes from one cluster to another
• For example, used for clustering proteins by structural similarity

Summary of Clustering• Aims: intuition, hypothesis generation, summarization
• Types:
• Hierarchical/Partitional
• Fuzzy/Non-Fuzzy
• Vector-based/Distance-based
• etc.
• Distance measures
• Euclidean, Manhattan, Correlation
• Hamming, Levenshtein
• etc.
• Applications:
• Clustering genes, sequences, organisms, etc.


