Download - Seasonal Saturation

Verifying Interpretations of Soil Saturation using
Hydrologic Measurements
Mike VepraskasSoil Science Dept.
NCSU
Seasonal High Water Tables
Depth to seasonally-saturated soil layers determines whether soil is:
• Suitable for a home site• A jurisdictional wetland

Determining Depth to Seasonal Saturation
• Find depth to Low Chroma or gray soil colors
• These colors mark the top of the seasonal high water table (SHWT)

Depth of seasonal
high water table
Problems with Using Soil Color to Detect Seasonal Saturation
• Colors are not reliable indicators when soils have been drained.
• We don’t know how often or how long a soil is saturated at a given depth from color alone.

Problems cont’d:New Needs
Land-use assessments may require information on frequency and duration of saturation--over the long term (40+ yrs)

Examples
• Wetlands--must be saturated for 5% of growing season for >5 out of 10 years
• Soils using septic systems-- must not be saturated for >14 d in 7 out of 10 years

Objectives
1. Review a method that calibrates percentages of redox. features (gray colors) to long-term saturation frequency and duration.2. Review applications of results.

Background Chemistry
Redoximorphic features form when:
• Soils are saturated and Fereduction occurs.
Gray color is natural color of soil minerals w/o Fe oxide coatings.

Methods
How to get 40 yrs of daily water table data

4-Step Approach
Calibratemodel to predict water table level
from rainfall
Compute 40 yr of daily
water table levels
Estimate how often soil saturates for critical period/yr
Correlate saturationestimates to soil color
percentages

Basic Idea
Calibrate percentages of redximorphic features to long-term water table data

Soils
• Two sites studied in NC Coastal Plain
• Hillslopes at each site contained plots in well, moderately well, and poorly drained soils (Kandiudults to Paleaquults)

GoldsboroLynchburg: fine-loamyLenoir: fine
Rains: fine-loamyLeaf: fine
Soil Series at Two Sites

Soils cont’d.• Measured the following in 22 soil
plots : daily water table levels, rainfall, and redox potential
• Percentages of redoximorphicfeatures were estimated by eye
Hydrologic Modeling
• DRAINMOD was calibrated for each soil plot
• Calibrated models were used to compute daily water table levels for 40-yr period for each soil plot

Saturation Parameters
• Minimum Duration of Saturation: lag between start of saturation and Fe reduction
• Saturation Frequency: how often the Minimum Duration of Saturation occurs over time

Estimating Minimum Saturation Durations needed to Reduce Fe
• Redox potential was measured to determine when soils were anaerobic and Fe-reduced
• We assumed the dominant Fe mineral was goethite

Dec
Eh
(mv)
Jan
525
Saturation
Fe reduction occurs after 4
weeks
(60 cm)
Aerobic
Reduced
4 wks
Finding Minimum Duration of Saturation

Minimum Durations of Saturation needed for Fe Reduction to Occur
Depth Site 1 Site 2 cm -------------------days-----------------
15 6 4530 21 560 35 21
Mean 21 24

Minimum Durations of Saturation and Fe Reduction
• Vary with depth for a given site
• Average minimum was 21 days (winter)• Shorter durations of saturation may
occur in summer, and where organic matter contents are greater.

0
10
20
30
Jan Aug
Average Daily Soil Temp.
So
il T
emp
(C
0 )
Biological
Zero

Saturation Events
• Needed a single variable that combined saturation frequency and duration
• Variable used was: Saturation Event Index (SE)

Saturation Event Formula
For saturation periods > 21 days:• T= no. of times saturation
occurs/year• D= longest period of saturation
SE= (T-1) + (D/21 d)

Simulation Data for Site 1, Plot 9, 70 cm
Year Frequency Duration SEdays
1959 1 25 11960 1 74 3
--- --- --- ---1998 2 31 2
Mean -- -- 2.2/yr

Example
If a soil at 60 cm had a saturationevent index of 2, then on average over 40 years it might saturate:
• once per year for 42 to 62 days, or • twice per year for 21 to 41 days

Assumption
A long period of saturation and reduction produces the same percentage of gray color as two shorter periods in a soil horizon.

Saturation Events
• Computed by plot for depths of 15, 30, 45, 60, 75, and 90 cm.
• Computed for each year from 1959 to 1998
Saturation Events cont’d.
• Computed for periods: During the growing seasonOutside the growing seasonEntire year
• Mean values (40-yr.) used in regressions

Regression Analyses
Basic equations:• SE = slope x (% redox depletions)
• SE = (A) x (% redox depletions) +(B) x (% redox conc.)
ResultsHow accurate were the
modeling results?

Model Simulation Results
Predicted and measured water table levels differed by
<15 cm for most plotsat both sites over a 3-yr. period

Regression Analyses
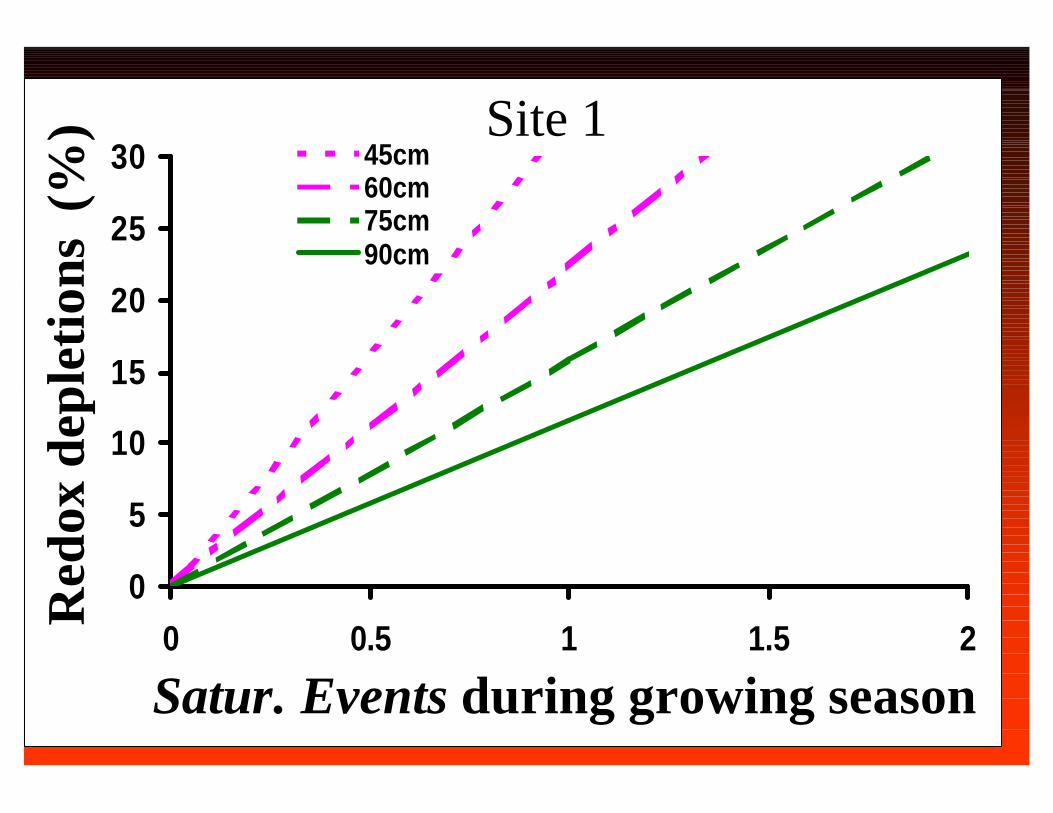
Initial data plots showed relationships between SE and Color for a site were:
• Linear• Depth dependent• Soil independent
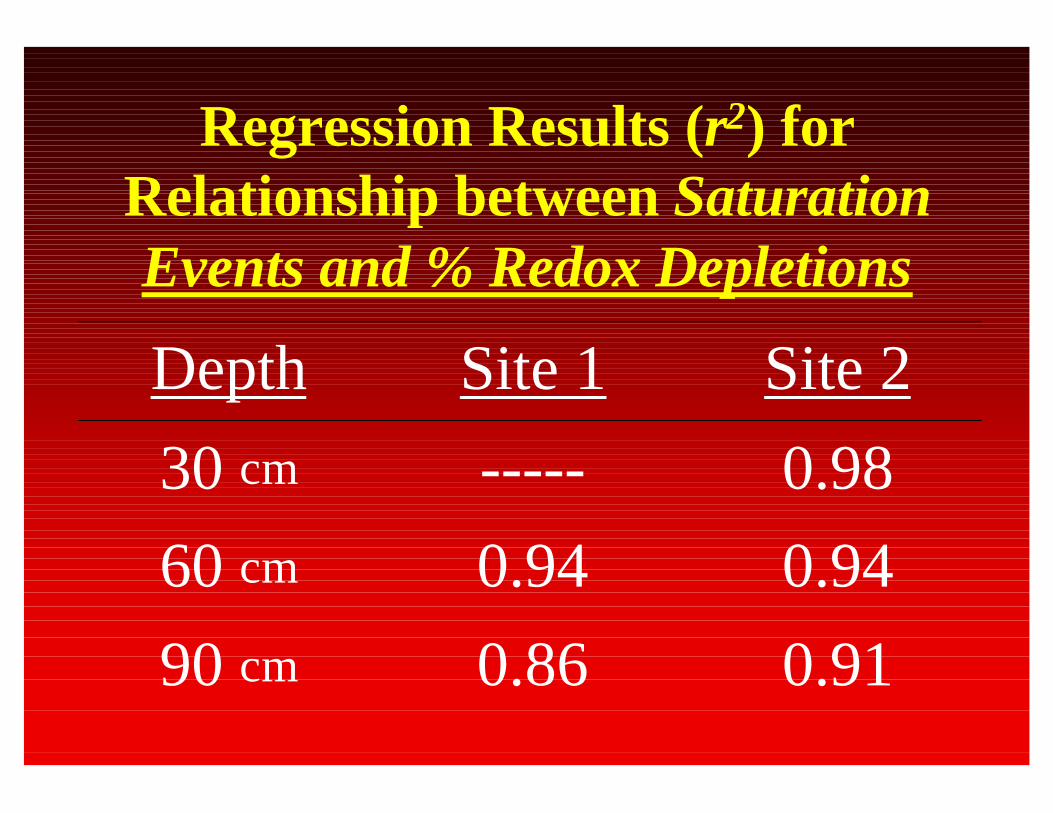
Regression Results (r2) for Relationship between SaturationEvents and % Redox Depletions
Depth Site 1 Site 2
30 cm ----- 0.98
60 cm 0.94 0.94
90 cm 0.86 0.91
0
5
10
15
20
25
30
0 0.5 1 1.5 2
45cm60cm75cm90cm
Site 1
Satur. Events during growing season
Red
oxde
plet
ions
(%
)

0
5
10
15
20
25
30
0 0.5 1 1.5 2
45cm60cm75cm90cm
Site 1
Satur. Events during growing season
Red
oxde
plet
ions
(%
)
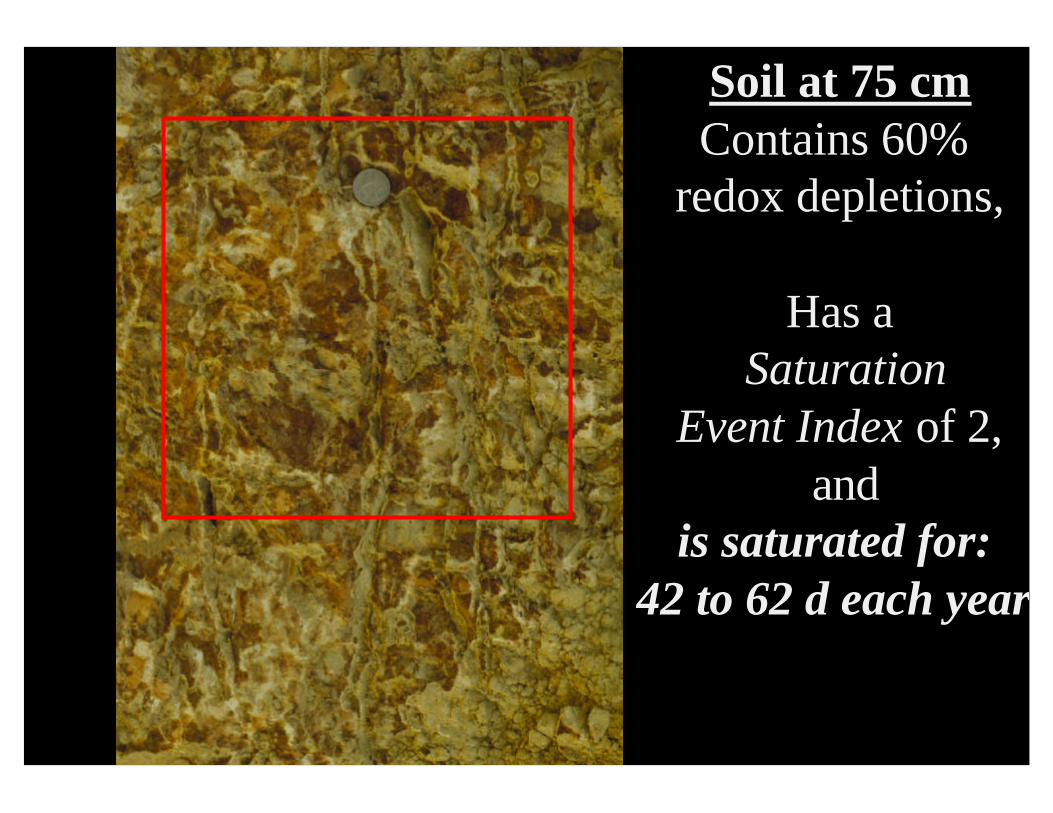
Soil at 75 cmContains 60%
redox depletions,
Has aSaturation
Event Index of 2,and
is saturated for: 42 to 62 d each year
0
5
10
15
20
25
30
0 0.5 1 1.5 2
Satur. Events during growing season
Red
oxde
plet
ions
(%
)
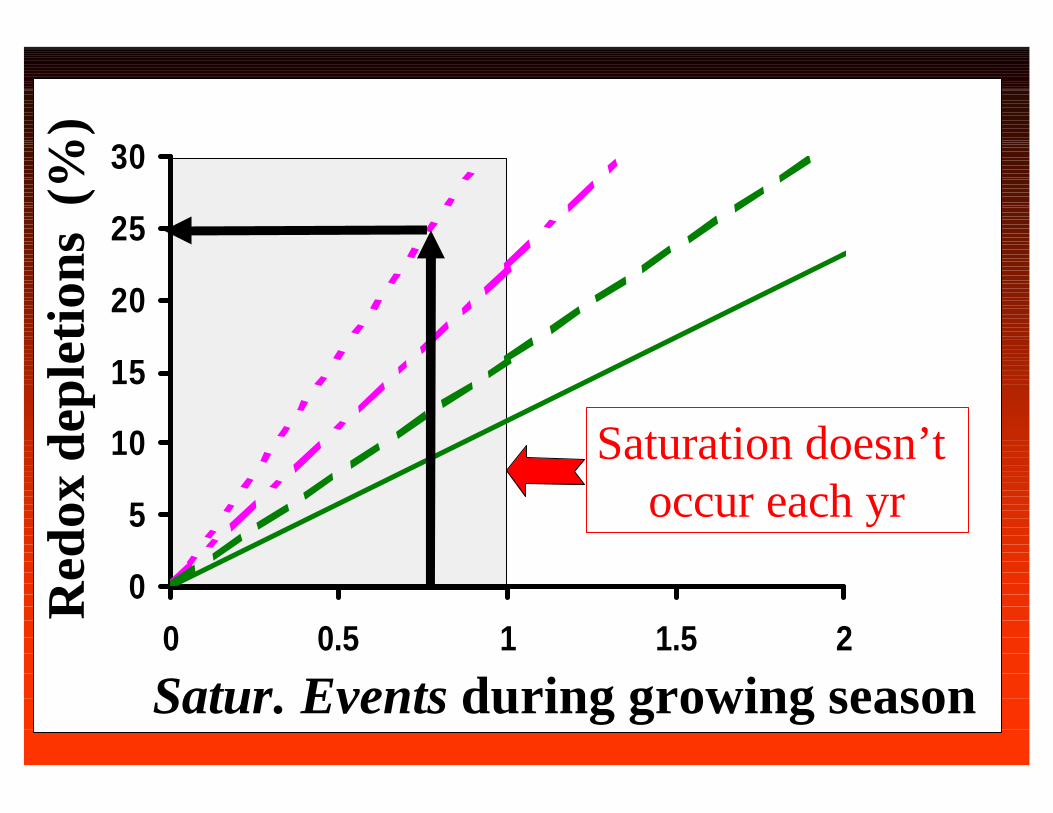
Saturation doesn’t occur each yr

When Saturation Events < 1
Soil saturates for >21 d less often than every year.
• If SE is 0.5, soil saturates every other year.
• If SE is 0.1, soil saturates once in 10 years

0
5
10
15
20
25
30
0 0.5 1 1.5 2
45cm
60cm
75cm
90cm
R2 = 0.95
R2 = 0.92
R2 = 0.82
R2 = 0.80
Sites 1 and 2
Saturation Events per year
Red
ox d
eple
tion
s %

Why Do Lines Have Different Slopes?
Hypothesis: Slopes are related to length of time needed for a saturated soil to become reduced at depth of interest.

0
5
10
15
20
25
30
0 0.5 1 1.5 2
Satur. Events during growing season
Red
oxde
plet
ions
(%
)
Needs 28 dto become reduced
Needs >60 dto become reduced

Objectives
1. Review calibration of gray colors to long-term saturationfrequency and duration.2. Review applications of results.

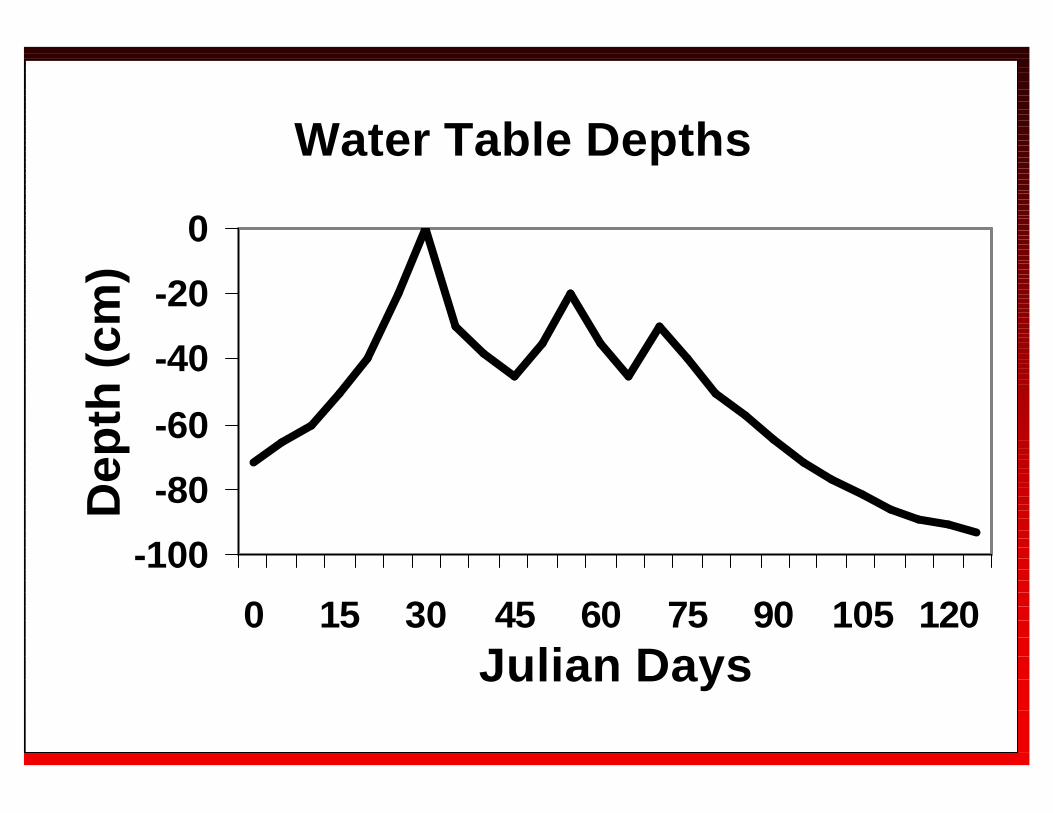
Relating Hydrographs to SHWT
You may be asked by a judge to verify your predictions of SHWT.This can be done using daily water table measurements during the wet period of a year of normal rainfall.

Water Table Depths
-100
-80
-60
-40
-20
0
0 15 30 45 60 75 90 105 120Julian Days
Dep
th (
cm)
Where do low chroma colors occur?

Find the "21-day Saturation Depth"
-100
-80
-60
-40
-20
0
0 15 30 45 60 75 90 105 120
Julian Days
Dep
th (c
m)

Depth to SHWT is 40 cm
-100
-80
-60
-40
-20
0
0 15 30 45 60 75 90 105 120
Julian Days
Dep
th (c
m)
Gray colors beginat 40 cm

Wetlands
Identified on the basis of three parameters:
•Hydrology
•Soils
•Vegetation

Hydric Soils• Must have been saturated and
anaerobic for part of the growing season
• Identified by color characteristics that are rigidly defined (field indicators)
Relationship of Hydric Soil Field Indicators and Wetland Hydrology
Depleted Matrix field indicator:• A layer of soil within 25 cm of
surface, with >60% redox depletions and > 2% redox conc.


Hydrology needed for a Depleted Matrix
• At site 2, layers with a depleted matrix had a SE index of 1.
• These layers saturate each year during growing season for 21 to 41 days.

Conclusions
• Percentages of redoximorphicfeatures can be calibrated to soil hydrology.
• Relationships vary among soils (sites) with different minimum saturation: Fe reductionrelationships.

Conclusions cont’d.
• Depth to “Seasonal High Water Table” was point where soil wassaturated for “21” consecutive days.

Conclusions cont’d.
• At site 2, the depleted matrixfield indicator could be used to identify soils meeting thewetland hydrology requirement.

The End

Conclusions cont’d.
The “21-day” Technical Standard was accepted in principle by a judge in NC, but modified to 14-days of saturation.

Technical Standard
System for measuring hydrologic, climatic, and soil chemicalproperties to verify morphological interpretations for regulatorypurposes.

Measurements1. Water table levels--daily
preferred for modeling2. Rainfall-daily, onsite3. Redox potential-weekly
(needed for some applications)
Water Table Depths
-100
-80
-60
-40
-20
0
0 15 30 45 60 75 90 105 120Julian Days
Dep
th (
cm)

Duration of Measurements
• Ideal: Long-term preferred (e.g. 40 yrs.) to establish scientific basis for technical standard
• Practical: One wet season

4-Step Approach
For a hillslope of soils:• Calibrated a hydrologic model• Computed water table levels for
40-yr. period

Approach cont’d.
• Computed annual saturation parameters (frequency of critical durations)
• Correlated saturation data to percentages of gray and red soil colors

Goal for Research
• Determine relationships between long-term water table measurements and percentages of redox. features.
• Develop a technical standard to find equivalent depth to SHWT from a hydrograph.

Soils Textures
• At site 1 soil textures were sand, sandy loam, and sandy clay loam
• At site 2 soil textures were silt, silt loam, and silty clay loam.

0
5
10
15
20
25
30
0 0.5 1 1.5 2
45cm60cm75cm90cm
Site 1
Satur. Events during growing season
Red
oxde
plet
ions
(%
)


0
5
10
15
20
25
30
35
40
0 0.5 1 1.5 2
Saturation Events within Growing Season
Site 2
15cm30cm45cm60cm75cm90cm
Red
oxde
plet
ions
(%)


