
School Improvement Planning: Data Analysis
Clark County School-Level Teams

CTLT 2011
Special Thanks
Center for Transforming Learning & Teaching
Colorado Department of Education This presentation is based on materials developed for
and with the Colorado Department of Education through an interagency agreement (2009) with the Center for Transforming Learning and Teaching.

SID Data Coordinators: Lisa Biesinger Lakeisha Young SID Project Facilitators: Krista Donnelly Sue Egloff Greg Manzi Stacie Nelson
AARSI Coordinators: Ramona Esparza Jeff Halsell Laura Love Kim Mauk Wayne Roberson IDS Department: Becca Meyer Nathan Trenholm
School Improvement 855-7783

Purpose
Ensure school planning teams are prepared to
identify performance trends and prioritize concerns
(performance challenges) as part of improvement
planning.

CTLT 2011
Participating from Two Perspectives
Learner
Facilitator

CTLT 2011
Norms The standards of behavior by
which we agree to operate while we are engaged in
learning together.

CTLT 2011
Norms for Today Be present, participate, and engage fully.
Listen to learn, limit side conversations.
Monitor personal technology (turn cell phones off or on vibrate, close laptops during group activities).
Pay attention to signals to rejoin the whole group – hand-raising.
Suspend judgment, live in curiosity.
Provide feedback on the “Parking Lot.”
Commit to follow-through.

CTLT 2011
Introductions
At your table, share: Name, role
Your current level of comfort in facilitating improvement planning at the school level.
Your most important outcome for this session.

CTLT 2011
Materials

CTLT 2011
Session Outcomes Explain how improvement planning will improve
student learning and system effectiveness.
Identify data sources to use in improvement planning.
Identify the data analyses processes included in the Improvement Plan template.
Interpret district-required performance measures and metrics.
Identify where school performance did not meet expectations.
Describe performance trends (over at least 3 years).
Determine which performance challenges will focus improvement activity for the coming year.
Develop a plan for completing the data analysis for the schools’ improvement plan.
Participate in hands-on session. Access additional resources.
Complete follow-up activities.

Monitor Your Learning Turn to Progress Monitoring, p.4
Re-write today’s learning targets in language that has meaning for you.
Create a bar graph which describes where you currently believe you are in relationship to each learning target.
Leave the reflections column blank for now.
Learning Target I don’t know what this Is
I need more Practice
I’ve got It
I can teach others Reflections
Explain how improvement planning will improve student learning and system effectiveness. In my words: I can explain why we engage in improvement planning and how it benefits students.

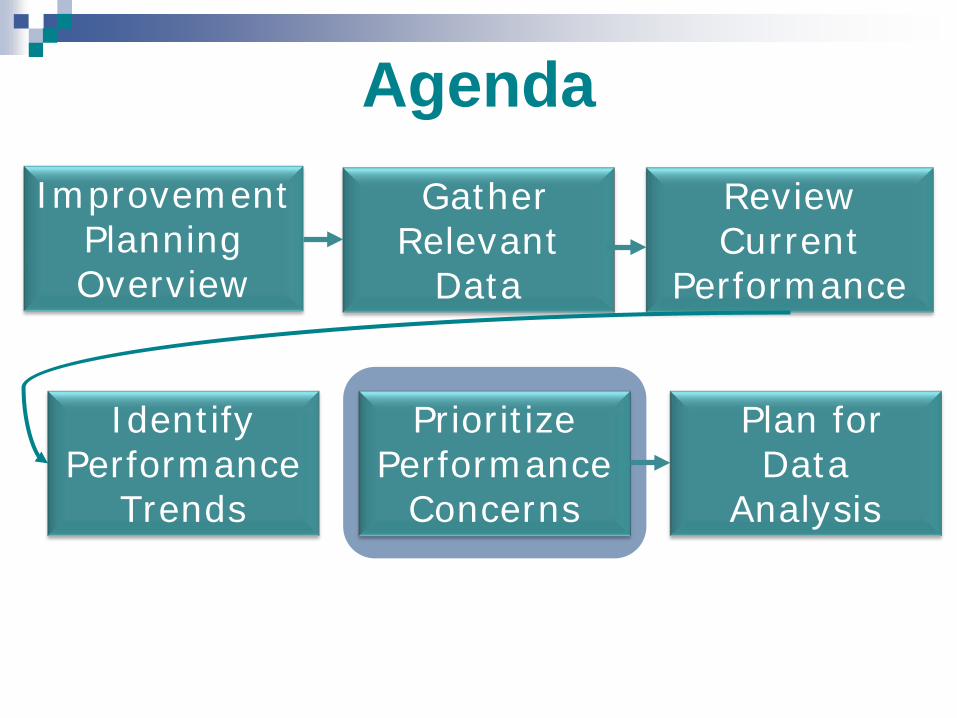
Agenda Improvement
Planning Overview
Gather Relevant
Data
Review Current
Performance
Prioritize Performance
Concerns
Plan for Data
Analysis
Identify Performance
Trends

CTLT 2011
Purposes of Improvement Planning Provide a framework for performance management.
Support school use of performance data to improve system effectiveness and student learning.
Shift from planning as an event to continuous improvement. (Compliance vs. Commitment)
Align federal/state and district accountability systems, bringing multiple planning requirements into one document.
Align district support resources to school needs.

How will engaging in improvement
planning result in improvements in student learning?
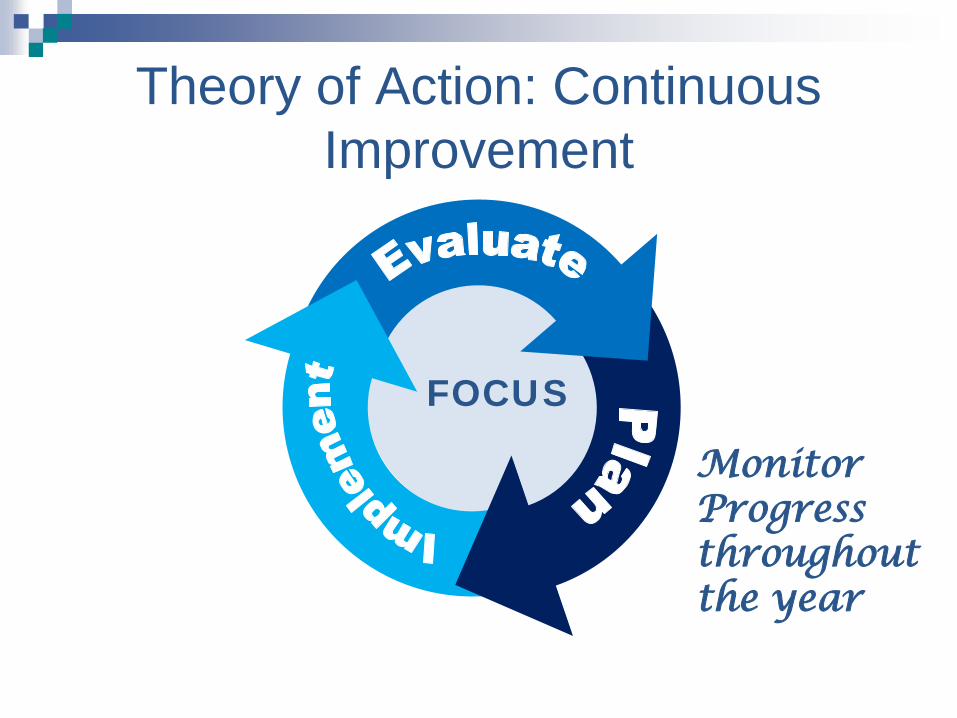
Theory of Action: Continuous Improvement
FOCUS
Monitor Progress throughout the year

CTLT 2011
Planning Terminology Consider Planning Terminology (p. 39).Use the
following legend to mark each term: = “I got it”
? = Could use further clarification
* = New term or new definition for a familiar term
With your team: Discuss any terms which raised ?’s
Share terms that still need clarification with the full group

Action Planning
Inquiry Process
Target Setting
Progress Monitoring
School Improvement Planning Processes
Describe Performance
Trends
Prioritize Performance
Concerns
Identify Root Causes
Set Performance
Targets
Identify Measurable Objectives
Identify Solutions and Action Steps
Identify Implementation
Evidence
Gather and Organize
Data
Review Performance Framework
Page 6

Section I Section II Section III Section IV Section V
Vision for Learning Members of the School Planning Team
School Performance Summary
Year to Year Analysis Current Data Analysis and Root Cause Analysis Key Strengths
Goals and Measurable Objectives
School Improvement Master Plan and Reform Strategies
Section VI Section VII Section VIII Section IX Appendix A Additional Required Elements (All Schools)
Required Elements for Non-Title I “Needs Improvement” schools
Budget Narrative Summary (All Title 1 & Turnaround Schools Only)
Required Ten Components for Title I Schools Only Title I Only: Staff Review
Approval and Assurances

CTLT 2011
Consider the Structure
Read/review Section II: School Summary (p. 9-10)
With your table discuss: What is the relationship between performance
indicators, measures, metrics and expectations?
What are minimum district expectations for each performance indicator?

Agenda Improvement
Planning Overview
Gather Relevant
Data
Review Current
Performance
Prioritize Performance
Concerns
Plan for Data
Analysis
Identify Performance
Trends

CTLT 2011
Gathering Relevant Data
Read/Review Gathering and Organizing Relevant Data (p. 7-9)
Consider: What basic district reports should all schools
consider?
What additional school-level data does our school have available?

Multiple measures must be considered and used to understand the multifaceted world of learning from the perspective of everyone involved. -Victoria Bernhardt

Student Learning
School Processes Perceptions
Demographics
Provides information that allows for the prediction of
actions, processes, programs that best meet the
needs of all students.
Victoria Bernhardt

CTLT 2011 Victoria Bernhardt
What combination/ intersection(s) of different types of data helps us answer:
1. Do students’ experiences in school differ based on their characteristics?
2. Which students participate in a reading intervention program?
3. Is participation in a reading intervention program associated with increased student achievement?
p. 15

CTLT 2011
For what are multiple measures used in SIP?
Consider these uses of data in Improvement Planning: Review current performance and prior year’s targets
Analyze data to identify trends
Prioritize performance concerns
Identify root causes
Identify interim measures to monitor changes in student performance during the year
Monitor implementation of action steps
What type of data (intersections of data types) need to be considered for each use?

CTLT 2011
Inventory Local Performance Data Consider: Inventory of Performance Data Sources (p. 17)
Legend (p. 18) Content Area and Focus
Assessment
When Available
Which Students
Grade Levels
Metrics
Data Views/Reports
Questions/Purpose
What information is captured about each data source

CTLT 2011
Complete the Inventory Questions to consider. . .
Do you know what assessment data sources are available to your school?
Do you already have a comprehensive inventory of available performance data?
Do you have the information asked for in this inventory (including when the data is available and the metrics)?
How do you access your school performance data?
Follow-Up: Complete an inventory of performance data available to your school.

Agenda Improvement
Planning Overview
Gather Relevant
Data
Review Current
Performance
Prioritize Performance
Concerns
Plan for Data
Analysis
Identify Performance
Trends

CTLT 2011
School Performance Frameworks Focus attention on what matters most.
Provide a body of evidence related to district-identified performance indicators to support district and school performance management.
Establish a common framework for the district to use to hold schools accountable for performance.
Identify schools that need additional support.
Support school efforts to evaluate their performance, plan and implement strategies to improve performance.

CTLT 2011
School Performance Indicators
Achievement Percent proficient
and advanced
• Reading (CRT) • Math (CRT) • Science (CRT) • Writing (CRT)
Growth Normative and
Criterion- Referenced
Growth • CRT Reading and
Math • Median Student
Growth Percentiles
Growth Gaps Growth Gaps
Median Student Growth Percentiles and Median Adequate Growth Percentiles for disaggregated groups: • Poverty • Race/Ethnicity • Disabilities • English Language
Learners

CTLT 2011
Review SPF Report Consider (p. 36):
In which indicator areas did the school not at least meet district expectations?
In which sub-indicators did the school not at least meet district expectations?
In which sub-indicators did school performance not meet school-level expectations?
What is the magnitude of the school’s performance challenge?
Does performance (achievement and growth) differ across content areas? Is there one content area in which performance is weaker?

Agenda Improvement
Planning Overview
Gather Relevant
Data
Review Current
Performance
Prioritize Performance
Concerns
Plan for Data
Analysis
Identify Performance
Trends

CTLT 2011
What are performance trends?
Read, Section III: Inquiry Process, Step Two: Identify Trends (p. 11-12)
Discuss: What are the most critical things to remember about
performance trends?
What are some examples of performance trends?
What patterns can be described as trends?
What are the elements of a trend statement?

CTLT 2011
Trends Include all performance indicator areas.
Include at least three years of data.
Consider data beyond that included in the school performance framework (grade-level data).
Include positive and negative performance patterns.
Identify where the school did not at least meet state/federal and district expectations.

Trends Could Be: Stable Increasing Decreasing Increasing then decreasing Decreasing then increasing Flat then increasing Flat then decreasing
What other patterns could folks see in three years of data?

CTLT 2011
Trend Statements Elements of a trend statement (p. 33):
Measure/Metric
Content Area (s)
Which students (grade-levels, disaggregated groups)
Direction
Amount
Time period
Examples
The percent of 4th grade students who scored meets or exceeds on math CRT declined from 70% to 55% to 48% between 2009 and 2011.
The median growth percentile of English Language learners in reading increased from 28 to 35 to 45 between 2009 and 2011.

CTLT 2011
Collaborative Inquiry to Identify Trends
Choose a partner. Turn to: Guiding Assumptions for Collaborative Inquiry. (p.21)
Read individually one row in the chart.
When each partner has completed a row, look up and “say something.” Something might be a question, a brief summary, a key point, an interesting idea or personal connection to the text.
Continue until you complete all of the rows in the table.

CTLT 2011
How to Describe Performance Trends 1. Start with a performance focus and relevant data
report(s).
2. Make predictions about performance.
3. Interact with data (at least 3 years).
4. Look for things that pop out, with a focus on patterns over time (at least three years).
5. Capture a list of observations about the data (positive or negative).
6. Write trend statements.
7. Determine if the trend requires further analysis.

CTLT 2011
Levels of data/levels of challenges
School Aggregated
Standard/ Content Strand
Disaggregated group
Classroom
Student work
Program (Tier I)
Individual
System
Program (Tier II/ Tier III)

CTLT 2011
Analyzing for Action How do we analyze data with action in mind?
Would action steps target growth separate from achievement?
In what categories do we take action? Content areas (math, reading, writing, science)
Groups of students (low performing, low growth, race/ethnicity, ELL, IEP. . .)

CTLT 2011
Organizing Data for Continuous Improvement
Consider Organizing Data for Continuous Improvement (p. 22)
Components: Path through the data
Measures and metrics
Critical questions to “drill down” for each step
Data views/reports

CTLT 2011
A path through the data. . . Review the SPF Report to identify where performance did not
at least meet expectations (federal/state/district)
Disaggregate groups further
Select one content area on which to focus
Consider performance (achievement/growth) by grade level for 3+ years
Within grade-levels consider achievement by
standard/content strand
Consider performance by disaggregated group by grade
level for 3+ years Look for and describe positive and negative trends.
Consider cross-content area performance (3 + years)
Look across groups

CTLT 2011
Initial focus Our path through the data includes focusing on
one content area at a time.
Choose an initial content area on which to focus (reading, mathematics) for the session today.
Note: you will focus on the additional content areas with your local planning team after today.

CTLT 2011
Considering Performance Academic Growth (overall and by grade-level)
Median Student Growth Percentile
Academic Achievement (overall and by grade-level)
% catch-up, % keep-up, % move-up
% proficient or better
% and number scoring at each performance level (emergent, approaching, meets, exceeds)

CTLT 2011
A path through the data. . . Review the SPF Report to identify where performance did not
at least meet expectations (federal/state/district)
Disaggregate groups further
Select one content area on which to focus
Consider performance (achievement/growth) by grade level for 3+ years
Within grade-levels consider achievement by
standard/content strand
Consider performance by disaggregated group by grade
level for 3+ years
Consider cross-content area performance (3 + years)
Look across groups

CTLT 2011
Disaggregated Groups Disaggregated Groups:
Minority (combines: Am. Indian, Asian, Black, Hispanic, Two or More Races, Pacific Islander)
Free/Reduced
ELL
IEP
Academic Growth (MGP)
Academic Achievement (% Proficient, % catch-up, % keep-up, % move-up)

CTLT 2011
Looking Across Groups
How does performance (achievement and growth) compare across different disaggregated groups?
Do some groups perform better than others? Which ones? By how much?

CTLT 2011
Why consider content-strand results?
Identify (with a content area) strengths and weaknesses.
Suggests where to go when determining root causes of performance challenges.

CTLT 2011
Achievement at the Standard/ Content Strand Level
2010-2011 P-Value Report (by grade level and content area)
P-Values for: School
District
State

CTLT 2011
How good is good enough?
School-based teams must determine how good is good enough for content-strand scores, options: District value
State value
Other

CTLT 2011
Cross-Content Area Performance
How does performance (achievement and growth) compare across content areas?
In what content areas is performance better than others?
Are there common patterns across content areas?

CTLT 2011
Small N?
What if summary reports have little or no data?
NDE/CCSD does not report data for small N to protect student privacy.
Options?
Student-Level Data
Summary statistics for smaller N
Accessed through Inform.

CTLT 2011
Practice Describing Trends 1. Start with performance focus and relevant data report(s).
2. Make predictions about performance.
3. Interact with data (at least 3 years).
4. Look for things that pop out, with a focus on patterns over time (at least three years).
5. Capture a list of observations about the data (positive or negative).
6. Write trend statements.
7. Identify which trends are significant (narrow) and which require additional analysis.

CTLT 2011
Practice In what content area will you focus your initial
analysis?
Organize your data reports for that content area: CRT Three-Year Trend Report by grade level
School Growth Summary Reports by grade level
P-Value Report

CTLT 2011
Why Predict? Access prior learning
Name the frames of reference through which we view the world
Make the assumptions underlying our predictions explicit, trying to understand where they came from
Activate our engagement with the data

CTLT 2011
Peter Senge explains that we should do this, not to lay our assumptions aside, but rather to give them considerable weight and try to understand where they come from.

Predictions and Assumptions

Activity: Predict 1. Select a recorder for your
table.
2. On a piece of flip-chart paper, create a T-chart.
3. Put “predictions” on one side and “assumptions” on the other side of the T-chart.
4. The recorder will capture predictions on the left side of this chart.
5. Make predictions about trends.
Predictions Assumptions

CTLT 2011
Describing Performance Trends 1. Start with performance focus and relevant data report(s).
2. Make predictions about performance.
3. Interact with data (at least 3 years).
4. Look for things that pop out, with a focus on patterns over time (at least three years).
5. Capture a list of observations about the data (positive or negative).
6. Write trend statements.
7. Identify which trends are significant (narrow) and which require additional analysis.

CTLT 2011
Interacting with data Consider strategies for interacting with data:
Highlight (color coded) based on a legend.
Do origami – fold the paper so you can compare columns.
Create graphic representations.
Agree on an approach.
How will you interact with your data?
Plan to include a visual representation (use the Interacting with Data Tool as a reference).
As a group, interact with your data.

CTLT 2011
Samples of Teams
Interacting with Data

CTLT 2011
Interact with Data- Task Select one content area to focus on from School
Performance Framework (SPF)
Look at trends available from School Growth Summary (Green & White) and 3-Year Trend
Discuss the team’s observations of the data
Chart your observations (2 Graphics) Growth Data (Green & White)
Achievement Data (3-Year Trend)

CTLT 2011
Describing Performance Trends 1. Start with performance focus and relevant data report(s).
2. Make predictions about performance.
3. Interact with data (at least 3 years).
4. Look for things that pop out, with a focus on patterns over time (at least three years).
5. Capture a list of observations about the data (positive or negative).
6. Write trend statements.
7. Identify which trends are significant (narrow) and which require additional analysis.

CTLT 2011
Be patient and hang out in uncertainty
Don’t try to explain the data
Observe what the data actually shows
No Because
Analyzing Trends
Because

CTLT 2011
Identify Trends 1. Review the highlighted data reports and
graphical representations of data.
2. Look for things that jump out.
3. Identify patterns over time (3-to-5 years).
4. Capture your observations on a flip chart.
Identify at least 5 observations about growth.
Consider growth and achievement together.

CTLT 2011
Describing Performance Trends 1. Start with performance focus and relevant data report(s).
2. Make predictions about performance.
3. Interact with data (at least 3 years).
4. Look for things that pop out, with a focus on patterns over time (at least three years).
5. Capture a list of observations about the data (positive or negative).
6. Write trend statements.
7. Identify which trends are significant (narrow) and which require additional analysis.

CTLT 2011
Writing Trend Statements Consider “Developing Trend Statements” (p.33)
1. List the content area.
2. Identify the measure/metrics.
3. Describe for which students (grade level and disaggregated group).
4. Describe the direction of the trend (e.g. increasing, decreasing, stable).
5. Include the amount.
6. Identify the time period
7. Identify for which performance indicator the trend applies.

CTLT 2011
Where will you drill deeper. . .
Some trends don’t tell the full story. . . Is the same pattern evident at the
disaggregated group level?
Is the same pattern evident across all content strands?

CTLT 2011
Identifying Performance Challenges
Which of the identified trends are positive?
Which represent performance challenges for our school?
Label trend as: Positive (+)
Negative (-) – representing a performance challenge

CTLT 2011
Capturing Trends in the School Improvement Plan Template
Capture performance trends (positive and negative) in the SIP template.
Note: This worksheet is organized by performance indicator.

CTLT 2011
Completing Trend Analysis Turn to Planning for Data Analysis (p. 37)
Make notes on how you will complete your trend Analysis. . . Who will participate?
When?
What materials and tools will you use?
Agenda Improvement
Planning Overview
Gather Relevant
Data
Review Current
Performance
Prioritize Performance
Concerns
Plan for Data
Analysis
Identify Performance
Trends

CTLT 2011
Priority Performance Challenges Read/Review Background on Data Analysis, Step
Three: Prioritize Concerns (p. 12) Discuss: What are the most critical things to remember
about priority concerns? How do priority concerns relate to trends? Why do we prioritize concerns (performance
challenges)?

CTLT 2011
Priority Concerns Priority Concerns. . . Specific statements about performance Strategic focus for the improvement efforts
About the students
Priority Concerns are NOT What caused or why we have the performance challenge
Action steps that need to be taken
Concerns about budget, staffing, curriculum, or instruction
About the adults

CTLT 2011
Priority Concern Examples
For the past three years, English language learners (making up 60% of the student population) have had median growth percentiles below 30 in both content areas.
The percent of fifth grade students scoring proficient or better in mathematics has declined from 45% three years ago, to 38% two years ago, to 33% in the most recent school year.

CTLT 2011
Priority Concern Non-Examples
To review student work and align proficiency levels to the Reading Continuum
Provide staff training in explicit instruction and adequate programming designed for intervention needs.
Implement interventions for English Language Learners in mathematics.
Budgetary support for paraprofessionals to support students with special needs in regular classrooms.
No differentiation in mathematics instruction when student learning needs are varied.

CTLT 2011
Determining Priority Concern Level
Read: How to determine the appropriate level for a priority concern (p. 13)
Discuss: What “level” of trends did you identify?
For which trends will you consider additional data (at a further disaggregated level)?
CTLT 2011
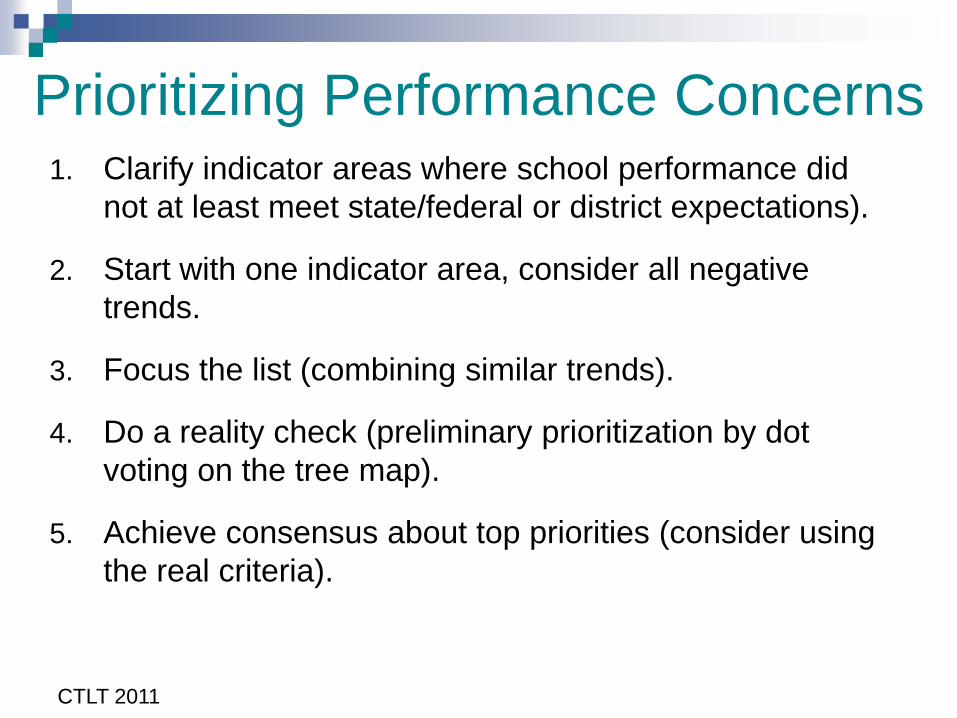
Prioritizing Performance Concerns 1. Clarify indicator areas where school performance did
not at least meet state/federal or district expectations).
2. Start with one indicator area, consider all negative trends.
3. Focus the list (combining similar trends).
4. Do a reality check (preliminary prioritization by dot voting on the tree map).
5. Achieve consensus about top priorities (consider using the real criteria).

CTLT 2011
Practice Prioritizing Concerns
Start with “negative” trends.
Focus the list (combining similar trends).
Do a reality check (preliminary prioritization by dot voting on the tree map).
Achieve consensus about top priorities (consider using the real criteria).

CTLT 2011
Completing Prioritization of Concerns
Turn to Planning for Data Analysis (p. 38)
Make notes on how you will complete your prioritization of concerns. . . Who will participate?
When?
What materials and tools will you use?

CTLT 2011
Apply Quality Criteria: Performance Trends and Priority Concerns
Use the Quality Criteria for Performance Trends and Priority Concerns. (p. 44)
Consider:
How are the trends and priority concerns similar and/or different from that reflected in quality criteria?
How could these sections be improved upon?

Agenda Improvement
Planning Overview
Gather Relevant
Data
Review Current
Performance
Prioritize Performance
Concerns
Plan for Data
Analysis
Identify Performance
Trends

CTLT 2011
Data Analysis Notes 1. In which performance indicators did school performance not at
least meet state/federal or district expectations?
2. Who was involved in identifying trends and prioritizing performance challenges?
3. What data did the planning team review?
4. In what process did the planning team engaged to analyze the school’s data?
5. What were the results of the analysis (which trends were identified as significant)?
6. How were concerns prioritized?
7. What were identified as priority concerns for the 2011-12 school year?

CTLT 2011
Planning for Data Analysis
When will you complete your data analysis?
Who will be involved?
What materials/resources/support do you need?

CTLT 2011
Taking it back to the school Next steps:
Complete the Performance Data Inventory.
Pull together any additional performance data that will be used to finalize your trend analysis.
Complete trend analysis (involving additional school staff as appropriate).
Finalize prioritization of concerns (choose 2-4 areas on which to focus improvement efforts).

CTLT 2011
Give us Feedback! Written: Use index cards
+ the aspects of this session that you liked or worked for you.
The things you will change in your practice or that you would change about this session.
? Question that you still have or things we did not get to today.
Ideas, ah-has, innovations.
Oral: Share one ah ha!
SID Data Coordinators: Lisa Biesinger Lakeisha Young SID Project Facilitators: Krista Donnelly Sue Egloff Greg Manzi Stacie Nelson
AARSI Coordinators: Ramona Esparza Jeff Halsell Laura Love Kim Mauk Wayne Roberson IDS Department: Becca Meyer Nathan Trenholm
School Improvement 855-7783


