center on reinventing public educationUniversity of Washington, 2101 N. 34th Street, Suite 195 • Seattle, WA 98103-9158 206.685.2214 • fax: 206.221.7402 • www.crpe.org
School Funding’s Tragic Flaw
Kevin Carey and Marguerite Roza

School Funding’S Tragic Flaw
May 2008
Kevin carey and Marguerite roza A Report from
Education Sector and the Center on Reinventing Public Education,
University of Washington
At every level of government, policymakers give more resources
to students who have more resources, and less to those who have less.

About
The Authors
Kevin Carey is the research and policy manager of Education Sector, an independent, non-partisan think tank.
Marguerite Roza is a research associate professor at the University of Washington’s College of Education and a senior scholar with the Center on Reinventing Public Education.
The Center on Reinventing Public Education
The Center on Reinventing Public Education (CRPE) was founded in 1993 at the University of Washington. CRPE engages in independent research and policy analysis on a range of K-12 public education reform issues, including finance and productivity, human resources, governance, regulation, leadership, school choice, equity, and effectiveness.
CRPE’s work is based on two premises: that public schools should be measured against the goal of educating all children well, and that current institutions too often fail to achieve this goal. Our research uses evidence from the field and lessons learned from other sectors to understand complicated problems and to design innovative and practical solutions for policymakers, elected officials, parents, educators, and community leaders.
Education Sector
Education Sector is an independent think tank that challenges conventional thinking in education policy. We are a nonprofit, nonpartisan organization committed to achieving real, measurable impact in education, both by improving existing reform initiatives and by developing new, innovative solutions to our nation’s most pressing education problems.
AcknowledgmentsThe research reported in this paper was made possible (in part) by a grant from the Spencer Foundation. The views expressed are those of the authors and do not necessarily reflect the views of the Spencer Foundation.
Andrew J. Rotherham, a co-director of Education Sector and a member of the Virginia State Board of Education, reviewed the contents of this paper prior to publication. He played no role in selecting the states, Virginia and North Carolina, on which this analysis is focused, nor did he author the policy recommendations contained herein.
ContentsIntroduction 1
Federal Policy 3
State Policy 5
Local Policy 9
Helping Those Who Need Help the Most 12
Beyond Equity 15

1
IntroductionIn many ways, Cameron Elementary School and Ponderosa Elementary School are alike. They are in neighboring states—Cameron in Virginia, Ponderosa in North Carolina—and are 320 miles apart. They are about the same size, and both enroll an unusually high per-centage of low-income students. At each school, meeting performance goals set by the federal No Child Left Behind Act (NCLB) is a major challenge.
But the two schools differ in once crucial way: Cameron receives more than twice as much money as Ponderosa to do essentially the same job. In fact, the schools are at opposite ends of a trend that has undermined the egalitarian promise of American education for as long as the nation has provided children with free public schools. Put simply: money follows money. At every level of government—federal, state, and local—policymakers give more resources to students who have more resources, and less to those who have less. These funding disparities accumulate as they cascade through layers of government, with the end result being massive disparities between otherwise similar schools.
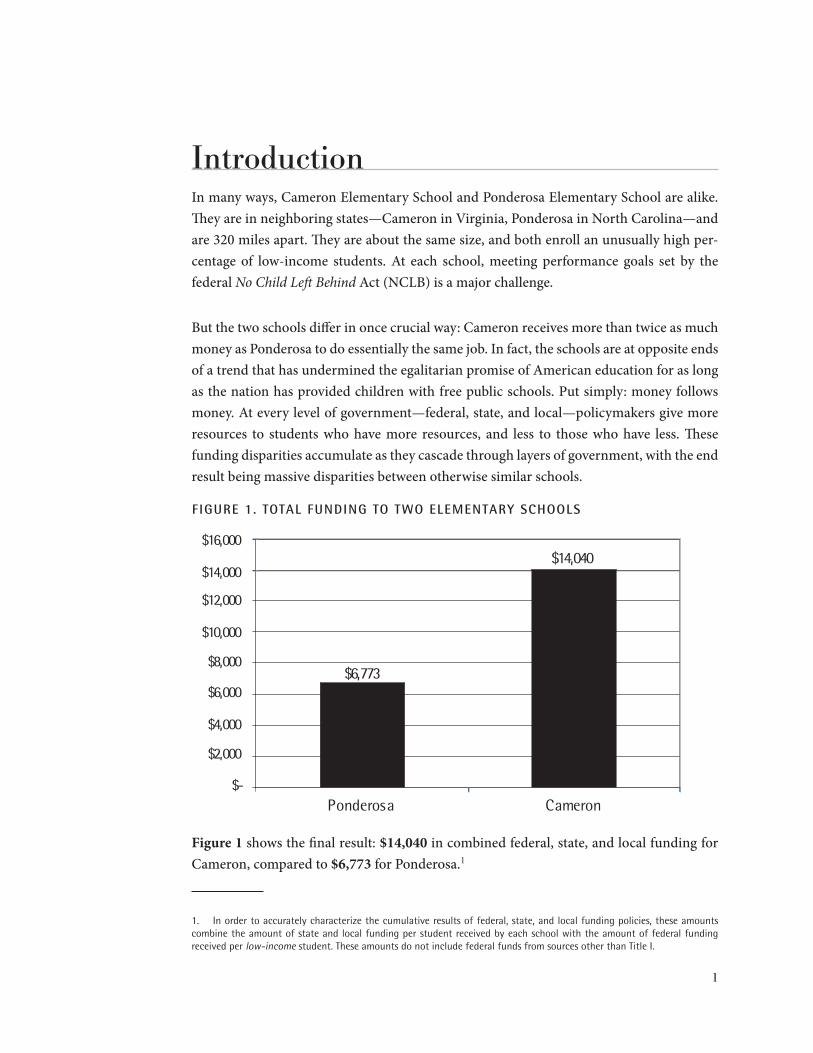
Figure 1. ToTal Funding To Two elemenTary SchoolS
$6,773
$14,040
$-
$2,000
$4,000
$6,000
$8,000
$10,000
$12,000
$14,000
$16,000
Ponderosa Cameron
Figure 1 shows the final result: $14,040 in combined federal, state, and local funding for Cameron, compared to $6,773 for Ponderosa.1
1. In order to accurately characterize the cumulative results of federal, state, and local funding policies, these amounts combine the amount of state and local funding per student received by each school with the amount of federal funding received per low-income student. These amounts do not include federal funds from sources other than Title I.
2
The impact of this disparity is not obvious at first. From the outside, Cameron looks like many other schools that educate a lot of low-income students. Built on a cramped lot near the interstate in a neighborhood of small one-story homes separated by chain-link fences, Cameron is in the less affluent part of its county. Most students qualify for the free- and reduced-price lunch program, and a recent wave of immigration has added a sizeable ESL population.
On the inside, however, Cameron looks a lot less typical. Class sizes in kindergarten and the first and second grades are kept at 15 students or fewer. The veteran teaching force earns an average salary of $62,533 per year, well above the national average of $47,602.2 When a new position becomes available—which does not happen often—the school gets as many as 20 solid applicants from which to choose. The walls are freshly painted, the students move in orderly fashion from class to class, and the rooms are full of books, computers, and supplies. Math and reading specialists provide full-time support to both teachers and students. Despite the added burden of poverty, the school’s third-graders met or exceeded the 2006 statewide average test score in science and math. As one school administrator recently said, “We are very fortunate to have the resources we have.”3
Ponderosa’s surroundings are similar—modest single-family homes and a commercial corridor with strip malls, fast food restaurants, and a poorly maintained cemetery nearby. There is the same daily bustle of parents dropping off students in the morning, the same well-kept hallways, colorful murals and posters on the wall.
But Ponderosa struggles to find the resources its students need. Class sizes are in the mid-20s, not 15 or below. The teachers often are inexperienced and leave only a few years after being hired, lured by higher salaries in neighboring districts and states. The school could use more math and reading specialists to help meet NCLB performance goals, as well as more counselors to help students whose mothers and fathers are deployed overseas in the military. But the money simply is not there. Test scores lag behind state norms, with barely half of third-graders proficient in math. What Cameron has, Ponderosa has not.
Beginning at the top with federal school funding policy, then moving down to the state and finally local levels of government, this report describes why these similar schools are funded so differently, and how these policies can be changed.
2. National average salary for 2005 per the American Federation of Teachers’ “2005 Survey & Analysis of Teacher Salary Trends,” http://www.aft.org/salary/.
3. Interview with the authors.
3
Federal PolicyThe federal government has historically played a small role in supporting public education. As late as the mid-1960s, less than 5 percent of all school funding came from federal coffers.4 Then Lyndon Johnson’s Great Society program brought an ambitious new effort to help impoverished students. That program evolved into what is now known as the “Title I” program, which distributes federal funds aimed at low-income students to schools across the nation. NCLB ratcheted up federal involvement even further, with new Title I funds to match. By 2006, the program had grown to almost $13 billion per year, one reason that federal funds now approach 10 percent of all school revenues, and provide an even larger percentage of funds for high-poverty schools.
Because Title I was designed to help poor children, funds are distributed to districts based on the number of poor students they enroll. There are actually four different Title I formulas, each of which works in a different way. When NCLB was enacted and subse-quent budgets funding the program were passed, Congress took steps to funnel more Title I funds into the formulas that most benefit districts with particularly high concentrations of poor students.
But the formulas still have a glaring flaw: They provide more money to poor students in wealthy states than to poor students in poor states. The authors of the original Title I formulas wanted to account for the fact that education costs more in some parts of the country than in others. So they decreed that the amount of federal funding per student would be tied to the average amount of state and local funding per student. The more a state spent per student, the more each of its districts received.
The problem with this approach is that interstate differences in per-student spending are primarily a function of differences in wealth, not cost. For example, public schools in Connecticut spent an average of $12,263 per student in 2005, 87 percent more than the $6,548 spent in Mississippi.5 Yet a U.S. Department of Education study found that Connecticut’s costs are only 32 percent higher.6 Most of the difference in spending between
4. U.S. Department of Education, Digest of Education Statistics 2006, Table 158, http://nces.ed.gov/programs/digest/d06/tables/dt06_158.asp.
5. U.S. Department of Education, Revenues and Expenditures for Public Elementary and Secondary Education: School Year 2004-2005 (Fiscal Year 2005), NCES 2007-356, http://nces.ed.gov/pubs2007/2007356.pdf.
6. U.S. Department of Education, http://nces.ed.gov/edfin/adjustments.asp.
4
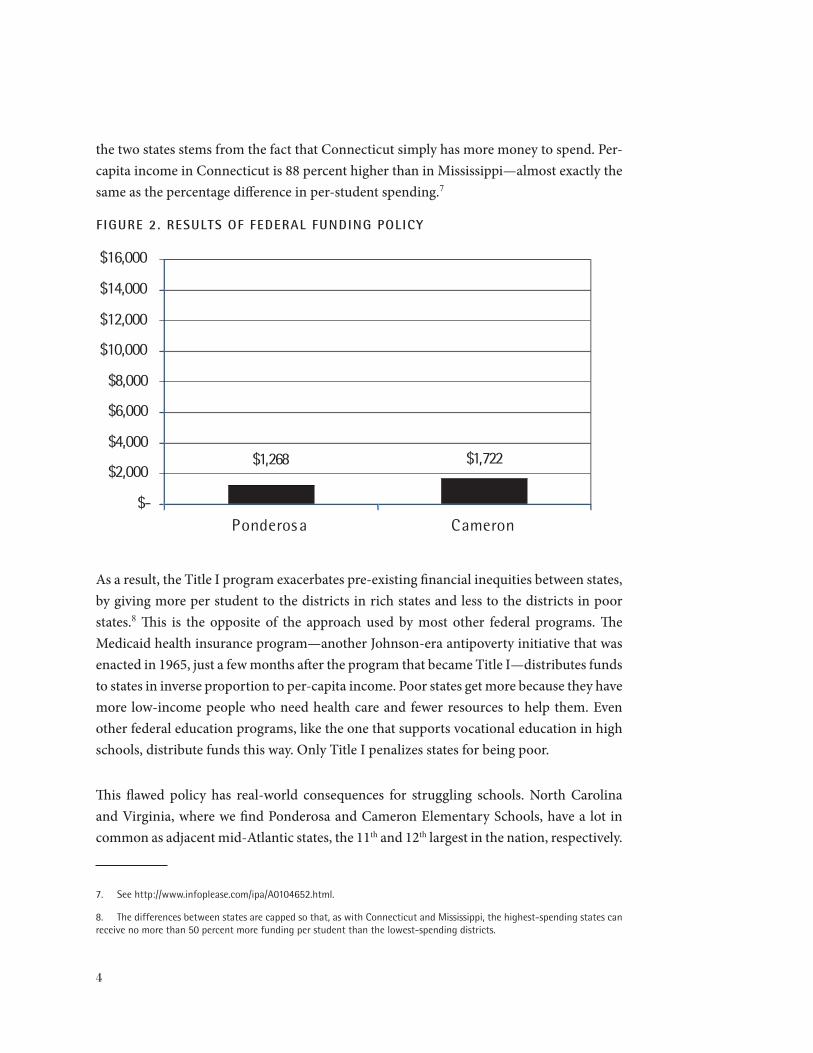
the two states stems from the fact that Connecticut simply has more money to spend. Per-capita income in Connecticut is 88 percent higher than in Mississippi—almost exactly the same as the percentage difference in per-student spending.7
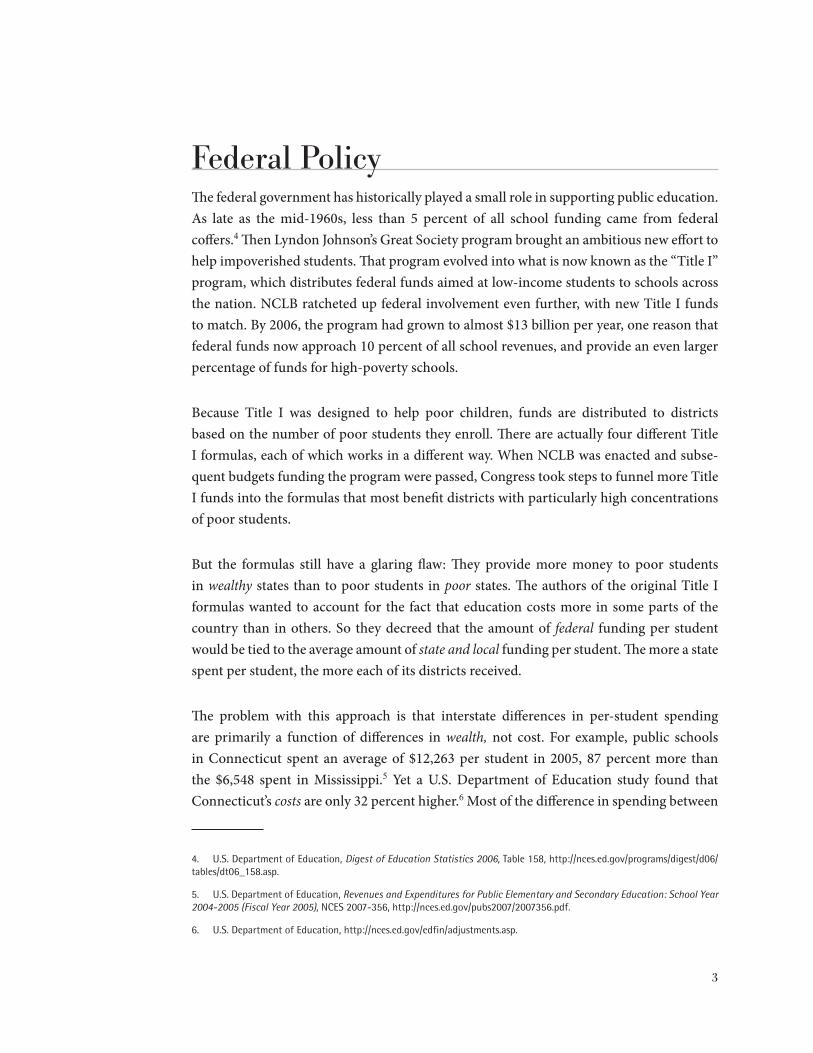
Figure 2. reSulTS oF Federal Funding Policy
$1,268 $1,722
$-
$2,000
$4,000
$6,000
$8,000
$10,000
$12,000
$14,000
$16,000
Ponderos a Cameron
As a result, the Title I program exacerbates pre-existing financial inequities between states, by giving more per student to the districts in rich states and less to the districts in poor states.8 This is the opposite of the approach used by most other federal programs. The Medicaid health insurance program—another Johnson-era antipoverty initiative that was enacted in 1965, just a few months after the program that became Title I—distributes funds to states in inverse proportion to per-capita income. Poor states get more because they have more low-income people who need health care and fewer resources to help them. Even other federal education programs, like the one that supports vocational education in high schools, distribute funds this way. Only Title I penalizes states for being poor.
This flawed policy has real-world consequences for struggling schools. North Carolina and Virginia, where we find Ponderosa and Cameron Elementary Schools, have a lot in common as adjacent mid-Atlantic states, the 11th and 12th largest in the nation, respectively.
7. See http://www.infoplease.com/ipa/A0104652.html.
8. The differences between states are capped so that, as with Connecticut and Mississippi, the highest-spending states can receive no more than 50 percent more funding per student than the lowest-spending districts.
5
But Virginia is substantially richer than North Carolina, and thus spends 29 percent more per student. As a result, as figure 2 shows, Cameron’s school district receives $1,722 per low-income student in Title I funds from the federal government. That’s 35 percent more than the $1,268 per student that Ponderosa’s district gets.9 Title I funds are often used for specialists who provide intensive instruction to underachieving students—exactly the kind of people Ponderosa’s school leaders say they do not have enough money to hire.
At the highest level of government, money for schooling follows money, with the wealthi-est states getting a disproportionate share—even in a program enacted specifically to help poor students. Unfortunately, the federal government is not alone in this. All too often, state governments make the same mistake.
State Policy American schools began as local enterprises, and to a significant extent remain so. They are governed by locally elected politicians and substantially funded by local revenue sources, primarily property taxes. Although all state constitutions require a system of free public schools, most states took their time in stepping up to that obligation. In 1930, only 17 percent of school funds came from state sources, with local funds making up the rest.10
But as societal norms changed to expect that all students would at least complete high school and most would go to college, states began to play a larger role in K–12 education. Laws were enacted to regulate and standardize a broad array of policies on questions of textbook adoption, teacher compensation, and the length of the school year. As society became increasingly mobile and more jobs required at least a high school diploma, the thinking went, all students needed access to an education of similar quality.
This created new challenges: while schools were increasingly expected to do the same things, they had wildly different levels of resources. There are over 14,000 school districts
9. The difference in per-student spending between Virginia and North Carolina, 29 percent, does not exactly match the difference in Title I funds allocated to Cameron and Ponderosa, 35 percent, because once the base per-student spending level is established for each state, it is then applied to a series of four complex funding formulas that take into account factors like the overall number and percentage of low-income students in each district. These formulas can increase or decrease per-student funding in each district.
10. Digest of Education Statistics 2006, Table 158 (see note 4).
6
in America (down from over 100,000 in 1940), and property wealth varies dramatical-ly between them. While per-capita income in the richest state is about twice that of the poorest, local property wealth per capita in a given state’s richest school district can be 50 times that of the poorest, or more. To even out these differences and to ensure that all schools had at least a minimum level of resources, states began to pump more money into the system. The state share of education funding increased rapidly to 30 percent by 1940 and 40 percent by 1950. From there it grew gradually to almost 50 percent, where it remains today.
Some states, however, did a better job of distributing the new funds than others. Those with the most enlightened policies distributed state funds in inverse proportion to local wealth, so that the quality of a child’s education was not a function of the community in which he or she happened to live. These states also put a damper on the ability of the richest districts to outspend the rest and lure away all the best teachers. Many of these states pushed the state share of education funding well past the 50 percent mark, sometimes to 60 percent or more.
Many of the most recent—and best—wealth-equalizing policies were spurred by school finance lawsuits, which have been filed in all but a handful of states over the last 30 years. By the early 1970s, when the wave of lawsuits began, many states still had huge funding dis-parities between high- and low-poverty school districts, despite the infusion of new funds. State leaders who chose to defend their inequitable systems in court often claimed they were not responsible for how much money local districts chose to raise in property taxes for education. But many state courts saw it differently. Because school districts are artifacts of state law, they declared, states are ultimately responsible for what local school districts do, particularly with regard to the state’s constitutional obligation to provide all children with a free public education.11 Much like the differences between states described above, funding differences between districts within states remain mostly a function of how much wealth districts have, not the portion of their wealth they choose to spend. While states like Massachusetts and New Jersey provide more funding to the neediest districts than the richest, others provide far less.12
11. This concept has implications for school funding analysis. Since state school funding formulas often simultaneously regulate the amount of locally raised funding and provide state dollars that are a function of local funding amounts, the distinction between “state” and “local” education funding is, in terms of both the original source of funds and the locus of decisionmaking that controls funding decisions, far less clear than it may seem. For that reason, the analysis in this report does not treat state and local funding separately as sources of revenue.
12. Carmen G. Arroyo, The Funding Gap (Washington, DC: The Education Trust, 2008).
7
But court victories and funding reforms have varied widely among the states. In Virginia, only 40 percent of school funding comes from the state, significantly below the national average of 47 percent. Virginia has established a “minimum foundation” education program and level of staffing for each district. The state contributes funds to the foundation, and districts are required to raise local funds to match. The state helps poor districts by dis-tributing state funds in inverse proportion to local wealth. But the minimum amount is not enough to compete for the best teachers and provide all the resources students need. As a result, most local districts in Virginia supplement the minimum by raising additional money from local property taxes.
This greatly benefits wealthy districts like Fairfax County Public Schools, where Cameron Elementary is located. Home of seven Fortune 500 companies, including Sprint-Nextel and defense giant General Dynamics, Fairfax County has a vibrant white-collar economy buoyed by the recent telecommunications boom and rapidly growing federal spending on the military. The county has money to spare, and spends it generously on education. In 2006, Fairfax was required by the state to raise $631 million in local funds to meet the minimum foundation requirements. It then voluntarily raised an additional $729 million in local funds on its own.13 Per-student spending in Fairfax is thousands of dollars above the state average; the district receives $11,521 per student in combined state and local funds.
North Carolina’s Cumberland County, home of Ponderosa Elementary School, is a different story. While Fairfax is home to wealthy defense contractors, Cumberland educates the sons and daughters of soldiers stationed at Fort Bragg. There are no Fortune 500 companies, just a mix of farming and manufacturing concerns struggling to cope with increasingly brutal competition in global markets.
Unlike Virginia, typical North Carolina school districts are not overly dependent on property tax revenue to fund education. The state’s funding system was designed to provide enough funds to support the basics. The state provides approximately 65 percent of K–12 education funding, via a formula that reimburses districts for the actual costs of hiring a
13. Virginia Department of Education, Annual Report on the Status of Required Local Effort in Support of the Standards of Quality, Report Document No. 18 (Virginia: Department of Education, 2007).
8
prescribed number of teachers and other staff. That number is, in turn, a function of daily student enrollment counts.14
But despite the relatively high percentage of funding coming from the state, differ-ences in local wealth still have a significant impact on funding levels in North Carolina. Idiosyncrasies within the staffing reimbursement formulas tend to favor wealthier, higher-spending districts. Those differences are compounded by what each county raises locally for its district. Because the state does not provide local wealth equalization like Virginia, districts vary dramatically in their capacity to raise local funds. Where Cumberland County augments its state revenues by 22 percent with local funds, other North Carolina districts are able to augment their state revenues by as much as 65 percent. Cumberland County spends less than half the local money per student raised in wealthy districts like those serving the state capitol of Raleigh or the flagship state university in Chapel Hill.15
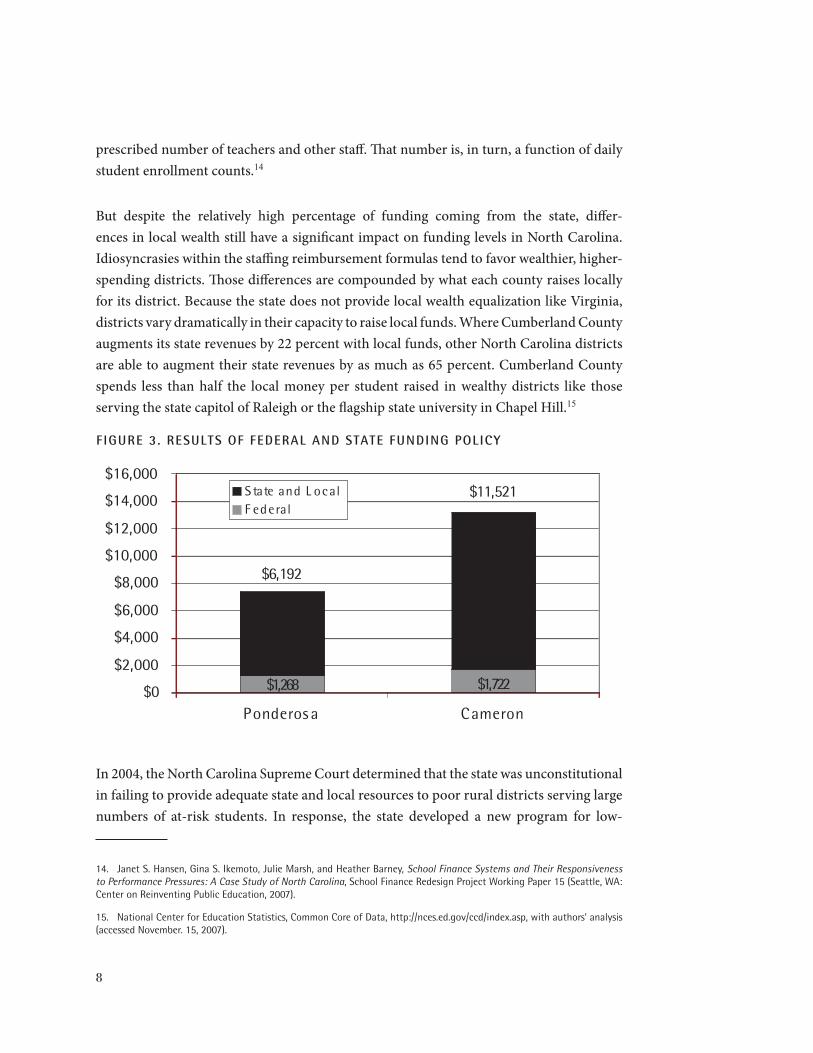
Figure 3. reSulTS oF Federal and STaTe Funding Policy
$1,268 $1,722
$6,192
$11,521
$0
$2,000
$4,000
$6,000
$8,000
$10,000
$12,000
$14,000
$16,000
Ponderos a Cameron
S tate and L ocalF ederal
In 2004, the North Carolina Supreme Court determined that the state was unconstitutional in failing to provide adequate state and local resources to poor rural districts serving large numbers of at-risk students. In response, the state developed a new program for low-
14. Janet S. Hansen, Gina S. Ikemoto, Julie Marsh, and Heather Barney, School Finance Systems and Their Responsiveness to Performance Pressures: A Case Study of North Carolina, School Finance Redesign Project Working Paper 15 (Seattle, WA: Center on Reinventing Public Education, 2007).
15. National Center for Education Statistics, Common Core of Data, http://nces.ed.gov/ccd/index.asp, with authors’ analysis (accessed November. 15, 2007).
9
income students, the “Disadvantaged Student Supplemental Fund.” But with a funding level of only $23 million in 2005–2006 (less than 1 percent of total state education funding), the program does not provide significant new funds to low-income districts. Because of a lack of local wealth and the state’s minimal funding of poor students, Cumberland receives only $6,192 in state and local funds per student for schools like Ponderosa.
As figure 3 shows, by the time the federal government is finished sending less money to poor states, and state governments are done constructing funding formulas that disadvan-tage poor districts, huge gaps have opened between the parent districts for schools like Cameron and Ponderosa. But this is not the end of the story. There is one more place where poor schools get shortchanged: within the school districts themselves.
Local PolicyHistorically, the smallest unit of analysis in most academic school funding studies was the school district. There are good reasons for this: districts are distinct legal entities subject to various accounting and audit requirements, so it is relatively easy to count how much money they have. Districts are also the unit at which most federal and state funding decisions are made.
But it turns out that districts make important decisions that determine how funding is dis-tributed among individual schools. The most significant decisions deal with how districts budget for teachers. Research has shown that when teachers choose where to work, they tend to gravitate toward schools with lower poverty levels and better working conditions.16 Either because of seniority-based work rules or simple value in the job market, teachers are better able to act on this preference as they gain years of experience. Teachers also get paid more as they gain experience. As a result, the average teacher salary in high-poverty schools, which frequently suffer from a steady “churn” of inexperienced, low-paid teachers who leave in short order, is usually much lower than in low-poverty schools that enjoy a stable, highly paid veteran staff. This results in significant per-student funding disparities between schools within districts.
16. Marguerite Roza and Paul Hill, “How Within-District Spending Inequities Help Some Schools to Fail,” in Brookings Papers on Education Policy 2004, ed. Diane Ravitch, 201-18 (Washington, DC: Brookings Press, 2004).
10
District allocation patterns also tend to shortchange poor schools in a second way, one that is even more counterintuitive. Not only do some higher-poverty schools get less expensive teachers and other staff, but the same schools often also get fewer teachers and other staff.17 School leaders, parents, and other stakeholders in more advantaged schools frequently work the system to ensure that their schools benefit from discretionary allocations (for example, an extra music teacher for the district’s award winning jazz program or a tech-nology expert at the high tech school), skate through budget cuts when other schools lose staff, or manage their enrollments to stay on the right side of formulas that reduce funding when enrollment drops below a specified amount.
As a result, schools like Ponderosa, which get the short end of both kinds of district-level disparity, get less money than other schools in the same district. Ponderosa has a staff of 35, one less than would be predicted by the district average. The teaching force is rela-tively junior and thus earns only an average of $35,610, about $2,000 less than the district average. Schools like Cameron, by contrast, disproportionately benefit from the same district policies. Cameron has slightly more than its share of teachers, the teaching force is experienced and stable, and the average teacher salary is $62,533, roughly $4,000 higher than the Fairfax County average.
This uneven distribution of teacher salaries also affects the distribution of federal Title I funds to schools. NCLB requires that districts only give Title I money to their highest-poverty schools. It also requires districts to first distribute state and local funds equitably so that students in high-poverty schools receive services that are “at least comparable” to those in lower-poverty schools. This “comparability” provision is designed to ensure that Title I fulfills its intended purpose: giving impoverished schoolchildren additional resources above and beyond what they normally receive.
But an obscure provision buried deep within NCLB—Section 1120(A)(c)(2)(B), to be exact—requires districts performing these “comparability” calculations to pretend that teacher salaries are the same across all schools in a district, even though that’s obviously not the case. So in complying with this provision, Cumberland County can replace Ponderosa’s real salaries with the district average of $2000 higher in its report. If these calculations were based on the actual amount of money spent in high-poverty schools that have many
17. Heather Rose, Jon Sonstelie, and Ray Reinhard, School Resources and Academic Standards in California: Lessons from the Schoolhouse (San Francisco, CA: Public Policy Institute of California, 2006).
11
inexperienced, low-paid teachers—the very schools Title I was designed to help—districts would have to direct more state and local resources to needy schools.
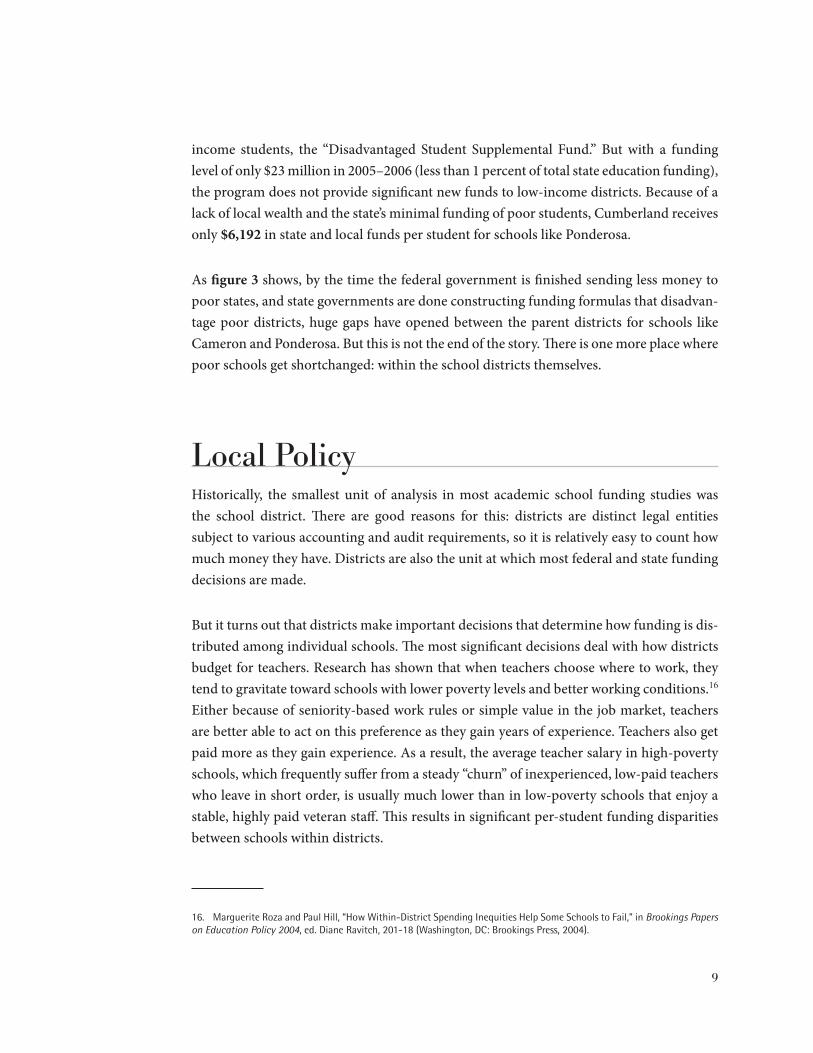
For Ponderosa, which is constantly losing more experienced teachers to wealthier neigh-boring states like Virginia and wealthier districts within North Carolina (a problem exacerbated by the federal- and state-level policies favoring those states and districts), these local policies mean fewer local resources. As figure 4 shows, local policies exacerbate the disparities between the schools profiled in this report. First, inequitable policies at state and federal levels work to bring some districts fewer revenues than others. Then schools like Ponderosa are shortchanged again when their district divvies up the financial pie among schools. While Ponderosa’s parent district, Cumberland County, receives an average of $6,192 in state and local revenues per pupil, Ponderosa gets only $5,911. Similarly, while Cumberland County is awarded an average of $1,268 in federal Title I funding per low-income student, Ponderosa receives only $862 in Title I funds per low-income student. Cameron Elementary, by contrast, receives its fair share of federal funding, since many of its teachers are well paid and experienced relative to other teachers in the district. Cameron also gets $12,317 in state and local funding, more than the district average of $11,521.
Figure 4. reSulTS oF Federal, STaTe, and local Funding Policy
$862 $1,723
$5,911
$12,317
$-
$2,000
$4,000
$6,000
$8,000
$10,000
$12,000
$14,000
$16,000
P o n d e ro s a C a m e ro n
S tate and L ocalF ederal
12
In terms of the raw numbers, the total dollar amounts involved in local differences between schools may be relatively small compared to disparities between districts or across states. The same is true for differences in federal funds. But federal and local funding policies are more important than they seem. The large fixed costs inherent to any school system—administration, transportation, maintenance, utilities, facilities, pensions, health insurance, etc.—are mostly paid from funds controlled by state policy. Federal and local decisions affect funding at the margins, disproportionately impacting the ability of schools to provide the additional resources, like specialists, tutoring, and extended learning time, that at-risk students need.
The final tally brings us back to the disparity shown in figure 1—Cameron Elementary school gets more than double the combined federal, state, and local funding of Ponderosa Elementary School: $14,040 per student, compared to $6,773, respectively. Similar schools, similar challenges, very different resources. This is not the kind of disparity typically high-lighted in analyses of school funding inequity, which often contrast distressed inner-city schools with wealthy suburbs nearby. Nor is this disparity a function of national extremes of wealth and poverty—Cameron and Ponderosa are in neighboring states and serve eco-nomically similar children. But just as one benefits at each level of the nation’s disparate education finance system, the other is disadvantaged.
Fortunately, this problem is solvable. If education policymakers at various levels of gov-ernment enact a set of common-sense—and long overdue—reforms, they can bring educational funding in line with the educational expectations enshrined in NCLB: equality for all students, including those who historically have been left behind.
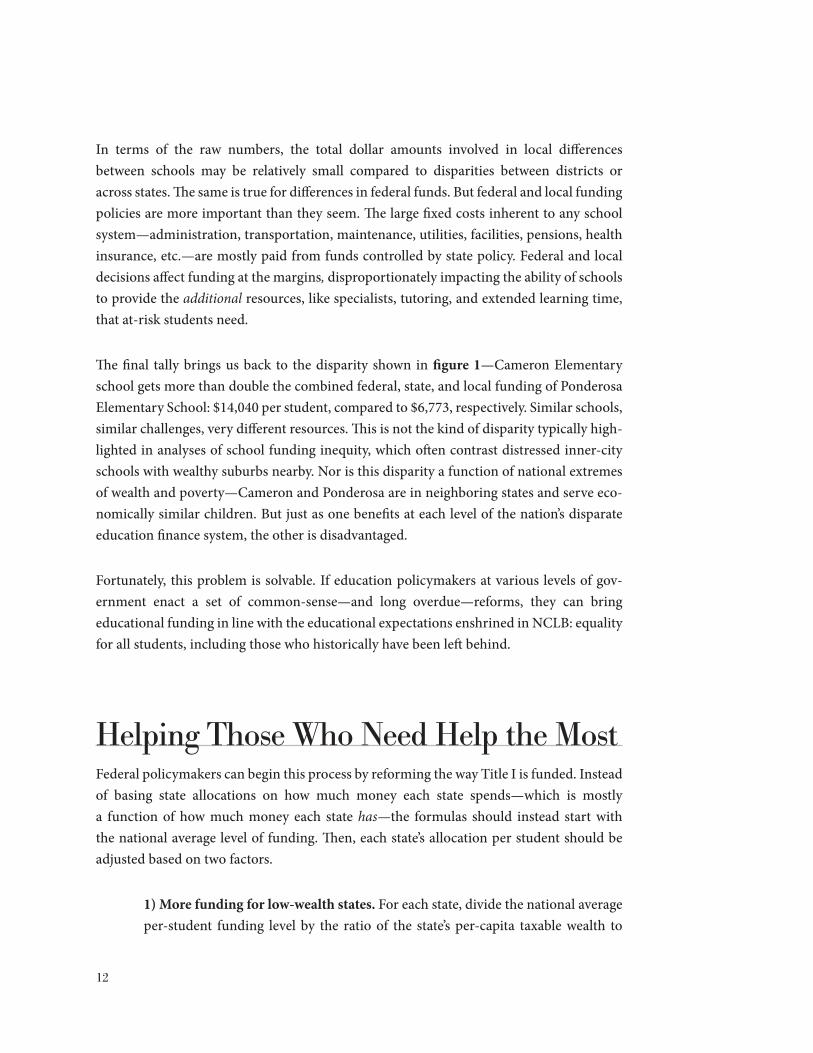
Helping Those Who Need Help the MostFederal policymakers can begin this process by reforming the way Title I is funded. Instead of basing state allocations on how much money each state spends—which is mostly a function of how much money each state has—the formulas should instead start with the national average level of funding. Then, each state’s allocation per student should be adjusted based on two factors.
1) More funding for low-wealth states. For each state, divide the national average per-student funding level by the ratio of the state’s per-capita taxable wealth to
13
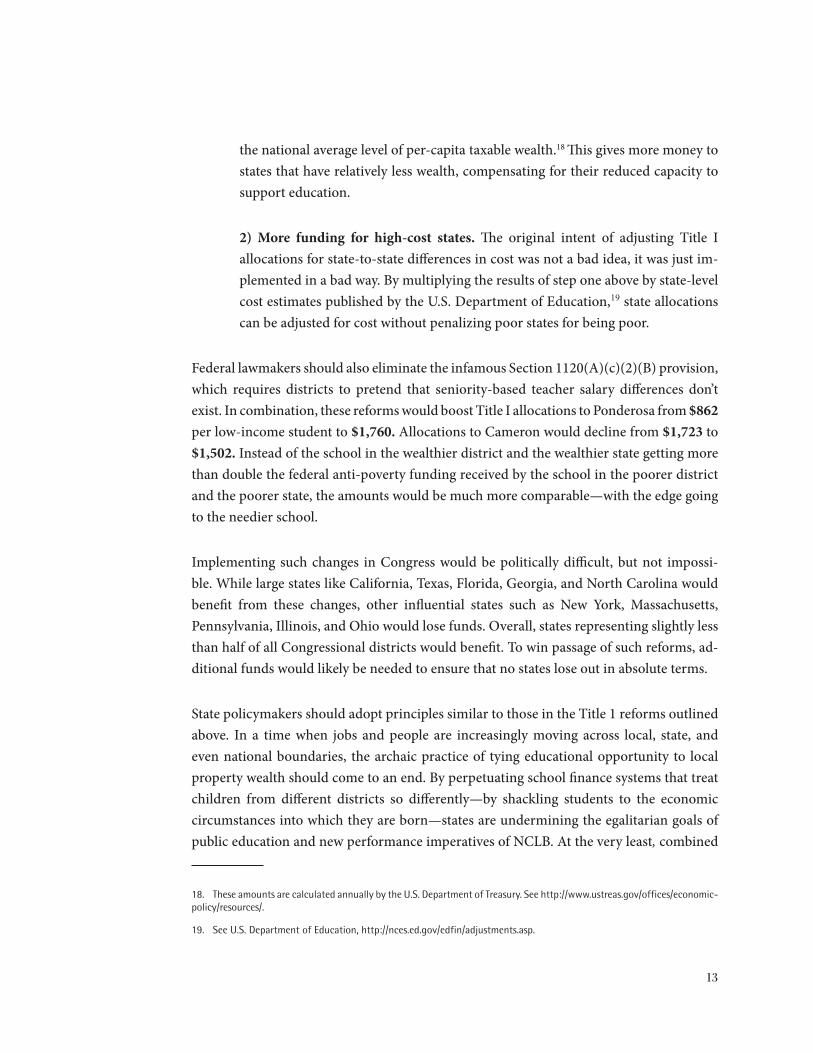
the national average level of per-capita taxable wealth.18 This gives more money to states that have relatively less wealth, compensating for their reduced capacity to support education.
2) More funding for high-cost states. The original intent of adjusting Title I allocations for state-to-state differences in cost was not a bad idea, it was just im-plemented in a bad way. By multiplying the results of step one above by state-level cost estimates published by the U.S. Department of Education,19 state allocations can be adjusted for cost without penalizing poor states for being poor.
Federal lawmakers should also eliminate the infamous Section 1120(A)(c)(2)(B) provision, which requires districts to pretend that seniority-based teacher salary differences don’t exist. In combination, these reforms would boost Title I allocations to Ponderosa from $862 per low-income student to $1,760. Allocations to Cameron would decline from $1,723 to $1,502. Instead of the school in the wealthier district and the wealthier state getting more than double the federal anti-poverty funding received by the school in the poorer district and the poorer state, the amounts would be much more comparable—with the edge going to the needier school.
Implementing such changes in Congress would be politically difficult, but not impossi-ble. While large states like California, Texas, Florida, Georgia, and North Carolina would benefit from these changes, other influential states such as New York, Massachusetts, Pennsylvania, Illinois, and Ohio would lose funds. Overall, states representing slightly less than half of all Congressional districts would benefit. To win passage of such reforms, ad-ditional funds would likely be needed to ensure that no states lose out in absolute terms.
State policymakers should adopt principles similar to those in the Title 1 reforms outlined above. In a time when jobs and people are increasingly moving across local, state, and even national boundaries, the archaic practice of tying educational opportunity to local property wealth should come to an end. By perpetuating school finance systems that treat children from different districts so differently—by shackling students to the economic circumstances into which they are born—states are undermining the egalitarian goals of public education and new performance imperatives of NCLB. At the very least, combined
18. These amounts are calculated annually by the U.S. Department of Treasury. See http://www.ustreas.gov/offices/economic-policy/resources/.
19. See U.S. Department of Education, http://nces.ed.gov/edfin/adjustments.asp.
14
state and local funding per student should be equal among districts within each state. There are many tried-and-true ways to do this. In the past four decades, a number of states have successfully implemented large-scale state education funding reforms that matched a reduction in school revenues from local property taxes with a corresponding increase in revenues from state taxes on sales and income. Because state funds are often distributed in inverse proportion to local wealth, overall equity is increased.
Similarly, states can use state revenues to establish high minimum or “foundation” funding levels for all districts. To be effective, such policies must give districts that receive only the minimum level enough money to effectively compete in the job market for high-quali-ty teachers. Very low minimum funding levels, such as those currently used in Virginia, provide a foundation that is shaky at best. States can also limit the ability of wealthy school districts to unilaterally raise funds. This is distinguished from school funding plans that overtly redistribute local revenues from one district to another, which have proved to be extremely unpopular in states such as Texas and Vermont. Instead, states can create what amounts to a funding ceiling to go along with the foundation or floor, so that very wealthy districts do not end up with a disproportionate share of education resources.
Local districts should adopt similar principles when it comes to distributing funds to in-dividual schools. Instead of simply giving schools enough money to pay for the teachers they hire—even when the teachers in some schools are far more expensive than others—they should allocate a standard amount of money per student to each school. Under such a policy, a school might choose to hire a smaller number of experienced, high-cost teachers, or it might choose to lower class size by hiring a larger number of younger, lower-paid teachers. A high-poverty school could offer recruitment bonuses to attract and retain teachers, in order to reduce frequent teacher turnover.
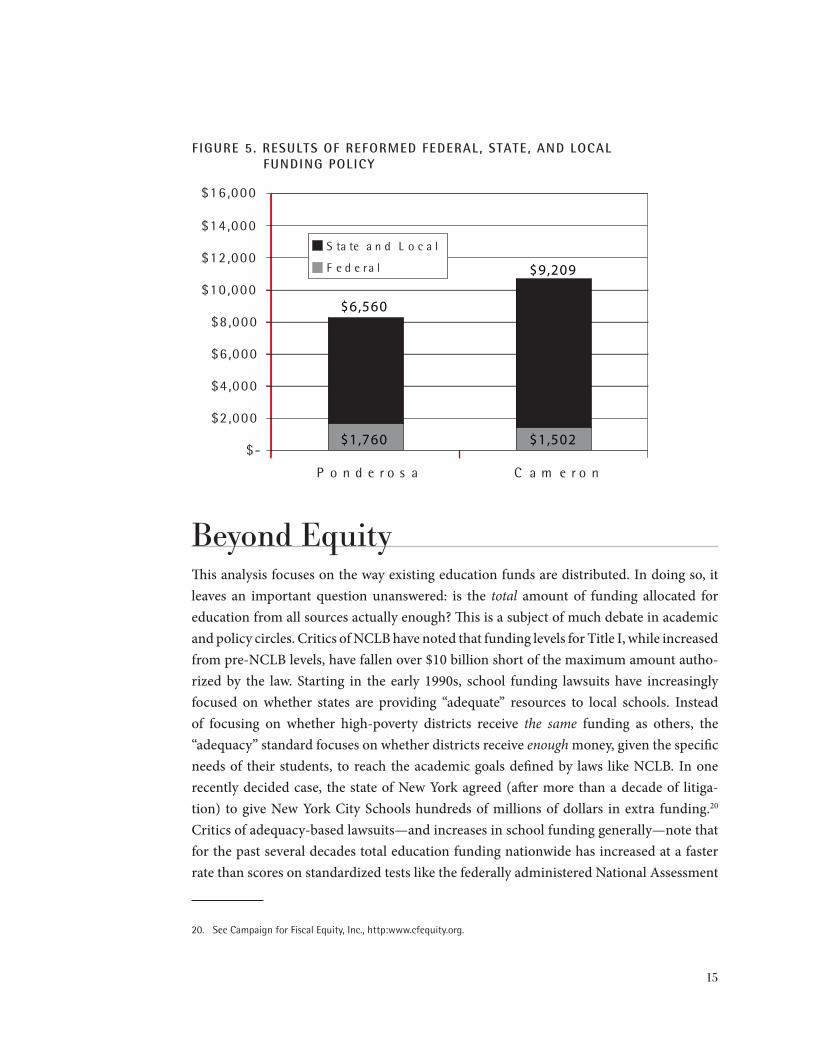
These reforms to state and local school funding policy would increase state and local funding per student to Ponderosa from $5,911 to $6,560. They would reduce state and local funding per student to Cameron from $12,317 to $9,209. Combined with federal reforms, the net result can be seen in figure 5. Instead of Cameron receiving more than double what Ponderosa receives, its total allocation of $10,711 would be only 29 percent greater than Ponderosa’s $8,320. Two similar schools would be funded in a much more similar way.
15
Figure 5. reSulTS oF reFormed Federal, STaTe, and local Funding Policy
Beyond EquityThis analysis focuses on the way existing education funds are distributed. In doing so, it leaves an important question unanswered: is the total amount of funding allocated for education from all sources actually enough? This is a subject of much debate in academic and policy circles. Critics of NCLB have noted that funding levels for Title I, while increased from pre-NCLB levels, have fallen over $10 billion short of the maximum amount autho-rized by the law. Starting in the early 1990s, school funding lawsuits have increasingly focused on whether states are providing “adequate” resources to local schools. Instead of focusing on whether high-poverty districts receive the same funding as others, the “adequacy” standard focuses on whether districts receive enough money, given the specific needs of their students, to reach the academic goals defined by laws like NCLB. In one recently decided case, the state of New York agreed (after more than a decade of litiga-tion) to give New York City Schools hundreds of millions of dollars in extra funding.20 Critics of adequacy-based lawsuits—and increases in school funding generally—note that for the past several decades total education funding nationwide has increased at a faster rate than scores on standardized tests like the federally administered National Assessment
20. See Campaign for Fiscal Equity, Inc., http:www.cfequity.org.
$1,760 $1,502
$6,560
$9,209
$-
$2 ,000
$4 ,000
$6 ,000
$8 ,000
$10 ,000
$12 ,000
$14 ,000
$16 ,000
P o n d e r o s a C a m e r o n
S ta te a n d L o c a l
F e d e ra l
16
of Educational Progress or the SAT, and has done little to shrink the achievement gap between poor and wealthy students.
Providing more overall education funding properly targeted to high-need schools would help alleviate the most painful consequence of the reforms described above: less money for schools like Cameron Elementary. Few would begrudge Cameron’s abundant resources, low-class sizes, and stable, experienced work force—these things undoubtedly contribute to the school’s relatively high level of academic success given its student demographics. The ideal solution is to bring schools like Ponderosa up to a sufficient funding level, not push more fortunate high-need schools down.
At the same time, resources are always limited to some degree. Given the nation’s long-term fiscal challenges in providing income security and health care for an aging population, limited public funds will likely be the norm for the foreseeable future, and hard choices will have to be made. We will never be able to provide every child with all the resources we might want for them. But we can refuse to privilege some children over others arbi-trarily, or worse, perversely. By breaking the historic pattern of school funding at all levels of government—by redesigning resource allocation policies to benefit those who need the most, not those who already have the most—policymakers can finally bring school funding policy in line with uniform expectations for performance they have already imposed.


