civil engineering | urban infrastructure | project management
Stirling City Centre Structure Plan
Services Infrastructure Report – Part 3
Services Infrastructure Report – Part 3
Document / Report Control Form
Project Name: Stirling City Centre Structure Plan Services Infrastructure Assessment Report – Part 3
Project number: 3006072
Report for: Stirling City Alliance
PREPARATION, REVIEW AND AUTHORISATION
Revision # Date Prepared by Reviewed by Approved for Issue by
0 29/07/2009 Paul Mallon Patrick Bingham Dean Illingworth
ISSUE REGISTER
Distribution List Date Issued Number of Copies
Stirling City Alliance: 1
LandCorp 2
SMEC staff:
Associates:
Perth Office Library:
Report Project File: 1
SMEC Australia Pty Ltd
Level 6, 12 St Georges Terrace,
Perth, WA 6000
Tel: (08) 9323 5900 Fax: (08) 9323 5901 Email: [email protected]
www.smec.com
The information within this document is and shall remain the property of SMEC.
Services Infrastructure Report – Part 3
1
Contents
Contents .......................................... ............................................................................ 1
Introduction ...................................... ........................................................................... 2
Structure Plan Area ............................... ...................................................................... 2
Project Phases .................................... ........................................................................ 2
Infrastructure Requirements ....................... ............................................................... 5
Water ............................................................................................................................ 6
Wastewater ................................................................................................................... 6
Electrical Power ............................................................................................................ 6
Gas ............................................................................................................................... 6
Communications ........................................................................................................... 6
Drainage ....................................................................................................................... 6
Infrastructure Costs and Cash Flow Projections .... .................................................. 6
Water ............................................................................................................................ 7
Wastewater ................................................................................................................... 7
Electrical Power ............................................................................................................ 7
Communications ........................................................................................................... 7
Drainage ....................................................................................................................... 8
Modifications to Existing Infrastructure .......................................................................... 8
Conclusions ....................................... .......................................................................... 8
Figures ........................................... ............................................................................ 13

Services Infrastructure Report – Part 3
2
Introduction
SMEC Urban has been engaged to review existing services infrastructure within the Stirling City Centre Structure Plan Area and to provide an assessment of services infrastructure requirements to facilitate future development in accordance with that Structure Plan.
The review of existing infrastructure was issued as Part 1. The assessment of likely infrastructure requirements for the whole of the Structure Plan Area was issued as Part 2. This document, the assessment of infrastructure requirements for the staged development of the Structure Plan Area, with particular focus on State Owned land, forms Part 3 of the Services Infrastructure Report.
Structure Plan Area
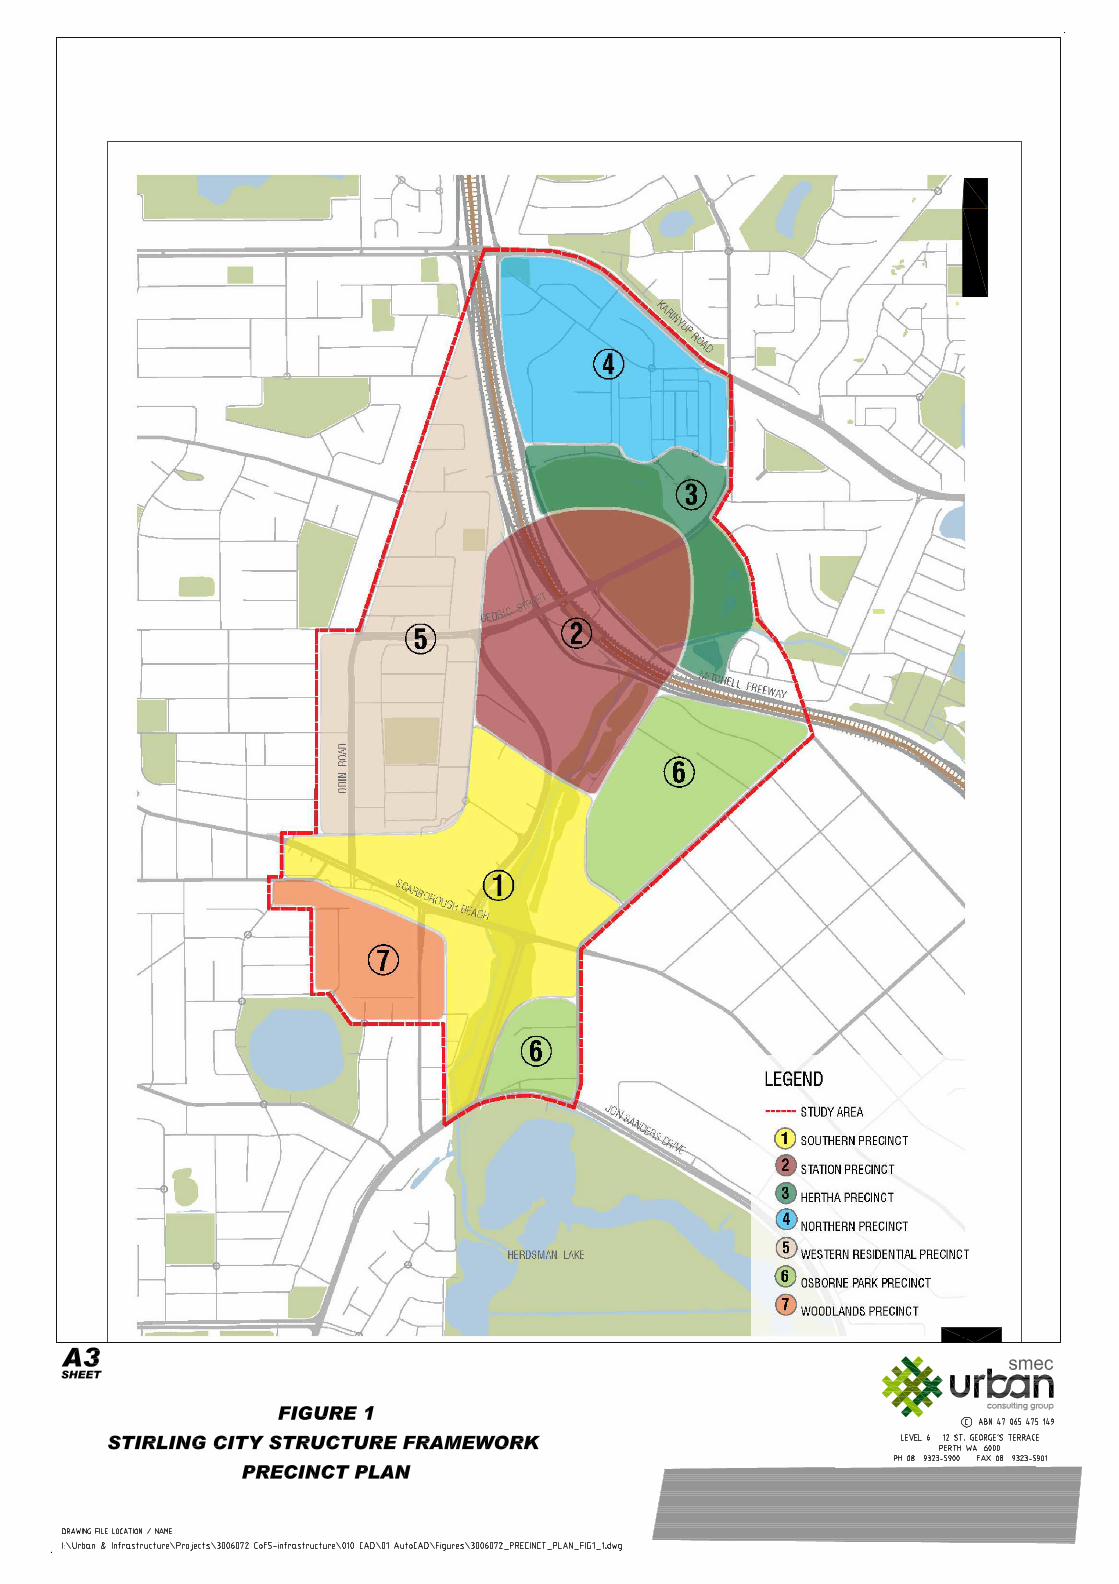
The Stirling City Centre Structure Plan Area is shown in Figure 1. It is proposed to develop the area into a mixed-use activity and employment centre comprising a wide range of regional shopping, office, administrative, residential, social, entertainment and recreational uses.
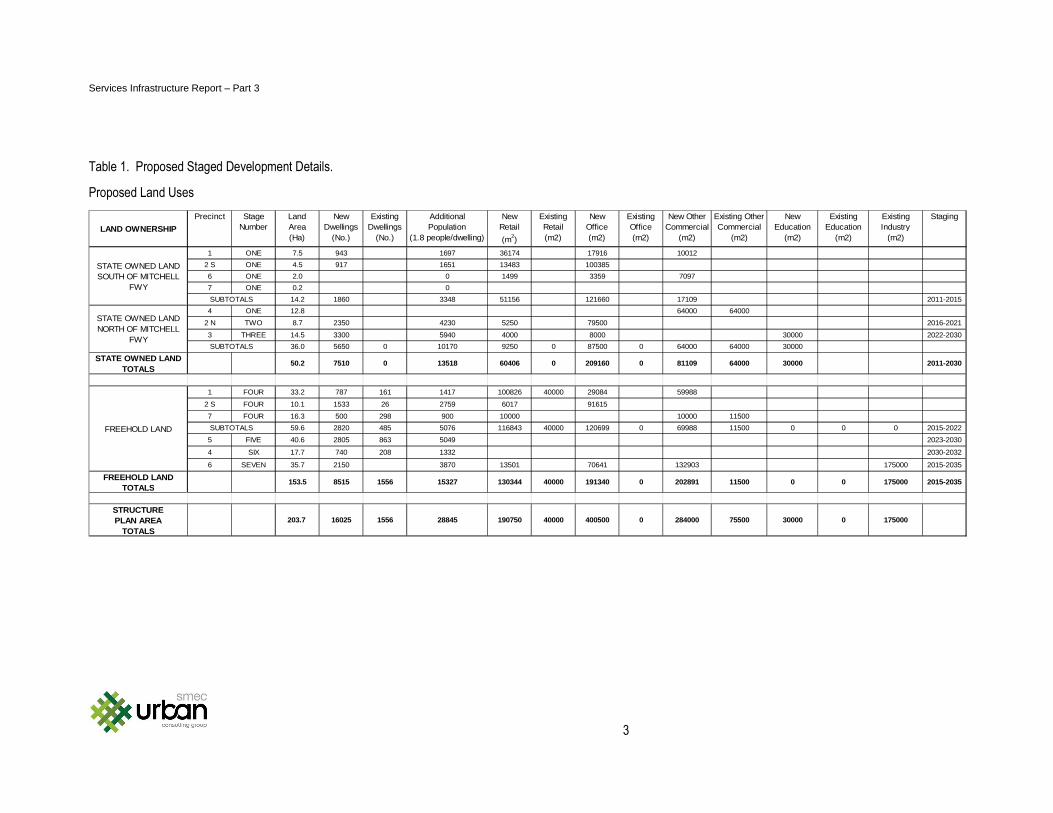
In July 2009, proposed land uses were further refined and staged development plans prepared by the Stirling City Alliance.
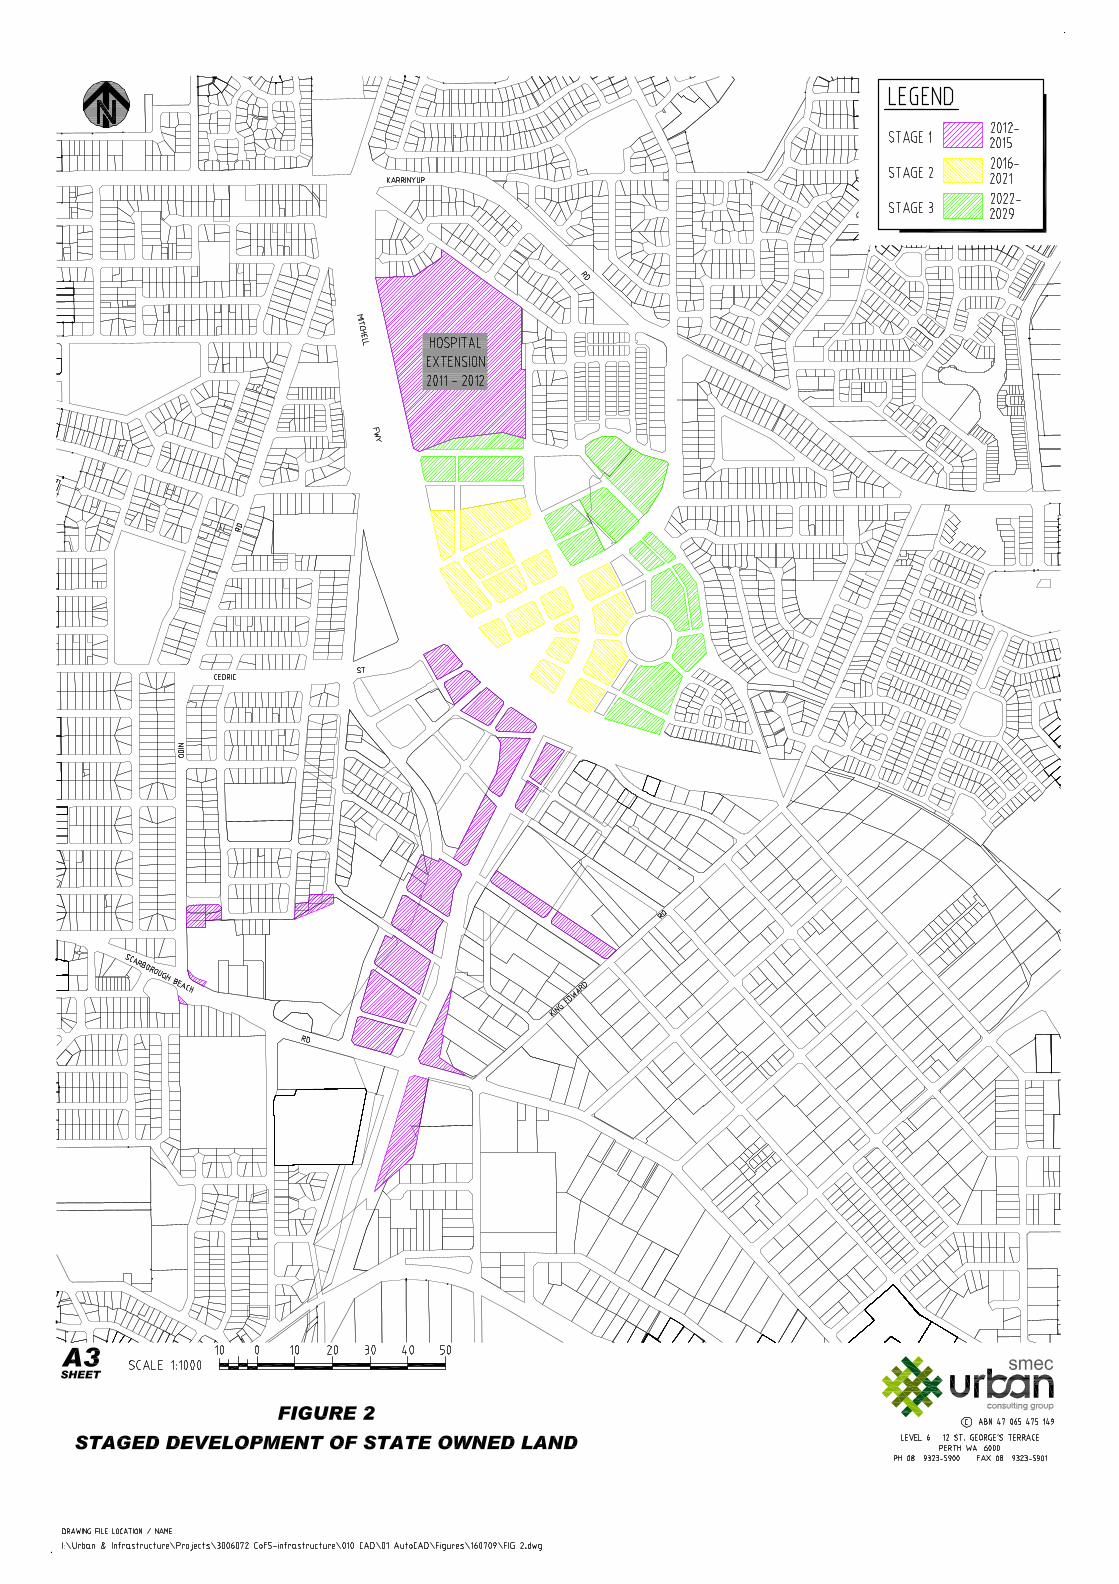
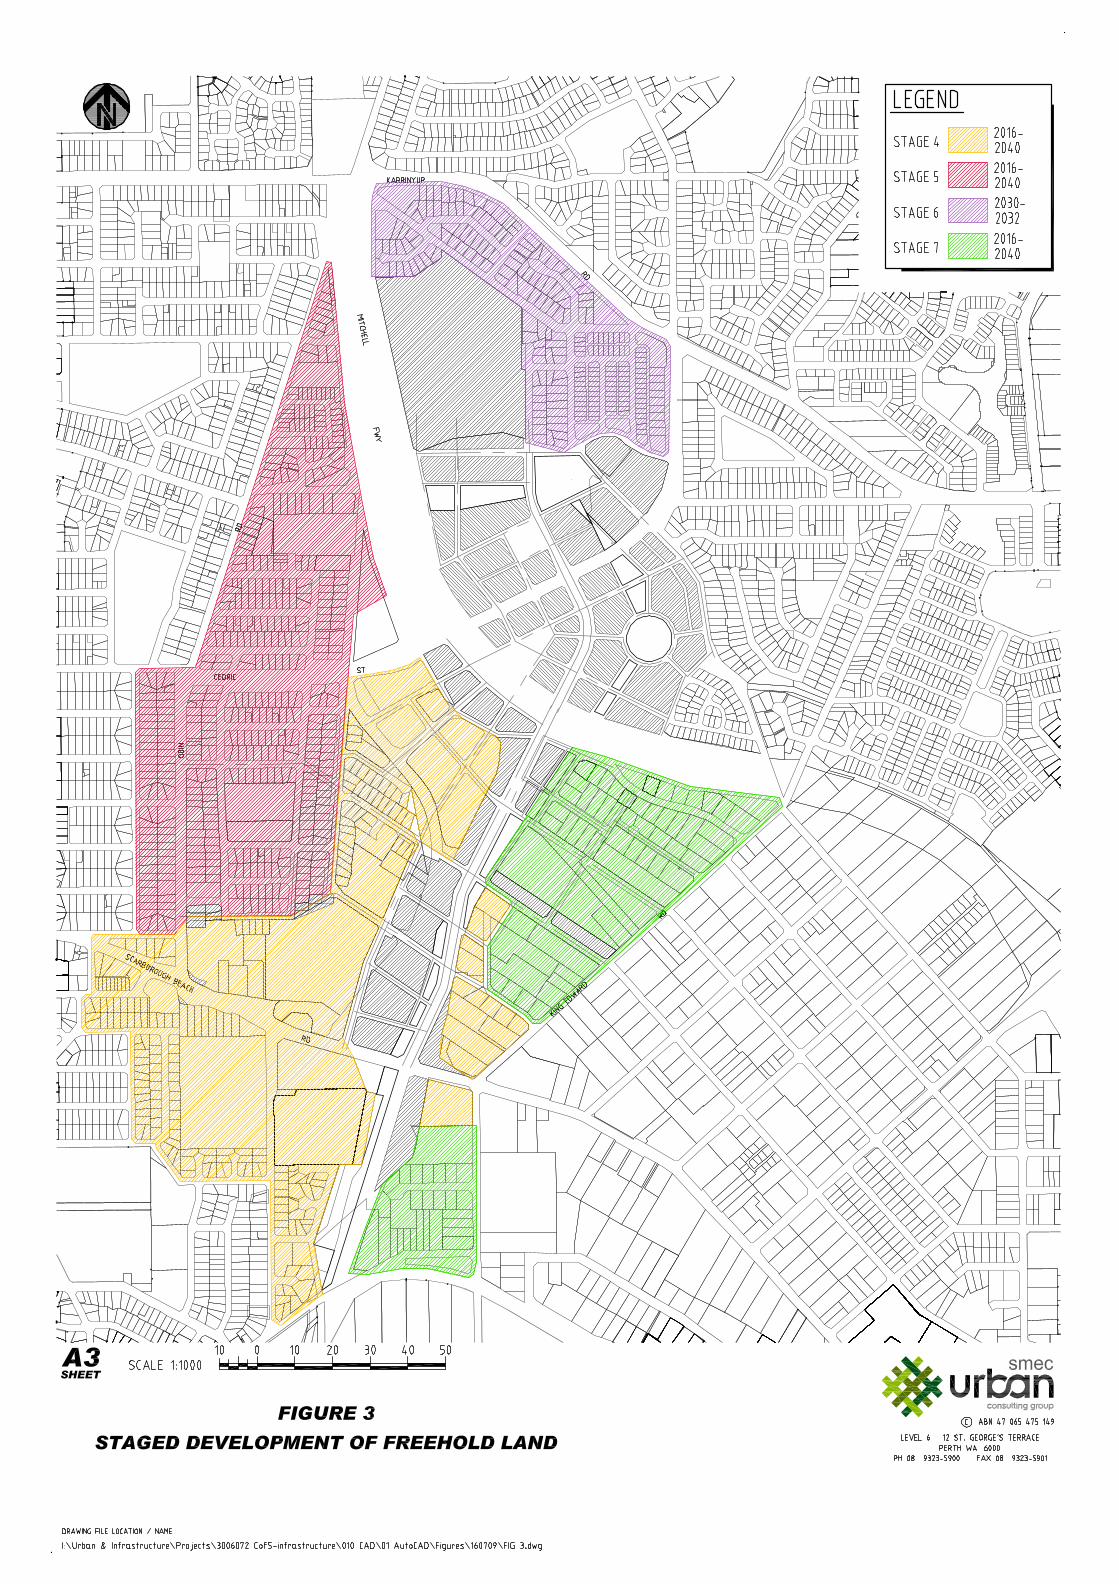
It is now proposed to develop the Structure Plan Area in seven (7) stages. Stages 1 to 3 relate to the development of State owned land as shown in Figure 2. Stages 4 to 7 relate to the development of freehold land as shown in Figure 3.
Details of the total number of new and existing dwellings and proposed areas of retail, office and other commercial land uses for each of the seven (7) stages have been provided by the Stirling City Alliance and are set out in Table 1 below.
Project Phases
The Commonwealth Government Department of Infrastructure, Transport, Regional Development and Local Government’s guidelines “Best Practice Cost Estimation for Publically Funded Road and Rail Construction”, identifies four (4) distinct phases in the life of a project. Paraphrasing from that publication, they are:
Project Identification.
This is a strategic phase where alternatives are considered. Specific data is often scarce or unavailable so typical or benchmark rates and costs are used. Cost estimates are for the purposes of comparing alternatives rather than for budget purposes.
Federal Infrastructure uses this phase to do Strategic Merit Tests (SMT) which include Rapid Benefit Cost Analysis (BCA) on alternatives to establish if there is a potentially suitable project for Australian Government Road and Rail funding.
If a budget cost has to be provided, it should include very substantial contingency allowances. There is a high risk that later estimates will be different if this estimate is used as the basis for any project.
Services Infrastructure Report – Part 3
3
Table 1. Proposed Staged Development Details.
Proposed Land Uses
1 ONE 7.5 943 1697 36174 17916 10012
2 S ONE 4.5 917 1651 13483 100385
6 ONE 2.0 0 1499 3359 7097
7 ONE 0.2 0
14.2 1860 3348 51156 121660 17109 2011-2015
4 ONE 12.8 64000 64000
2 N TWO 8.7 2350 4230 5250 79500 2016-2021
3 THREE 14.5 3300 5940 4000 8000 30000 2022-2030
36.0 5650 0 10170 9250 0 87500 0 64000 64000 30000
STATE OWNED LAND TOTALS
50.2 7510 0 13518 60406 0 209160 0 81109 64000 30000 2011-2030
1 FOUR 33.2 787 161 1417 100826 40000 29084 59988
2 S FOUR 10.1 1533 26 2759 6017 91615
7 FOUR 16.3 500 298 900 10000 10000 11500
59.6 2820 485 5076 116843 40000 120699 0 69988 11500 0 0 0 2015-2022
5 FIVE 40.6 2805 863 5049 2023-2030
4 SIX 17.7 740 208 1332 2030-2032
6 SEVEN 35.7 2150 3870 13501 70641 132903 175000 2015-2035
FREEHOLD LAND TOTALS
153.5 8515 1556 15327 130344 40000 191340 0 202891 11500 0 0 175000 2015-2035
STRUCTURE PLAN AREA
TOTALS203.7 16025 1556 28845 190750 40000 400500 0 284000 75500 30000 0 175000
Existing Retail (m2)
SUBTOTALSFREEHOLD LAND
LAND OWNERSHIP
Precinct Stage Number
STATE OWNED LAND SOUTH OF MITCHELL
FWY
STATE OWNED LAND NORTH OF MITCHELL
FWY
SUBTOTALS
SUBTOTALS
Land Area (Ha)
New Dwellings
(No.)
Existing Dwellings
(No.)
Additional Population
(1.8 people/dwelling)
New Retail
(m2)
StagingExisting Industry
(m2)
New Office (m2)
Existing Office (m2)
New Other Commercial
(m2)
Existing Other Commercial
(m2)
New Education
(m2)
Existing Education
(m2)

Services Infrastructure Report – Part 3
4
Table 1. Continued…
Estimated Additional Population Growth
STAGE 2011 2012 2013 2014 2015 2016 2017 2018 2019 2020 2021 2022 2023 2024 20251 837 837 837 837
2 705 705 705 705 705 705
3 743 743 743 743
4 203 203 203 203 203 203 203 203 203 203
5 202 202 202 202 202 202 202 202 202 202
6
7 155 155 155 155 155 155 155 155 155 155
TOTALS - 837 837 837 837 1265 1265 1265 1265 1265 1265 1302 1302 1302 1302
CUMULATIVE TOTALS
0.000 837 1674 2511 3348 4613 5878 7142 8407 9672 10937 12239 13541 14844 16146
STAGE 2026 2027 2028 2029 2030 2031 2032 2033 2034 2035 2036 2037 2038 2039 2040
1
2
3 743 743 743 743
4 203 203 203 203 203 203 203 203 203 203 203 203 203 203 203
5 202 202 202 202 202 202 202 202 202 202 202 202 202 202 202
6 444 444 444
7 155 155 155 155 155 155 155 155 155 155 155 155 155 155 155
TOTALS 1302 1302 1302 1302 1004 1004 1004 560 560 560 560 560 560 560 560
CUMULATIVE TOTALS
17448 18751 20053 21355 22359 23363 24367 24926 25486 26046 26606 27166 27725 28285 28845

Services Infrastructure Report – Part 3
5
Project Scoping.
This is a scoping (or concept) phase that concludes with a Business Case, usually for a preferred option.
The capital cost estimate produced in this phase is the first cost estimate in the life of a project that should be able to be relied upon for program purposes. It must be underpinned by sufficient levels of investigation, preliminary design of key elements to ensure constructability, expert knowledge to advise on the design, definition and construction, comparison with benchmark costs, appropriate risk and contingency allowances and rigorous review.
An Outturn Cost estimate at this phase requires a cash flow that is based on a stated plan to construction commencement plus a construction program based on an identified delivery method and identified constraints. It also requires an assessment of likely escalation in the market place during the planned time frame to completion of construction.
An Outturn Cost estimate prepared as part of a full Business Case and detailed Benefit Cost Ratio during the Project Scoping phase in the Federal Infrastructure process becomes part of a request for Australian Government funding.
Project Development.
The Project Development phase takes the project from post Business Case to be ready to call tenders for construction or equivalent. The Project Development phase (or pre-tender) cost estimate is made with the design either fully complete (for Construct Only contracts) or to a reasonable preliminary stage (for Design & Construct or Early Contractor Involvement contracts).
Project Delivery.
The Project Delivery phase includes the final procurement activities, award of contracts and construction through to commissioning and handover. The outcome of this phase is a final project outturn cost, being the actual costs incurred during delivery and all previous phases.
The infrastructure works defined in this Report are based largely on preliminary advice from the various service authorities provided for the purposes of gleaning an idea of what additional works could be required to service the development. Actual requirements may vary substantially. The various service authorities have advised that they intend to await the outcomes of the Stirling City Centre Structure Planning process, when land use zonings are more clearly defined, before undertaking any substantive infrastructure planning.
With reference to the aforementioned four (4) phases, it is considered that, in terms of infrastructure requirements, the project currently resides within the “Project Identification” phase. Accordingly, probable cost estimates and cash flow projections prepared at this point in time may vary considerably from actual costs and cash flows so should be used with caution.
Infrastructure Requirements
Services infrastructure considered in this report include: water, wastewater, electricity, gas, telecommunications and storm water drainage.
Asset maps of existing services infrastructure were provided in Part 1. Total infrastructure requirements for the whole of the Structure Plan Area were provided in Part 2.
The assessment of infrastructure requirements for the staged development of the Structure Plan Area, with particular focus on State Owned land, are considered in this Report.
Services Infrastructure Report – Part 3
6
Water
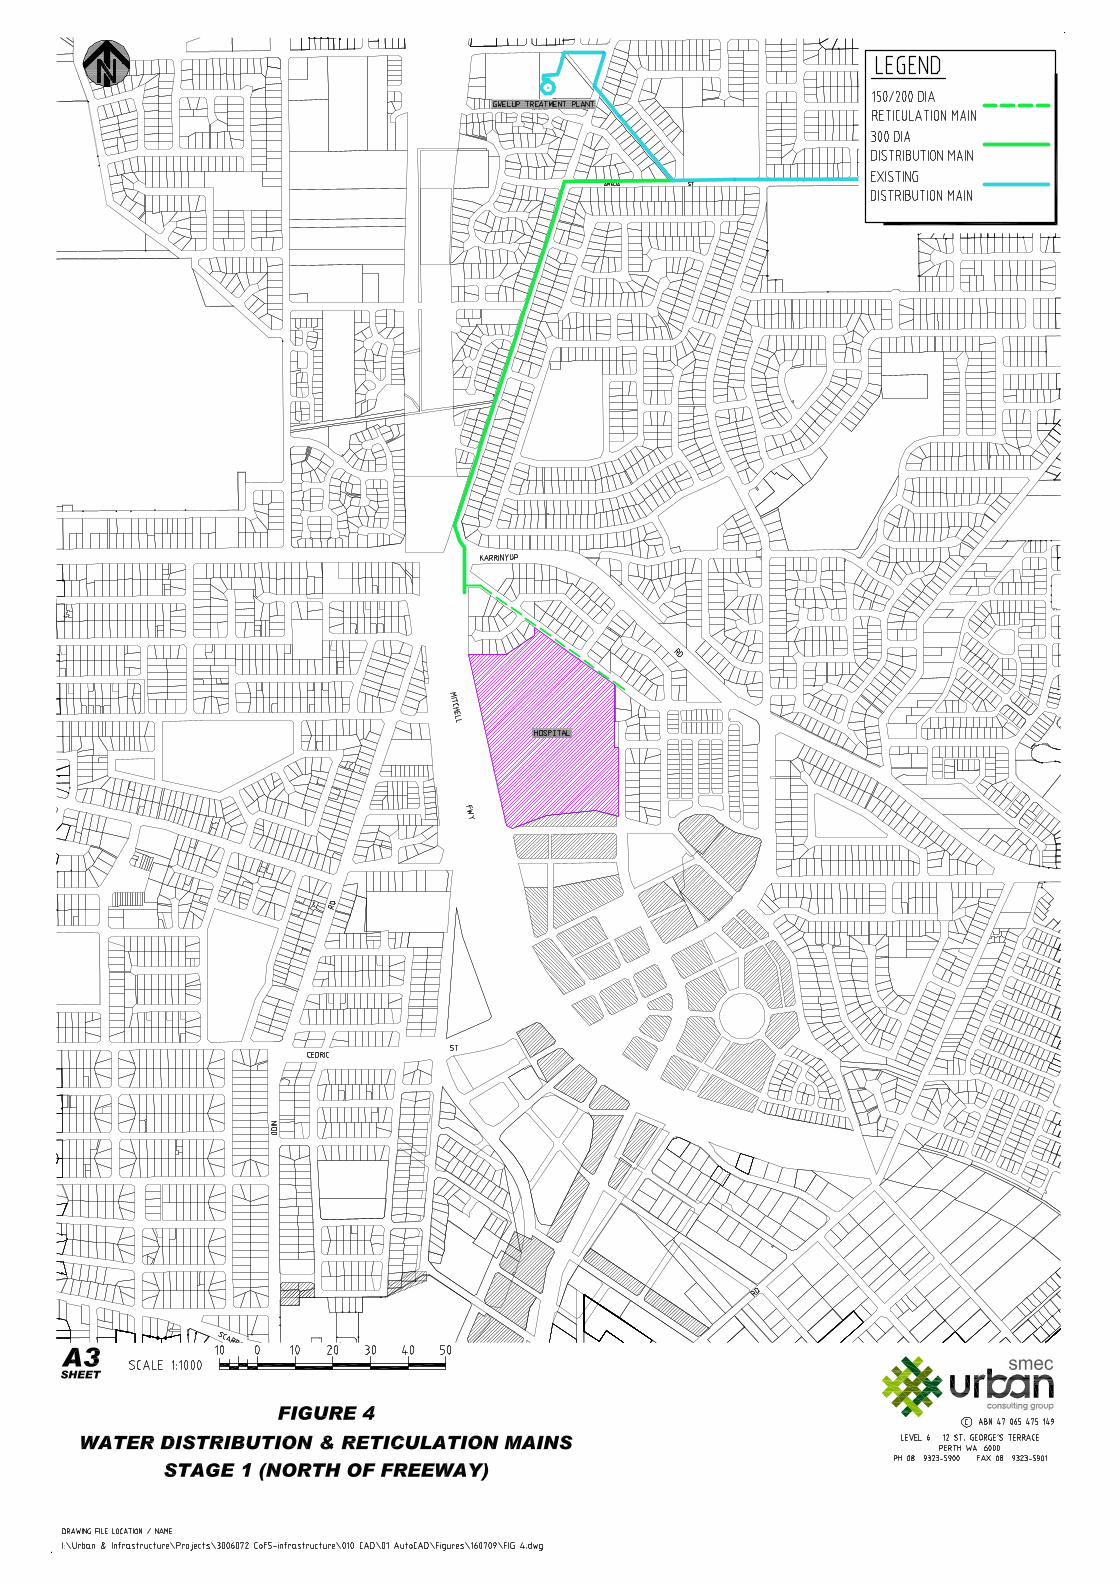
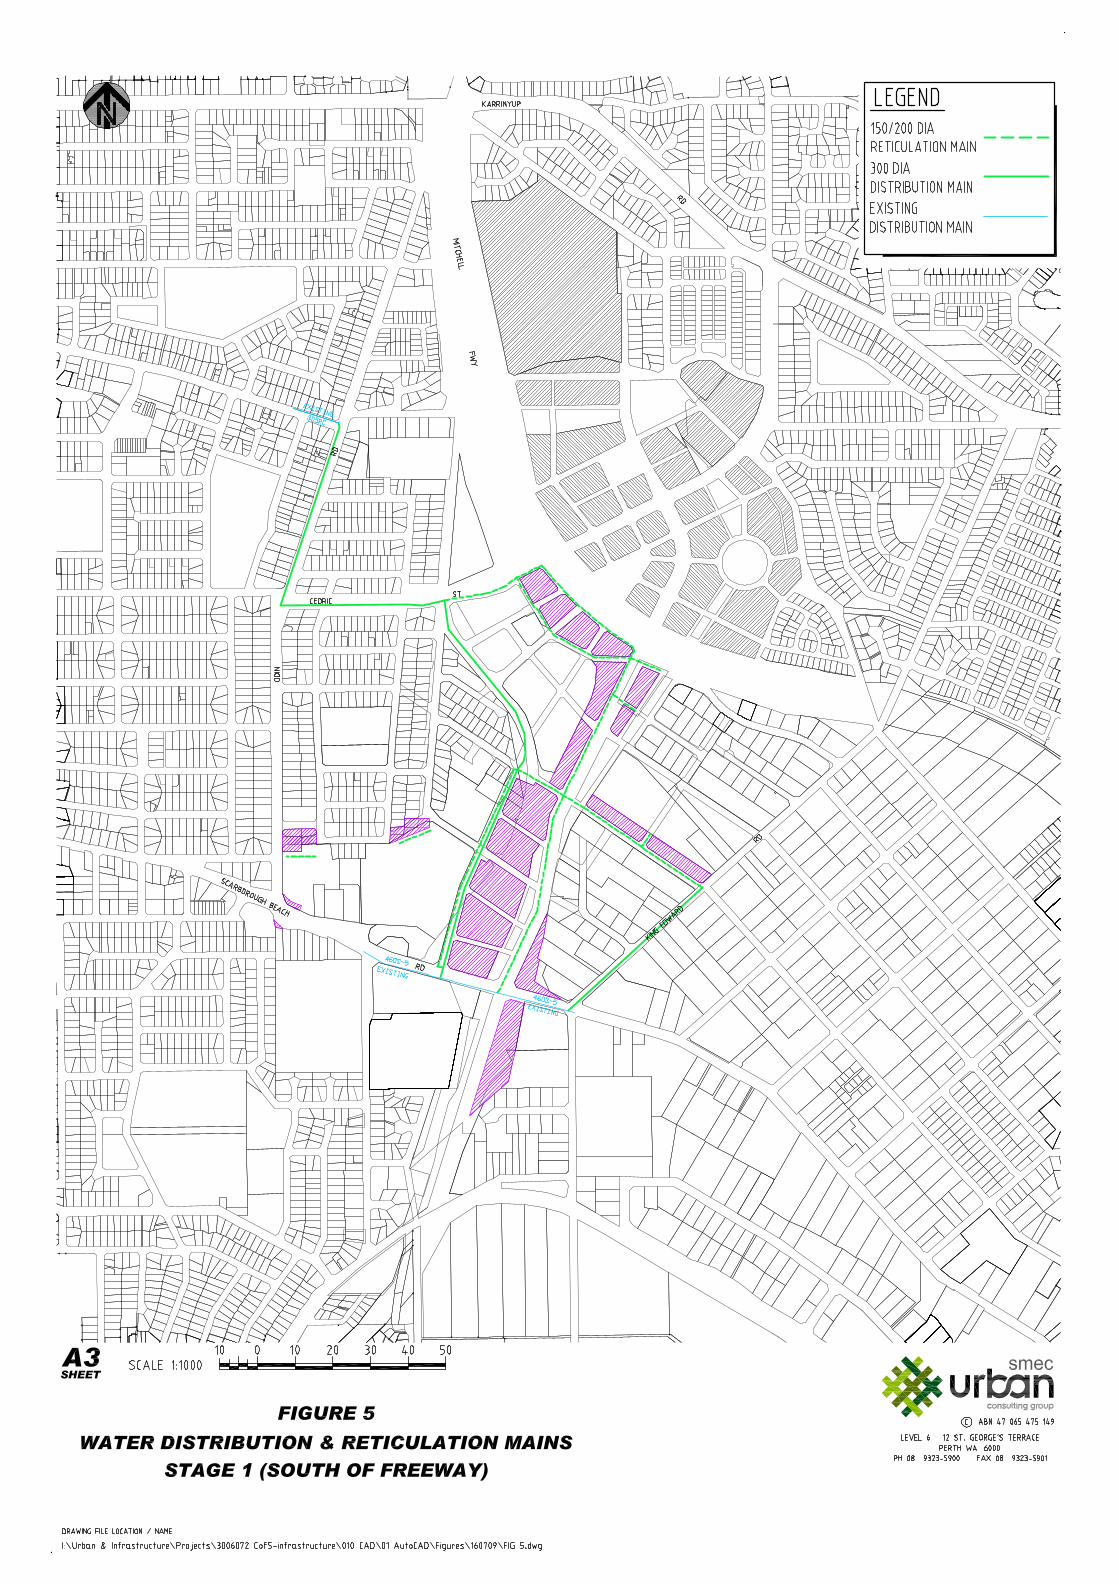
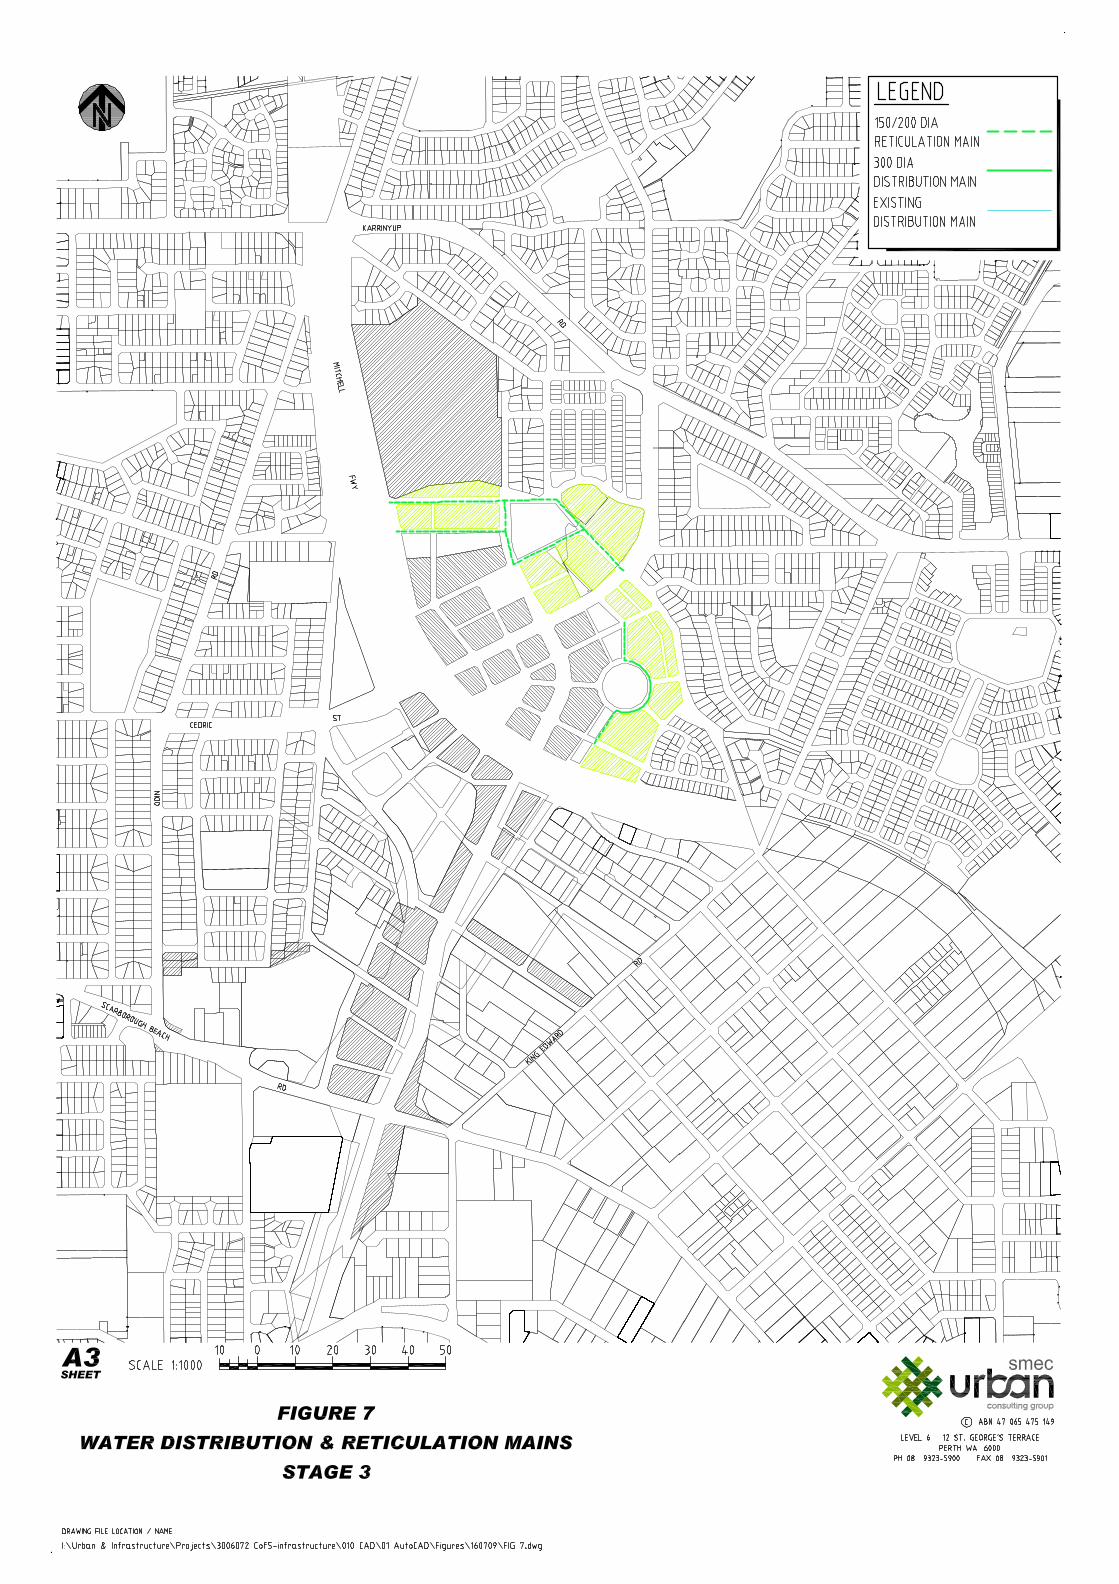
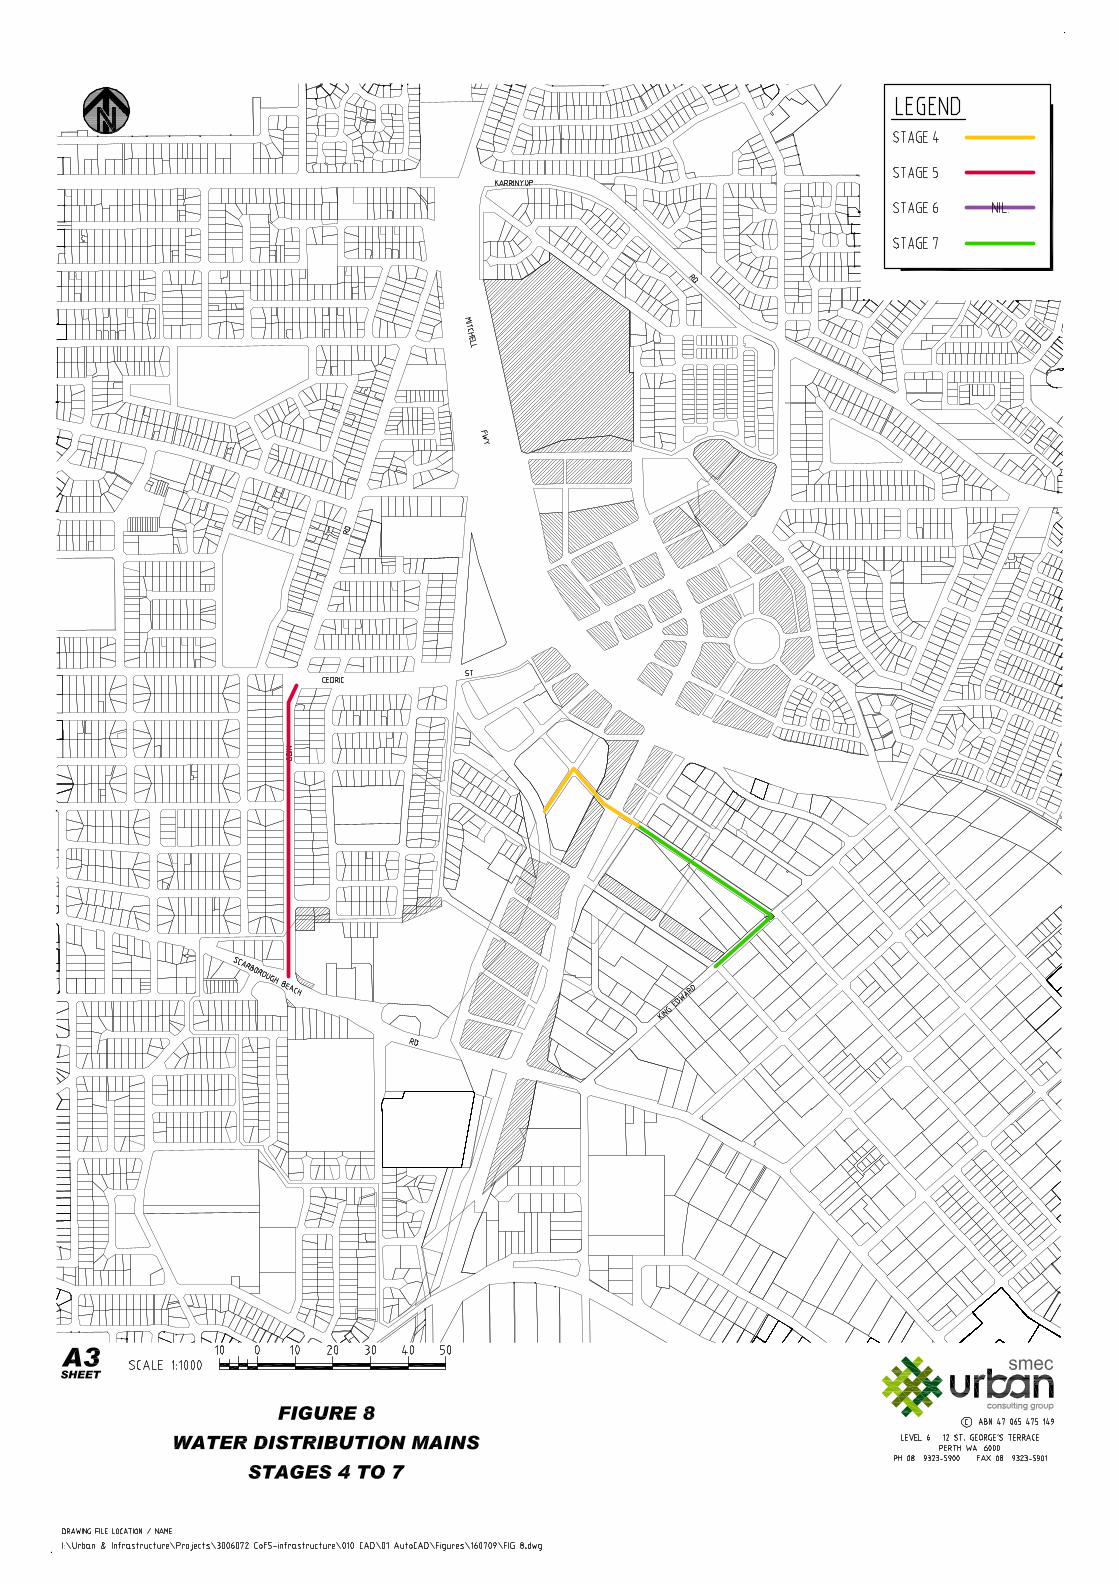
The staged implementation of water distribution and reticulation infrastructure for the proposed three (3) stages of development of State Government land are shown in Figures 4 to 7. The staged implementation of water distribution infrastructure for the proposed four (4) stages of development of freehold land is shown in Figure 8.
In total, the anticipated scope of works are as described in Part 2. The works have simply been subdivided into elements considered necessary to service each Stage.
Wastewater
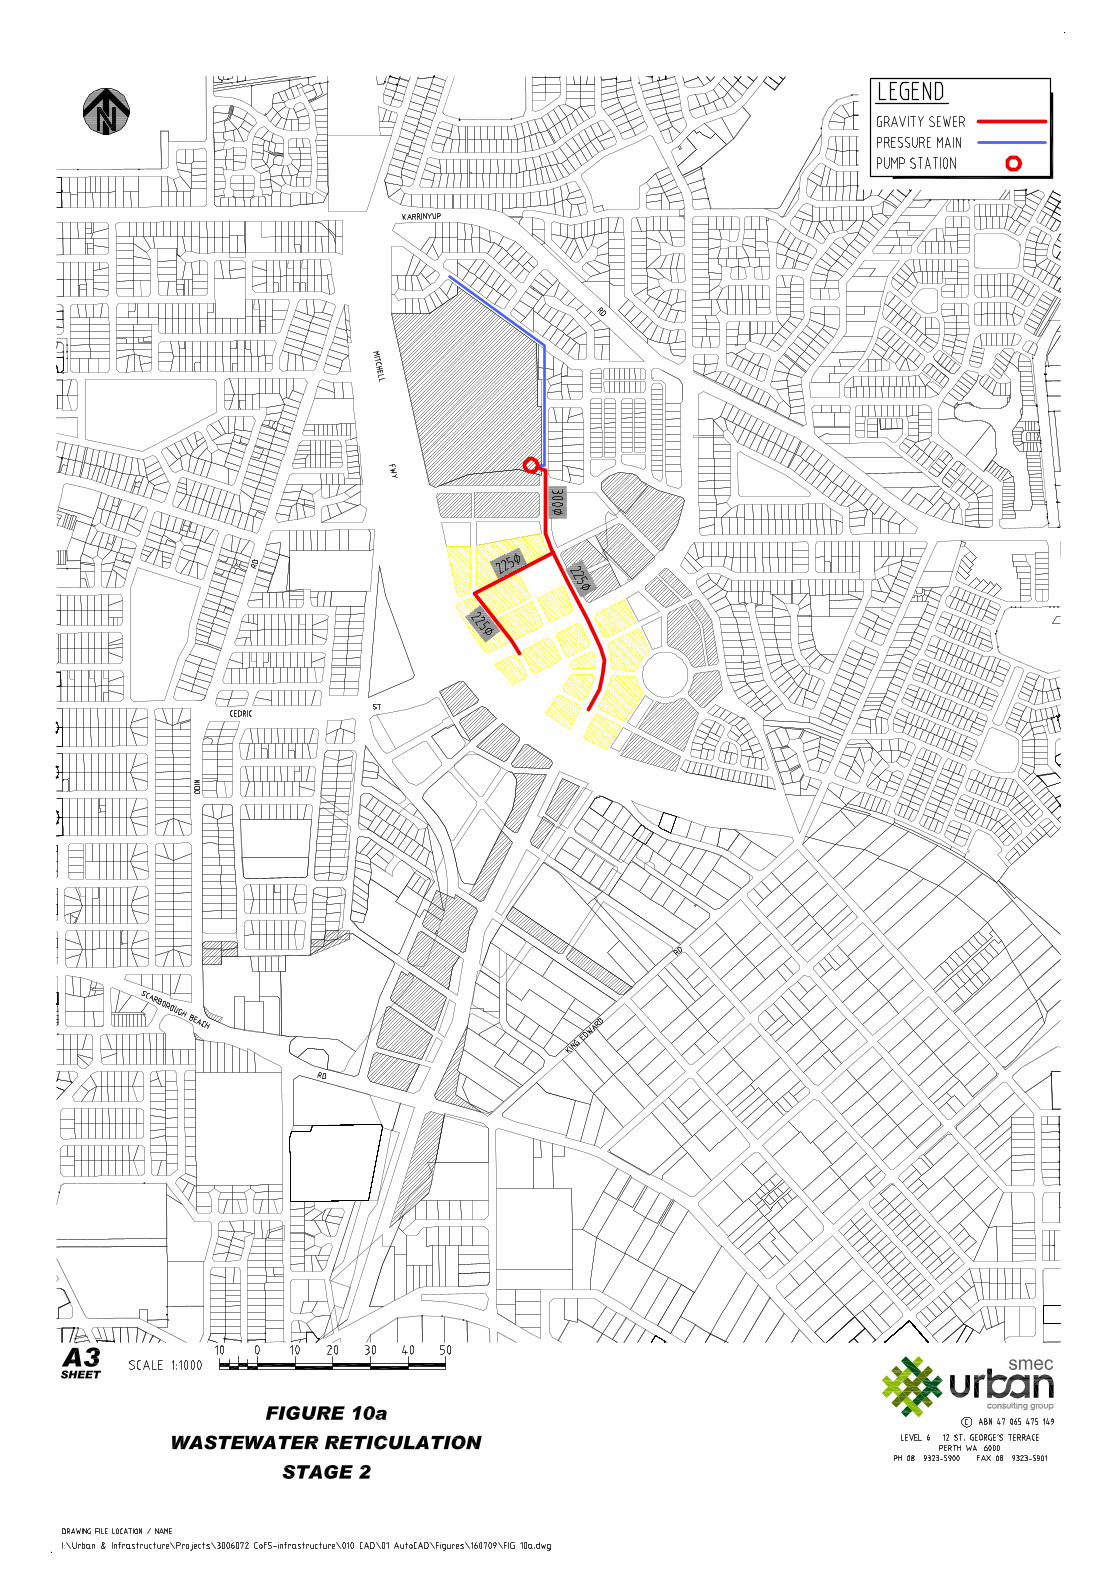
The staged implementation of wastewater infrastructure for the proposed three (3) stages of development of State Government land are shown in Figures 9 to 11. The staged implementation of wastewater infrastructure for the proposed four (4) stages of development of freehold land is shown in Figure 12.
In total, the anticipated scope of works are as described in Part 2.
Electrical Power
In total, the anticipated scope of works are as described in Part 2 with no allowance made for power requirements for the proposed public transport (light rail) network.
Stage 1 shows development over land currently occupied by the substation located off Scarborough Beach Road just east of Ellen Stirling Bvd. It is our understanding that the existing substation will be retained.
Gas
In total, the anticipated scope of works are as described in Part 2.
Communications
In total, the anticipated scope of works are as described in Part 2.
Drainage
In total, the anticipated scope of works are as described in Part 2. It has been assumed that the relocation of the Water Corporation Main Drain and associated works will be undertaken in association with proposed major upgrades to Scarborough Beach Road and Stephenson Avenue. The balance of stormwater drainage infrastructure works will be completed as required to service each Stage.
Infrastructure Costs and Cash Flow Projections
The following is an opinion of probable costs and cash flow projections for the provision of infrastructure services for water, wastewater, power, communications and storm water drainage for the staged development of the Structure Plan Area. Gas services costs have not been considered as they are generally provided at little or no cost to the developer.
As this opinion of probable costs and cash flows is pre-design, pre-investigation and pre-consultation by key stakeholders, it may vary considerably from actual costs and actual cash flows so should be used with caution. A contingency allowance of 40% has been adopted at this point in time.
A number of assumptions have had to be made in relation to the likely scope of work for each service for each stage of development to enable a determination of probable cost and cash flow projections. The key assumptions are outlined below. Obviously, the assumptions made are subject to amendment following detailed reviews of
Services Infrastructure Report – Part 3
7
infrastructure requirements by the various service authorities and are likely to undergo further amendment during detailed design.
Probable costs and cash flow projections have been determined for each of the three (3) proposed stages of development of State Government land. These figures have been further broken down to differentiate between Government lands north and south of the Mitchell Freeway. Probable costs and cash flow projections have also been determined for each of the four (4) stages of development of freehold land.
Details of probable costs are provided in Table 2 and cash flow projections are provided in Table 3. Tables 2 and 3 are located at the end of this chapter.
Water
Probable costs are based on the scope of works shown in Figures 4 to 7 for the staged development of State Government land and Figure 8 for the staged development of freehold land. Cash flow projections for the development of Government land assumed distribution mains would be constructed up front and reticulation mains provided at a roughly uniform rate over the life of each Stage.
Whilst distribution mains (300mm diameter and above) are ultimately funded by the Water Corporation, quite often they are constructed by the developer on a “pre-funded” basis to avoid project delays. Accordingly, this work has been itemized separately for ease of identification of the costs involved. For the purposes of determining a cash flow, a payback period of fifteen (15) years commencing one (1) year following construction has been assumed for pre-funded works. This period of time has been chosen as it approximates the length of time expected to achieve full utilization of the asset.
Wastewater
Probable costs are based on the scope of works shown in Figures 9 to 11 for the staged development of State Government land and Figure 12 for the staged development of freehold land. Cash flow projections for the development of Government land assumed upgrades to wastewater pump stations and associated mains would be constructed up front and reticulation sewers provided at a roughly uniform rate over the life of each Stage.
Whilst permanent upgrades to pump stations and associated mains are ultimately funded by the Water Corporation, quite often they are constructed by the developer on a “pre-funded” basis to avoid project delays. Accordingly, this work has been itemized separately for ease of identification of the costs involved. For the purposes of determining a cash flow, a payback period of fifteen (15) years commencing one (1) year following construction has been assumed for pre-funded works. This period of time has been chosen as it approximates the length of time expected to achieve full utilization of the asset.
Electrical Power
The scope of works assumed are as described in Part 2 with no allowance for power requirements for the proposed public transport (light rail) network. The cost rates used have been provided by Western Power on the basis that they are best guess estimates for initial budgeting purposes only.
It is our understanding that the existing substation located off Scarborough Beach Road just east of Ellen Stirling Bvd will be retained.
It has been assumed that the cost of the roll out of high and low voltage power would be roughly proportional to the land area being developed.
Communications
The scope of works assumed are as described in Part 2. The cost rate per dwelling used is based on cost information provided by Telstra. That information has been provided on the understanding that it is a best guess estimate for initial budgeting purposes only.
Services Infrastructure Report – Part 3
8
It has also been assumed that the cost of the roll out of communications cables would be roughly proportional to the number of new dwellings to be serviced. It has been assumed that commercial and retail developments will only require the standard communications services provided at little to no cost to the developer.
Drainage
The scope of works assumed are as described in Part 2.
It has been assumed that the relocation of the Water Corporation Main Drain ($23m) and associated works will be undertaken in association with proposed major upgrades to Scarborough Beach Road and Stephenson Avenue. Cost details for this work are reported in Part 2 but, at the request of the Stirling City Alliance, are not included in the cost estimates for any Stage in this Report.
It has been assumed that the balance of stormwater drainage infrastructure works will be completed as required to service each Stage and that this work would be roughly proportional to the land area being developed.
Modifications to Existing Infrastructure
Any changes to existing road alignments may involve the relocation of existing services infrastructure. For example, the “suggested realignment of Ellen Stirling Bvd across private land” as stated on page 34 of the Structure Plan Framework document (Oct 2008) will very likely require the relocation of Telstra primary cables (including optical fibre), high and low voltage cables, water mains, gas mains and gravity sewers.
All costs associated with the relocation of existing infrastructure would have to be met by the developer.
It is our understanding that services relocation costs associated with the construction of Stage 1 Primary Roads have been included in cost estimates for those works. A total nominal allowance of $10m has been made to cover all other miscellaneous services relocations to be undertaken within the Structure Plan Area.
Conclusions
A preliminary assessment of potential infrastructure requirements, probable costs and cash flows for the staged development of the Structure Plan Area, with particular focus on State Owned land, has been undertaken.
Land use and population growth projections as provided by the Stirling City Alliance are shown summarized in Table 1. Infrastructure requirements to meet proposed development needs have been largely based on preliminary advice from the various service authorities.
Probable costs and cash flow projections have been derived based on the preliminary advices received from the various service authorities and are provided in Tables 2 and 3 respectively. These are considered to be “order of magnitude” estimates only.
It is our understanding that the various service authorities will have to commit considerable resources and time to undertake substantive infrastructure planning. In this regard, the Water Corporation advises that full scheme reviews can take 2 years or more to complete. Western Power suggests a lead time of 2 to 3 years is required to establish additional substations to meet growth in power demand. Telstra would appreciate a similar time frame to plan for upgrades to their network to meet growing demand.
Before committing to a review of their networks, each service authority requires a Structure Plan or Town Plan showing land use zonings . They also require the Structure Plan to be clear on the intended staging and timing of land development within the Structure Plan area to enable the proper planning and roll out of services to accommodate progressive development.
To progress the infrastructure services element of the project to the next phase, the “Project Scoping” phase will require the following:
Services Infrastructure Report – Part 3
9
• A greater level of infrastructure planning by the various service authorities which they advise is conditional upon receipt of a Structure Plan or Town Plan showing land use zonings.
• A clearly defined development program that is accepted by all stakeholders as realistic and achievable.
• A clear understanding of the nature and extent of proposed roadworks and associated transport infrastructure to more accurately assess the impacts on existing infrastructure and to determine future requirements. This may involve the preparation of preliminary designs, particularly at intersections.
• A clear understanding of, and Water Corporation agreement in principal to, proposed modifications to the Main Drain.
• A greater level of understanding of subsurface conditions (geology and groundwater in particular).
• A greater level of information about proposed routes for new infrastructure (cadastral and topographical information, physical and environmental constraints).
• A clear understanding of what existing major infrastructure assets are proposed to be retained and whether future augmentation requirements will be accommodated.
If Federal funding is envisaged, the calculation and reporting of cost estimates and cash flow projections should be undertaken in accordance with the Commonwealth Government Department of Infrastructure, Transport, Regional Development and Local Government’s guidelines “Best Practice Cost Estimation for Publically Funded Road and Rail Construction”. It would be prudent to establish a consistent approach to the calculation of cost estimates and a consistent format for the reporting of same for the various major elements of the project such as roadworks, earthworks and services infrastructure.
Services Infrastructure Report – Part 3
10
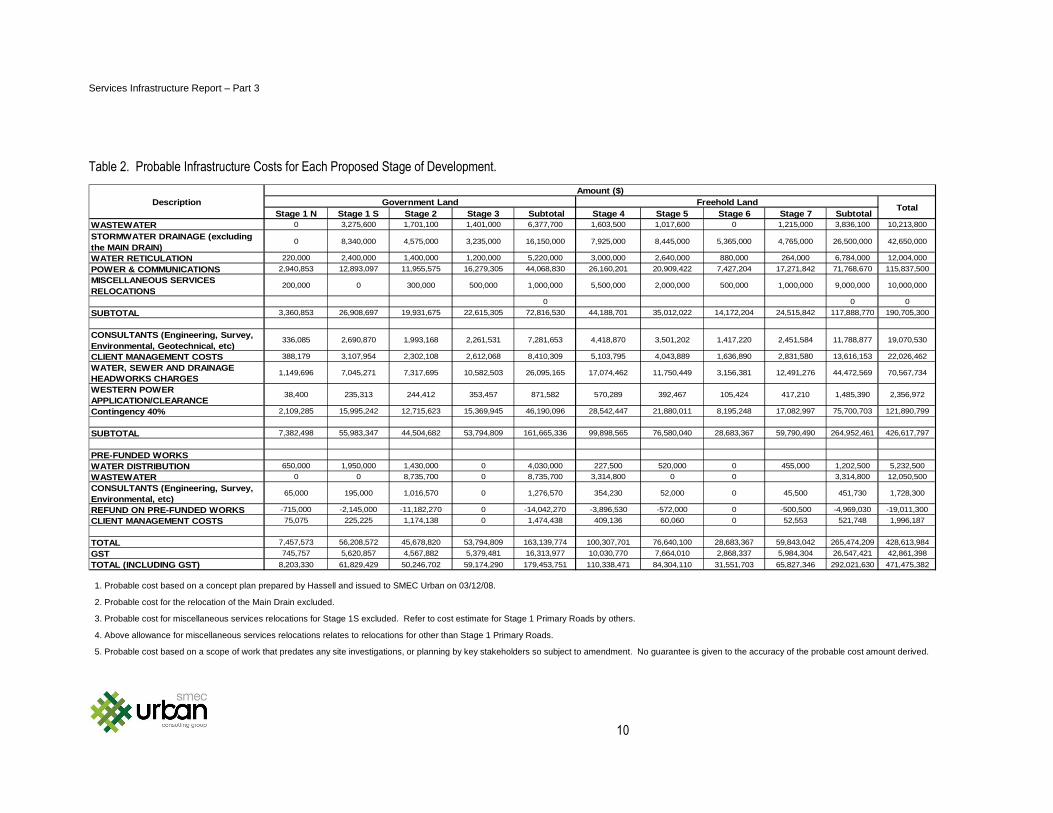
Table 2. Probable Infrastructure Costs for Each Proposed Stage of Development.
Stage 1 N Stage 1 S Stage 2 Stage 3 Subtotal Stage 4 Sta ge 5 Stage 6 Stage 7 SubtotalWASTEWATER 0 3,275,600 1,701,100 1,401,000 6,377,700 1,603,500 1,017,600 0 1,215,000 3,836,100 10,213,800
STORMWATER DRAINAGE (excluding the MAIN DRAIN)
0 8,340,000 4,575,000 3,235,000 16,150,000 7,925,000 8,445,000 5,365,000 4,765,000 26,500,000 42,650,000
WATER RETICULATION 220,000 2,400,000 1,400,000 1,200,000 5,220,000 3,000,000 2,640,000 880,000 264,000 6,784,000 12,004,000
POWER & COMMUNICATIONS 2,940,853 12,893,097 11,955,575 16,279,305 44,068,830 26,160,201 20,909,422 7,427,204 17,271,842 71,768,670 115,837,500
MISCELLANEOUS SERVICES RELOCATIONS
200,000 0 300,000 500,000 1,000,000 5,500,000 2,000,000 500,000 1,000,000 9,000,000 10,000,000
0 0 0
SUBTOTAL 3,360,853 26,908,697 19,931,675 22,615,305 72,816,530 44,188,701 35,012,022 14,172,204 24,515,842 117,888,770 190,705,300
CONSULTANTS (Engineering, Survey, Environmental, Geotechnical, etc)
336,085 2,690,870 1,993,168 2,261,531 7,281,653 4,418,870 3,501,202 1,417,220 2,451,584 11,788,877 19,070,530
CLIENT MANAGEMENT COSTS 388,179 3,107,954 2,302,108 2,612,068 8,410,309 5,103,795 4,043,889 1,636,890 2,831,580 13,616,153 22,026,462
WATER, SEWER AND DRAINAGE HEADWORKS CHARGES
1,149,696 7,045,271 7,317,695 10,582,503 26,095,165 17,074,462 11,750,449 3,156,381 12,491,276 44,472,569 70,567,734
WESTERN POWER APPLICATION/CLEARANCE
38,400 235,313 244,412 353,457 871,582 570,289 392,467 105,424 417,210 1,485,390 2,356,972
Contingency 40% 2,109,285 15,995,242 12,715,623 15,369,945 46,190,096 28,542,447 21,880,011 8,195,248 17,082,997 75,700,703 121,890,799
SUBTOTAL 7,382,498 55,983,347 44,504,682 53,794,809 161,665,336 99,898,565 76,580,040 28,683,367 59,790,490 264,952,461 426,617,797
PRE-FUNDED WORKSWATER DISTRIBUTION 650,000 1,950,000 1,430,000 0 4,030,000 227,500 520,000 0 455,000 1,202,500 5,232,500
WASTEWATER 0 0 8,735,700 0 8,735,700 3,314,800 0 0 3,314,800 12,050,500
CONSULTANTS (Engineering, Survey, Environmental, etc)
65,000 195,000 1,016,570 0 1,276,570 354,230 52,000 0 45,500 451,730 1,728,300
REFUND ON PRE-FUNDED WORKS -715,000 -2,145,000 -11,182,270 0 -14,042,270 -3,896,530 -572,000 0 -500,500 -4,969,030 -19,011,300
CLIENT MANAGEMENT COSTS 75,075 225,225 1,174,138 0 1,474,438 409,136 60,060 0 52,553 521,748 1,996,187
TOTAL 7,457,573 56,208,572 45,678,820 53,794,809 163,139,774 100,307,701 76,640,100 28,683,367 59,843,042 265,474,209 428,613,984
GST 745,757 5,620,857 4,567,882 5,379,481 16,313,977 10,030,770 7,664,010 2,868,337 5,984,304 26,547,421 42,861,398
TOTAL (INCLUDING GST) 8,203,330 61,829,429 50,246,702 59,174,290 179,453,751 110,338,471 84,304,110 31,551,703 65,827,346 292,021,630 471,475,382
Government LandAmount ($)
Freehold LandDescriptionTotal
1. Probable cost based on a concept plan prepared by Hassell and issued to SMEC Urban on 03/12/08.
2. Probable cost for the relocation of the Main Drain excluded.
3. Probable cost for miscellaneous services relocations for Stage 1S excluded. Refer to cost estimate for Stage 1 Primary Roads by others.
4. Above allowance for miscellaneous services relocations relates to relocations for other than Stage 1 Primary Roads.
5. Probable cost based on a scope of work that predates any site investigations, or planning by key stakeholders so subject to amendment. No guarantee is given to the accuracy of the probable cost amount derived.
Services Infrastructure Report – Part 3
11
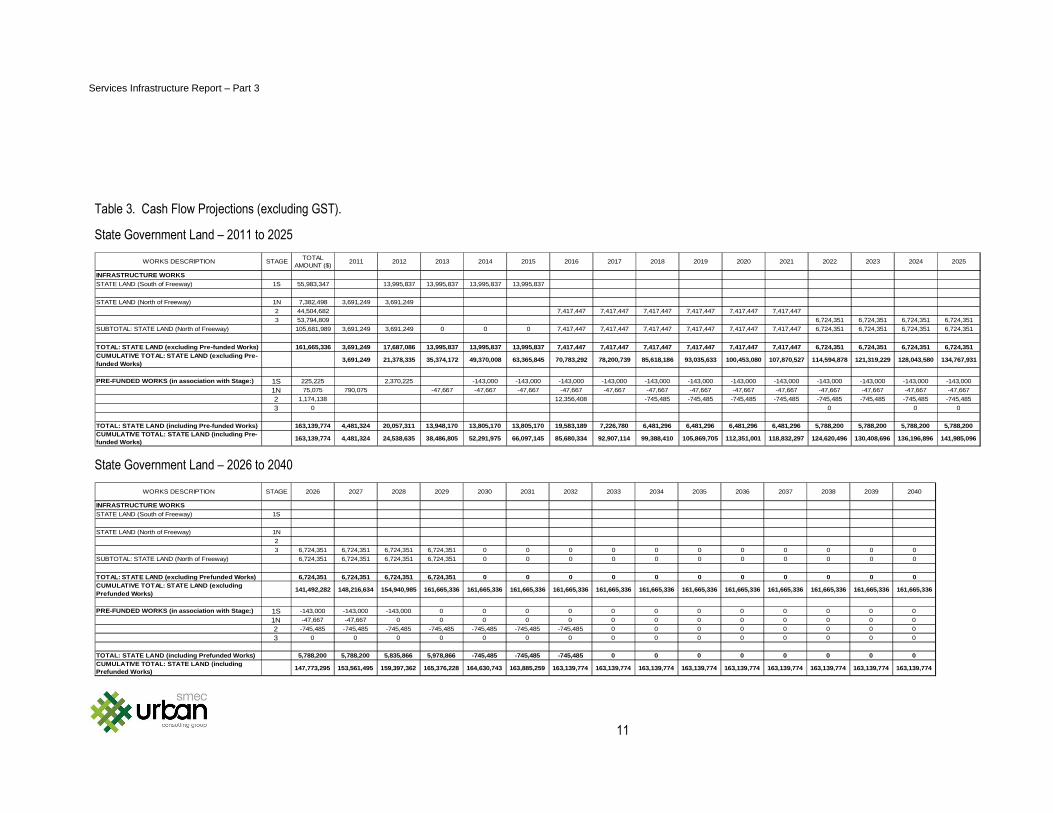
Table 3. Cash Flow Projections (excluding GST).
State Government Land – 2011 to 2025
INFRASTRUCTURE WORKSSTATE LAND (South of Freeway) 1S 55,983,347 13,995,837 13,995,837 13,995,837 13,995,837
STATE LAND (North of Freeway) 1N 7,382,498 3,691,249 3,691,249
2 44,504,682 7,417,447 7,417,447 7,417,447 7,417,447 7,417,447 7,417,447
3 53,794,809 6,724,351 6,724,351 6,724,351 6,724,351
SUBTOTAL: STATE LAND (North of Freeway) 105,681,989 3,691,249 3,691,249 0 0 0 7,417,447 7,417,447 7,417,447 7,417,447 7,417,447 7,417,447 6,724,351 6,724,351 6,724,351 6,724,351
TOTAL: STATE LAND (excluding Pre-funded Works) 161,6 65,336 3,691,249 17,687,086 13,995,837 13,995,837 13,995,837 7,417,447 7,417,447 7,417,447 7,417,447 7,417,447 7,417,447 6,724,351 6,724,351 6,724,351 6,724,351CUMULATIVE TOTAL: STATE LAND (excluding Pre-funded Works)
3,691,249 21,378,335 35,374,172 49,370,008 63,365,845 70,783,292 78,200,739 85,618,186 93,035,633 100,453,080 107,870,527 114,594,878 121,319,229 128,043,580 134,767,931
PRE-FUNDED WORKS (in association with Stage:) 1S 225,225 2,370,225 -143,000 -143,000 -143,000 -143,000 -143,000 -143,000 -143,000 -143,000 -143,000 -143,000 -143,000 -143,000
1N 75,075 790,075 -47,667 -47,667 -47,667 -47,667 -47,667 -47,667 -47,667 -47,667 -47,667 -47,667 -47,667 -47,667 -47,667
2 1,174,138 12,356,408 -745,485 -745,485 -745,485 -745,485 -745,485 -745,485 -745,485 -745,485
3 0 0 0 0
TOTAL: STATE LAND (including Pre-funded Works) 163,139,774 4,481,324 20,057,311 13,948,170 13,805,170 13,805,170 19,583,189 7,226,780 6,481,296 6,481,296 6,481,296 6,481,296 5,788,200 5,788,200 5,788,200 5,788,200CUMULATIVE TOTAL: STATE LAND (including Pre-funded Works)
163,139,774 4,481,324 24,538,635 38,486,805 52,291,975 66,097,145 85,680,334 92,907,114 99,388,410 105,869,705 112,351,001 118,832,297 124,620,496 130,408,696 136,196,896 141,985,096
2020 2022 2024 202520232021WORKS DESCRIPTION STAGE 2011 2012 2013 2014 2015TOTAL
AMOUNT ($)2017 2018 20192016
State Government Land – 2026 to 2040
INFRASTRUCTURE WORKSSTATE LAND (South of Freeway) 1S
STATE LAND (North of Freeway) 1N
2
3 6,724,351 6,724,351 6,724,351 6,724,351 0 0 0 0 0 0 0 0 0 0 0
SUBTOTAL: STATE LAND (North of Freeway) 6,724,351 6,724,351 6,724,351 6,724,351 0 0 0 0 0 0 0 0 0 0 0
TOTAL: STATE LAND (excluding Prefunded Works) 6,724, 351 6,724,351 6,724,351 6,724,351 0 0 0 0 0 0 0 0 0 0 0CUMULATIVE TOTAL: STATE LAND (excluding Prefunded Works)
141,492,282 148,216,634 154,940,985 161,665,336 161,665,336 161,665,336 161,665,336 161,665,336 161,665,336 161,665,336 161,665,336 161,665,336 161,665,336 161,665,336 161,665,336
PRE-FUNDED WORKS (in association with Stage:) 1S -143,000 -143,000 -143,000 0 0 0 0 0 0 0 0 0 0 0 0
1N -47,667 -47,667 0 0 0 0 0 0 0 0 0 0 0 0 0
2 -745,485 -745,485 -745,485 -745,485 -745,485 -745,485 -745,485 0 0 0 0 0 0 0 0
3 0 0 0 0 0 0 0 0 0 0 0 0 0 0 0
TOTAL: STATE LAND (including Prefunded Works) 5,788,200 5,788,200 5,835,866 5,978,866 -745,485 -745,485 -745,485 0 0 0 0 0 0 0 0CUMULATIVE TOTAL: STATE LAND (including Prefunded Works)
147,773,295 153,561,495 159,397,362 165,376,228 164,630,743 163,885,259 163,139,774 163,139,774 163,139,774 163,139,774 163,139,774 163,139,774 163,139,774 163,139,774 163,139,774
2027 2028 2029 2030 2039 20402032 2033 2034 2035 2036 2037 20382031WORKS DESCRIPTION STAGE 2026

Services Infrastructure Report – Part 3
12
Table 3 (Continued). Cash Flow Projections (excluding GST).
Freehold Land – 2011 to 2025
INFRASTRUCTURE WORKS
FREEHOLD LAND 4 99,898,565 3,995,943 3,995,943 3,995,943 3,995,943 3,995,943 3,995,943 3,995,943 3,995,943 3,995,943 3,995,943
5 76,580,040 3,063,202 3,063,202 3,063,202 3,063,202 3,063,202 3,063,202 3,063,202 3,063,202 3,063,202 3,063,202
6 28,683,367
7 59,790,490 2,391,620 2,391,620 2,391,620 2,391,620 2,391,620 2,391,620 2,391,620 2,391,620 2,391,620 2,391,620TOTAL: FREEHOLD LAND (excluding Pre-funded Works)
264,952,461 0 0 0 0 0 9,450,764 9,450,764 9,450,764 9,450,764 9,450,764 9,450,764 9,450,764 9,450,764 9,450,764 9,450,764
CUMULATIVE TOTAL: FREEHOLD LAND (excluding Pre-funded Works)
0 0 0 0 0 9,450,764 18,901,528 28,352,291 37,803,055 47,253,819 56,704,583 66,155,347 75,606,110 85,056,874 94,507,638
PRE-FUNDED WORKS (in association with Stages 4, 5 & 7:)Twyford Street Pump Station & Associated Pressure Mains
382,859 4,029,139 -243,085
Water Distribution Mains 138,889 1,461,639 -88,183 -88,183 -88,183 -88,183 -88,183 -88,183 -88,183 -88,183TOTAL: FREEHOLD LAND (including Pre-funded Works)
265,474,209 0 0 0 0 0 10,912,403 9,450,764 9,362,580 9,362,580 9,362,580 9,362,580 9,362,580 13,391,720 9,362,580 9,119,495
CUMULATIVE TOTAL: FREEHOLD LAND (including Pre-funded Works)
265,474,209 0 0 0 0 0 10,912,403 20,363,166 29,725,747 39,088,327 48,450,908 57,813,488 67,176,069 80,567,788 89,930,369 99,049,864
2022 2023 2024 2025WORKS DESCRIPTION 202120202014 2015 2017 2018 2019TOTAL
AMOUNT ($)STAGE 2011 2012 2013 2016
Freehold Land – 2026 to 2040
INFRASTRUCTURE WORKS
FREEHOLD LAND 4 3,995,943 3,995,943 3,995,943 3,995,943 3,995,943 3,995,943 3,995,943 3,995,943 3,995,943 3,995,943 3,995,943 3,995,943 3,995,943 3,995,943 3,995,943
5 3,063,202 3,063,202 3,063,202 3,063,202 3,063,202 3,063,202 3,063,202 3,063,202 3,063,202 3,063,202 3,063,202 3,063,202 3,063,202 3,063,202 3,063,202
6 9,561,122 9,561,122 9,561,122
7 2,391,620 2,391,620 2,391,620 2,391,620 2,391,620 2,391,620 2,391,620 2,391,620 2,391,620 2,391,620 2,391,620 2,391,620 2,391,620 2,391,620 2,391,620TOTAL: FREEHOLD LAND (excluding Prefunded Works)
9,450,764 9,450,764 9,450,764 9,450,764 19,011,886 19,011,886 19,011,886 9,450,764 9,450,764 9,450,764 9,450,764 9,450,764 9,450,764 9,450,764 9,450,764
CUMULATIVE TOTAL: FREEHOLD LAND (excluding Prefunded Works)
103,958,402 113,409,165 122,859,929 132,310,693 151,322,579 170,334,465 189,346,351 198,797,115 208,247,879 217,698,642 227,149,406 236,600,170 246,050,934 255,501,698 264,952,461
PRE-FUNDED WORKS (in association with Stages 4, 5 & 7:)Twyford Street Pump Station & associated pressure mains
-243,085 -243,085 -243,085 -243,085 -243,085 -243,085 -243,085 -243,085 -243,085 -243,085 -243,085 -243,085 -243,085 -243,085
Water Distribution Mains -88,183 -88,183 -88,183 -88,183 -88,183 -88,183 -88,183TOTAL: FREEHOLD LAND (including Pre-funded Works)
9,119,495 9,119,495 9,119,495 9,119,495 18,680,617 18,680,617 18,680,617 9,207,678 9,207,678 9,207,678 9,207,678 9,207,678 9,207,678 9,207,678 9,450,764
CUMULATIVE TOTAL: FREEHOLD LAND (including Prefunded Works)
108,169,359 117,288,854 126,408,349 135,527,845 154,208,462 172,889,079 191,569,696 200,777,375 209,985,053 219,192,732 228,400,410 237,608,089 246,815,767 256,023,446 265,474,209
2039 204020372032 2033 2034 2035 20362026 2027 2028 2029 2030 2038WORKS DESCRIPTION 2031STAGE

Services Infrastructure Report – Part 3
13
Figures