Download - Refusing to be Average - Jarden
Refusing to beAverage
November 2020Investment Outlook
NZ Equities Australian Equities Global Equities
BUY A2 Milk,Kathmandu, MainfreightStride Property, Spark
BUY Amcor, Cleanaway, CSL, RamsayHealthcare, Worley
BUY Abbott,Laboratories, AstraZeneca,Schneider Electric, Siemens
Investment Outlook November 2020
Jarden Securities Limited | NZX Firm | www.jarden.co.nz
2
Jarden Overview
November 2020
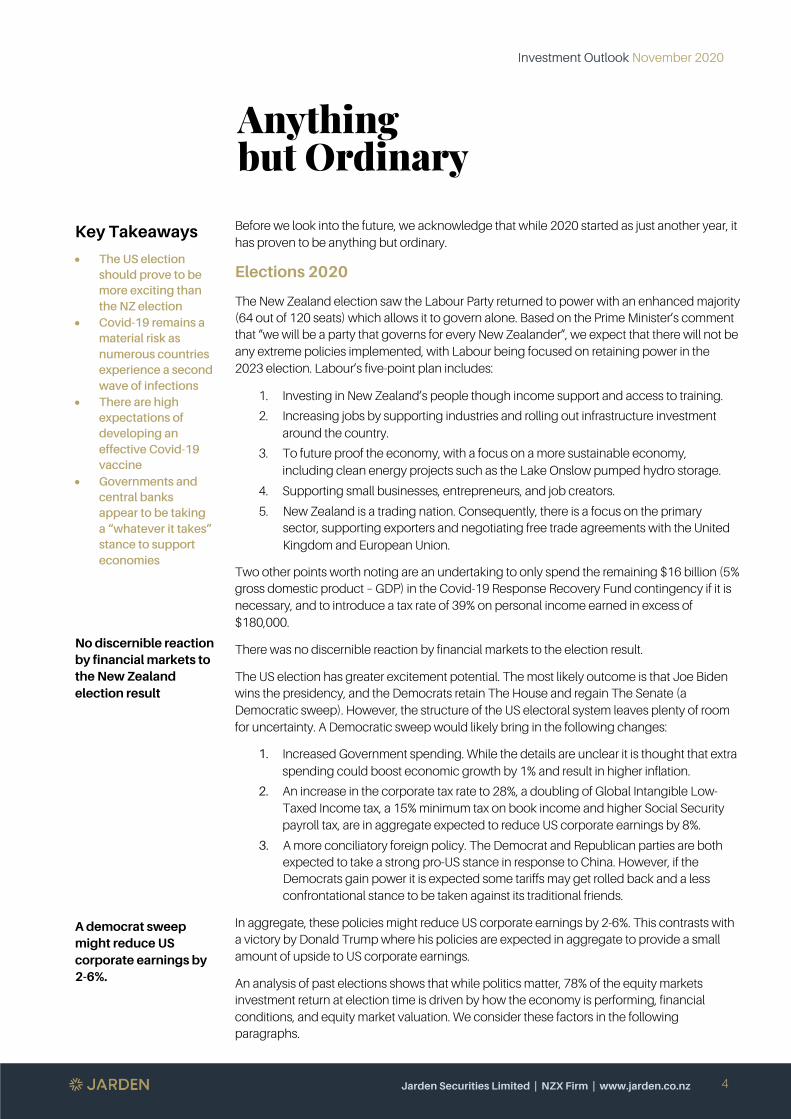
As the end of 2020 draws near, we look back on a year that has truly been “anything but ordinary”. In New Zealand, the Labour Party achieved a staggering election victory which will allow them to govern alone. Remaining with politics the US presidential election is just around the corner on Tuesday 3 November. It has the potential to deliver a notable change in the direction of US policy and the economy.
In the short term, we are entering a period where financial markets could swing in either direction. After making solid improvement, the global economy is entering a period where the rate of recovery is slowing as governments support measures start being reduced. In addition, a new wave of Covid-19 infections engulfs many countries. However, central banks globally continue to do whatever it takes. This has resulted in extraordinarily low interest rates almost everywhere. In New Zealand, interest rates are expected to fall further and remain low for some time until employment improves, and inflation ignites. A direct consequence of low interest rates is asset price inflation, including equities and property.
Meanwhile investors are firmly focused on the development of a Covid-19 vaccine resulting in attention starting to shift from those equities which have benefited from the Covid-19 pandemic, to those which are likely to benefit from the development of a vaccine. We observe that many governments have taken the pandemic as an opportunity to reset the direction of their economies. For most this will be a green-led recovery. In this edition we explore this theme by examining what it means for transport, infrastructure, energy transition, energy efficiency and the circular economy.
At Jarden we have continued our expansion into Australia rounding out the team with several highly respected research analyst appointments. Through our “Save the Kiwi Day” we raised over $330,000 for the important work Kiwis for Kiwi’s to improve the survival rate of New Zealand’s national icon. Our geographic footprint has expanded with the opening of a representative office in Timaru and we welcome Tony Conroy to our adviser team in Dunedin.
We have explored Jarden’s roots by telling the story of Ron Jarden and the firm he founded nearly sixty years ago. We have done this through the production of a short video which will appear in numerous media outlets and can also be viewed on our website at www.jarden.co.nz/about-jarden. History shows that the Jarden family refused to be average. Consequently, Ron Jarden was anything but ordinary and the firm, of which you are a valued client, operates in the same vein.
As this is the last edition of the Investment Outlook for 2020, we would like to take this opportunity to thank you for your ongoing support and wish you all the best for the coming festive season.
John Norling, Director, Head of Wealth Research

Investment Outlook November 2020
Jarden Securities Limited | NZX Firm | www.jarden.co.nz
3
Contents
Anything but Ordinary ............................................................................................................................................................. 4
Asset Allocation .......................................................................................................................................................................... 8
Company CEO – Adrian Littlewood, Auckland Airport ....................................................................................... 13
Jarden Wealth Management – Introducing Janine Turner .............................................................................. 15
Covid-19 Vaccine - A Financial Shot in the Arm ..…................................................................................................. 16
A Green-led Recovery ………..………………..…………………………...………………………………………………………………..……………….……………. 18
Quality Investing – Timing Isn’t Everything ………………………………………………………..…………………………………….…………….. 22
New Zealand Equity Metrics .............................................................................................................................................. 26
Australian Equity Metrics ...................................................................................................................................................... 27
Global Equity Metrics ............................................................................................................................................................. 28
Debt Securities – Implications of Low Interest Rates ...………................................................................................. 29
New Zealand Dollar – Holdings its Own ....................................................................................................................... 31
Staying the Course – Asset Allocation .......................................................................................................................... 32
Jarden in the Community – Save the Kiwi Day .…………….......................................................................................... 34
Important Operational Changes .….……………………….......................................................................................................... 35
Calendar ........................................................................................................................................................................................ 37
Your Local Jarden Team ...................................................................................................................................................... 38
Investment Outlook November 2020
Jarden Securities Limited | NZX Firm | www.jarden.co.nz
4
Anything but Ordinary
Key Takeaways
• The US election should prove to be more exciting than the NZ election
• Covid-19 remains a material risk as numerous countries experience a second wave of infections
• There are high expectations of developing an effective Covid-19 vaccine
• Governments and central banks appear to be taking a “whatever it takes” stance to support economies
No discernible reaction by financial markets to the New Zealand election result A democrat sweep might reduce US corporate earnings by 2-6%.
Before we look into the future, we acknowledge that while 2020 started as just another year, it has proven to be anything but ordinary.
Elections 2020
The New Zealand election saw the Labour Party returned to power with an enhanced majority (64 out of 120 seats) which allows it to govern alone. Based on the Prime Minister’s comment that “we will be a party that governs for every New Zealander”, we expect that there will not be any extreme policies implemented, with Labour being focused on retaining power in the 2023 election. Labour’s five-point plan includes:
1. Investing in New Zealand’s people though income support and access to training.
2. Increasing jobs by supporting industries and rolling out infrastructure investment around the country.
3. To future proof the economy, with a focus on a more sustainable economy, including clean energy projects such as the Lake Onslow pumped hydro storage.
4. Supporting small businesses, entrepreneurs, and job creators.
5. New Zealand is a trading nation. Consequently, there is a focus on the primary sector, supporting exporters and negotiating free trade agreements with the United Kingdom and European Union.
Two other points worth noting are an undertaking to only spend the remaining $16 billion (5% gross domestic product – GDP) in the Covid-19 Response Recovery Fund contingency if it is necessary, and to introduce a tax rate of 39% on personal income earned in excess of $180,000.
There was no discernible reaction by financial markets to the election result.
The US election has greater excitement potential. The most likely outcome is that Joe Biden wins the presidency, and the Democrats retain The House and regain The Senate (a Democratic sweep). However, the structure of the US electoral system leaves plenty of room for uncertainty. A Democratic sweep would likely bring in the following changes:
1. Increased Government spending. While the details are unclear it is thought that extra spending could boost economic growth by 1% and result in higher inflation.
2. An increase in the corporate tax rate to 28%, a doubling of Global Intangible Low-Taxed Income tax, a 15% minimum tax on book income and higher Social Security payroll tax, are in aggregate expected to reduce US corporate earnings by 8%.
3. A more conciliatory foreign policy. The Democrat and Republican parties are both expected to take a strong pro-US stance in response to China. However, if the Democrats gain power it is expected some tariffs may get rolled back and a less confrontational stance to be taken against its traditional friends.
In aggregate, these policies might reduce US corporate earnings by 2-6%. This contrasts with a victory by Donald Trump where his policies are expected in aggregate to provide a small amount of upside to US corporate earnings.
An analysis of past elections shows that while politics matter, 78% of the equity markets investment return at election time is driven by how the economy is performing, financial conditions, and equity market valuation. We consider these factors in the following paragraphs.
Investment Outlook November 2020
Jarden Securities Limited | NZX Firm | www.jarden.co.nz
5
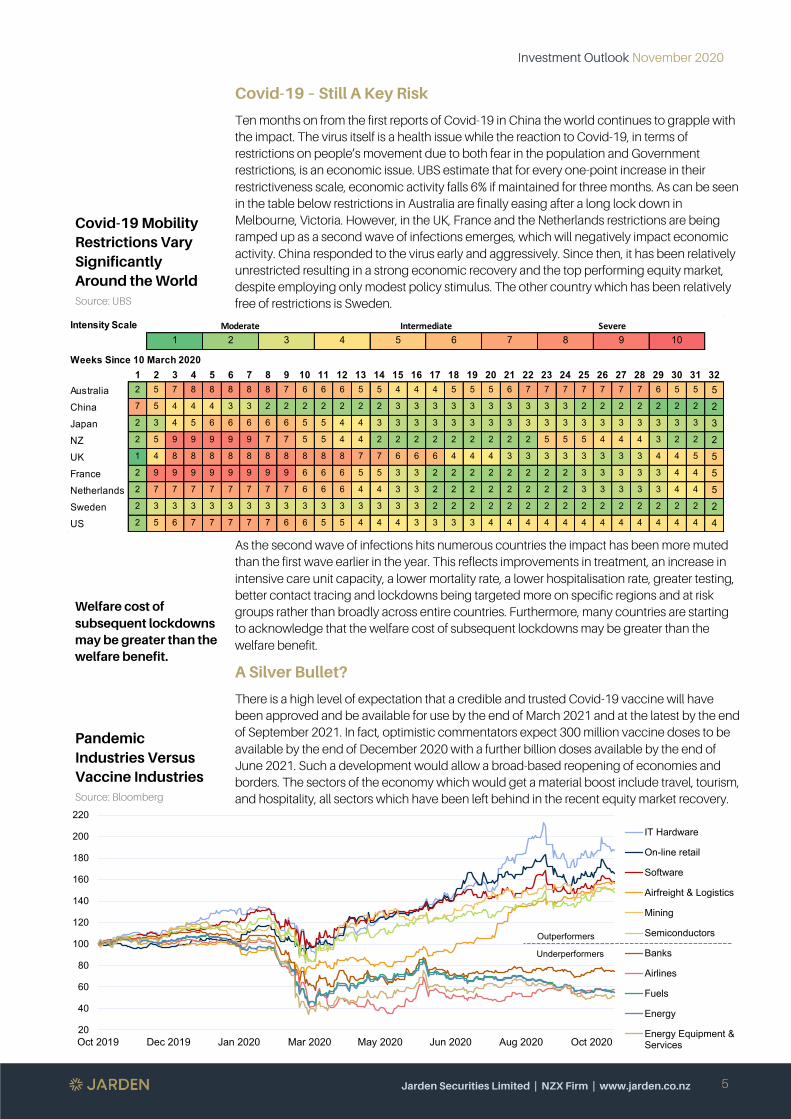
Covid-19 Mobility Restrictions Vary Significantly Around the World Source: UBS
Covid-19 – Still A Key Risk
Ten months on from the first reports of Covid-19 in China the world continues to grapple with the impact. The virus itself is a health issue while the reaction to Covid-19, in terms of restrictions on people’s movement due to both fear in the population and Government restrictions, is an economic issue. UBS estimate that for every one-point increase in their restrictiveness scale, economic activity falls 6% if maintained for three months. As can be seen in the table below restrictions in Australia are finally easing after a long lock down in Melbourne, Victoria. However, in the UK, France and the Netherlands restrictions are being ramped up as a second wave of infections emerges, which will negatively impact economic activity. China responded to the virus early and aggressively. Since then, it has been relatively unrestricted resulting in a strong economic recovery and the top performing equity market, despite employing only modest policy stimulus. The other country which has been relatively free of restrictions is Sweden.
Welfare cost of subsequent lockdowns may be greater than the welfare benefit.
Pandemic Industries Versus Vaccine Industries Source: Bloomberg
As the second wave of infections hits numerous countries the impact has been more muted than the first wave earlier in the year. This reflects improvements in treatment, an increase in intensive care unit capacity, a lower mortality rate, a lower hospitalisation rate, greater testing, better contact tracing and lockdowns being targeted more on specific regions and at risk groups rather than broadly across entire countries. Furthermore, many countries are starting to acknowledge that the welfare cost of subsequent lockdowns may be greater than the welfare benefit.
A Silver Bullet?
There is a high level of expectation that a credible and trusted Covid-19 vaccine will have been approved and be available for use by the end of March 2021 and at the latest by the end of September 2021. In fact, optimistic commentators expect 300 million vaccine doses to be available by the end of December 2020 with a further billion doses available by the end of June 2021. Such a development would allow a broad-based reopening of economies and borders. The sectors of the economy which would get a material boost include travel, tourism, and hospitality, all sectors which have been left behind in the recent equity market recovery.
Intensity Scale
1 2 3 4 5 6 7 8 9 10 11 12 13 14 15 16 17 18 19 20 21 22 23 24 25 26 27 28 29 30 31 32Australia 2 5 7 8 8 8 8 8 7 6 6 6 5 5 4 4 4 5 5 5 6 7 7 7 7 7 7 7 6 5 5 5
China 7 5 4 4 4 3 3 2 2 2 2 2 2 2 3 3 3 3 3 3 3 3 3 3 2 2 2 2 2 2 2 2
Japan 2 3 4 5 6 6 6 6 6 5 5 4 4 3 3 3 3 3 3 3 3 3 3 3 3 3 3 3 3 3 3 3
NZ 2 5 9 9 9 9 9 7 7 5 5 4 4 2 2 2 2 2 2 2 2 2 5 5 5 4 4 4 3 2 2 2
UK 1 4 8 8 8 8 8 8 8 8 8 8 7 7 6 6 6 4 4 4 3 3 3 3 3 3 3 3 4 4 5 5
France 2 9 9 9 9 9 9 9 9 6 6 6 5 5 3 3 2 2 2 2 2 2 2 2 3 3 3 3 3 4 4 5
Netherlands 2 7 7 7 7 7 7 7 7 6 6 6 4 4 3 3 2 2 2 2 2 2 2 2 3 3 3 3 3 4 4 5
Sweden 2 3 3 3 3 3 3 3 3 3 3 3 3 3 3 3 2 2 2 2 2 2 2 2 2 2 2 2 2 2 2 2
US 2 5 6 7 7 7 7 7 6 6 5 5 4 4 4 3 3 3 3 4 4 4 4 4 4 4 4 4 4 4 4 4
Moderate Intermediate Severe
Weeks Since 10 March 2020
1 2 3 6 7 8 94 5 10
20
40
60
80
100
120
140
160
180
200
220
Oct 2019 Dec 2019 Jan 2020 Mar 2020 May 2020 Jun 2020 Aug 2020 Oct 2020
IT Hardware
On-line retail
Software
Airfreight & Logistics
Mining
Semiconductors
Banks
Airlines
Fuels
Energy
Energy Equipment &Services
Outperformers
Underperformers
Investment Outlook November 2020
Jarden Securities Limited | NZX Firm | www.jarden.co.nz
6
The faster these sectors recover the less will be the adverse impact
Taking a more relaxed view towards inflation
Excess Liquidity Drives Valuation Multiples Higher (%) Source: Bloomberg, Jarden
Globally, and especially in New Zealand, these sectors employee significant numbers of people. Therefore, the faster these sectors recover the less will be the adverse impact on unemployment. Unemployment is expected to rise as government support measures roll off. The other area to benefit from removing mobility restrictions is global supply chains, many of which remain disrupted, adversely impacting the timely supply of goods. Finally, it is worth noting the multiplier effect as improvements in our trading partner’s economies improves the outlook for New Zealand’s exporters.
Investors are increasingly switching their attention from those companies which benefited from the pandemic to those that will benefit from the development of a vaccine. We published a research note on 25 September titled “A Potential Covid-19 Vaccine – Opportunities and Risks for Equities” which outlined stocks likely to benefit once a vaccine becomes widely available. We follow this up on page 16 with an article on those pharmaceutical companies expected to directly benefit from the creation of a credible trusted vaccine.
Clearly if a credible trusted vaccine is not developed and made readily available, equity markets are at risk of a correction like that seen in early September 2020.
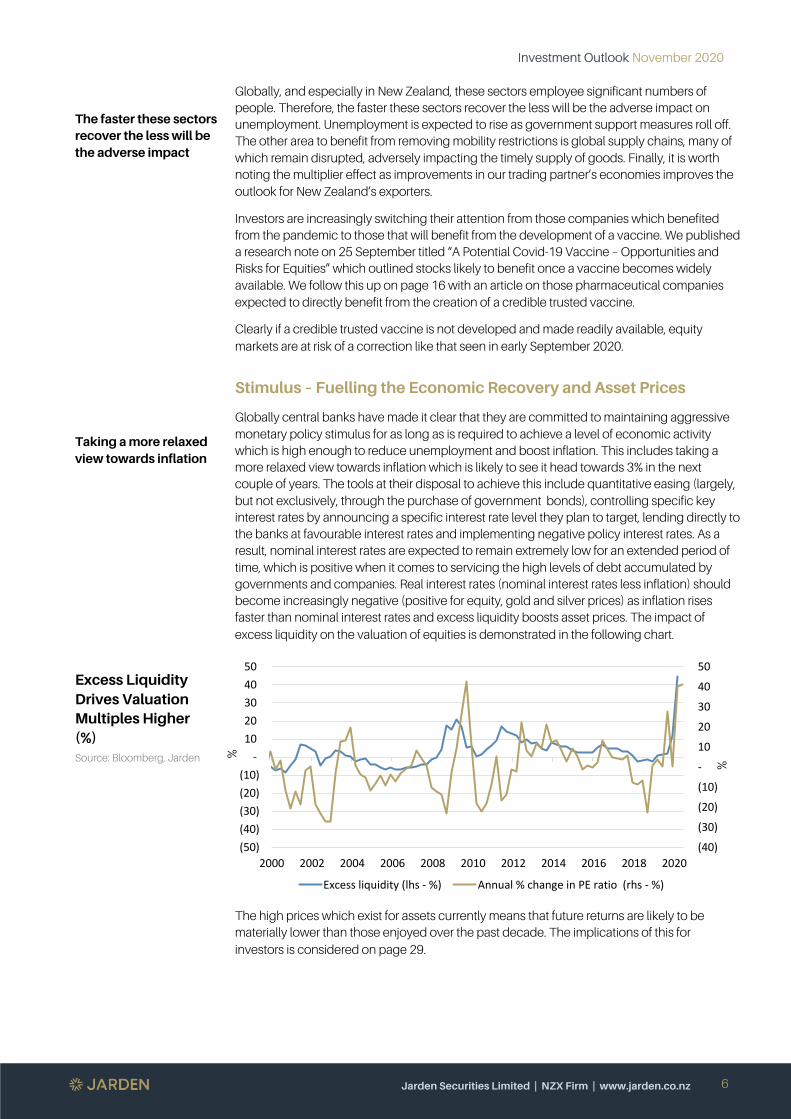
Stimulus – Fuelling the Economic Recovery and Asset Prices
Globally central banks have made it clear that they are committed to maintaining aggressive monetary policy stimulus for as long as is required to achieve a level of economic activity which is high enough to reduce unemployment and boost inflation. This includes taking a more relaxed view towards inflation which is likely to see it head towards 3% in the next couple of years. The tools at their disposal to achieve this include quantitative easing (largely, but not exclusively, through the purchase of government bonds), controlling specific key interest rates by announcing a specific interest rate level they plan to target, lending directly to the banks at favourable interest rates and implementing negative policy interest rates. As a result, nominal interest rates are expected to remain extremely low for an extended period of time, which is positive when it comes to servicing the high levels of debt accumulated by governments and companies. Real interest rates (nominal interest rates less inflation) should become increasingly negative (positive for equity, gold and silver prices) as inflation rises faster than nominal interest rates and excess liquidity boosts asset prices. The impact of excess liquidity on the valuation of equities is demonstrated in the following chart.
The high prices which exist for assets currently means that future returns are likely to be materially lower than those enjoyed over the past decade. The implications of this for investors is considered on page 29.
(40)
(30)
(20)
(10)
-
10
20
30
40
50
(50) (40) (30) (20) (10)
- 10 20 30 40 50
2000 2002 2004 2006 2008 2010 2012 2014 2016 2018 2020
Excess liquidity (lhs - %) Annual % change in PE ratio (rhs - %)
%
%
Investment Outlook November 2020
Jarden Securities Limited | NZX Firm | www.jarden.co.nz
7
Decline in government spending will potentially expose economic weaknesses
Single Stock Call Option Volume has been Rising (US$ billions, 10-day rolling average) Source: Goldman Sachs, OptionMetrics
Keeping interest rates at extraordinarily low levels for an extended period
From the onset of Covid-19, governments have ramped up spending materially to cushion the adverse impact of the measures taken to restrict the virus’s transmission. We are currently entering a period where government spending is starting to decline which will potentially expose economic weaknesses. Depending on the extent of the weaknesses we would expect governments to implement new spending packages, but at lower levels than those that they replace. After many weeks there is still no agreement between Democrats and Republicans about the size and focus of additional Government spending package. It is likely that the spending package will not be finalised until after the next US president in inaugurated in January 2021. We expect that governments and central banks will continue to do everything in their power to underpin economic activity and boost employment.
Near Term Caution
Economic indicators suggest that the strong economic rebound associated with many countries exiting severe lockdowns in late March to early May is likely to plateau. This leaves economies and financial markets more exposed to the risks from rising Covid-19 infections in some countries, electoral uncertainty in the US, potential delays in implementing further government spending in the US, or a lack of success in developing a Covid-19 vaccine.
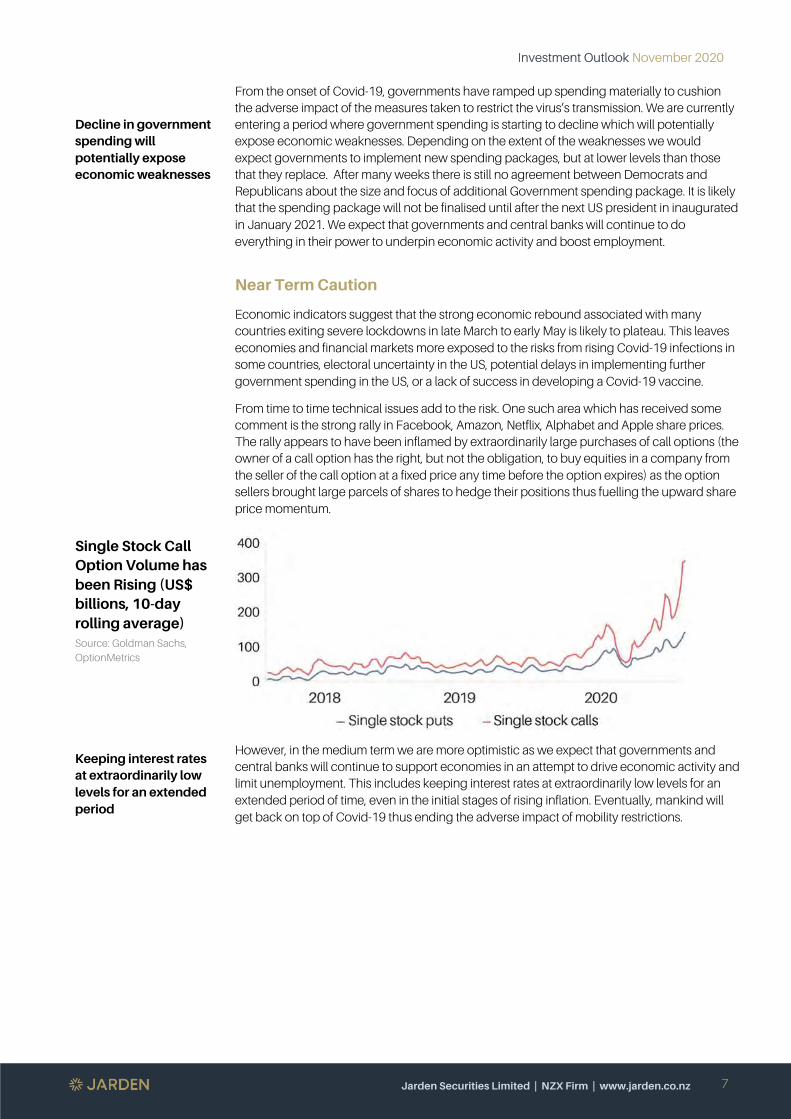
From time to time technical issues add to the risk. One such area which has received some comment is the strong rally in Facebook, Amazon, Netflix, Alphabet and Apple share prices. The rally appears to have been inflamed by extraordinarily large purchases of call options (the owner of a call option has the right, but not the obligation, to buy equities in a company from the seller of the call option at a fixed price any time before the option expires) as the option sellers brought large parcels of shares to hedge their positions thus fuelling the upward share price momentum.
However, in the medium term we are more optimistic as we expect that governments and central banks will continue to support economies in an attempt to drive economic activity and limit unemployment. This includes keeping interest rates at extraordinarily low levels for an extended period of time, even in the initial stages of rising inflation. Eventually, mankind will get back on top of Covid-19 thus ending the adverse impact of mobility restrictions.
Investment Outlook November 2020
Jarden Securities Limited | NZX Firm | www.jarden.co.nz
8
Asset Allocation
Key Takeaways
• Immense economic stimulus is likely to continue supporting global and domestic equities
• Higher-than-expected inflation is the biggest risk to the smooth sailing of equities
US Unemployment Rate (%) and Initial Jobless Claims (millions) Source: US Bureau of Labor Statistics, Department of Labor, Bloomberg
Colossal government support likely to continue
… with central banks playing along in concert
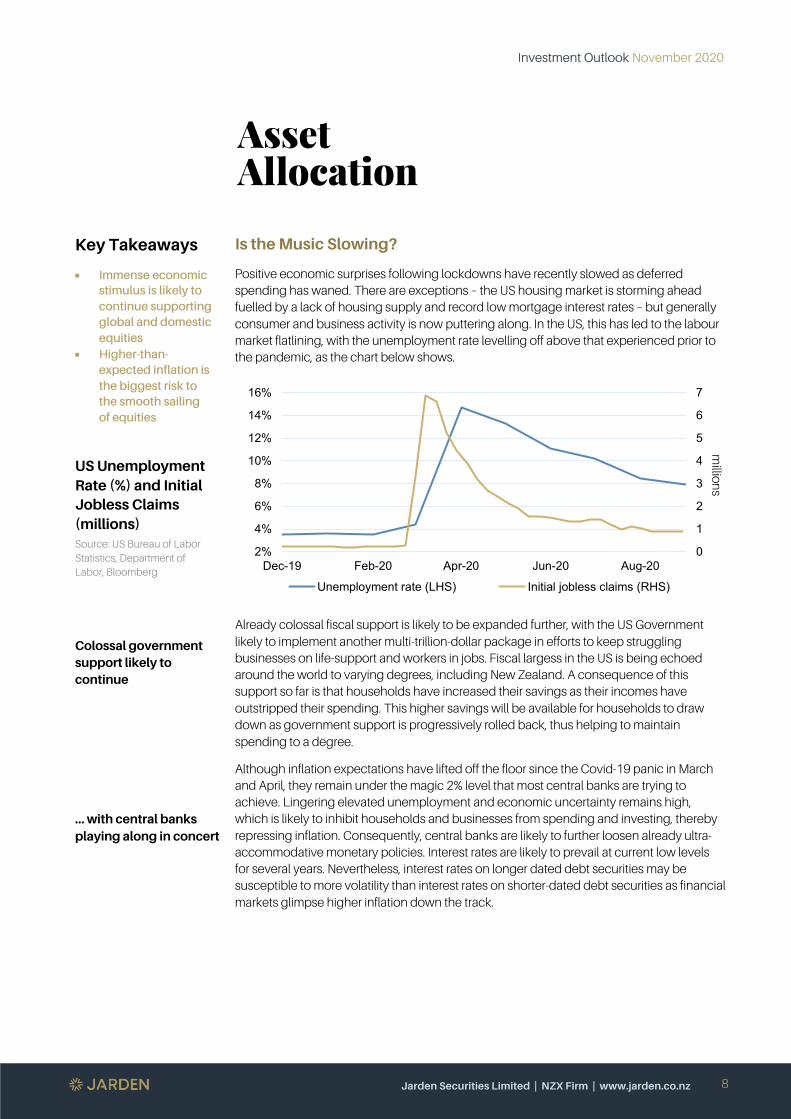
Is the Music Slowing?
Positive economic surprises following lockdowns have recently slowed as deferred spending has waned. There are exceptions – the US housing market is storming ahead fuelled by a lack of housing supply and record low mortgage interest rates – but generally consumer and business activity is now puttering along. In the US, this has led to the labour market flatlining, with the unemployment rate levelling off above that experienced prior to the pandemic, as the chart below shows.
Already colossal fiscal support is likely to be expanded further, with the US Government likely to implement another multi-trillion-dollar package in efforts to keep struggling businesses on life-support and workers in jobs. Fiscal largess in the US is being echoed around the world to varying degrees, including New Zealand. A consequence of this support so far is that households have increased their savings as their incomes have outstripped their spending. This higher savings will be available for households to draw down as government support is progressively rolled back, thus helping to maintain spending to a degree.
Although inflation expectations have lifted off the floor since the Covid-19 panic in March and April, they remain under the magic 2% level that most central banks are trying to achieve. Lingering elevated unemployment and economic uncertainty remains high, which is likely to inhibit households and businesses from spending and investing, thereby repressing inflation. Consequently, central banks are likely to further loosen already ultra-accommodative monetary policies. Interest rates are likely to prevail at current low levels for several years. Nevertheless, interest rates on longer dated debt securities may be susceptible to more volatility than interest rates on shorter-dated debt securities as financial markets glimpse higher inflation down the track.
0
1
2
3
4
5
6
7
2%
4%
6%
8%
10%
12%
14%
16%
Dec-19 Feb-20 Apr-20 Jun-20 Aug-20
Unemployment rate (LHS) Initial jobless claims (RHS)
million
s
Investment Outlook November 2020
Jarden Securities Limited | NZX Firm | www.jarden.co.nz
9
Economic Policy Uncertainty Index and US Inflation Expectations Source: Baker, Bloom and Davis, US Bureau of Labor Statistics, Bloomberg
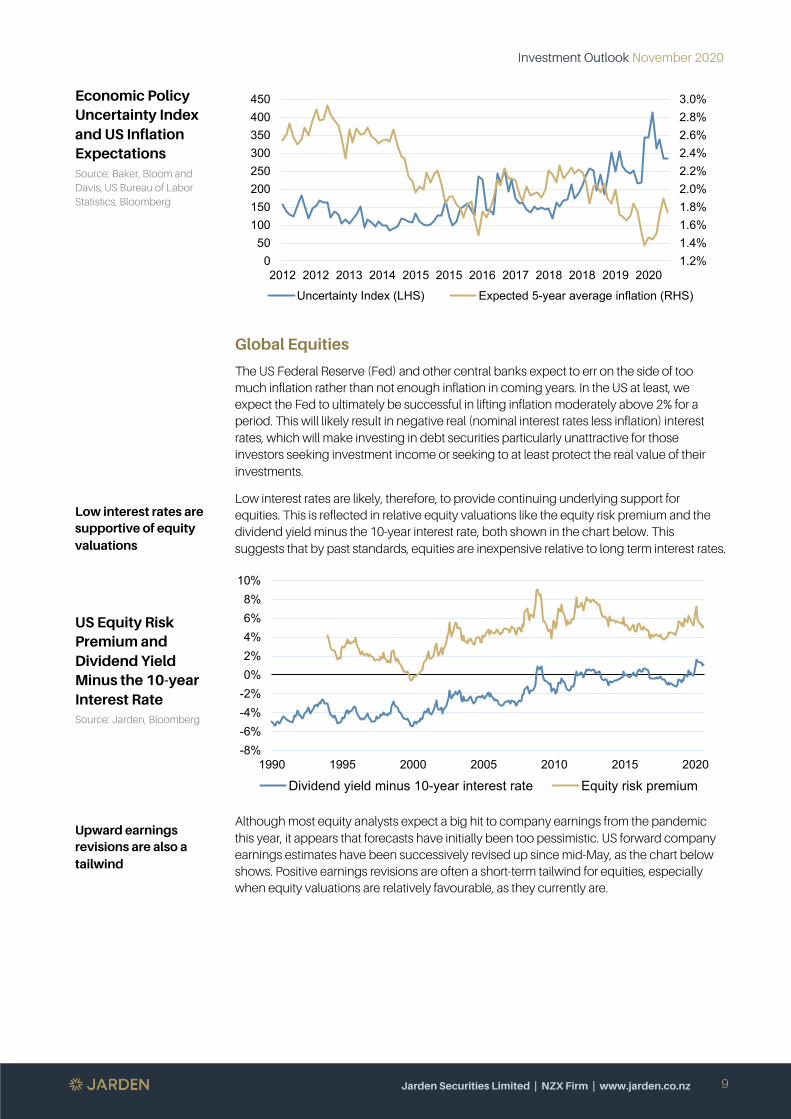
Low interest rates are supportive of equity valuations
US Equity Risk Premium and Dividend Yield Minus the 10-year Interest Rate Source: Jarden, Bloomberg
Upward earnings revisions are also a tailwind
Global Equities
The US Federal Reserve (Fed) and other central banks expect to err on the side of too much inflation rather than not enough inflation in coming years. In the US at least, we expect the Fed to ultimately be successful in lifting inflation moderately above 2% for a period. This will likely result in negative real (nominal interest rates less inflation) interest rates, which will make investing in debt securities particularly unattractive for those investors seeking investment income or seeking to at least protect the real value of their investments.
Low interest rates are likely, therefore, to provide continuing underlying support for equities. This is reflected in relative equity valuations like the equity risk premium and the dividend yield minus the 10-year interest rate, both shown in the chart below. This suggests that by past standards, equities are inexpensive relative to long term interest rates.
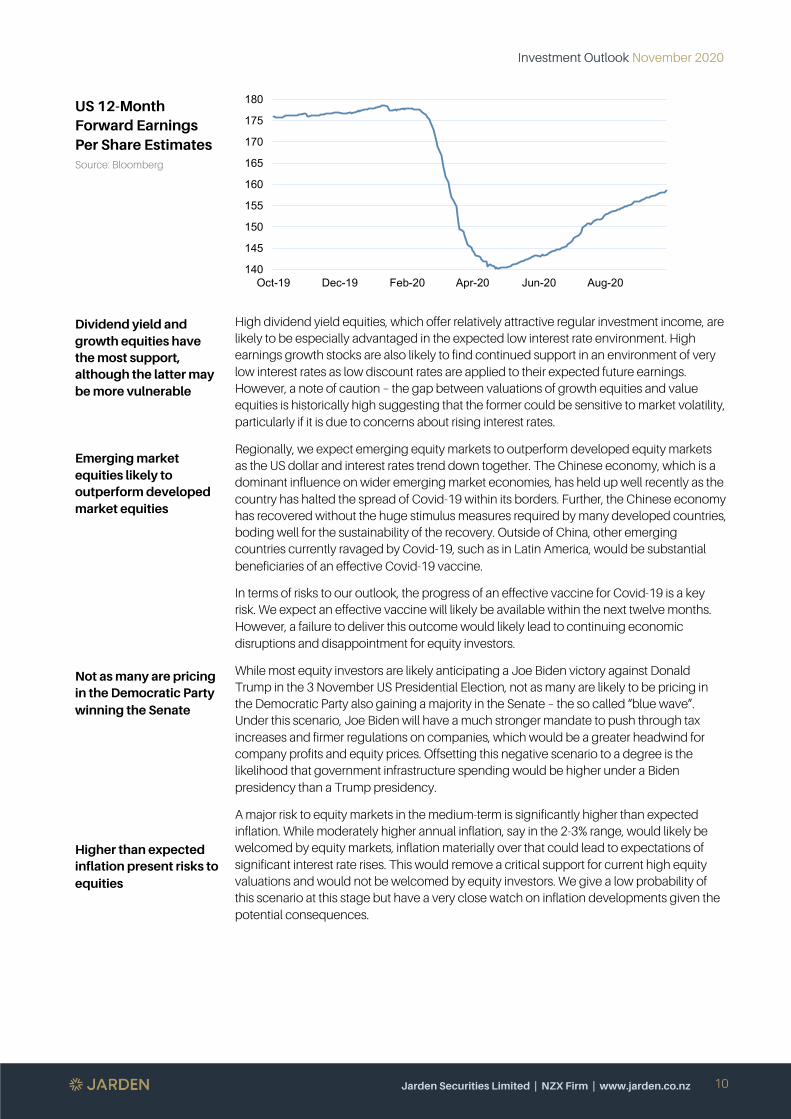
Although most equity analysts expect a big hit to company earnings from the pandemic this year, it appears that forecasts have initially been too pessimistic. US forward company earnings estimates have been successively revised up since mid-May, as the chart below shows. Positive earnings revisions are often a short-term tailwind for equities, especially when equity valuations are relatively favourable, as they currently are.
1.2%1.4%1.6%1.8%2.0%2.2%2.4%2.6%2.8%3.0%
050
100150200250300350400450
2012 2012 2013 2014 2015 2015 2016 2017 2018 2018 2019 2020
Uncertainty Index (LHS) Expected 5-year average inflation (RHS)
-8%-6%-4%-2%0%2%4%6%8%
10%
1990 1995 2000 2005 2010 2015 2020
Dividend yield minus 10-year interest rate Equity risk premium
Investment Outlook November 2020
Jarden Securities Limited | NZX Firm | www.jarden.co.nz
10
US 12-Month Forward Earnings Per Share Estimates Source: Bloomberg
Dividend yield and growth equities have the most support, although the latter may be more vulnerable
Emerging market equities likely to outperform developed market equities
Not as many are pricing in the Democratic Party winning the Senate
Higher than expected inflation present risks to equities
High dividend yield equities, which offer relatively attractive regular investment income, are likely to be especially advantaged in the expected low interest rate environment. High earnings growth stocks are also likely to find continued support in an environment of very low interest rates as low discount rates are applied to their expected future earnings. However, a note of caution – the gap between valuations of growth equities and value equities is historically high suggesting that the former could be sensitive to market volatility, particularly if it is due to concerns about rising interest rates.
Regionally, we expect emerging equity markets to outperform developed equity markets as the US dollar and interest rates trend down together. The Chinese economy, which is a dominant influence on wider emerging market economies, has held up well recently as the country has halted the spread of Covid-19 within its borders. Further, the Chinese economy has recovered without the huge stimulus measures required by many developed countries, boding well for the sustainability of the recovery. Outside of China, other emerging countries currently ravaged by Covid-19, such as in Latin America, would be substantial beneficiaries of an effective Covid-19 vaccine.
In terms of risks to our outlook, the progress of an effective vaccine for Covid-19 is a key risk. We expect an effective vaccine will likely be available within the next twelve months. However, a failure to deliver this outcome would likely lead to continuing economic disruptions and disappointment for equity investors.
While most equity investors are likely anticipating a Joe Biden victory against Donald Trump in the 3 November US Presidential Election, not as many are likely to be pricing in the Democratic Party also gaining a majority in the Senate – the so called “blue wave”. Under this scenario, Joe Biden will have a much stronger mandate to push through tax increases and firmer regulations on companies, which would be a greater headwind for company profits and equity prices. Offsetting this negative scenario to a degree is the likelihood that government infrastructure spending would be higher under a Biden presidency than a Trump presidency.
A major risk to equity markets in the medium-term is significantly higher than expected inflation. While moderately higher annual inflation, say in the 2-3% range, would likely be welcomed by equity markets, inflation materially over that could lead to expectations of significant interest rate rises. This would remove a critical support for current high equity valuations and would not be welcomed by equity investors. We give a low probability of this scenario at this stage but have a very close watch on inflation developments given the potential consequences.
140
145
150
155
160
165
170
175
180
Oct-19 Dec-19 Feb-20 Apr-20 Jun-20 Aug-20
Investment Outlook November 2020
Jarden Securities Limited | NZX Firm | www.jarden.co.nz
11
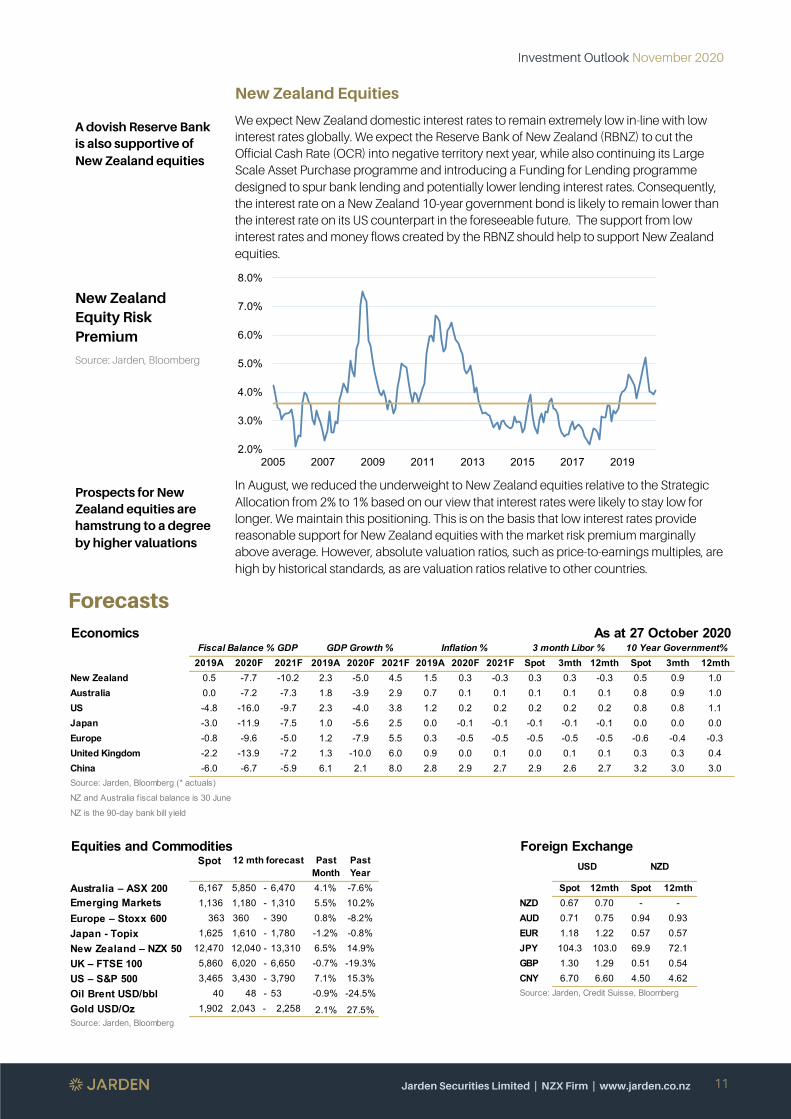
A dovish Reserve Bank is also supportive of New Zealand equities
New Zealand Equity Risk Premium
Source: Jarden, Bloomberg
Prospects for New Zealand equities are hamstrung to a degree by higher valuations
New Zealand Equities
We expect New Zealand domestic interest rates to remain extremely low in-line with low interest rates globally. We expect the Reserve Bank of New Zealand (RBNZ) to cut the Official Cash Rate (OCR) into negative territory next year, while also continuing its Large Scale Asset Purchase programme and introducing a Funding for Lending programme designed to spur bank lending and potentially lower lending interest rates. Consequently, the interest rate on a New Zealand 10-year government bond is likely to remain lower than the interest rate on its US counterpart in the foreseeable future. The support from low interest rates and money flows created by the RBNZ should help to support New Zealand equities.
In August, we reduced the underweight to New Zealand equities relative to the Strategic Allocation from 2% to 1% based on our view that interest rates were likely to stay low for longer. We maintain this positioning. This is on the basis that low interest rates provide reasonable support for New Zealand equities with the market risk premium marginally above average. However, absolute valuation ratios, such as price-to-earnings multiples, are high by historical standards, as are valuation ratios relative to other countries.
Forecasts
2.0%
3.0%
4.0%
5.0%
6.0%
7.0%
8.0%
2005 2007 2009 2011 2013 2015 2017 2019
Spot 3mth 12mth Spot 3mth 12mthNew Zealand 0.3 0.3 -0.3 0.5 0.9 1.0Australia 0.1 0.1 0.1 0.8 0.9 1.0US 0.2 0.2 0.2 0.8 0.8 1.1Japan -0.1 -0.1 -0.1 0.0 0.0 0.0Europe -0.5 -0.5 -0.5 -0.6 -0.4 -0.3United Kingdom 0.0 0.1 0.1 0.3 0.3 0.4China 2.9 2.6 2.7 3.2 3.0 3.0
Australia – ASX 200 Spot 12mth Spot 12mthNZD 0.67 0.70 - -
Europe – Stoxx 600 AUD 0.71 0.75 0.94 0.93Japan - Topix EUR 1.18 1.22 0.57 0.57New Zealand – NZX 50 JPY 104.3 103.0 69.9 72.1UK – FTSE 100 GBP 1.30 1.29 0.51 0.54US – S&P 500 CNY 6.70 6.60 4.50 4.62Oil Brent USD/bblGold USD/Oz
2019A 2020F 2021F
-4.8 -16.0 -9.7
-0.8 -9.6 -5.0
-6.0 -6.7 -5.9
1,902 Source: Jarden, Bloomberg
3,465 40
3,430 -
2019A
-3.0 -11.9
2020F 2021F
Economics As at 27 October 2020Fiscal Balance % GDP GDP Growth % Inflation % 3 month Libor % 10 Year Government%
2019A 2020F 2021F0.3 -0.3
0.0 -7.2 -7.3 1.8 -3.9 2.9 0.7 0.1 0.10.5 -7.7 -10.2 2.3 -5.0 4.5 1.5
-7.5 1.0 -5.6 2.52.3 -4.0 3.8
-0.5 -0.51.2 -7.9 5.5 0.3
1.2 0.2 0.20.0 -0.1 -0.1
-2.2 -13.9 -7.2 1.3 -10.0 6.0 0.9 0.0 0.16.1 2.1 8.0 2.8 2.9 2.7
363 1,625 1,610 - 1,780
0.8%360 - 390
6,167
-0.8%-1.2%
NZD
48 - 53
-8.2%Emerging Markets 1,136
Source: Jarden, Bloomberg (* actuals)
NZ and Australia f iscal balance is 30 June
NZ is the 90-day bank bill yield
Equities and Commodities Foreign ExchangeSpot USD
5.5%5,850 -1,180 -
6,4701,310
4.1%
12 mth forecast Past Month
Past Year-7.6%10.2%
12,470 5,860 6,020 -
Source: Jarden, Credit Suisse, Bloomberg15.3%-24.5%
27.5%
7.1%-0.9%
2.1%
3,790
14.9%-19.3%
6.5%-0.7%6,650
2,043 - 2,258
12,040 - 13,310
Investment Outlook November 2020
Jarden Securities Limited | NZX Firm | www.jarden.co.nz
12
Asset Allocation November 2020
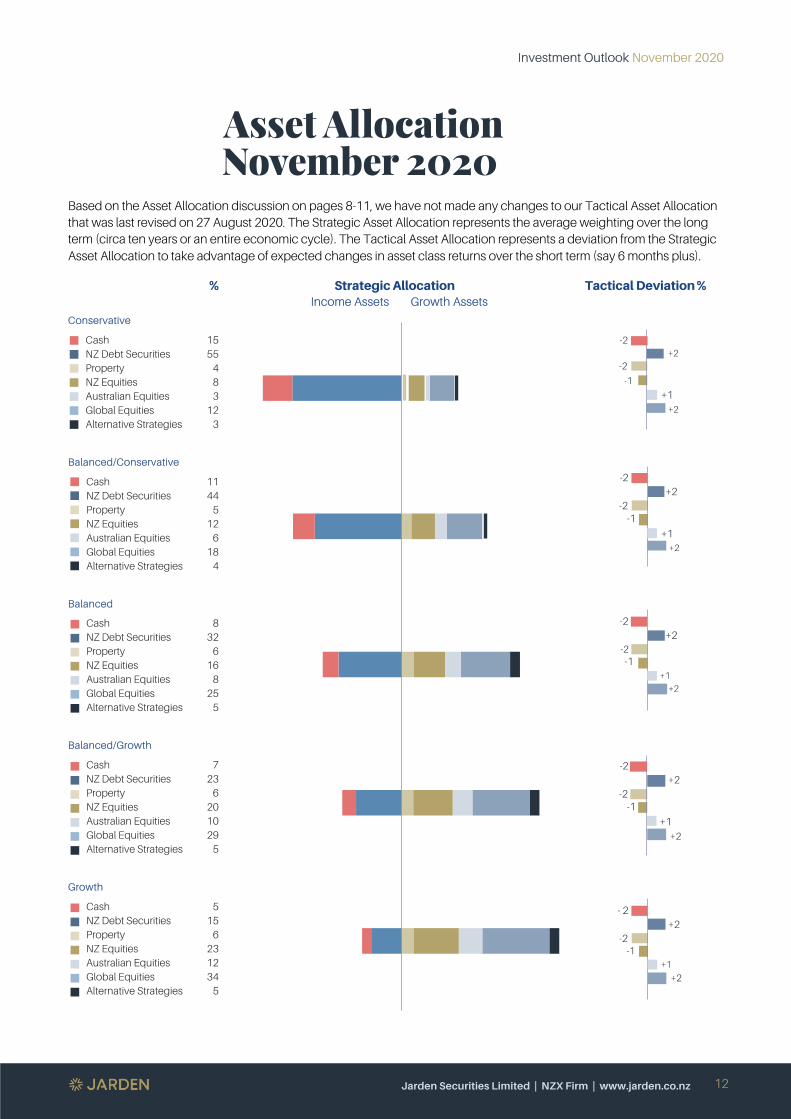
Based on the Asset Allocation discussion on pages 8-11, we have not made any changes to our Tactical Asset Allocation that was last revised on 27 August 2020. The Strategic Asset Allocation represents the average weighting over the long term (circa ten years or an entire economic cycle). The Tactical Asset Allocation represents a deviation from the Strategic Asset Allocation to take advantage of expected changes in asset class returns over the short term (say 6 months plus).
% Strategic Allocation Income Assets Growth Assets
Tactical Deviation %
Conservative
Cash 15 NZ Debt Securities 55 Property 4 NZ Equities 8 Australian Equities 3 Global Equities 12 Alternative Strategies 3
Balanced/Conservative
Cash 11 NZ Debt Securities 44 Property 5 NZ Equities 12 Australian Equities 6 Global Equities 18 Alternative Strategies 4
Balanced
Cash 8 NZ Debt Securities 32 Property 6 NZ Equities 16 Australian Equities 8 Global Equities 25 Alternative Strategies 5
Balanced/Growth
Cash 7 NZ Debt Securities 23 Property 6 NZ Equities 20 Australian Equities 10 Global Equities 29 Alternative Strategies 5
Growth
Cash 5 NZ Debt Securities 15 Property 6 NZ Equities 23 Australian Equities 12 Global Equities 34 Alternative Strategies 5
-2 +1 +2 -2
-1
+1
+2
-2 +1 +2 -2 -1
+1
+2
-2 +1 +2 -2 -1 +1
+2
-2 +1 +2 -2 -1
+1
+2
- 2 +1 +2 -2 -1 +1
+2
Investment Outlook November 2020
Jarden Securities Limited | NZX Firm | www.jarden.co.nz
13
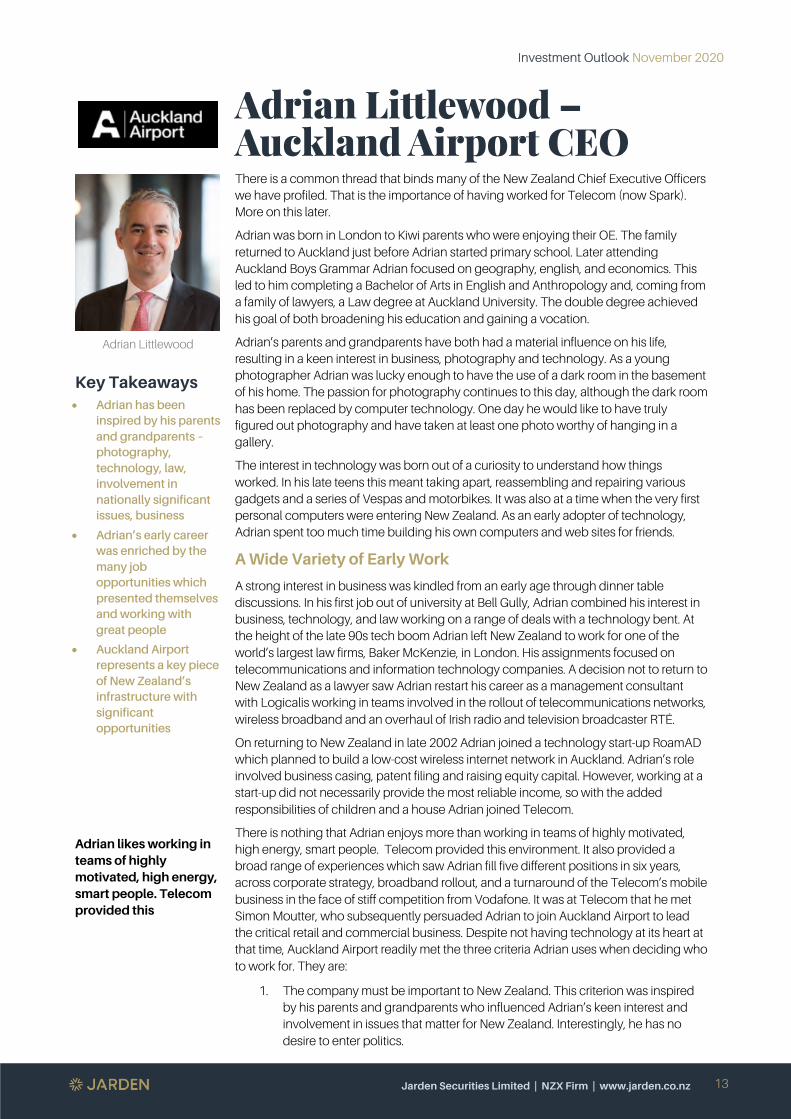
Adrian Littlewood – Auckland Airport CEO
Adrian Littlewood
Key Takeaways • Adrian has been
inspired by his parents and grandparents – photography, technology, law, involvement in nationally significant issues, business
• Adrian’s early career was enriched by the many job opportunities which presented themselves and working with great people
• Auckland Airport represents a key piece of New Zealand’s infrastructure with significant opportunities
Adrian likes working in teams of highly motivated, high energy, smart people. Telecom provided this
There is a common thread that binds many of the New Zealand Chief Executive Officers we have profiled. That is the importance of having worked for Telecom (now Spark). More on this later.
Adrian was born in London to Kiwi parents who were enjoying their OE. The family returned to Auckland just before Adrian started primary school. Later attending Auckland Boys Grammar Adrian focused on geography, english, and economics. This led to him completing a Bachelor of Arts in English and Anthropology and, coming from a family of lawyers, a Law degree at Auckland University. The double degree achieved his goal of both broadening his education and gaining a vocation.
Adrian’s parents and grandparents have both had a material influence on his life, resulting in a keen interest in business, photography and technology. As a young photographer Adrian was lucky enough to have the use of a dark room in the basement of his home. The passion for photography continues to this day, although the dark room has been replaced by computer technology. One day he would like to have truly figured out photography and have taken at least one photo worthy of hanging in a gallery.
The interest in technology was born out of a curiosity to understand how things worked. In his late teens this meant taking apart, reassembling and repairing various gadgets and a series of Vespas and motorbikes. It was also at a time when the very first personal computers were entering New Zealand. As an early adopter of technology, Adrian spent too much time building his own computers and web sites for friends.
A Wide Variety of Early Work
A strong interest in business was kindled from an early age through dinner table discussions. In his first job out of university at Bell Gully, Adrian combined his interest in business, technology, and law working on a range of deals with a technology bent. At the height of the late 90s tech boom Adrian left New Zealand to work for one of the world’s largest law firms, Baker McKenzie, in London. His assignments focused on telecommunications and information technology companies. A decision not to return to New Zealand as a lawyer saw Adrian restart his career as a management consultant with Logicalis working in teams involved in the rollout of telecommunications networks, wireless broadband and an overhaul of Irish radio and television broadcaster RTÉ.
On returning to New Zealand in late 2002 Adrian joined a technology start-up RoamAD which planned to build a low-cost wireless internet network in Auckland. Adrian’s role involved business casing, patent filing and raising equity capital. However, working at a start-up did not necessarily provide the most reliable income, so with the added responsibilities of children and a house Adrian joined Telecom.
There is nothing that Adrian enjoys more than working in teams of highly motivated, high energy, smart people. Telecom provided this environment. It also provided a broad range of experiences which saw Adrian fill five different positions in six years, across corporate strategy, broadband rollout, and a turnaround of the Telecom’s mobile business in the face of stiff competition from Vodafone. It was at Telecom that he met Simon Moutter, who subsequently persuaded Adrian to join Auckland Airport to lead the critical retail and commercial business. Despite not having technology at its heart at that time, Auckland Airport readily met the three criteria Adrian uses when deciding who to work for. They are:
1. The company must be important to New Zealand. This criterion was inspired by his parents and grandparents who influenced Adrian’s keen interest and involvement in issues that matter for New Zealand. Interestingly, he has no desire to enter politics.
Investment Outlook November 2020
Jarden Securities Limited | NZX Firm | www.jarden.co.nz
14
Ensure that Auckland Airport capitalises on its future opportunities
Auckland Airport opportunities
Upgrading airport ….
Evolve and enhance the airport’s retail business
A significant premium property development opportunity
We should strive to leave New Zealand in a better place than we found it
2. Decision making must be based locally.
3. There must be scope for Adrian to make a difference.
New Zealand’s Premier Gateway – Auckland Airport
Auckland Airport is a business with a large piece of infrastructure at its heart which earns a regulated return. However, its non-regulated business is dynamic with significant opportunities. To ensure that Auckland Airport capitalises on its future opportunities and include shareholders and other stakeholders on the journey, Auckland Airport laid out a 30-year master plan in 2014 and confirmed a multi-billion dollar investment programme in 2017. This was being implemented when Covid-19 threw an unimaginable curve ball, temporarily halting the airport’s plan. While the plan requires adjustment to reflect the lasting impact of Covid-19, it is not critically altered. This reflects travel being high on the agenda of most people. Adrian observes that people’s desire to explore has evolved over thousands of years through our development as highly social beings, who are naturally curious and have a wandering spirit. Furthermore, technology will not disrupt this as visiting somewhere and experiencing the local environment cannot be replicated on Zoom or virtual reality. Instead, technology is expected to enable travel to continue by helping to successfully screen for Covid-19 and other infectious diseases at the border, and developing carbon emission free forms of air travel – battery powered short haul flights, hydrogen fuelled long haul flights or high energy aviation fuel synthesised out of water and carbon captured out of the air.
In the medium term there are three key opportunities for Auckland Airport:
1. Upgrading airport infrastructure to serve the expected growth in high value visitors from around the Asia-pacific rim looking for experiences around activities rather than events or shopping which other destinations offer. Importantly, these visitors are only one flight away rather than the two flights endured by those visiting from the United Kingdom or Europe.
2. There is material scope to evolve and enhance the airport’s retail business. The advent of click and collect allows the Airport’s retail businesses to expand the range of goods offered and unshackle themselves from the physical limits of available floor space to display goods at their airport premises. Technology also enables the development of dynamic marketing and pricing. Finally, through the development of a customer loyalty scheme, Strata Club, the airport now increasingly knows who its customers are and can market travel related products to them such as travel insurance, car rentals and airport hotels.
3. Auckland Airport has a significant land bank located only 22 kilometres from Auckland’s central business district. As a premier location there is an extremely large property development opportunity, which has become increasingly valuable as property capitalisation rates have compressed.
Outside of the immediate Covid-19 challenges, the key challenge facing the Airport in the coming years is resetting and delivering its infrastructure plan in a post Covid-19 world while the shape of the aviation recovery remains uncertain and finding the skills and resources to deliver the programme. This is likely to become a challenge mirrored across many parts of New Zealand as many civic and national assets reach the end of their lives and need replacing. Consequently, the Airport has partnered with the Ministry of Social Development and the local community to create Ara. This is the Airport’s jobs and skills hub, connecting South Auckland people with job and training opportunities to build and run the Airport over the next three decades.
Finishing on a personal note, Adrian’s ambition is to continue doing interesting things while working alongside great people. He acknowledges what we all know, which is that New Zealand is a special place in the world and that we should strive to leave it in a better state than we found it for future generations.

Investment Outlook November 2020
Jarden Securities Limited | NZX Firm | www.jarden.co.nz
15
Introducing Janine Turner – Head of Wealth Operations
Janine Turner
Key Takeaways • Janine enjoys the
fast-paced environment associated with financial markets and interacting with clients.
• Away from the office she is a passionate gardener and foodie who enjoys entertaining
• A strong work ethic and desire to achieve high standards was instilled early
Without the support of their associates most wealth management advisers would struggle to provide a high level of service
Janine brings a wealth of experience to her role as Jarden’s Head of Wealth Operations having first gained exposure to financial markets in 1992 when she joined Bankers Trust as a Settlements Officer. Janine enjoys the fast-paced environment associated with financial markets and talking to clients who come from all walks of life. However, it was not until she had spent a couple of years working in banks that she realised that her calling was working in companies operating in financial markets.
Janine spent her early years growing up in Fielding. From age eight her father became a bank manager which saw the family move around numerous small north island towns every three to four years. This saw her finish her secondary schooling in the small Waikato town of Te Kauwhata north of Hamilton. Her rural upbringing clearly had an influence as she and her family now live on a lifestyle block north of Albany with sheep, chickens, a large garden, and a glasshouse. As a “foodie” and passionate gardener Janine grows all her vegetables. When combined with eggs from the chickens and fresh lamb, supermarket shops are significantly smaller than for the average kiwi family.
In her teenage years Janine developed a strong desire to travel. Consequently, in her early twenties she based herself in London, working in a few financial market companies, which funded two lengthy holidays. One in Europe and one trucking around Africa, which took her from Kenya to South Africa taking in Africa’s amazing wildlife along the way.
There have been numerous people who have influenced Janine’s life. However, it was her boss at Bankers Trust that deserves special mention. He instilled in Janine a strong work ethic and the desire to strive for and achieve high expectations.
Janine has worked for Jarden for nearly twenty years, a testament to a career that she thoroughly enjoys and gets significant satisfaction from doing an exceptional job. The scope of her role has expanded significantly over the years and, in conjunction with the growth in Jarden’s wealth management business, now supports around seventy wealth management advisers through the team of twenty wealth management associates which she leads.
Wealth Management Associates
Without the support of their associates most wealth management advisers would struggle to provide the high level of service expected from a Jarden adviser. While associates cannot provide investment advice to clients, they know all the systems and processes required to deliver our wealth management service to clients. They are deeply involved in on-boarding new clients, answering a huge variety of operational requests from clients, and ensuring that the ever-changing regulatory requirements are complied with as simply as possible. As a result of many client interactions it is common for a strong enduring rapport to develop between clients and associates. Jarden’s associates are at the front line of living and breathing Jarden’s values of client focus, excellence, and respect.
Investment Outlook November 2020
Jarden Securities Limited | NZX Firm | www.jarden.co.nz
16
Covid-19 Vaccine - A Financial Shot in the Arm
Key Takeaway
• It appears more likely a safe and effective vaccine will become available by year end
• The financial windfall to the winner will be huge
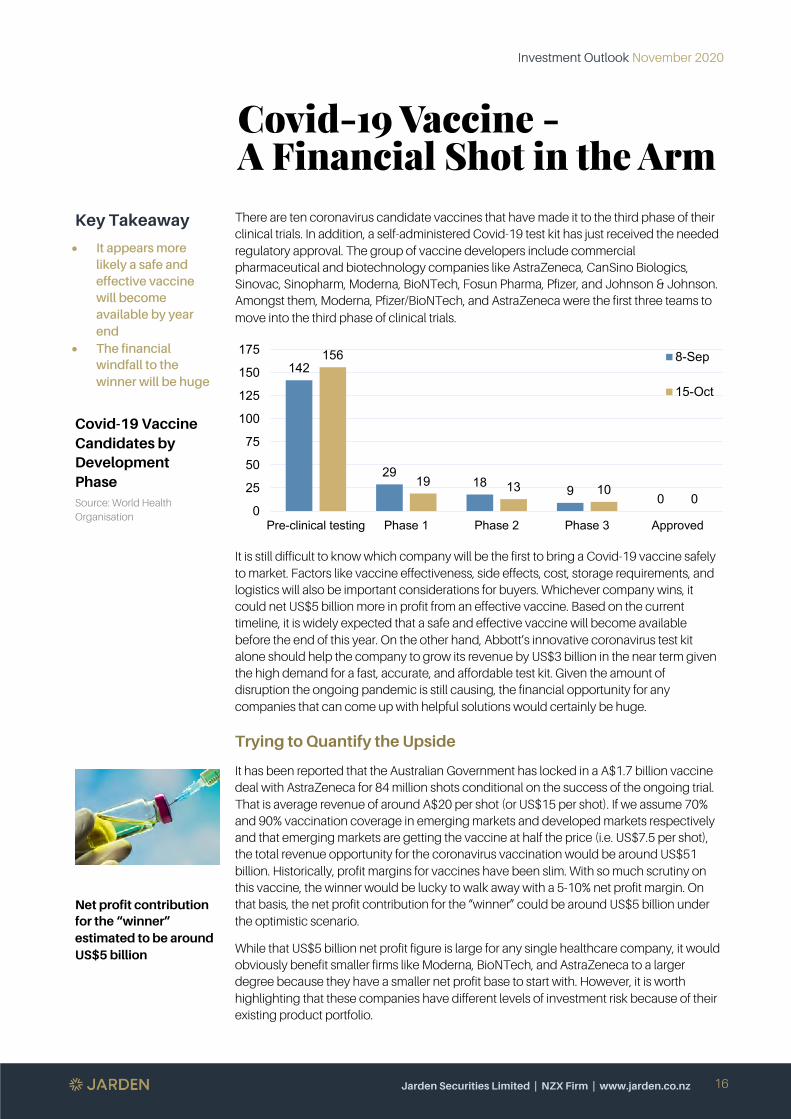
Covid-19 Vaccine Candidates by Development Phase Source: World Health Organisation
Net profit contribution for the “winner” estimated to be around US$5 billion
There are ten coronavirus candidate vaccines that have made it to the third phase of their clinical trials. In addition, a self-administered Covid-19 test kit has just received the needed regulatory approval. The group of vaccine developers include commercial pharmaceutical and biotechnology companies like AstraZeneca, CanSino Biologics, Sinovac, Sinopharm, Moderna, BioNTech, Fosun Pharma, Pfizer, and Johnson & Johnson. Amongst them, Moderna, Pfizer/BioNTech, and AstraZeneca were the first three teams to move into the third phase of clinical trials.
It is still difficult to know which company will be the first to bring a Covid-19 vaccine safely to market. Factors like vaccine effectiveness, side effects, cost, storage requirements, and logistics will also be important considerations for buyers. Whichever company wins, it could net US$5 billion more in profit from an effective vaccine. Based on the current timeline, it is widely expected that a safe and effective vaccine will become available before the end of this year. On the other hand, Abbott’s innovative coronavirus test kit alone should help the company to grow its revenue by US$3 billion in the near term given the high demand for a fast, accurate, and affordable test kit. Given the amount of disruption the ongoing pandemic is still causing, the financial opportunity for any companies that can come up with helpful solutions would certainly be huge.
Trying to Quantify the Upside
It has been reported that the Australian Government has locked in a A$1.7 billion vaccine deal with AstraZeneca for 84 million shots conditional on the success of the ongoing trial. That is average revenue of around A$20 per shot (or US$15 per shot). If we assume 70% and 90% vaccination coverage in emerging markets and developed markets respectively and that emerging markets are getting the vaccine at half the price (i.e. US$7.5 per shot), the total revenue opportunity for the coronavirus vaccination would be around US$51 billion. Historically, profit margins for vaccines have been slim. With so much scrutiny on this vaccine, the winner would be lucky to walk away with a 5-10% net profit margin. On that basis, the net profit contribution for the “winner” could be around US$5 billion under the optimistic scenario.
While that US$5 billion net profit figure is large for any single healthcare company, it would obviously benefit smaller firms like Moderna, BioNTech, and AstraZeneca to a larger degree because they have a smaller net profit base to start with. However, it is worth highlighting that these companies have different levels of investment risk because of their existing product portfolio.
142
2918 9 0
156
19 13 100
0
25
50
75
100
125
150
175
Pre-clinical testing Phase 1 Phase 2 Phase 3 Approved
8-Sep
15-Oct
Investment Outlook November 2020
Jarden Securities Limited | NZX Firm | www.jarden.co.nz
17
Company Ratings
AstraZeneca
Ticker: AZN.LN Price: £80.77 Target price: £90.80
Pfizer
Ticker: PFE.US Price: US$37.92 Target price: US$40.92
Moderna
Ticker: MRNA.US Price: US$70.24 Target price: US$92.85
BioNTech
Ticker: BNTX.US Price: US$82.93 Target price: US$70.07
Abbott Laboratories
Ticker: ABT.US Price: US$109.00 Target price: US$117.17 Note: All target prices are Bloomberg consensus
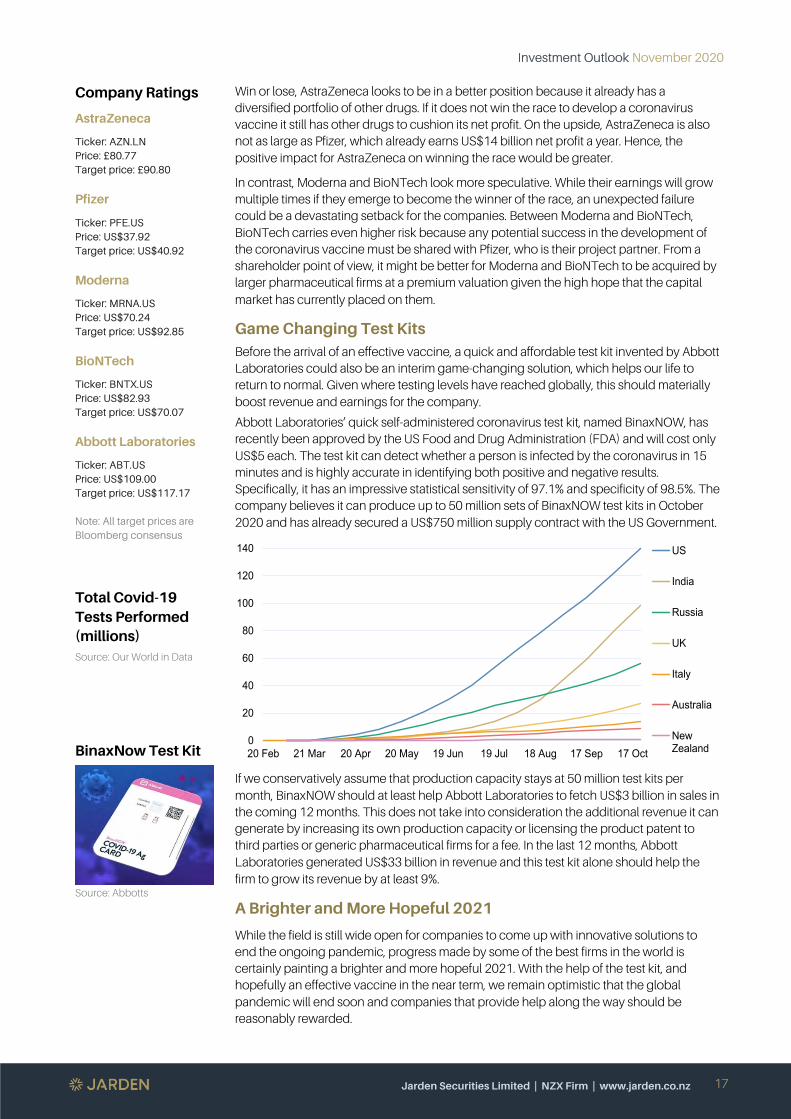
Total Covid-19 Tests Performed (millions) Source: Our World in Data
BinaxNow Test Kit
Source: Abbotts
Win or lose, AstraZeneca looks to be in a better position because it already has a diversified portfolio of other drugs. If it does not win the race to develop a coronavirus vaccine it still has other drugs to cushion its net profit. On the upside, AstraZeneca is also not as large as Pfizer, which already earns US$14 billion net profit a year. Hence, the positive impact for AstraZeneca on winning the race would be greater.
In contrast, Moderna and BioNTech look more speculative. While their earnings will grow multiple times if they emerge to become the winner of the race, an unexpected failure could be a devastating setback for the companies. Between Moderna and BioNTech, BioNTech carries even higher risk because any potential success in the development of the coronavirus vaccine must be shared with Pfizer, who is their project partner. From a shareholder point of view, it might be better for Moderna and BioNTech to be acquired by larger pharmaceutical firms at a premium valuation given the high hope that the capital market has currently placed on them.
Game Changing Test Kits Before the arrival of an effective vaccine, a quick and affordable test kit invented by Abbott Laboratories could also be an interim game-changing solution, which helps our life to return to normal. Given where testing levels have reached globally, this should materially boost revenue and earnings for the company.
Abbott Laboratories’ quick self-administered coronavirus test kit, named BinaxNOW, has recently been approved by the US Food and Drug Administration (FDA) and will cost only US$5 each. The test kit can detect whether a person is infected by the coronavirus in 15 minutes and is highly accurate in identifying both positive and negative results. Specifically, it has an impressive statistical sensitivity of 97.1% and specificity of 98.5%. The company believes it can produce up to 50 million sets of BinaxNOW test kits in October 2020 and has already secured a US$750 million supply contract with the US Government.
If we conservatively assume that production capacity stays at 50 million test kits per month, BinaxNOW should at least help Abbott Laboratories to fetch US$3 billion in sales in the coming 12 months. This does not take into consideration the additional revenue it can generate by increasing its own production capacity or licensing the product patent to third parties or generic pharmaceutical firms for a fee. In the last 12 months, Abbott Laboratories generated US$33 billion in revenue and this test kit alone should help the firm to grow its revenue by at least 9%.
A Brighter and More Hopeful 2021
While the field is still wide open for companies to come up with innovative solutions to end the ongoing pandemic, progress made by some of the best firms in the world is certainly painting a brighter and more hopeful 2021. With the help of the test kit, and hopefully an effective vaccine in the near term, we remain optimistic that the global pandemic will end soon and companies that provide help along the way should be reasonably rewarded.
0
20
40
60
80
100
120
140
20 Feb 21 Mar 20 Apr 20 May 19 Jun 19 Jul 18 Aug 17 Sep 17 Oct
US
India
Russia
UK
Italy
Australia
NewZealand
Investment Outlook November 2020
Jarden Securities Limited | NZX Firm | www.jarden.co.nz
18
A Green-led Recovery
Key Takeaways
• The global wave of fiscal stimulus includes a substantial amount of ‘green’ initiatives aimed at addressing climate change.
• Several end markets and companies will benefit from the long-term growth trends being supported.
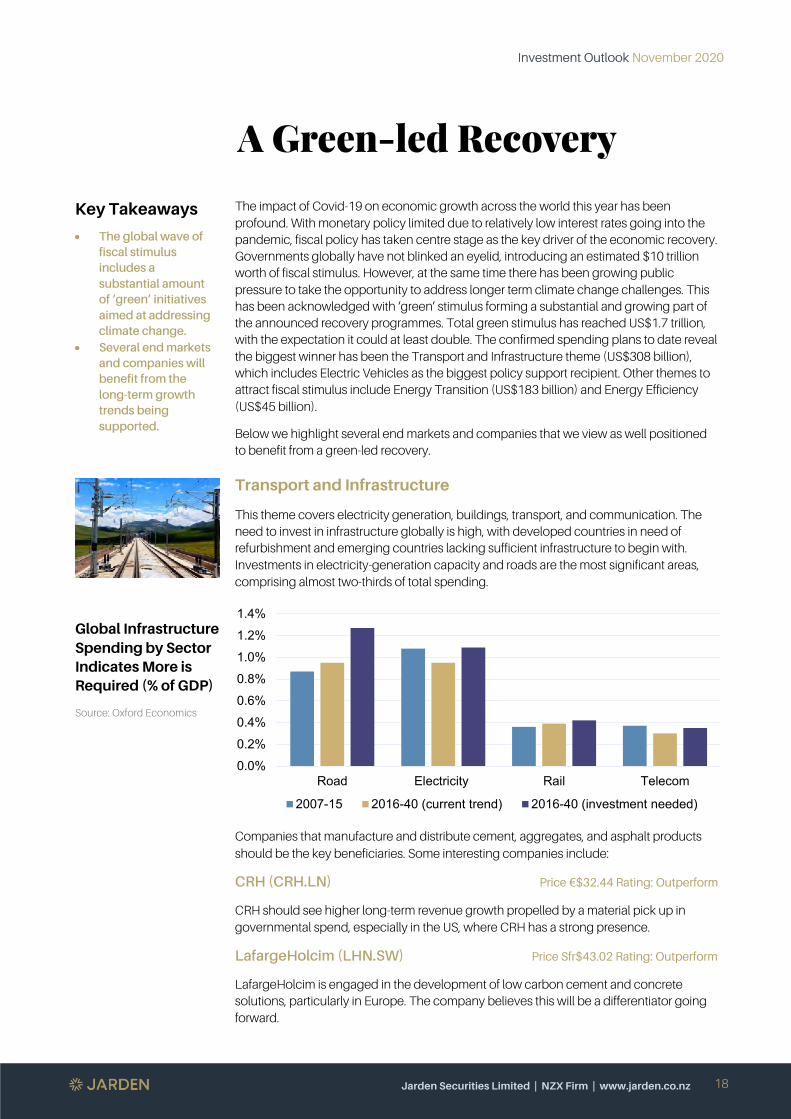
Global Infrastructure Spending by Sector Indicates More is Required (% of GDP)
Source: Oxford Economics
The impact of Covid-19 on economic growth across the world this year has been profound. With monetary policy limited due to relatively low interest rates going into the pandemic, fiscal policy has taken centre stage as the key driver of the economic recovery. Governments globally have not blinked an eyelid, introducing an estimated $10 trillion worth of fiscal stimulus. However, at the same time there has been growing public pressure to take the opportunity to address longer term climate change challenges. This has been acknowledged with ‘green’ stimulus forming a substantial and growing part of the announced recovery programmes. Total green stimulus has reached US$1.7 trillion, with the expectation it could at least double. The confirmed spending plans to date reveal the biggest winner has been the Transport and Infrastructure theme (US$308 billion), which includes Electric Vehicles as the biggest policy support recipient. Other themes to attract fiscal stimulus include Energy Transition (US$183 billion) and Energy Efficiency (US$45 billion).
Below we highlight several end markets and companies that we view as well positioned to benefit from a green-led recovery.
Transport and Infrastructure
This theme covers electricity generation, buildings, transport, and communication. The need to invest in infrastructure globally is high, with developed countries in need of refurbishment and emerging countries lacking sufficient infrastructure to begin with. Investments in electricity-generation capacity and roads are the most significant areas, comprising almost two-thirds of total spending.
Companies that manufacture and distribute cement, aggregates, and asphalt products should be the key beneficiaries. Some interesting companies include:
CRH (CRH.LN) Price €$32.44 Rating: Outperform
CRH should see higher long-term revenue growth propelled by a material pick up in governmental spend, especially in the US, where CRH has a strong presence.
LafargeHolcim (LHN.SW) Price Sfr$43.02 Rating: Outperform
LafargeHolcim is engaged in the development of low carbon cement and concrete solutions, particularly in Europe. The company believes this will be a differentiator going forward.
0.0%0.2%
0.4%0.6%0.8%
1.0%1.2%1.4%
Road Electricity Rail Telecom
2007-15 2016-40 (current trend) 2016-40 (investment needed)
Investment Outlook November 2020
Jarden Securities Limited | NZX Firm | www.jarden.co.nz
19
Share of Global Power Generation by Energy Source Source: BP
Electric Vehicles
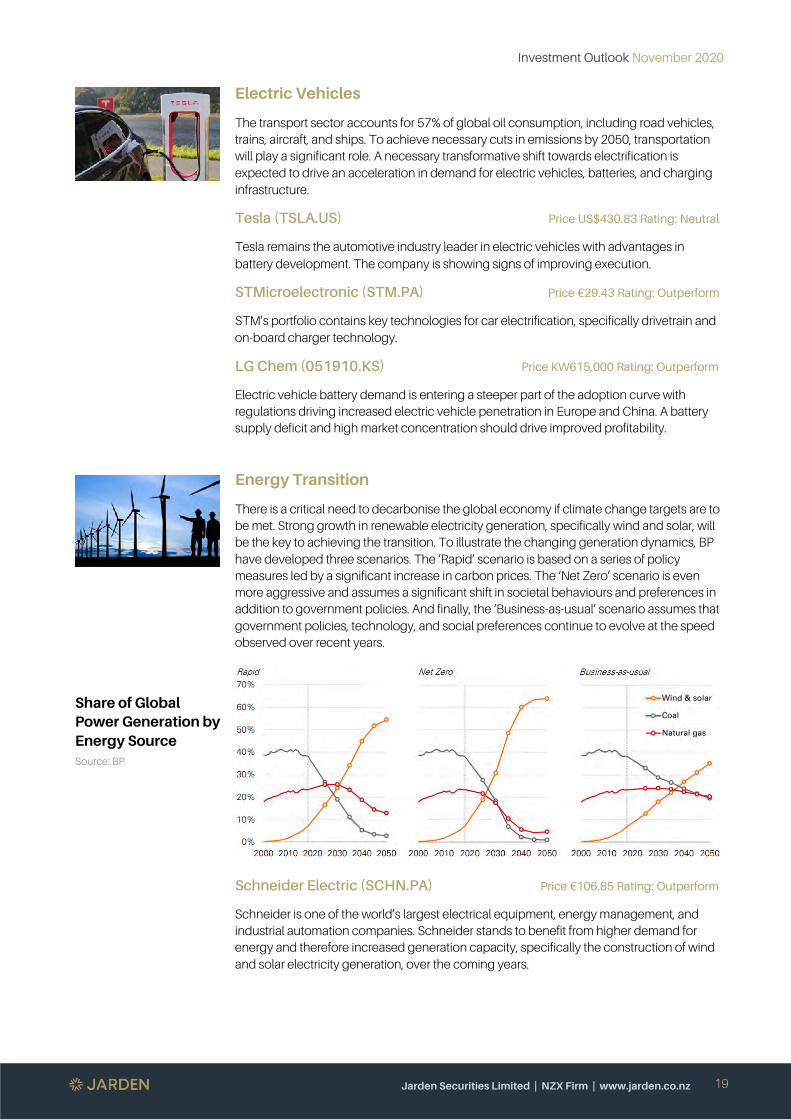
The transport sector accounts for 57% of global oil consumption, including road vehicles, trains, aircraft, and ships. To achieve necessary cuts in emissions by 2050, transportation will play a significant role. A necessary transformative shift towards electrification is expected to drive an acceleration in demand for electric vehicles, batteries, and charging infrastructure.
Tesla (TSLA.US) Price US$430.83 Rating: Neutral
Tesla remains the automotive industry leader in electric vehicles with advantages in battery development. The company is showing signs of improving execution.
STMicroelectronic (STM.PA) Price €29.43 Rating: Outperform
STM’s portfolio contains key technologies for car electrification, specifically drivetrain and on-board charger technology.
LG Chem (051910.KS) Price KW615,000 Rating: Outperform
Electric vehicle battery demand is entering a steeper part of the adoption curve with regulations driving increased electric vehicle penetration in Europe and China. A battery supply deficit and high market concentration should drive improved profitability.
Energy Transition
There is a critical need to decarbonise the global economy if climate change targets are to be met. Strong growth in renewable electricity generation, specifically wind and solar, will be the key to achieving the transition. To illustrate the changing generation dynamics, BP have developed three scenarios. The ‘Rapid’ scenario is based on a series of policy measures led by a significant increase in carbon prices. The ‘Net Zero’ scenario is even more aggressive and assumes a significant shift in societal behaviours and preferences in addition to government policies. And finally, the ‘Business-as-usual’ scenario assumes that government policies, technology, and social preferences continue to evolve at the speed observed over recent years.
Schneider Electric (SCHN.PA) Price €106.85 Rating: Outperform
Schneider is one of the world’s largest electrical equipment, energy management, and industrial automation companies. Schneider stands to benefit from higher demand for energy and therefore increased generation capacity, specifically the construction of wind and solar electricity generation, over the coming years.
Investment Outlook November 2020
Jarden Securities Limited | NZX Firm | www.jarden.co.nz
20
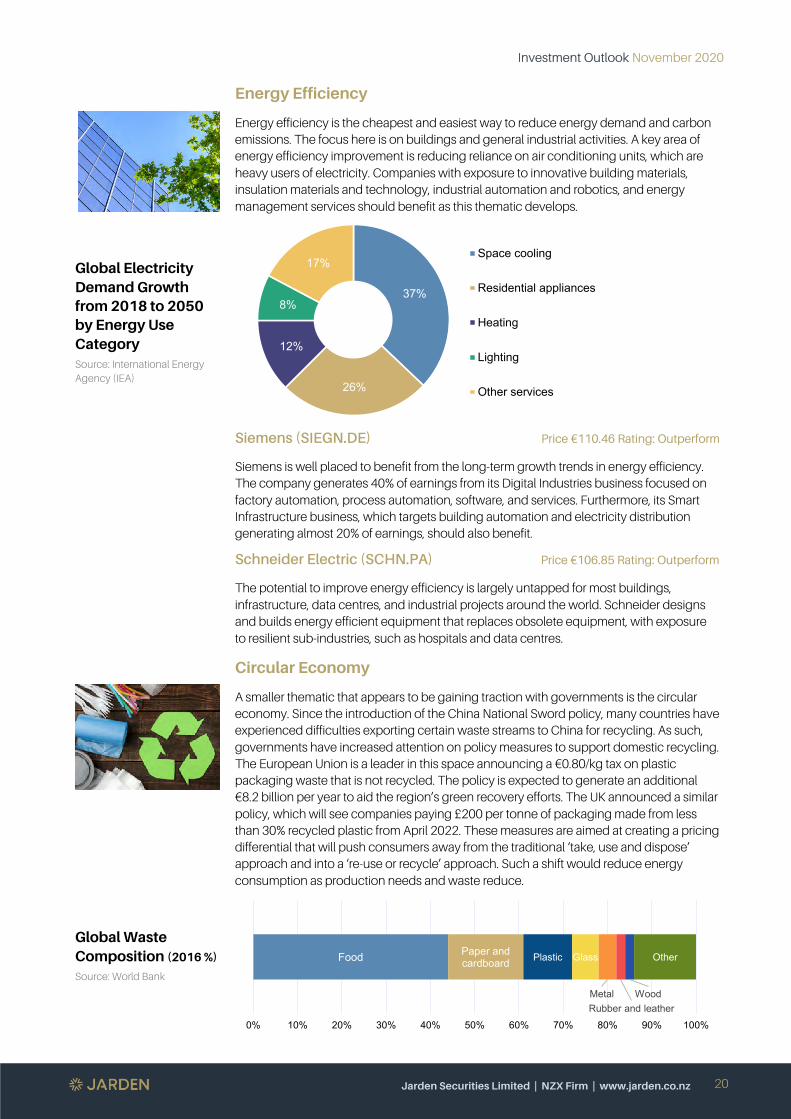
Global Electricity Demand Growth from 2018 to 2050 by Energy Use Category Source: International Energy Agency (IEA)
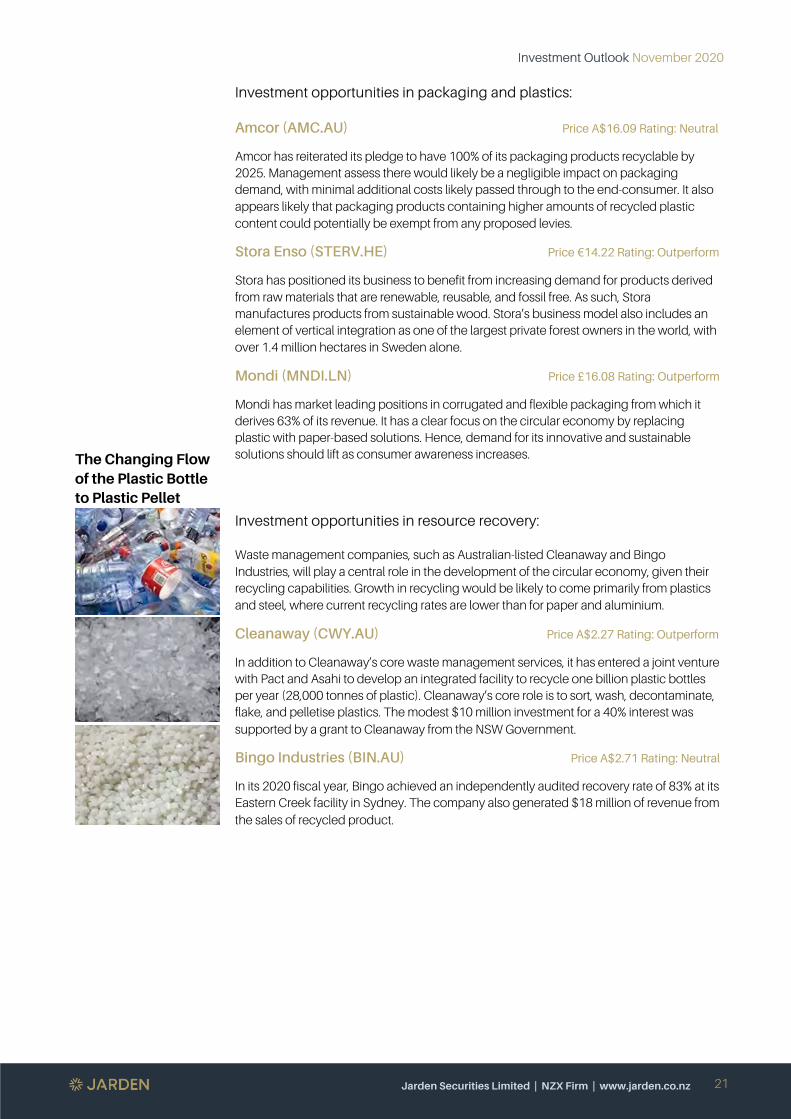
Global Waste Composition (2016 %)
Source: World Bank
Energy Efficiency
Energy efficiency is the cheapest and easiest way to reduce energy demand and carbon emissions. The focus here is on buildings and general industrial activities. A key area of energy efficiency improvement is reducing reliance on air conditioning units, which are heavy users of electricity. Companies with exposure to innovative building materials, insulation materials and technology, industrial automation and robotics, and energy management services should benefit as this thematic develops.
Siemens (SIEGN.DE) Price €110.46 Rating: Outperform
Siemens is well placed to benefit from the long-term growth trends in energy efficiency. The company generates 40% of earnings from its Digital Industries business focused on factory automation, process automation, software, and services. Furthermore, its Smart Infrastructure business, which targets building automation and electricity distribution generating almost 20% of earnings, should also benefit.
Schneider Electric (SCHN.PA) Price €106.85 Rating: Outperform
The potential to improve energy efficiency is largely untapped for most buildings, infrastructure, data centres, and industrial projects around the world. Schneider designs and builds energy efficient equipment that replaces obsolete equipment, with exposure to resilient sub-industries, such as hospitals and data centres.
Circular Economy
A smaller thematic that appears to be gaining traction with governments is the circular economy. Since the introduction of the China National Sword policy, many countries have experienced difficulties exporting certain waste streams to China for recycling. As such, governments have increased attention on policy measures to support domestic recycling. The European Union is a leader in this space announcing a €0.80/kg tax on plastic packaging waste that is not recycled. The policy is expected to generate an additional €8.2 billion per year to aid the region’s green recovery efforts. The UK announced a similar policy, which will see companies paying £200 per tonne of packaging made from less than 30% recycled plastic from April 2022. These measures are aimed at creating a pricing differential that will push consumers away from the traditional ‘take, use and dispose’ approach and into a ‘re-use or recycle’ approach. Such a shift would reduce energy consumption as production needs and waste reduce.
37%
26%
12%
8%
17%Space cooling
Residential appliances
Heating
Lighting
Other services
Food Paper and cardboard Plastic Glass
MetalRubber and leather
Wood
Other
0% 10% 20% 30% 40% 50% 60% 70% 80% 90% 100%
Investment Outlook November 2020
Jarden Securities Limited | NZX Firm | www.jarden.co.nz
21
The Changing Flow of the Plastic Bottle to Plastic Pellet
Investment opportunities in packaging and plastics:
Amcor (AMC.AU) Price A$16.09 Rating: Neutral
Amcor has reiterated its pledge to have 100% of its packaging products recyclable by 2025. Management assess there would likely be a negligible impact on packaging demand, with minimal additional costs likely passed through to the end-consumer. It also appears likely that packaging products containing higher amounts of recycled plastic content could potentially be exempt from any proposed levies.
Stora Enso (STERV.HE) Price €14.22 Rating: Outperform
Stora has positioned its business to benefit from increasing demand for products derived from raw materials that are renewable, reusable, and fossil free. As such, Stora manufactures products from sustainable wood. Stora’s business model also includes an element of vertical integration as one of the largest private forest owners in the world, with over 1.4 million hectares in Sweden alone.
Mondi (MNDI.LN) Price £16.08 Rating: Outperform
Mondi has market leading positions in corrugated and flexible packaging from which it derives 63% of its revenue. It has a clear focus on the circular economy by replacing plastic with paper-based solutions. Hence, demand for its innovative and sustainable solutions should lift as consumer awareness increases.
Investment opportunities in resource recovery:
Waste management companies, such as Australian-listed Cleanaway and Bingo Industries, will play a central role in the development of the circular economy, given their recycling capabilities. Growth in recycling would be likely to come primarily from plastics and steel, where current recycling rates are lower than for paper and aluminium.
Cleanaway (CWY.AU) Price A$2.27 Rating: Outperform
In addition to Cleanaway’s core waste management services, it has entered a joint venture with Pact and Asahi to develop an integrated facility to recycle one billion plastic bottles per year (28,000 tonnes of plastic). Cleanaway’s core role is to sort, wash, decontaminate, flake, and pelletise plastics. The modest $10 million investment for a 40% interest was supported by a grant to Cleanaway from the NSW Government.
Bingo Industries (BIN.AU) Price A$2.71 Rating: Neutral
In its 2020 fiscal year, Bingo achieved an independently audited recovery rate of 83% at its Eastern Creek facility in Sydney. The company also generated $18 million of revenue from the sales of recycled product.
Investment Outlook November 2020
Jarden Securities Limited | NZX Firm | www.jarden.co.nz
22
Quality Investing – Timing Isn’t Everything
Key Takeaways
• Quality means different things to different people
• Quality has historically provided better downside protection during recessionary periods
• Jarden’s Quality Model Portfolio reflects a desire for a longer-term investment horizon and therefore less sensitivity to short term discrepancies in valuation
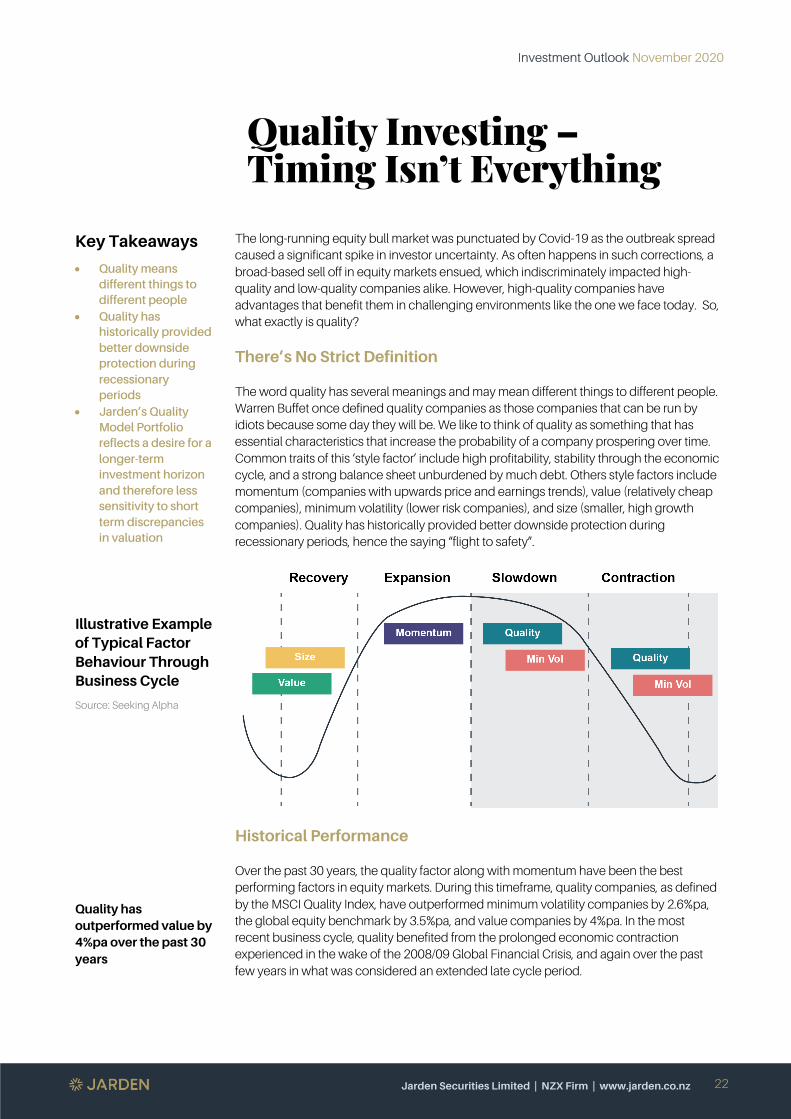
Illustrative Example of Typical Factor Behaviour Through Business Cycle
Source: Seeking Alpha
Quality has outperformed value by 4%pa over the past 30 years
The long-running equity bull market was punctuated by Covid-19 as the outbreak spread caused a significant spike in investor uncertainty. As often happens in such corrections, a broad-based sell off in equity markets ensued, which indiscriminately impacted high-quality and low-quality companies alike. However, high-quality companies have advantages that benefit them in challenging environments like the one we face today. So, what exactly is quality?
There’s No Strict Definition
The word quality has several meanings and may mean different things to different people. Warren Buffet once defined quality companies as those companies that can be run by idiots because some day they will be. We like to think of quality as something that has essential characteristics that increase the probability of a company prospering over time. Common traits of this ‘style factor’ include high profitability, stability through the economic cycle, and a strong balance sheet unburdened by much debt. Others style factors include momentum (companies with upwards price and earnings trends), value (relatively cheap companies), minimum volatility (lower risk companies), and size (smaller, high growth companies). Quality has historically provided better downside protection during recessionary periods, hence the saying “flight to safety”.
Historical Performance
Over the past 30 years, the quality factor along with momentum have been the best performing factors in equity markets. During this timeframe, quality companies, as defined by the MSCI Quality Index, have outperformed minimum volatility companies by 2.6%pa, the global equity benchmark by 3.5%pa, and value companies by 4%pa. In the most recent business cycle, quality benefited from the prolonged economic contraction experienced in the wake of the 2008/09 Global Financial Crisis, and again over the past few years in what was considered an extended late cycle period.
Investment Outlook November 2020
Jarden Securities Limited | NZX Firm | www.jarden.co.nz
23
Quality is generally a highly persistent characteristic
Less sensitive to short term discrepancies in valuation
Quality companies tend to find appreciation from the general market during volatile times
The Valuation Argument
Quality traits are most often found in the Technology, Consumer Staples, and Healthcare sectors. Coincidently, companies in these sectors are generally associated with high valuation multiplies relative to the broader market. Furthermore, valuations for quality companies have risen significantly over the past few years. This is generally because as a business cycle matures, a company’s success becomes evident and well-known.
Quality is generally a highly persistent characteristic. This means that a high-quality company today is very likely to remain a high-quality company in the future. A company with very high levels of profitability has likely achieved this by building a defendable moat around its business through a strong brand, proprietary technology, or its network effect. Consequently, when identifying quality companies, valuation does not typically play a significant role.
Paying Up for Quality
Goodman Property Trust (GMT) Price $2.43 Rating: Underperform
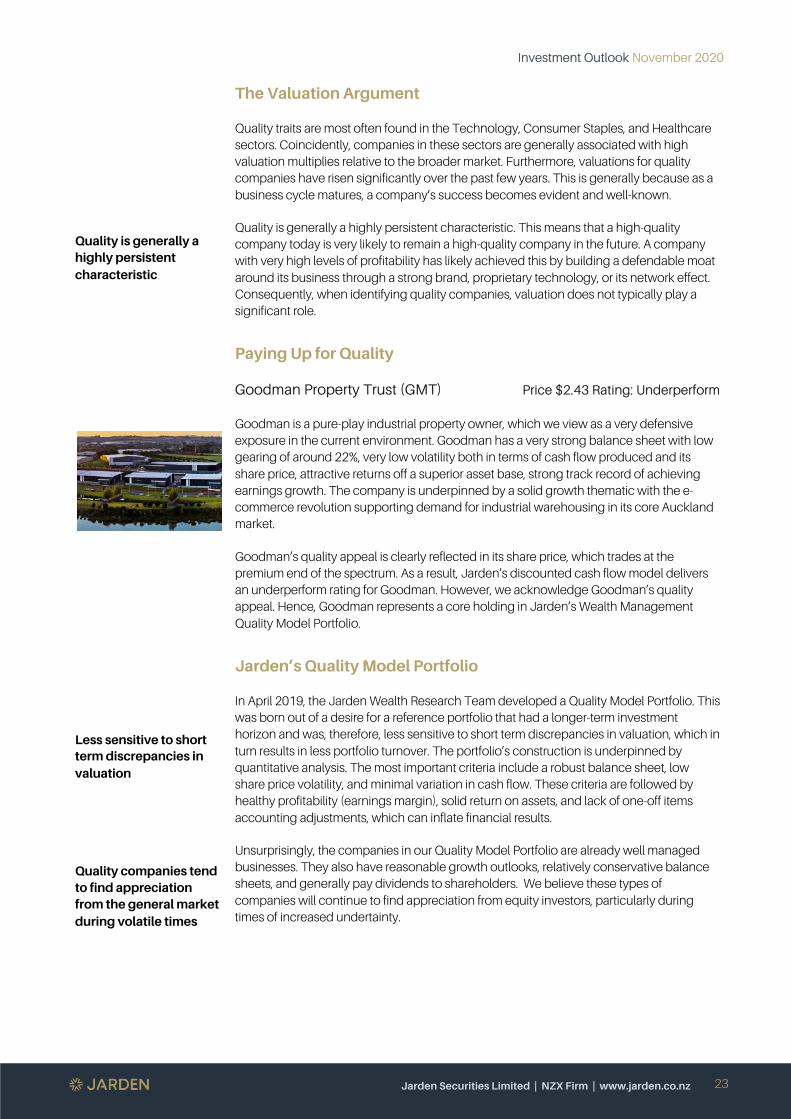
Goodman is a pure-play industrial property owner, which we view as a very defensive exposure in the current environment. Goodman has a very strong balance sheet with low gearing of around 22%, very low volatility both in terms of cash flow produced and its share price, attractive returns off a superior asset base, strong track record of achieving earnings growth. The company is underpinned by a solid growth thematic with the e-commerce revolution supporting demand for industrial warehousing in its core Auckland market.
Goodman’s quality appeal is clearly reflected in its share price, which trades at the premium end of the spectrum. As a result, Jarden’s discounted cash flow model delivers an underperform rating for Goodman. However, we acknowledge Goodman’s quality appeal. Hence, Goodman represents a core holding in Jarden’s Wealth Management Quality Model Portfolio.
Jarden’s Quality Model Portfolio
In April 2019, the Jarden Wealth Research Team developed a Quality Model Portfolio. This was born out of a desire for a reference portfolio that had a longer-term investment horizon and was, therefore, less sensitive to short term discrepancies in valuation, which in turn results in less portfolio turnover. The portfolio’s construction is underpinned by quantitative analysis. The most important criteria include a robust balance sheet, low share price volatility, and minimal variation in cash flow. These criteria are followed by healthy profitability (earnings margin), solid return on assets, and lack of one-off items accounting adjustments, which can inflate financial results.
Unsurprisingly, the companies in our Quality Model Portfolio are already well managed businesses. They also have reasonable growth outlooks, relatively conservative balance sheets, and generally pay dividends to shareholders. We believe these types of companies will continue to find appreciation from equity investors, particularly during times of increased undertainty.

Whether you’re investing for you or your children’s children. We’ll take care of it all on your behalf.
Our highest level of wealth management.
Visit jarden.co.nz/compass for more information.
Jarden Securities Limited is an accredited NZX Market Participant and a broker disclosure statement is available free on request.
Through all market conditions, our local wealth management experts can help guide you towards your long term financial goals – freeing up your time.
Investment Outlook November 2020
Jarden Securities Limited | NZX Firm | www.jarden.co.nz
24
Jarden’s Quality Portfolio Constituents
Source: Jarden as of 21 October 2020 (*PIE structure)
Gross Performance Since Inception
Source: Jarden as of 21 October 2020 *Note: Benchmark is the S&P/NZX50 Portfolio Index Gross with Imputation and inception date was 30 April 2019
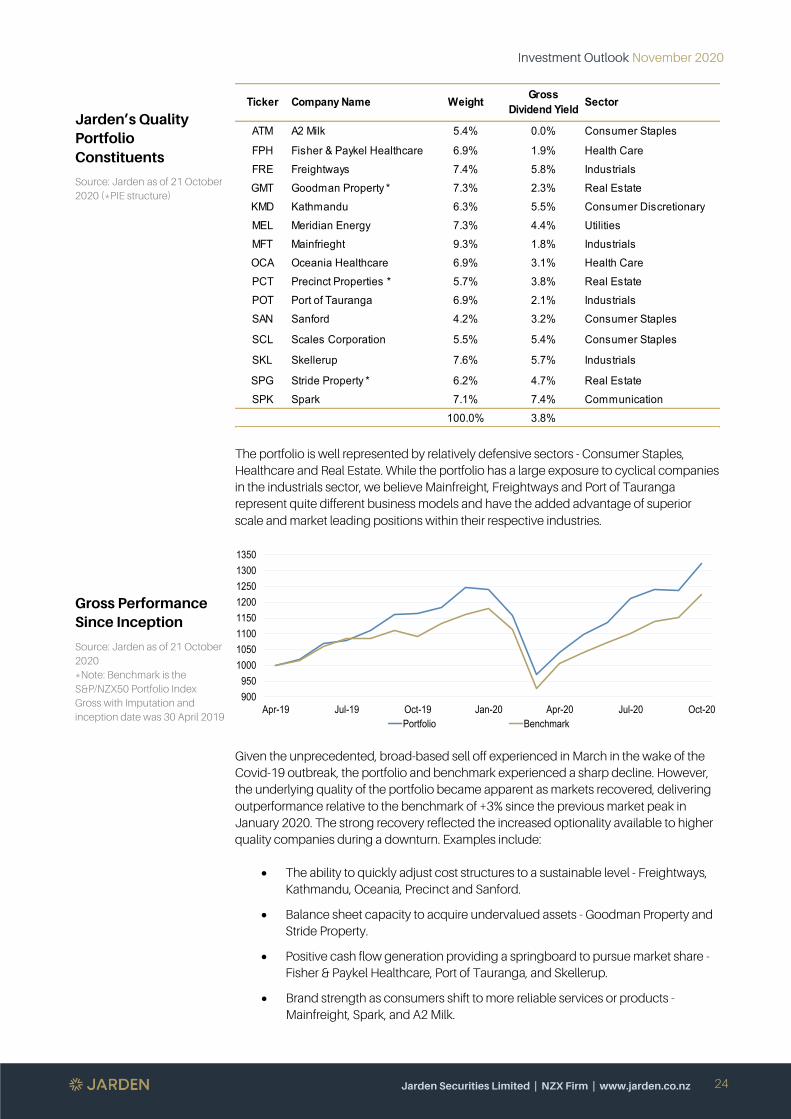
The portfolio is well represented by relatively defensive sectors - Consumer Staples, Healthcare and Real Estate. While the portfolio has a large exposure to cyclical companies in the industrials sector, we believe Mainfreight, Freightways and Port of Tauranga represent quite different business models and have the added advantage of superior scale and market leading positions within their respective industries.
Given the unprecedented, broad-based sell off experienced in March in the wake of the Covid-19 outbreak, the portfolio and benchmark experienced a sharp decline. However, the underlying quality of the portfolio became apparent as markets recovered, delivering outperformance relative to the benchmark of +3% since the previous market peak in January 2020. The strong recovery reflected the increased optionality available to higher quality companies during a downturn. Examples include:
• The ability to quickly adjust cost structures to a sustainable level - Freightways, Kathmandu, Oceania, Precinct and Sanford.
• Balance sheet capacity to acquire undervalued assets - Goodman Property and Stride Property.
• Positive cash flow generation providing a springboard to pursue market share - Fisher & Paykel Healthcare, Port of Tauranga, and Skellerup.
• Brand strength as consumers shift to more reliable services or products - Mainfreight, Spark, and A2 Milk.
Ticker Company Name Weight Gross Dividend Yield Sector
ATM A2 Milk 5.4% 0.0% Consumer Staples
FPH Fisher & Paykel Healthcare 6.9% 1.9% Health CareFRE Freightways 7.4% 5.8% IndustrialsGMT Goodman Property * 7.3% 2.3% Real EstateKMD Kathmandu 6.3% 5.5% Consumer DiscretionaryMEL Meridian Energy 7.3% 4.4% UtilitiesMFT Mainfrieght 9.3% 1.8% IndustrialsOCA Oceania Healthcare 6.9% 3.1% Health CarePCT Precinct Properties * 5.7% 3.8% Real EstatePOT Port of Tauranga 6.9% 2.1% IndustrialsSAN Sanford 4.2% 3.2% Consumer Staples
SCL Scales Corporation 5.5% 5.4% Consumer Staples
SKL Skellerup 7.6% 5.7% Industrials
SPG Stride Property * 6.2% 4.7% Real EstateSPK Spark 7.1% 7.4% Communication
100.0% 3.8%
90095010001050110011501200125013001350
Apr-19 Jul-19 Oct-19 Jan-20 Apr-20 Jul-20 Oct-20Portfolio Benchmark
Investment Outlook November 2020
Jarden Securities Limited | NZX Firm | www.jarden.co.nz
26
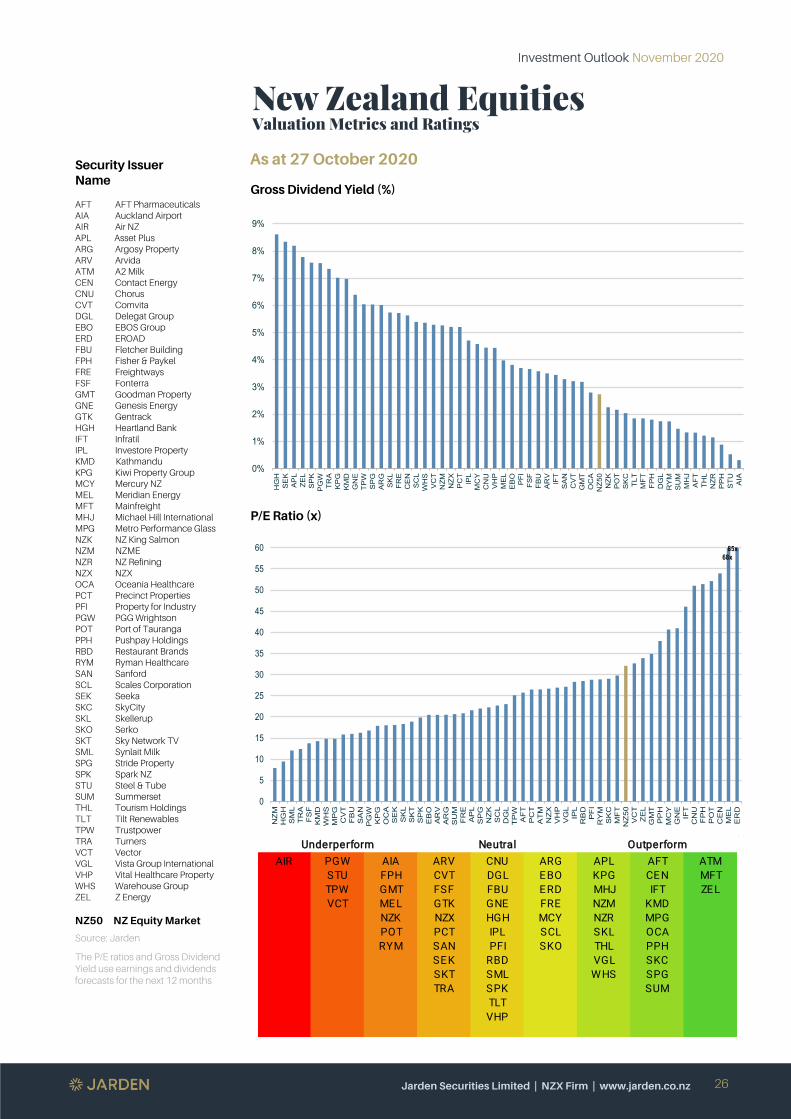
New Zealand Equities Valuation Metrics and Ratings
Security Issuer Name
AFT AFT Pharmaceuticals AIA Auckland Airport AIR Air NZ APL Asset Plus ARG Argosy Property ARV Arvida ATM A2 Milk CEN Contact Energy CNU Chorus CVT Comvita DGL Delegat Group EBO EBOS Group ERD EROAD FBU Fletcher Building FPH Fisher & Paykel FRE Freightways FSF Fonterra GMT Goodman Property GNE Genesis Energy GTK Gentrack HGH Heartland Bank IFT Infratil IPL Investore Property KMD Kathmandu KPG Kiwi Property Group MCY Mercury NZ MEL Meridian Energy MFT Mainfreight MHJ Michael Hill International MPG Metro Performance Glass NZK NZ King Salmon NZM NZME NZR NZ Refining NZX NZX OCA Oceania Healthcare PCT Precinct Properties PFI Property for Industry PGW PGG Wrightson POT Port of Tauranga PPH Pushpay Holdings RBD Restaurant Brands RYM Ryman Healthcare SAN Sanford SCL Scales Corporation SEK Seeka SKC SkyCity SKL Skellerup SKO Serko SKT Sky Network TV SML Synlait Milk SPG Stride Property SPK Spark NZ STU Steel & Tube SUM Summerset THL Tourism Holdings TLT Tilt Renewables TPW Trustpower TRA Turners VCT Vector VGL Vista Group International VHP Vital Healthcare Property WHS Warehouse Group ZEL Z Energy
NZ50 NZ Equity Market
Source: Jarden
The P/E ratios and Gross Dividend Yield use earnings and dividends forecasts for the next 12 months
As at 27 October 2020
Gross Dividend Yield (%)
P/E Ratio (x)
0%
1%
2%
3%
4%
5%
6%
7%
8%
9%
HGH
SEK
APL
ZEL
SPK
PGW
TRA
KPG
KMD
GNE
TPW
SPG
ARG
SKL
FRE
CEN
SCL
WHS
VCT
NZM NZXPCT
IPL
MCY
CNU
VHP
MEL
EBO
PFI
FSF
FBU
ARV
IFT
SAN
CVT
GMT
OCA
NZ50
NZK
POT
SKC
TLT
MFT
FPH
DGL
RYM
SUM
MHJ
AFTTHL
NZRPPH
STU AIA
0
5
10
15
20
25
30
35
40
45
50
55
60
NZM
HGH
SML
TRA
FSF
KMD
WHS
MPG
CVT
FBU
SAN
PGW
KPG
OCA
SEK
SKL
SKT
SPK
EBO
ARV
ARG
SUM
FRE
APL
SPG
NZK
SCL
DGL
TPW
AFT
PCT
ATM
NZX
VHP
VGL
IPL
RBD
PFI
RYM
SKC
MFT
NZ50
VCT
ZEL
GMT
PPH
MCY
GNE
IFT
CNU
FPH
POT
CEN
MEL
ERD
68x85x
AIR PGW AIA ARV CNU ARG APL AFT ATMSTU FPH CVT DGL EBO KPG CEN MFTTPW GMT FSF FBU ERD MHJ IFT ZELVCT MEL GTK GNE FRE NZM KMD
NZK NZX HGH MCY NZR MPGPOT PCT IPL SCL SKL OCARYM SAN PFI SKO THL PPH
SEK RBD VGL SKCSKT SML WHS SPGTRA SPK SUM
TLTVHP
Underperform Neutral Outperform
Investment Outlook November 2020
Jarden Securities Limited | NZX Firm | www.jarden.co.nz
27
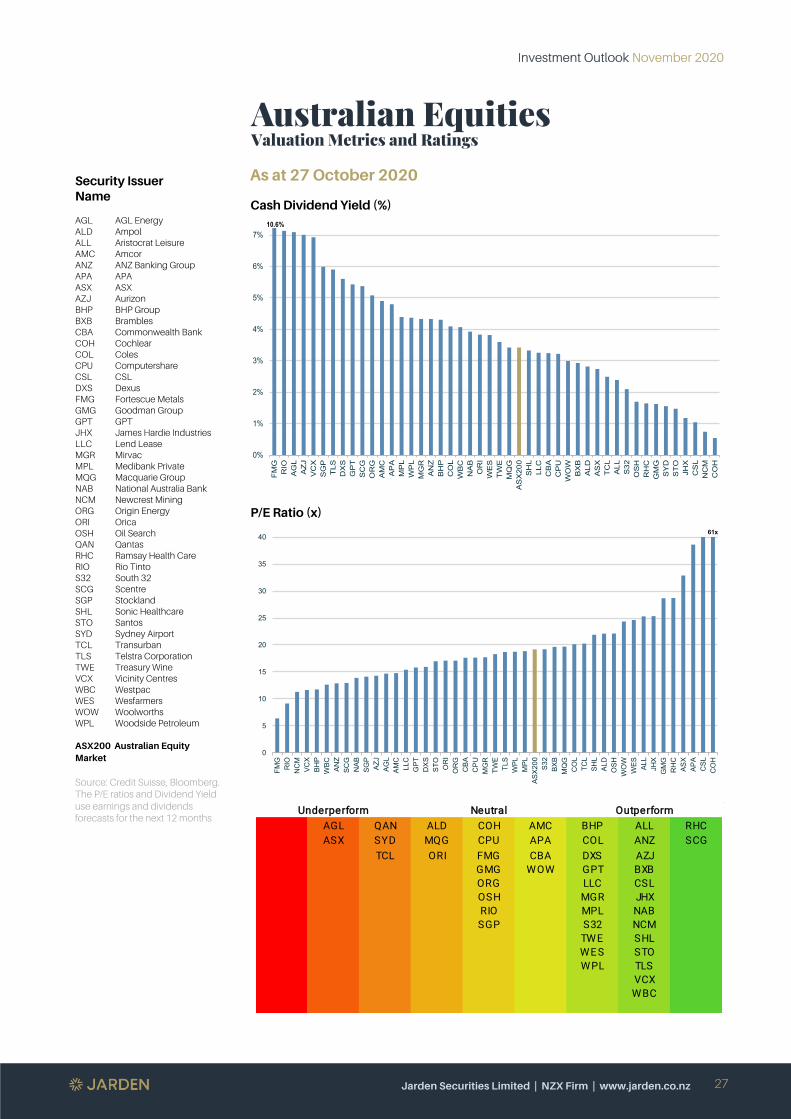
Australian Equities Valuation Metrics and Ratings
Security Issuer Name
AGL AGL Energy ALD Ampol ALL Aristocrat Leisure AMC Amcor ANZ ANZ Banking Group APA APA ASX ASX AZJ Aurizon BHP BHP Group BXB Brambles CBA Commonwealth Bank COH Cochlear COL Coles CPU Computershare CSL CSL DXS Dexus FMG Fortescue Metals GMG Goodman Group GPT GPT JHX James Hardie Industries LLC Lend Lease MGR Mirvac MPL Medibank Private MQG Macquarie Group NAB National Australia Bank NCM Newcrest Mining ORG Origin Energy ORI Orica OSH Oil Search QAN Qantas RHC Ramsay Health Care RIO Rio Tinto S32 South 32 SCG Scentre SGP Stockland SHL Sonic Healthcare STO Santos SYD Sydney Airport TCL Transurban TLS Telstra Corporation TWE Treasury Wine VCX Vicinity Centres WBC Westpac WES Wesfarmers WOW Woolworths WPL Woodside Petroleum
ASX200 Australian Equity Market
Source: Credit Suisse, Bloomberg. The P/E ratios and Dividend Yield use earnings and dividends forecasts for the next 12 months
As at 27 October 2020
Cash Dividend Yield (%)
P/E Ratio (x)
0%
1%
2%
3%
4%
5%
6%
7%
FMG
RIO
AGL
AZJ
VCX
SGP
TLS
DXS
GPT
SCG
ORG
AMC
APA
MPL
WPL
MGR
ANZ
BHP
COL
WBC
NAB
ORI
WES
TWE
MQG
ASX200
SHL
LLC
CBA
CPU
WOW
BXB
ALDASX
TCL
ALLS32
OSH
RHC
GMG
SYD
STO
JHX
CSL
NCM
COH
10.6%
0
5
10
15
20
25
30
35
40
FMG
RIO
NCM
VCX
BHP
WBC ANZ
SCG
NAB
SGP
AZJ
AGL
AMC
LLC
GPT
DXSSTO
ORI
ORG
CBA
CPU
MGR
TWE
TLS
WPL
MPL
ASX200 S32
BXB
MQG
COL
TCL
SHL
ALD
OSH
WOW
WES ALL
JHX
GMG
RHC
ASX
APA
CSL
COH
61x
AGL QAN ALD COH AMC BHP ALL RHCASX SYD MQG CPU APA COL ANZ SCG
TCL ORI FMG CBA DXS AZJGMG WOW GPT BXBORG LLC CSLOSH MGR JHXRIO MPL NABSGP S32 NCM
TWE SHLWES STOWPL TLS
VCXWBC
Underperform Neutral Outperform
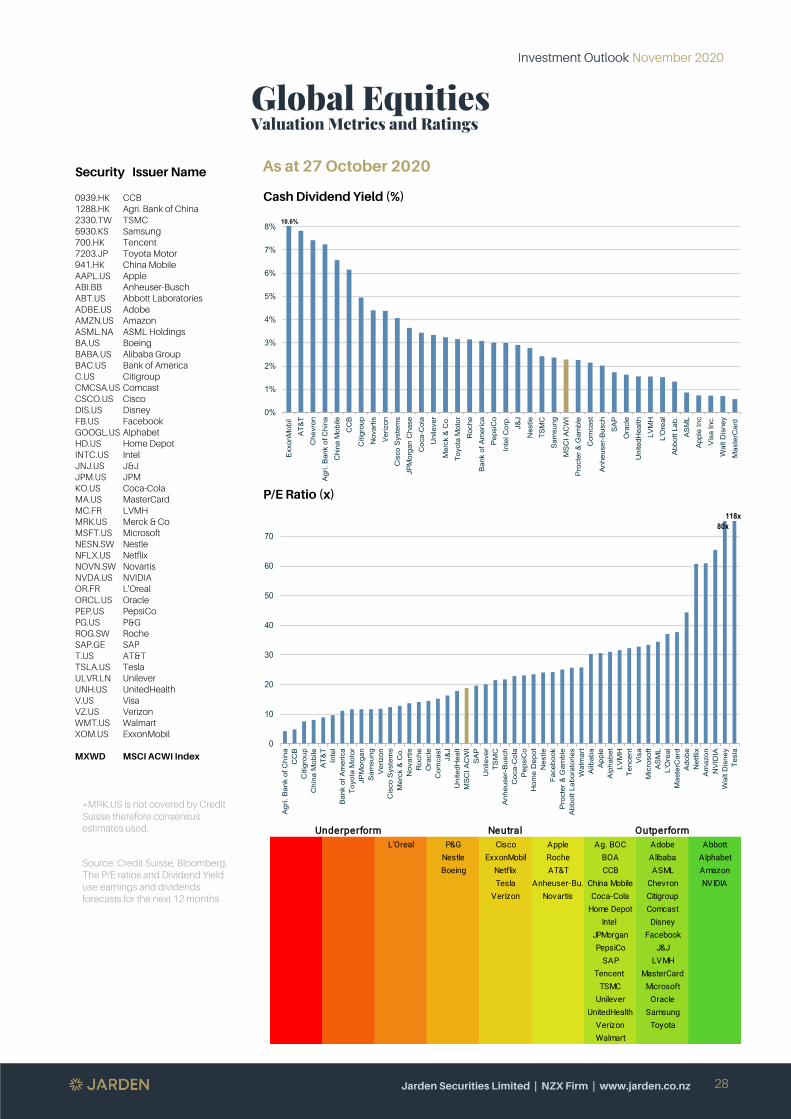
Investment Outlook November 2020
Jarden Securities Limited | NZX Firm | www.jarden.co.nz
28
Global Equities Valuation Metrics and Ratings
Security Issuer Name
0939.HK CCB 1288.HK Agri. Bank of China 2330.TW TSMC 5930.KS Samsung 700.HK Tencent 7203.JP Toyota Motor 941.HK China Mobile AAPL.US Apple ABI.BB Anheuser-Busch ABT.US Abbott Laboratories ADBE.US Adobe AMZN.US Amazon ASML.NA ASML Holdings BA.US Boeing BABA.US Alibaba Group BAC.US Bank of America C.US Citigroup CMCSA.US Comcast CSCO.US Cisco DIS.US Disney FB.US Facebook GOOGL.US Alphabet HD.US Home Depot INTC.US Intel JNJ.US J&J JPM.US JPM KO.US Coca-Cola MA.US MasterCard MC.FR LVMH MRK.US Merck & Co MSFT.US Microsoft NESN.SW Nestle NFLX.US Netflix NOVN.SW Novartis NVDA.US NVIDIA OR.FR L'Oreal ORCL.US Oracle PEP.US PepsiCo PG.US P&G ROG.SW Roche SAP.GE SAP T.US AT&T TSLA.US Tesla ULVR.LN Unilever UNH.US UnitedHealth V.US Visa VZ.US Verizon WMT.US Walmart XOM.US ExxonMobil
MXWD MSCI ACWI Index
*MRK.US is not covered by Credit Suisse therefore consensus estimates used.
Source: Credit Suisse, Bloomberg. The P/E ratios and Dividend Yield use earnings and dividends forecasts for the next 12 months
As at 27 October 2020
Cash Dividend Yield (%)
P/E Ratio (x)
0%
1%
2%
3%
4%
5%
6%
7%
8%
Exx
onM
obil
AT&
TC
hevr
onA
gri.
Ban
k of
Chi
naC
hina
Mob
ileC
CB
Citi
grou
pN
ovar
tisV
eriz
onC
isco
Sys
tem
sJP
Mor
gan
Cha
seC
oca-
Col
aU
nile
ver
Mer
ck &
Co.
Toyo
ta M
otor
Roc
heB
ank
of A
mer
ica
Pep
siC
oIn
tel C
orp.
J&J
Nes
tleTS
MC
Sam
sung
MS
CI A
CW
IP
roct
er &
Gam
ble
Com
cast
Anh
euse
r-Bus
chS
AP
Ora
cle
Uni
tedH
ealth
LVM
HL'
Ore
alA
bbot
t Lab
.A
SM
LA
pple
Inc
Vis
a In
c.W
alt D
isne
yM
aste
rCar
d
10.6%
0
10
20
30
40
50
60
70
Agr
i. B
ank
of C
hina
CC
BC
itigr
oup
Chi
na M
obile
AT&
TIn
tel
Ban
k of
Am
eric
aTo
yota
Mot
orJP
Mor
gan
Sam
sung
Ver
izon
Cis
co S
yste
ms
Mer
ck &
Co.
Nov
artis
Roc
heO
racl
eC
omca
stJ&
JU
nite
dHea
ltM
SC
I AC
WI
SA
PU
nile
ver
TSM
CA
nheu
ser-
Bus
chC
oca-
Col
aP
epsi
Co
Hom
e D
epot
Nes
tleFa
cebo
okP
roct
er &
Gam
ble
Abb
ott L
abor
ator
ies
Wal
mar
tA
libab
aA
pple
Alp
habe
tLV
MH
Tenc
ent
Vis
aM
icro
soft
AS
ML
L'O
real
Mas
terC
ard
Ado
beN
etfli
xA
maz
onN
VID
IAW
alt D
isne
yTe
sla
118x80x
L'Oreal P&G Cisco Apple Ag. BOC Adobe AbbottNestle ExxonMobil Roche BOA Alibaba AlphabetBoeing Netflix AT&T CCB ASML Amazon
Tesla Anheuser-Bu. China Mobile Chevron NVIDIAVerizon Novartis Coca-Cola Citigroup
Home Depot ComcastIntel Disney
JPMorgan FacebookPepsiCo J&J
SAP LVMHTencent MasterCard
TSMC MicrosoftUnilever Oracle
UnitedHealth SamsungVerizon ToyotaWalmart
Underperform Neutral Outperform
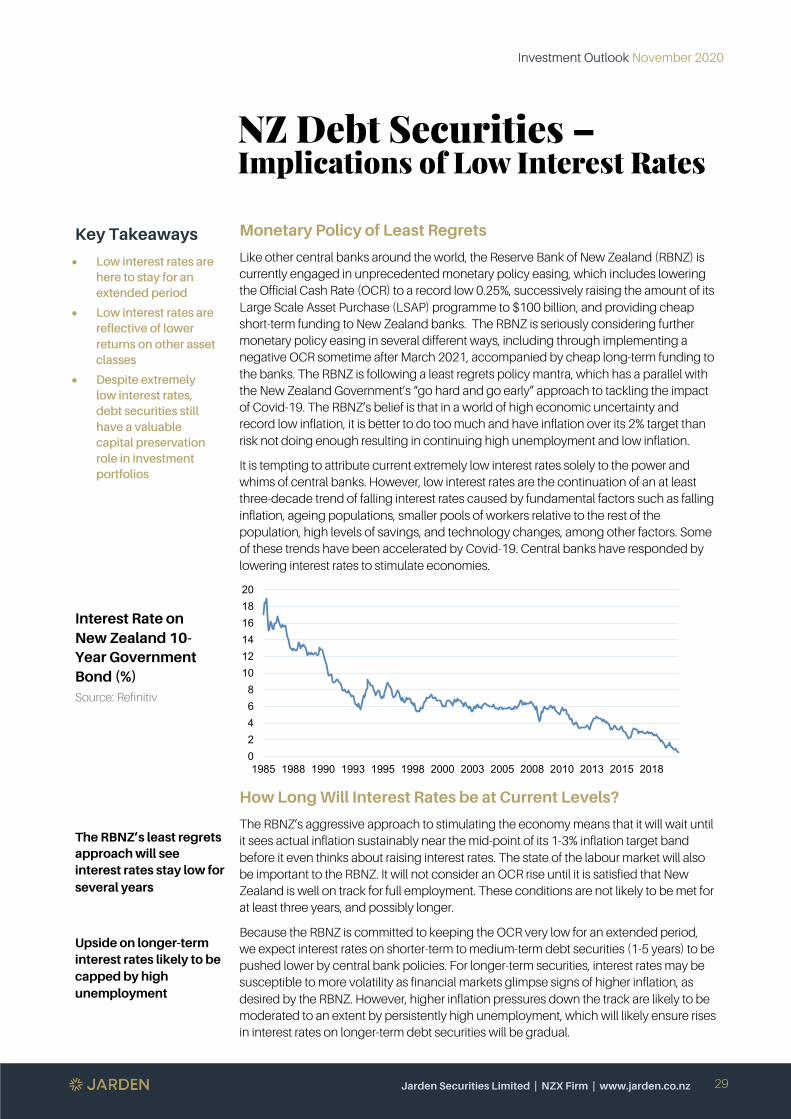
Investment Outlook November 2020
Jarden Securities Limited | NZX Firm | www.jarden.co.nz
29
NZ Debt Securities – Implications of Low Interest Rates
Key Takeaways
• Low interest rates are here to stay for an extended period
• Low interest rates are reflective of lower returns on other asset classes
• Despite extremely low interest rates, debt securities still have a valuable capital preservation role in investment portfolios
Interest Rate on New Zealand 10-Year Government Bond (%) Source: Refinitiv
The RBNZ’s least regrets approach will see interest rates stay low for several years
Upside on longer-term interest rates likely to be capped by high unemployment
Monetary Policy of Least Regrets
Like other central banks around the world, the Reserve Bank of New Zealand (RBNZ) is currently engaged in unprecedented monetary policy easing, which includes lowering the Official Cash Rate (OCR) to a record low 0.25%, successively raising the amount of its Large Scale Asset Purchase (LSAP) programme to $100 billion, and providing cheap short-term funding to New Zealand banks. The RBNZ is seriously considering further monetary policy easing in several different ways, including through implementing a negative OCR sometime after March 2021, accompanied by cheap long-term funding to the banks. The RBNZ is following a least regrets policy mantra, which has a parallel with the New Zealand Government’s “go hard and go early” approach to tackling the impact of Covid-19. The RBNZ’s belief is that in a world of high economic uncertainty and record low inflation, it is better to do too much and have inflation over its 2% target than risk not doing enough resulting in continuing high unemployment and low inflation.
It is tempting to attribute current extremely low interest rates solely to the power and whims of central banks. However, low interest rates are the continuation of an at least three-decade trend of falling interest rates caused by fundamental factors such as falling inflation, ageing populations, smaller pools of workers relative to the rest of the population, high levels of savings, and technology changes, among other factors. Some of these trends have been accelerated by Covid-19. Central banks have responded by lowering interest rates to stimulate economies.
How Long Will Interest Rates be at Current Levels?
The RBNZ’s aggressive approach to stimulating the economy means that it will wait until it sees actual inflation sustainably near the mid-point of its 1-3% inflation target band before it even thinks about raising interest rates. The state of the labour market will also be important to the RBNZ. It will not consider an OCR rise until it is satisfied that New Zealand is well on track for full employment. These conditions are not likely to be met for at least three years, and possibly longer.
Because the RBNZ is committed to keeping the OCR very low for an extended period, we expect interest rates on shorter-term to medium-term debt securities (1-5 years) to be pushed lower by central bank policies. For longer-term securities, interest rates may be susceptible to more volatility as financial markets glimpse signs of higher inflation, as desired by the RBNZ. However, higher inflation pressures down the track are likely to be moderated to an extent by persistently high unemployment, which will likely ensure rises in interest rates on longer-term debt securities will be gradual.
02468101214161820
1985 1988 1990 1993 1995 1998 2000 2003 2005 2008 2010 2013 2015 2018
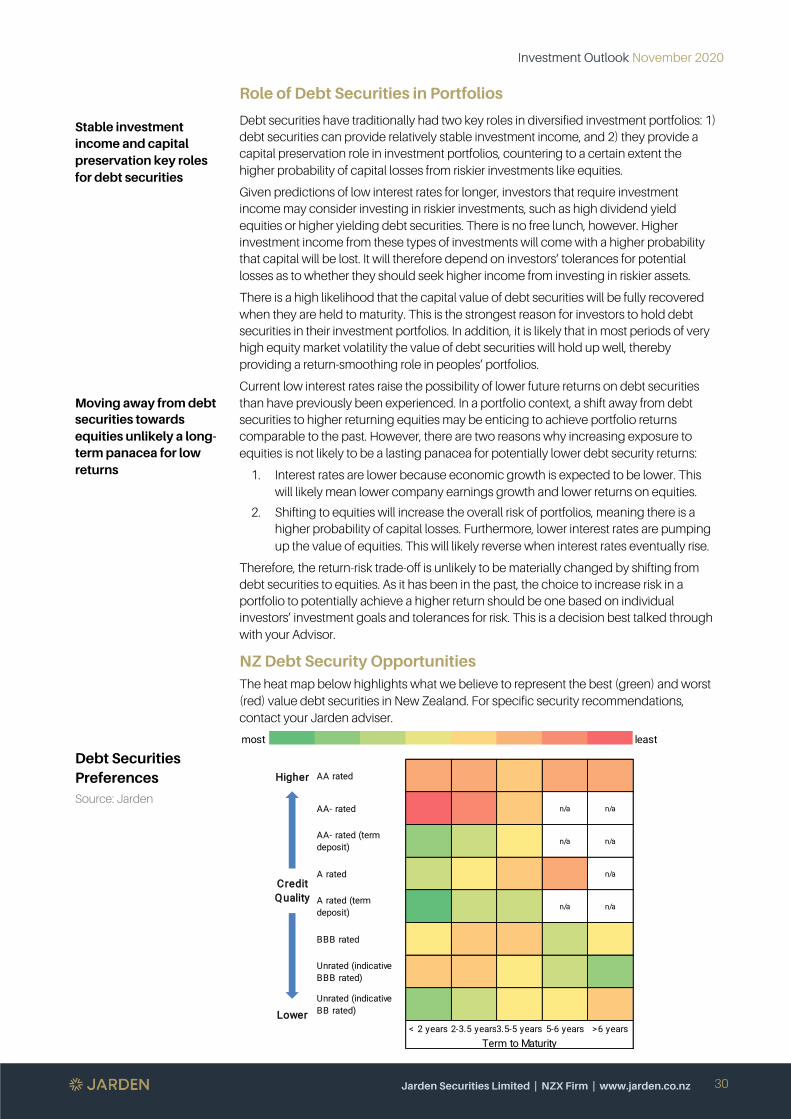
Investment Outlook November 2020
Jarden Securities Limited | NZX Firm | www.jarden.co.nz
30
Stable investment income and capital preservation key roles for debt securities
Moving away from debt securities towards equities unlikely a long-term panacea for low returns
Debt Securities Preferences Source: Jarden
Role of Debt Securities in Portfolios
Debt securities have traditionally had two key roles in diversified investment portfolios: 1) debt securities can provide relatively stable investment income, and 2) they provide a capital preservation role in investment portfolios, countering to a certain extent the higher probability of capital losses from riskier investments like equities.
Given predictions of low interest rates for longer, investors that require investment income may consider investing in riskier investments, such as high dividend yield equities or higher yielding debt securities. There is no free lunch, however. Higher investment income from these types of investments will come with a higher probability that capital will be lost. It will therefore depend on investors’ tolerances for potential losses as to whether they should seek higher income from investing in riskier assets.
There is a high likelihood that the capital value of debt securities will be fully recovered when they are held to maturity. This is the strongest reason for investors to hold debt securities in their investment portfolios. In addition, it is likely that in most periods of very high equity market volatility the value of debt securities will hold up well, thereby providing a return-smoothing role in peoples’ portfolios.
Current low interest rates raise the possibility of lower future returns on debt securities than have previously been experienced. In a portfolio context, a shift away from debt securities to higher returning equities may be enticing to achieve portfolio returns comparable to the past. However, there are two reasons why increasing exposure to equities is not likely to be a lasting panacea for potentially lower debt security returns:
1. Interest rates are lower because economic growth is expected to be lower. This will likely mean lower company earnings growth and lower returns on equities.
2. Shifting to equities will increase the overall risk of portfolios, meaning there is a higher probability of capital losses. Furthermore, lower interest rates are pumping up the value of equities. This will likely reverse when interest rates eventually rise.
Therefore, the return-risk trade-off is unlikely to be materially changed by shifting from debt securities to equities. As it has been in the past, the choice to increase risk in a portfolio to potentially achieve a higher return should be one based on individual investors’ investment goals and tolerances for risk. This is a decision best talked through with your Advisor.
NZ Debt Security Opportunities The heat map below highlights what we believe to represent the best (green) and worst (red) value debt securities in New Zealand. For specific security recommendations, contact your Jarden adviser.
most 1 0 9 7 6 4 3 1 0 least
Higher 5 .0 0 0 5 .0 0 0 5 .5 0 0 5 .0 0 0 5 .0 0 0
4 .0 0 0 4 .5 0 0 5 .5 0 0 n/a n/a
7 .0 0 0 6 .5 0 0 6 .0 0 0 n/a n/a
6 .5 0 0 6 .0 0 0 5 .5 0 0 5 .0 0 0 n/a
7 .5 0 0 6 .5 0 0 6 .5 0 0 n/a n/a
6 .0 0 0 5 .5 0 0 5 .5 0 0 6 .5 0 0 6 .0 0 0
5 .5 0 0 5 .5 0 0 6 .0 0 0 6 .5 0 0 7 .0 0 0
Lower7 .0 0 0 6 .5 0 0 6 .0 0 0 6 .0 0 0 5 .5 0 0
< 2 years 2-3.5 years3.5-5 years 5-6 years >6 yearsTerm to Maturity
Credit Quality
AA rated
AA- rated
AA- rated (term deposit)
A rated
A rated (term deposit)
BBB rated
Unrated (indicative BBB rated)
Unrated (indicative BB rated)
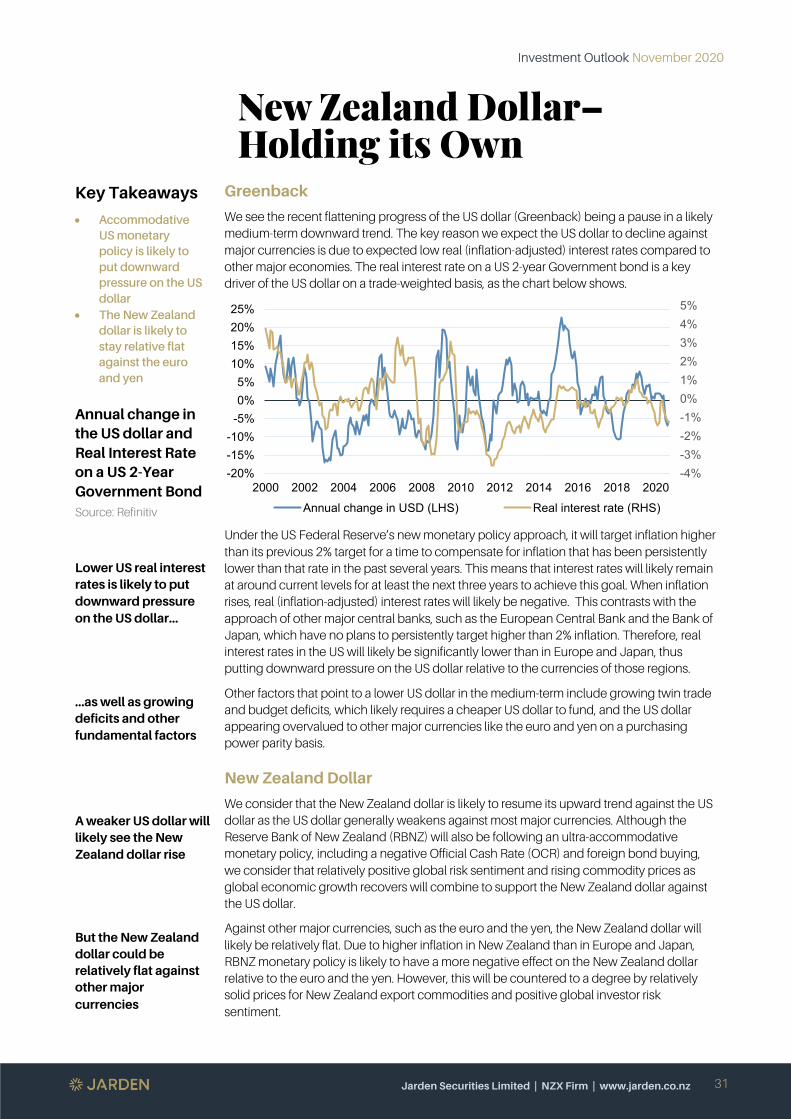
Investment Outlook November 2020
Jarden Securities Limited | NZX Firm | www.jarden.co.nz
31
New Zealand Dollar– Holding its Own
Key Takeaways
• Accommodative US monetary policy is likely to put downward pressure on the US dollar
• The New Zealand dollar is likely to stay relative flat against the euro and yen
Annual change in the US dollar and Real Interest Rate on a US 2-Year Government Bond Source: Refinitiv
Lower US real interest rates is likely to put downward pressure on the US dollar…
…as well as growing deficits and other fundamental factors
A weaker US dollar will likely see the New Zealand dollar rise
But the New Zealand dollar could be relatively flat against other major currencies
Greenback
We see the recent flattening progress of the US dollar (Greenback) being a pause in a likely medium-term downward trend. The key reason we expect the US dollar to decline against major currencies is due to expected low real (inflation-adjusted) interest rates compared to other major economies. The real interest rate on a US 2-year Government bond is a key driver of the US dollar on a trade-weighted basis, as the chart below shows.
Under the US Federal Reserve’s new monetary policy approach, it will target inflation higher than its previous 2% target for a time to compensate for inflation that has been persistently lower than that rate in the past several years. This means that interest rates will likely remain at around current levels for at least the next three years to achieve this goal. When inflation rises, real (inflation-adjusted) interest rates will likely be negative. This contrasts with the approach of other major central banks, such as the European Central Bank and the Bank of Japan, which have no plans to persistently target higher than 2% inflation. Therefore, real interest rates in the US will likely be significantly lower than in Europe and Japan, thus putting downward pressure on the US dollar relative to the currencies of those regions.
Other factors that point to a lower US dollar in the medium-term include growing twin trade and budget deficits, which likely requires a cheaper US dollar to fund, and the US dollar appearing overvalued to other major currencies like the euro and yen on a purchasing power parity basis.
New Zealand Dollar
We consider that the New Zealand dollar is likely to resume its upward trend against the US dollar as the US dollar generally weakens against most major currencies. Although the Reserve Bank of New Zealand (RBNZ) will also be following an ultra-accommodative monetary policy, including a negative Official Cash Rate (OCR) and foreign bond buying, we consider that relatively positive global risk sentiment and rising commodity prices as global economic growth recovers will combine to support the New Zealand dollar against the US dollar.
Against other major currencies, such as the euro and the yen, the New Zealand dollar will likely be relatively flat. Due to higher inflation in New Zealand than in Europe and Japan, RBNZ monetary policy is likely to have a more negative effect on the New Zealand dollar relative to the euro and the yen. However, this will be countered to a degree by relatively solid prices for New Zealand export commodities and positive global investor risk sentiment.
-4%-3%-2%-1%0%1%2%3%4%5%
-20%-15%-10%
-5%0%5%
10%15%20%25%
2000 2002 2004 2006 2008 2010 2012 2014 2016 2018 2020Annual change in USD (LHS) Real interest rate (RHS)
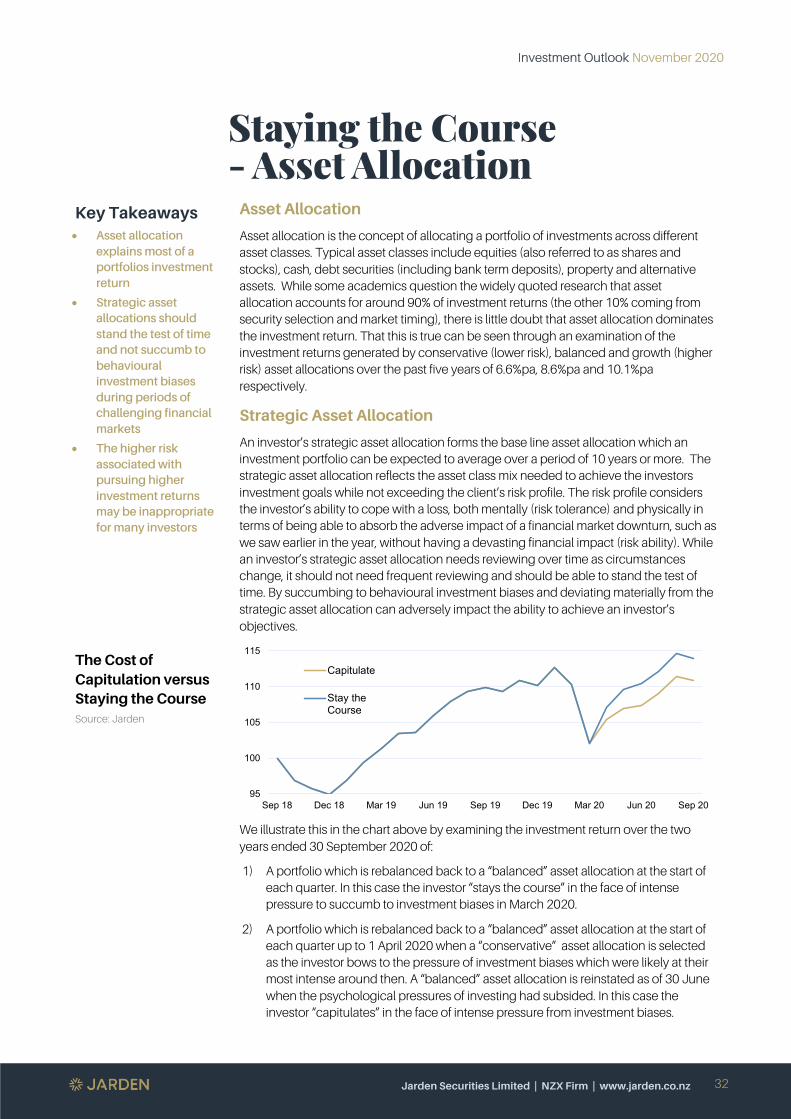
Investment Outlook November 2020
Jarden Securities Limited | NZX Firm | www.jarden.co.nz
32
Staying the Course - Asset Allocation
Key Takeaways • Asset allocation
explains most of a portfolios investment return
• Strategic asset allocations should stand the test of time and not succumb to behavioural investment biases during periods of challenging financial markets
• The higher risk associated with pursuing higher investment returns may be inappropriate for many investors
The Cost of Capitulation versus Staying the Course Source: Jarden
Asset Allocation
Asset allocation is the concept of allocating a portfolio of investments across different asset classes. Typical asset classes include equities (also referred to as shares and stocks), cash, debt securities (including bank term deposits), property and alternative assets. While some academics question the widely quoted research that asset allocation accounts for around 90% of investment returns (the other 10% coming from security selection and market timing), there is little doubt that asset allocation dominates the investment return. That this is true can be seen through an examination of the investment returns generated by conservative (lower risk), balanced and growth (higher risk) asset allocations over the past five years of 6.6%pa, 8.6%pa and 10.1%pa respectively.
Strategic Asset Allocation
An investor’s strategic asset allocation forms the base line asset allocation which an investment portfolio can be expected to average over a period of 10 years or more. The strategic asset allocation reflects the asset class mix needed to achieve the investors investment goals while not exceeding the client’s risk profile. The risk profile considers the investor’s ability to cope with a loss, both mentally (risk tolerance) and physically in terms of being able to absorb the adverse impact of a financial market downturn, such as we saw earlier in the year, without having a devasting financial impact (risk ability). While an investor’s strategic asset allocation needs reviewing over time as circumstances change, it should not need frequent reviewing and should be able to stand the test of time. By succumbing to behavioural investment biases and deviating materially from the strategic asset allocation can adversely impact the ability to achieve an investor’s objectives.
We illustrate this in the chart above by examining the investment return over the two years ended 30 September 2020 of:
1) A portfolio which is rebalanced back to a “balanced” asset allocation at the start of each quarter. In this case the investor “stays the course” in the face of intense pressure to succumb to investment biases in March 2020.
2) A portfolio which is rebalanced back to a “balanced” asset allocation at the start of each quarter up to 1 April 2020 when a “conservative” asset allocation is selected as the investor bows to the pressure of investment biases which were likely at their most intense around then. A “balanced” asset allocation is reinstated as of 30 June when the psychological pressures of investing had subsided. In this case the investor “capitulates” in the face of intense pressure from investment biases.
95
100
105
110
115
Sep 18 Dec 18 Mar 19 Jun 19 Sep 19 Dec 19 Mar 20 Jun 20 Sep 20
Capitulate
Stay theCourse
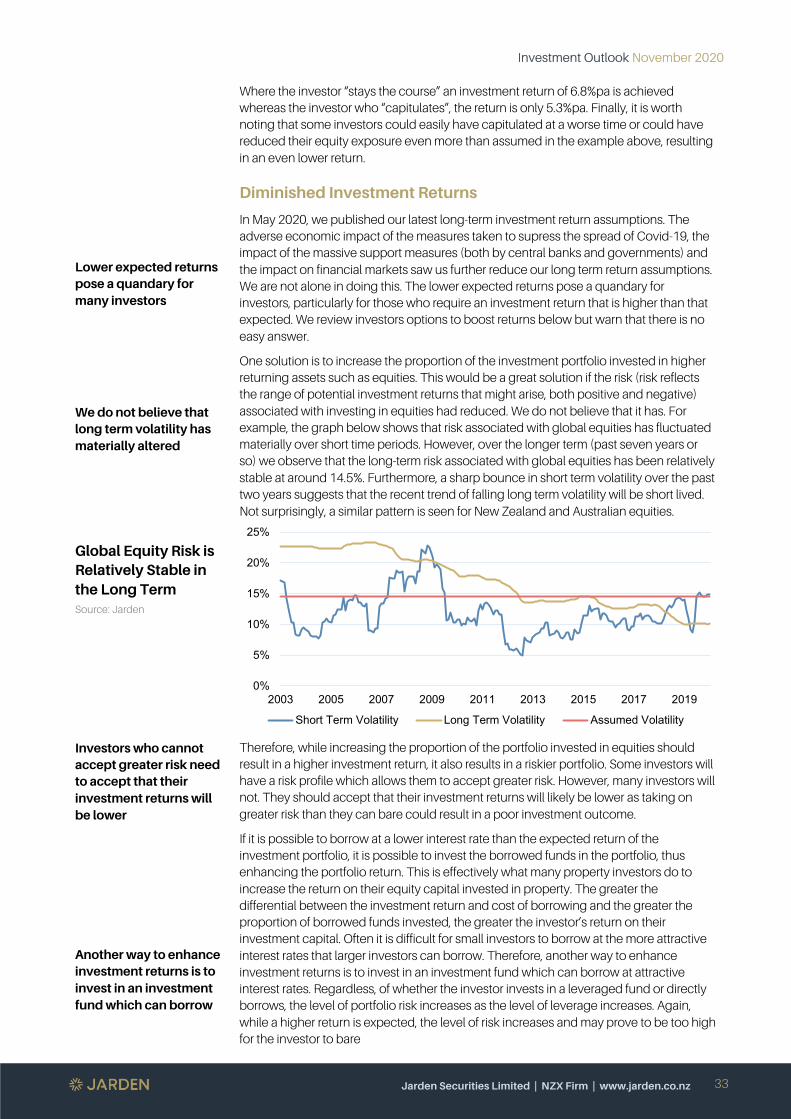
Investment Outlook November 2020
Jarden Securities Limited | NZX Firm | www.jarden.co.nz
33
Lower expected returns pose a quandary for many investors
We do not believe that long term volatility has materially altered
Global Equity Risk is Relatively Stable in the Long Term Source: Jarden
Investors who cannot accept greater risk need to accept that their investment returns will be lower
Another way to enhance investment returns is to invest in an investment fund which can borrow
Where the investor “stays the course” an investment return of 6.8%pa is achieved whereas the investor who “capitulates”, the return is only 5.3%pa. Finally, it is worth noting that some investors could easily have capitulated at a worse time or could have reduced their equity exposure even more than assumed in the example above, resulting in an even lower return.
Diminished Investment Returns
In May 2020, we published our latest long-term investment return assumptions. The adverse economic impact of the measures taken to supress the spread of Covid-19, the impact of the massive support measures (both by central banks and governments) and the impact on financial markets saw us further reduce our long term return assumptions. We are not alone in doing this. The lower expected returns pose a quandary for investors, particularly for those who require an investment return that is higher than that expected. We review investors options to boost returns below but warn that there is no easy answer.
One solution is to increase the proportion of the investment portfolio invested in higher returning assets such as equities. This would be a great solution if the risk (risk reflects the range of potential investment returns that might arise, both positive and negative) associated with investing in equities had reduced. We do not believe that it has. For example, the graph below shows that risk associated with global equities has fluctuated materially over short time periods. However, over the longer term (past seven years or so) we observe that the long-term risk associated with global equities has been relatively stable at around 14.5%. Furthermore, a sharp bounce in short term volatility over the past two years suggests that the recent trend of falling long term volatility will be short lived. Not surprisingly, a similar pattern is seen for New Zealand and Australian equities.
Therefore, while increasing the proportion of the portfolio invested in equities should result in a higher investment return, it also results in a riskier portfolio. Some investors will have a risk profile which allows them to accept greater risk. However, many investors will not. They should accept that their investment returns will likely be lower as taking on greater risk than they can bare could result in a poor investment outcome.
If it is possible to borrow at a lower interest rate than the expected return of the investment portfolio, it is possible to invest the borrowed funds in the portfolio, thus enhancing the portfolio return. This is effectively what many property investors do to increase the return on their equity capital invested in property. The greater the differential between the investment return and cost of borrowing and the greater the proportion of borrowed funds invested, the greater the investor’s return on their investment capital. Often it is difficult for small investors to borrow at the more attractive interest rates that larger investors can borrow. Therefore, another way to enhance investment returns is to invest in an investment fund which can borrow at attractive interest rates. Regardless, of whether the investor invests in a leveraged fund or directly borrows, the level of portfolio risk increases as the level of leverage increases. Again, while a higher return is expected, the level of risk increases and may prove to be too high for the investor to bare
0%
5%
10%
15%
20%
25%
2003 2005 2007 2009 2011 2013 2015 2017 2019
Short Term Volatility Long Term Volatility Assumed Volatility

Investment Outlook November 2020
Jarden Securities Limited | NZX Firm | www.jarden.co.nz
34
Jarden in the Community
On October 15 Jarden celebrated ‘Save the Kiwi Day’, an initiative to support community partner Kiwis for kiwi in its mission to take our national icon from endangered to everywhere.
Contributions from the firm, clients and staff raised over $330,000 for Kiwis for kiwi which will have a real impact on the survival rates of our national icon by growing our kiwi population and protecting the birds we already have.
New Zealand is in danger of losing its national icon within a couple of generations. Only a few hundred years ago, millions of kiwis roamed New Zealand and now an estimated 70,000 remain. Despite efforts, that number drops by 2% every year and 95% of kiwis born in unprotected areas die before they reach breeding age.
From the funds raised across the Jarden business on ‘Save the Kiwi Day’, Kiwis for kiwi are able to find more wild kiwi and attach transmitters to their legs to track and monitor them. This enables them to uplift their eggs and take them to an incubation facility, safely hatch them, and then release the chicks into a predator-free environment.
Jarden CEO James Lee says kiwi are entwined with our identity as New Zealanders, but they need our support to ensure their survival.
“Jarden partners with organisations that believe in New Zealand’s potential and support our people, our communities and our environment to become the best they can be. We are proud to support the important work of Kiwis for Kiwi and to be doing our bit in giving these chicks the best head start in life.
“We hope that Jarden’s contributions and ongoing support will have a real impact on survival rates of our national icon.”
Find out more at https://www.kiwisforkiwi.org/
Investment Outlook November 2020
Jarden Securities Limited | NZX Firm | www.jarden.co.nz
35
Important Operational Changes
Key Takeaways
• Jarden will no longer process cheques issued in New Zealand
• Australian cheques are unaffected at this time but will be phased out soon
• The Quarterly Statement from FNZ Custodians is being replaced by the six-monthly Summary of Investor Income report
• Jarden will stop posting them to you and send them via email instead
• The new financial services regime is to remove the distinction between ‘class’ and ‘personalised’ advice
Cheque Processing
In line with many other New Zealand companies, from 31 December 2020 Jarden will no longer process cheques issued in New Zealand. This means we will no longer accept deposits made by cheque and we will no longer be able to bank dividend cheques on your behalf. If you currently receive dividends by cheque or deposit money into your cash account by cheque, now is the time to make alternative arrangements. With rapid advances in technology, digital payments are now faster, more secure and less costly than traditional transaction methods. Major banks and government bodies are already phasing out cheques in favour of electronic payment methods. The limitations of cheques were especially evident during Level 4 Covid-19 restrictions. Some clients experienced significant delays in accessing dividend funds as bank branches were closed and cheques could not be presented. We recommend the following actions:
1. If you use online banking, log into your bank account and save “Jarden Securities Limited - Client Trust” account as a payee. Be sure to include your client number as the reference, so we can link the funds to your Jarden account. You will find your client number on any contract note. We will continue to accept funds by electronic bill payment, international money transfer or by Direct Debit.
2. If you currently have any dividend cheques, make it a priority to present them to your local bank branch while it is still possible to bank them into your account.
3. If you still receive New Zealand dividend payments by cheque contact the relevant share registry (Computershare or Link Market Services) to arrange for your dividends to be paid directly to your bank account. If you hold shares in multiple companies, you may need to update your details at more than one share registry.
Alternatively, many companies offer a dividend reinvestment plan (DRP). If you opt in, you effectively receive additional shares (of equal or additional value depending on whether the new shares are issued at a discount or not) in lieu of cash dividends. Full details of a DRP should be available on the individual company’s website. You can obtain a copy of the DRP or subscribe to the DRP by contacting the company’s share registry.
Please note this change applies to New Zealand cheques only. Australian cheques are unaffected at this time but will be phased out soon.

Investment Outlook November 2020
Jarden Securities Limited | NZX Firm | www.jarden.co.nz
36
Replaced by a six-monthly Summary of Investor Income report
We need to keep your account details current
Quarterly Custody and Nominee Holding Statements
If you have securities held in custody you will have received a quarterly statement from FNZ Custodians showing the securities held in custody. This report is being replaced by the six-monthly Summary of Investor Income report. Included in the report is portfolio and asset valuations, transactions of cash and assets and a summary of fees deducted. However, if at any time you would like a copy of the Custody and Nominee report please do not hesitate to request a copy from your Jarden Adviser.
Emailing Contract Notes
For those clients who receive portfolio performance reporting from FNZ Custodians contract notes have been either posted to you or collected and held on your behalf before being sent periodically. Over the next few weeks, we will stop posting them to you and send them via email instead. We will be in contact with some clients regarding this process, although for most we will simply switch to emailing contract notes to you.
Ongoing Client Due Diligence
To provide you with the high level of service you expect we need to keep abreast of your changing needs which means we need to keep your account details current. This not only means having up to date contact details, but also ensuring that any new people on the account are correctly onboarded and able to give us instructions in relation to the account. To help plan we also need to understand what you want to use our products and services for, how often you intend investing new funds and when you aim to make withdrawals. Your Jarden Adviser regularly reviews your account and may contact you from time to time to refresh some of the information Jarden holds. Currently Trusts are particularly in the spotlight as new Trust law comes into effect on 30 January 2021.
New Financial Advice Regulation on its Way
As we outlined in the August edition of the Investment Outlook, the new Financial Services Legislation Amendment Act comes into force on 15 March 2021. One of the major changes in the new regime is to remove the distinction between ‘class’ and ‘personalised’ advice. In light of this, we have repositioned our ‘class advice’ service to meet the requirements of the new Act. We will be contacting clients in this service to discuss transitioning to our new service, or another service if this is more suitable. Your Adviser will be in touch and will be able to guide you through the process. The regime also introduces new disclosure standards. We will be providing updated disclosure statements to all clients before March 2021.

Investment Outlook November 2020
Jarden Securities Limited | NZX Firm | www.jarden.co.nz
37
Calendar Major Events: November 2020 – January 2021
Economic Events Central Bank Decisions │ Political EventsChina PMI 2 Nov ●
US Manufacturing PMI 3 Nov ● 3 Nov ● Australia RBA Interest Rate Decision● US Presidential Election
NZ Unemployment Rate 4 Nov ● 4 Nov ● US Withdrawal from Paris ClimateUS Non-Manufacturing PMI 5 Nov ● NZ Business Confidence ● Agreement
06 Nov ● UK BoE Interest Rate Decision● US FOMC Meeting
US Unemployment Rate 7 Nov ● China Trade BalanceAustralia Business Confidence 10 Nov ●
11 Nov ● RBNZ Official Cash RateNZ Net Migration 12 Nov ● UK Trade Balance
UK GDP ● EU Industrial ProductionNZ PMI 13 Nov ● EU GDP
Japan GDP 16 Nov ● China Industrial ProductionUS Retail Sales 18 Nov ● Japan Trade Balance
UK CPI ●Japan PMI 20 Nov ●
21 Nov ● G20 MeetingAustralia PMI 23 Nov ● EU PMI
US GDP 26 Nov ●NZ Consumer Confidence 27 Nov ● EU Consumer ConfidenceNZ Business Confidence 30 Nov ●
China PMI 1 Dec ● 1 Dec ● Australia RBA Interest Rate DecisionUS Manufacturing PMI 2 Dec ● EU Unemployment Rate
US Non-Manufacturing PMI 4 Dec ●US Unemployment Rate 5 Dec ●
China Trade Balance 7 Dec ●Japan GDP 8 Dec ● NZ Business Confidence
Australia Business Confidence ● EU GDPAustralia Consumer Confidence 9 Dec ●
UK Trade Balance 10 Dec ●NZ PMI 11 Dec ●
NZ Net Migration 14 Dec ● EU Industrial ProductionChina Industrial Production 15 Dec ●
Japan Trade Balance 16 Dec ● UK CPIUS Retail Sales 17 Dec ● NZ GDP 17 Dec ● US FOMC Meeting
NZ Consumer Confidence 18 Dec ● 18 Dec ● UK BoE Interest Rate Decision● Japan BoJ Interest Rate Decision
NZ Business Confidence 21 Dec ●UK GDP 22 Dec ●US GDP 23 Dec ●
31 Dec ● End of Brexit Transition Period● German EU Presidency Ends
EU Consumer Confidence 7 Jan ●EU Unemployment Rate 8 Jan ●US Unemployment Rate 9 Jan ●EU Industrial Production 13 Jan ●
US Retail Sales 16 Jan ●UK CPI 20 Jan ●
NZ Net Migration 21 Jan ● Japan Trade Balance 21 Jan ● Japan BoJ Interest Rate DecisionNZ PMI 22 Jan ● NZ CPI
Australia CPI 27 Jan ●28 Jan ● US FOMC Meeting
US GDP 29 Jan ●

Investment Outlook November 2020
Jarden Securities Limited | NZX Firm | www.jarden.co.nz 39
Your Local Jarden Team
Auckland Auckland Freephone 0800 805 584Level 32, PwC Tower, 15 Customs Street West, Jeremy Ashcroft 09 307 5724 Phil Picot 09 307 5717PO Box 5333, Auckland Amanda Chen 09 302 5582 Martin Poulsen 09 307 5725
Tony Connolly 09 307 5721 David Pretorius 09 302 5576Victoria Park, Auckland Mark Gatward 09 307 5718 Simon Ravenscroft 09 302 5594Unit 55a, 95 Union Street, Freemans Bay, Murray Graham 09 307 5714 Roy Savage 09 302 5529PO Box 5333, Auckland Rob Hawkins 09 302 5574 William Savage 09 307 5713
Jo Hikaka 09 307 5722 David Sommerville 09 302 5567Cambridge Andrew Horton 09 307 5732 Brett Steven 09 307 570530 Gillies Street Lory Luo 09 307 5739 Stephen Wright 09 307 5733Cambridge 3434 Kristan Mines 09 307 5744 James Young 09 307 5731
Simon Myhre 09 307 5715Havelock NorthLevel 1, The Village Exchange, 1 Havelock Road, Victoria Park, Auckland Phone 09 307 5702PO Box 28153, Havelock North Patrick McCarthy 09 307 5749 Sean Poulton 09 302 5561
Brian Moss 09 307 5712 Chris White 09 302 5596WellingtonLevel 14, ANZ Centre, 171 Featherston Street, Havelock North Freephone 0800 562 543PO Box 3394, Wellington Andrew Atkinson 06 871 5882 Deborah Murdoch 06 871 5881
Brent Greig 06 871 5889 Tobias Taylor 06 877 9074Nelson Sam Howard 06 871 5887 Adrian Woodhams 06 871 5888Level 1, 6 Akersten Street, John Lockie 06 871 5883PO Box 114, Nelson
Wellington Freephone 0800 800 968Christchurch Andrew Austin 04 496 5320 James Malden 04 474 4013Level 1, 148 Victoria Street, Kyle Edmonds 04 474 4019 Angus Marks 04 496 5321PO Box 25258, Christchurch Scott Fowler 04 474 4039 Richard McCadden 04 474 4402
Michael Grace 04 474 4454 Graham Nelson 04 496 5318Timaru Jonathan Glass 04 496 5317 Graham Parlane 04 496 5348Level 1, 49 George Street Ralph Goodwin 04 496 5363 Bryan Shepherd 04 474 4014Timaru 7910 Mark Hayward 04 474 4062 Sam Stanley 04 474 4436
Simon Hogg 04 474 4015 Anton van der Wilt 04 496 5333Queenstown Philip Hunter 04 496 5312 Chris West 04 496 5314Level 3, 36 Shotover Street Peter Irwin 04 496 5316 Glenn Wilson 04 496 5332Queenstown 9300 Greg Main 04 474 4061
Dunedin Nelson Freephone 0800 502 828Level 1, 218 George Street Francis Gargiulo 03 548 8319 Aaron Shields 03 548 8319Dunedin 9016 Greg Lillico 03 548 8319
Christchurch Freephone 0800 123 053Johnny Cochrane 03 366 5370 Bevan O'Sullivan 03 336 5382Ian Dalley 03 336 5374 Stuart Thomas 03 336 5371Hannah Donaldson 03 336 5372
Queenstown CambridgeAnna Boland 03 441 8404 Johnathan Bayley 07 834 2712Matthew Rose 03 336 5378 Steivan Juvalta 07 834 2713
Dunedin Fixed IncomeTony Conroy 0272412738 Jo Hikaka 09 307 5722James Hunter 03 588 0356 Ben Petro 04 474 4057Selwyn Smith 03 588 0354
ResearchTim Agar 04 474 4438 Peter Irwin 04 496 5316John Carran 04 496 5369 John Norling 04 496 5343
Website www.jarden.co.nz Email [email protected]

Investment Outlook November 2020
Jarden Securities Limited | NZX Firm | www.jarden.co.nz
39
Limitations and Disclaimer
Copyright: Jarden Securities Limited and its related companies,
2020 All rights reserved
This publication has been prepared by Jarden Securities Limited for distribution to clients of Jarden Securities Limited on the basis that no part of it will be reproduced, altered in any way, transmitted to, copied to or distributed to any other person without the prior express permission of Jarden Securities Limited. The information, investment views and recommendations in this publication are provided for general information purposes only. To the extent that any such information, views and recommendations constitute advice, they do not take into account any person’s particular financial situation or goals and, accordingly, do not constitute personalised financial advice under the Financial Advisers Act 2008, not do they constitute advice of a legal, tax, accounting or other nature to any person. We recommend that recipients seek advice specific to their circumstances from their adviser before making any investment decision or taking any action.
This publication does not, and does not attempt to, contain all material or relevant information about the subject companies or other matters herein. The information is published in good faith and has been obtained from sources believed to be reliable, accurate and complete at the time of preparation, but its accuracy and completeness is not guaranteed (and no warranties or representations, express or implied, are given as to its accuracy or completeness). To the fullest extent permitted by law, no liability or responsibility is accepted for any loss or damage arising out of the use of or reliance on the information provided including without limitation, any loss of profit or any other damage, direct or consequential. Information, opinions and estimates contained herein reflect a judgement at the date of publication by Jarden Securities Limited and are subject to change without notice. Jarden Securities Limited is under no obligation to update or keep current any of the information on this publication. Research may include material sourced from Credit Suisse Group. To the fullest extent permitted by law, Credit Suisse Group shall have no liability to Jarden Securities Limited or clients or prospective clients of Jarden Securities Limited or any other person in relation to such research material. All investment involves risk. The bond market is volatile.
Bonds carry interest rate risk (as interest rates rise, bond prices usually fall, and vice versa), inflation risk and issuer and credit default risks. Lower quality and unrated debt securities involve a greater risk of default and/or price changes due to potential changes in the credit quality of the issuer. The price, value and income derived from investments may fluctuate in that values can go down as well as up and investors may get back less than originally invested. Past performance is not indicative of future results, and no representation or warranty, express or implied, is made regarding future performance or investment returns. Reference to taxation or the impact of taxation does not constitute tax advice.
The levels and bases of taxation may change. The value of any tax reliefs will depend on investors’ circumstances. Investors should consult their tax adviser in order to understand the impact of investment decisions on their tax position. Where an investment is denominated in a foreign currency, changes in rates of exchange may have adverse effect on the value, price or income of the investment. The market in certain investments may be unavailable and/or illiquid meaning that investors may be unable to purchase, sell or realise their investments at their preferred volume and/or price, or at all. Jarden Securities Limited, its employees and persons associated with Jarden Securities Limited may (i) have held or hold securities mentioned in this publication (or related securities) as principal for their own account, (ii) have provided investment advice or other investment services in relation to such securities within the last twelve months, and (iii) have other financial interests, including as a shareholder of the Jarden group of companies (“Jarden Group”), in the matters mentioned herein. Investors should assume that Jarden Securities Limited, its related companies and affiliated persons and Credit Suisse Group, with whom Jarden Group has a strategic alliance, do and seeks to do investment banking business with companies covered in its research reports. Specific additional disclosures will be made in relation to companies where Jarden Group has a transaction role and publishes research. This publication is intended for distribution only to market professional, institutional investor and retail investor clients in New Zealand and other jurisdictions to whom, under relevant law, this publication lawfully may be distributed. It may not be distributed in any other jurisdiction or to any other persons.
Jarden Securities Limited is a NZX Firm.
A Disclosure Statement is available on request, free of charge.

Investment Outlook November 2020
Jarden Securities Limited | NZX Firm | www.jarden.co.nz
40
Investment Outlook November 2020


