Atlanta University CenterDigitalCommons@Robert W. Woodruff Library, AtlantaUniversity Center
ETD Collection for AUC Robert W. Woodruff Library
5-1-1999
Reaction mechanism of N0x destruction by non-thermal plasma dischargeZhicheng WangClark Atlanta University
Follow this and additional works at: http://digitalcommons.auctr.edu/dissertations
Part of the Chemistry Commons
This Thesis is brought to you for free and open access by DigitalCommons@Robert W. Woodruff Library, Atlanta University Center. It has beenaccepted for inclusion in ETD Collection for AUC Robert W. Woodruff Library by an authorized administrator of DigitalCommons@Robert W.Woodruff Library, Atlanta University Center. For more information, please contact [email protected].
Recommended CitationWang, Zhicheng, "Reaction mechanism of N0x destruction by non-thermal plasma discharge" (1999). ETD Collection for AUC RobertW. Woodruff Library. Paper 980.
ABSTRACT
CHEMISTRY
WANG, ZHICHENG B.A. SICHUAN UNIVERSITY,1986
M.S. RIPP, 1991
REACTION MECHANISM OF NOx DESTRUCTION
BY NON-THERMAL PLASMA DISCHARGE
Advisors: Professors Kofi B. Bota and Yaw D. Yeboah
Dissertation dated May, 1999
Nitrogen oxides (NOx) contribute to the formation of acid rain and ground-level
ozone. Cost-effective technologies that destroy NOx from gas streams are needed. Of
particular interest are Non-thermal plasma technologies that offer an innovative approach
to the solution ofNOx emission control.
This study investigates the use of a particular electrical discharge technique, the
barrier discharge. Experiments were conducted in double dielectric barrier discharge
(DDBD) reactors to elucidate the effects of physical and chemical variables on the NOx
removal efficiencies. Analysis instruments included a FT-IR with a length adjustable gas
cell, a GC-MS, several gas analyzers and an emission spectrometer.
The variables investigated include input power, chemical composition, residence
time, and gap spacing. Through this investigation, an overall optimization of DDBD
performance was obtained. Of these, we primarily investigated the effect of discharge gap
spacing on the electrical and chemical processes that occur in non-thermal plasma
discharge (NTPD). A numerical model was developed to simulate the physical and
chemical processes during the oxidation and reduction of NOx. Experiments and
1
calculations were performed to investigate the effects of the above-mentioned variables
on breakdown electric field, free electron energy distribution, electron impact kinetic
rates, and chemical reactions. Results from the calculations and experiments
demonstrated the complex relations between NOx removal efficiency and the tested
variables. A mechanism ofNOx destruction in a NTPD was proposed.
This study revealed that the characteristics of microdischarges are the key to
understanding the NTPD process. Optical measurements, by means of a high speed
intensified imager, provided important information on the microdischarge. This
information helped to develop the numerical model, which established the relation
between surface charge and charge density within a microdischarge. Results of this study
should provide a basis for developing a potential solution for the reduction of NOx
emission from off-gas sources, such as diesel-powered aerospace ground equipment used
on the Air Force.
REACTION MECHANISM OF NOx DESTRUCTION
BY NON-THERMAL PLASMA DISCHARGE
A DISSERTATION
SUBMITTED TO THE FACULTY OF CLARK ATLANTA UNIVERSITY
IN PARTIAL FULFILLMENT OF THE REQUIREMENTS FOR
THE DEGREE OF DOCTOR OF PHILOSOPHY
IN CHEMISTRY
BY
ZHICHENG WANG
DEPARTMENT OF CHEMISTRY
ATLANTA, GEORGIA
MAY 1999

© 1999
ZHICHENG WANG
All Right Reserved
ACKNOWLEDGEMENT
I am extremely grateful to Professor Kofi B. Bota, Professor Yaw D. Yeboah and
Professor T.J Bai for their guidance, experience and encouragement in directing the
research presented in this thesis. Also thanks to Mr. Steven Federle, Dr. John Rogers and
Dr. Glenn Rolader for providing technical insights. Additionally, thanks to Professor
Reynolds Verrett for his input as my thesis committee member.
I would like to thank the following people for their assistance and advise: Dr. Jad
Batteh and Dr. Xiansheng Nie.
I also would like to thank Professor Cass Parker for his help in the Graduate
program and Dr. Yi Pang for his advises and support.
This project was supported by the US Air Force under grant number
F08630-96-K-0015.
Finally, I wish to express my thanks and appreciation to my wife, Liqin, for all
her love and support.
TABLE OF CONTENTS
ACKNOWLEDGEMENT ii
LIST OF FIGURES ""viLIST OF TABLES viii
I. INTRODUCTION
LIBackground 1
1.2 Conventional Techniques for NOx Control 2
1.3 Non-thermal Plasma Discharge Technologies 3
1.4 Literature Reviews 5
II. NON-THERMAL PLASMA DISCHARGE
2.1 Theory and Apparatus 19
2.1.1 The Electrical Breakdown 19
2.1.2 The Boltzmann Equation 22
2.1.3 Poisson's Equation 24
2.1.4 Particle and Charge Density 24
2.1.5 Reaction Rate Coefficients 25
2.1.6 Manley's Equation 27
2.2 Method Development 28
2.3 Chemical Reactions 30
III. EXPERIMENTS AND PROCEDURE
3.1 Experimental Setup 32
iii
3.2 Physical Characteristics 35
3.2.1 Power Measurement 35
3.2.2 Breakdown Voltage, Current and Charge 36
3.3 Optical Measurement 40
3.4 Spectrum Analysis 42
IV. RESULTS AND DISCUSSION
4.1.1 The effect of Gas Composition 46
4.1.1.1 Water 47
4.1.1.2 Oxygen 49
4.1.1.3 Hydrogen 52
4.1.1.4 NOx 55
4.1.2 Gap Spacing 57
4.1.2.1 Breakdown Voltage 58
4.1.2.2 NOx Removal 61
4.1.2.3 Microdischarge Characteristics 64
4.1.3 Photo Chemistry 72
4.1.4 Power Input 75
4.2 System Optimization 80
4.3 Reaction Mechanisms and Modeling 83
V. CONCLUSIONS AND RECOMMENDATIONS
5.1 Conclusions 92
5.2 Recommendations 97
APPENDIX A 98
IV
APPENDIXB 100
APPENDIX C 113
REFERENCES 134
LIST OF FIGURES
No. Page
3.1 The Experimental Set-up 34
3.2 Voltage Waveforms for DDBD Cell 37
3.3 Current Waveform 37
3.4 Charge Waveform 38
3.5 Comparison of Voltage, Current and Charge During Spikes 38
3.6 Q-V Plot for Calculation ofBreakdown Voltage and Power 39
3.7 Sketch of Simplified Microdischarge and Arrangement ofDDBD 41
3.8 Picture ofA Microdischarge 42
3.9 Spectrum ofFT-IR 43
3.10 Emission Spectrum 44
4.1 The Effect ofWater Concentration on NOx Removal Efficiency 47
4.2 Picture ofA Single Microdischarge 49
4.3 Dependence ofNOx Removal Efficiency on [02] 50
4.4 Picture of Microdischarge 52
4.5 NOx Removal Efficiency versus Power 53
4.6 Gas Composition versus Power 54
4.7 NO Concentration Effect on NO Removal 56
4.8 Relationship Between Breakdown Voltage and Gap width 61
4.9 NO Removal versus Energy Deposition 62
vi
4.10 NO Removal versus Gap Width 63
4.11 Images ofMicrodischarges at Different Gap Widths 65
4.12 Plot ofDischarge Radius versus Gap Width 68
4.13 Plot ofFootprint Radius versus Gap Width 69
4.14 Plot of the Footprint Radius, RO, versus the Microdischarge Radius, r 70
4.15 Spectra ofProcessing Gases in NTPD 73
4.16 Lissajous Figures with Input Powers 75
4.17 Dependence of the Total Charges Transferred on Power Input 76
4.18 NOx/NO Removal Efficiency versus Power Input 77
4.19 FT-IR Spectra with Power Increasing 78
4.20 Effects ofPower on the Photo Emission in the Discharge 79
4.21 Dependence ofNOx Removal Efficiency on Residence Time 79
4.22 NOx Removal versus Power Input at Optimized Conditions 82
4.23 Results ofBOLSIG Running 88
4.24 Simulation Results from Model 91
vu
LIST OF TABLES
No. Page
4.1 NO Removal Efficiency at Various Gap Widths and Energy Depositions 65
4.2 Summary ofMicrodischarge Properties Derived
from Optical Measurements 68
4.3 Estimates of the Volume Charge Density and Electron Density
Using Equation (4.23) and Calculation of Reduced Electric Field 73
4.5 Parameters Used in the One Run ofBOLSIG Modeling 88
Vlll
CHAPTER I
INTRODUCTION
1.1 Background
Nitrogen oxides have contributed to several air pollution problems including acid
rain, ozone depletion and photochemical smog. It is estimated that annual NOx emission
in United States is about 21 million tons due to fossil fuel combustion for electricity
generation [Spengler et al, 1990]. Recently the Environmental Protection Agency
unveiled proposed rules that would require 22 eastern states and the District of Columbia
to make deep cuts in emissions of nitrogen oxides [Ross, 1998 ]. Therefore, cost-effective
technologies that destroy/remove NOx from gas streams are highly needed.
Sources ofNOx include both naturally occurring and man-made processes. In
nature NOx is produced in forest fires, in lightning strikes and from volcanic activities.
Man made or anthropogenic sources ofNOx include nitric acid manufacturing and the
nitric acid used in steel pickling, plating and catalyst recovery operations and chemical
manufacture. However, the largest sources of anthropogenic NOx are the combustion of
fossil fuels. These emissions can result in high local concentrations of 10 to 100 times
that found in rural regions.
2
NOx exists in several forms including nitrous oxide (N2O), nitric oxide (NO),
dinitrogen trioxide (N2O3), nitrogen dioxide (NO2), dinitrogen tetroxide (N2O4) and
dinitrogen pentoxide (N2O5). They all are toxic gases. In the atmosphere, NO and NO2
are primary stable forms so that NOx generally refers to the presence of these
compounds.
1.2 Conventional Techniques for NOx Control
Efforts to reduce NOx emission are focused on fuel combustion since it is the
main source of NOx. A number of approaches, grouped into pre-combustion, in-
combustion and post-combustion modification, can be used to control NOx emissions.
Since production rate of NOx in combustion is proportional to the temperature and
contents of N2 and O2, these approaches attempt to control flame temperature and
fuel/gas chemistry in the combustion process. Forty to seventy percentage reduction of
NOx emissions can be expected by the optimum combination [Breault et al, 1992].
Although significant, this achievement trades off the combustion efficiency, and the cost
is high.
In pre-combustion, NOx control was achieved by inducing bound nitrogen in
fuels to reduce the NOx concentration in combustion production. It is very costly and no
longer considered a practical method.
In-combustion control of NOx is now considered to be the major opportunity to
control emissions. Two efficient techniques have been introduced: (1) low-NOx burner
(LNB) and (2) multiple stage combustion including air staging, fuel staging and exhaust
gas recirculation.
3
The LNB designs differ from manufacturer to manufacturer. They all generally
modify the means of introducing the air and fuel to slow the rate of mixing, reduce
oxygen availability in critical NOx formation zones, and reduce the amount of fuel
burned at peak temperature. This full LNB can be expected to reduce NOx emission from
uncontrolled baseline levels by up to 50%. The reliability and cost is critical.
The two-stage combustion is a technology used to minimize the formation ofNOx
by burning the fuel in the initially rich or sub-stoichiometric zone. The first zone is
operated fuel-rich to control NOx formation due to lower temperature and the reduction
characteristics. The second zone is operated fuel-lean to complete burn out.
The two technologies of post-combustion NOx control in commercial use are
selective non-catalytic reduction (SNCR) and selective catalytic reduction (SCR). SNCR
processes take place by injecting reducing reagent, ammonia, urea, or other nitrogen
containing compound which selectively react with the NOx molecule to reduce the
oxidative state of the nitrogen. Reduction levels are typically 60% with levels above 80%
hard to achieve without increasing CO and unreacted reagent above acceptable limits.
SCR uses catalyst to make the reactions proceed within a lower temperature regime. The
most popular catalysts include Vanadium, Platinum, or Titanium compounds
impregnated on a substrate. These methods are effective. However, they cost too much
for routine operation. In addition, the secondary pollution is hard to avoid in practical
application.
1.3 Non-thermal Plasma Discharge Technologies
Non-thermal plasma discharge (NTPD) technologies offer an innovative
approach to the solution ofNOx emission control. These technologies can be applied to
4
disposal of a wide variety of gaseous pollutants, and have the capability for the
simultaneous removal of coexisting pollutants. Another critical advantage over the above
conventional methods, is the high selectivity of the non-thermal plasma method that is
very important for treating industrial off-gases containing dilute pollutants. This field has
grown dramatically in recent years and many new types of devices have been developed.
It is in the interest of many nations to assure that all practical and economically feasible
steps are taken to apply and further develop these techniques to help solve environmental
pollution problems
The Non-Thermal Plasma Discharge provides a means for employing electrical
energy to drive selected chemical reactions in contaminated gaseous media. The principle
of the NTPD technique is based on the gas plasma created by the collision between
electrons and gas molecules. Typically, three essential parts are included in a NTPD
system: 1) source of high-energy electrons; 2) collision between electrons and gas
molecules; and 3) chemical reactions. All these occur in a NTPD reactor.
The high-energy electrons can either be created by applying high voltage on
electrodes placed within the reactor or be supplied by inducing an external electron beam
into the reactor where the gases containing pollutant flow. Due to high kinetic energy
electrons, collisions between electrons and gas molecules occur massively. New reactive
species, such as radicals, ions and excimers, are produced. These active species will react
with gas molecules that exist in the reactor. Therefore, the desired chemical reactions can
be controlled by feeding reactants into the system.
Non-thermal plasma can be created in essentially two different ways: by electron-
beam irradiation, and by electrical discharge. Electrical discharge techniques can be
5
implemented in many ways, depending on the electrode configuration and electrical
power supply.
1.4 Literature Review
The first indications of excimer formation in gas discharges were introduced by
Goldstein and Cuitis in 1913 [Eliasson et al, 1991]. In two independent papers they
reported new features in the emission spectrum of Helium discharges which they
tentatively interpreted as a result of molecule formation. In 1955, Tanaka realized that the
rare gas excimer continua could be excited in silent discharges, but abandoned this idea
in favor of a pulsed discharge that later became known as the Tanaka lamp.
Silent discharges have been utilized in an ozone generator developed by Siemens
in 1850's. A silent discharge generally refers to a plasma device employing a gas
capacitor that has at least one electrode covered by a dielectric layer. At present,
commercial ozonizers have an energy yield of 90 and 180g/kWh for dry air and pure
oxygen, respectively. Since the theoretical energy yield is 1200g/kWh, up to 92.5% of the
energy is lost as heat to gas and/or surroundings.
Contrary to thermal plasma, the pollution control efficiency of non-thermal
plasma is based on a "focussed" effect of high energy particles on particular compounds
[Karen et al, 1997]. A small portion of energy is lost in the heating up of the gas. The
energy is predominantly used for the generation of highly energetic electrons.
Furthermore, in most cases secondary waste can be minimized when using plasma
treatment.
6
Traditionally, non-thermal plasma is obtained by a gas discharge under the
application of a strong electric field. Electrons and ions are accelerated to high energies
(usually, several eV) that are much higher than the Boltzmann thermal energy of the
ambient gas. Because electrons have a much longer mean free path and lighter mass, they
have much higher kinetic energy than ions.
There are two main methods of introducing high-energy particles into the air
stream: 1) acceleration of the charged particles by a strong electric field and 2) injection
of them externally. The first method normally comprises steady state or pulsed
discharges, which supply charged particles through electron impact ionization. Most
techniques recently developed for pollutant destruction and VOC reduction use various
versions of corona or barrier discharge in direct current, alternating current or pulsed
regimes. The second particle introduction method is commonly known as electron beam
technology. In systems using electron beams, high-energy electrons are injected from an
external source. Their electron energy is usually monochromatic and is defined by the
accelerating potential in the electron gun and thus well in excess of the ambient thermal
energy. Thus, such a system also can be classified as a non-thermal plasma. The main
difference between discharge generated and e-beam plasma is that the first moderately
high energy electrons move chaotically, while in the latter the primary electrons of much
higher energy enter the system as a collimated beam.
Several types of gas discharge can generate the non-thermal plasma environment.
The reactors could be point-to-point, point-to-plane, plane-to-plane, packed bed or
coaxial (or wire-pipe) and are driven by direct current (DC), alternating current (AC), or
pulsed current. Some different types ofnon-thermal plasma devices are discussed below:
7
1) Glow Discharge: Typically, it is a low-pressure (less than 10 mbar) and operated at
low electric fields (~ lOV/cm), hence comparatively low operating voltages. It is
limited in application for the treatment of contaminated flue gases. Increasing the
pressure to atmospheric is possible, but it is necessary to increase the electric field
simultaneously and requires a high frequency power source, noble gas for dilution
and the insertion of a dielectric plate between the electrodes
2) Corona Discharge: the corona discharge is a relatively low power electrical discharge
that takes place at or near atmospheric pressure. Strong fields generate the corona and
at least one of the electrodes is a thin wire, a needle or has a sharp edge. The strong
curvature is responsible for the high electric field, necessary for ionization of neutral
gas molecules. The other electrode can be a plate or a cylinder. Corona discharge
exists in several forms depending on the polarity of the field and the electrode
configuration. When the inception voltage is reached, the gas in the neighborhood of
the high curvature is ionized by the high local electric field triggering the avalanche
multiplication of free electrons. Depending on the polarity applied to a high curvature
electrode, the various forms of corona discharge are classified as positive or negative
corona.
3) Dielectric Barrier Discharge: Dielectric barrier discharge is a general term for
discharge methods that use a dielectric material as a plasma stabilizer. The main types
are silent discharge and surface discharge.
The main feature of the so-called silent discharge is the fact that a dielectric
layer covers at least one of the electrodes. Typically, materials with a high dielectric
strength and a high dielectric constant are used. In conventional gas discharge
processes at atmospheric pressure, the formation of the sparks results in local heating
and non-uniform gas treatment. When using silent discharge, the dielectric acts as a
capacitor in series with plasma; when the potential across the gap reaches the
breakdown voltage, the dielectric acts as a stabilizing material, leading to the
formation of a large number of microdischarges or short pulses, which are statistically
spread over the discharge gap. The discharge generated ions traverse the space in a
pulse and are stored on the surface of the dielectric material. Since the accumulated
space charge generates a reverse electric field, the discharge will be terminated. By
applying a sinusoidal voltage the process will be repeated over and over again.
Surface discharges are similar in nature and thus appropriate for the same
applications as a silent discharge. In this technique, surface ruggedness amplifies the
electric field at the surface. Two ways of implementing the surface discharge for gas
cleaning purposes are commonly used: 1) a packed bed reactor and 2) a strip-like or
film-like electrode embedded in ceramic. The materials used for pellets in the bed
reactors are BaCO3, SrCC>3, or PbCO3. If the voltage over the electrodes is increased,
a weak glow appears at the surfaces of the pellets and radicals are generated. In the
second type of surface discharge, a high voltage is applied to generate a surface
discharge that appears at the sides of the strips and covers the ceramic surface
uniformly.
4 Electron Beam: In an electron beam induced plasma, the initial electrons are mono-
energetic. Usually, they are formed outside the reactor and injected into the gas
stream. There the electrons react with the gas by direct and dissociative attachment
9
and excitation. These inelastic reactions, as well as the electrons thermalized by the
elastic collisions, generate the plasma.
Presently, there is not enough evidence to prove that one of the various types of
plasma gas discharge reactor is superior over the others. Each of them has its own
different optimum operating conditions. Their performance is strongly affected by factors
like:
1). Energy efficiency ofreactor
2). Gas pressure
3). Gas flow rates
4). Initial concentration ofpollutants
5). Toxic by-product production rates
6). Residence time, power input and frequency.
7). Gas chemical composition
In summary, the pulsed and DC corona, and dielectric barrier discharge
techniques are suitable for low and medium flow rate gas treatment systems. Electron
beams can be used up to 1000 Nm3/h and even up to 10,000 Nm3/h as already
demonstrated for SO3 and NO2 destruction [Matzing et al, 1994]. The method of the
dielectric barrier discharge has a more uniform plasma, as compared to DC corona, and
offers a more convenient and easily adjustable experimental set-up when conducted in
laboratory scale.
Joshi (1927) undertook investigation of the destruction of nitrogen oxides by
electrical discharge firstly. The experiment was conducted in a Siemens Ozonator at 6-12
kV and 150 Hz. Complete conversion of N2O to N2 and O2 was achieved but the rate of
10
reaction varied considerably. It was proposed that the rate varied due to the production of
NO2 as an intermediate product.
In 1952, Visvanathan applied the same discharge process as that used by Joshi to
study the decomposition of pure gaseous NO. It was found that NO decomposed to N2
and O2 with NO2 as an intermediate. It was reported that the decomposition was complete
at low pressure (<400 mmHg) but that at higher pressure the reaction stopped before all
of the NO could be decomposed to N2 and O2 [Visvanathan, 1952]. These results were
consistent with the theory of electron activation developed by Elliot et al. in 1927. This
theory stated that high concentrations of electronegative NO2, produced in Visvanathan's
work at high initial pressures, reduced the electron velocity (at pressure and voltage
applied to the system) to a value below the critical velocity needed for NO2
decomposition.
Bes and Lacoste [1970,1974] suggested that the product of voltage and frequency
was a main parameter in determining the rate of the decomposition reactions taking place.
Further, it was found that when the product of the voltage and frequency was below 106
V/s the reaction proceeded with the formation of NO2 as an intermediate product.
However, when the voltage-frequency product exceeded 106 V/s no formation of
intermediate NO2 was observed.
The experimental investigations of the removal of toxic components (NOx etc.)
by DBD by Wolf, Listl and Neiger [1996] were conducted in plane and coaxial reactor
configuration. They found the concentration of NOx could be reduced significantly from
500 ppm to below 20 ppm. The energy consumption per converted NOx molecule fell
11
between 40 and 90 eV, but the energy consumption per removed NO molecule was 4 eV
if the additive (C2H4) was used.
Breault et al. [1993] showed in their experimental results the effect of Reynolds
number on NOx conversion. Increasing Reynolds number to a given level increased the
NOx conversion significantly. Their test range of Reynolds numbers were 100 to 750,
1700 to 2300 and 2600 to 3000, respectively.
Chang et al. [1991] experimentally investigated simulated gas streams (N2, O2,
H2O, SO2) by using a dielectric barrier discharge and computer modeling. Their work
showed that the conversion of SO2 to primarily H2SO4 was limited by the generation of
OH radicals. Increasing the concentration of O2 and H2O increased the generation of OH
radicals and resulted in more removal of SO2 from gas streams. High removal efficiencies
were experimentally achieved. Results from the model suggested that more efficient
removal is obtained with a series of short, high E/N current pulses rather than a single,
low E/N current pulse.
Gentile and Kushner [1995] studied the dielectric barrier discharge remediation
ofNxOy from simulated diesel exhaust. They discussed the dominant reaction pathways
and proposed scaling laws to optimize the energy efficiency for the removal of NOx.
Their results show that the energy efficiency of remediation generally increases with
increasing water content by removing NOx through the oxidation channel which leads to
an acidic waste product.
With laboratory scale experiments on the destruction of toxic chemicals and
industrial pollutants, Rosacha et al [1993] demonstrated that the dielectric barrier
discharge technique is a viable method for destruction of gaseous-based waste. Using
12
this technique, large concentrations of reactive O (3P) and OH can be formed with high
efficiencies relative to the deposited electrical energy. The destruction rates of organic
compounds by these species are generally high, so the organic destruction efficiency is
also expected to be quite high.
Gallimbarti [1988] simulated the impulse corona discharges in air and flue gases
with different composition. His results indicated that the presence of H2O and O2 in the
mixture component played a major role in the attachment processes. As a consequence,
the corona characteristics were very much affected by the flue gas composition. In this
study, the steady-state Boltzmann equation was solved to calculate the electron and ion
transport characteristics in the flue gas. The transport parameters were used to solve the
electron, positive and negative ion densities, together with Poisson's equation for the
pulsed corona discharge.
The experimental data in Sun et al's paper [1996] showed that the major end
products of the remediation ofNO were N2, NO2, N2O, N2O5, HNO2 and HNO3 for initial
gas mixture of 80% N2, 9% O2, 2% H2O, and 9% CO2 at 400 K. They found that the
densities of the reaction products HNO2 and HN03, the restricted NxOy products (NO2,
N2O, N2O5), and the N2 generally incrementally increased with each pulse as the reaction
products accumulated in the gas stream. For these conditions, -33% of NO is converted
to N2 through the reduction channel and -28% is converted to HNO3 through the
oxidation channel. And the percentage removal through the reduction channel increased
as the energy density increased.
Chang et al. [1992] with a lab-scale reactor has experimentally investigated gas-
phase removal of NO with dielectric barrier discharges. Their experimental results
13
indicated that 95% NO could be achieved for conditions that simulated the composition
and temperature of the exhaust gases generated by the combustion of fossil fuel.
Increasing CO2 decreased the removal efficiency of NO. There is also an optimal
concentration ofO2 to maximize the removal ofNO at a specific concentration of H2O.
Third bodies, such as additives, catalysts and fillers, have been found to have
effects on the NOx/SOx removal efficiency.
Fujii et al [1993] in their paper "Simultaneous Removal of NOx, COx, SOx and
Soot in Diesel Engine Exhaust" showed that the NOx reduction rate with oil is increased
by a factor of about 20% compared to the case using a discharge plasma only. Further,
they proposed two possible effects of the oil in the reactor. 1) the formation of an oil film
on the glass tube wall which was convenient for capturing the soot and 2) the formation
of an oil mist in the discharge space. It was suggested that the improvement of the plasma
uniformity was due to the decrease of the electric field strength by the enlarged
permittivity in the discharge space caused by the presence of the oil mist, because a
localized filamentary discharge would be suppressed by a weakened electric field. The
elimination of the soot by the oil film described above also resulted in a large permittivity
because the soot is a conductor with small permittivity.
In one of the pulsed corona experiments at ENEL [Dinelli et al, 1990], the NOx
removal was 50%, with initial NOx concentration of 240 ppm. The gas temperature was
115 °C and about 12 Wh/M3 of electrical energy was supplied to the gas. The gas
consisted of 73% N2, 13% CO2, 6% O2, 8% H2O, 650 ppm SO2 and 240 ppm NOx. The
amount of ammonia used for this particular case was 1300 ppm. Later experiments using
14
a combination of ammonia and hydrogen peroxide additives showed approximately the
same specific energy consumption, but with negligible ammonia slip.
Good results were obtained in the electron beam experiments of Tokunaga et al.
[1993] using a gas consisting of6% O2,14% CO2,12% H2O, 68% N2, 500 ppm SO2, and
150 ppm NOx. In their experiments, 5 kGy of radiation dose and 1150 ppm of ammonia
additive were used. They observed 80% reduction of NOx. This corresponded to an
energy consumption of less than 2 WH/m3, or an energy cost of 14 eV per removed NOx
molecule. Maezawa and Izutsu [1992] obtained very similar energy consumption on
electron beam treatment of coal-fired boiler flue gas at 65 °C consisting of 209 ppm
NOx, 779 ppm SO2 and 1 stoichiometric amount of ammonia. Around 80% reduction of
NOx was observed using a dose of 6 kGy.
Mizuno et al. [1992] have made many tests on NOx removal from diesel engine
exhaust using various of hydrocarbon additives, including C2H4, C3H8 and CH4. They
found QH4 to be most efficient. At a gas temperature of 30 °C, they observed 70% NOx
reduction for an initial 600 ppm NO and 30 ppm NO2, using 500 ppm of QH4.
In Rogers et al. [1997] experiments, the gas stream contained 10% O2, 2000 ppm
H2O, and approximately 500 ppm of total NOx in balance with N2. The molar ratio of
injected ammonia to initial NO was approximately 1:1. At comparable power levels the
percentage of NO removed with ammonia injection was considerably less (about 1/3)
than in tests without ammonia. They also suggested that the formation of a fine powder,
NH4NO3, within the NTPD might have inhibited the formation of microdischarge and
reduced processing efficiency. When injecting molar ratios of C2H5OH to initial NO of
8:1,90% NO removal was obtained with only 3.9 Watts (97 eV/molecule) of tube power,
15
representing a greater than 10 fold decrease in energy consumption as compared to the
base stream with no injectant. Other injection compounds, like hydrogen peroxide,
hydrazine, iso-octane and ozone, were tested. None had a better effect than ethanol did at
removing NO.
Mclamon et al [1989] investigated the use of gold plated metal wools in
conjunction with strong electric fields to decompose NO to its elemental compounds. No
significant effect on NO reduction was observed with the use of these materials.
The use of catalyst packing materials (glass wool, Kaowool and Linde 4A sieves)
resulted in higher conversion than when no packing was used [Mclamon, 1989]. In terms
of the power input to the reactor there was no significant difference in NOx conversion
achieved in systems with no catalyst packing material. Additionally, an increase in the
density ofthe glass wool packing, and therefore an increase in the glass wool surface area
in the reactor, did not increase the NOx conversion for a given discharge power.
Non-thermal plasma technology is still at a formative stage. There are a few
engineering and industrial applications of pollution control devices using non-thermal
plasma. It should be pointed out that with current NTPD techniques, plasma treatment of
waste materials is certainly more costly than many conventional incineration techniques.
In 1983, Ebara International Corporation built and operated an electron beam
FGT plant at the Indianapolis Power and Light Company's E.W Stout plant in
Indianapolis, Indiana. The purposes of these tests were to evaluate this process for flue-
gas treatment in a coal-fire utility plant.
16
In 1984, the Nuclear Research Center in Karlsruhe, Germany and the University
of Karlsruhe both built pilot-scale plants to study the reaction mechanism of the process.
In 1989, a second pilot plant was added.
In 1991, Ebara Corporation built a 1,000 Nm3/h test facility at its Central
Research Facility in Fujisawa, Japan to make further studies for reducing capital and
operating costs of the process.
In 1992, a 12,000 Nm3/h coal-burning facility was completed in Nagoya, Japan at
Chubu Electric Company. This facility would demonstrate the process and improve the
operating costs for achieving suitable NOx removal efficiencies at lower power input.
Also in 1992, a plant to treat ventilation gases from automobile tunnels became
operational to reduce the amount of NOx and unburned hydrocarbons entering the
atmosphere from the tunnel exhaust. This plant has a capacity of 50,000 Nm3/h.
Those plants have utilized non-thermal plasma techniques. They successfully
demonstrated that 1) more than 95% SO2 and 90% NOx were simultaneously removed
from the flue gas under optimum operating condition, and 2) scale-up to a full sized
commercial application is eventually feasible.
In this study, lab scale reactors were employed in non-thermal plasma discharge
process experiments. Some important physical and chemical properties were tested for
their effects on the NOx removal efficiencies. A numerical model were proposed and
tested. An over-all optimization ofthe NTPD NOx removal efficiency was achieved.
CHAPTER II
NON-THERMAL PLASMA DISCHARGE
The non-thermal plasma discharge (NTPD), also known as the silent discharge,
represents a non-equilibrium process in which the majority of the electrical energy is
used to generate highly energetic electrons. Due to its energy selectivity and its capability
for the simultaneous removal of various pollutants, the NTPD has long been recognized
as an effective technique for preferentially and efficiently channeling electrical energy to
drive specific chemical reactions. NTPD, which usually occurs in a high pressure gas,
consists of a multitude of current filaments of short duration. Four separated steps were
categorized during the life cycle of one such filament [Eliasson et al, 1991]: (i) the
formation of the discharge; (ii) the ensuing current pulse or transport of charge across the
gap; (iii) the simultaneous excitation of atoms and molecules present and thus initiation
of the reaction kinetics; and (iv) the quench of discharge and termination of reaction. The
durations of these steps are of different orders of magnitude. The local breakdown is
usually completed within nanoseconds; the current transport takes typically 1-100 ns; and
the chemistry can last from nanoseconds to seconds; the quench and termination is the
shortest step, its duration is no more than a few nanoseconds.
17
18
The reactor used in experiments typically consists of two plane and parallel
electrodes, which are covered by at least one dielectric of thickness g, with a plane gap of
width d. Within this gap, a gas of density n (pressure p, temperature T) is present. By
applying an increasing voltage to the two electrodes, breakdown is induced in the gas
once the field inside the gap exceeds the corresponding reduced Paschen field of the gap.
The Paschen voltage is given by the smallest constant voltage needed to initiate
breakdown in the gap. The reduced Paschen field is obtained by dividing the Paschen
voltage by the product nd. At the pressure of about 1 atm the breakdown results in a
multitude of filaments or micro-discharges (breakdown channels). Each channel
corresponds to a single transit breakdown or streamer breakdown. The micro-discharges
have diameters of the order of some 100 urn. Both the diameter and the duration depend
upon the gas properties and its density. The exchange of energy between the accelerated
electrons and the atoms and molecules occurs within the microdischarges. Due to the
high electron energy, the energy exchange can be very efficient. Usually more than 90%
of the electron kinetic energy is thus transformed into stored energy of gas atoms or
molecule. Elastic losses are therefore very low, and initially very little energy is lost as
heat.
A great advantage of the NTPD over many other discharge types is that one can
control the average energy of the electrons by changing the product of gas density and
gap. In this fairly easy way, one can adjust a very important parameter to optimize the
yield of the process.
The microdischarge is the key to the processes ofNTPD technology. Therefore it is
very important to understand its physics; i.e., the electrical breakdown and its chemistry-
19
the reactions of excited species generated. The initial electron current excites the species
and these excited species in turn react to form the products.
In this chapter, some important theories, methods and measurements will be
briefly introduced.
2.1 Theory and Apparatus
2.1.1. The Electrical Breakdown
With rising voltage, electron avalanches start propagating from the cathode to the
anode. When the electric field is high enough to cause a considerable current flowing
through the gap, the breakdown occurs. The breakdown voltage depends on the product
of the gas density n and the gap distance d. There are two distinctly different mechanisms
that lead to breakdown: Townsend's Generation and Kanalaufbau's Streamer
mechanisms.
i) Townsend breakdown (Generation Mechanism): For low values of nd, usually in
glow discharge, the breakdown occurs with negligible generation of space charge within
the gap. Here, the breakdown is a feedback process between the avalanches and
secondary electrons emitted from cathode. There is a slow buildup toward this
breakdown process, and it takes a number of avalanches to complete it. This type of
breakdown depends on the cathode material to a large extent.
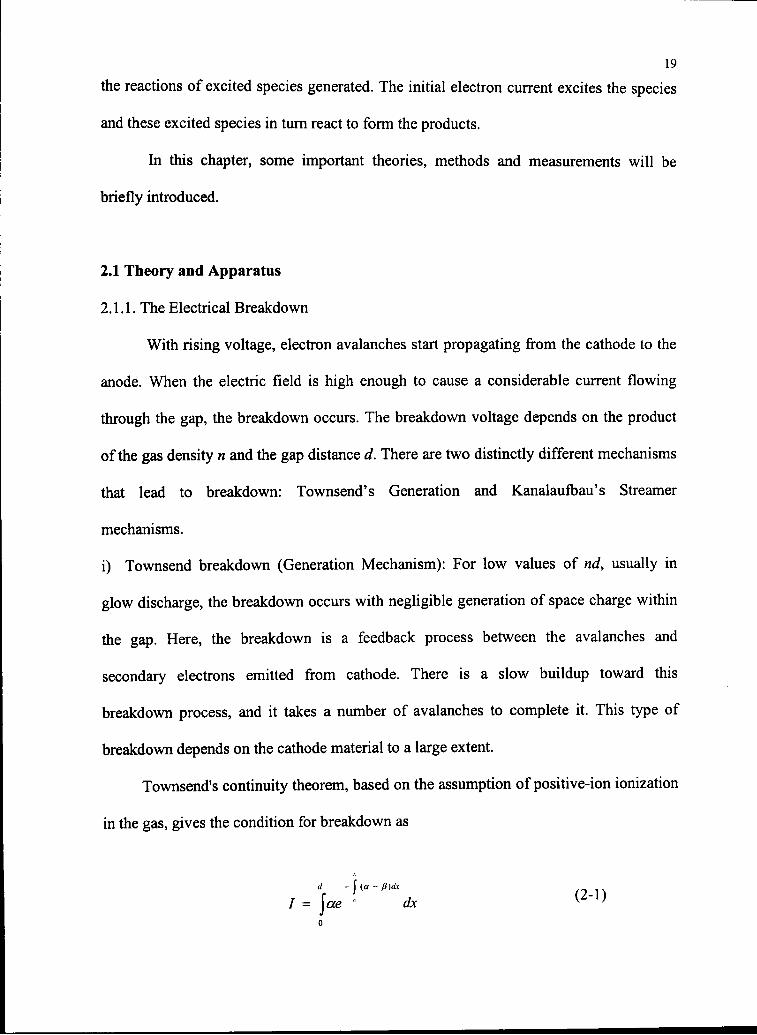
Townsend's continuity theorem, based on the assumption of positive-ion ionization
in the gas, gives the condition for breakdown as
d -\(a- P)dx
I = jae " dxo
20
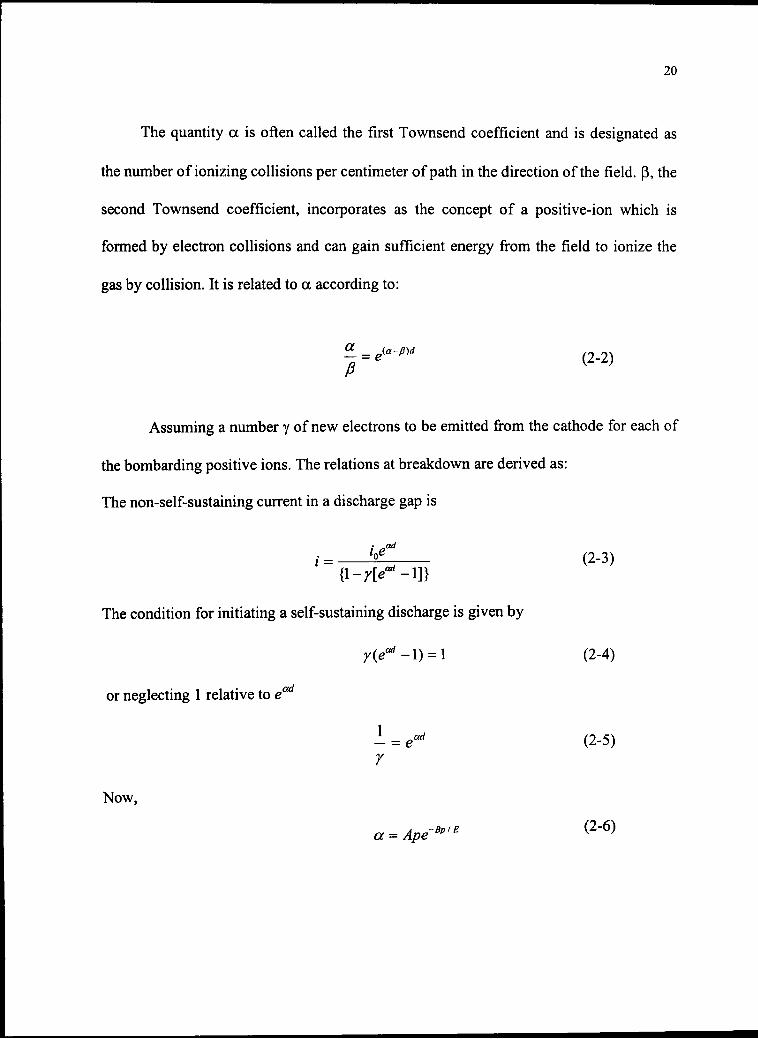
The quantity a is often called the first Townsend coefficient and is designated as
the number of ionizing collisions per centimeter of path in the direction of the field, p, the
second Townsend coefficient, incorporates as the concept of a positive-ion which is
formed by electron collisions and can gain sufficient energy from the field to ionize the
gas by collision. It is related to a according to:
(2-2)
Assuming a number y of new electrons to be emitted from the cathode for each of
the bombarding positive ions. The relations at breakdown are derived as:
The non-self-sustaining current in a discharge gap is
i = !°L. (2-3)
The condition for initiating a self-sustaining discharge is given by
/(earf — 1) = 1 (2-4)
or neglecting 1 relative to e™1
- = ead (2-5)
Y
Now,
a = Ape-bp,e (2-6)
21
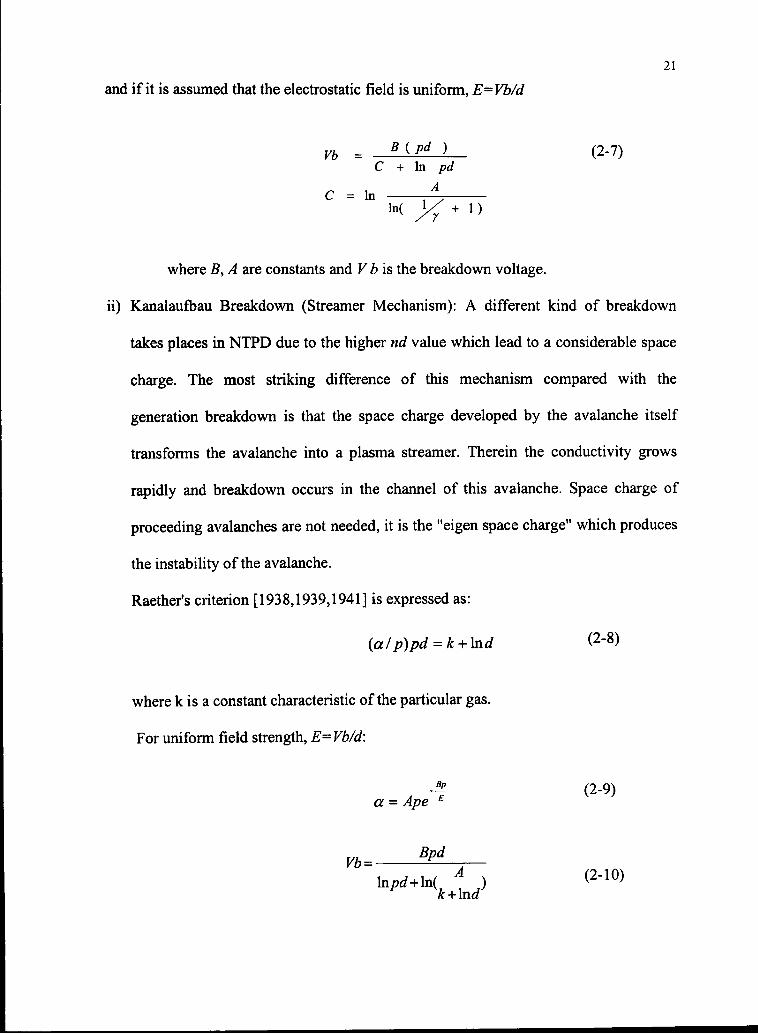
Mid if it is assumed that the electrostatic field is uniform, E=Vb/d
Vb = B{pd ) (2-7)C + In pd
C = In — A
where B, A are constants and V b is the breakdown voltage.
ii) Kanalaufbau Breakdown (Streamer Mechanism): A different kind of breakdown
takes places in NTPD due to the higher nd value which lead to a considerable space
charge. The most striking difference of this mechanism compared with the
generation breakdown is that the space charge developed by the avalanche itself
transforms the avalanche into a plasma streamer. Therein the conductivity grows
rapidly and breakdown occurs in the channel of this avalanche. Space charge of
proceeding avalanches are not needed, it is the "eigen space charge" which produces
the instability of the avalanche.
Raether's criterion [1938,1939,1941] is expressed as:
(a/p)pd = k (28)
where k is a constant characteristic of the particular gas.
For uniform field strength, E=Vb/d:
a = Ape E
Vb =
22
A empirical condition for streamer breakdown is given by
aXcn,=C (2-11)
where C is a constant. The following mechanisms occur for the given values of
xcril. [Przybylski, 1958]
IfXcrit=d, a streamer mechanism at static voltage with the minimum value of a.
Xcn^d, an anode directed streamer.
Xcrit>>d, the Generation mechanism
The Townsend mechanism generally applies for lower values of the product of gas
density n and gap spacing d, slower time-varying applied voltages, and a fairly large
secondary emission coefficient y. It is thought that the discharge generally operates in
streamer mode at higher values of nd, small y, and higher over-voltage (e.g. >20% of self-
breakdown). The two criterions have the same results if y is constant in Townsend's
equation and Ind is very small compared to k in Raether's criterion.
2.1.2. The Boltzmann Equation
Since the discharge operates at around latm pressure, the distribution of electron
energy is therefore practically always in equilibrium with the applied field. The stationary
Boltzmann equation can be applied for a constant field, independent of the other
equations.
In order to model the temporal and spatial behavior of charged particles in an
electric field, as well as their interaction with neutrals, a set of coupled Boltzmann
equations for each kind of the particle (e.g. electrons, ions, atoms, molecules) has to be
23
solved. Due to the tremendous efforts necessary to perform such calculations, appropriate
simplifications have to be found.
The electron distribution function is a seven dimensional function of coordinate
space r, velocity space v, and time t. In general, an isotropic velocity distribution can be
reduced to a function of the electron energy. The evolution of the distribution function in
the increment t -dt to / follows from the motion of the electrons in the presence of an
external force F and a correction term due to collisions:
—dt,t-dt) + \tf) dt (2-12)me V dt )ce
The Boltzmann equation is obtained by expanding the left hand side to the first
order and taking the limit as dt->0
dt me V ot )c
where E(r,t) represents the actual electric field (due to the externally applied voltage
and the space-charge distribution). The collision term ?L-\ . is a non-linear "source
term" which describes changes of particle position and velocity in the space due to
collisions. This term is again a function of fe
Because of the complexity of the collision operator and the number of variables, a
general solution of the Boltzmann equation at microscopic level is practically impossible,
either analytically or numerically. But by fittingly defining the boundary conditions and
assumptions, Boltzmann equations can be solved with acceptable accuracy.
24
2.1.3. Poisson's Equation
The electric field is described by Poisson's Equation
V .E(r,t) = Y^^- (2-14)
Where e represents the dielectric constant of the background medium. qt and «,
represents the species i with charge q and density n.
The potentials of each species are calculated separately and superimposed
considering the boundary conditions.
2.1.4. Particle and Charge Density
The particle density, «/, at any position r and time t can be obtained from the
function
nt{r,t)= \f,(r,v,t)dv (2-15)
by integrating over the velocity distribution. The function/f obeys the basic conservation
equation (i.e. the Boltzmann Equation).
An additional equation that must be solved is the equation of continuity.
^ + V • («,v. - DjVnj) = Sj (2-16)
Where w=//, (v, is the draft velocity of species j with mobility //, ), Dj is the
diffusion coefficient and Sj is the sum of all sink and source terms. Note that 5} is a
function of all reactions which species./ is a part of.
25
An important aspect to be considered during solution of the Poisson equation is the
time- and space-dependent boundary condition on the dielectric. Due to charge buildup
there, the potential on the dielectric/gap interface varies with time.
The surface charge density on the dielectric surface q is given by
q{r,t)= \e^eE(r,t')ne(r,ndt' (2-17)
And the total charge by
o
r
= 2n jq(r,t)rdr
The total charge depends on the dielectric thickness and the dielectric constant, as
well as the gap width. It increases linearly with the gap width. The charge q(r,t) that is
deposited on the dielectric grows with time and leads to the development of a field. The
developed field is directed against the applied field and eventually chokes the
microdischarge.
2.1.5. Reaction Rate Coefficients
The rate at which free radicals, ions or other excited states are formed by electron
impact in plasma can be quantified in terms of a chemical reaction rate expression
^ *„[«][»,] ()at
Where dfnj/dt is the rate of formation of species nj from precursor nj, ky is the rate
cofficient, [e] is the concentration of electrons, and fnj is the concentration of the
neutral precursor species.
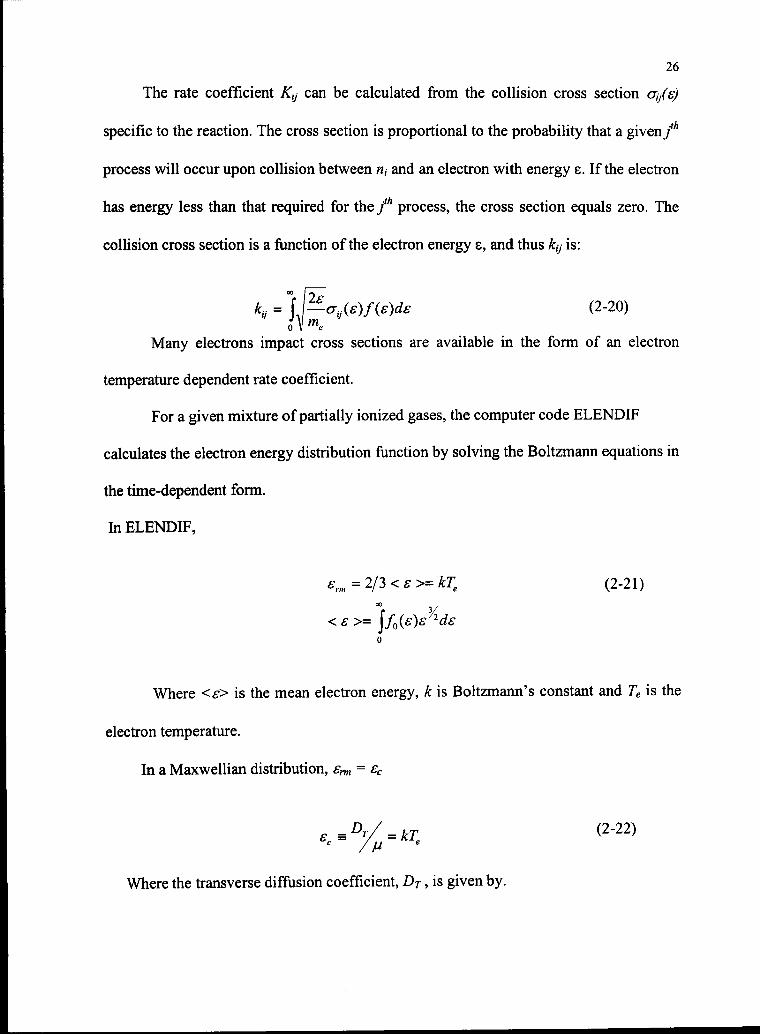
26
The rate coefficient Ky can be calculated from the collision cross section ot/s)
specific to the reaction. The cross section is proportional to the probability that a givenfh
process will occur upon collision between n, and an electron with energy e. If the electron
has energy less than that required for the/* process, the cross section equals zero. The
collision cross section is a function of the electron energy s, and thus ky is:
(2-20)
Many electrons impact cross sections are available in the form of an electron
temperature dependent rate coefficient.
For a given mixture of partially ionized gases, the computer code ELENDIF
calculates the electron energy distribution function by solving the Boltzmann equations in
the time-dependent form.
In ELENDIF,
erm= 2/3 <e>=kTe (2-21)
< £ >=
o
Where <e> is the mean electron energy, k is Boltzmann's constant and Te is the
electron temperature.
In a Maxwellian distribution, erm = sc
e sdt/ = kT, (2"22)
Where the transverse diffusion coefficient, DT, is given by.
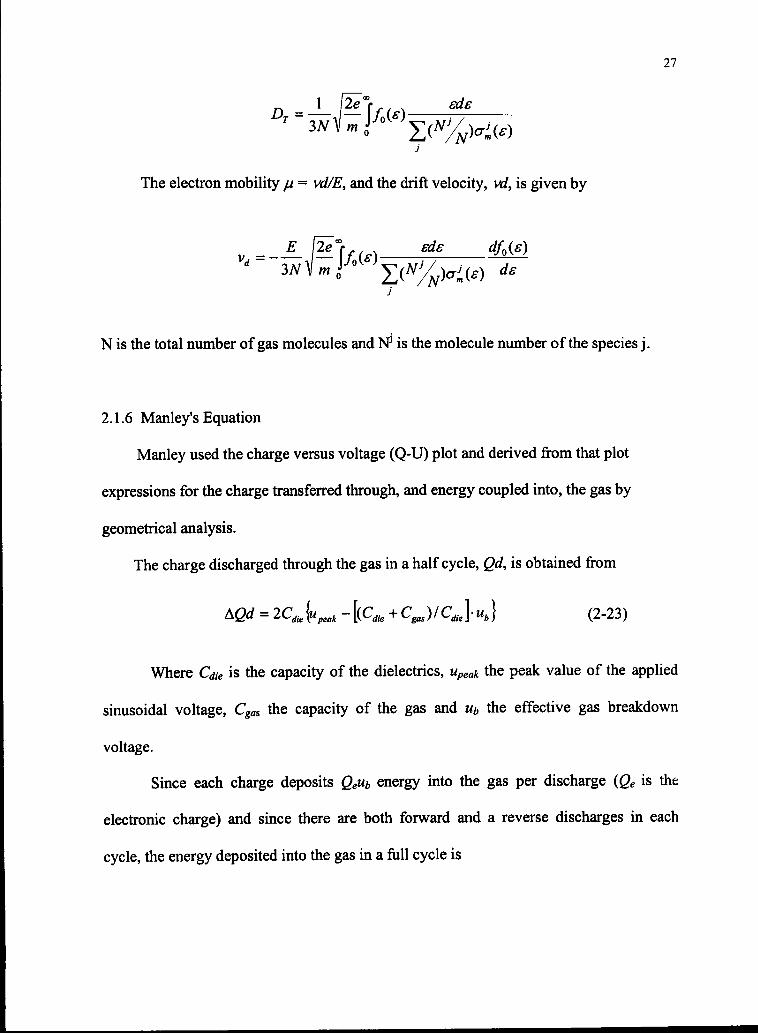
27
sds
The electron mobility ju = wi/Zs, and the drift velocity, vd, is given by
eds dfo(s)
7
N is the total number of gas molecules and Nj is the molecule number of the species j.
2.1.6 Manley's Equation
Manley used the charge versus voltage (Q-U) plot and derived from that plot
expressions for the charge transferred through, and energy coupled into, the gas by
geometrical analysis.
The charge discharged through the gas in a half cycle, Qd, is obtained from
AQd = 2Cdie {upeak - [{Cdie + Cgas)/ CJ- ub} (2-23)
Where Qie is the capacity of the dielectrics, upeak the peak value of the applied
sinusoidal voltage, Cgas the capacity of the gas and ub the effective gas breakdown
voltage.
Since each charge deposits Qeub energy into the gas per discharge (Qe is the
electronic charge) and since there are both forward and a reverse discharges in each
cycle, the energy deposited into the gas in a full cycle is
28
W = 2AQdub (2-24)
and the mean power can be obtained by multiplying the mean energy per cycle by the
frequency.
2.2 Method Development
Many different types of discharges may be used as reactors for pollution control.
The electrical and chemical properties of the plasma species produced in each reactor
depend on the mechanism of discharge development and charged particles production.
Many electrical discharge devices achieve non-thermal conditions through the
production of microdischarges called streamers. Streamers are plasma filaments produced
by highly localized space-charge waves that enhance the applied field in the front of the
wave and propagate because of electrons avalanching in this high field. Streamers yield
good power efficiency because within the short lifetime of the streamer, the ions do not
experience significant movement and therefore do not contribute to the power
consumption. The short lifetime of the streamer is accomplished by using very short
high-voltage pulses and/or dielectric coatings on the electrodes.
The high capital costs of accelerators and the x-ray hazards associated with electron-
beam pollution control systems have motivated studies into alternate plasma-based
technologies such as those utilizing electrical discharges. Electrical discharges can be
produced in many different ways, depending on the geometry of the reactor and the
electrical power supply. Many reactor designs use electrodes, such as small diameter
wires, needles or sharp-edged parallel, and metal planes.
29
One type of discharge reactor that has shown very promising results is the pulsed
corona reactor. The industrial implementation of this reactor has the advantage of low
retrofit cost since it can use the same wire-plate electrode arrangement used in
electrostatic precipitators. By driving the reactor with very short pulses of high voltage,
short-lived plasma discharges are created that consist of energetic electrons, which in turn
produce the radicals responsible for the decomposition of the toxic molecules. Pulsed
corona reactors have been shown, both on laboratory and industrial scale, to be effective
for the removal of many types of gaseous pollutants.
In dielectric barrier discharge reactors, AC high voltages are applied between
electrodes, one or both of which are covered by a dielectric layer with high dielectric
strength, such as glass and Teflon. The geometry is commonly either planar or
cylindrical. The dielectric barrier discharge process is a very mature technology, first
investigated by Siemens in 1850's for the production of ozone. Joshi first demonstrated
the destruction of nitrogen oxides using a Siemens reactor in 1927.
Whereas in the pulsed corona method the applied voltage pulse controls the
transient behavior of the plasma, the discharge that takes place between dielectric barriers
naturally reduces the local electric field. This feature presents an advantage for the
dielectric barrier discharge approach since simpler electrical power supplies can be used.
A great advantage of the dielectric-barrier discharge over many other discharge types is
that one can influence the average energy of the electrons generated by changing the
product of gas density and gap width (usually changing the latter). Thus in a fairly simple
way one can adjust this very important parameter to optimize the yield of the process
under study.
30
With variable gap spacing, reaction zone size and dielectric barrier material, a
series of Double Dielectric Barrier Discharge (DDBD) reactors were designed for the
investigation ofNTPD processes described in this study.
2.3 Chemical Reactions
It is known that non-thermal techniques are particularly efficient only when the
pollutant is present in fairly low concentrations. At higher initial pollutant concentrations,
the electrical energy consumption becomes comparable, or may even exceed, that of
thermal techniques. The removal of NOx using non-thermal plasma can be implemented
without using catalysts or additives, but the use of additives and catalysts, such as
ammonia or alcohol, becomes necessary in some cases due to excessive low energy
consumption. The trade-offmay be the formation of secondary pollutants
Chemical reactions in non-equilibrium cold plasmas are initiated by collisions of
molecules with electrons having large energy taken from the electrical field. Many
particles having high chemical activity even at low temperatures are generated by
electron molecule collisions, such as excited molecules, negative and positive ions, atoms
and radicals. The chemical reaction mechanism in non-equilibrium plasmas may be very
complex and dependent on many internal plasma parameters.
The exchange of energy between the accelerated electrons and the molecules and
atoms occurs within the microdischarges. The fairly energetic electrons (some ev) excite
the molecules and atoms and thus transform some of their kinetic energy into stored
energy in the excited species. Due to the high electron energy, this energy exchange can
be very efficient with as much as 90% of the kinetic energy being transformed into stored
energy. Elastic losses are therefore very low.
31
A broad range of chemical and physical reactions occurs in the non-equilibrium
plasma. It is necessary to note that determination of the active species that primarily
contribute to product generation is difficult because of the various types of active species
that are formed in any electrical discharge through gas, but only a few are important to
the chemistry. It is therefore necessary in the study of plasma-chemical reactions to
choose the most physically probable chemical reactions and physical processes for non-
equilibrium plasma.
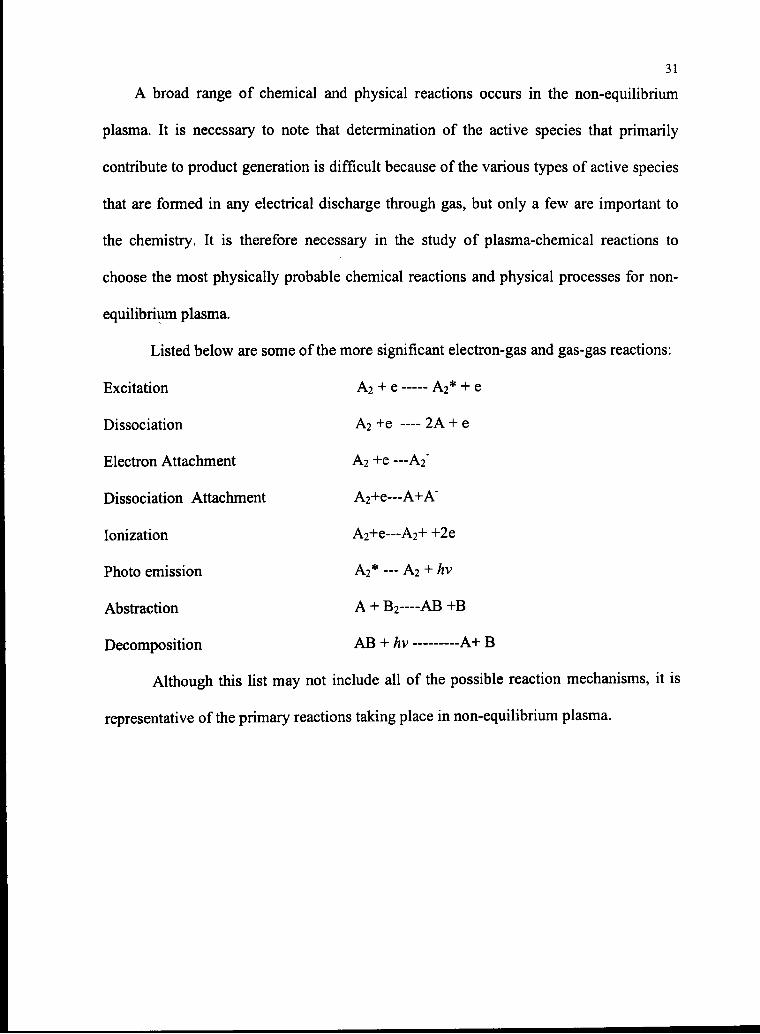
Listed below are some of the more significant electron-gas and gas-gas reactions:
Excitation A2 + e A2* + e
Dissociation A2 +e —- 2A + e
Electron Attachment A2 +e —A2"
Dissociation Attachment A2+e—A+A"
Ionization A2+e—A2+ +2e
Photo emission A2* — A2 + hv
Abstraction A + B2—AB +B
Decomposition AB + hv A+ B
Although this list may not include all of the possible reaction mechanisms, it is
representative of the primary reactions taking place in non-equilibrium plasma.
CHARPTER HI
EXPERIMENTS AND PROCEDURE
In order to carry out this study of the non-thermal plasma discharge, a reliable
double dielectric barrier discharge system was designed and installed. Experimental
methods and procedures for measurements and data analyses were developed. In this
chapter, a laboratory scale DDBD system will be described and experimental procedures
will be discussed in detail.
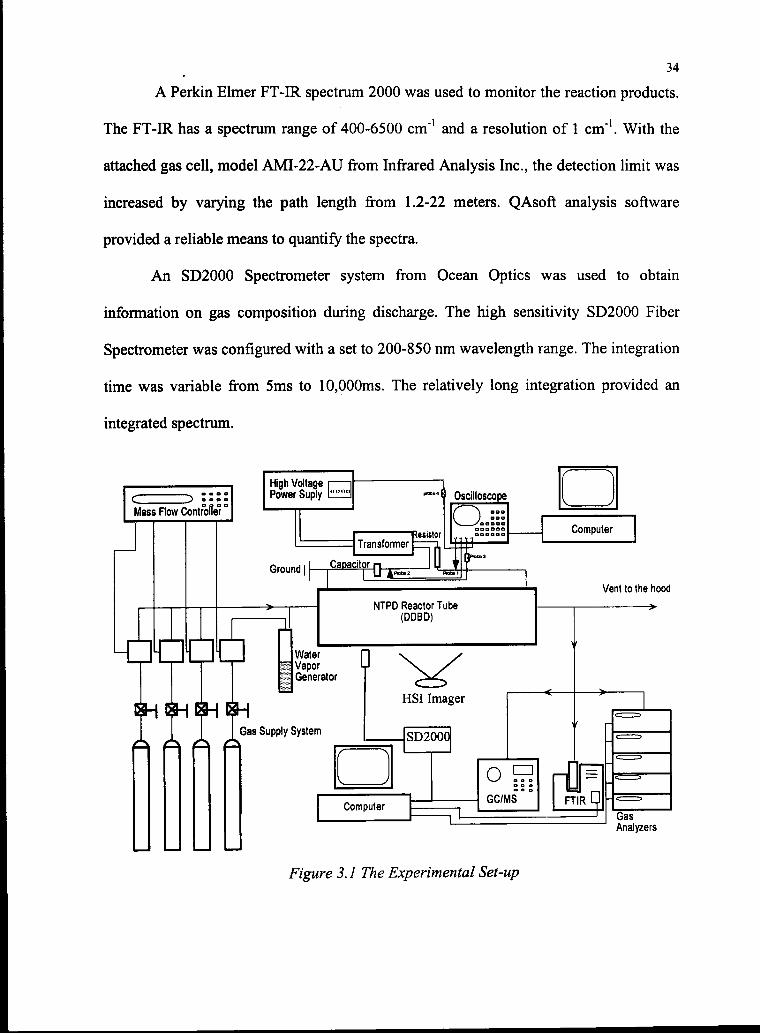
3.1 Experimental Setup
The experimental setup is shown in Figure 3.1. The reactor tube, a double dielectric
barrier discharge (DDBD), consisted of two parallel plate electrodes that were formed by
sealing a copper screen between two 1 mm thick tempered Pyrex glass plates using RTV
silicon. The tube was constructed so that gas flow was directed through the gap space
between the plates. The DDBD reactor housing was made of aluminum or PVC with
ports for the inlet and outlet gas flows and the high and low voltage terminals. The inside
of the reactor housing was overlaid with Kapton high voltage tape while the top was
sealed with a rubber gasket, sealing tape, and a Plexiglas cover, which ensured that no
gas flow occurred outside of the gap spacing. The electrodes were separated by a Teflon
32
33
spacer of well-defined thickness that fixed the size of the gap. The gap sizes varied
between 0.5-5 mm in the experiments.
The power supply was a model 501SL-12/401SD-002 AC Power System
manufactured by Elgar and capable of delivering 0-260 Volts at frequency of 45-5000
Hz. The frequency accuracy was 0.0015 of the set value and the total harmonic distortion
was 0.6%. A 3k VA transformer with a nominal step-up of 70:1 at a frequency of 400 Hz
was used. A HP 54600 oscilloscope with four channels was employed in the experiments
to measure the tube voltage, sense capacitor voltage, and current. By connecting the
oscilloscope to a PC with a GPIB PCII card, data was transmitted to the PC and
subsequently used to calculate the power consumption and other system parameters. Due
to the high voltage, two attenuation probes (xlOOO) were connected between the
oscilloscope and the high voltage terminals.
An eight-channel thermal meter measured the temperatures of the inlet flow, outlet
flow, and surroundings and a U-tube manometer was employed to measure the pressure
drop across the DDBD. The gas matrix was fed quantitatively, using MSK 1179 Mass-
Flow Controllers, from gas cylinders of O2, N2, and NO (with N2 balance). A vapor
generator was used to provide the desired level of water vapor in the inlet gas stream.
The post-reaction exhaust flow gases were analyzed for NO and NOx using a
Horiba CLA-510ss Chemiluminescence gas analyzer with 1% accuracy. A sampling unit
was attached to the analyzer to draw in a sample at flow rate of 3 L/min. To work with
flow rates less than 3 L/min, dilute N2 was added to balance the pressure of the reaction
system.
34
A Perkin Elmer FT-IR spectrum 2000 was used to monitor the reaction products.
The FT-IR has a spectrum range of 400-6500 cm"1 and a resolution of 1 cm1. With the
attached gas cell, model AMI-22-AU from Infrared Analysis Inc., the detection limit was
increased by varying the path length from 1.2-22 meters. QAsoft analysis software
provided a reliable means to quantify the spectra.
An SD2000 Spectrometer system from Ocean Optics was used to obtain
information on gas composition during discharge. The high sensitivity SD2000 Fiber
Spectrometer was configured with a set to 200-850 nm wavelength range. The integration
time was variable from 5ms to 10,000ms. The relatively long integration provided an
integrated spectrum.
Capacit
Transformeresistor
Oscilloscope
( \ ===
V 'ooDaa
Computer
NTPD Reactor Tube
(DDBD)
Vent to the hood
Water
Vapor
Generator
mm bhI I I Gas Supply System
D
HSI Imager
SD2000
Computer
O HBOO
GC/MS
Gas
Analyzers
Figure 3.1 The Experimental Set-up
35
A Shimadzu GC-MS was also employed for routine analysis of the post reaction
stream. A 25-meter long column with specific stationary phase assured the desired
resolution for gas samples in the GC.
The experimental procedure involved first purging the DDBD reactor, flow path,
and analyzers for 10-20 minutes using dry N2 at flow rates of 1-2 L/min. Calibration of
the analyzer was then performed by using N2 gas (99.9%) for zero and standard NO gas
(2000 ppm, N2 balance) for span. The next step was to set the power to zero and record
the corresponding power reading on the computer. If the reading was not zero, frequency
compensation (high, mid and low) of the attenuation probe on the high voltage was used
to correct it to zero. By setting and controlling channels on the MKS Multigas Flow
Controller, inlet gas mixture was synthesized according to the desired experimental
composition. Water vapor for the experiment was generated through bubbling the N2 gas
through a small container of water. The amount of vapor in the saturated stream was
determined from the measured temperature of the gas. By adjusting the voltage provided
by the power supply, the desired power level was achieved. At the desired power level,
the system was allowed to achieve stability or steady state, and the NO and NOx levels in
the effluent gas stream were measured with the gas analyzer. Other parameters such as
temperature, pressure drop and flow rate were recorded during each experiment. The
average values of the measured parameters were used for data analysis.
3.2 Physical Characteristics
3.2.1 .Power Measurement
36
Power measurement is based on the voltage of DDBD reactor and the current of
discharge:
p = VI (3-1)
/ _ cdVc/ (3-2)dt~L Ydt
Where P is the power, V the applied voltage, / the discharge current, Vi the low
side voltage, Vh the high side voltage, C the capacitance of the sense capacitor, Vc the
voltage between the terminals of the capacitor, and/ the time.
Once Vc is obtained, manual calculation of dVc/dt is a very complex task.
Typically thousands of points should be manipulated to obtain the value of dVc/dt for
each cycle. By setting the HP Oscilloscope to communicate remotely with a computer,
numerical calculation of dVc/dt is possible. After installing the power calculation
algorithm, a run time power was obtained.
In our experiments, a \uF capacitor and two 1000:1 attenuation probes were used
to obtain Vc and V. About 2000 points were utilized to calculate the dVc/dt. Finally, the
average root mean square of the power was output.
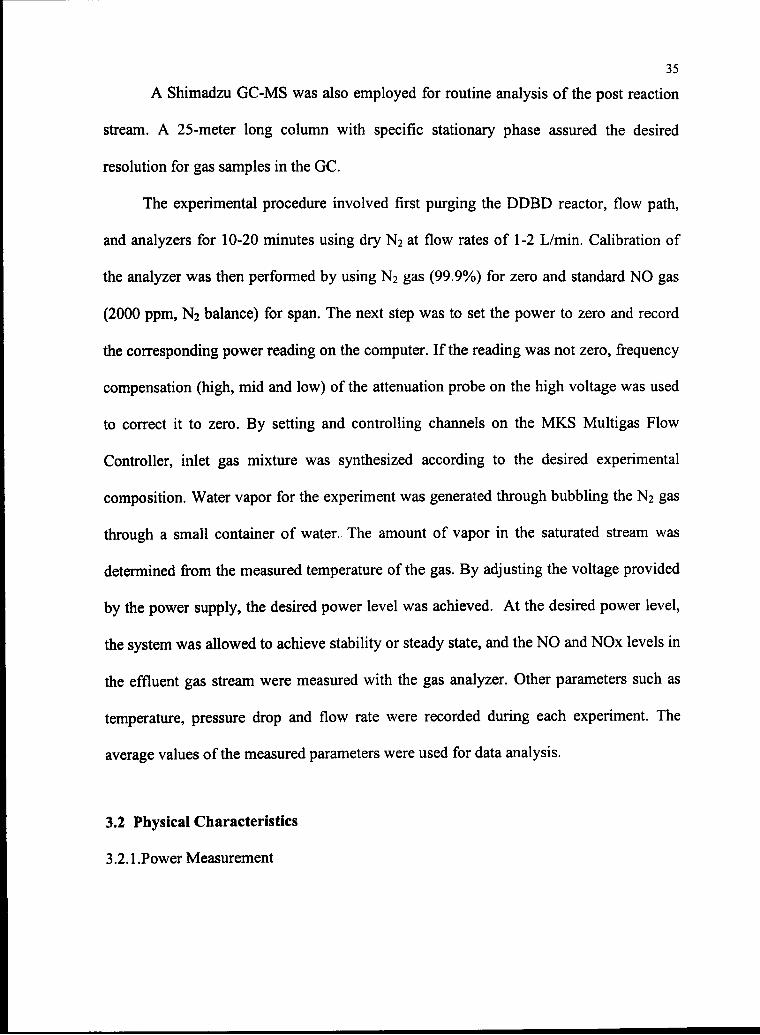
3.2.2. Breakdown Voltage, Current and Charge
As the voltage across the reactor increases in time, the voltage across the gas gap
increases as well. When the gap voltage reaches the electrical breakdown voltage, a
number of microdischarges appear in the gas volume. When sufficient electrical charge
builds up on the dielectric surface, the microdischarges are arrested and the voltage
across the discharge drops from the ignition voltage to the extinction voltage.
37
20000
15000
^. 10000
% 5000O) ft
o "500°> -10000
-15000
-20000
\ / \ / i
\ i X 1\ / \l /
) 0.001 0.002 0.003 0.004 0.005 0.006
Time (sec)
9BD0.
9030.
9100.
9000.
8B0O.
8B0O.
SOD
QOGBOO 4O0EG5 80CE03 1.ZHE
Figure 3.2. Voltage Waveforms for DDBD Cell
(a) Full cycle (b) Spikes
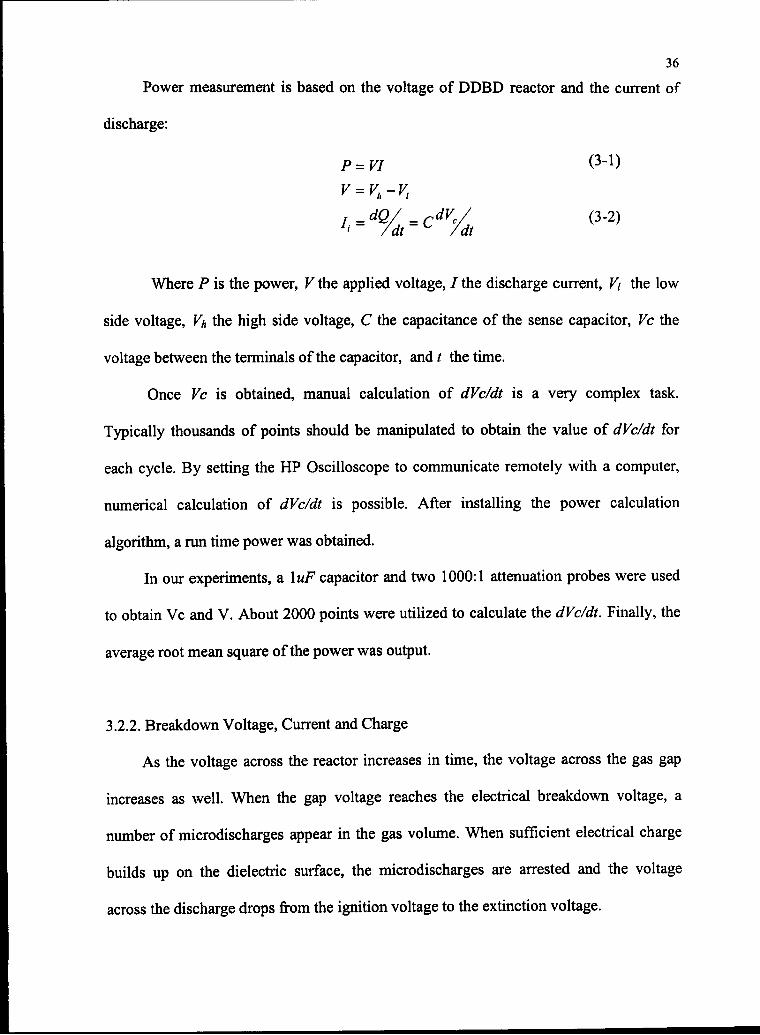
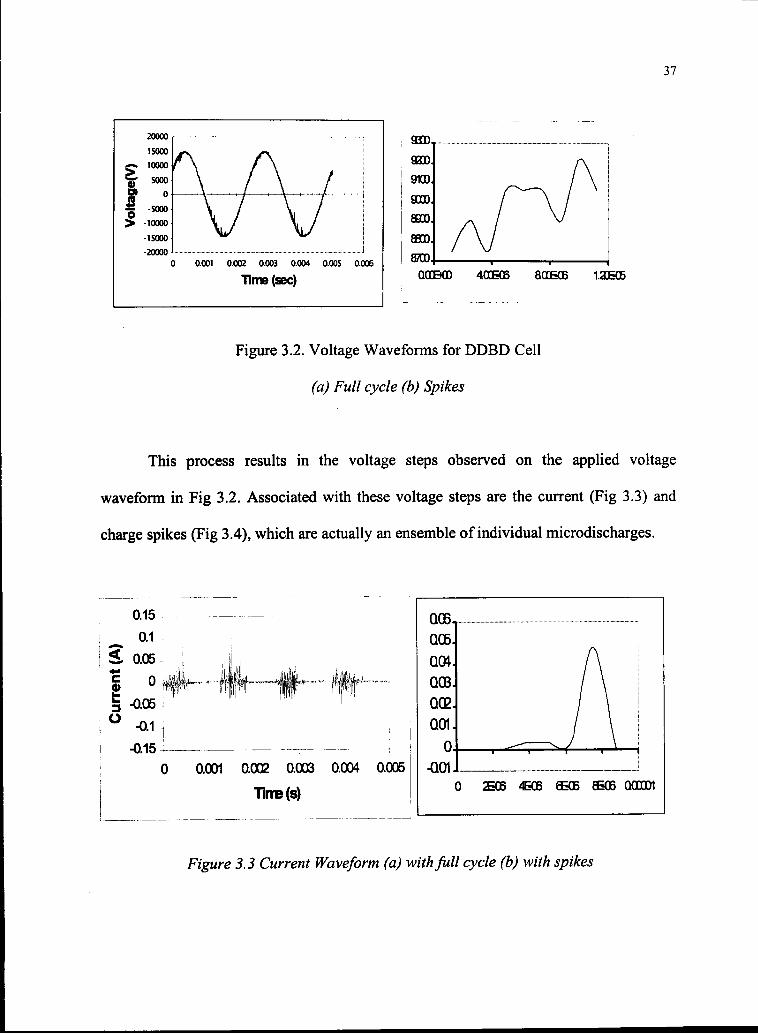
This process results in the voltage steps observed on the applied voltage
waveform in Fig 3.2. Associated with these voltage steps are the current (Fig 3.3) and
charge spikes (Fig 3.4), which are actually an ensemble of individual microdischarges.
0.15
^ 0.1
2 0.050
-0.05
-0.1
-0.15
o
0.0O1 0.002 0.003 0.004 0.005
TinB(s)2EG6 4KB 6EG6 EEG6 QO00O1
Figure 3.3 Current Waveform (a) with full cycle (b) with spikes
38
1.00E06
g- 500EO7,
g> O.00BCO
g -500E07
-100E05
(
1 —\j4-.- -—-*]- 4L[ -4-
3 0.002 0.004 0.006
Time(sec)
aOCE08.
4.00E08.
O.O0BOO.
-4.00EO3.
-aOOB08.
\JO.00E 200E- 4.0CE &00B aOQE 1.0QB 1.20B
■KM 06 06 06 06 05 05
Figure 3.4 Charge Waveform (a) withfull cycle (b) with spikes
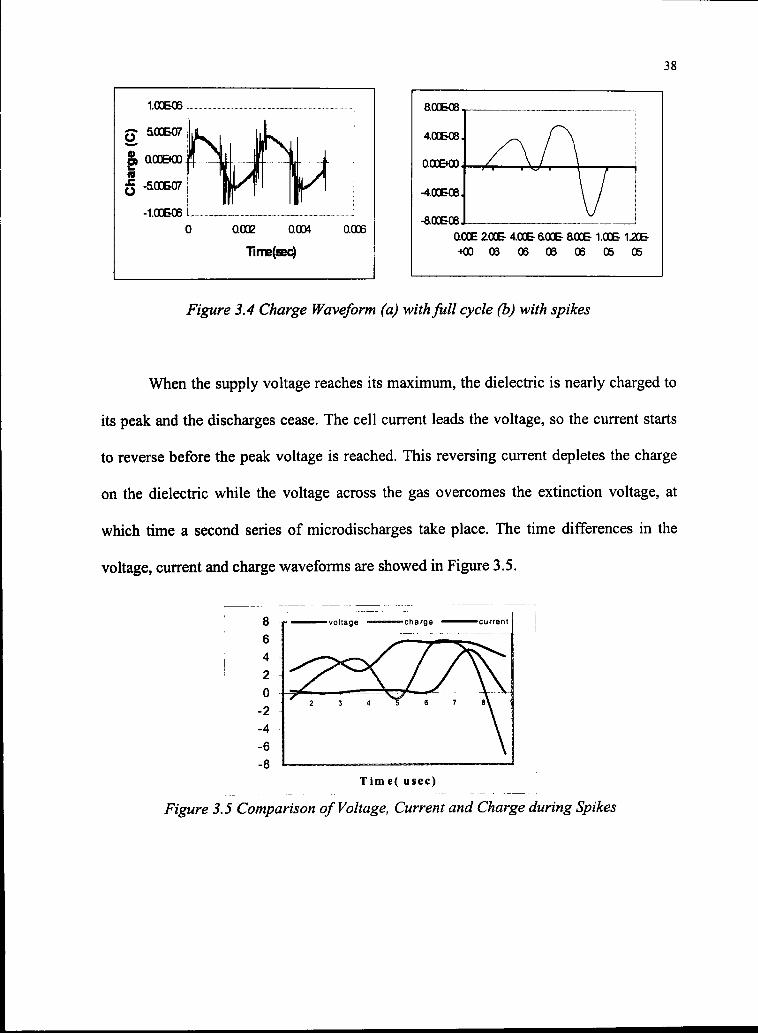
When the supply voltage reaches its maximum, the dielectric is nearly charged to
its peak and the discharges cease. The cell current leads the voltage, so the current starts
to reverse before the peak voltage is reached. This reversing current depletes the charge
on the dielectric while the voltage across the gas overcomes the extinction voltage, at
which time a second series of microdischarges take place. The time differences in the
voltage, current and charge waveforms are showed in Figure 3.5.
Tim e( usec)
Figure 3.5 Comparison of Voltage, Current and Charge during Spikes
39
It should be noticed that the phase of the charge is behind of the voltage but ahead
of the current, which implies the time sequence of the electrical process.
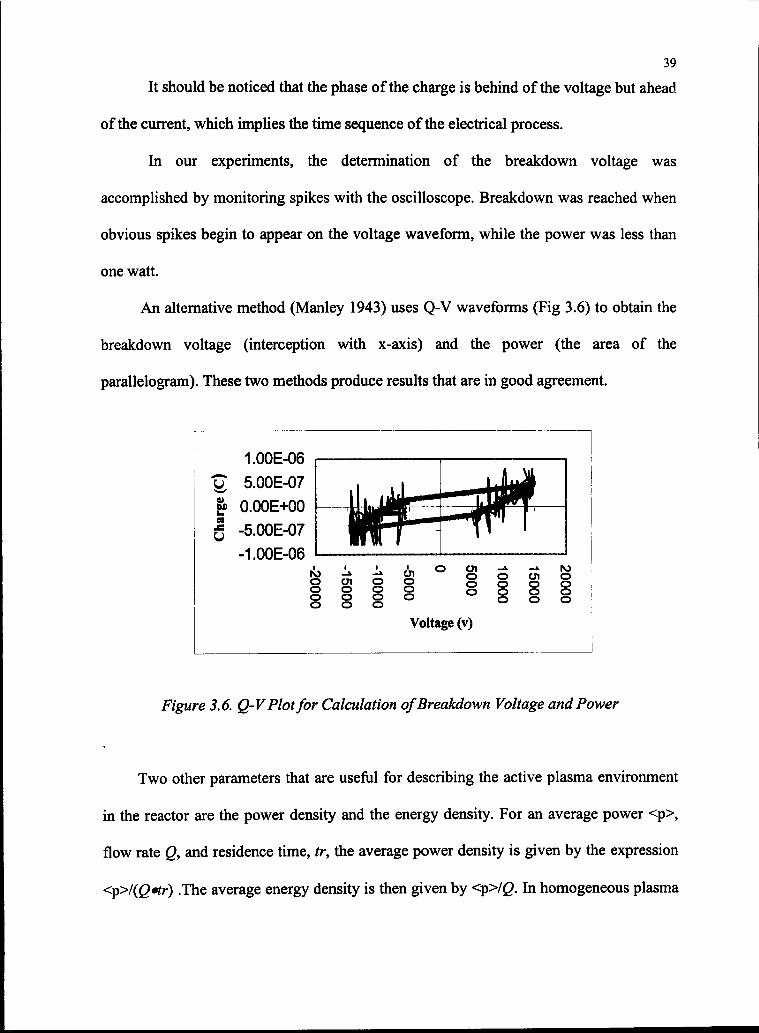
In our experiments, the determination of the breakdown voltage was
accomplished by monitoring spikes with the oscilloscope. Breakdown was reached when
obvious spikes begin to appear on the voltage waveform, while the power was less than
one watt.
An alternative method (Manley 1943) uses Q-V waveforms (Fig 3.6) to obtain the
breakdown voltage (interception with x-axis) and the power (the area of the
parallelogram). These two methods produce results that are in good agreement.
1.00E-06
u; 5.00E-07
g> 0.00E+00
g -5.00E-07
-1.00E-06
O O1£5
o oo
O Ol -»• -*• NJo o en oo o o oo o o o
o o o
Voltage (v)
Figure 3.6. Q-VPlotfor Calculation ofBreakdown Voltage and Power
Two other parameters that are useful for describing the active plasma environment
in the reactor are the power density and the energy density. For an average power <p>,
flow rate Q, and residence time, tr, the average power density is given by the expression
<p>/(Qtr) .The average energy density is then given by <p>IQ. In homogeneous plasma
40
reactor models, the average power determines the average electron density. The electron
density determines the excitation and dissociation rates of molecules in gas.
3.3 Optical Measurement
Photographs taken with an intensified high speed imager in framing mode revealed
details of the microdischarges. We assumed that microdischarge images in the spectral
range of 400 nm-800 ran represent the main electron stream that forms a channel. Note
that the duration of the image only reflects the integration of the excimers life within the
channel.
During a single half power cycle, the number of microdischarges and their radii
can be measured directly by the images. Since the DDBD's configuration is assumed to
be symmetric, we simply assume that all charges were transferred through
microdischarges in which chemical reactions were initialized. The reactions are
determined by electron-molecular/atom collisions occurring within the microdischarge.
Therefore, to understand the microdischarge is key to understanding the NTPD.
A cylindrically shaped microdischarge with radius r and a disc shaped footprint
with radius Ro are assumed as shown in Fig 3.7. Furthermore all charges are assumed
transferred through discharge channels and the electrical field is taken as to be uniform
over microdischarges.
The microdischarge consists of a small channel and a creep discharge on the
dielectric surface. During the discharge process a dielectric double layer is built up at the
dielectric surface. This layer reduces the field strength within the gap leading to
extinction of the discharge within a few nanoseconds.

41
lmm Glass
lmm Glass
Ro
Metal net (High Voltage)
- Teflon Spacer
- Metal-net (Low Voltage)
Figure 3.7. Sketch ofA Simplified Microdischarge and Arrangement ofthe DDBD
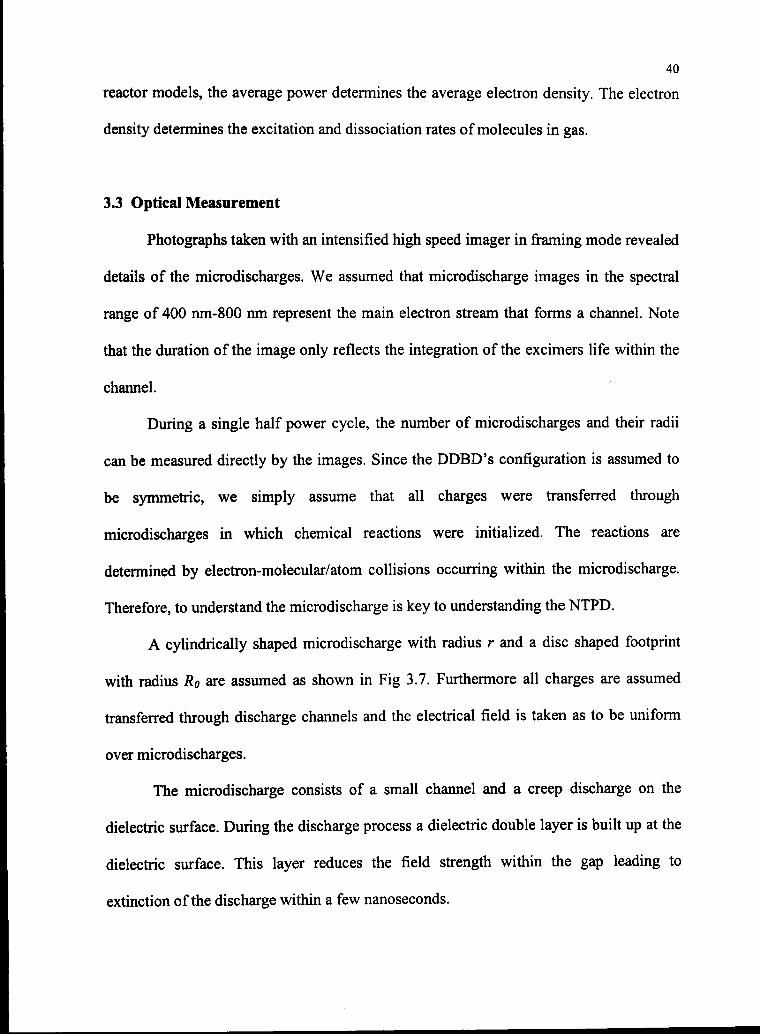
Since the electrical discharge initiates the chemical reactions, the properties of the
microdischarge determine the performance of the NTPD process. A typical picture of a
microdischarge is presented in Fig 3.8.
The electrode surface can affect the microdischarge radius by changing the
surface conductivity. The conductivity changes the Ro due to a change in the avalanche
range on the electrode surface and changes r due to a change in the amount of charge
transferred through a channel.
From the vertical direction, using a given optical area determined by the optical
system and the lens distances, the number of microdischarges can be recorded during a
specified time by controlling the frame rate and/or expose time.
42
Figure 3.8. Picture ofA Microdischarge.
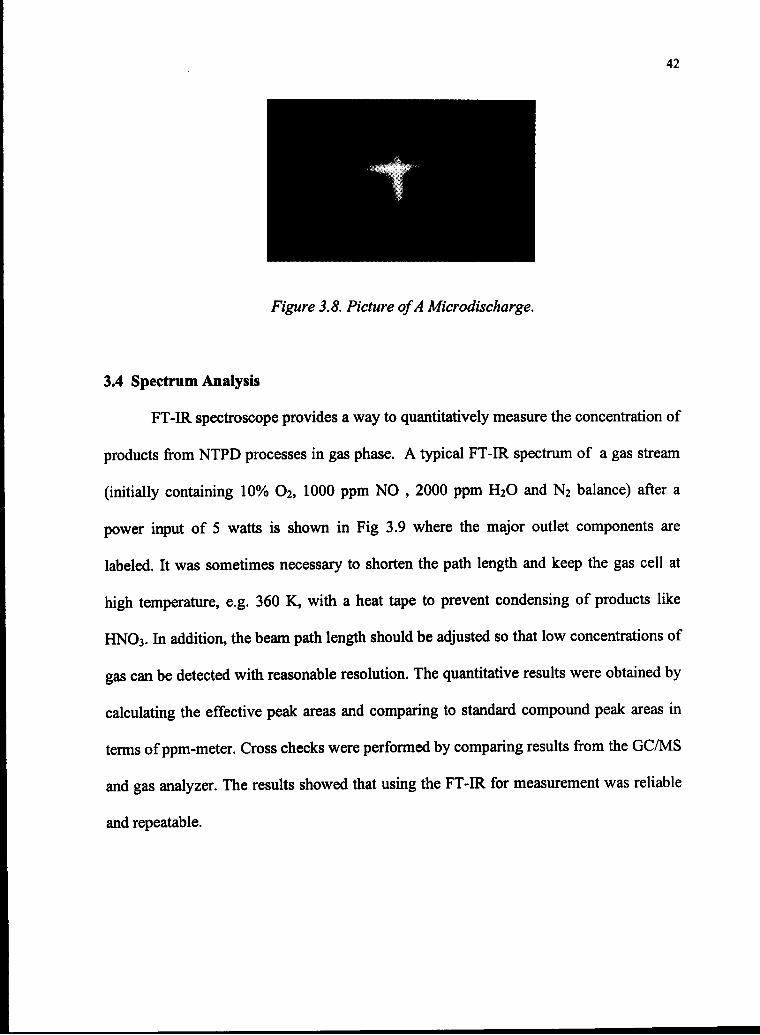
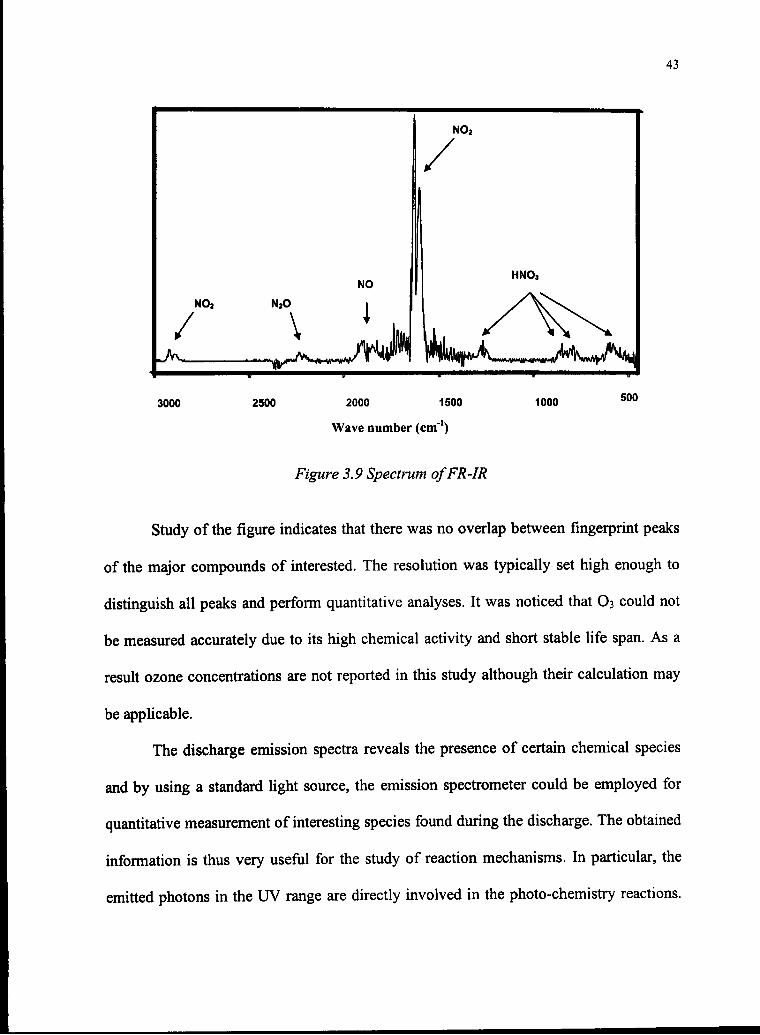
3.4 Spectrum Analysis
FT-IR spectroscope provides a way to quantitatively measure the concentration of
products from NTPD processes in gas phase. A typical FT-IR spectrum of a gas stream
(initially containing 10% O2, 1000 ppm NO , 2000 ppm H2O and N2 balance) after a
power input of 5 watts is shown in Fig 3.9 where the major outlet components are
labeled. It was sometimes necessary to shorten the path length and keep the gas cell at
high temperature, e.g. 360 K, with a heat tape to prevent condensing of products like
HNO3. In addition, the beam path length should be adjusted so that low concentrations of
gas can be detected with reasonable resolution. The quantitative results were obtained by
calculating the effective peak areas and comparing to standard compound peak areas in
terms ofppm-meter. Cross checks were performed by comparing results from the GC/MS
and gas analyzer. The results showed that using the FT-IR for measurement was reliable
and repeatable.
43
y^mJ^H^mW T^W 1
3000 2500 2000 1500 1000 500
Wave number (cm'1)
Figure 3.9 Spectrum ofFR-IR
Study of the figure indicates that there was no overlap between fingerprint peaks
of the major compounds of interested. The resolution was typically set high enough to
distinguish all peaks and perform quantitative analyses. It was noticed that O3 could not
be measured accurately due to its high chemical activity and short stable life span. As a
result ozone concentrations are not reported in this study although their calculation may
be applicable.
The discharge emission spectra reveals the presence of certain chemical species
and by using a standard light source, the emission spectrometer could be employed for
quantitative measurement of interesting species found during the discharge. The obtained
information is thus very useful for the study of reaction mechanisms. In particular, the
emitted photons in the UV range are directly involved in the photo-chemistry reactions.
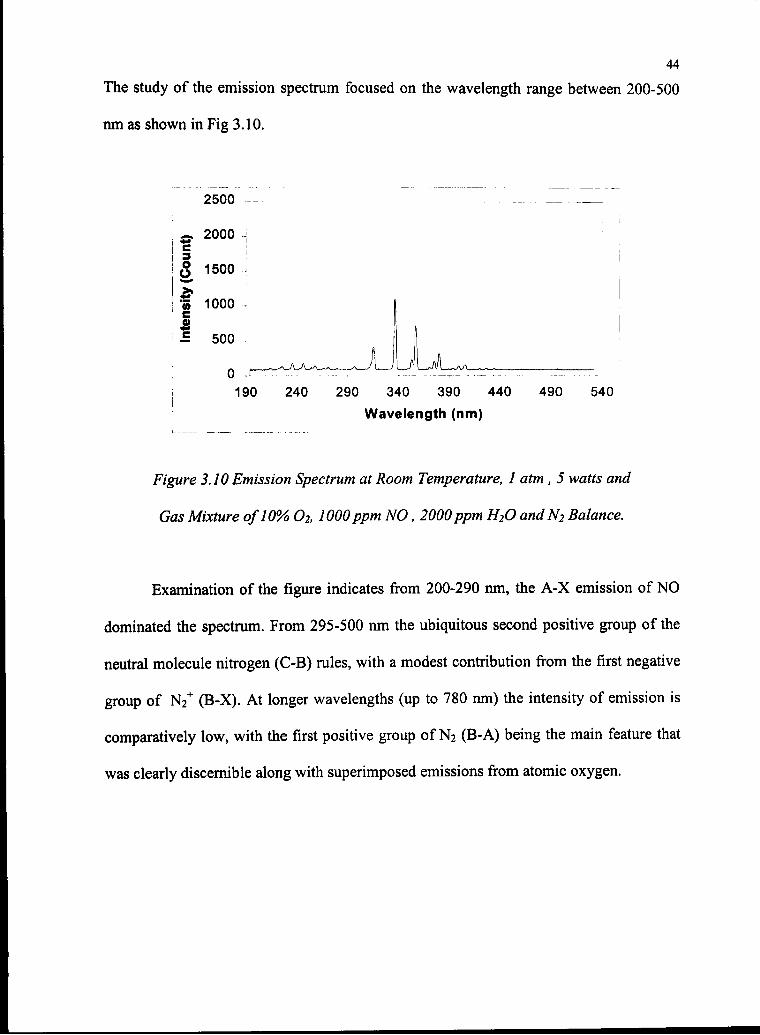
44
The study of the emission spectrum focused on the wavelength range between 200-500
nm as shown in Fig 3.10.
2500
nt)
(Coui
isity 1
2000 1500 1000 500190 240 290 340 390 440 490 540
Wavelength (nm)
Figure 3.10 Emission Spectrum at Room Temperature, 1 atm , 5 watts and
Gas Mixture of10% O2, WOOppm NO, 2000ppm H2O andN2 Balance.
Examination of the figure indicates from 200-290 nm, the A-X emission of NO
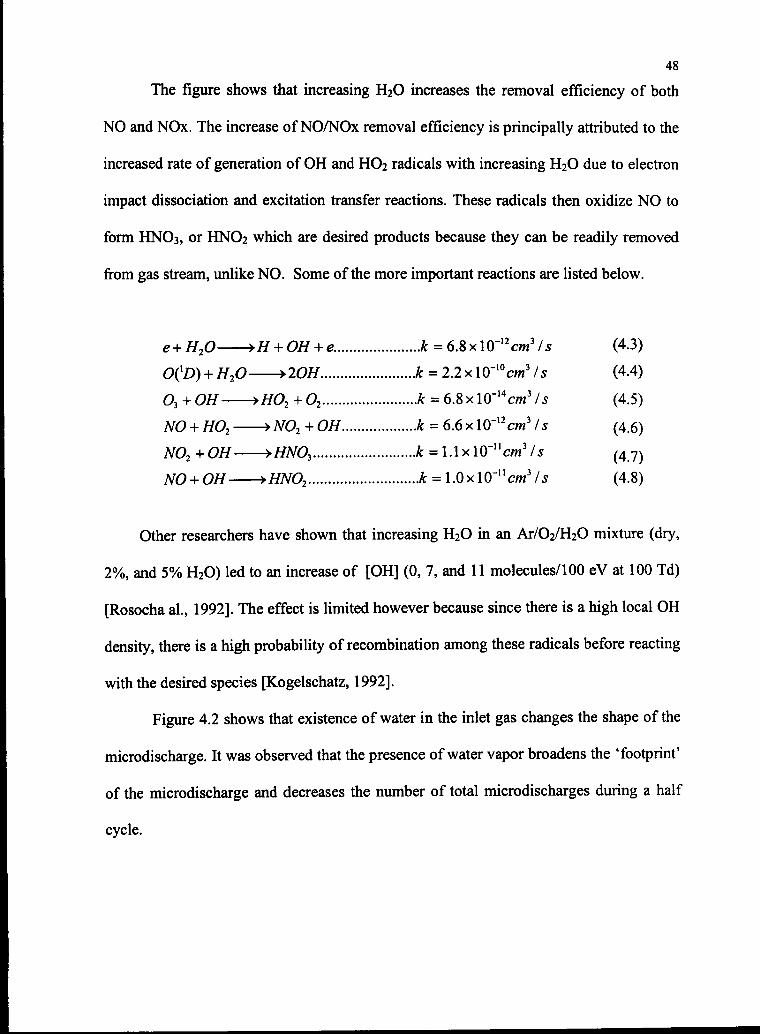
dominated the spectrum. From 295-500 nm the ubiquitous second positive group of the
neutral molecule nitrogen (C-B) rules, with a modest contribution from the first negative
group of N2+ (B-X). At longer wavelengths (up to 780 nm) the intensity of emission is
comparatively low, with the first positive group of N2 (B-A) being the main feature that
was clearly discernible along with superimposed emissions from atomic oxygen.
CHAPTER IV
RESULTS AND DISCUSSION
Non-thermal plasma discharge is a very complex physical and chemical process.
Many variables could affect the results of NOx removal. One of our objectives is to
determine the factors affecting performance and to understand what they mean in terms
of NOx removal efficiency. Understanding the important process variables is necessary
for process optimization that will help make its application viable. The variables studied
investigated include physical and chemical parameters, such as gas composition, gap
spacing, photochemistry and power input.
The rest of this chapter is organized as follows. The first of the following three
sections covers several factors that affect the performance of the NTPD process. The
second section summarizes the factors affecting performance and gives the optimal
results. Finally, in the third section the NOx destruction mechanism is discussed and a
numerical model is proposed.
In order to quantify the performance of the NTPD process, process efficiency
must be defined. Nitrogen oxide removal efficiency is typically measured in terms of the
NO and NOx destruction occurring through the discharge. NO removal represents the
amount of nitric oxide in the inlet gas that is converted to some other compound.
45
46
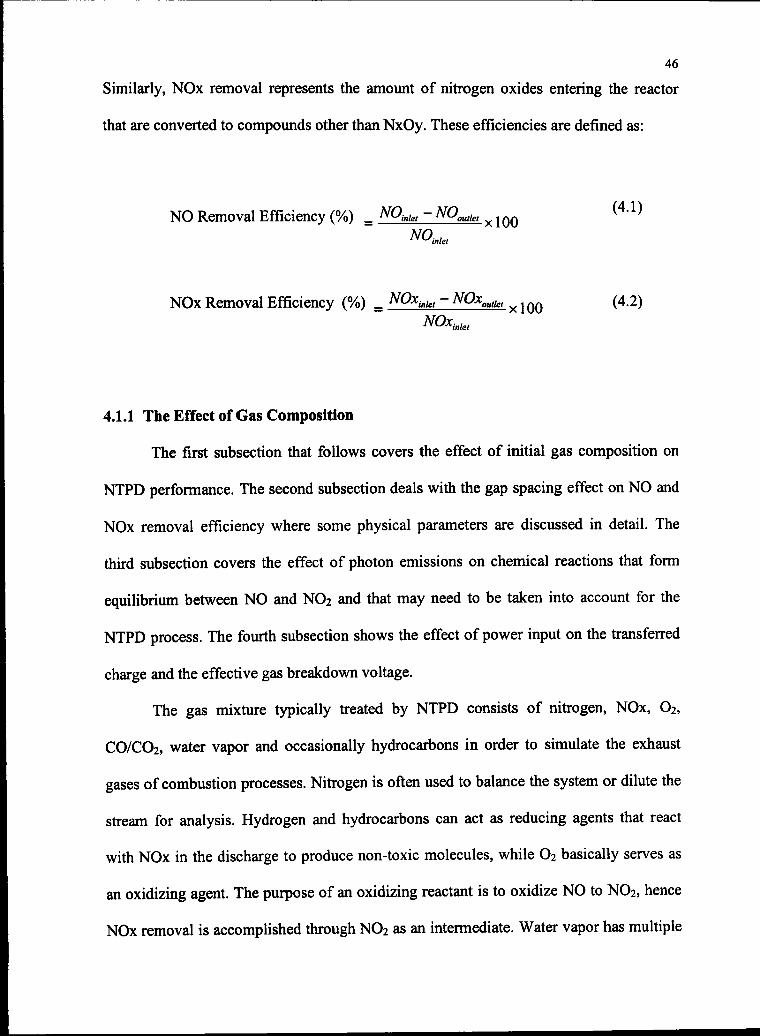
Similarly, NOx removal represents the amount of nitrogen oxides entering the reactor
that are converted to compounds other than NxOy. These efficiencies are defined as:
NO Removal Efficiency (%) = NOMet -NOoullel x{QQ (4-!)o
NOx Removal Efficiency (%) = NOxinlet - NOxoutlet ^m (4.2)
NOxinlet
4.1.1 The Effect of Gas Composition
The first subsection that follows covers the effect of initial gas composition on
NTPD performance. The second subsection deals with the gap spacing effect on NO and
NOx removal efficiency where some physical parameters are discussed in detail. The
third subsection covers the effect of photon emissions on chemical reactions that form
equilibrium between NO and NO2 and that may need to be taken into account for the
NTPD process. The fourth subsection shows the effect of power input on the transferred
charge and the effective gas breakdown voltage.
The gas mixture typically treated by NTPD consists of nitrogen, NOx, O2,
CO/CO2, water vapor and occasionally hydrocarbons in order to simulate the exhaust
gases of combustion processes. Nitrogen is often used to balance the system or dilute the
stream for analysis. Hydrogen and hydrocarbons can act as reducing agents that react
with NOx in the discharge to produce non-toxic molecules, while O2 basically serves as
an oxidizing agent. The purpose of an oxidizing reactant is to oxidize NO to NO2, hence
NOx removal is accomplished through NO2 as an intermediate. Water vapor has multiple
47
functions. It provides OH or OH2 during the discharge process and reacts with NO and
NO2 to produce HNO3 and HNO2, which are easily removed from the gas flow by
condensing them at room temperature with a scrubber. Radicals from processed
hydrocarbons reduce NOx or its intermediate species to stable products, however some
secondary pollutants are potentially created. Although controversial, hydrocarbon
injection can dramatically decrease the power consumption. The following discussion
details the composition investigations.
4.1.1.1 Water
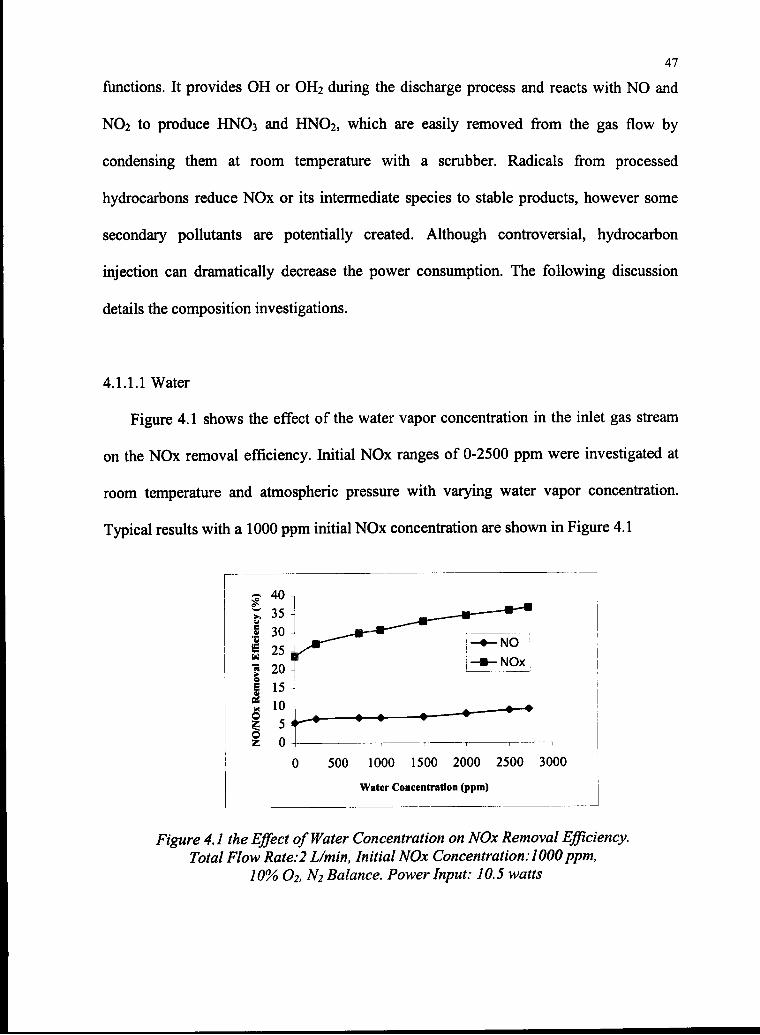
Figure 4.1 shows the effect of the water vapor concentration in the inlet gas stream
on the NOx removal efficiency. Initial NOx ranges of 0-2500 ppm were investigated at
room temperature and atmospheric pressure with varying water vapor concentration.
Typical results with a 1000 ppm initial NOx concentration are shown in Figure 4.1
500 1000 1500 2000 2500 3000
Water Concentration (ppm)
Figure 4.1 the Effect of Water Concentration on NOx Removal Efficiency.
Total Flow Rate:2 L/min, Initial NOx Concentration:1000ppm,
10% O2, N2 Balance. Power Input: 10.5 watts
48
The figure shows that increasing H2O increases the removal efficiency of both
NO and NOx. The increase of NO/NOx removal efficiency is principally attributed to the
increased rate of generation of OH and HO2 radicals with increasing H2O due to electron
impact dissociation and excitation transfer reactions. These radicals then oxidize NO to
form HNO3, or HNO2 which are desired products because they can be readily removed
from gas stream, unlike NO. Some of the more important reactions are listed below.
e + H20 >H + 0H + e k = 6.8 x 10"'W Is (4.3)
O(D) + H2O >2OH k = 2.2 x 10'1(W Is (4.4)
O3 + OH >HO2 + O2 k = 6.8 x 10"1W Is (4.5)
NO + H02 >N02 + OH k = 6.6 x 10"1W Is (4.6)
N02 + OH >HNOl k = 1.1 x 10""cm3 Is (4 7)
NO + OH >HNO2 ^ = 1.0xl0'ucm3/5 (4.8)
Other researchers have shown that increasing H2O in an Ar/O2/H2O mixture (dry,
2%, and 5% H2O) led to an increase of [OH] (0, 7, and 11 molecules/100 eV at 100 Td)
[Rosocha al., 1992]. The effect is limited however because since there is a high local OH
density, there is a high probability of recombination among these radicals before reacting
with the desired species [Kogelschatz, 1992].
Figure 4.2 shows that existence of water in the inlet gas changes the shape of the
microdischarge. It was observed that the presence of water vapor broadens the 'footprint'
of the microdischarge and decreases the number of total microdischarges during a half
cycle.
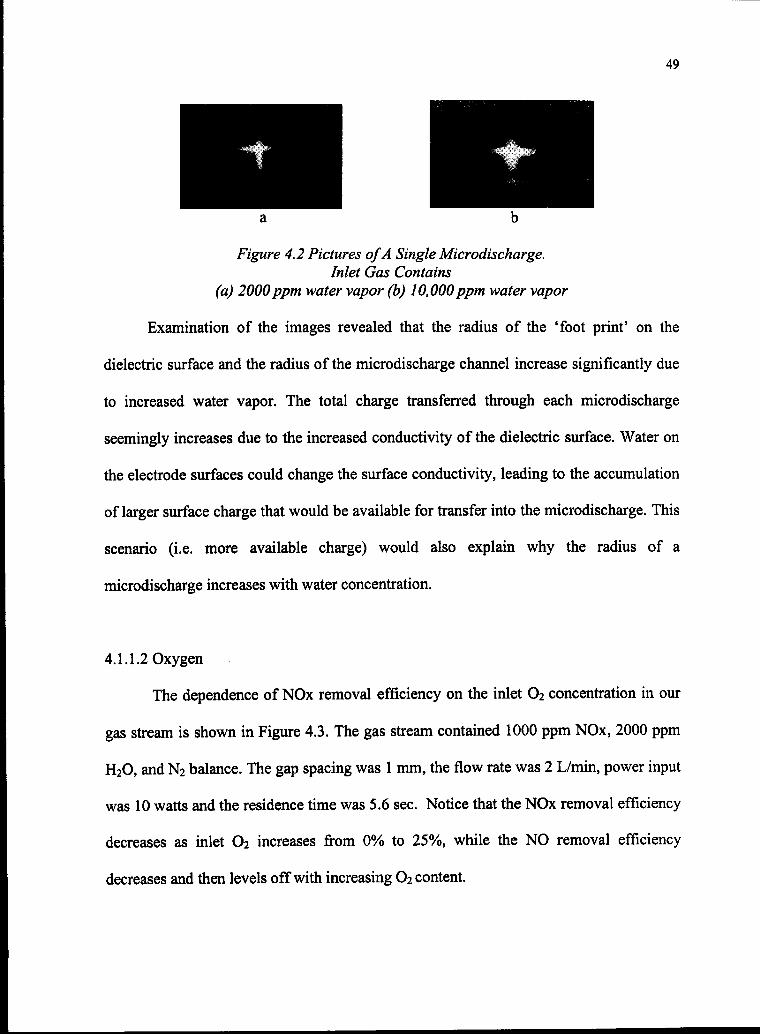
49
Figure 4.2 Pictures ofA Single Microdischarge.
Inlet Gas Contains
(a) 2000ppm water vapor (b) 10,000ppm water vapor
Examination of the images revealed that the radius of the 'foot print' on the
dielectric surface and the radius of the microdischarge channel increase significantly due
to increased water vapor. The total charge transferred through each microdischarge
seemingly increases due to the increased conductivity of the dielectric surface. Water on
the electrode surfaces could change the surface conductivity, leading to the accumulation
of larger surface charge that would be available for transfer into the microdischarge. This
scenario (i.e. more available charge) would also explain why the radius of a
microdischarge increases with water concentration.
4.1.1.2 Oxygen
The dependence of NOx removal efficiency on the inlet O2 concentration in our
gas stream is shown in Figure 4.3. The gas stream contained 1000 ppm NOx, 2000 ppm
H2O, and N2 balance. The gap spacing was 1 mm, the flow rate was 2 L/min, power input
was 10 watts and the residence time was 5.6 sec. Notice that the NOx removal efficiency
decreases as inlet O2 increases from 0% to 25%, while the NO removal efficiency
decreases and then levels off with increasing O2 content.
50
B
■a
|
i
50 i
45 |
40 ■
35 -
30 '25
20
15 -
10 -
5
0 -
c
, 1—•—NOx
■ NO
k ■—■ ■ •—•
^* <*-♦
5 10 15 20
O2 Cone.
Gap=1mm,T=22.4CFIow rate
_ -■
25
=2L/mfn
30
Figure 4.3 Dependence ofNOx Removal Efficiency on [O2].
The observed effect of oxygen content is not surprising since the presence of
oxygen in the gas entering the barrier discharge reactor significantly alters the reaction
pathways leading to the destruction of NOx. Without oxygen in the gas stream the
reactions are dominated by reduction processes and the products of the reactions are
primarily N2 and O2. With oxygen, oxidation reactions will be the dominant processes in
the removal ofNOx. Several of the important reactions are listed below.
N(2D)-
NO2+O
N2 + OCP) 2.2 x KT1W /*
N2+OCP) 1.8xl0"10cm3/5
O2 5.0x10"12c/m3/5
>NO2+O2 1.6 x 10"14 cm3 Is
(4.9)
(4.10)
(4.11)
(4.12)
In the absence of O2 in the inlet gas, one third of the NOx was removed from the
gas stream while nearly half of the NO was converted. Analysis showed that three
quarters of the NO were reduced directly to N2 and HNO2. The remaining NO was
51
converted to lower degree nitrogen oxides such as N2O. To clarify the NO reduction
pathway an experiment was performed with no water present. The result showed that
forty percent of the NO was still removed from the stream.
The NOx and NO removal efficiencies level off as the concentration of O2 is
increased to about 20% by volume for NOx and 5% by volume for NO. Increasing the
inlet concentration of O2 results in a higher rate of generation of both O and O3. From the
perspective of removing NO from the gas stream, O and O3 serve to oxidize NO to form
NO2, which can then be further oxidized by OH to form HNO3. The rate of generation of
OH also increases with increasing concentration of O2 (Equation. 4.4). Increasing the
concentration of O2 decreases the concentration of N (i.e. limit the reduction pathway)
due to reactions that form NOx. With the presence of O2, the NOx removal efficiency
heavily depends on the concentration of H2O because oxygen efficiently oxidizes H2O to
OH and NOx can be removed through the HNO2 and HNO3 pathways.
Optical studies found that the size of a microdischarge dramatically decreased
with increasing O2 concentration. The reason for the decrease for transferred charge (i.e.
the discharge size) with increasing oxygen content is the electron-negative character of
oxygen. With increasing oxygen concentration electron attachment increases and less
charge is transferred per microdischarge. In addition, the mean microdischarge decay
time was observed to decrease with increasing the oxygen content. Fig 4.4 shows that the
size of the microdischarge becomes very small in pure oxygen. No single microdischarge
could be discriminated and the brightness of the microdischarge was so weak that a
clear picture was only obtained at long exposure times. The total number of
microdischarges increased with the addition of oxygen, while the charge transferred per
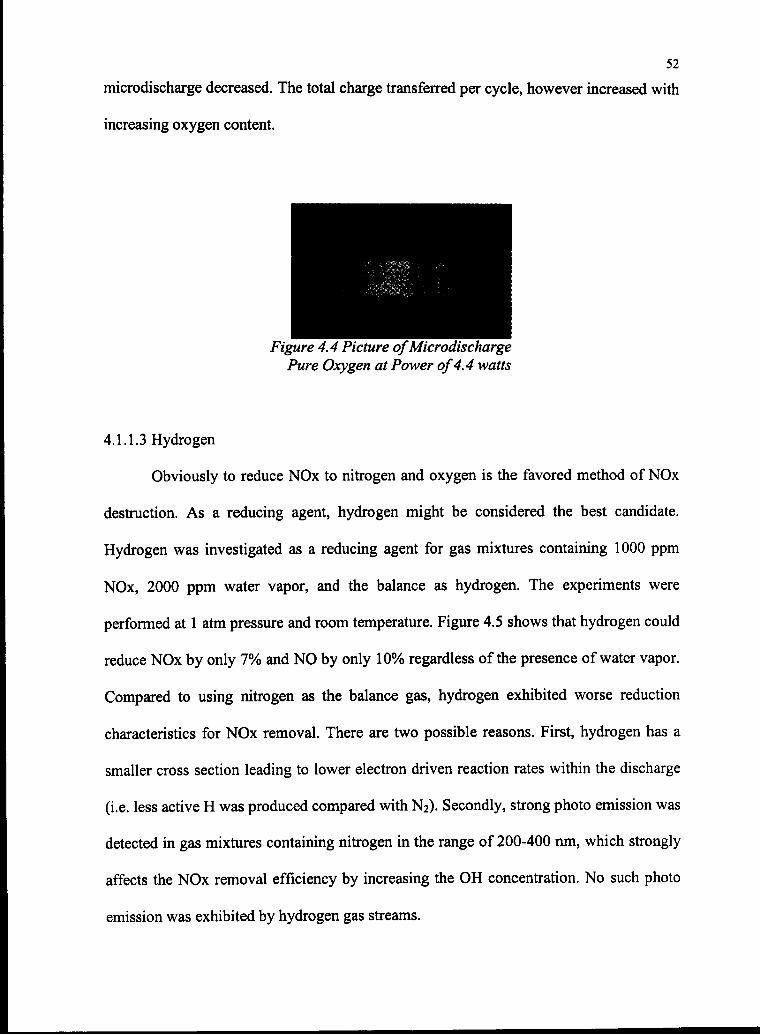
52
microdischarge decreased. The total charge transferred per cycle, however increased with
increasing oxygen content.
Figure 4.4 Picture ofMicrodischarge
Pure Oxygen at Power of4.4 watts
4.1.1.3 Hydrogen
Obviously to reduce NOx to nitrogen and oxygen is the favored method of NOx
destruction. As a reducing agent, hydrogen might be considered the best candidate.
Hydrogen was investigated as a reducing agent for gas mixtures containing 1000 ppm
NOx, 2000 ppm water vapor, and the balance as hydrogen. The experiments were
performed at 1 atm pressure and room temperature. Figure 4.5 shows that hydrogen could
reduce NOx by only 7% and NO by only 10% regardless of the presence of water vapor.
Compared to using nitrogen as the balance gas, hydrogen exhibited worse reduction
characteristics for NOx removal. There are two possible reasons. First, hydrogen has a
smaller cross section leading to lower electron driven reaction rates within the discharge
(i.e. less active H was produced compared with N2). Secondly, strong photo emission was
detected in gas mixtures containing nitrogen in the range of 200-400 nm, which strongly
affects the NOx removal efficiency by increasing the OH concentration. No such photo
emission was exhibited by hydrogen gas streams.
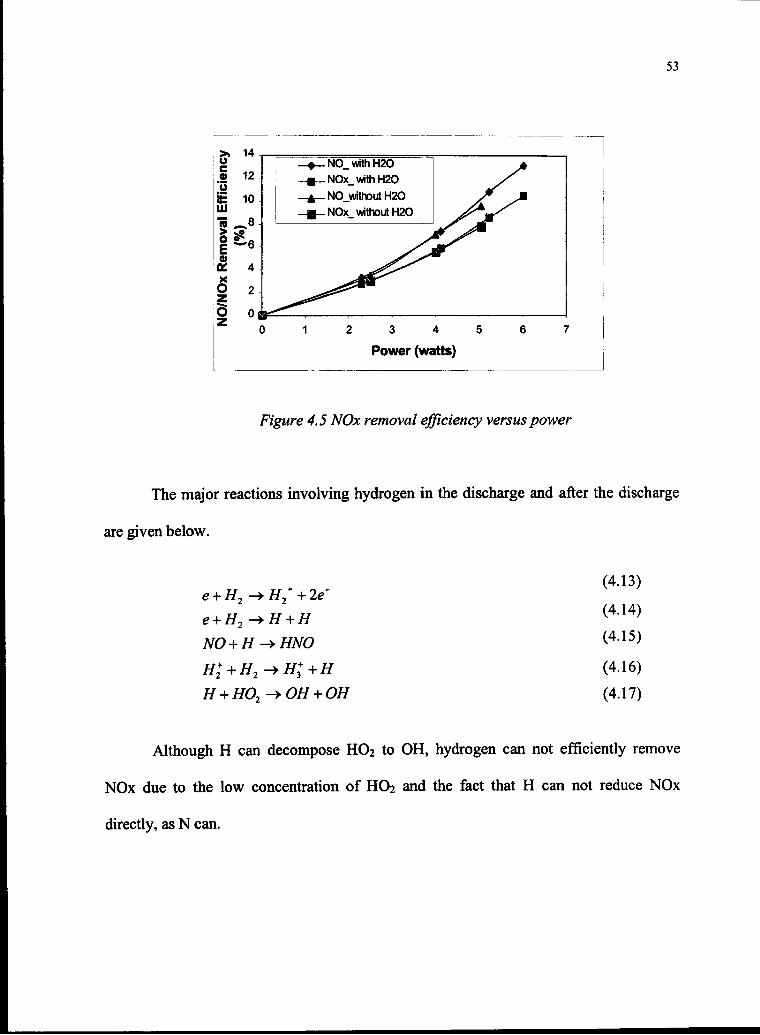
53
u
.1 12E 10Hi
6 25O 0|
—♦_NO_withH2O
HB-N0x_withH20
A NO_without H2O
_B-NOx_ without H2O As
2 3 4 5
Power (watts)
Figure 4.5 NOx removal efficiency versus power
The major reactions involving hydrogen in the discharge and after the discharge
are given below.
H2 ->#2+ +2e'
H^HNO
(4.13)
(4.14)
(4.15)
(4.16)
(4.17)
Although H can decompose HO2 to OH, hydrogen can not efficiently remove
NOx due to the low concentration of HO2 and the fact that H can not reduce NOx
directly, as N can.
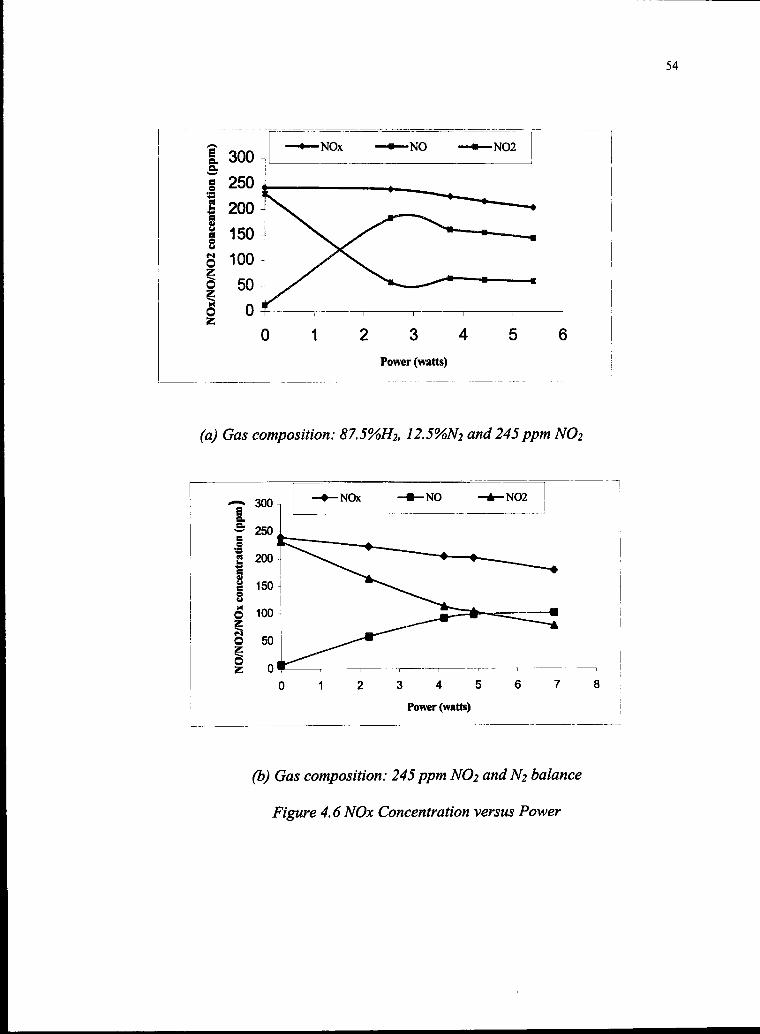
54
12 3 4
Power (watts)
(a) Gas composition: 87.5%H2, 12.5%N2 and 245ppm NO2
M
o
o
z
300 i—♦—NOx
250 i—-_200 T^v
150
100-
50
u
0 1 2
-•-NO -4
—^—*-
i i i
3 4 5
Power (watts)
i— NO2
—
' ■ .
6
-m
-4
7
1
8
(b) Gas composition: 245ppm NO2 andN2 balance
Figure 4.6 NOx Concentration versus Power
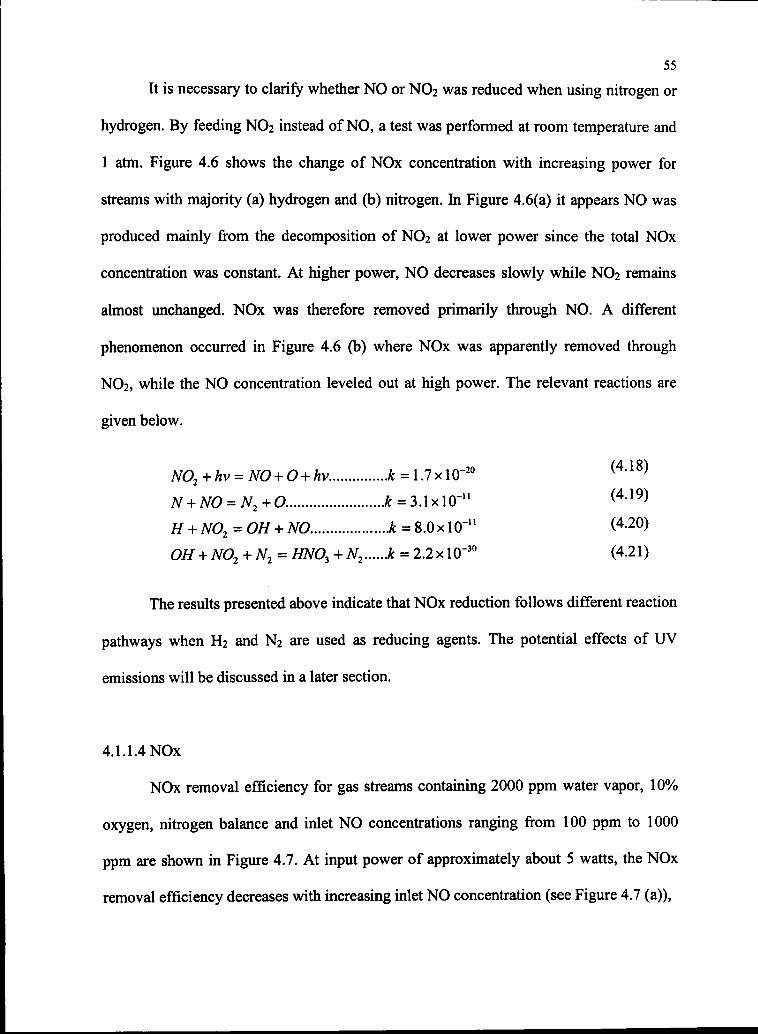
55
It is necessary to clarify whether NO or NO2 was reduced when using nitrogen or
hydrogen. By feeding NO2 instead of NO, a test was performed at room temperature and
1 atm. Figure 4.6 shows the change of NOx concentration with increasing power for
streams with majority (a) hydrogen and (b) nitrogen. In Figure 4.6(a) it appears NO was
produced mainly from the decomposition of NO2 at lower power since the total NOx
concentration was constant. At higher power, NO decreases slowly while NO2 remains
almost unchanged. NOx was therefore removed primarily through NO. A different
phenomenon occurred in Figure 4.6 (b) where NOx was apparently removed through
NO2, while the NO concentration leveled out at high power. The relevant reactions are
given below.
NO2+hv = NO + O + hv £ = 1.7xl(-20 V
(4.19)
H + NO2=OH + NO & = 8.0xl0-u (4-20)
OH + NO2 +N2= HNO3 + N2 k = 2.2 x 10"30 (4.21)
NO = N2+O
The results presented above indicate that NOx reduction follows different reaction
pathways when H2 and N2 are used as reducing agents. The potential effects of UV
emissions will be discussed in a later section.
4.1.1.4 NOx
NOx removal efficiency for gas streams containing 2000 ppm water vapor, 10%
oxygen, nitrogen balance and inlet NO concentrations ranging from 100 ppm to 1000
ppm are shown in Figure 4.7. At input power of approximately about 5 watts, the NOx
removal efficiency decreases with increasing inlet NO concentration (see Figure 4.7 (a)),
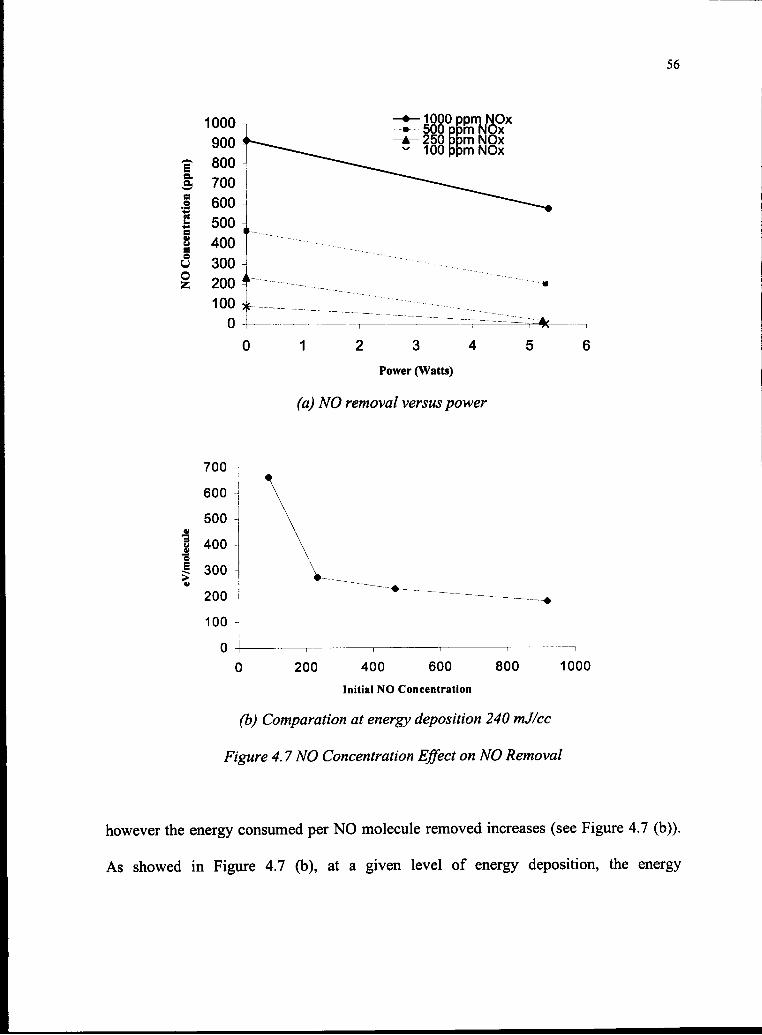
56
1000
900
12 3 4
Power (Watts)
(a) NO removal versus power
700
600
500
1 400
I 300 -I
200 -J
100
0
200 400 600
Initial NO Concentration
800 1000
(b) Comparation at energy deposition 240 mJ/cc
Figure 4.7 NO Concentration Effect on NO Removal
however the energy consumed per NO molecule removed increases (see Figure 4.7 (b)).
As showed in Figure 4.7 (b), at a given level of energy deposition, the energy
57
consumption in terms of eV per NO molecule removed decreases by 6 times when the
NO concentration increases from 100 ppm to lOOOppm.
In N2-O2-H2O-NOX mixtures, experimental results revealed that NOx was
removed through the chemical reaction pathways summarized as follows:
(R1)NO+N = N2+O
(R2)NO+O3 = NO2+O2
(R3) NO2+OH = HNO3
NOx removal was accomplished primarily through the reduction reaction (Rl) if
no O2 was present. Otherwise, reaction (R3) dominated the NOx removal. The reduction
reaction pathway for NOx removal was limited by a maximum efficiency of about 50%.
In this case, increasing the input power above a certain level would not significantly
improve the NOx removal efficiency. The presence of oxygen in the inlet gas can reduce
the energy consumption and lead to total NOx removal only if enough H2O is added. It
has been reported that the energy consumption was reduced from 175 eV per NOx to 50
ev per NOx molecule when the H2O concentration changed from 3% to 20% [Wolf et al.,
1996].
4.1.2 Gap Spacing
Gap spacing is one of the key variables for DDBD technologies. It determines the
breakdown voltage, the average electron energy, the DDBD reactor capacity and other
process variables. Since the breakdown voltage depends on the product of the gas density
and the gap spacing, most researches have concentrated on the effect of pressure (gas
density) due to the difficulty of changing gap spacing. There have been few clear reports
58
on the effects of gap spacing. In fact, the gap width and gas density have different effects
on the DDBD process.
Various measurements were made using the system described in the previous
chapter. The different measurements can be grouped into three categories: (1)
breakdown voltage, (2) NOX removal, and (3) microdischarge characteristics. The
breakdown voltage provided essential information regarding the electric field strength
under which the discharges occur. The NOX removal measurement, along with
measurements of the input power and gas flow rate, provided system level information
relating to the performance of each gap width. The optical measurements obtained by the
high-speed imager provided valuable qualitative information about the microdischarges.
Each of the measurements is discussed in detail below.
4.1.2.1. Breakdown Voltage
One of the most important physical characteristics of the microdischarge is the
breakdown voltage, Vb. As a rising voltage is applied to the gap, electron avalanches
begin propagating from the cathode toward the anode. Due to the high nd value, a
considerable space charge is generated during the first avalanche's first transit through
the gap. As voltage grows further, secondary processes such as the creation of electrons
by particles resulting from the primary process of electron impact ionization come into
play. Secondary processes affect amplification more strongly if they produce electron
emission from the cathode.
Most evidence seems to suggest that the silent discharge is best described by the
avalanche streamer or "Kanal" theory (Raether, 1964). The streamers (cylindrical current
filaments) are formed when initial electrons, driven by electric field ionization, reach a
59
critical local density at which the space charge electric field near an individual electron
avalanche head approaches the magnitude of the external applied electric field. Such
large space charge fields can be easily established by relatively immobile positive ions.
The propagation of the streamer is thought to be sustained by secondary avalanches,
which arise from the electrons supplied by photo ionization of the gas between the
discharge electrodes. The streamer growth eventually results in the complete bridging of
the anode-cathode gap with relatively homogeneous plasma. The microdischarges are
transient discharges, fed by ionization and detachment and then arrested when charge
build-up on the dielectric reduces the electric field in the streamer to the point where
electron attachment dominates ionization and detachment.
Raether's breakdown criterion is given by:
(a/p)pd = k+\nd (4.22)
where a designates the number of ionizing collisions, p is the gas pressure, k is a constant
characteristic of the particular gas, and d is the gap spacing. For flat electrodes with a
uniform field distribution, the coefficient of ionization increases with decreasing gap
width.
In Equation (4.22) a = Ap-exv(-Bp/E), where E is the electric field given by
E = vjd and A and B are constants which depend on the gas and the cathode material,
respectively. Thus a depends on the gas, the material of the cathode, the pressure, and
the discharge gap spacing. To arrive at explicit expressions, we substitute a and E into
Equation (4.22), to obtain
60
Bpd
ln(4/w/)ln(A: + ln</) '
In our case, the applied voltage, VA, at breakdown is, vA = F4 + 2F,, where Frf is the
voltage on the dielectrics. The dielectric voltage is Vd =Vb(cgm/Cdle) so in terms of the
dielectric constant of the dielectric material Equation (4.18) becomes:
(h)V = V Kd) (4.24)A \nApd-ln(k + \d)
where, t is the thickness of the dielectric and K is its dielectric constant. Taking (k+lnd)
and/? to be constant, we can write
= hifL±^i (4.25)" tad + C,
where C, = 5p
c =2^p
C 2 = \n[ Ap /( * + In d )]
The experimental breakdown (or Paschen) curves along with a numerical fit of
Equation (4.25) to the experimental data are plotted in Figure 4.8. The constants for the
fit were found to be Ci = 12339.6 volts/mm, C2 = 9254.7 volts, and C3 = 4.1.
As shown in Figure 4.8, the experimental values for the breakdown voltage are fit
well by the functional form predicted by the theoretical considerations (i.e. Equation
4.20). The breakdown voltage can be used to establish the electric field for the
microdischarges through the relation Eb =
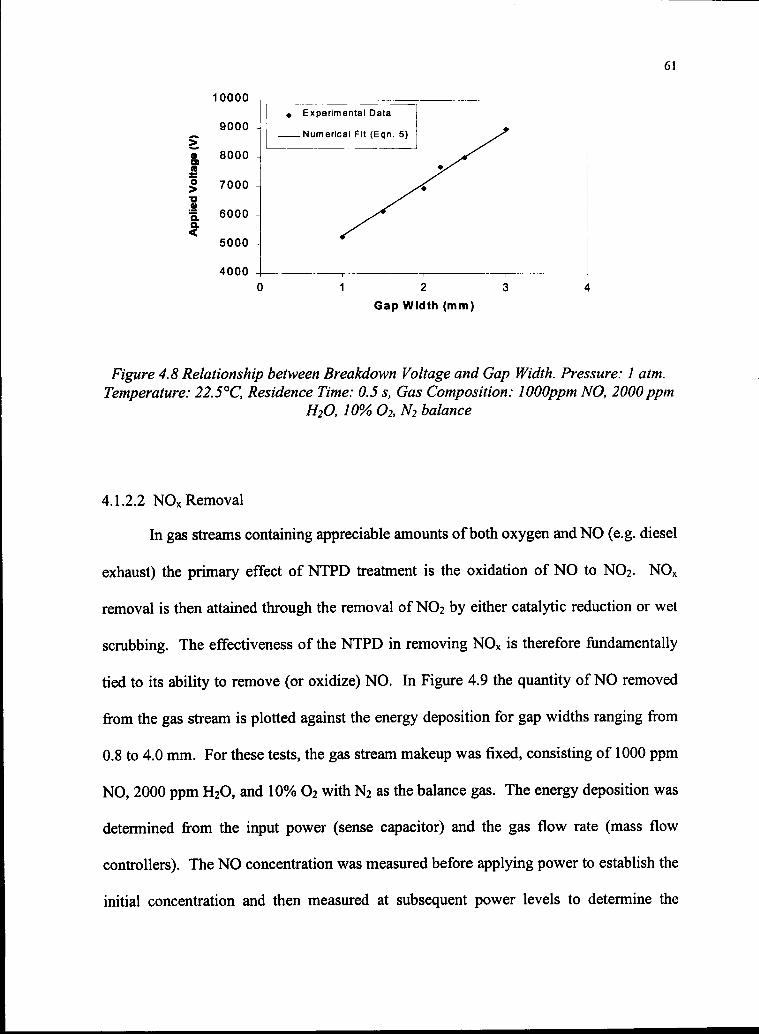
61
>
1
10000
9000
8000
7000 -
6000
5000
4000
Experimental Data
.Numerical Fit (Eqn. 5)
Gap Width (mm)
Figure 4.8 Relationship between Breakdown Voltage and Gap Width. Pressure: 1 atm.
Temperature: 22.5°C, Residence Time: 0.5 s, Gas Composition: lOOOppm NO, 2000ppm
H2O, 10% O2, N2 balance
4.1.2.2 NOX Removal
In gas streams containing appreciable amounts ofboth oxygen and NO (e.g. diesel
exhaust) the primary effect of NTPD treatment is the oxidation of NO to NO2. NOX
removal is then attained through the removal of NO2 by either catalytic reduction or wet
scrubbing. The effectiveness of the NTPD in removing NOX is therefore fundamentally
tied to its ability to remove (or oxidize) NO. In Figure 4.9 the quantity of NO removed
from the gas stream is plotted against the energy deposition for gap widths ranging from
0.8 to 4.0 mm. For these tests, the gas stream makeup was fixed, consisting of 1000 ppm
NO, 2000 ppm H2O, and 10% O2 with N2 as the balance gas. The energy deposition was
determined from the input power (sense capacitor) and the gas flow rate (mass flow
controllers). The NO concentration was measured before applying power to establish the
initial concentration and then measured at subsequent power levels to determine the
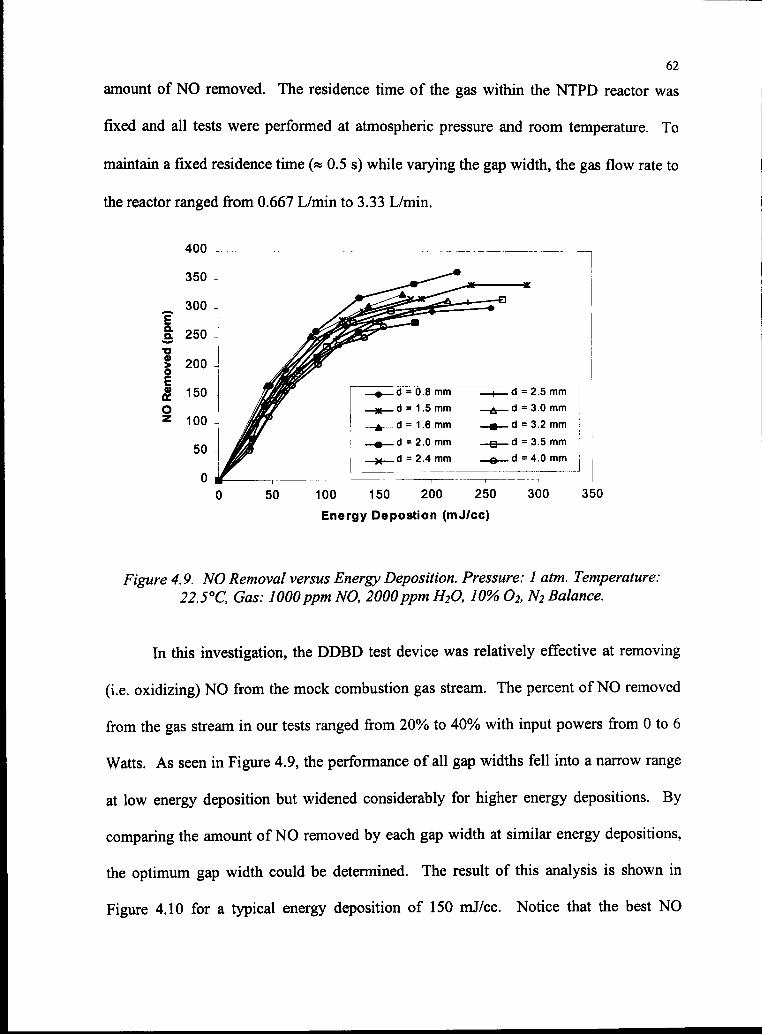
62
amount of NO removed. The residence time of the gas within the NTPD reactor was
fixed and all tests were performed at atmospheric pressure and room temperature. To
maintain a fixed residence time (« 0.5 s) while varying the gap width, the gas flow rate to
the reactor ranged from 0.667 L/min to 3.33 L/min.
50
0 d
~3K— d
-A d
1
100
Energy
m d
-*-d
150
= 1.5 mm £_
= 1.6 mm a_
= 2.0 mm _b_
= 2.4 mm e-
200 250
Depostion (mJ/cc)
_d = 2.5
_d = 3.0
_d = 3.2
_d = 3.5
_d =4.0
300
mm
mm
mm
mm
mm
350
Figure 4.9. NO Removal versus Energy Deposition. Pressure: 1 atm. Temperature:
22.5°C, Gas: 1000ppm NO, 2000ppm H2O, 10% O2, N2 Balance.
In this investigation, the DDBD test device was relatively effective at removing
(i.e. oxidizing) NO from the mock combustion gas stream. The percent of NO removed
from the gas stream in our tests ranged from 20% to 40% with input powers from 0 to 6
Watts. As seen in Figure 4.9, the performance of all gap widths fell into a narrow range
at low energy deposition but widened considerably for higher energy depositions. By
comparing the amount of NO removed by each gap width at similar energy depositions,
the optimum gap width could be determined. The result of this analysis is shown in
Figure 4.10 for a typical energy deposition of 150 mJ/cc. Notice that the best NO
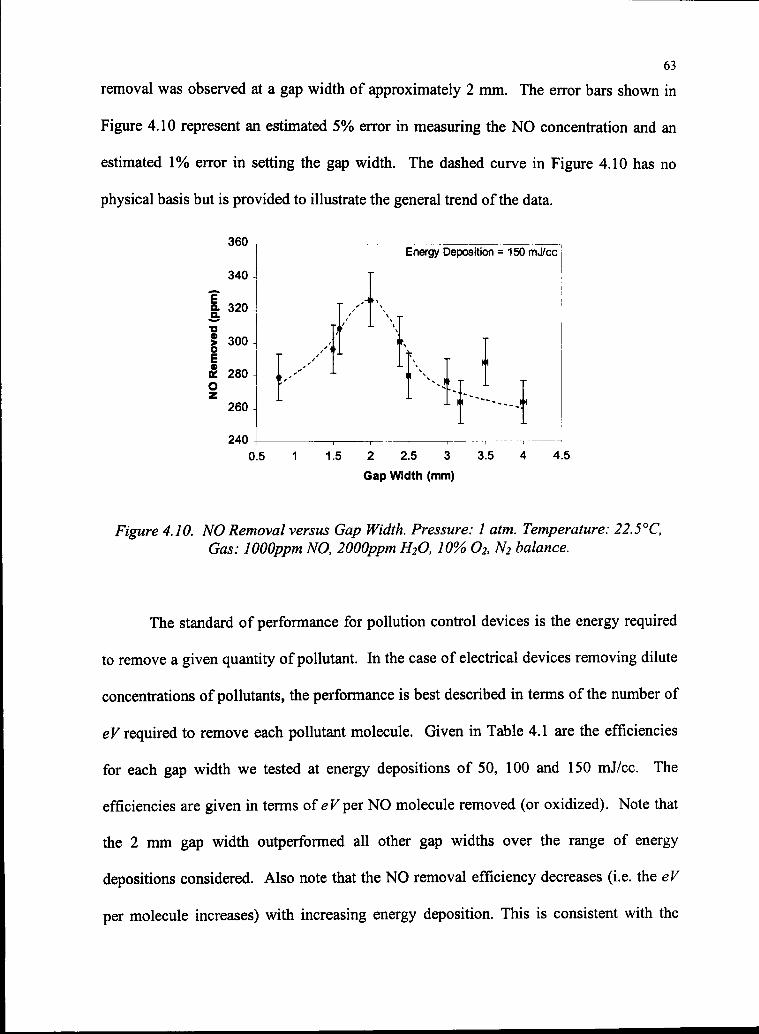
63
removal was observed at a gap width of approximately 2 mm. The error bars shown in
Figure 4.10 represent an estimated 5% error in measuring the NO concentration and an
estimated 1% error in setting the gap width. The dashed curve in Figure 4.10 has no
physical basis but is provided to illustrate the general trend of the data.
340
1 32°| 300-
& 280oz
260 -
240 -
<
/ i
/
T sA
/ >■
Energy Deposition = 150 mJ/cc
1 ii ~"----j
0.5 1 1.5 2 2.5 3 3.5 4 4.5
Gap Width (mm)
Figure 4.10. NO Removal versus Gap Width. Pressure: 1 atm. Temperature: 22.5°C,
Gas: WOOppm NO, 2000ppm H2O, 10% O2, N2 balance.
The standard of performance for pollution control devices is the energy required
to remove a given quantity of pollutant. In the case of electrical devices removing dilute
concentrations of pollutants, the performance is best described in terms of the number of
eV required to remove each pollutant molecule. Given in Table 4.1 are the efficiencies
for each gap width we tested at energy depositions of 50, 100 and 150 mJ/cc. The
efficiencies are given in terms of eFper NO molecule removed (or oxidized). Note that
the 2 mm gap width outperformed all other gap widths over the range of energy
depositions considered. Also note that the NO removal efficiency decreases (i.e. the eV
per molecule increases) with increasing energy deposition. This is consistent with the
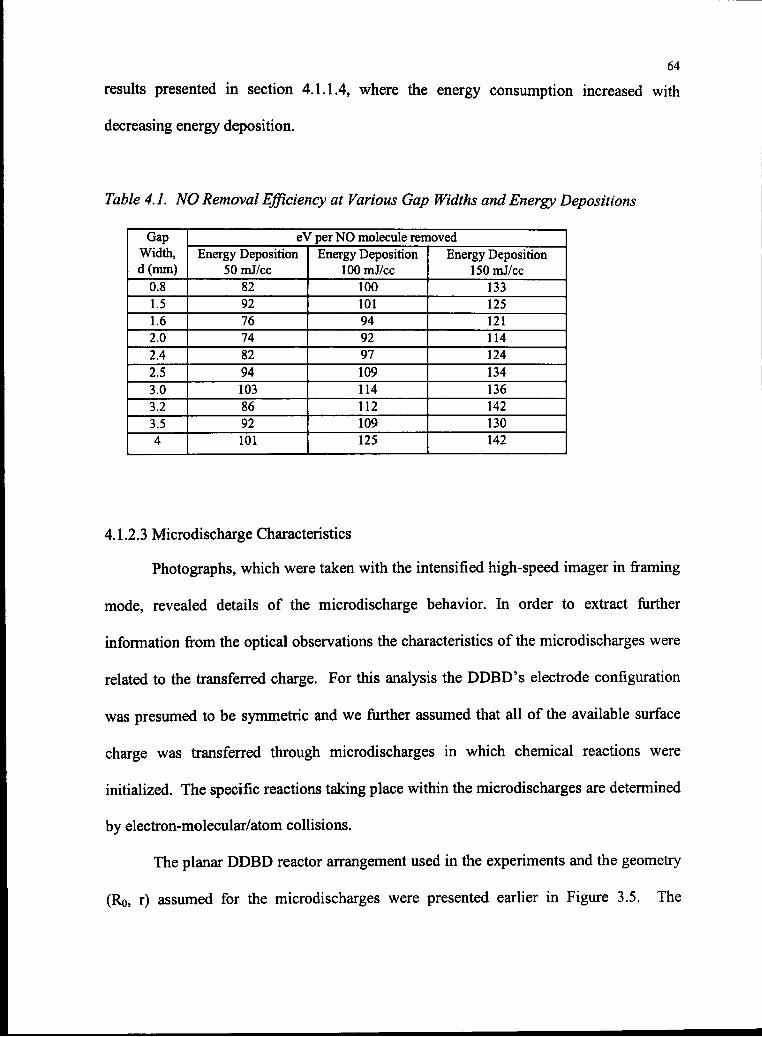
64
results presented in section 4.1.1.4, where the energy consumption increased with
decreasing energy deposition.
Table 4.1. NO Removal Efficiency at Various Gap Widths and Energy Depositions
Gap
Width,
d(mm)
0.8
1.5
1.6
2.0
2.4
2.5
3.0
3.2
3.5
4
eV per NO molecule removed
Energy Deposition
50 mJ/cc
82
92
76
74
82
94
103
86
92
101
Energy Deposition
lOOmJ/cc
100
101
94
92
97
109
114
112
109
125
Energy Deposition
150mJ/cc
133
125
121
114
124
134
136
142
130
142
4.1.2.3 Microdischarge Characteristics
Photographs, which were taken with the intensified high-speed imager in framing
mode, revealed details of the microdischarge behavior. In order to extract further
information from the optical observations the characteristics of the microdischarges were
related to the transferred charge. For this analysis the DDBD's electrode configuration
was presumed to be symmetric and we further assumed that all of the available surface
charge was transferred through microdischarges in which chemical reactions were
initialized. The specific reactions taking place within the microdischarges are determined
by electron-molecular/atom collisions.
The planar DDBD reactor arrangement used in the experiments and the geometry
(Ro, r) assumed for the microdischarges were presented earlier in Figure 3.5. The
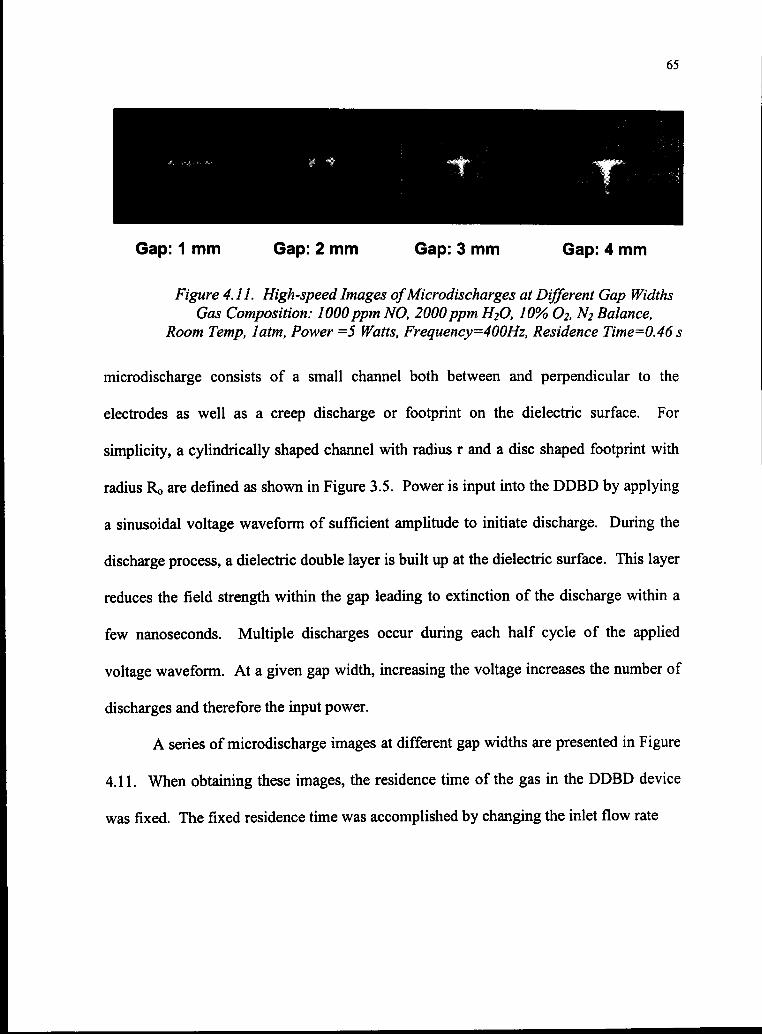
65
Gap: 1 mm Gap: 2 mm Gap: 3 mm Gap: 4 mm
Figure 4.11. High-speed Images ofMicrodischarges at Different Gap Widths
Gas Composition: WOOppm NO, 2000ppm H20, 10% 02, N2 Balance,
Room Temp, latm, Power =5 Watts, Frequency=400Hz, Residence Time=0.46s
microdischarge consists of a small channel both between and perpendicular to the
electrodes as well as a creep discharge or footprint on the dielectric surface. For
simplicity, a cylindrically shaped channel with radius r and a disc shaped footprint with
radius R<> are defined as shown in Figure 3.5. Power is input into the DDBD by applying
a sinusoidal voltage waveform of sufficient amplitude to initiate discharge. During the
discharge process, a dielectric double layer is built up at the dielectric surface. This layer
reduces the field strength within the gap leading to extinction of the discharge within a
few nanoseconds. Multiple discharges occur during each half cycle of the applied
voltage waveform. At a given gap width, increasing the voltage increases the number of
discharges and therefore the input power.
A series of microdischarge images at different gap widths are presented in Figure
4.11. When obtaining these images, the residence time of the gas in the DDBD device
was fixed. The fixed residence time was accomplished by changing the inlet flow rate
66
when changing the gap spacing. The input power, driving frequency, and flow
temperature were also fixed in each case, as was the gas mixture.
The specific conditions under which the images in Figure 4.11 were obtained are
given in the figure caption. Notice that with increasing gap spacing the radius, r, of the
discharge increased significantly, while the number of discharges per half cycle
dramatically decreased. The radius was found to vary from approximately 90 ^m at the 1
mm gap width to 340 um at the 4 mm gap width. The frame rate for these images was
1000 fps and the gate time was varied from 20 to 200 \is to obtain the clearest image.
In addition to affecting the radius of the microdischarge channel, the gap width
significantly affected the footprint of the discharge. The radius of the footprint, Ro,
increased with gap width even more markedly than the channel radius. The footprint
radius was approximately 100 um at lmm gap width while it grew to 1700 \\xa at the 4
mm gap width. The footprint extended only slightly beyond the channel at the smaller
gap width but was many times the channel radius at larger widths. Despite being
significantly affected by the gap width, both the channel radius and the footprint radius
were largely unaffected by variations in the input power.
The other major effect observed when varying the gap width was the number of
discharges. As the gap width was decreased the number of discharges increased
significantly. By taking high-speed photographs of the discharges through the glass and
aluminum mesh, it was possible to estimate the number of discharges per half cycle for
each gap width. At an input power of 5 Watts, we estimate that there were approximately
7000 discharges per half cycle for the 1 mm gap width while for a gap width of 4 mm the
number of discharges was only 400 per half cycle. Since the input power was fixed, the
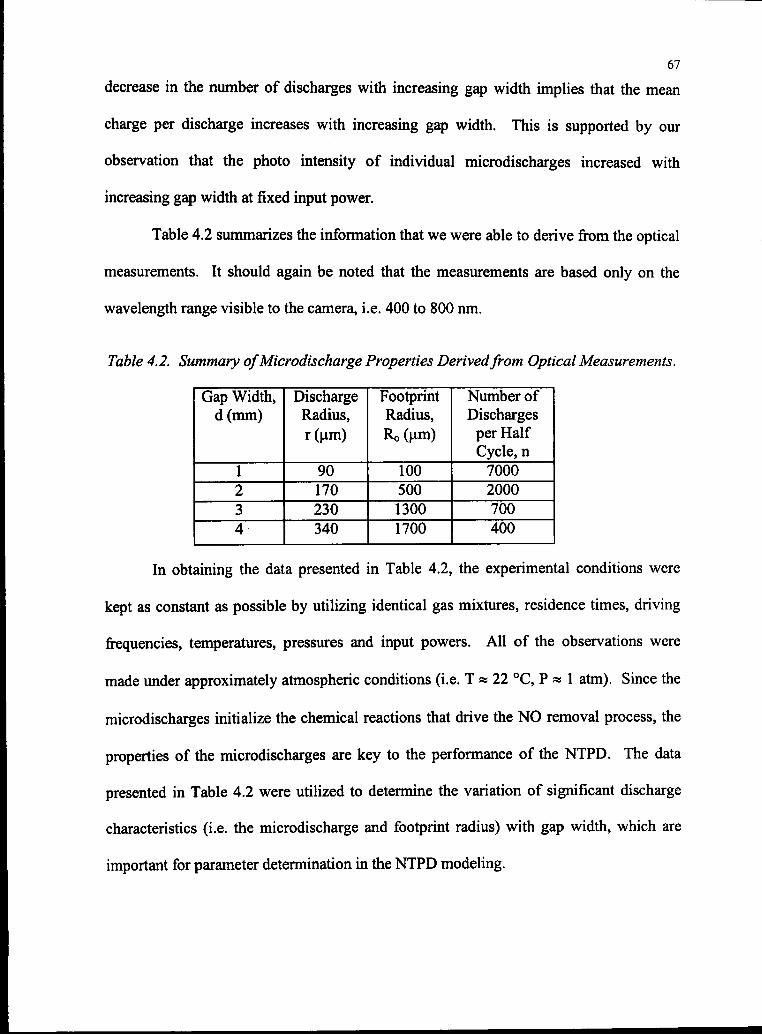
67
decrease in the number of discharges with increasing gap width implies that the mean
charge per discharge increases with increasing gap width. This is supported by our
observation that the photo intensity of individual microdischarges increased with
increasing gap width at fixed input power.
Table 4.2 summarizes the information that we were able to derive from the optical
measurements. It should again be noted that the measurements are based only on the
wavelength range visible to the camera, i.e. 400 to 800 ran.
Table 4.2. Summary ofMicrodischarge Properties Derivedfrom Optical Measurements.
Gap Width,
d(mm)
1
2
3
4
Discharge
Radius,
r(|am)
90
170
230
340
Footprint
Radius,
Ro(um)
100
500
1300
1700
Number of
Discharges
per Half
Cycle, n
7000
2000
700
400
In obtaining the data presented in Table 4.2, the experimental conditions were
kept as constant as possible by utilizing identical gas mixtures, residence times, driving
frequencies, temperatures, pressures and input powers. All of the observations were
made under approximately atmospheric conditions (i.e. T « 22 °C, P«l atm). Since the
microdischarges initialize the chemical reactions that drive the NO removal process, the
properties of the microdischarges are key to the performance of the NTPD. The data
presented in Table 4.2 were utilized to determine the variation of significant discharge
characteristics (i.e. the microdischarge and footprint radius) with gap width, which are
important for parameter determination in the NTPD modeling.
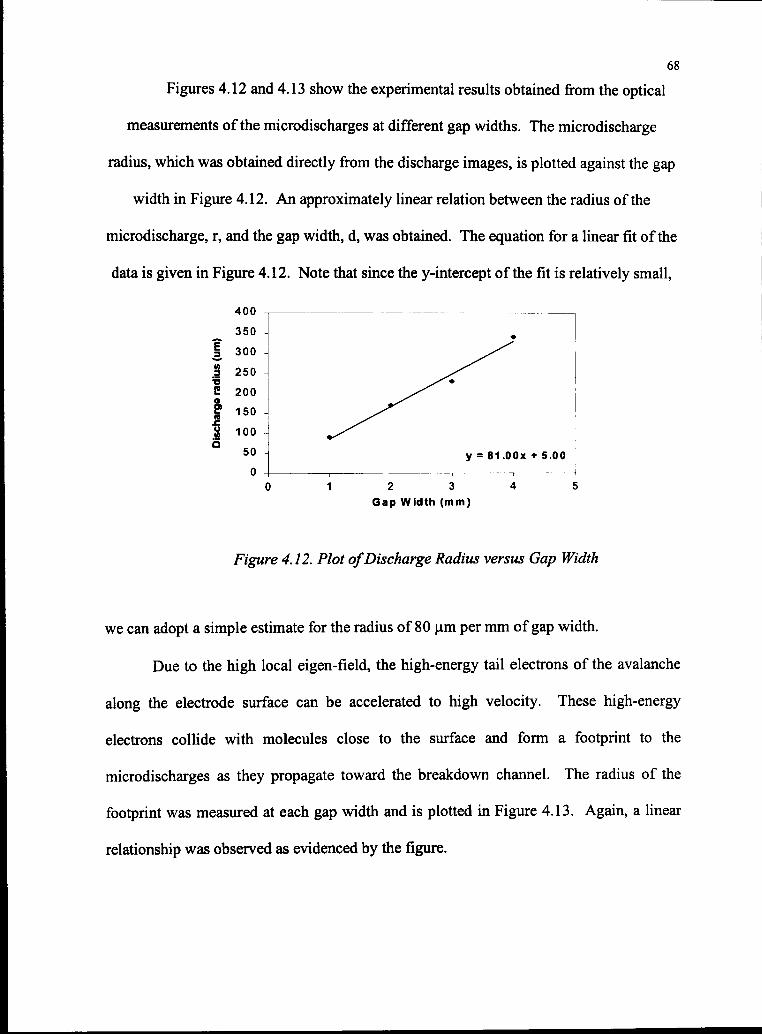
68
Figures 4.12 and 4.13 show the experimental results obtained from the optical
measurements of the microdischarges at different gap widths. The microdischarge
radius, which was obtained directly from the discharge images, is plotted against the gap
width in Figure 4.12. An approximately linear relation between the radius of the
microdischarge, r, and the gap width, d, was obtained. The equation for a linear fit ofthe
data is given in Figure 4.12. Note that since the y-intercept of the fit is relatively small,
350 -
1 300 -
a 250
E 200 -
b 150 -
8 100 -
° 50 -
0 -
*
^^^^
y = 81.00x + 5.00
2 3
Gap Width (mm)
Figure 4.12. Plot ofDischarge Radius versus Gap Width
we can adopt a simple estimate for the radius of 80 urn per mm of gap width.
Due to the high local eigen-field, the high-energy tail electrons of the avalanche
along the electrode surface can be accelerated to high velocity. These high-energy
electrons collide with molecules close to the surface and form a footprint to the
microdischarges as they propagate toward the breakdown channel. The radius of the
footprint was measured at each gap width and is plotted in Figure 4.13. Again, a linear
relationship was observed as evidenced by the figure.
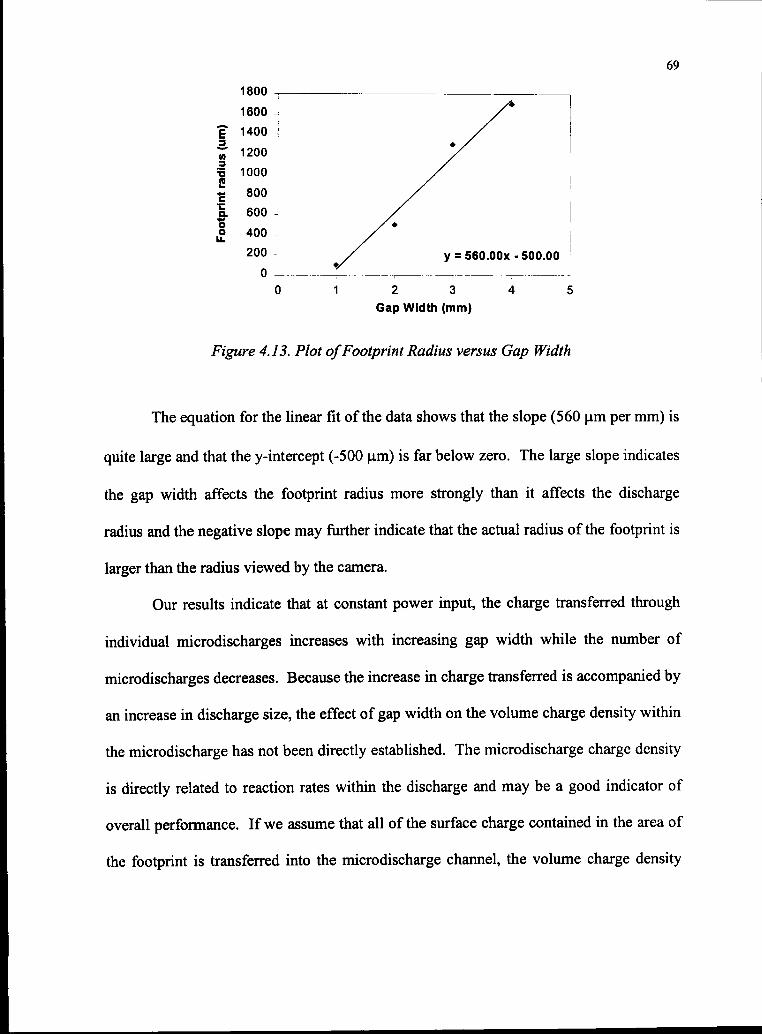
69
1800
y = 560.00x-500.00
42 3
Gap Width (mm)
Figure 4.13. Plot ofFootprint Radius versus Gap Width
The equation for the linear fit of the data shows that the slope (560 ^im per mm) is
quite large and that the y-intercept (-500 |4.m) is far below zero. The large slope indicates
the gap width affects the footprint radius more strongly than it affects the discharge
radius and the negative slope may further indicate that the actual radius of the footprint is
larger than the radius viewed by the camera.
Our results indicate that at constant power input, the charge transferred through
individual microdischarges increases with increasing gap width while the number of
microdischarges decreases. Because the increase in charge transferred is accompanied by
an increase in discharge size, the effect of gap width on the volume charge density within
the microdischarge has not been directly established. The microdischarge charge density
is directly related to reaction rates within the discharge and may be a good indicator of
overall performance. If we assume that all of the surface charge contained in the area of
the footprint is transferred into the microdischarge channel, the volume charge density
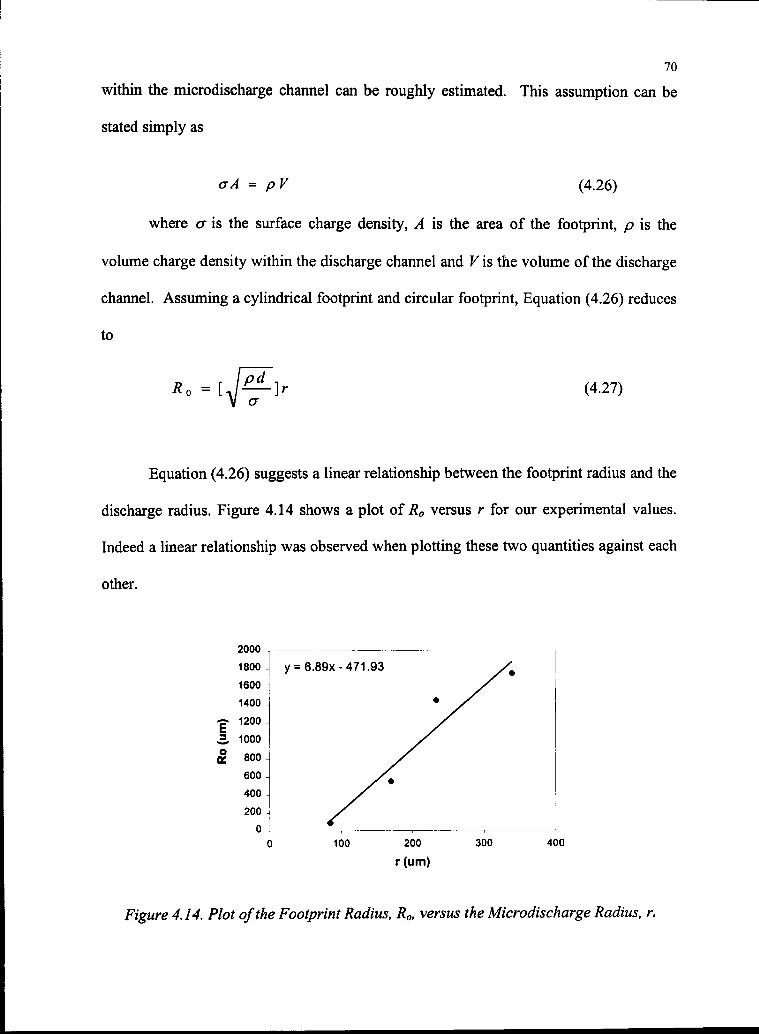
70
within the microdischarge channel can be roughly estimated. This assumption can be
stated simply as
trA = pV (4.26)
where a is the surface charge density, A is the area of the footprint, p is the
volume charge density within the discharge channel and V is the volume of the discharge
channel. Assuming a cylindrical footprint and circular footprint, Equation (4.26) reduces
to
/ nj
(4.27)
Equation (4.26) suggests a linear relationship between the footprint radius and the
discharge radius. Figure 4.14 shows a plot of Ro versus r for our experimental values.
Indeed a linear relationship was observed when plotting these two quantities against each
other.
2000
<=• 1200 -
3 1000
18OO-| y = 6.89x-471.93
400
Figure 4.14. Plot ofthe Footprint Radius, Ro, versus the Microdischarge Radius, r.
71
The equation for the linear fit to the data is given in Figure 4.14 and the slope
determined from this fit can be equated with the bracketed quantity in Equation (4.20) to
estimate the volume charge density of the microdischarges. To solve for the volume
charge density we must first specify the surface charge density. The surface charge
density at each gap width is directly related to measurable quantities and can be found
from the equation,
where Q,e is the capacitance of the dielectric, Vdie is the voltage on the dielectric
and Adie is the area of the dielectric. The equation for the volume charge density is thus
determined from the equation
p = k 2 C * V » (4.29)dA *
where k (= 6.89) is the slope of the Ro versus r curve. In Equation (4.23) only Vdie
is dependent on the gap width and has to be determined experimentally. Values for Vdie
were taken from the experimental values of the applied voltage and the breakdown
voltage (discussed in an earlier section) when the images were taken. The results of this
analysis are given in Table 4.3. In addition to the volume charge density, the
corresponding electron density is also given in Table 4.3. The estimated electron density
values are consistent with values suggested in the literature [Eliasson, 1991].
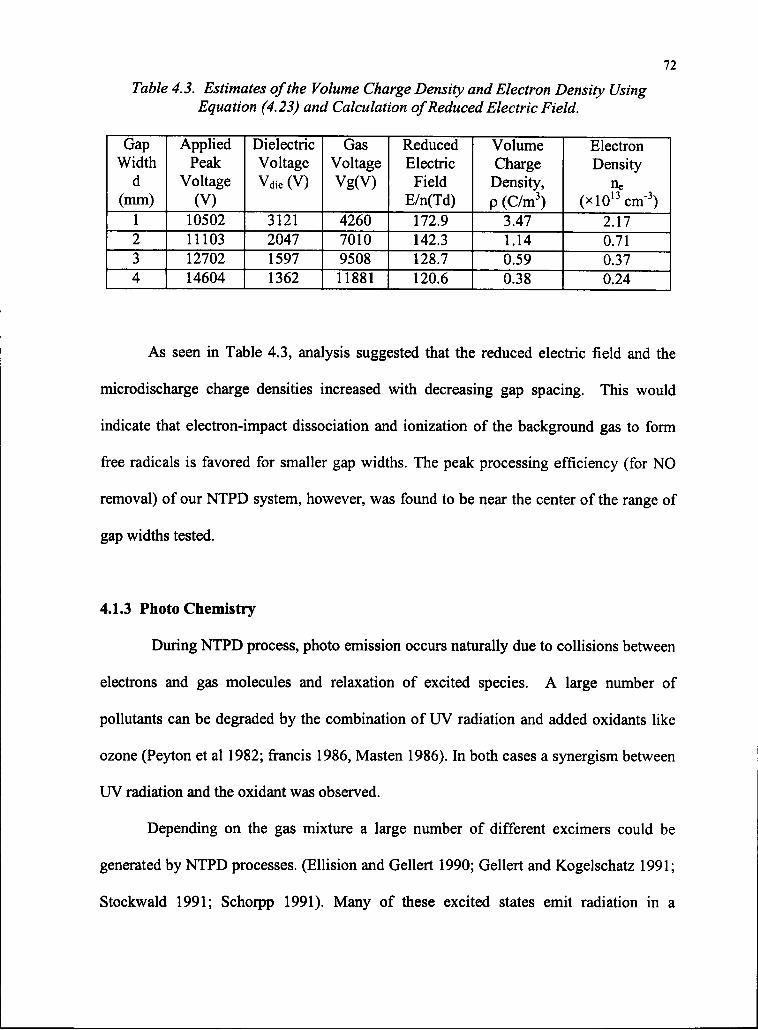
72
Table 4.3. Estimates ofthe Volume Charge Density and Electron Density Using
Equation (4.23) and Calculation ofReduced Electric Field.
Gap
Width
d
(mm)
1
2
3
4
Applied
Peak
Voltage
(V)
10502
11103
12702
14604
Dielectric
Voltage
Vdie(V)
3121
2047
1597
1362
Gas
Voltage
Vg(V)
4260
7010
9508
11881
Reduced
Electric
Field
E/n(Td)
172.9
142.3
128.7
120.6
Volume
Charge
Density,
p (C/m3)
3.47
1.14
0.59
0.38
Electron
Density
ne
(xlO13cm3)
2.17
0.71
0.37
0.24
As seen in Table 4.3, analysis suggested that the reduced electric field and the
microdischarge charge densities increased with decreasing gap spacing. This would
indicate that electron-impact dissociation and ionization of the background gas to form
free radicals is favored for smaller gap widths. The peak processing efficiency (for NO
removal) of our NTPD system, however, was found to be near the center of the range of
gap widths tested.
4.1.3 Photochemistry
During NTPD process, photo emission occurs naturally due to collisions between
electrons and gas molecules and relaxation of excited species. A large number of
pollutants can be degraded by the combination of UV radiation and added oxidants like
ozone (Peyton et al 1982; francis 1986, Masten 1986). In both cases a synergism between
UV radiation and the oxidant was observed.
Depending on the gas mixture a large number of different excimers could be
generated by NTPD processes. (Ellision and Gellert 1990; Gellert and Kogelschatz 1991;
Stockwald 1991; Schorpp 1991). Many of these excited states emit radiation in a
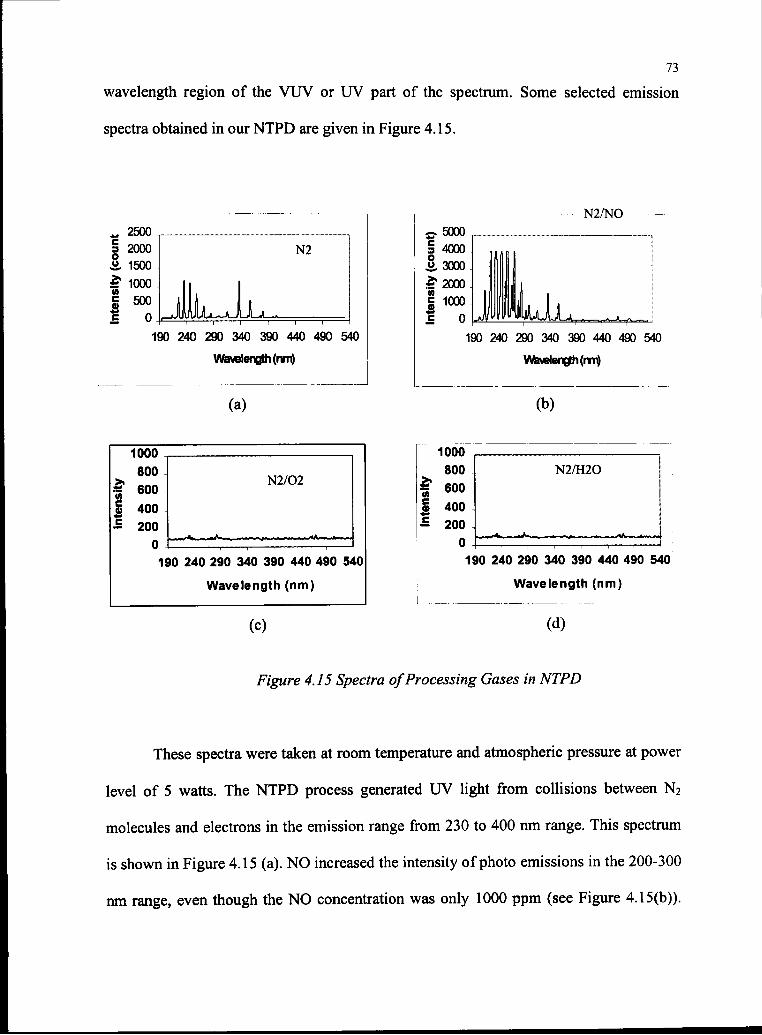
73
wavelength region of the VUV or UV part of the spectrum. Some selected emission
spectra obtained in our NTPD are given in Figure 4.15.
_ 2500
| 20001 1500.■i1 1000w
g 500J
I 0
N2
^-JIMJU^oJLLjl^.
190 240 290 340 390 440 490 540
Wavelength (nm)
(a)
1000
800
I* 600| 400
I 200
N2/O2
190 240 290 340 390 440 490 540
Wavelength (nm)
(c)
N2/N0
5-. 5000
§ 4000
8, 3000£2000
I 1000I 0 ULu
190 240 290 340 390 440 490 540
Wavelength (nm)
(b)
190 240 290 340 390 440 490 540
Wavelength (nm)
(d)
Figure 4.15 Spectra ofProcessing Gases in NTPD
These spectra were taken at room temperature and atmospheric pressure at power
level of 5 watts. The NTPD process generated UV light from collisions between N2
molecules and electrons in the emission range from 230 to 400 nm range. This spectrum
is shown in Figure 4.15 (a). NO increased the intensity of photo emissions in the 200-300
nm range, even though the NO concentration was only 1000 ppm (see Figure 4.15(b)).
74
Nitrogen oxides are particularly sensitive to UV photons, having a very wide absorption
range. Upon absorption they immediately emit UV radiation during relaxation or
chemical reaction. Ozone produced from oxygen and electron impact strongly absorbs
UV in the range of 200-310 nm, leading to its decomposition. This absorption contributes
to the lack of UV lines in the spectra of N2/O2 in Figure 4.15 (c). Similarly, there are no
peaks observed in N2/H2O because water partially absorbs UV and blocks the UV light
transmission. Some of the more important reactions involving VUV and UV emission are
given below.
*O2 + O(D) (A
O(lD) + H2O -+OH + OH
O2 + hv-+ O(D) + O(3P) (^ < \75nm) (4.32)
H2O + hv^>OH + H (A < 2A2nm) (4.33)
NO2 +hv->NO + O (A < 366nm) (4-34)
Some of these reactions are quite strong. In the gas phase the quantum efficiency
involving the photolytic cleavage reactions for H2O and O2 are close to unity (Getoff and
Schenck, 1986). Since UV has the ability to increase the concentration of OH, it plays a
positive role in NOx removal with NTPD. However, it also produces negative effects
such as the reaction in Equation 4.34, where it decomposes to NO. Experimental results
suggest that the decomposition of NO2 can be checked by adding enough water and
oxygen to the gas mixture. With adequate water vapor and UV radiation at shorter
wavelengths the water can be photolyzed strongly to OH. Produced ozone would absorb
the photons in the range where NO2 has absorption.
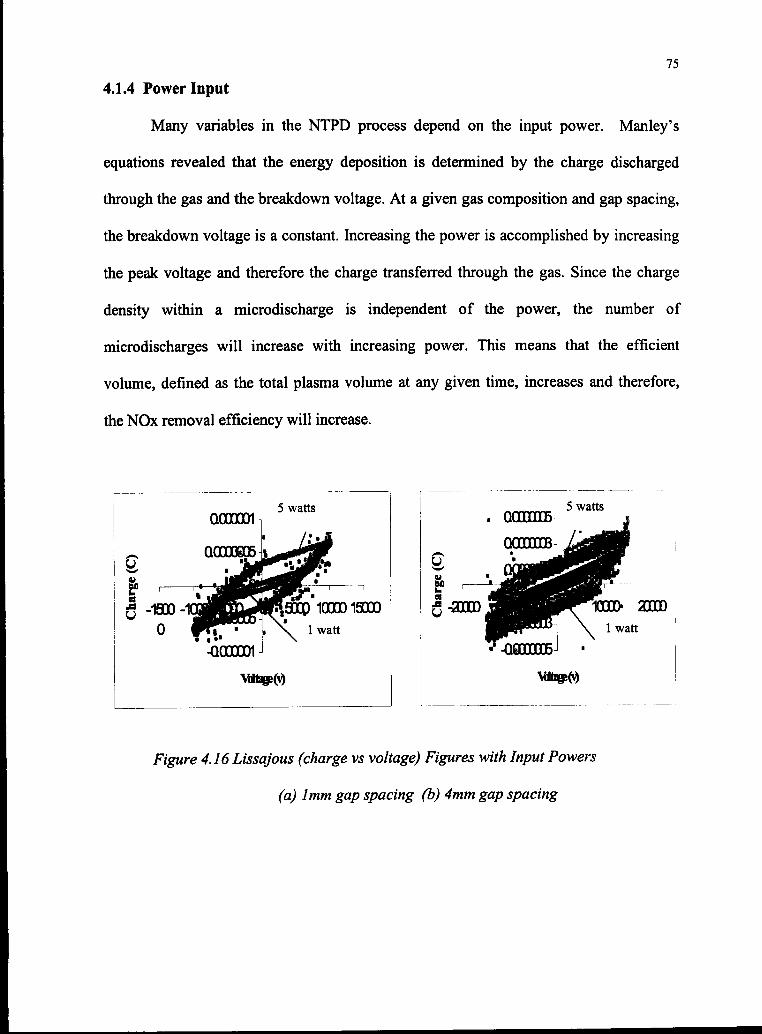
75
4.1.4 Power Input
Many variables in the NTPD process depend on the input power. Manley's
equations revealed that the energy deposition is determined by the charge discharged
through the gas and the breakdown voltage. At a given gas composition and gap spacing,
the breakdown voltage is a constant. Increasing the power is accomplished by increasing
the peak voltage and therefore the charge transferred through the gas. Since the charge
density within a microdischarge is independent of the power, the number of
microdischarges will increase with increasing power. This means that the efficient
volume, defined as the total plasma volume at any given time, increases and therefore,
the NOx removal efficiency will increase.
-1SDO-
QOOQOOl5 watts
100Q01SOOO
watt
• Q0000005
20000
lwatt
-00000005
Figure 4.16 Lissajous (charge vs voltage) Figures with Input Powers
(a) lmm gap spacing (b) 4mm gap spacing
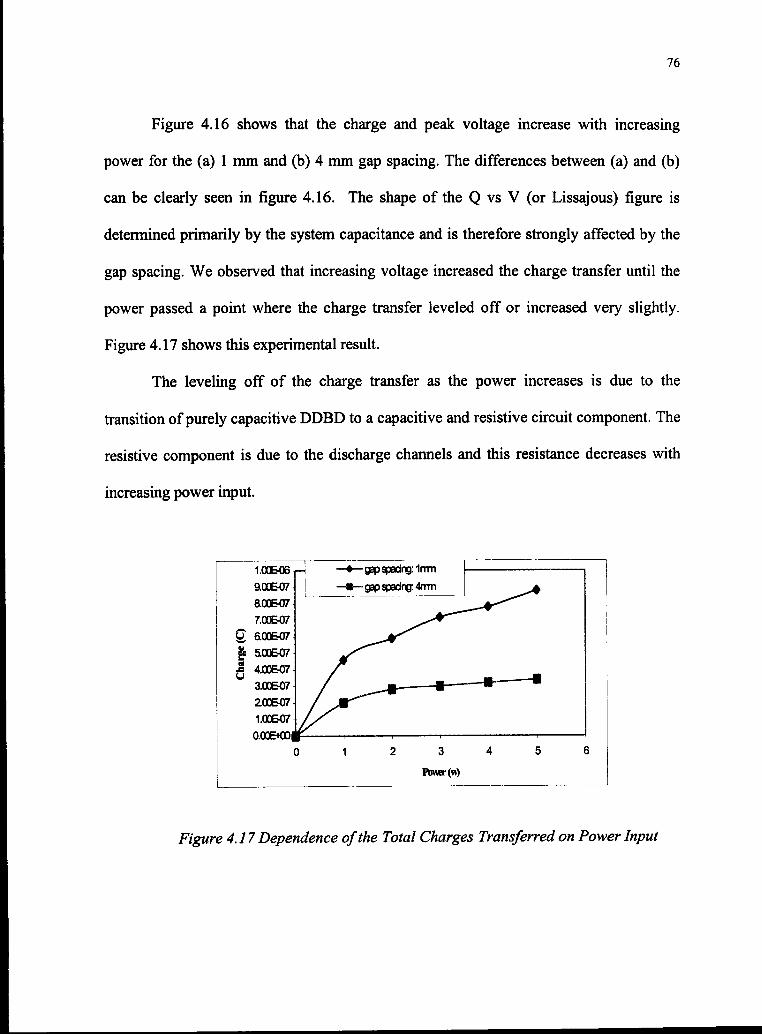
76
Figure 4.16 shows that the charge and peak voltage increase with increasing
power for the (a) 1 mm and (b) 4 mm gap spacing. The differences between (a) and (b)
can be clearly seen in figure 4.16. The shape of the Q vs V (or Lissajous) figure is
determined primarily by the system capacitance and is therefore strongly affected by the
gap spacing. We observed that increasing voltage increased the charge transfer until the
power passed a point where the charge transfer leveled off or increased very slightly.
Figure 4.17 shows this experimental result.
The leveling off of the charge transfer as the power increases is due to the
transition of purely capacitive DDBD to a capacitive and resistive circuit component. The
resistive component is due to the discharge channels and this resistance decreases with
increasing power input.
5 6
Figure 4.17 Dependence ofthe Total Charges Transferred on Power Input
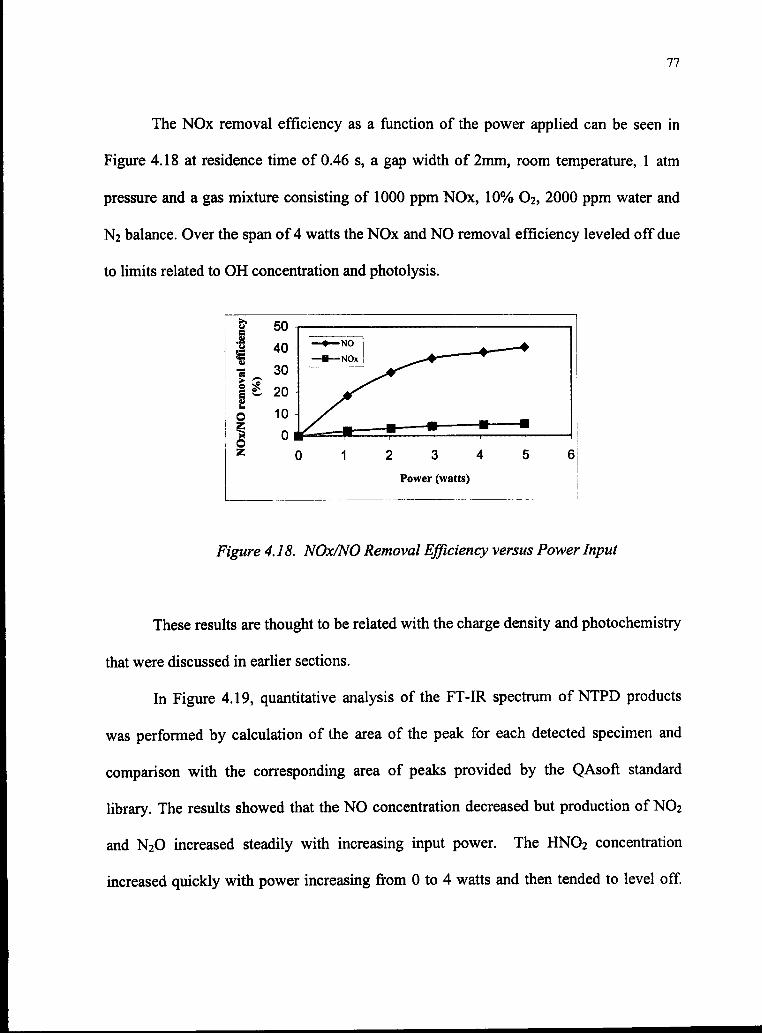
77
The NOx removal efficiency as a function of the power applied can be seen in
Figure 4.18 at residence time of 0.46 s, a gap width of 2mm, room temperature, 1 atm
pressure and a gas mixture consisting of 1000 ppm NOx, 10% O2, 2000 ppm water and
N2 balance. Over the span of 4 watts the NOx and NO removal efficiency leveled off due
to limits related to OH concentration and photolysis.
2 3 4
Power (watts)
Figure 4.18. NOx/NO Removal Efficiency versus Power Input
These results are thought to be related with the charge density and photochemistry
that were discussed in earlier sections.
In Figure 4.19, quantitative analysis of the FT-IR spectrum of NTPD products
was performed by calculation of the area of the peak for each detected specimen and
comparison with the corresponding area of peaks provided by the QAsoft standard
library. The results showed that the NO concentration decreased but production of NO2
and N2O increased steadily with increasing input power. The HNO2 concentration
increased quickly with power increasing from 0 to 4 watts and then tended to level off.
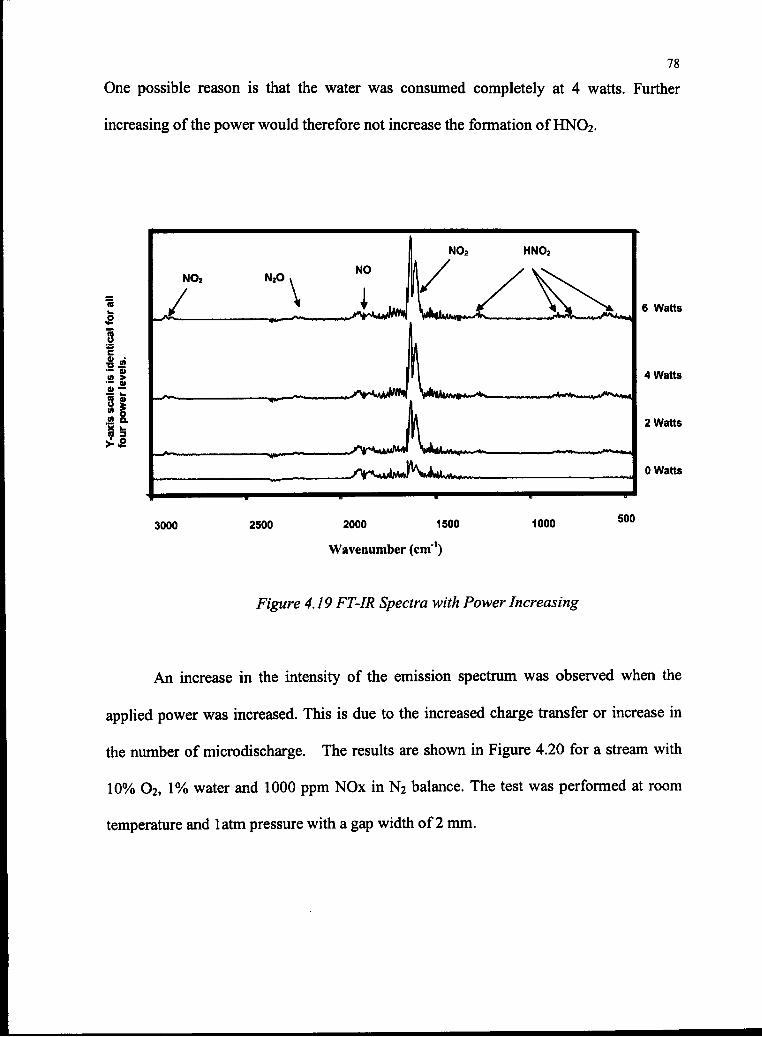
78
One possible reason is that the water was consumed completely at 4 watts. Further
increasing of the power would therefore not increase the formation ofHNO2.
•5
a
8
.2
8
3000 2500 2000
NO, N2O .NO
NO] HNO2
\yfcuiv^*^—*k , IJUU, n-«—>-.-.^.a**^
\^_
1500
Wavenumber (cm")
1000
Figure 4.19 FT-IR Spectra with Power Increasing
6 Watts
4 Watts
2 Watts
0 Watts
500
An increase in the intensity of the emission spectrum was observed when the
applied power was increased. This is due to the increased charge transfer or increase in
the number of microdischarge. The results are shown in Figure 4.20 for a stream with
10% O2, 1% water and 1000 ppm NOx in N2 balance. The test was performed at room
temperature and latm pressure with a gap width of 2 mm.
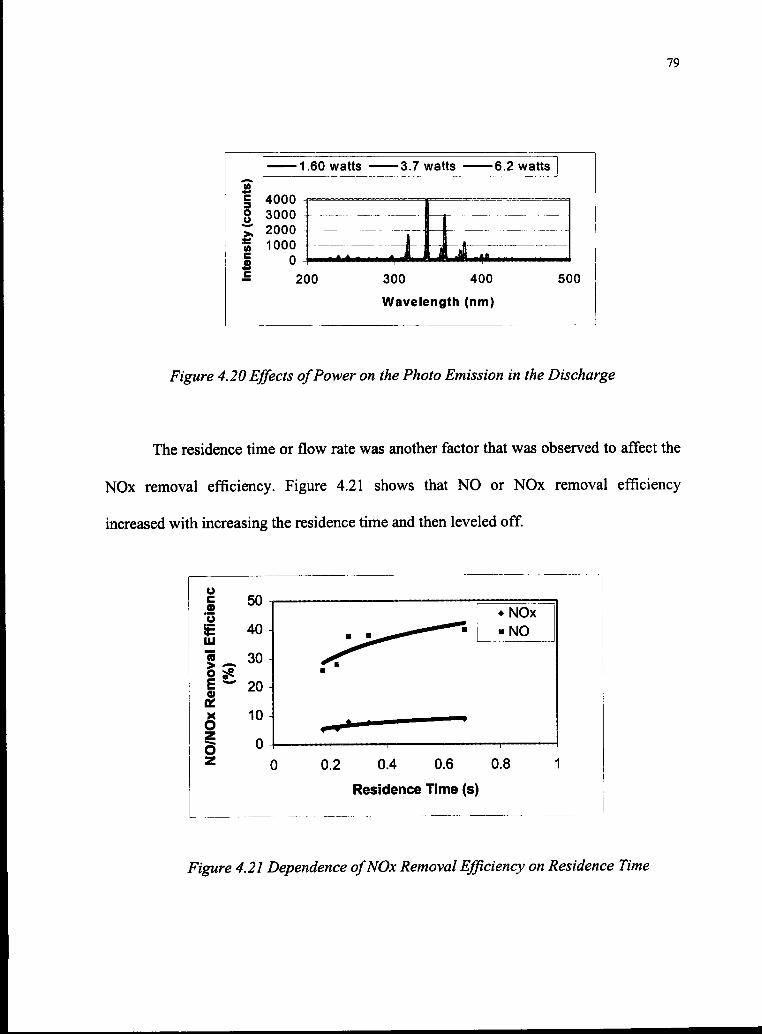
79
■ 1.60 watts ■3.7 watts ■6.2 watts
200 300 400
Wavelength (nm)
500
Figure 4.20 Effects ofPower on the Photo Emission in the Discharge
The residence time or flow rate was another factor that was observed to affect the
NOx removal efficiency. Figure 4.21 shows that NO or NOx removal efficiency
increased with increasing the residence time and then leveled off.
50u
o
o
£ 40Hi
« 30
Iz
20
10
0
♦ NOx
■ NO
0.2 0.4 0.6 0.8
Residence Time (s)
Figure 4.21 Dependence ofNOx Removal Efficiency on Residence Time
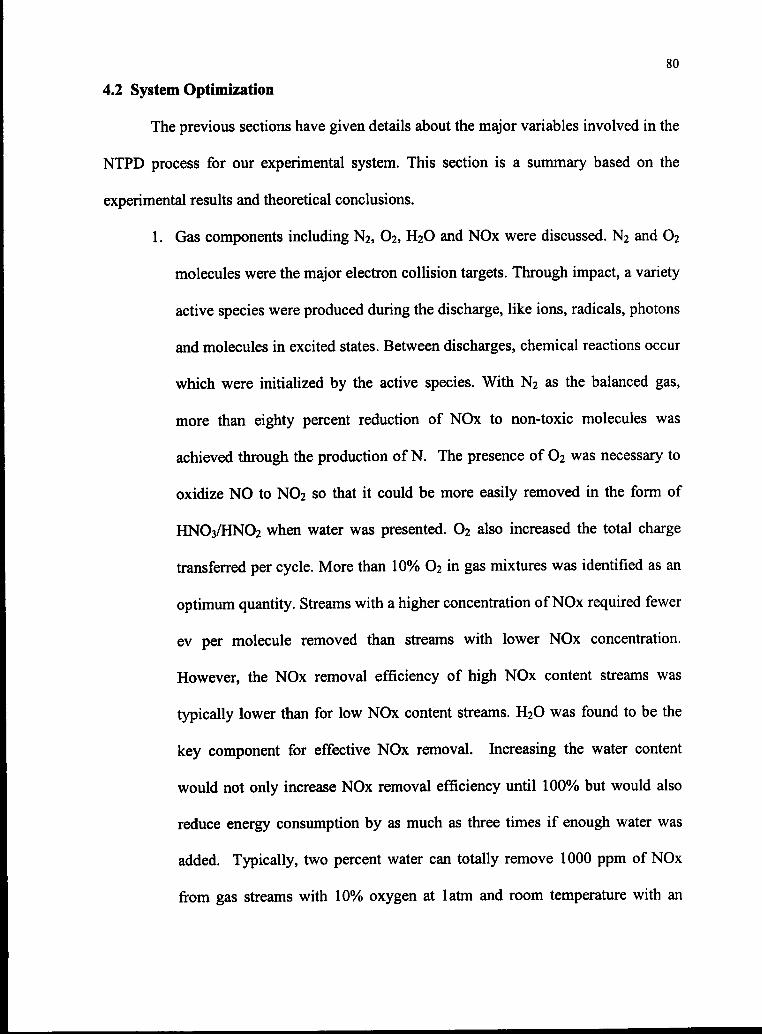
80
4.2 System Optimization
The previous sections have given details about the major variables involved in the
NTPD process for our experimental system. This section is a summary based on the
experimental results and theoretical conclusions.
1. Gas components including N2, O2, H2O and NOx were discussed. N2 and O2
molecules were the major electron collision targets. Through impact, a variety
active species were produced during the discharge, like ions, radicals, photons
and molecules in excited states. Between discharges, chemical reactions occur
which were initialized by the active species. With N2 as the balanced gas,
more than eighty percent reduction of NOx to non-toxic molecules was
achieved through the production of N. The presence of O2 was necessary to
oxidize NO to NO2 so that it could be more easily removed in the form of
HNO3/HNO2 when water was presented. O2 also increased the total charge
transferred per cycle. More than 10% O2 in gas mixtures was identified as an
optimum quantity. Streams with a higher concentration ofNOx required fewer
ev per molecule removed than streams with lower NOx concentration.
However, the NOx removal efficiency of high NOx content streams was
typically lower than for low NOx content streams. H2O was found to be the
key component for effective NOx removal. Increasing the water content
would not only increase NOx removal efficiency until 100% but would also
reduce energy consumption by as much as three times if enough water was
added. Typically, two percent water can totally remove 1000 ppm of NOx
from gas streams with 10% oxygen at latm and room temperature with an
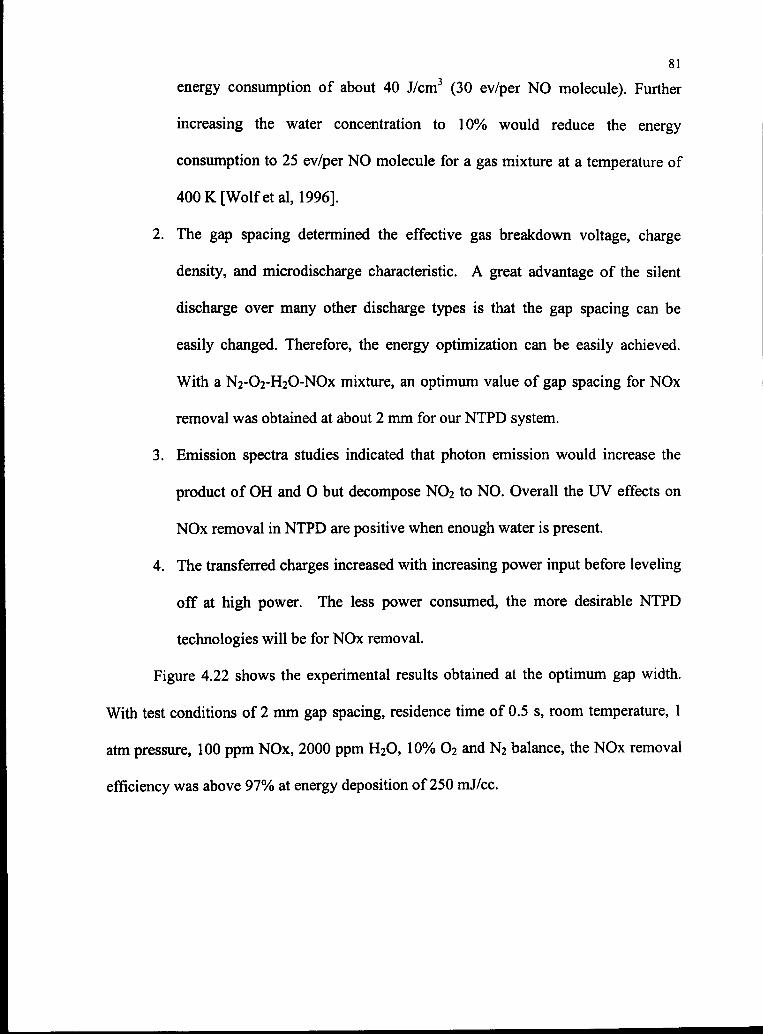
81
energy consumption of about 40 J/cm3 (30 ev/per NO molecule). Further
increasing the water concentration to 10% would reduce the energy
consumption to 25 ev/per NO molecule for a gas mixture at a temperature of
400 K[Wolfetal, 1996].
2. The gap spacing determined the effective gas breakdown voltage, charge
density, and microdischarge characteristic. A great advantage of the silent
discharge over many other discharge types is that the gap spacing can be
easily changed. Therefore, the energy optimization can be easily achieved.
With a N2-O2-H2O-NOX mixture, an optimum value of gap spacing for NOx
removal was obtained at about 2 mm for our NTPD system.
3. Emission spectra studies indicated that photon emission would increase the
product of OH and O but decompose NO2 to NO. Overall the UV effects on
NOx removal in NTPD are positive when enough water is present.
4. The transferred charges increased with increasing power input before leveling
off at high power. The less power consumed, the more desirable NTPD
technologies will be for NOx removal.
Figure 4.22 shows the experimental results obtained at the optimum gap width.
With test conditions of 2 mm gap spacing, residence time of 0.5 s, room temperature, 1
atm pressure, 100 ppm NOx, 2000 ppm H2O, 10% O2 and N2 balance, the NOx removal
efficiency was above 97% at energy deposition of 250 mJ/cc.
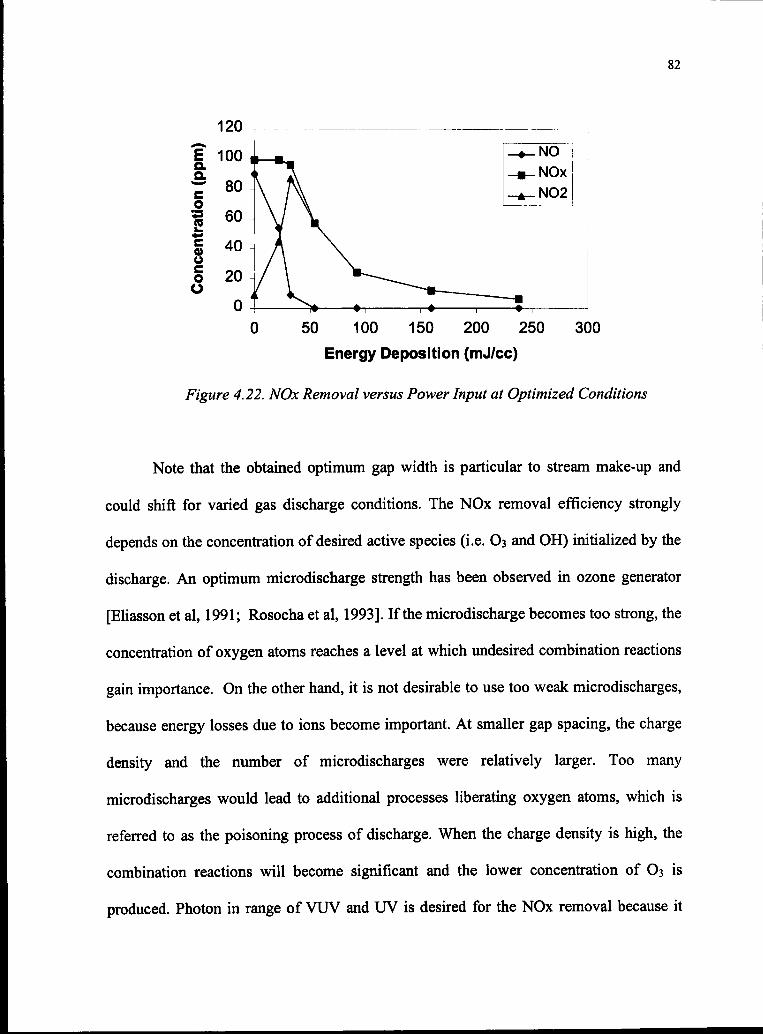
82
0 50 100 150 200 250
Energy Deposition (mJ/cc)
300
Figure 4.22. NOx Removal versus Power Input at Optimized Conditions
Note that the obtained optimum gap width is particular to stream make-up and
could shift for varied gas discharge conditions. The NOx removal efficiency strongly
depends on the concentration of desired active species (i.e. O3 and OH) initialized by the
discharge. An optimum microdischarge strength has been observed in ozone generator
[Eliasson et al, 1991; Rosocha et al, 1993]. If the microdischarge becomes too strong, the
concentration of oxygen atoms reaches a level at which undesired combination reactions
gain importance. On the other hand, it is not desirable to use too weak microdischarges,
because energy losses due to ions become important. At smaller gap spacing, the charge
density and the number of microdischarges were relatively larger. Too many
microdischarges would lead to additional processes liberating oxygen atoms, which is
referred to as the poisoning process of discharge. When the charge density is high, the
combination reactions will become significant and the lower concentration of O3 is
produced. Photon in range of VUV and UV is desired for the NOx removal because it
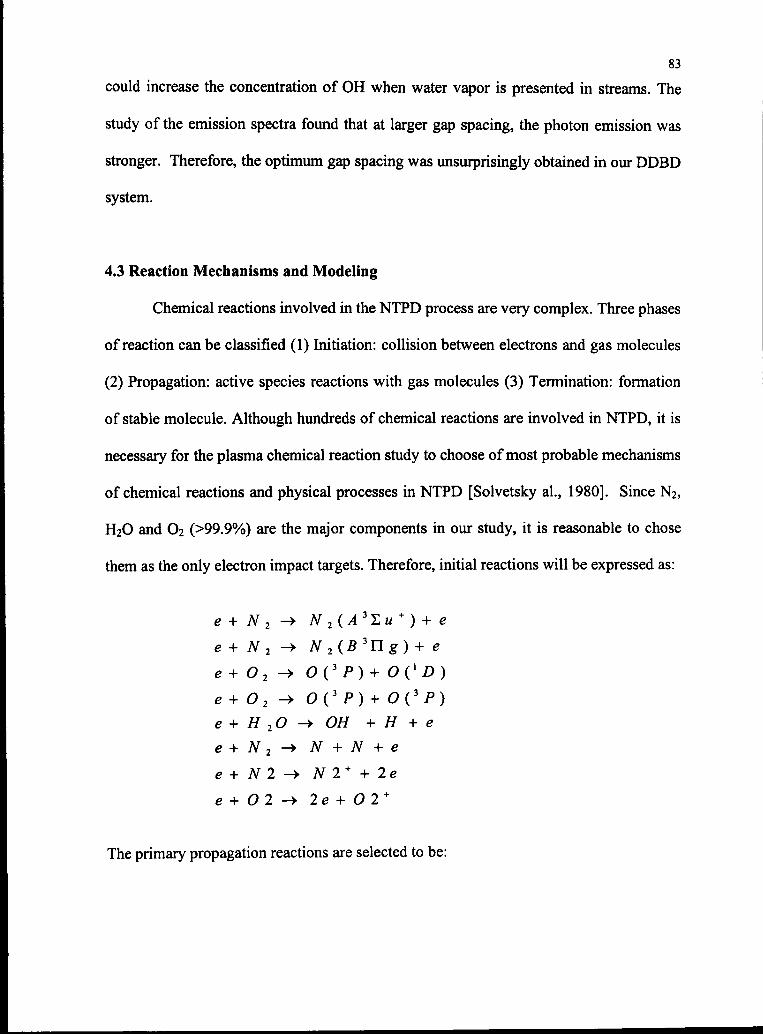
83
could increase the concentration of OH when water vapor is presented in streams. The
study of the emission spectra found that at larger gap spacing, the photon emission was
stronger. Therefore, the optimum gap spacing was unsurprisingly obtained in our DDBD
system.
4.3 Reaction Mechanisms and Modeling
Chemical reactions involved in the NTPD process are very complex. Three phases
of reaction can be classified (1) Initiation: collision between electrons and gas molecules
(2) Propagation: active species reactions with gas molecules (3) Termination: formation
of stable molecule. Although hundreds of chemical reactions are involved in NTPD, it is
necessary for the plasma chemical reaction study to choose ofmost probable mechanisms
of chemical reactions and physical processes in NTPD [Solvetsky al, 1980]. Since N2,
H2O and O2 (>99.9%) are the major components in our study, it is reasonable to chose
them as the only electron impact targets. Therefore, initial reactions will be expressed as:
e + N 2 -» N 2(^3Zm + ) + e
e + N 2 -> N 2(B3Ug) + e
e + O2 -> OC P) + OC D)
e + O2 -> OC P)+ OC P)
e + H 2O -> OH + H + e
e + N 2 -> N + N + e
e + N 2 -+ N 2+ + 2e
e + 02 -* 2e + O2 +
The primary propagation reactions are selected to be:
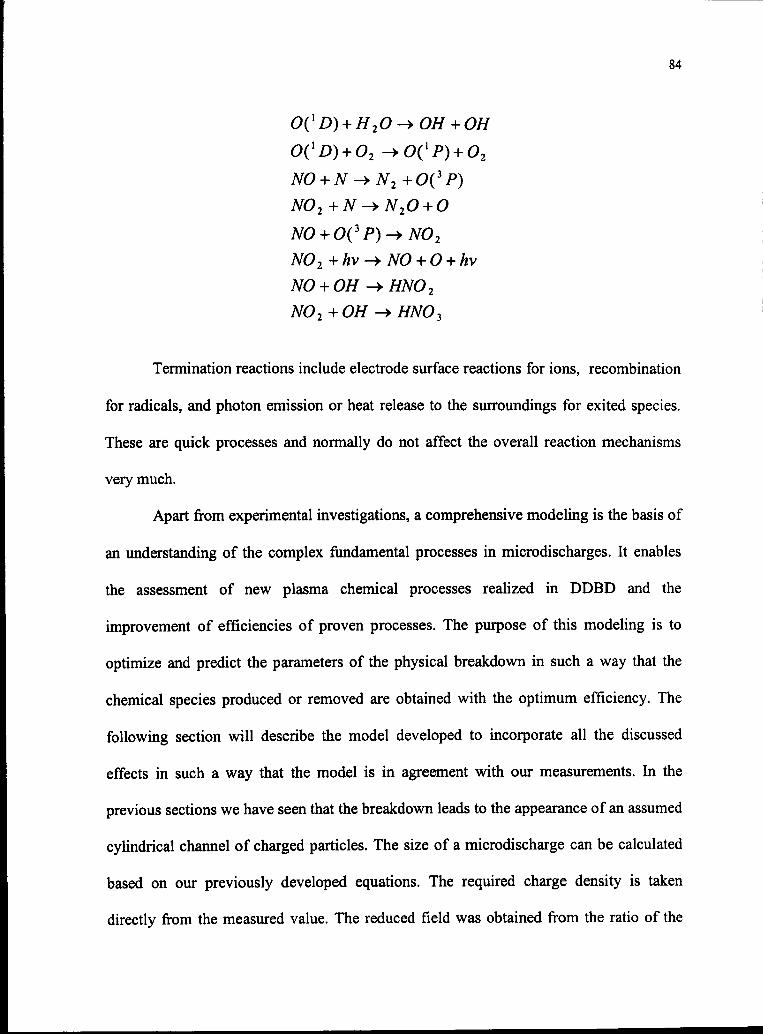
84
NO2+hv-> NO + O + hv
NO + OH -+HNO2
NO2+OH -+HNO)
Termination reactions include electrode surface reactions for ions, recombination
for radicals, and photon emission or heat release to the surroundings for exited species.
These are quick processes and normally do not affect the overall reaction mechanisms
very much.
Apart from experimental investigations, a comprehensive modeling is the basis of
an understanding of the complex fundamental processes in microdischarges. It enables
the assessment of new plasma chemical processes realized in DDBD and the
improvement of efficiencies of proven processes. The purpose of this modeling is to
optimize and predict the parameters of the physical breakdown in such a way that the
chemical species produced or removed are obtained with the optimum efficiency. The
following section will describe the model developed to incorporate all the discussed
effects in such a way that the model is in agreement with our measurements. In the
previous sections we have seen that the breakdown leads to the appearance of an assumed
cylindrical channel of charged particles. The size of a microdischarge can be calculated
based on our previously developed equations. The required charge density is taken
directly from the measured value. The reduced field was obtained from the ratio of the
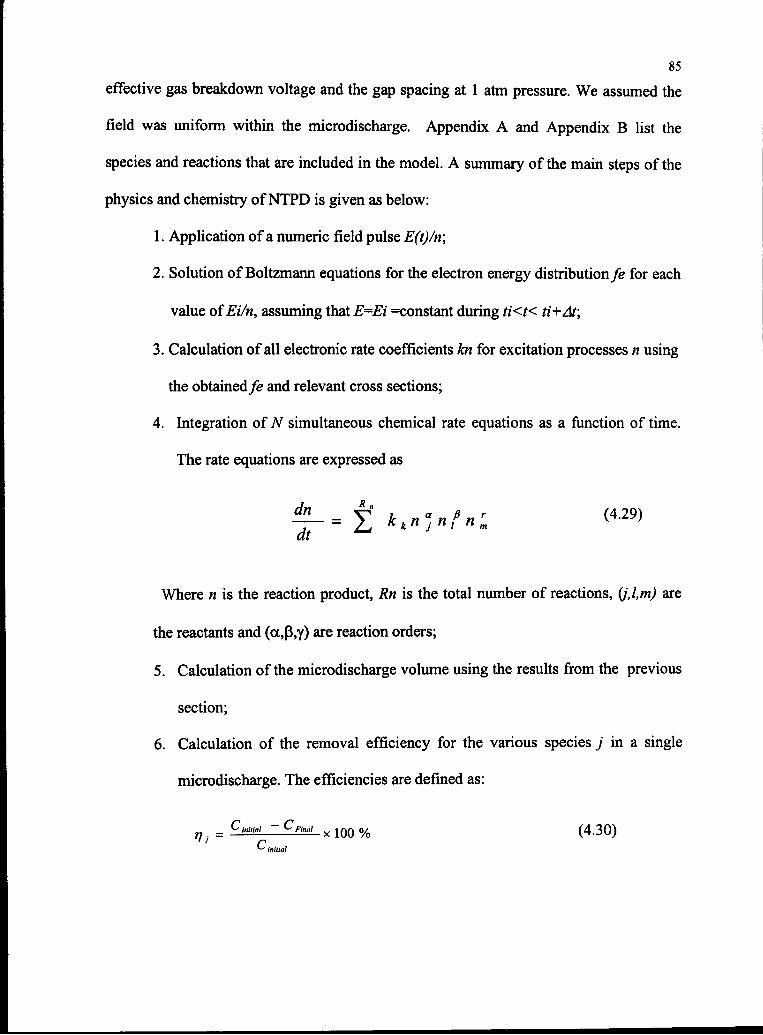
85
effective gas breakdown voltage and the gap spacing at 1 atm pressure. We assumed the
field was uniform within the microdischarge. Appendix A and Appendix B list the
species and reactions that are included in the model. A summary of the main steps of the
physics and chemistry ofNTPD is given as below:
1. Application of a numeric field pulse E(t)/n;
2. Solution of Boltzmann equations for the electron energy distributionfe for each
value ofEi/n, assuming that E=Ei =constant during ti<t< ti+At;
3. Calculation of all electronic rate coefficients kn for excitation processes n using
the obtained/e and relevant cross sections;
4. Integration of N simultaneous chemical rate equations as a function of time.
The rate equations are expressed as
dn £r , „ p , (4.29)
dtkknajnf>n
m
Where n is the reaction product, Rn is the total number of reactions, (j.l.m) are
the reactants and (a,p,y) are reaction orders;
5. Calculation of the microdischarge volume using the results from the previous
section;
6. Calculation of the removal efficiency for the various species j in a single
microdischarge. The efficiencies are defined as:
= j^—CI!ss!_ x 10Q % (4
'-' initial
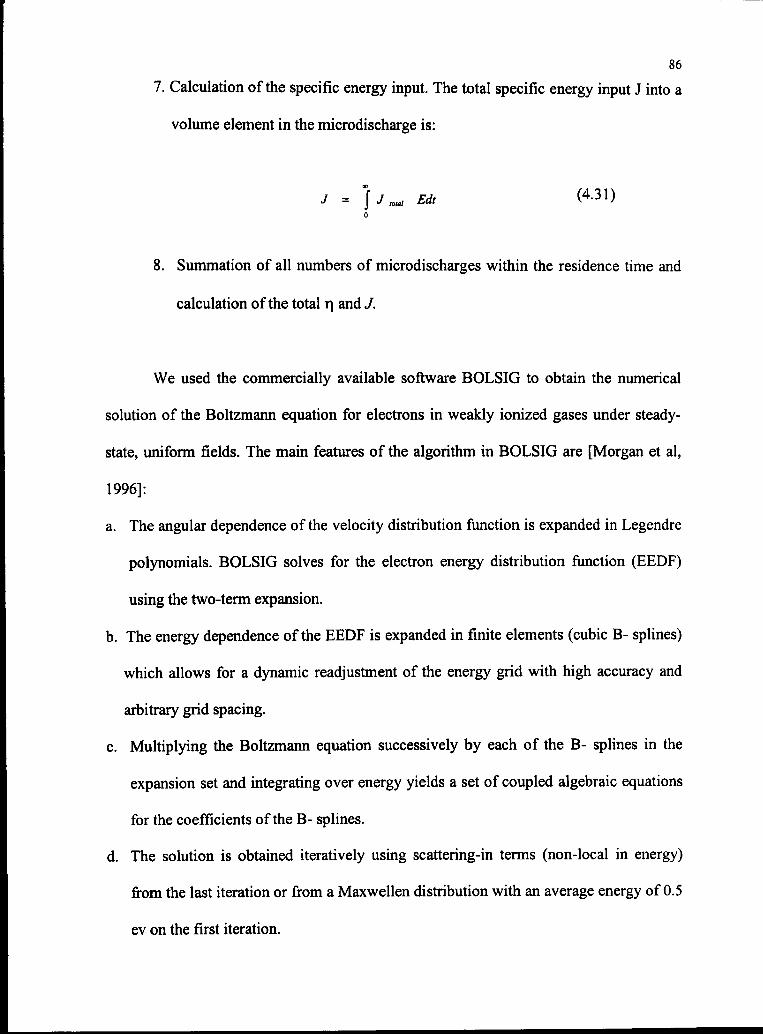
86
7. Calculation of the specific energy input. The total specific energy input J into a
volume element in the microdischarge is:
J = ]•/,»,„ Edt (4-31)o
8. Summation of all numbers of microdischarges within the residence time and
calculation of the total r| and J.
We used the commercially available software BOLSIG to obtain the numerical
solution of the Boltzmann equation for electrons in weakly ionized gases under steady-
state, uniform fields. The main features of the algorithm in BOLSIG are [Morgan et al,
1996]:
a. The angular dependence of the velocity distribution function is expanded in Legendre
polynomials. BOLSIG solves for the electron energy distribution function (EEDF)
using the two-term expansion.
b. The energy dependence of the EEDF is expanded in finite elements (cubic B- splines)
which allows for a dynamic readjustment of the energy grid with high accuracy and
arbitrary grid spacing.
c. Multiplying the Boltzmann equation successively by each of the B- splines in the
expansion set and integrating over energy yields a set of coupled algebraic equations
for the coefficients of the B- splines.
d. The solution is obtained iteratively using scattering-in terms (non-local in energy)
from the last iteration or from a Maxwellen distribution with an average energy of 0.5
ev on the first iteration.
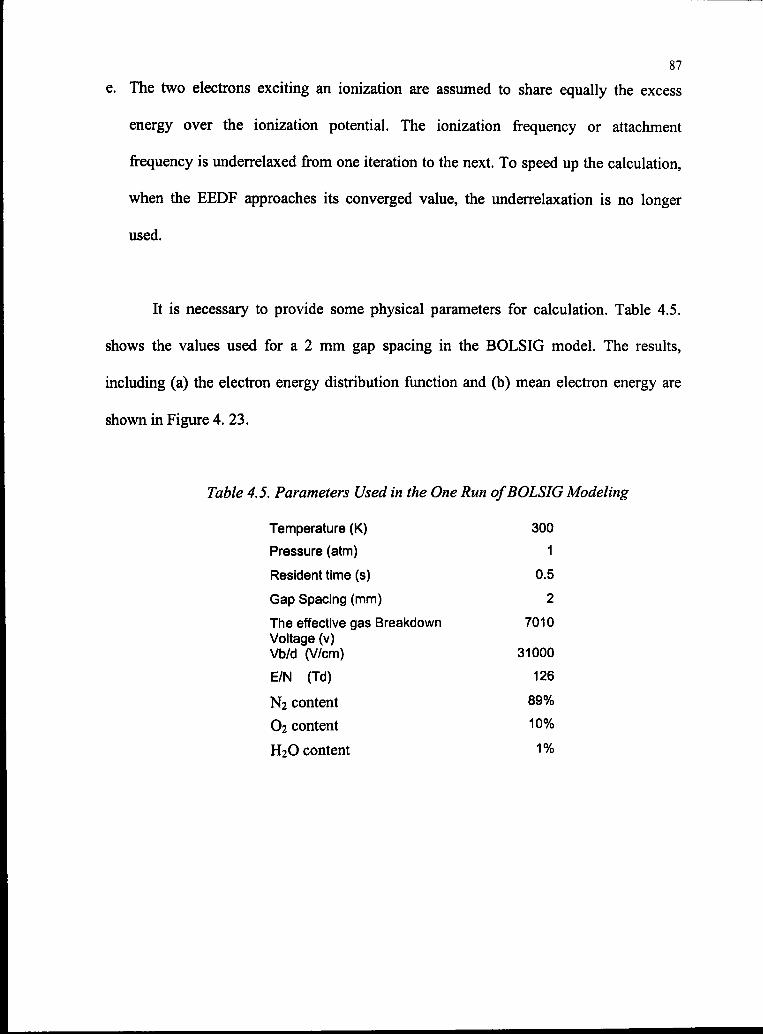
87
e. The two electrons exciting an ionization are assumed to share equally the excess
energy over the ionization potential. The ionization frequency or attachment
frequency is underrelaxed from one iteration to the next. To speed up the calculation,
when the EEDF approaches its converged value, the underrelaxation is no longer
used.
It is necessary to provide some physical parameters for calculation. Table 4.5.
shows the values used for a 2 mm gap spacing in the BOLSIG model. The results,
including (a) the electron energy distribution function and (b) mean electron energy are
shown in Figure 4. 23.
Table 4.5. Parameters Used in the One Run ofBOLSIG Modeling
Temperature (K)
Pressure (atm)
Resident time (s)
Gap Spacing (mm)
The effective gas Breakdown
Voltage (v)
Vb/d (V/cm)
E/N (Td)
N2 content
O2 content
H2O content
300
1
0.5
2
7010
31000
126
89%
10%
1%
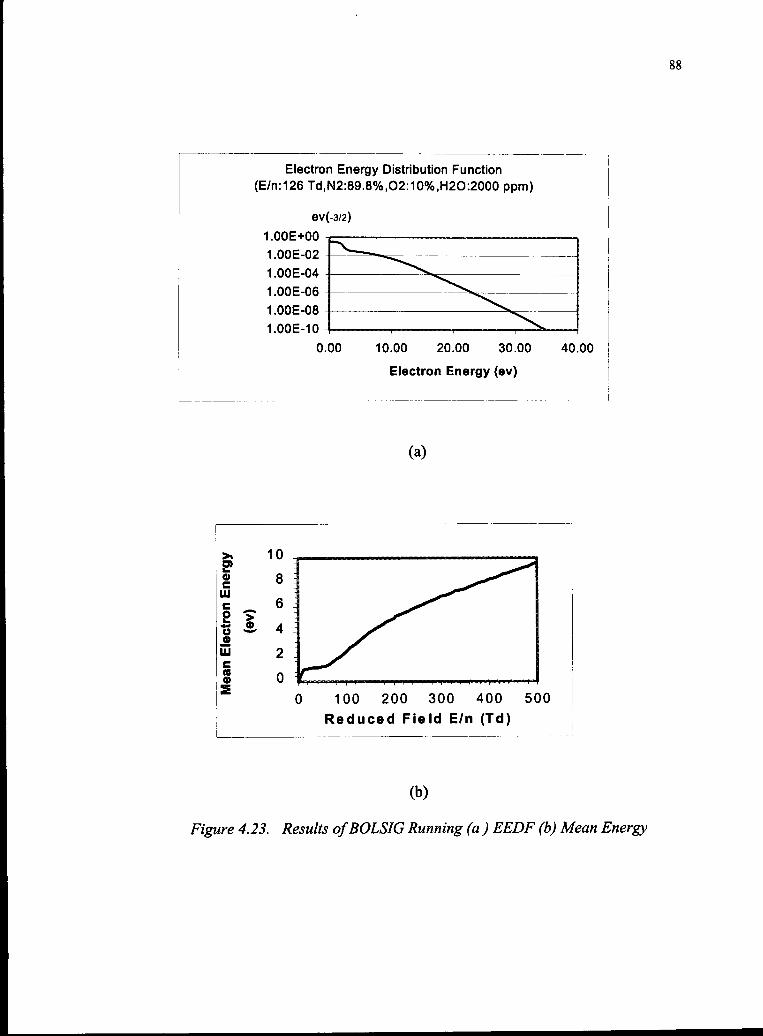
Electron Energy Distribution Function
(E/n:126 Td,N2:89.8%,O2:10%,H2O:2000 ppm)
ev(-3/2)
1.00E+00
1.00E-02
1.00E-04
1.00E-06
1.00E-08
1.00E-10
0.00 10.00 20.00 30.00 40.00
Electron Energy (ev)
(a)
Reduced Field E/n (Td)
(b)
Figure 4.23. Results ofBOLSIG Running (a ) EEDF (b) Mean Energy
From Figure 4. 23 (b), we can estimate the mean electron energy about 3.16 ev for
a gap spacing of 2 mm (i.e. a reduced field of 125 Td). At such an energy level, the
dissociation ofN2 (9.8 ev), O2 (5.2 ev) and H2O (5.2 ev) is very small.
The numeric solution of the chemical kinetics used codes we developed (see
Appendix C) based on modeling step 3 to 7. These codes are mainly concerned with the
chemical reaction paths and energy deposition. The physical parameters depended on the
experiment settings and the DDBD design. The kinetic rates of electron impact were
obtained from the BOLSIG results. Other chemical reaction rates were taken from
literature reports. Relationships between them have been discussed in the previous
sections. The following are values of the parameters listed for modeling calculation with
the gap width of 2 mm. If the gap spacing is changed, the corresponding parameters will
change also. These parameters are available directly from the experimental
measurements.
Time Between Discharges (TIMEBD) = 0.5000xl0"02 sec
Between Discharges dt (DTOFF) = O.lOOOxlO"06 sec
Estimated Discharge time (TIMED) = O.lOOOxlO"07 sec
Discharge dt (DTMD) = 0.2000xl0"09 sec
After Glow Duration (TIMEAG) = O.lOOOxlO"03 sec
After Glow dt (DTAG) = O.lOOOxlO"08 sec
Total Energy Dissipated (TOTEAD)= 0.680010+03 mJ/cm3
Number OfDischarges =2000
Gas Temperature (TEMP) = O.3OOOxlO+O3 K
Discharge Gap = 0.2000x10"02 Meters
90
Breakdown Voltage =0.70100xl0+04 Volts
Discharge Radius =0.1700xl0"03 Meters
Total Energy Added (TOTEAD) =0.6800xl0+06 J/m3
Total Number ofKinetic Equations (NEQ) =272
Number of Collision Kinetic Equations. (NRREQ) =219
Number of Electron Collision Equations. (NELEQ) =23
Number of Electron Capture Equations. (NECEQ) =26
Number ofUV Reaction Equations (NUVEQ) =4
Number of Species Considered (NSPEC) =51
Initial Total Number Density = 0.2451xl0+26 part/m3
Calculated Pressure = 0.1002xl0+01 arm.
Based on these data, the simulated results from our model were obtained and are
shown in Figure 4. 24. The model predicts that the primary products of NTPD process
are NO3, N2O, HNO2 and HNO3. The NOx removal with a gap spacing of 2 mm and
power input of 5 watts are about 100% which is in agreement with the experimental
results for inlet gas mixture of 90% N2, 10% O2, 2000 ppm H2O and 100 ppm NOx.
Figure 4.24 reveals a difference between the numerical calculation and experimental
measurements. The simulation results show that the HNO3 is the primary product.
However, FT-IR spectra did not show the expected quantity of HNO3. The possible
explanation is that HNO3 is condensed so that quantitative analysis of gas phase could not
be available for HNO3 in our system.
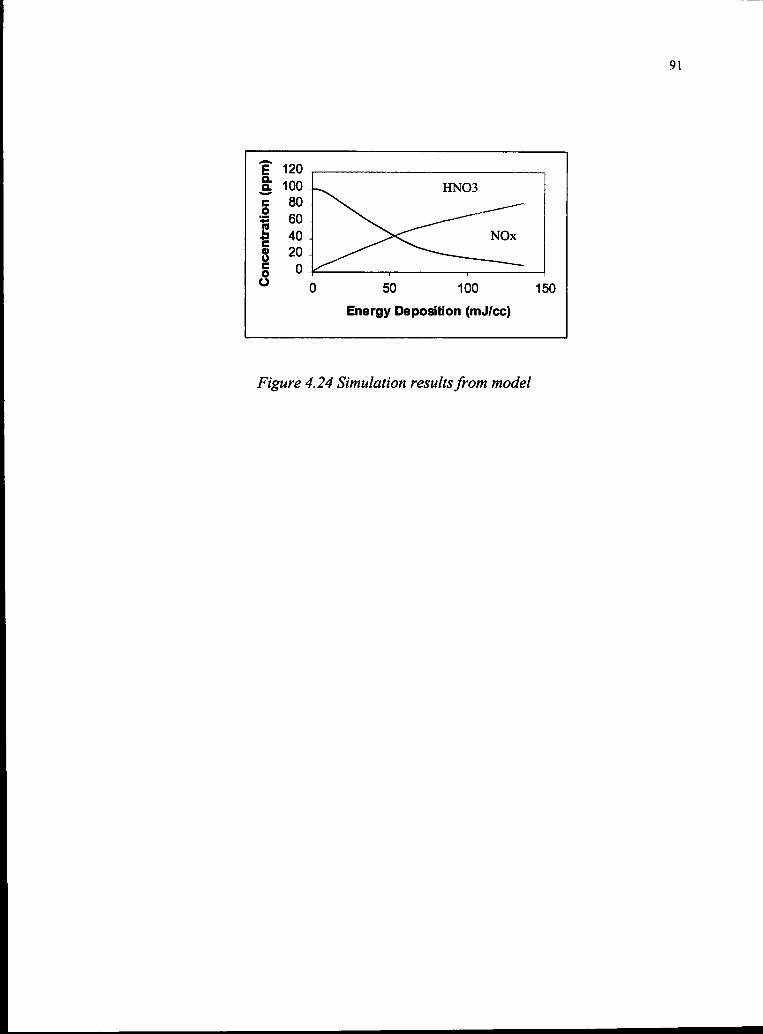
91
? 120
a 100 -
c* 80 -
i 60£ 40 -
8 20-
§ 0-
° (
-^ HNO3
J^<^i NOx
) 50 100 150
Energy Deposition (mJ/cc)
Figure 4.24 Simulation resultsfrom model
92
CHAPTER V
CONCLUSIONS AND RECOMMEDATIONS
5.1 Conclusions
This study was conducted to investigate the NTPD process for destruction of
nitrogen oxides. Double dielectric barrier discharge (DDBD) reactors were employed in
the research.
The study showed that DDBD is an effective technique to remove NOx from gas
streams that contain NOx. The conversion levels heavily depend on the power input.
NOx could be completely removed at optimum conditions with enough power input.
Understanding the microdischarge is the key to understand the silent discharge.
Their physics have been studied through optical measurements and theoretical studies.
Special emphasis was placed on the gap spacing that determines many other important
variables of the NTPD process. A clear relationship between microdischarge and gap
width was developed, which led to a successful construction of a chemical kinetic
reaction model. Conclusions drawn from the work conducted in this study apply to the
operation ofDDBD system. They are listed below:
1. Determination of the breakdown voltage is very important for NTPD process.
An empirical equation was derived based on the criterion for the occurrence of
a self-sustaining discharge as.
93
A ~ lnrf + C,
where C, = Bp
C, =K
ApC3=ln
The constants for the fit were found to be Ci = 12339.6 volts/mm, C2 = 9254.7
volts, andC3 =4.1.
2. Chemical reactions are initialized by collisions between electrons and gas
molecules within microdischarges. It is essential to determine the average size
and the number of microdischarges. Dependence of the size of a
microdischarge on gap spacing was investigated. A linear relation between
radius of footprint and channel was found.
£0=6.89r-471.93
The number of microdischarges exponentially decreased with increasing gap
spacing.
3. When we assume that all of the surface charge contained in the area of the
footprint is transferred into the microdischarge channel.
a A = p V
Therefore, the volume charge density within the microdischarge channel can
be roughly estimated. The calculated results were consistent with
measurements using different methods in the literature.
4. Experimentation on the chemical aspects of the DDBD destruction ofNOx led
to the following conclusions pertaining to effects of various gases on NOx
removal efficiency.
94
The major products of NTPD processed gases were nitrogen and oxygen,
benign compounds that can be released to the environment, when the inlet
gas was composed ofNOx in N2.
If water was introduced into the gas mixture, the major products were
HNO2 and HNO3, which were easy to be condensed and removed. NOx
removal efficiency increased with water concentration.
Although hydrogen is a reducing reagent, nitrogen oxides in hydrogen
could not be removed effectively under our experimental conditions. The
mean electron energy was too low to make enough active hydrogen.
Oxygen in the gas mixture stream decreased the NOx removal through
reduction. By oxidizing NO to NO2, oxygen increased the NOx removal
efficiency through different mechanisms ifwater was present.
5. Our study indicates that gap width can be considered one of the major factors
affecting the physical properties and performance of dielectric barrier
discharges. In order to evaluate the effect of gap width on NO removal in
combustion gas streams, both the physical properties of the microdischarges
and the NO removal efficiency were investigated at gap widths ranging from
0.8 to 4.0 mm. System level measurements of the NO removal efficiency at
various gap widths revealed that for the selected gas stream the NO removal
peaked at a gap width of approximately 2 mm. Although the observed
optimum gap width is potentially only applicable to our specific test
conditions, the existence of an optimum indicates that each application of
NTPD to toxic gas removal may benefit from consideration ofthe gap width.
95
6. Photochemistry study showed that photo emission from electron-molecular
impact in the range of 200-400 nm increased the concentration of OH and O
and decomposed the NO2 to NO.
7. NOx removal efficiency strongly depended on the applied power. Experiment
results indicted that NOx removal efficiency increased with power increasing.
Analysis of the transferred charges and the effective gas breakdown voltage
found that they increased with increasing power and tented to level off if
power input increased further. This may be reflected by the facts that NOx
removal efficiency also leveled off at higher level of power. The charge and
the effective gas breakdown voltage changed with different trends at the
different gap spacing.
8. Optimization of the physical and chemical parameters was accomplished. For
our specific experimental conditions, the applicable conditions are listed
below:
Gas composition: 89% N2,10% O2,1% H2O and 500 ppm NOx;
Gap spacing: 2 mm;
Flow rate: 2 L/min;
Power input: 5 watts.
9. The plasma reaction processes can be divided into two groups. One is the
group of processes which yield active species by electron impact followed by
very fast quenching of some of those species. This is followed by a group of
relatively slow remedial processes in which the active species undergo
reaction with pollutant molecules in the discharge. For the former, the reaction
rates are functions of the reduced electric field and the gas composition. For
the later the reaction rates are constants at given temperature and can be
obtained from published literature. Therefore, the simulation can be carried
out in two distinct parts: (1) determination of the active species production per
unit of energy input for a given gas composition and reduced field, and (2)
solving the rate equations to determine the time evolution of species for a
given energy density and pollutant concentration.
Electron energy distribution function and collision reaction rates were obtained by
running BOLSIG. The reduced electric field was calculated by using the effective gas
breakdown voltage from experimental measurements. The rate equations were solved by
developed model. The necessary values of parameters included in that model came from
results of experiments, theoretic studies and literature. The results of modeling showed
good agreement with the experimental observations.
This study has showed that the NTPD is an attractive technology for the NOx
emission control through plasma chemistry. Low levels of NOx in the outlet of the
DDBD reactor can be achieved without any production of pollutant. Theoretical study
provides a insight ofNTPD processes. A better understanding will lead to develop more
effective techniques to overcome problems such as cost effectiveness.
There are a lot of variables involved in NTPD process. Determination of those
factors and system optimization are necessary for NTPD commercial application. It is
hoped that this study will be helpful in future developments of NTPD research and
application.
97
5.2 Recommendations
1. The study revealed that surface charge and surface conductivity are very important
for charge density calculation and microdischarge characteristics in NTPD process.
These properties of the electrode surfaces play an important role in gas pollutant
destruction from streams. Further investigation is meaningful.
2. Investigation ofNTPD technology suggested that using catalysts or package materials
in DDBD could potentially reduce the energy deposition for NOx removal.
3. Photo chemistry study showed that emitted photo from gas discharge increased the
NOx removal efficiency by inducing enough water and oxygen in the gas stream
optimization of electron energy and dielectric barrier material should be included in
future research.
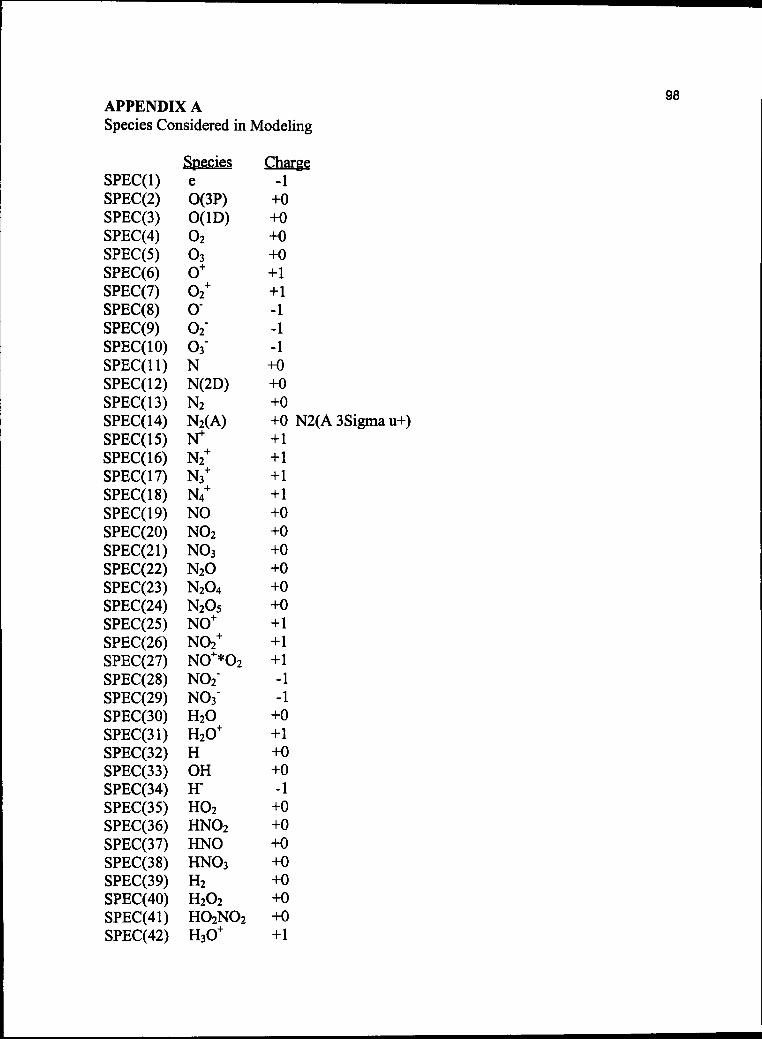
APPENDIX A 98Species Considered in Modeling
Species Charge
SPEC(l) e -1
SPEC(2) O(3P) +0
SPEC(3) O(1D) +0
SPEC(4) O2 +0
SPEC(5) O3 +0
SPEC(6) O+ +1
SPEC(7) O2+ +1SPEC(8) O- -1
SPEC(9) O2" -1
SPEC(IO) O3" -1
SPEC(ll) N +0
SPEC(12) N(2D) +0
SPEC(13) N2 +0
SPEC(14) N2(A) +0 N2(A3Sigmau+)
SPEC(15) N+ +1
SPEC(16) N2+ +1
SPEC(17) N3+ +1
SPEC(18) N4+ +1SPEC(19) NO +0
SPEC(20) NO2 +0
SPEC(21) NO3 +0
SPEC(22) N2O +0
SPEC(23) N2O4 +0
SPEC(24) N2O5 +0
SPEC(25) NO+ +1SPEC(26) NO2+ +1
SPEC(27) NO+*O2 +1SPEC(28) NO2" -1
SPEC(29) NO3' -1
SPEC(30) H2O +0
SPEC(31) H2O+ +1SPEC(32) H +0
SPEC(33) OH +0
SPEC(34) ff -1
SPEC(35) HO2 +0
SPEC(36) HNO2 +0
SPEC(37) HNO +0
SPEC(38) HNO3 +0
SPEC(39) H2 +0
SPEC(40) H2O2 +0
SPEC(41) HO2NO2 +0
SPEC(42) H3O+ +1
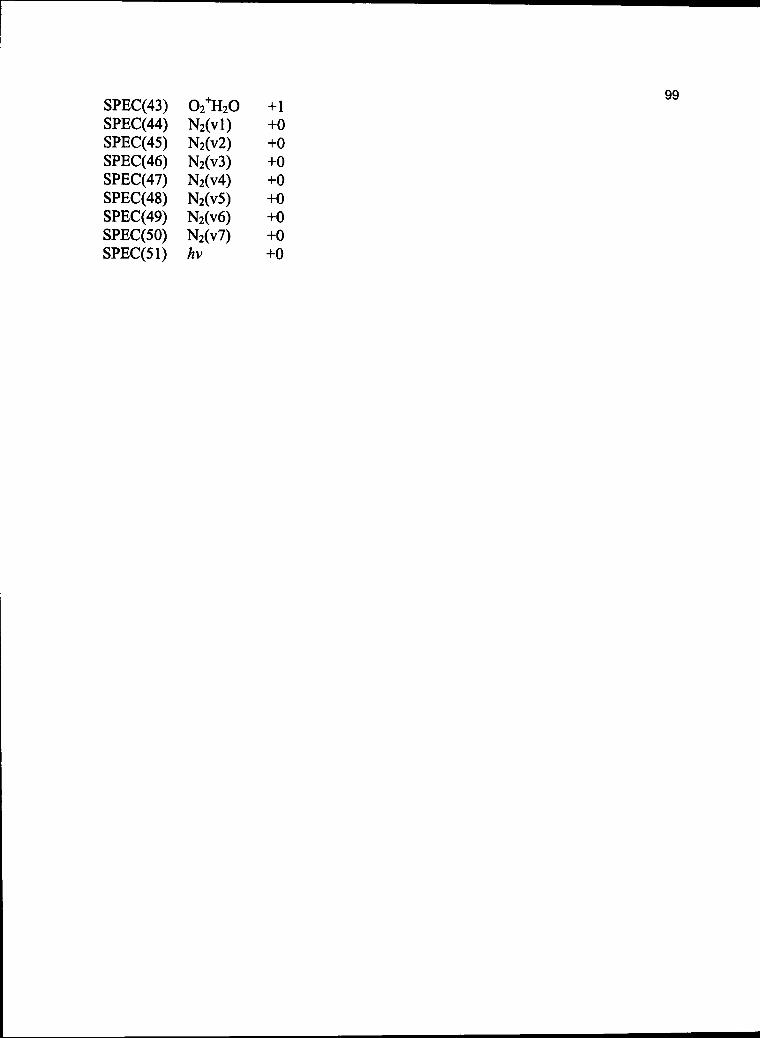
SPEC(43) 02+H20SPEC(44)
SPEC(45)
SPEC(46)
SPEC(47)
SPEC(48)
SPEC(49)
SPEC(50)
SPEC(51)
N2(vl)
N2(v2)
N2(v3)
N2(v4)
N2(v5)
N2(v6)
N2(v7)
hv
+1
+0
+0
+0
+0
+0
+0
+0
+0
99
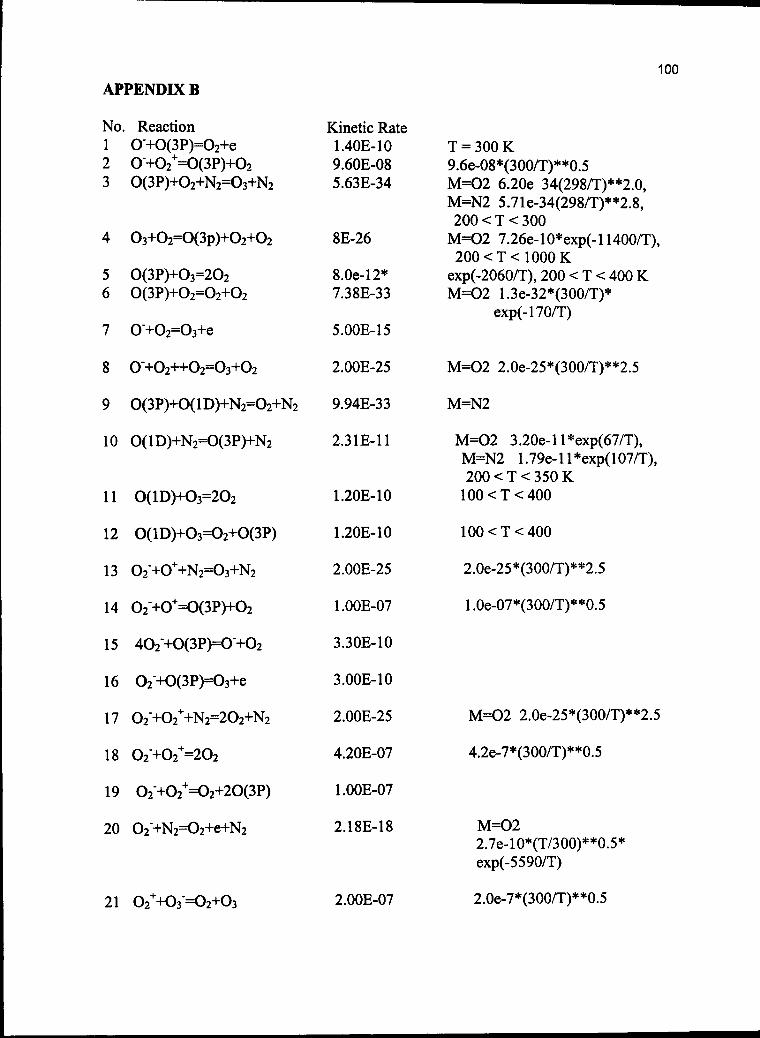
APPENDIX B
100
No. Reaction
1 O+O(3P)=O2+e
2 O+O2+=O(3P)+O23 O(3P)+O2+N2=O3+N2
4 O3+O2=O(3p)+O2+O2
5 O(3P)+O3=2O2
6 O(3P)+O2=O2+O2
7 O+O2=O3+e
8 O+O2++O2=O3+O2
9 O(3P)+O(1D)+N2=O2+N2
10 O(1D)+N2=O(3P)+N2
11 O(1D)+O3=2O2
12 O(1D)+O3=O2+O(3P)
13 O2'+O++N2=O3+N2
14 O2+O+=O(3P)+O2
15 4O2+O(3P)=O+O2
16 02"+0(3P)O3+e
17 O2"+O2++N2=2O2+N2
18 02>02+=202
19 O2+O2+=O2+2O(3P)
20
Kinetic Rate
1.40E-10
9.60E-08
5.63E-34
8E-26
T = 300 K
9.6e-08*(300/T)**0.5
M=O2 6.20e 34(298/T)**2.0,
M=N2 5.71e-34(298/T)**2.8,
200 < T < 300
M=O2 7.26e-10*exp(-11400/T),
200 <T< 1000 K
8.0e-12*
7.38E-33
5.00E-15
2.00E-25
9.94E-33
2.31E-11
1.20E-10
1.20E-10
2.00E-25
1.00E-07
3.30E-10
3.00E-10
2.00E-25
4.20E-07
1.00E-07
2.18E-18
exp(-2060/T), 200 < T < 400 K
M=O2 1.3e-32*(300/T)*
exp(-170/T)
M=O2 2.0e-25*(300/T)**2.5
M=N2
M=O2 3.20e-11 *exp(67/T),
M=N2 1.79e-ll*exp(107/T),
200 < T < 350 K
100<T<400
100<T<400
2.0e-25*(300/T)**2.5
1.0e-07*(300/T)**0.5
M=O2 2.0e-25*(300/T)**2J
4.2e-7*(300/T)**0.5
M=O2
2.7e-10*(T/300)**0.5*
exp(-5590/T)
21 O2++O3"=O2+O3 2.00E-07 2.0e-7*(300/T)**0.5
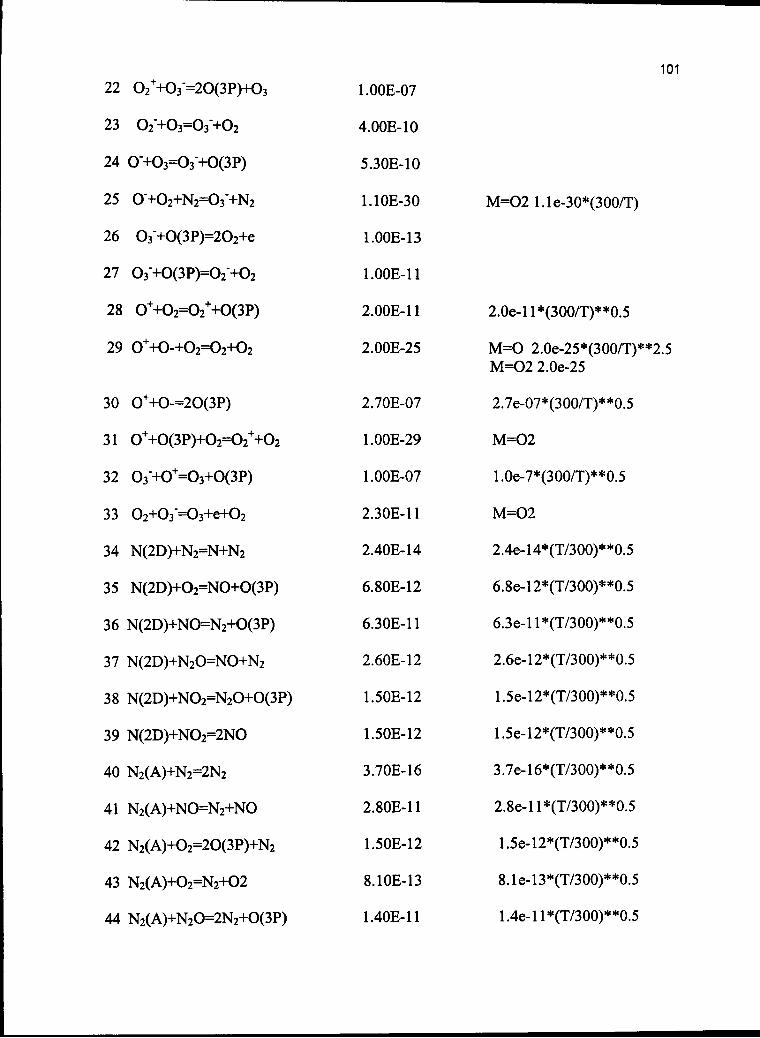
101
22 O2++O3~=2O(3P)+O3
23 O
24 O~+O3=O3 +O(3P)
25 O"+O2+N2=O3"+N2
26 O3~+O(3P)=2O2+e
27 O3+O(3P)=O2+O2
28 O++O2=O2++O(3P)
29 O++O-+O2=O2+O2
30 O++O-=2O(3P)
31 O++O(3P)+O2=O2++O2
32 O3+O+=O3+O(3P)
33 O2+O3'=O3+e+O2
34 N(2D)+N2=N+N2
35 N(2D)+O2=NO+O(3P)
36 N(2D)+NO=N2+O(3P)
37 N(2D)+N2O=NO+N2
38 N(2D)+NO2=N2O+O(3P)
39 N(2D)+NO2=2NO
40 N2(A)+N2=2N2
41 N2(A)+NO=N2+NO
42 N2(A)+O2=2O(3P)+N2
43 N2(A)+O2=N2+O2
44 N2(A)+N2O=2N2+O(3P)
1.00E-07
4.00E-10
5.30E-10
1.10E-30
1.00E-13
1.00E-11
2.00E-11
2.00E-25
2.70E-07
1.00E-29
1.00E-07
2.30E-11
2.40E-14
6.80E-12
6.30E-11
2.60E-12
1.50E-12
1.50E-12
3.70E-16
2.80E-11
1.50E-12
8.10E-13
1.40E-11
M=O2 l.le-30*(300/T)
2.0e-ll*(300/T)**0.5
M=O 2.0e-25*(300/T)**2.5
M=O2 2.0e-25
2.7e-07*(300/T)**0.5
M=O2
1.0e-7*(300/T)**0.5
M=O2
2.4e-14*(T/300)**0.5
6.8e-12*(T/300)**0.5
6.3e-ll*(T/300)**0.5
2.6e-12*(T/300)**0.5
1.5e-12*(T/300)**0.5
1.5e-12*(T/300)**0.5
3.7e-16*(T/300)**0.5
2.8e-ll*(T/300)**0.5
1.5e-12*(T/300)**0.5
8.1e-13*(T/300)**0.5
1.4e-ll*(T/300)**0.5
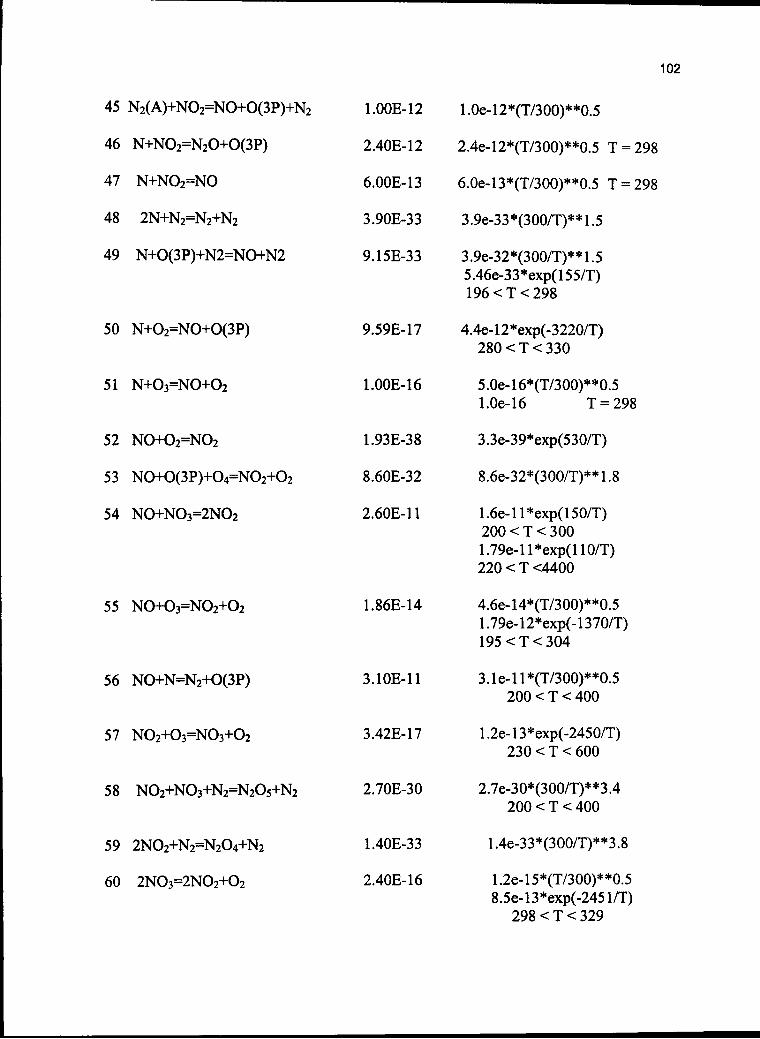
102
45
46
47
48
49
50
N2(A)+NO2=NO+O(3P)+N2
N+NO2=N2O+O(3P)
N+NO2=NO
2N+N2=N2+N2
N+O(3P)+N2=NO+N2
N+O2=NO+O(3P)
1.00E-12
2.40E-12
6.00E-13
3.90E-33
9.15E-33
9.59E-17
1.0e-12*(T/300)**0.5
2.4e-12*(T/300)**0.5
6.0e-13*(T/300)**0.5
3.9e-33*(300/T)**1.5
3.9e-32*(300/T)**1.5
5.46e-33*exp(155/T)
196<T<298
4.4e-12*exp(-3220/T)
280 < T < 330
51 N+O3=NO+O2
52 NO+O2=NO2
53 NO+O(3P)+O4=NO2+O2
54 NO+NO3=2NO2
55 NO+O3=NO2+O2
56 NO+N=N2+O(3P)
57 NO2+O3=NO3+O2
58 NO2+NO3+N2=N2O5+N2
59 2NO2+N2=N2O4+N2
60 2NO3=2NO2+O2
1.00E-16 5.0e-16*(T/300)**0.5
1.0e-16 T = 298
1.93E-38
8.60E-32
2.60E-11
1.86E-14
3.10E-11
3.42E-17
2.70E-30
1.40E-33
2.40E-16
3.3e-39*exp(530/T)
8.6e-32*(300/T)**1.8
1.6e-ll*exp(150/T)
200 < T < 300
1.79e-ll*exp(110/T)
220 < T <4400
4.6e-14*(T/300)**0.5
1.79e-12*exp(-1370/T)
195<T<304
3.1e-ll*(T/300)**0.5
200 < T < 400
1.2e-13*exp(-2450/T)
230 < T < 600
2.7e-30*(300/T)**3.4
200 < T < 400
1.4e-33*(300/T)**3.8
1.2e-15*(T/300)**0.5
8.5e-13*exp(-2451/T)
298 < T < 329
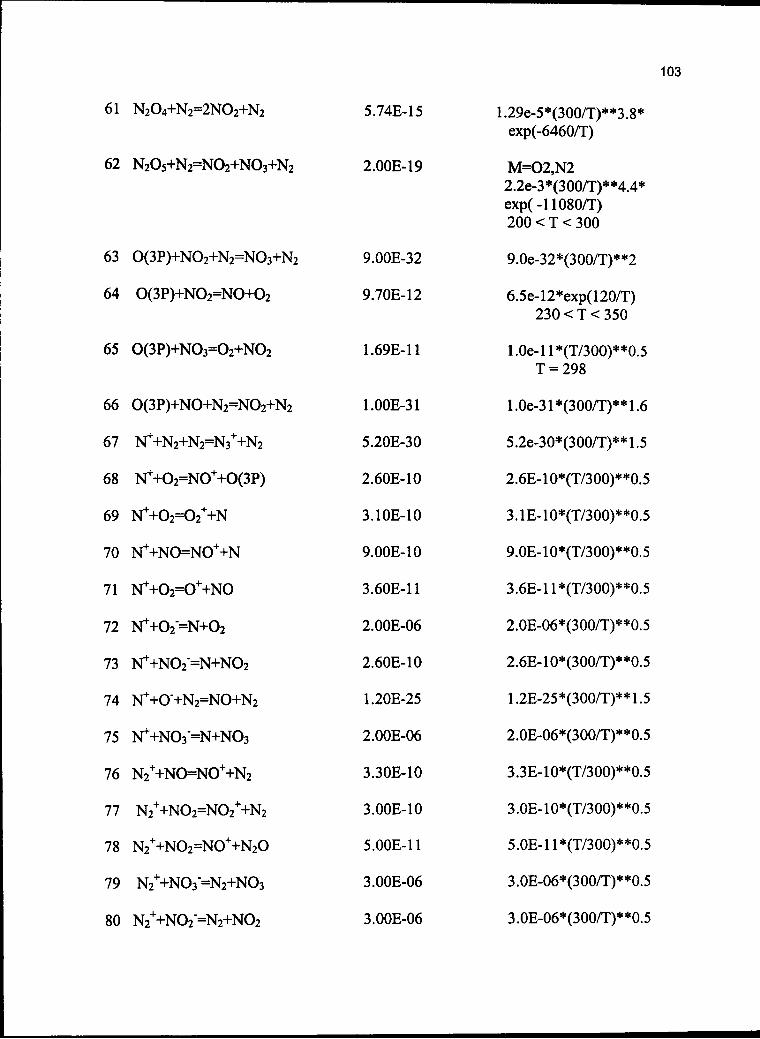
103
61
62
63 O(3P)+NO2+N2=NO3+N2
64 O(3P)+NO2=NO+O2
65 O(3P)+NO3=O2+NO2
66 O(3P)+NO+N2=NO2+N2
67 N++N2+N2=N3++N2
68 N++O2=NO++O(3P)
69 N++O2=O2++N
70 N++NO=NO++N
71 N++O2=O++NO
72 N++O2"=N+O2
73 N++NO2"=N+NO2
74 N++O'+N2=NO+N2
75 Nf+NO3"=N+NO3
76 N2++NO=NO++N2
77 N2++NO2=NO2++N2
78 N2++NO2=NO++N2O
79 N2++NO3"=N2+NO3
80 N2++NO2"=N2+NO2
5.74E-15
2.00E-19
9.00E-32
9.70E-12
1.69E-11
1.00E-31
5.20E-30
2.60E-10
3.10E-10
9.00E-10
3.60E-11
2.00E-06
2.60E-10
1.20E-25
2.00E-06
3.30E-10
3.00E-10
5.00E-11
3.00E-06
3.00E-06
1.29e-5*(300/T)**3.8*
exp(-6460/T)
M=O2,N2
2.2e-3*(300/T)**4.4*
exp(-11080/T)
200 < T < 300
9.0e-32*(300/T)**2
6.5e-12*exp(120/T)
230<T<350
1.0e-ll*(T/300)**0.5
T = 298
1.0e-31*(300/T)**1.6
5.2e-30*(300/T)**1.5
2.6E-10*(T/300)**0.5
3.1E-10*(T/300)**0.5
9.0E-10*(T/300)**0.5
3.6E-ll*(T/300)**0.5
2.0E-06*(300/T)**0.5
2.6E-10*(300/T)**0.5
1.2E-25*(300/T)**1.5
2.0E-06*(300/T)**0.5
3.3E-10*(T/300)**0.5
3.0E-10*(T/300)**0.5
5.OE-11*(T/3OO)**O.5
3.0E-06*(300/T)**0.5
3.0E-06*(300/T)**0.5
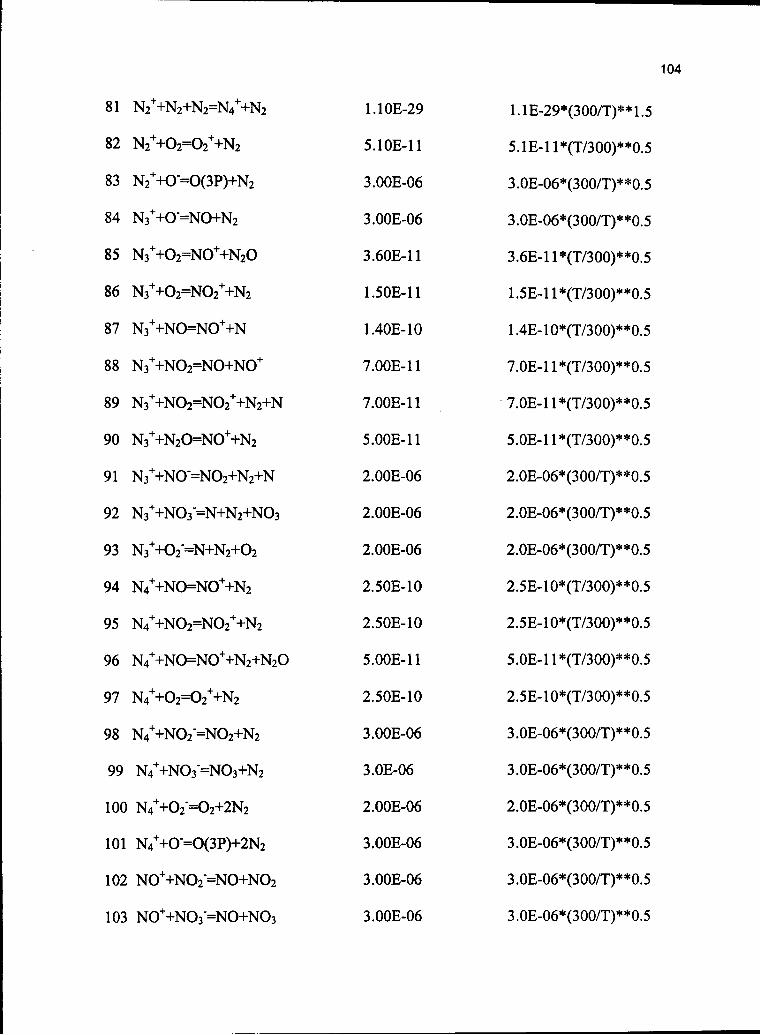
104
81 N
82 N2++O2=O2++N2
83 N2++O=O(3P)+N2
84 N3++O"=NO+N2
85 N3++O2=NO++N2O
86 N3++O2=NO2++N2
87 N3++NO=NO++N
88 N3++NO2=NO+NO+
89 N3++NO2=NO2++N2+N
90 N3++N2O=NO++N2
91 N3++NO"=NO2+N2+N
92 N3++NO3"=N+N2+NO3
93 N3++O2=N+N2+O2
94 N4++NO=NO++N2
95 N4++NO2=NO2++N2
96 N4++NO=NO++N2+N2O
97 N4++O2=O2++N2
98 N4++NO2"=NO2+N2
99 N4++NO3"=NO3+N2
100 N4++O2'=O2+2N2
101 N4++O=O(3P)+2N2
102 NO++NO2=NO+NO2
103 NO++NO3=NO+NO3
1.10E-29
5.10E-11
3.00E-06
3.00E-06
3.60E-11
1.50E-11
1.40E-10
7.00E-11
7.00E-11
5.00E-11
2.00E-06
2.00E-06
2.00E-06
2.50E-10
2.50E-10
5.00E-11
2.50E-10
3.00E-06
3.0E-06
2.00E-06
3.00E-06
3.00E-06
3.00E-06
1.1E-29*(3OO/T)**1.5
5.1E-ll*(T/300)**0.5
3.0E-06*(300/T)**0.5
3.0E-06*(300/T)**0.5
3.6E-ll*(T/300)**0.5
1.5E-ll*(T/300)**0.5
1.4E-10*(T/300)**0.5
7.0E-ll*(T/300)**0.5
7.0E-ll*(T/300)**0.5
5.0E-ll*(T/300)**0.5
2.0E-06*(300/T)**0.5
2.0E-06*(300/T)**0.5
2.0E-06*(300/T)**0.5
2.5E-10*(T/300)**0.5
2.5E-10*(T/300)**0.5
5.OE-11*(T/3OO)**O.5
2.5E-10*(T/300)**0.5
3.0E-06*(300/T)**0.5
3.0E-06*(300/T)**0.5
2.0E-06*(300/T)**0.5
3.0E-06*(300/T)**0.5
3.0E-06*(300/T)**0.5
3.0E-06*(300/T)**0.5
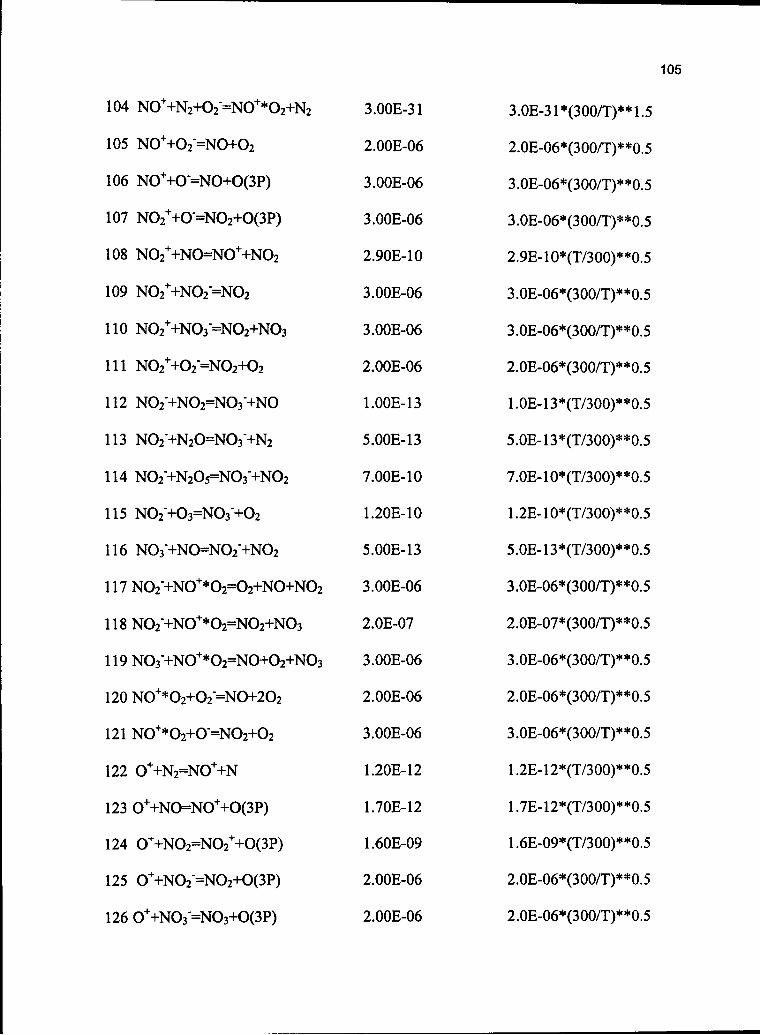
105
104 NO++N2+O2"=NO+*O2+N2 3.00E-31
105 NO++O2"=NO+O2 2.00E-06
106 NO++O=NO+O(3P) 3.00E-06
107 NO2++O'=NO2+O(3P) 3.00E-06
108 NO2++NO=NO++NO2 2.90E-10
109 NO2++NO2"=NO2 3.00E-06
110 NO2++NO3'=NO2+NO3 3.00E-06
111 NO2++O2"=NO2+O2 2.00E-06
112 NO2'+NO2=NO3"+NO 1.00E-13
113 NO2'+N2O=NO3"+N2 5.00E-13
114 NO2"+N2O5=NO3"+NO2 7.00E-10
115 NO2"+O3=NO3"+O2 1.20E-1O
116 NO3'+NO=NO2'+NO2 5.00E-13
117 NO2"+NO+*O2=O2+NO+NO2 3.00E-06
118 NO2'+NO+*O2=NO2+NO3 2.0E-07
119 NO3'+NO+*O2=NO+O2+NO3 3.00E-06
120 NO+*O2+O2"=NO+2O2 2.00E-06
121 NO+*O2+O"=NO2+O2 3.00E-06
122 O++N2=NO++N 1.20E-12
123 0++NONO++0(3P) 1.70E-12
124 O++NO2=NO2++O(3P) 1.60E-09
125 O++NO2"=NO2+O(3P) 2.00E-06
126 O++NO3"=NO3+O(3P) 2.00E-06
3.0E-31*(300/T)**1.5
2.0E-06*(300/T)**0.5
3.0E-06*(300/T)**0.5
3.0E-06*(300/T)**0.5
2.9E-10*(T/300)**0.5
3.0E-06*(300/T)**0.5
3.0E-06*(300/T)**0.5
2.0E-06*(300/T)**0.5
1.0E-13*(T/300)**0.5
5.0E-13*(T/300)**0.5
7.0E-10*(T/300)**0.5
1.2E-10*(T/300)**0.5
5.0E-13*(T/300)**0.5
3.0E-06*(300/T)**0.5
2.0E-07*(300/T)**0.5
3.0E-06*(300/T)**0.5
2.0E-06*(300/T)**0.5
3.0E-06*(300/T)**0.5
1.2E-12*(T/300)**0.5
1.7E-12*(T/300)**0.5
1.6E-09*(T/300)**0.5
2.0E-06*(300/T)**0.5
2.0E-06*(300/T)**0.5
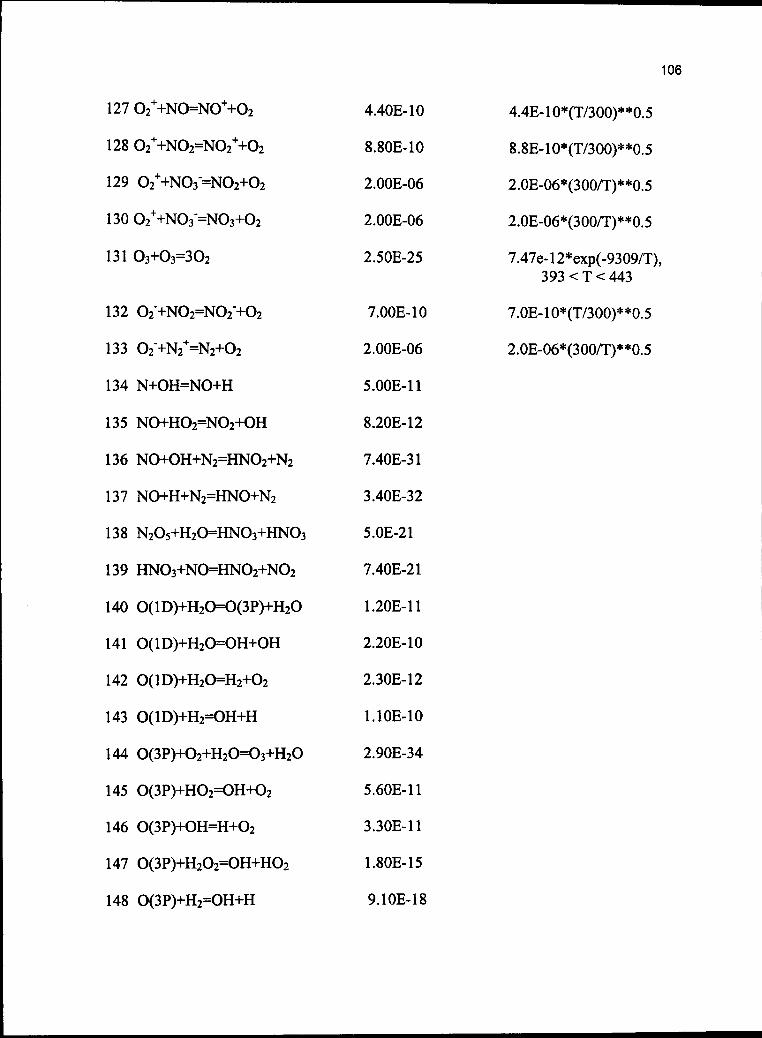
S0**(l/00£)*90-30#3
SO**(OO£/I)*OI-3O"Z.
S0**(l/00£)*90-30<3
S0**(00£/l)*0l-38'8
81-301*6
SI-308"I
ll-30££
11-309S
fr£"3063
01-3011
3I"30£3
01-3033
11-303'I
IZ-ZOVL
I3-30-S
3£W£
K-ROVL
31-303-8
II-300'S
90-3003
01-3007,
S3-30S"3
90-3003
90-3003
Ot-3088
H+HO=zH+(d£)O
sOH+HO=zOrH+(d£)O
2O+H=HO+(d£)O
zO+HO=zOH+(d£)O
O2H+eO=O2H+2O+(d£)O
H+HO=zH+(dl)O
zO+zK=OzK+(ai)O
HO+HO=OzH+(ai)O
O3H+(d£)O=O2H+(ai)O
zON+zONH=ON+eONH
£ONH+£ONH=O^O^
rN+ONH=3N+H+ON
^^ONH^M+HO+ON
HO+3ON=rOH+ON
H+ON=HO+N
2O£=eO+£O
^O+£ON=£ON+^0
^O+^OM=£OM+^0
^0+^OM=^OM+^0
sn
Ln
9H
vvL
in
zn
in
on
6£l
8£I
Li\
9£I
SET
t^£T
££l
3£I
Ul
0£l
631
831
+ZOLZl
901
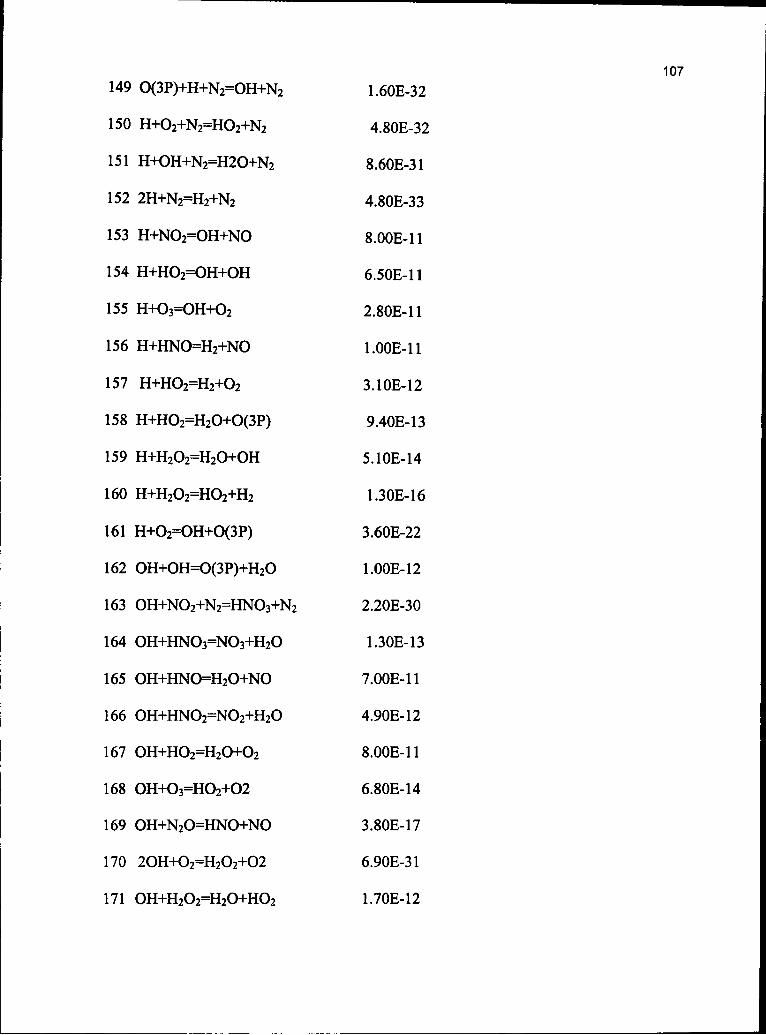
149 O(3P)+H+N2=OH+N2
150 H+O2+N2=HO2+N2
151 H+OH+N2=H2O+N2
152 2H+N2=H2+N2
153 H+NO2=OH+NO
154 H+HO2=OH+OH
155 H+O3=OH+O2
156 H+HNO=H2+NO
157 H+HO2=H2+O2
158 H+HO2=H2O+O(3P)
159 H+H2O2=H2O+OH
160 H+H2O2=HO2+H2
161 H+O2=OH+O(3P)
162 OH+OH=O(3P)+H2O
163 OH+NO2+N2=HNO3+N2
164 OH+HNO3=NO3+H2O
165 OH+HNO=H2O+NO
166 OH+HNO2=NO2+H2O
167 OH+HO2=H2O+O2
168 OH+O3=HO2+O2
169 OH+N2O=HNO+NO
170 2OH+O2=H2O2+O2
171 OH+H2O2=H2O+HO2
107
1.60E-32
4.80E-32
8.60E-31
4.80E-33
8.00E-11
6.50E-11
2.80E-11
1.00E-11
3.10E-12
9.40E-13
5.10E-14
1.30E-16
3.60E-22
1.00E-12
2.20E-30
1.30E-13
7.00E-11
4.90E-12
8.00E-11
6.80E-14
3.80E-17
6.90E-31
1.70E-12
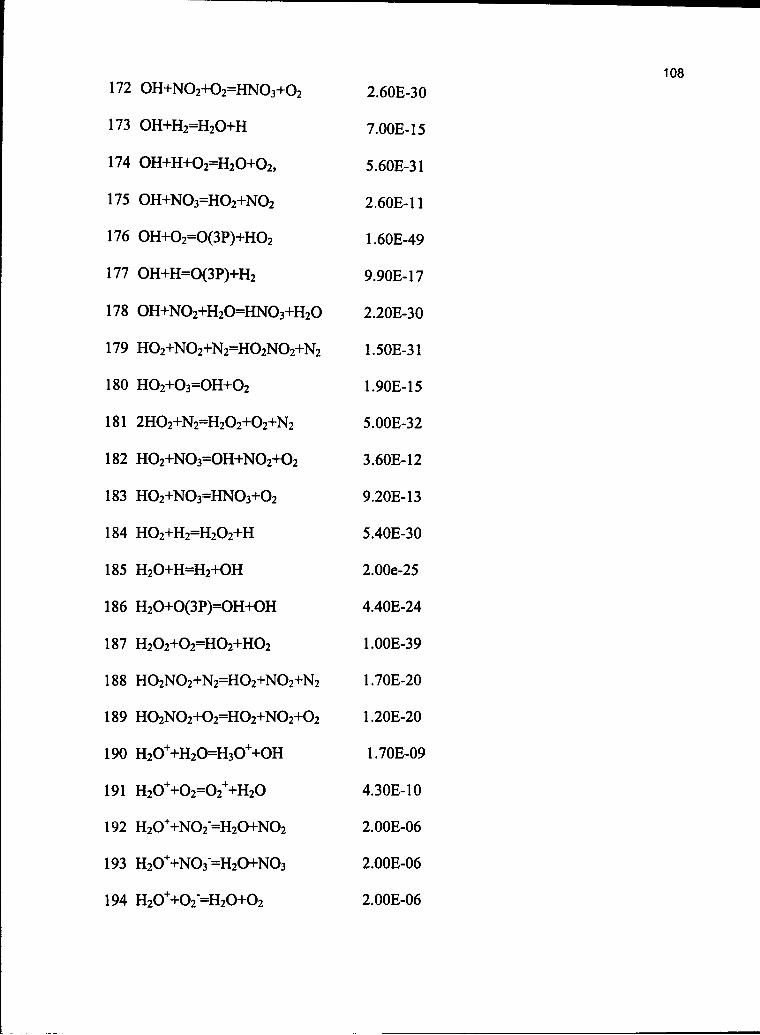
90-3003
90-3003
90-3003
60-30Z.I
03-303"I
03-30Z.I
6£"300I
S3-9003
£1-3036
3I"309£
3£-300S
SI-3061
I£-305*I
0£-303"3
Z,I-3066
6^-309"I
H-3093
l£-309S
SI-R00L
0£-3093
eON+O2H=eON++OeH£61
JON+OzH=zON++OeH361
OzH++2O=zO++OrH161
HO++OeH=OzH++OrH061
*O+2ON+zOH=zO+zONrOH681
zN+i:ON+zOH=3N+zON3OH881
LSI
HO+HO=(d£)O+O3H981
HO+ZH=H+OZHS8I
E+ZOZU=ZU+ZOB.Wl
2O+£ONH=eON+2OH£81
381
181
JO+HO=£O+ZOH081
zN+zONzOH=*N+2ON+rOH6Z.I
O2H+eONH=C^H+zON+HO8Z.I
zH+(d£)O=H+HOLL\
2OH+(d£)O=3O+HO9Z-1
801-
SL\
'ZO+OZH=ZO+H+HOHI
H+O^H+HOZLl
ZO+£ONH=ZO+ZON+HOZLl
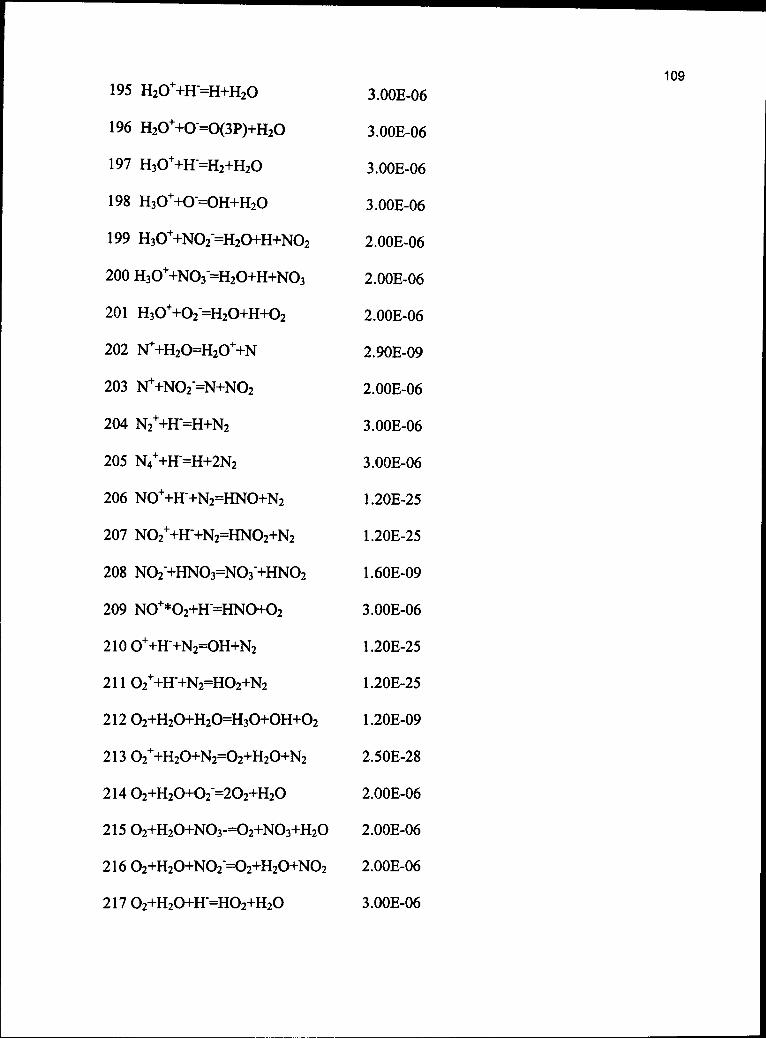
109
195 H2O++H=H+H2O 3.00E-06
196 H2O++O=O(3P)+H2O 3.00E-06
197 H3O++H-=H2+H2O 3.00E-06
198 H3O++O=OH+H2O 3.00E-06
199 H3O++NO2=H2O+H+NO2 2.00E-06
200 H3O++NO3"=H2O+H+NO3 2.00E-06
201 H3O++O2"=H2O+H+O2 2.00E-06
202 IST+HzOH^+N 2.90E-09
203 N++NO2=N+NO2 2.00E-06
204 N2++H=H+N2 3.00E-06
205 N4++H=H+2N2 3.00E-06
206 NO++H"+N2=HNO+N2 1.20E-25
207 NO2++H>N2=HNO2+N2 1.20E-25
208 NO2'+HNO3=NO3"+HNO2 1.60E-09
209 NO+*O2+H=HNO+O2 3.00E-06
210 O++H+N2=OH+N2 1.20E-25
211 O2++H-+N2=HO2+N2 1.20E-25
212 O2+H2O+H2O=H3O+OH+O2 1.20E-09
213 O2++H2O+N2=O2+H2O+N2 2.50E-28
214 O2+H2O+O2=2O2+H2O 2.00E-06
215 O2+H2O+NO3-=O2+NO3+H2O 2.00E-06
216 O2+H2O+NO2"=O2+H2O+NO2 2.00E-06
217 O2+H2O+H"=HO2+H2O 3.00E-06
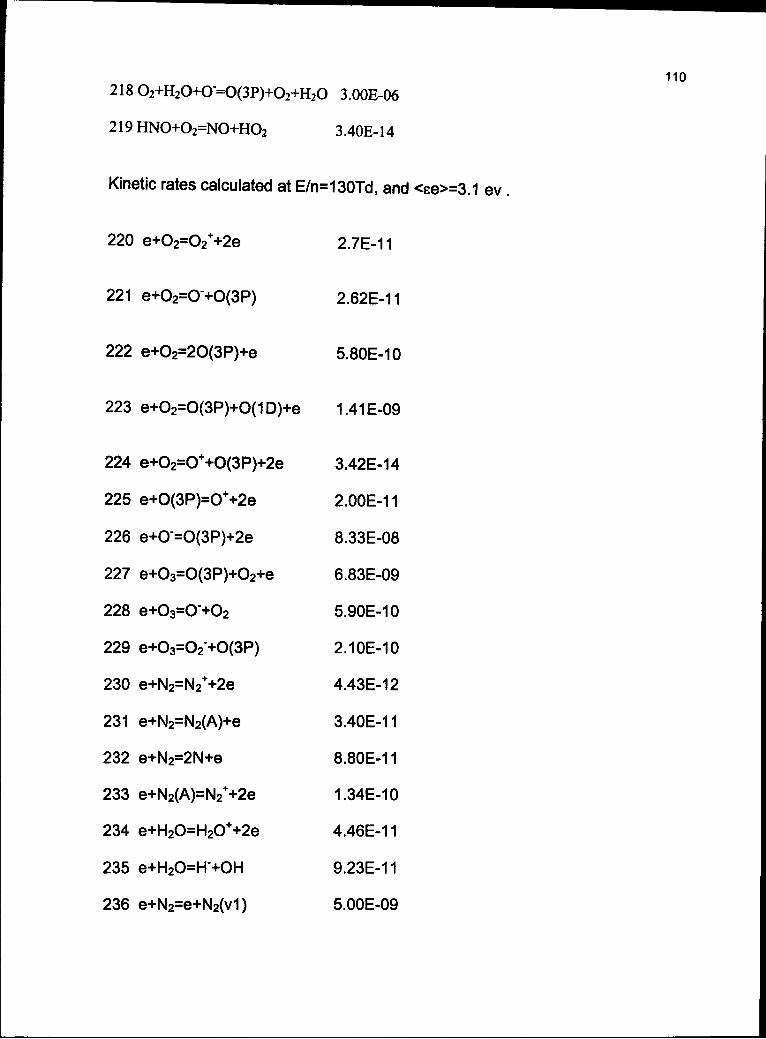
218 O2+H2O+O-=O(3P)+O2+H2O 3.00E-06
219 HNO+O2=NO+HO2 3.40E-14
Kinetic rates calculated at E/n=130Td, and <ee>=3.1 ev
110
220 e+O2=O2++2e
221 e+O2=O>O(3P)
222 e+O2=2O(3P)+e
224 e+O2=O++O(3P)+2e
225 e+O(3P)=O++2e
226 e+O=O(3P)+2e
227 e+O3=O(3P)+O2+e
228 e+O3=O"+O2
229 e+O3=O2>O(3P)
230 e+N2=N2++2e
231 e+N2=N2(A)+e
232 e+N2=2N+e
233 e+N2(A)=N2++2e
234 e+H2O=H2O++2e
235 e+H2O=H+OH
236 e+N2=e+N2(v1)
2.7E-11
2.62E-11
5.80E-10
223 e+O2=O(3P)+O(1D)+e 1.41E-09
3.42E-14
2.00E-11
8.33E-08
6.83E-09
5.90E-10
2.10E-10
4.43E-12
3.40E-11
8.80E-11
1.34E-10
4.46E-11
9.23E-11
5.00E-09
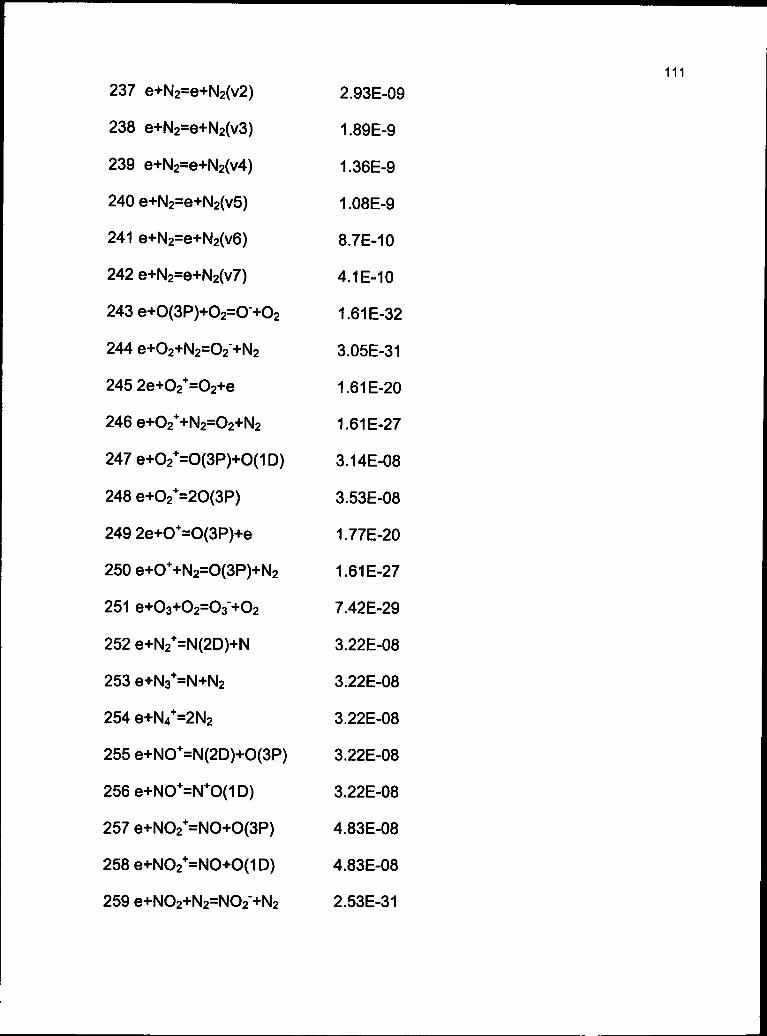
111
237 e+N2=e+N2(v2) 2.93E-09
238 e+N2=e+N2(v3) 1.89E-9
239 e+N2=e+N2(v4) 1.36E-9
240 e+N2=e+N2(v5) 1.08E-9
241 e+N2=e+N2(v6) 8.7E-10
242 e+N2=e+N2(v7) 4.1E-10
243 e+O(3P)+O2=O"+O2 1.61 E-32
244 e+O2+N2=O2"+N2 3.05E-31
245 2e+O2+=O2+e 1.61E-20
246 e+O2++N2=O2+N2 1.61 E-27
247 e+O2+=O(3P)+O(1 D) 3.14E-08
248 e+O2+=2O(3P) 3.53E-08
249 2e+O+=O(3P)+e 1.77E-20
250 e+O++N2=O(3P)+N2 1.61 E-27
251 e+O3+O2=O3"+O2 7.42E-29
252 e+N2+=N(2D)+N 3.22E-08
253 e+N3+=N+N2 3.22E-08
254 e+N4+=2N2 3.22E-08
255 e+NO+=N(2D)+O(3P) 3.22E-08
256e+NO+=N+O(1D) 3.22E-08
257 e+NO2+=NO+O(3P) 4.83E-08
258e+NO2+=NO+O(1D) 4.83E-08
259 e+NO2+N2=NO2"+N2 2.53E-31
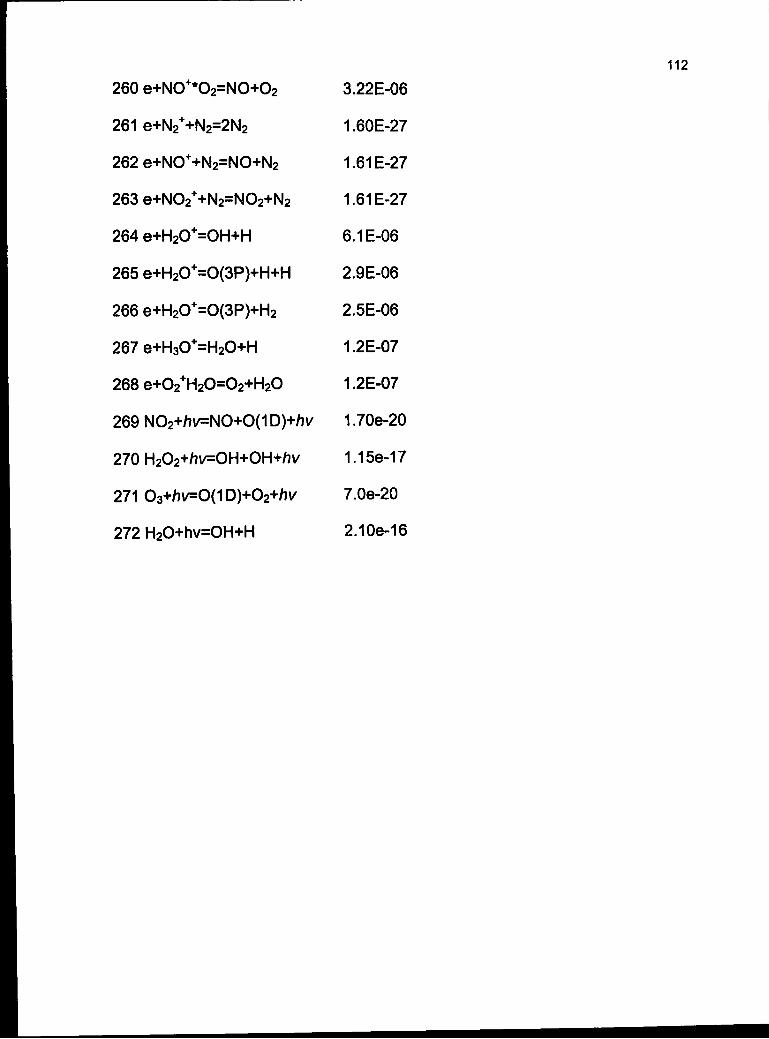
112
260 e+NO+*O2=NO+O2
261 e+N2++N2=2N2
262 e+NO++N2=NO+N2
263 e+NO2++N2=NO2+N2
264 e+H2O+=OH+H
265 e+H2O+=O(3P)+H+H
266 e+H2O+=O(3P)+H2
267 e+H3O+=H2O+H
268 e+O2+H2O=O2+H2O
269 NO2+/)V=NO+O(1D)+h
270 H2O2+/)v=OH+OH+/)v
271 O3+hv=O^D)+O2+hv
272 H2O+hv=OH+H
3.22E-06
1.60E-27
1.61E-27
1.61E-27
6.1E-06
2.9E-06
2.5E-06
1.2E-07
1.2E-07
1.70e-20
1.15e-17
7.0e-20
2.10e-16
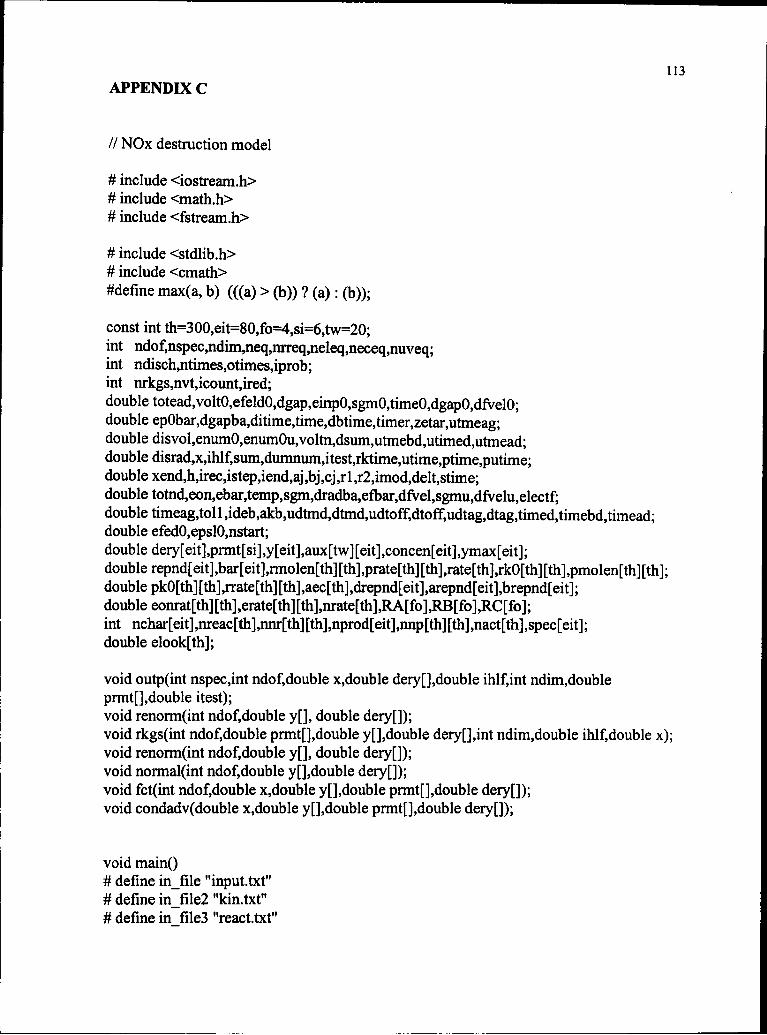
113
APPENDIX C
// NOx destruction model
# include <iostream.h>
# include <math.h>
# include <fstream.h>
# include <stdlib.h>
# include <cmath>
#define max(a, b) (((a) > (b)) ? (a) : (b));
const int th=300,eit=80,fo=4,si=6,tw=20;
int ndof,nspec,ndim,neq,nrreq,neleq,neceq,nuveq;int ndisch,ntimes,otimes,iprob;int nrkgs,nvt,icount,ired;
double totead,voltO,efeldO,dgap,einpO,sgmO,timeO,dgapO,dfvelO;double epObar,dgapba,ditime,time,dbtime,timer,zetar,utmeag;double disvol,enumO,enumOu,voltn,dsum,utmebd,utimed,utmead;double disrad,x,ihlf,sum,dumnum,itest,rktime,utime,ptime,putime;double xend,h,irec,istep,iend,aj,bj,cj,rl ,r2,imod,delt,stime;
double totnd,eon,ebar,temp,sgm,dradba,efbar,dfVel,sgmu,dfvelu,electf;
double timeag,tol 1 ,ideb,akb,udtmd,dtmd,udtoff,dtoff,udtag)dtag,timed,timebd,timead;double efedO,epslO,nstart;
double dery[eit],prmt[si],y[eit],aux[tw][eit],concen[eit],ymax[eit];
double repnd[eit],bar[eit],rmolen[th][th],prate[th][th],rate[th],rkO[th][th],pniolen[th][th];
double pkO[th][th],rrate[th][th],aec[th],drepnd[eit],arepnd[eit],brepnd[eit];
double eonrat[th][th],erate[th][th],nrate[th],RA[fo],RB[fo],RC[fo];
int nchar[eit],nreac[th],nnr[th][th],nprod[eit],nnp[th][tih],nact[th],spec[eit];
double elook[th];
void outp(int nspec,int ndof.double x,double dery[],double ihlf,int ndim,double
prmt[].double itest);
void renorm(int ndof,double y[], double dery[]);
void rkgs(int ndof,double prmt[],double y[],double dery[],int ndim.double ihlf,double x);
void renorm(int ndof.double y[], double dery[]);
void normal(int ndof,double y[],double dery[j);void fct(int ndof,double x.double y[],double prmt[],double dery[]);
void condadv(double x.double y[],double prmt[],double dery[]);
void main()
# define in_file "input.txt"
# define in_file2 "kin.txt"
# define in file3 "react.txt"
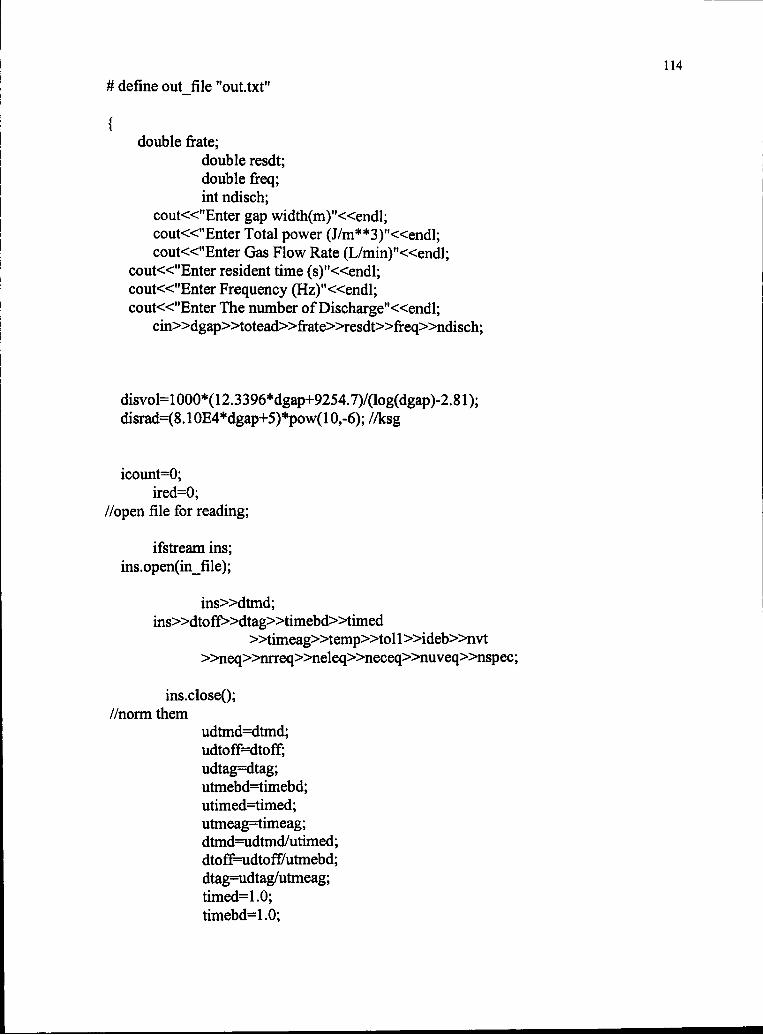
114
# define out file "out.txt"
double frate;
double resdt;
double freq;
int ndisch;
cout«"Enter gap width(m)"«endl;
cout«"Enter Total power (J/m**3)"«endl;
cout«"Enter Gas Flow Rate (L/min)"«endl;
cout«"Enter resident time (s)"«endl;
cout«"Enter Frequency (Hz)"«endl;
cout«"Enter The number ofDischarge"«endl;
cin»dgap»totead»frate»resdt»freq»ndisch;
disvol=1000*(12.3396*dgap+9254.7)/(log(dgap)-2.81);
disrad=(8.10E4*dgap+5)*pow(10,-6);//ksg
icount=0;
ired=0;
//open file for reading;
ifstream ins;
ins.open(in_file);
ins»dtmd;
ins»dtoff»dtag»timebd»timed
»timeag»temp»toll»ideb»nvt
»neq»nrreq»neleq»neceq»nuveq»nspec;
ins.close();
//norm them
udtmd=dtmd;
udtoff=dtoff;
udtag=dtag;
utmebd=timebd;
utimed=timed;
utmeag=timeag;
dtmd=udtmd/utimed;
dtoff=udtofCutmebd;
dtag=udtag/utmeag;
timed=1.0;
timebd=1.0;
115
timeag=1.0;
//end
//read data from file and norm them.
nstart=O.O;
ndof=l;
ifstream ink;
ink.open(in_file2);
for(int i=l;i<=nspec;i++)
ink»spec[i]»drepnd[i]»arepnd[i]»brepnd[i]»nchar[i];
ink.close();
for (i=l;i<=nspec;i++)
concen[i]=0.00;
enumOu=concen[ 1 ];
enumO=enumOu/repnd[ 1 ];
stime=4.0809e-2;
concen[4]=4.84e24;
concen[13]=1.96e25;
concenf 19]=2.2e22;
concen[20]=2.45e21;
concen[30]=4.89e22;
enumOu=concen[ 1 ];
enumO=enumOu/repnd[ 1 ];
//read symbolic reactions from file
//General(l-nrreq),
ifstream inr;
inr.open(in_file3);
for( i=l;i<=neq;i++)
inr»nreac[i]»nprod[i]»rate[i]»nact[i];
for (int jr=l Jr<=nreac[i];jr++)
inr»rmolen[i][jr]»nnr[i] [jr];
116
}for (int jp=lyp<=nprod[i]yp++)
{inr»pmolen[i] [jp]>>nnp[i] [jp];
inr.close();
for (i=l;i<=nrreq;i++)
rate[i]=rate[i]/le6;
//ready to run
nrkgs=ndisch;
if(ndof==2)
ndof=l;
else if (ndof=l)
ndof=0;
else
ndof=2;
rktime=0.00;
if(int(nstart)==O)
utime=0.00;
if(int(nstart)=l)
utime=stime;
//loop for discharge simulation
for (int iu=l;iu<=nrkgs;iu++)
{if(ndof==2)
ndof=0;
elseif(ndof=l)
ndof=2;
else
ndof=l;
double otimes;
ntimes=0;
otimes=0.0;
if(ndof==l)
117
concen[ 1 ]=totead*frate/(6.0e6)/disvol/(2* 1.60e-19);
concen[51]=2.0e-3*concen[l];
}else
{concen[ l]=0.00;
concen[51]=0.00;
}for (i=l;i<=nspec;i++)
{ymax[i]=0.00;
iprob=0;
ptime=rktime;
putime=utime;
ndim=nspec+3;
renonn(ndof,y,dery);
if(ndof=l)
concen[ 1 ]=enum0+concen[ 1 ];
ytl]=concen[l];
if(ndof==0)
)
y[l]=y[l]+y[nspec+3];
y[l]=0.00;
concen[l]=y[l];
y[nspec+l]=1.00;
concen[nspec+l]=y[nspec+l];
y[nspec+2]=1.00;
concen[nspec+2]=y[nspec+2];
y[nspec+3]=0.00;
concen[nspec+3]=y[nspec+3];
for (int io=l;io<=nspec;io++)
{if(nchar[io]!=0)
{y[io]=0.00;
concen[io]=y[io];
118
if(ndof=l)
{ if(iu=l)
y[ 1 ]=enumOu/repnd[ 1 ];
else
y[ 1 ]=enumOu/repnd[ 1]+y[ 1 ];
concen[l]=y[l];
y[nspec+l]=1.00;
concen[nspec+1 ]=y[nspec+1 ];
y[nspec+2]=0.00;
concen[nspec+2]=y[nspec+2];
y[nspec+3]=0.00;
concen[nspec+3]=y[nspec+3];
voltn=y[nspec+l];
if(ndof=2)
{y[nspec+l]=1.00;
concen[nspec+1 ]=y[nspec+1 ];
y[nspec+2]=1.00;
concen[nspec+2]=y[nspec+2];
normal(ndof,y,dery);
for (int jk=lyk<=nspecyk++)
{concen[jk]=y[jk];
}voltn=y[nspec+1 ];
dsum=0.00;
for (i=l;i<=nspec+3;i++)
{dsum=dsum+dery[i];
}prmt[l]=0.00;
prmt[4]=toll;
if(ndof==0)
{prmt[2]=1.0;
prmt[3]=dtoff;
}if(ndof=l)
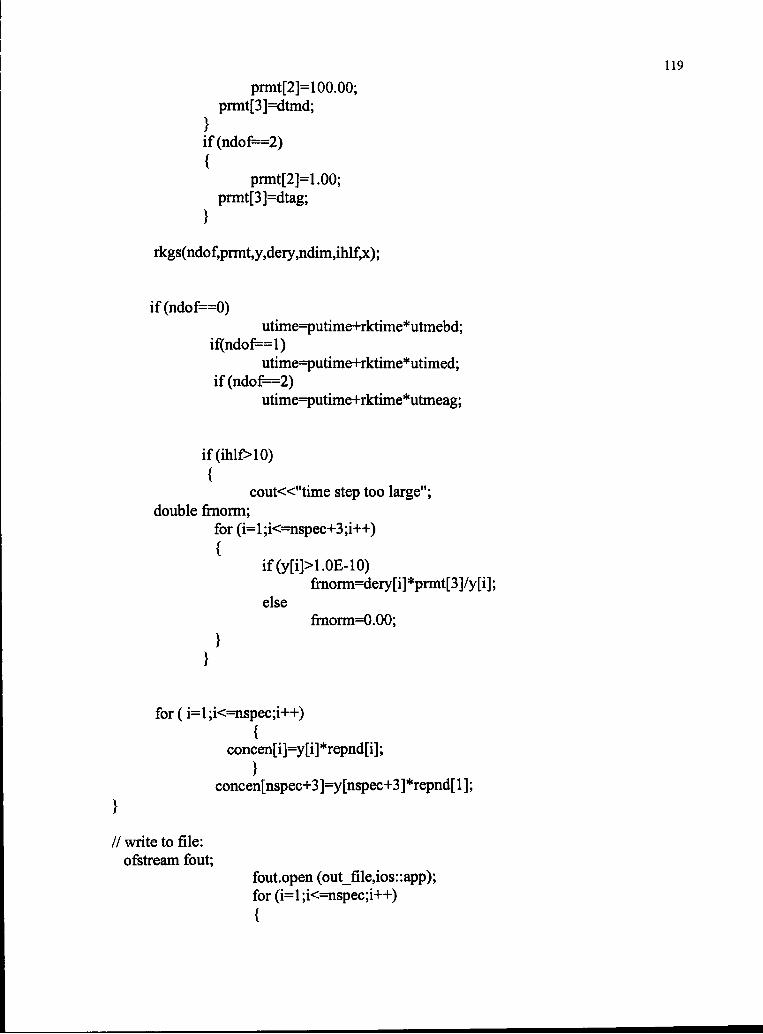
119
prmt[2]=100.00;
prmt[3]=dtmd;
}if(ndof==2)
{prmt[2]=1.00;
prmt[3]=dtag;
rkgs(ndof,prmt,y,dery,ndim,ihlf,x);
if(ndof==0)
utime=putime+rktime*utmebd;
if(ndof==l)
utime=putime+rktime*utimed;
if(ndof=2)
utime=putime+rktime*utmeag;
if(ihlf>10)
cout«"time step too large";
double frnorm;
for (i=l;i<=nspec+3;i++)
frnorm=dery[i]*prmt[3]/y[i];
else
frnorm=0.00;
for (i=l;i<=nspec;i++)
{concen[i]=y[i]*repnd[i];
}concen[nspec+3]=y[nspec+3]*repnd[l];
// write to file:
ofstream fout;
fout.open (out_file,ios::app);
for (i=l ;i<=nspec;i++)
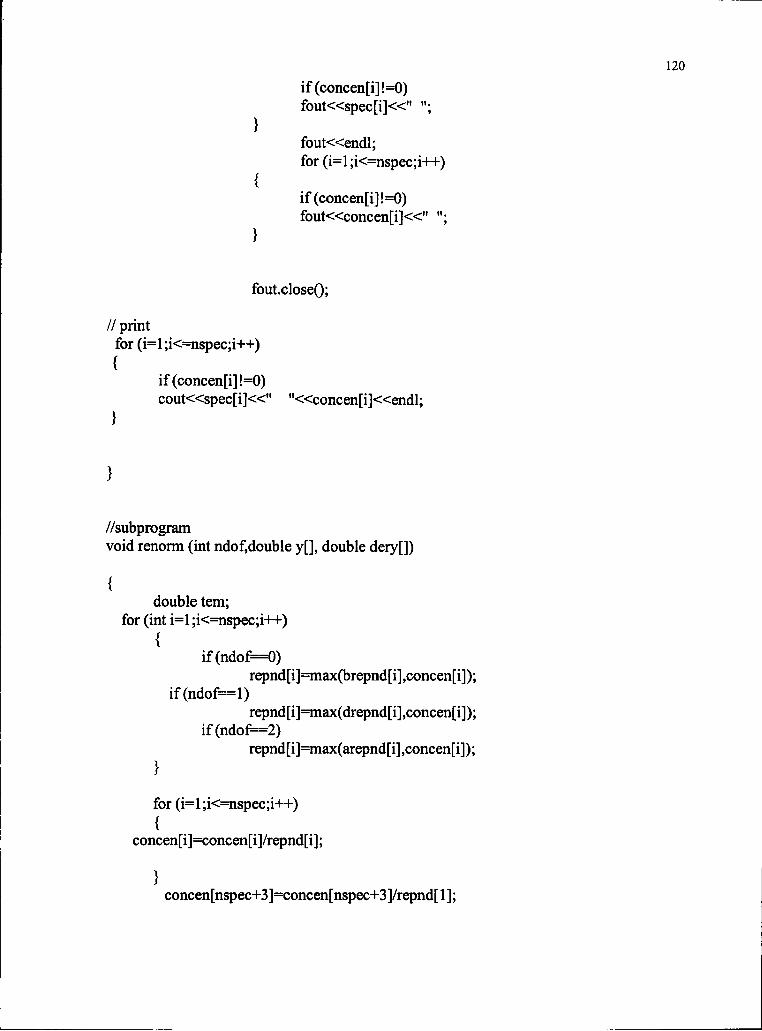
120
if(concen[i]!=0)
fout«spec[i]«" ";
fout«endl;
for (i=l;i<=nspec;i++)
if(concen[i]!=0)
fout«concen[i]«" ";
fout.close();
for (i=l;i<=nspec;i++)
if(concen[i]!=0)
cout«spec[i]«" "«concen[i]«endl;
//subprogram
void renorm (int ndof,double y[], double dery[])
double tern;
for (int i=l;i<=nspec;i++)
{if(ndof=0)
repnd[i]=max(brepnd[i],concen[i]);
if(ndof==l)
repnd[i]=max(drepnd[i],concen[i]);
if(ndof==2)
repnd[i]=max(arepnd[i],concen[i]);
for (i=l;i<=nspec;i++)
{concen[i]=concen[i]/repnd[i];
}concen[nspec+3]=concen[nspec+3]/repnd[l];
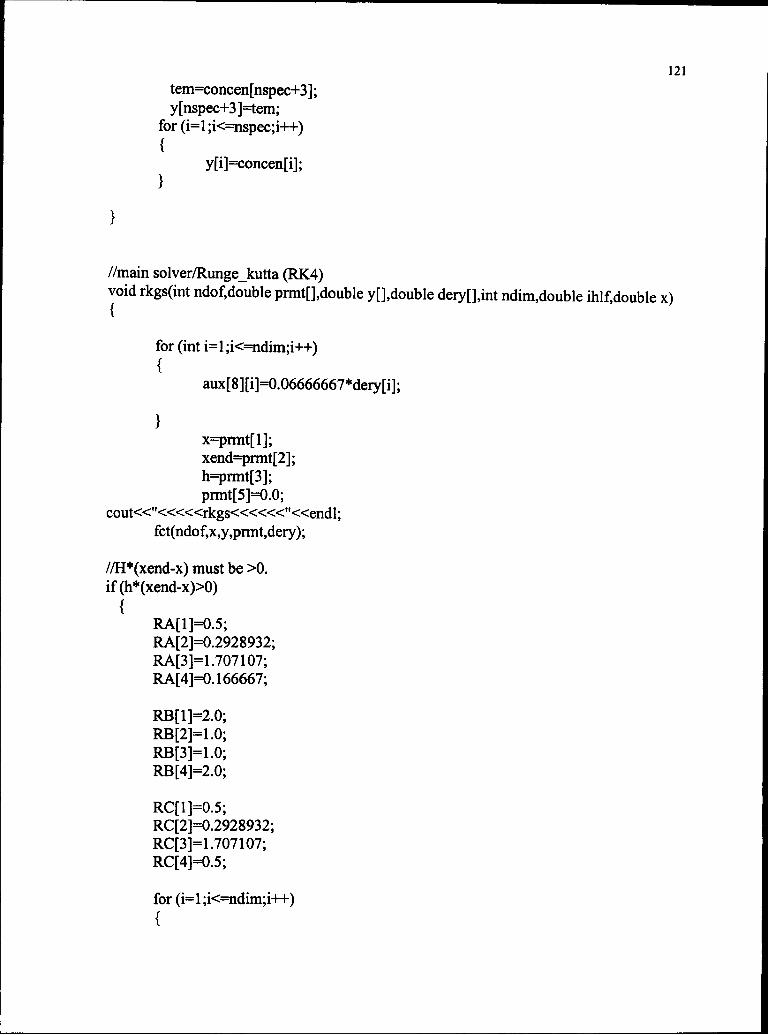
121
tem=concen[nspec+3];
y[nspec+3]=tem;
for (i=l;i<=nspec;i++)
{y[i]=concen[i];
//main solver/Runge_kutta (RK4)
void rkgs(int ndof.double pnnt[],double y[],double dery[],int ndim.double ihlf.double x)
for (int i=l;i<=ndim;i++)
{
aux[8][i]=0.06666667*dery[i];
x=prmt[l];
xend=pnnt[2];
h=prmt[3];
prmt[5]=0.0;
cout«"««<rkgs«««"«endl;
fct(ndof,x,y,prmt,dery);
//H*(xend-x) must be >0.
if(h*(xend-x)>0)
{RA[l]=0.5;
RA[2]=0.2928932;
RA[3]=1.707107;
RA[4]=0.166667;
RB[l]=2.0;
RB[2]=1.0;
RB[3]=1.0;
RB[4]=2.0;
RC[l]=0.5;
RC[2]=0.2928932;
RC[3]=1.707107;
RC[4]=0.5;
for (i=l;i<=ndim;i-H-)
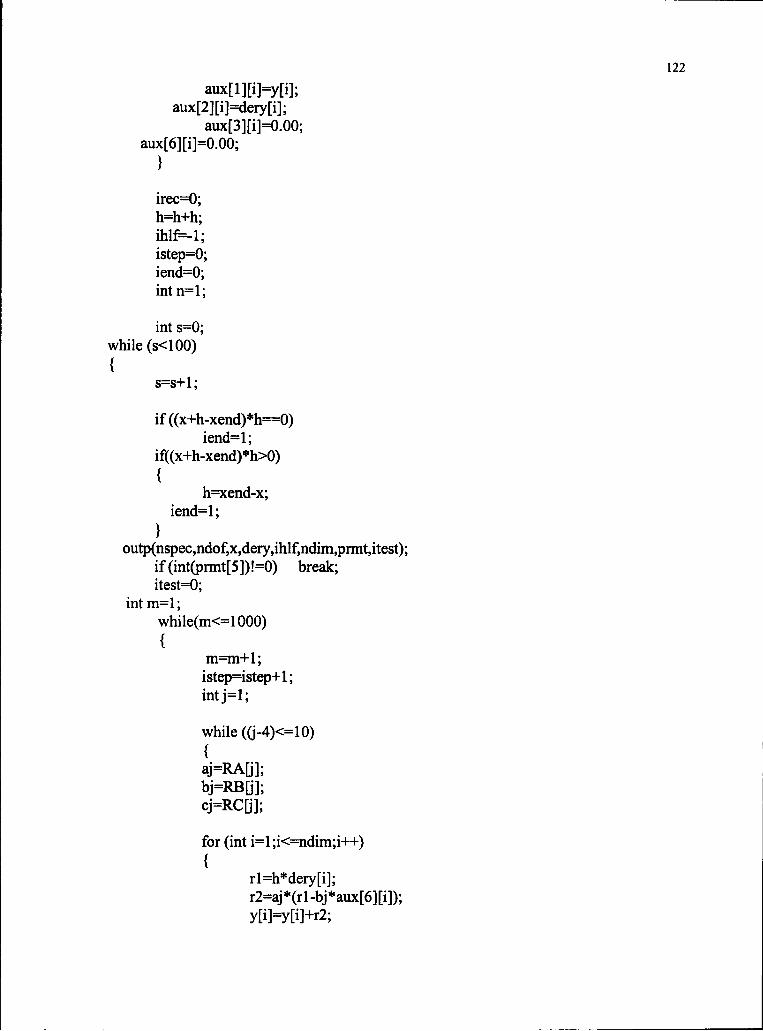
122
aux[2][i]=dery[i];
aux[3][i]=0.00;
aux[6][i]=0.00;
irec=O;
h=h+h;
istep=O;
iend=O;
intn=l;
int s=0;
while (s<100)
{s=s+l;
if((x+h-xend)*h==O)
iend=l;
if((x+h-xend)*h>0)
{h=xend-x;
iend=l;
}outp(nspec,ndof,x,dery,ihlf,ndim,prmt,itest);
if(int(prmt[5])!=0) break;
itest=O;
int m=l;
while(m<=1000)
{m=m+l;
istep=istep+l;
intj=l;
while ((j-4)<=10)
{aj=RA[j];bj=RB[j];
cj=RC[j];
for (int i=l;i<=ndim;i-H-)
{rl=h*dery[i];
r2=aj*(rl-bj*aux[6][i]);
y[i]=y[i]+r2;
123
r2=r2+r2+r2;
aux[6][i]=aux[6][i]+r2-cj*rl;
if((j-3)!=0) x=x+0.5*h;
fct (ndof,x,y,prmt,dery);
//end while
if(itest<=0)
{ for (i=l ;i<=ndim;i-H-)
{aux[4][i]=y[i];
}itest=l;
istep=istep+istep-2;
ihlf=ihlf+l;
x=x-h;
h=0.5*h;
for (i=l;i<=ndim;i++)
dery[i]=aux[2][i];
aux[6][i]=aux[3][i];
continue;
}imod=istep/2;
if(istep-imod-imod=0)
delt=0.00;
for (i=l;i<=ndim;i++)
delt=delt+aux[8][i]*fabs(aux[4][i]-y[i]);
if (delt-prmt[4]<=0) break;
if((delt-prmt[4])>0)
{if(ihlf>=10) break;
if(ihlf<10)

124
for (i=l;i<=ndim;i++)
{aux[4][i]=aux[5][i];
}istep=istep+istep-4;
x=x-h;
iend=0;
ihlf=ihlf+l;
x=x-h;
h=0.5*h;
for (i=l ;i<=ndim;i++)
dery[i]=aux[2][i];
aux[6][i]=aux[3][i];
continue;
fct(ndof,x,y,prmt,dery);
for (i=l;i<=ndim;i++)
{aux[5][i]=y[i];
aux[7][i]=dery[i];
}//while loop end;
if(ihlf-10>=0) break;
fct(ndof,x,y,prmt,dery);
for(i=l ;i<=ndim;i
aux[2][i]=dery[i];
aux[3][i]=aux[6][i];
y[i]=aux[5][i];
dery[i]=aux[7][i];
}outp(nspec,ndof,x,dery,ihlf,ndim,prmt,itest);
125
if(int(prmt[5])!=0) break;
for (i=l;i<=ndim;i++)
dery[i]=aux[2][i];
}irec=ihlf;
if(iend>0) break;
ihlf=ihlf-l;
istep=istep/2;
h=h+h;
if(ihlf<0)
continue;
imod=istep/2;
if(istep-imod-imod!=0)
continue;
if((delt-0.02*prmt[4])>0)
continue;
ihlf=ihlf-l;
istep=istep/2;
h=h+h;
} // end 1st loop
}//endif(h*(xend-x))
if(int(prmt[5])==0)
{if((ihlf-10)<=0);
{ihlf=ll;
fct(ndof,x,y,prmt,dery);
if(int(h*(xend-x))=O)
ihlf=12;
if(h*(xend-x)<0)
ihlf=13;
outp(nspec,ndof,x,dery,ihlf,ndim,prmt,itest);
void normal(int ndof.double y[],double dery[])
126
for (int i=l ;i<=nspec;i++)
{bar[i]=1.0;
}if(ndof=0)
{bar[nspec+l]=1.00;
bar[nspec+2]=1.00;
bar[nspec+3]=0.10;
}
if(ndof=l)
{bar[nspec+l]=0.50;
bar[nspec+2]=0.50;
bar[nspec+3]=O.5O;
}if(ndof=2)
{bar[nspec+l]=1.00;
bar[nspec+2]=1.00;
bar[nspec+3]=0.30;
}sum=0.00;
for (i=l;i<=nspec+3;i-H-)
{if(bar[i]!=0.00)
sum=sum+1.0/bar[i];
}for(i=l ;i<=nspec+3;i++)
{if(bar[i]!=0.00)
dery[i]=( 1.0/bar[i])/sum;
if(bar[i]=0.00)
dery[i]=0.00;
}
for (i=l;i<=neq;i++)
{dumnum=1.0;
for (int j=l y<=nreac[i]y++)
{dumnum=dumnum*pow(repnd[nnr[i] [j ] ] ,rmolen[i] [j ]);
127
for (j=l y<=nreac[i]y++)
if(ndof==0)
rkO[i][j]=repnd[nnr[i][j]]/(utmebd*dumnum);if(ndof=l)
rkO[i][j]=repnd[nnr[i][j]]/(utimed*dumniim);
if(ndof==2)
rkO[i][j]=repnd[nnr[i][j]]/(utmeag*duninum);
}for (j=l y<=nprod[i]y++)
if(ndof==0)
pkO[i][j]=repnd[nnp[i][j]]/(utinebd*dumnum);
if(ndof=l)
pkO[i][j]=repnd[nnp[i][j]]/(utimed*dumnum);
if(ndof=2)
pkO[i] [j ]=repnd[nnp[i] [j ]]/(utmeag*dumnum);
}
for (i=l;i<=nrreq;i++)
{for(int j=l J<=nreac[i]y++)
{rrate[i]D"]=rate[i]/(rkO[i][j]);
}for(j=l y<=nprod[i]y++)
{prate[i][j]=rate[i]/(pkO[i][j]);
}voltO=disvol;
timeO=utimed;
efeldO=disvol/dgap;
einpO=totead/double(ndisch);
sgm0=einp0/pow(efed0,2*time0);
epslO=sgmO*timeO;
dgapO=dgap;
dfvelO=dgapO/timeO;
if(nvt=0)
ep0bar=8.85E-12/(sgm0*time0);
128
if(epObar=l)
epObar=8.85/(sgmO*timeO);
dradba=disrad/dgap;
dgapba=1.0;
void fct(int ndof,double x.double y[],double prmt[],double dery[])
//start
for (int i=l;i<=nspec+3;i++)
{dery[i]=0.00;
//updrr
for (i=l ;i<=nrreq;i++)
{zetar=1.00;
for (int j=ly<=nreac[i]y++)
{zetar=zetar*pow(concen[nnr[i][j]],rmolen[i][j]);
}for (j=l y<=nreac[i]y++)
{dery[nnr[i] [j ]]=dery[nnr[i] [j ]]
-rmolen[i] [j ] *zetar*rrate[i] [j ];
}for (j=l;j<=nprod[i]y++)
{dery[nnp[i][j]]=dery[nnp[i][j]]
+pmolen[i]|j]*zetar*prate[i][j];
//updel
if(ndof=l)
for (i=nrreq+l;i<=nrreq+neleq;i++)
{rate[i]=rate[i]/1.0e6;
129
for (int j=ly<=nreac[i]y++)
{rrate[i][j]=rate[i]/(rkO[i][j]);
}for O=ly<=nprod[i]j++)
{prate[i][j]=rate[i]/(pkO[i]|j]);
for (i=nrreq+l;i<=nrreq+neleq;i++)
{zetar=l;
for (int j=ly<=nreac[i]y++)
zetar=zetar*pow(concen[nnr[i][j]],rmolen[i][j]);
}for (j=lu<=nreac[i]y-H-)
{dery[nnr[i][j]]=dery[nnr[i][j]]
-rmolen[i][j]*zetar*rrate[i][j];
}for(j=l;j<=nprod[i];j++)
{dery[nnp[i][j]]=dery[nnp[i][j]]
+pmolen[i][j]*zetar*prate[i][j];
//UVfor (i=nrreq+neleq+neceq+l ;i<=nrreq+neleq+neceq+nuveq;i++)
for (int j=ly<=nreac[i]y++)
{rrate[i][j]=rate[i]/(rkO[i][j]);
}for 0=lU<=npi"od[i]y++)
{prate[i][j]=rate[i]/(pkO[i][j]);
130
for (i=nrreq+neleq+neceq+l ;i<=nrreq+neleq+neceq+nuveq;i++)
zetar=1.0;
for (int j=ly<=nreac[i]y++)
{
zetar=zetar*pow(concen[nnr[i]0]],rmolen[i][j]);
for (j=ly<=nreac[i];j-i-+)
{dery[nnr[i][j]]=dery[nnr[i][j]]
-rmolen[i] [j ] *zetar*rrate[i] [j ];
}for(j=l y<=nprod[i]y++)
{dery[nnp[i][j]]=dery[nnp[i][j]]
+pmolen[i][j]*zetar*prate[i][j];
//upelc
for (i=nrreq+neleq+l ;i<=nrreq+neleq+neceq;i++)
{rate[i]=rate[i]/l e6;
for (int j=l y<=nreac[i]J++)
{rrate[i][j]=rate[i]/rkO[i]|j];
}for (j=ly<=nprod[i]y++)
{prate[i]D]=rate[i]/pkO[i][j];
for (i=nrreq+neleq+l ;i<=nrreq+neleq+neceq;i++)
{zetar=1.0;
for (int j=ly<=nreac[i]y'++)
{zetar=zetar*pow(concen[nnr[i] [j]],rmolen[i] [j]);
131
for (j=ly<=nreac[i]y-H-)
{dery[nnr[i][j]]=dery[nnr[i][j]]
-rmolen[i][j]*zetar*rTate[i][j];
}for(j=l y<=nprod[i];j++)
{dery[nnp[i][j]]=dery[nnp[i][j]]
+pmolen[i] [j ] *zetar*prate[i] [j ];
//drift equ
if(ndof==l)
{condadv(x,y,prmt,dery);
dery[nspec+1 ]=-2.0*(sgm/ep0bar)
*pow((dradba/dgapba),2)*voltn;
dery[nspec+2]=sgm*pow(efbar,2);
dery[nspec+3]=concen[l]*dfVel/dgapba;
}if(ndof==0)
{dery[nspec+l]=0.00;
dery[nspec+2]=0.00;
dery[nspec+3]=0.00;
}if(ndof==2)
{dery[nspec+l]=0.00;
dery[nspec+2]=0.00;
dery[nspec+3]=-concen[nspec+3]*utmeag*5.0e7;
dery[nspec+3]=-concen[nspec+3]*(200.00e-9*5.0e7);
}dery[ 1 ]=dery[ 1 ]-dery[nspec+3];
for (i=l;i<=nspec+3;i++)
{if(dery[i]<1.0e-40)
dery[i]=0.00;
132
void condadv(double x,double y[],double prmt[],double dery[])
if(voltn>0.0)
electf=voltn*voltO/dgap;
else
elect£=0;
efbar=electf/efeldO;
if(efbaKO.O)
efbar=O.O;
dfvel=dfvelu/dfvelO;
sgmu=concen[ 1 ]*repnd[ 1 ]* 1.60e-19*dfvelu/electf;
sgm=sgmu/sgmO;
void outp(int nspec,int ndof,double x,double dery[],double ihlf,int ndim,double
prmt[],double itest)
icount=icount+l;
for (int u=l; u<=(nspec+3);u++)
{if(y[u]<1.0e-40)
y[u]=0.00;
concen[u]=y[u];
}
voltn=y[nspec+l];
for(int k=l ;k<=nspec;k++)
{ymax[k]=max(y[k],ymax[k]);
}
fct(ndof,x,y,prmt,dery);
time=utime+x*utmebd;
if(ndof=l)
time=utime+x*utimed;
if(ndof=2)
time=utime+x*utmeag;
133
dbtime=time;
ditime=time-utime;
if(ndof=l &&y[nspec+2]>1.0)
prmt[5]=1.00;
if(ndofl=l)
for(int i=l;i<=nspec;i++)
{if(y[i]>1.0e-50 && y[i]<1.0e-20)
{double timer;
y[i]=0.00;
prmt[5]=1.00;
timer=1.0-x;
iprob=l;
REFERENCES
Balbach, J. H. in " Modeling the removal of sulfur dioxide and nitrogen oxides
from flue gases using combined plasma and optical processing", Thesis,
University ofIllinois, 1993, Oct.
Bes, R., Lacoste, G., Mahenc, J., J. Chim Phys., 1970, 67,731
Braun, D. et al., J. Phys. D: Appl. Phys., 1991,24
Breault, R.W., Mclarnon, C. and Mathur, V.K., NATO series G, 1993, Vol (34),
part B., 239.
Chang, M. B. et al., Environ. Sci. Technol, 1992, Vol. 26, NO. 4,111
Chang, M. B, Balbach, J.H., Rood, M. J., and Kushner, M.J., J. Appl. Phys.,1991.
69,4409
Coogan, J. J. and Sappey, A. D., IEEE Trans. Plasma Sci., 1996, 24, 91
Dhali, S. K. and Sardjia, JAppl. Phys., 1991, 69(9), 6319
Dinelli, G., Civitano,L., and Rea, IEEE Trans. Ind. Appl, 1990,. 25,535
Eliasson, B. and Straessler, S., B. Amer. Phys. Soc, 1983,Vol. 18, Feb., 183.
Eliasson, B. et al., Transactions on Plasma Science, 1991, Vol. 19, NO. 2, April
309
Elliott, G. A., Joshi, S.S., and Lunt, R. W., Trans. Faraday Soc., 1027, 23, 57
Falkenstein, Z. and Coogan, J. J., /. Phys. D: Appl. Phys. 1997, 30,817
Fujii, K., higash, M., and Suzuki, N., 1993, NATO ASI Series, Vol G34, Part B,
257.
Gallimberti, 1., Appl. Chern., 1988, Vol. 60, No. 5, 663.
Gallimberti, I., Pure Appl.Chem., 1988, 60, 663
134
135
Gentile, A. C. and Kushner, M. J., Appl. Phys., 1996, 79(8), 15 April.
Gentile, C. and Kushner, M. J, J. Appl. Phys., 1995, 78, 2074
George, E. and Volgtlin, Electrical documents published on Web, last modified:
Sep. 1,1994
Hsiao, M.C. et al., J. Adv. Oxid. Tech., 1997, Vol. 2, No. 2,283
Joshi, S.S, Trans. FaradySoc, 1927,23, 227
Karen, L. L. V., Alexander, A. B. et al., J. Adv. Oxid. Tech., 1997, Vol. 2, No. 2,
312
Lacoste, G., and Bes, R., Rev. Chim. Minerale, 1974,11, 141
Li, J. et al., J. Appl. Phys. 82(9), 1 Nov., 1997.
Loeb, L.B. in " Funndamental Processes of Electrical Discharges in Gases", New
York, 1939.
Maezawa, A.,and Izutsu, M., NATO ASISeries, G,1993, Vol34, partB., 47
Manley, T. C, Trans. Electrochem. Soc, 1944,84
Masuda, S., Pure & Appl. Chem., 1988, Vol 60. NO 5
Matzing, H. W., Paur, K, H-R., Statuskolloquium des PEF:9, Karlsruhe vom 9-
11. Mearz 1993, Vorhanden in Kernforschungzentrum Karlsruhe.KfK-PEF 104,
441.
Mclarnon C.R. in "Electro-Catalytic reduction of Nitrogen Oxides", Master's
Thesis, 1989, University ofNew Hampshire.
Mclarnon C.R. in " Nitrogen Oxides Decoposation by Barrier Discharge", Ph.D's
Thesis, 1993, University ofNew Hampshire.
Mizuno, A., Chakrabarti, A., and Okazaki, K., NATO ASI Series, G, 1993, Vol34,
part B, 165
Pentrante, B. M. et al, Appl. Phys. Lett., 68(26), 24 June, 1996.
Popa, S. D., Chiru, P. and Ciobotaru, L., J. Physique III, 1998,L53
Przybylsk, A.Z. Phys., 1958,161,264
136
Raber, L. R., C&ENNews, 1998, September 7
Reather, H.Z. Phys., 1938,110, 611
Reather, H.Z. Phys., 1939,112,464
Reather, H.Z. P/iy,s., 1941,117, 394, 524
Rogers, J. W. et al., J. Adv. Oxid. Tech., 1997, Vol. 2, No. 2,353
Rolader, G.E., Rogers, J. et al, 28th Plasmadynamics and Lasers Conference,1991, Atlanta.
Rolader, G. E. and Hoffman, M.P., Second International Symposium on
Environmental Technologies, 1995, Atlanta.
Rosocha, L.A. et al., NATO ASISeries, 1993,Fo/. G34, PartB., 281
Schlienger, M. P., NATO ASI Series G, 1993, Vol.34. Part A, 43
Slepian, J. in "A series of Lectures on Conduction of Electricity in gases", East
Pittsburgh, 1933.
Spengler, J.D and Brauer, M JEnviron.. Sci. Technol. 1990,24 (7)
Slovetsky, D. I, Pure & Appl. Chem., 1988, Vol. 60, No. 5, 753
Sun, W. et al,/. appl. Phys., 79(7), 1 April, 1996, 3438
Tokunaga, O., Namba, H., and hirota, K., NATO ASI Series, G, 1993, Vol34, part
B.,55
Townsend, J. S. in "Electricity in gases", O.U.P., 1915
Visvanathan, K. S., J. Ind. Chem. Soc, 1952,39, 836
Wang, Z, Yeboah, Y.D. et al., AIAA, 1999, Reno
Willis, C, Boyd, A.W., Int. J. Radiat. Phys. Chem. 1976, Vol. 8, 71.
Wolf, O., Listl, S. and Neiger, M., International Symposium on high press Low
Temperature Plasma Chemistry, 1996, 324
Yeboah, Y.D. et al., National Conference on Environmental Remediation Science
and Technology, 1998, Greensboro.


