Queensland Sustainable Lifestyle Horticulture Project
Final report
Feb 2008
Page 2Sustainable Lifestyle Horticulture Project – Final report Feb 08
Table of Contents
28Implementation rationale & funding10
30-31Implementation plan - Stakeholder responsibilities12
57Glossary16
17-18Urban landscape benefits3
56References15
26Opportunities and strategy rationale8
24-25Key issues and strategy implications7
19-20Product diversification4
38-55Support Appendices14
32-37Implementation plan13
29Alignment with existing programs11
27Vision Statement, value proposition and future role9
10-16Trends shaping the future • Water availability• Regulatory impact• Skills• Supply Chain dynamics • Stakeholder roles • Environmental awareness
2
22-23Export opportunities 6
21Regional development5
6-9Industry structure & profile1
Table of contents Page
Page 3Sustainable Lifestyle Horticulture Project – Final report Feb 08
Introduction
Project Background & Purpose
• Freshlogic has been commissioned by the Department of Primary Industries and Fisheries (DPI&F) to assist the lifestyle horticulture industry
adjust to the current challenges being experienced by businesses in the industry.
• This project is required to develop a strategic direction for the future sustainability, growth, and profitability of the lifestyle horticulture
industry.
Methodology
• This project is known as the Sustainable Lifestyle Horticultural Project and has drawn on the expertise of a support working group.
• All relevant available industry information was assessed, and a structured questionnaire (see page 51-51)was used to obtain detailed input
from both the working group and selected commercial enterprises. Based on the analysis of this information, the strategy planning
implications were identified, developed into a set of strategic planning outputs and then extended into an implementation plan.
Key Findings
• The lifestyle horticulture industry is made up of a diverse range of industries that span from primary production to retailing, and include the
provision of professional services. The larger sectors of the lifestyle horticulture industry - nursery and landscape - are characterised by high
numbers of smaller enterprises that are strong voices in industry associations.
• The changes in availability of water has adversely impacted the Queensland lifestyle horticulture market. It has created declines in both the
commercial landscape and home garden sectors, with the decline in plant use being a contributing factor. The market downturn has also
been impacted by longer term trends in domestic dwelling design, lower interest in gardening as a hobby by new home owners and reduced
levels of mainstream garden media. Based on the information available, the sum impact is a decline in market value of $260M or 18% of
market value for the year ending June 2007.
• Despite low or negative growth, there are still some positive demand signals from the market, many of which are related to increased
consumer awareness to environmental issues.
• Industry information levels are weak and methods to categorise and define market size, structure and supply chain value are evolving. As a
result, the levels of collaboration across industry sectors varies.
Page 4Sustainable Lifestyle Horticulture Project – Final report Feb 08
Introduction
Key Findings (Continued)
• While increased exports to Europe and Asia have been targeted, exports have declined in recent years. This decline has been impacted by
higher local labour costs, adverse exchange rates and technology and scale advantages being captured by competing exporters.
• One blanket set of improvement strategies will not work across all of Queensland. Regional variations will be required to ensure state wide
improvement.
• Despite challenging market conditions, some enterprises have diversified and generated growth. Capturing the capabilities of these
businesses is targeted in what is the cornerstone of growth strategy. This strategy is based on supporting those who are prepared to invest,
and in doing so, set examples for others to follow.
• Making alternative water sources available is a priority. Improved water availability will flow directly into stimulating consumption of lifestyle
horticulture products and services.
• Another priority is to communicate and gain acknowledgement of the environmental, health, psycho social and economic benefits that can be
attributed to urban landscapes. Indications are that awareness of these type of benefits is lifting, and the intent is to reach and influence
community decision makers. Another strategy will be seeking leverage from this awareness by developing packages of lifestyle horticulture
products and services that will satisfy the demand from enterprises and consumers to take action on sustainability.
• Value can also be added by cross sector collaboration. Specific strategies are proposed to consolidate the regulatory burdens on enterprises,
and to give greater scale and course range scope to skills and training providers. The latter is designed to reduce the risk of a longer term
skills gap.
• A total of $5.5m funding over 5 years is sought to implement these improvements, with 90% of these funds planned to be used in matching
the investments of those businesses who are prepared to invest in generating growth. It is also recommended that industry working groups
provide the human resources to manage other improvement strategies.
Page 5Sustainable Lifestyle Horticulture Project – Final report Feb 08
Industry structure & profile
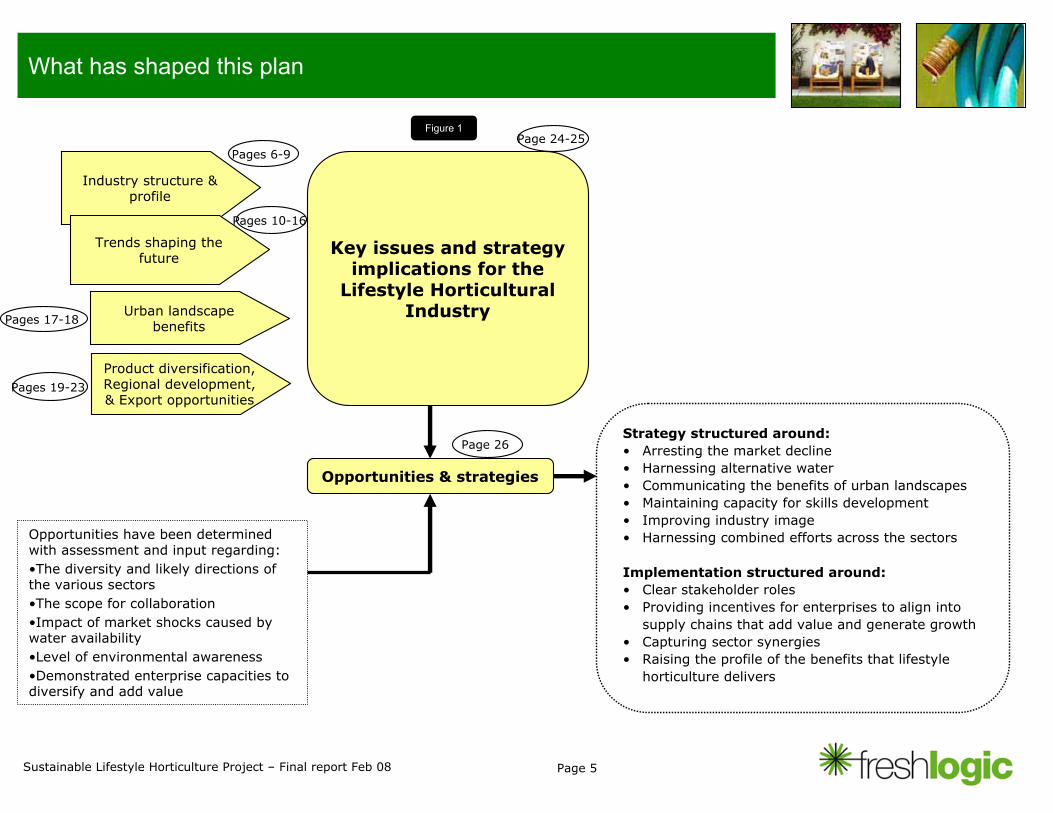
What has shaped this plan
Trends shaping the future
Key issues and strategy implications for the
Lifestyle Horticultural Industry
Opportunities & strategies
Strategy structured around:• Arresting the market decline• Harnessing alternative water • Communicating the benefits of urban landscapes• Maintaining capacity for skills development• Improving industry image • Harnessing combined efforts across the sectors
Implementation structured around: • Clear stakeholder roles• Providing incentives for enterprises to align into
supply chains that add value and generate growth • Capturing sector synergies• Raising the profile of the benefits that lifestyle
horticulture delivers
Opportunities have been determined with assessment and input regarding: •The diversity and likely directions of the various sectors •The scope for collaboration•Impact of market shocks caused by water availability •Level of environmental awareness•Demonstrated enterprise capacities to diversify and add value
Product diversification, Regional development, & Export opportunities
Urban landscape benefits
Pages 6-9 Page 24-25
Pages 10-16
Pages 17-18
Pages 19-23
Page 26
Figure 1
Page 6Sustainable Lifestyle Horticulture Project – Final report Feb 08
Forestry & ProductionHorticulture
Nursery(A high level of inter
trading)
Industry structure & profile
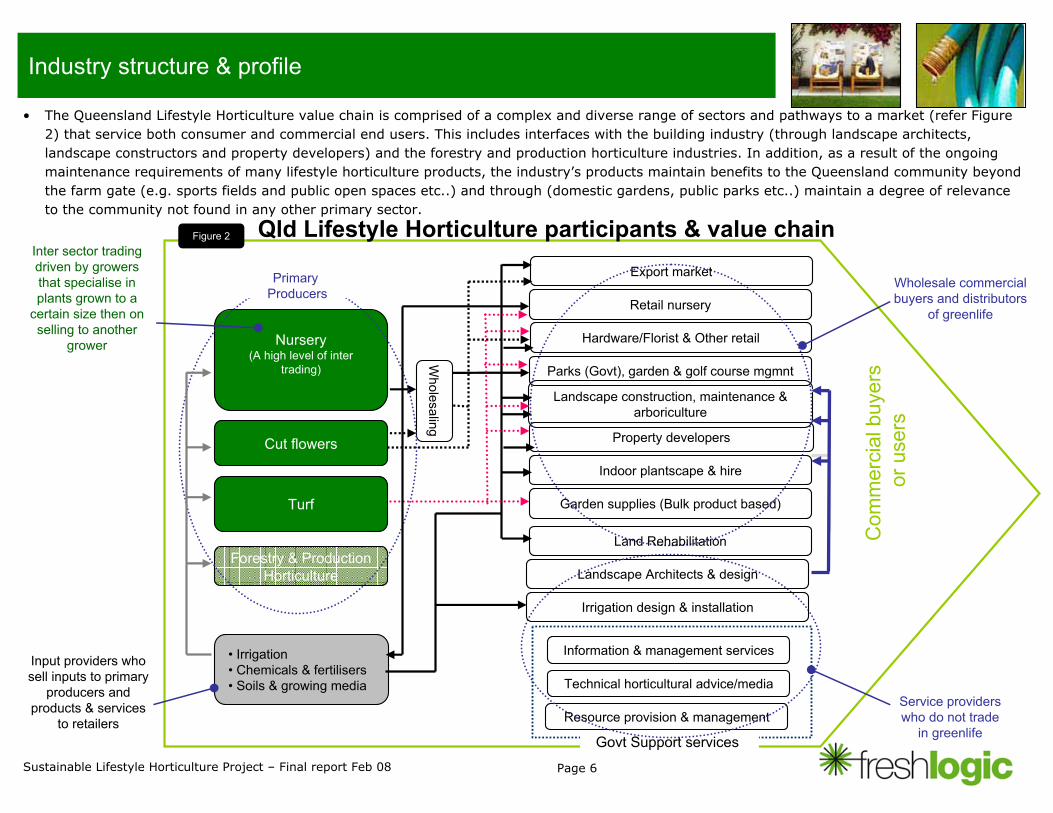
• The Queensland Lifestyle Horticulture value chain is comprised of a complex and diverse range of sectors and pathways to a market (refer Figure 2) that service both consumer and commercial end users. This includes interfaces with the building industry (through landscape architects, landscape constructors and property developers) and the forestry and production horticulture industries. In addition, as a result of the ongoing maintenance requirements of many lifestyle horticulture products, the industry’s products maintain benefits to the Queensland community beyond the farm gate (e.g. sports fields and public open spaces etc..) and through (domestic gardens, public parks etc..) maintain a degree of relevance to the community not found in any other primary sector.
Com
mer
cial
buy
ers
or u
sers
Turf
Cut flowers
Garden supplies (Bulk product based)
Landscape Architects & design
Indoor plantscape & hire
Parks (Govt), garden & golf course mgmnt
Retail nursery
Wholesaling
Landscape construction, maintenance & arboriculture
Govt Support services
Hardware/Florist & Other retail
Information & management services
Technical horticultural advice/media
Qld Lifestyle Horticulture participants & value chain
Resource provision & management
Property developers
• Irrigation • Chemicals & fertilisers• Soils & growing media
PrimaryProducers
Inter sector trading driven by growers that specialise in plants grown to a
certain size then on selling to another
grower
Service providers who do not trade
in greenlife
Input providers who sell inputs to primary
producers and products & services
to retailers
Wholesale commercial buyers and distributors
of greenlife
Export market
Figure 2
Land Rehabilitation
Irrigation design & installation
Page 7Sustainable Lifestyle Horticulture Project – Final report Feb 08
Industry structure & profile
High labour intensity
• The Australian lifestyle horticulture industry also faces potential competition from low-cost countries due to the advance of globalisationreflected in free trade agreements, and international capital and technology movements. Labour-intensive production sectors are particularly vulnerable to countries with relatively low-cost labour. This weakness is a core challenge when exploring international export markets for products.
Dominance of small family owned businesses
• The lifestyle horticulture industry is highly fragmented, comprising mostly of small to micro-businesses that operate independently. Many of these business owners entered the industry for lifestyle reasons. Such business structures and capabilities are generally not conducive to the development of export capabilities and value-added strategies, access to finance and marketing and product differentiation initiatives.
Domestic market focus and increasing level of imports
• The Queensland lifestyle horticulture industry currently exports on an opportunistic basis. An estimated 98 cents in every dollar of the industry’s gross sales are currently from domestic trade in Australia. Due to a high proportion of products sold into other states, the market conditions in each state - including water restrictions, drought conditions and gardening awareness - impact on the Queensland industry’s gross sales. Import trends reflect that increasing volumes of cut flowers are being imported to compete with locally produced product.
Steady growth until 2004-05
• Credible industry statistics are scant. Best information indicates that growth over the past 15 years has been steady at an average 6%+, with highs and lows being a reflection of optimum spring weather. During this time, the industry enjoyed the peak of lifestyle TV and the creation of the garden makeover concept, and a steady flow of new houses that required gardens and minimal restrictions on domestic water use in gardens. However, from 2005-06 (refer Figure 3), when lifestyle TV eased, new time-poor home owners appeared to have lost interest in gardening as an activity, new houses came with complete gardens and water restrictions commenced, the market slowed and then declined.
Garden market share movement
• As home gardeners have changed the way they purchase garden products, market share has moved away from retailers (who have beenservicing the DIY gardeners) to landscaper and property developers, who are supplying combinations of product and service. Within the retail supply channel, the large format hardware stores have rapidly expanded in the last 10 years and now dominate the retail market. The once dominant retail nurseries/garden centres are struggling in these conditions.
Synergies between sectors
• Synergies are strong in sectors that service public and private garden amenity needs. The products and services to meet these needs are commonly combined, and larger scale solutions are aligned in a common design phase. However, the cut flowers sector does not achieve the same level of synergies with the balance of lifestyle horticulture. This sector requires a different distribution pathway typical of a short life perishable food product.
Page 8Sustainable Lifestyle Horticulture Project – Final report Feb 08
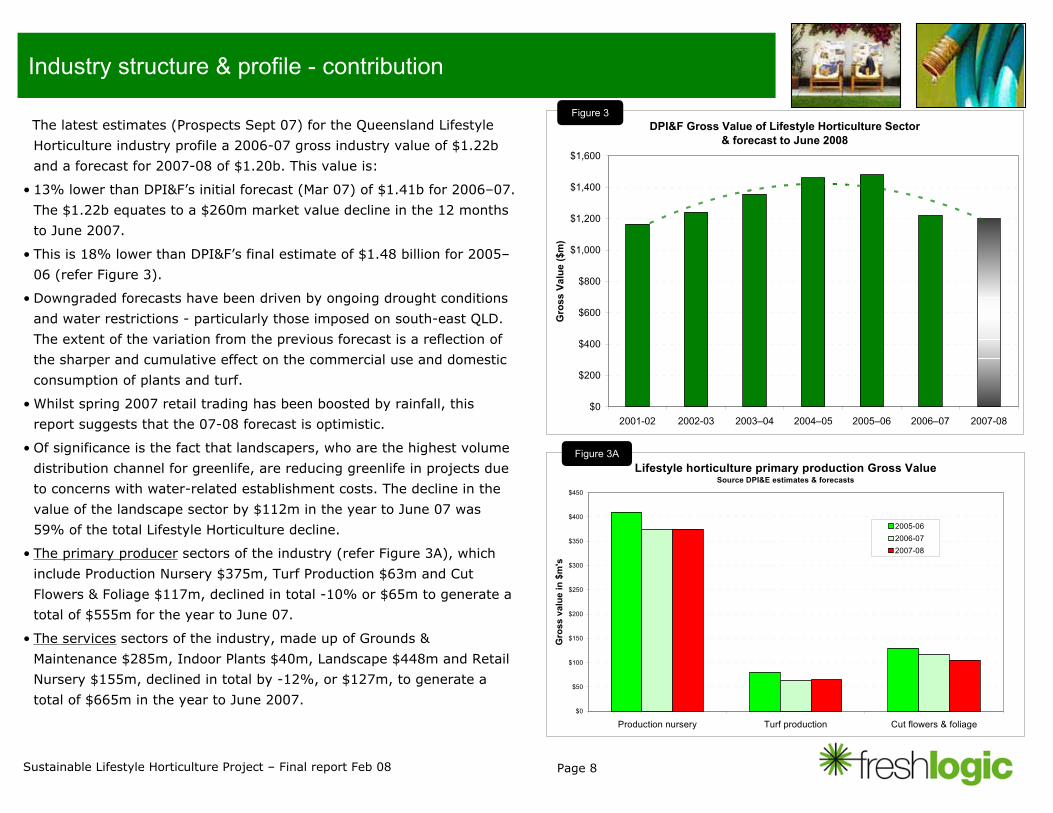
DPI&F Gross Value of Lifestyle Horticulture Sector& forecast to June 2008
$0
$200
$400
$600
$800
$1,000
$1,200
$1,400
$1,600
2001-02 2002-03 2003–04 2004–05 2005–06 2006–07 2007-08
Gro
ss V
alue
($m
)
Industry structure & profile - contribution
The latest estimates (Prospects Sept 07) for the Queensland Lifestyle
Horticulture industry profile a 2006-07 gross industry value of $1.22b
and a forecast for 2007-08 of $1.20b. This value is:
• 13% lower than DPI&F’s initial forecast (Mar 07) of $1.41b for 2006–07.
The $1.22b equates to a $260m market value decline in the 12 months
to June 2007.
• This is 18% lower than DPI&F’s final estimate of $1.48 billion for 2005–
06 (refer Figure 3).
• Downgraded forecasts have been driven by ongoing drought conditions
and water restrictions - particularly those imposed on south-east QLD.
The extent of the variation from the previous forecast is a reflection of
the sharper and cumulative effect on the commercial use and domestic
consumption of plants and turf.
• Whilst spring 2007 retail trading has been boosted by rainfall, this
report suggests that the 07-08 forecast is optimistic.
• Of significance is the fact that landscapers, who are the highest volume
distribution channel for greenlife, are reducing greenlife in projects due
to concerns with water-related establishment costs. The decline in the
value of the landscape sector by $112m in the year to June 07 was
59% of the total Lifestyle Horticulture decline.
• The primary producer sectors of the industry (refer Figure 3A), which
include Production Nursery $375m, Turf Production $63m and Cut
Flowers & Foliage $117m, declined in total -10% or $65m to generate a
total of $555m for the year to June 07.
• The services sectors of the industry, made up of Grounds &
Maintenance $285m, Indoor Plants $40m, Landscape $448m and Retail
Nursery $155m, declined in total by -12%, or $127m, to generate a
total of $665m in the year to June 2007.
Figure 3
Lifestyle horticulture primary production Gross ValueSource DPI&E estimates & forecasts
$0
$50
$100
$150
$200
$250
$300
$350
$400
$450
Production nursery Turf production Cut flowers & foliage
Gro
ss v
alue
in $
m's
2005-062006-072007-08
Figure 3A
Page 9Sustainable Lifestyle Horticulture Project – Final report Feb 08
Industry structure & profile - contribution
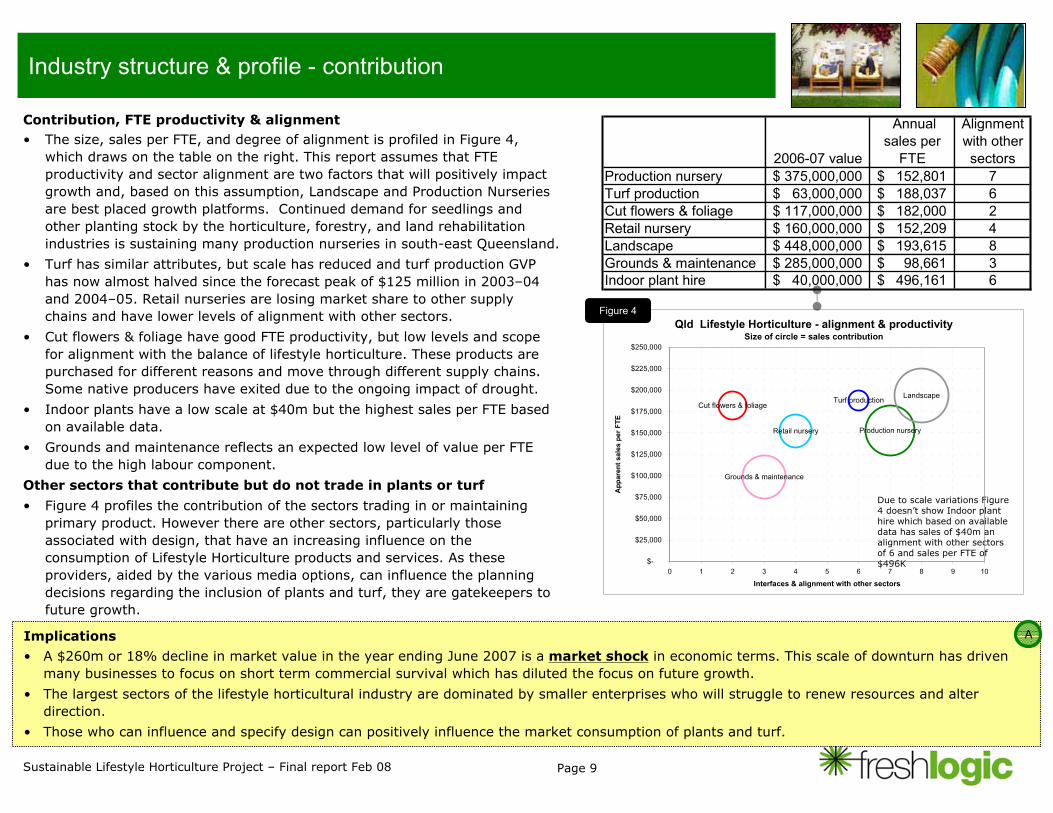
Contribution, FTE productivity & alignment• The size, sales per FTE, and degree of alignment is profiled in Figure 4,
which draws on the table on the right. This report assumes that FTE productivity and sector alignment are two factors that will positively impact growth and, based on this assumption, Landscape and Production Nurseries are best placed growth platforms. Continued demand for seedlings and other planting stock by the horticulture, forestry, and land rehabilitation industries is sustaining many production nurseries in south-east Queensland.
• Turf has similar attributes, but scale has reduced and turf production GVP has now almost halved since the forecast peak of $125 million in 2003–04 and 2004–05. Retail nurseries are losing market share to other supply chains and have lower levels of alignment with other sectors.
• Cut flowers & foliage have good FTE productivity, but low levels and scope for alignment with the balance of lifestyle horticulture. These products are purchased for different reasons and move through different supply chains. Some native producers have exited due to the ongoing impact of drought.
• Indoor plants have a low scale at $40m but the highest sales per FTE based on available data.
• Grounds and maintenance reflects an expected low level of value per FTE due to the high labour component.
Other sectors that contribute but do not trade in plants or turf
• Figure 4 profiles the contribution of the sectors trading in or maintaining primary product. However there are other sectors, particularly those associated with design, that have an increasing influence on theconsumption of Lifestyle Horticulture products and services. As these providers, aided by the various media options, can influence the planning decisions regarding the inclusion of plants and turf, they are gatekeepers to future growth.
Implications
• A $260m or 18% decline in market value in the year ending June 2007 is a market shock in economic terms. This scale of downturn has driven many businesses to focus on short term commercial survival which has diluted the focus on future growth.
• The largest sectors of the lifestyle horticultural industry are dominated by smaller enterprises who will struggle to renew resources and alter direction.
• Those who can influence and specify design can positively influence the market consumption of plants and turf.
A
Due to scale variations Figure 4 doesn’t show Indoor plant hire which based on available data has sales of $40m an alignment with other sectors of 6 and sales per FTE of $496K
Qld Lifestyle Horticulture - alignment & productivitySize of circle = sales contribution
Production nurseryRetail nursery
Grounds & maintenance
Cut flowers & foliageLandscapeTurf production
$-
$25,000
$50,000
$75,000
$100,000
$125,000
$150,000
$175,000
$200,000
$225,000
$250,000
0 1 2 3 4 5 6 7 8 9 10
Interfaces & alignment with other sectors
App
aren
t sal
es p
er F
TE
Figure 4
2006-07 value
Annual sales per
FTE
Alignment with other sectors
Production nursery 375,000,000$ 152,801$ 7Turf production 63,000,000$ 188,037$ 6Cut flowers & foliage 117,000,000$ 182,000$ 2Retail nursery 160,000,000$ 152,209$ 4Landscape 448,000,000$ 193,615$ 8Grounds & maintenance 285,000,000$ 98,661$ 3Indoor plant hire 40,000,000$ 496,161$ 6
Page 10Sustainable Lifestyle Horticulture Project – Final report Feb 08
Trends shaping the future - Water availability
Changes in water availability
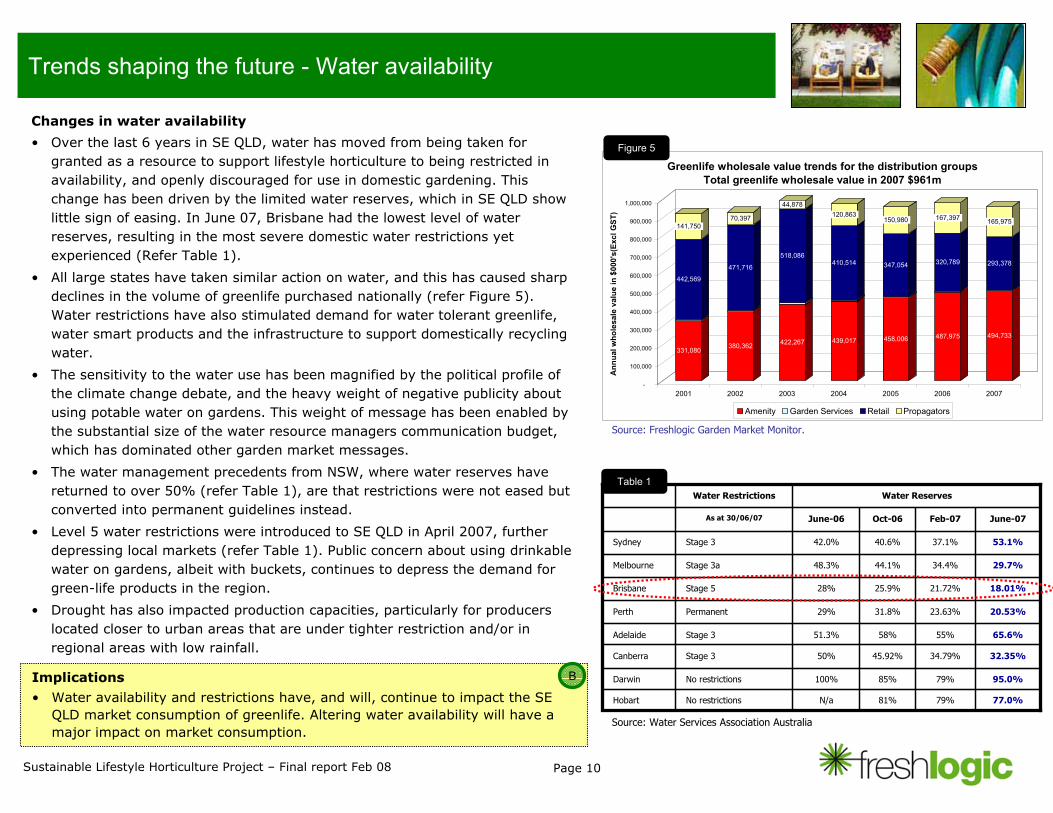
• Over the last 6 years in SE QLD, water has moved from being taken for granted as a resource to support lifestyle horticulture to being restricted in availability, and openly discouraged for use in domestic gardening. This change has been driven by the limited water reserves, which in SE QLD show little sign of easing. In June 07, Brisbane had the lowest level of water reserves, resulting in the most severe domestic water restrictions yet experienced (Refer Table 1).
• All large states have taken similar action on water, and this has caused sharp declines in the volume of greenlife purchased nationally (refer Figure 5). Water restrictions have also stimulated demand for water tolerant greenlife, water smart products and the infrastructure to support domestically recycling water.
• The sensitivity to the water use has been magnified by the political profile of the climate change debate, and the heavy weight of negative publicity about using potable water on gardens. This weight of message has been enabled by the substantial size of the water resource managers communication budget, which has dominated other garden market messages.
• The water management precedents from NSW, where water reserves have returned to over 50% (refer Table 1), are that restrictions were not eased but converted into permanent guidelines instead.
• Level 5 water restrictions were introduced to SE QLD in April 2007, further depressing local markets (refer Table 1). Public concern about using drinkable water on gardens, albeit with buckets, continues to depress the demand for green-life products in the region.
• Drought has also impacted production capacities, particularly for producers located closer to urban areas that are under tighter restriction and/or in regional areas with low rainfall.
77.0%79%81%N/aNo restrictionsHobart
95.0%79%85%100%No restrictionsDarwin
32.35%34.79%45.92%50%Stage 3Canberra
65.6%55%58%51.3%Stage 3Adelaide
20.53%23.63%31.8%29%PermanentPerth
18.01%21.72%25.9%28%Stage 5Brisbane
29.7%34.4%44.1%48.3%Stage 3aMelbourne
53.1%37.1%40.6%42.0%Stage 3Sydney
June-07Feb-07Oct-06June-06As at 30/06/07
Water ReservesWater Restrictions
Source: Water Services Association Australia
Implications
• Water availability and restrictions have, and will, continue to impact the SE QLD market consumption of greenlife. Altering water availability will have a major impact on market consumption.
331,080
442,569
141,750
380,362
471,716
70,397
422,267
518,086
44,878
439,017
410,514
120,863
458,006
347,054
150,980
487,975
320,789
167,397
494,733
293,378
165,975
-
100,000
200,000
300,000
400,000
500,000
600,000
700,000
800,000
900,000
1,000,000
Ann
ual w
hole
sale
val
ue in
$00
0's(
Excl
GST
)
2001 2002 2003 2004 2005 2006 2007
Greenlife wholesale value trends for the distribution groupsTotal greenlife wholesale value in 2007 $961m
Amenity Garden Services Retail Propagators
Figure 5
Table 1
Source: Freshlogic Garden Market Monitor.
B
Page 11Sustainable Lifestyle Horticulture Project – Final report Feb 08
Trends shaping the future - Water availability
Alternative water sources
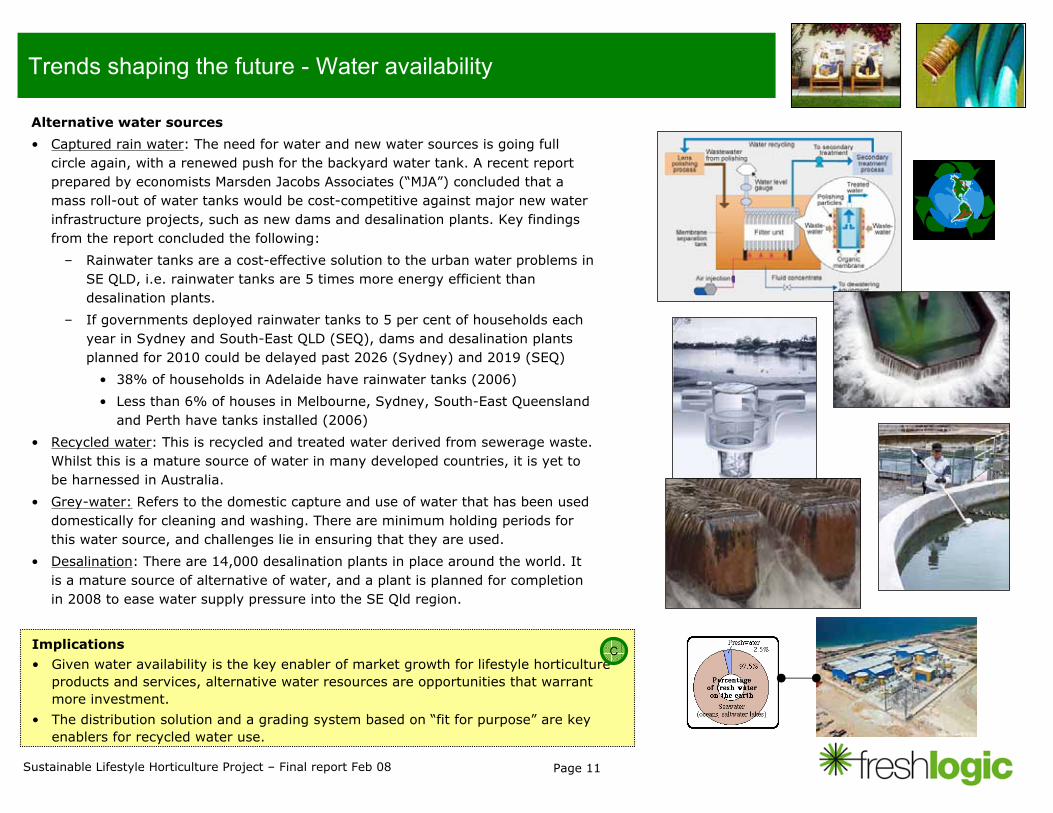
• Captured rain water: The need for water and new water sources is going full circle again, with a renewed push for the backyard water tank. A recent report prepared by economists Marsden Jacobs Associates (“MJA”) concluded that a mass roll-out of water tanks would be cost-competitive against major new water infrastructure projects, such as new dams and desalination plants. Key findings from the report concluded the following:
– Rainwater tanks are a cost-effective solution to the urban water problems in SE QLD, i.e. rainwater tanks are 5 times more energy efficient than desalination plants.
– If governments deployed rainwater tanks to 5 per cent of households each year in Sydney and South-East QLD (SEQ), dams and desalination plants planned for 2010 could be delayed past 2026 (Sydney) and 2019 (SEQ)
• 38% of households in Adelaide have rainwater tanks (2006)
• Less than 6% of houses in Melbourne, Sydney, South-East Queensland and Perth have tanks installed (2006)
• Recycled water: This is recycled and treated water derived from sewerage waste. Whilst this is a mature source of water in many developed countries, it is yet to be harnessed in Australia.
• Grey-water: Refers to the domestic capture and use of water that has been used domestically for cleaning and washing. There are minimum holding periods for this water source, and challenges lie in ensuring that they are used.
• Desalination: There are 14,000 desalination plants in place around the world. It is a mature source of alternative of water, and a plant is planned for completion in 2008 to ease water supply pressure into the SE Qld region.
Implications
• Given water availability is the key enabler of market growth for lifestyle horticulture products and services, alternative water resources are opportunities that warrant more investment.
• The distribution solution and a grading system based on “fit for purpose” are key enablers for recycled water use.
C
Page 12Sustainable Lifestyle Horticulture Project – Final report Feb 08
Trends shaping the future - Regulatory Impact
Layers of regulation
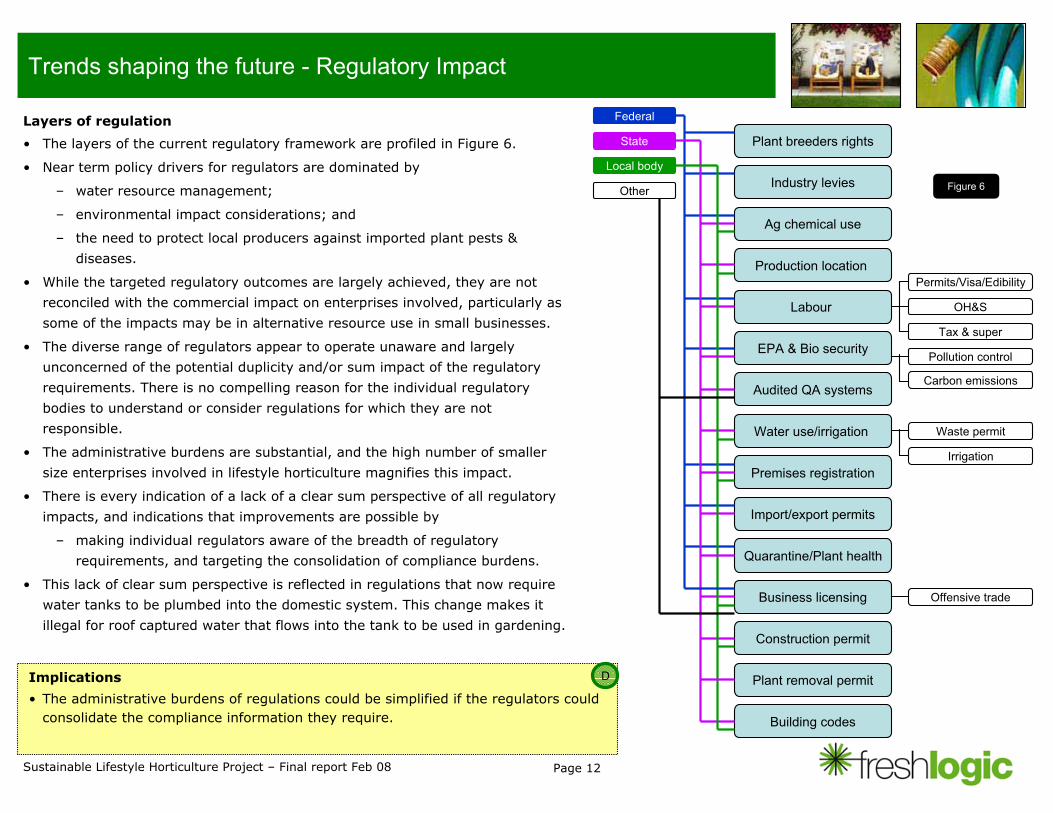
• The layers of the current regulatory framework are profiled in Figure 6.
• Near term policy drivers for regulators are dominated by
– water resource management;
– environmental impact considerations; and
– the need to protect local producers against imported plant pests &
diseases.
• While the targeted regulatory outcomes are largely achieved, they are not
reconciled with the commercial impact on enterprises involved, particularly as
some of the impacts may be in alternative resource use in small businesses.
• The diverse range of regulators appear to operate unaware and largely
unconcerned of the potential duplicity and/or sum impact of the regulatory
requirements. There is no compelling reason for the individual regulatory
bodies to understand or consider regulations for which they are not
responsible.
• The administrative burdens are substantial, and the high number of smaller
size enterprises involved in lifestyle horticulture magnifies this impact.
• There is every indication of a lack of a clear sum perspective of all regulatory
impacts, and indications that improvements are possible by
– making individual regulators aware of the breadth of regulatory
requirements, and targeting the consolidation of compliance burdens.
• This lack of clear sum perspective is reflected in regulations that now require
water tanks to be plumbed into the domestic system. This change makes it
illegal for roof captured water that flows into the tank to be used in gardening.
Implications
• The administrative burdens of regulations could be simplified if the regulators could consolidate the compliance information they require.
Plant breeders rights
Ag chemical use
Production location
Labour
EPA & Bio security
Quarantine/Plant health
Permits/Visa/Edibility
OH&S
Industry levies
Premises registration
Import/export permits
Business licensing
Tax & super
Construction permit
Audited QA systems
Plant removal permit
Water use/irrigation
Building codes
Federal
State
Local body
Other
Waste permit
Pollution control
Offensive trade
Carbon emissions
Figure 6
D
Irrigation
Page 13Sustainable Lifestyle Horticulture Project – Final report Feb 08
Trends shaping the future - Skills
Status
• Skilled labour is a vital resource. It is not possible to invest in mechanisation to entirely eliminate the necessity of this resource. If it is not available, industry capacity will be compromised.
• Numerous previous studies relating to the training needs of individual sectors have drawn the following common conclusions:
– Other industries are paying higher wages, resulting in the loss of some long term skilled employees.
– Training institutions that offer higher level courses are experiencing a downward spiral in enrolments, which threatens course viability.
– More mature age students are involved in training for horticulture, and these students are increasingly selecting course content based on general interest or specific workplace competencies, and not completing full courses.
– The industry is not viewed as an attractive career option. This is affected by the level of remuneration, smaller business structures, older generation of management, and, more recently, the adverse messages about responsible water use.
– Employment programs have directed lower skilled applicants into horticultural courses, and this has pressured down the course content. This is an influence on the number of enrolments for qualifications in Amenity Horticulture (RTF), which has increased by 41% from 2,940 to 4,160 for 2004 to 2005 respectively. The number of completions for qualifications in Amenity Horticulture(RTF), however, are not so high, with 150 and 810 completions in2004 and 2005 respectively.
– These conclusions remain valid in Nov 2007.
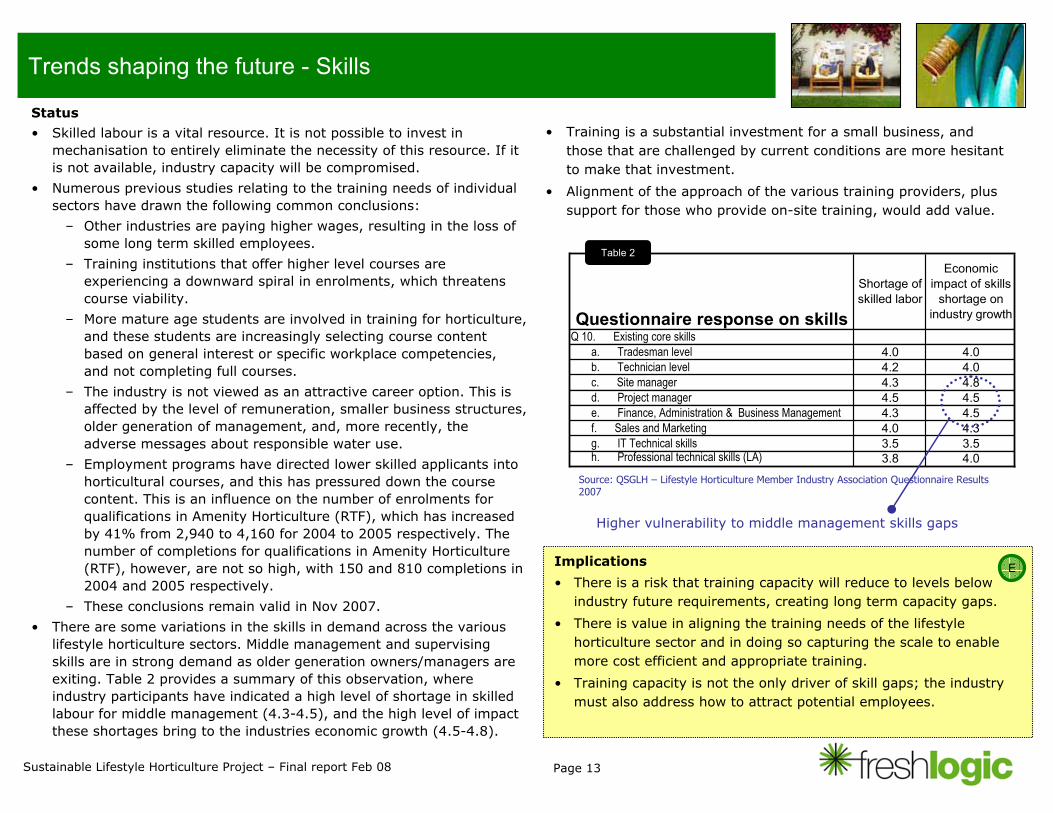
• There are some variations in the skills in demand across the various lifestyle horticulture sectors. Middle management and supervising skills are in strong demand as older generation owners/managers are exiting. Table 2 provides a summary of this observation, where industry participants have indicated a high level of shortage in skilled labour for middle management (4.3-4.5), and the high level of impact these shortages bring to the industries economic growth (4.5-4.8).
Implications
• There is a risk that training capacity will reduce to levels below industry future requirements, creating long term capacity gaps.
• There is value in aligning the training needs of the lifestyle horticulture sector and in doing so capturing the scale to enable more cost efficient and appropriate training.
• Training capacity is not the only driver of skill gaps; the industry must also address how to attract potential employees.
Questionnaire response on skills
Shortage of skilled labor
Economic impact of skills
shortage on industry growth
Q 10. Existing core skills a. Tradesman level 4.0 4.0b. Technician level 4.2 4.0c. Site manager 4.3 4.8d. Project manager 4.5 4.5e. Finance, Administration & Business Management 4.3 4.5f. Sales and Marketing 4.0 4.3g. IT Technical skills 3.5 3.5h. Professional technical skills (LA) 3.8 4.0
Higher vulnerability to middle management skills gaps
Table 2
• Training is a substantial investment for a small business, and those that are challenged by current conditions are more hesitant to make that investment.
• Alignment of the approach of the various training providers, plus support for those who provide on-site training, would add value.
Source: QSGLH – Lifestyle Horticulture Member Industry Association Questionnaire Results 2007
E
Page 14Sustainable Lifestyle Horticulture Project – Final report Feb 08
Trends shaping the future – Distribution channel dynamics
Market share movement
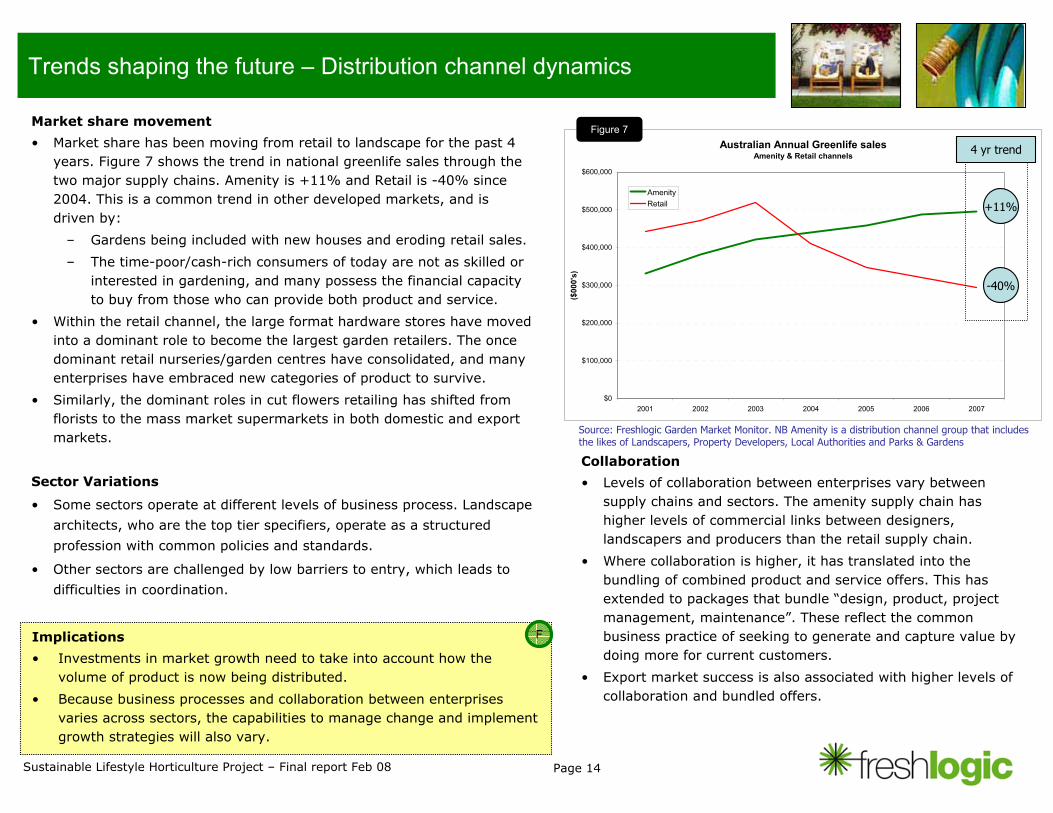
• Market share has been moving from retail to landscape for the past 4 years. Figure 7 shows the trend in national greenlife sales through the two major supply chains. Amenity is +11% and Retail is -40% since 2004. This is a common trend in other developed markets, and is driven by:
– Gardens being included with new houses and eroding retail sales.
– The time-poor/cash-rich consumers of today are not as skilled or interested in gardening, and many possess the financial capacityto buy from those who can provide both product and service.
• Within the retail channel, the large format hardware stores have moved into a dominant role to become the largest garden retailers. The once dominant retail nurseries/garden centres have consolidated, and many enterprises have embraced new categories of product to survive.
• Similarly, the dominant roles in cut flowers retailing has shifted from florists to the mass market supermarkets in both domestic and export markets.
Sector Variations
• Some sectors operate at different levels of business process. Landscape
architects, who are the top tier specifiers, operate as a structured
profession with common policies and standards.
• Other sectors are challenged by low barriers to entry, which leads to
difficulties in coordination.
Australian Annual Greenlife sales Amenity & Retail channels
$0
$100,000
$200,000
$300,000
$400,000
$500,000
$600,000
2001 2002 2003 2004 2005 2006 2007
($00
0's)
AmenityRetail
-40%
+11%
4 yr trend
Implications
• Investments in market growth need to take into account how the volume of product is now being distributed.
• Because business processes and collaboration between enterprisesvaries across sectors, the capabilities to manage change and implement growth strategies will also vary.
Collaboration
• Levels of collaboration between enterprises vary between supply chains and sectors. The amenity supply chain has higher levels of commercial links between designers, landscapers and producers than the retail supply chain.
• Where collaboration is higher, it has translated into the bundling of combined product and service offers. This has extended to packages that bundle “design, product, project management, maintenance”. These reflect the common business practice of seeking to generate and capture value by doing more for current customers.
• Export market success is also associated with higher levels of collaboration and bundled offers.
Figure 7
Source: Freshlogic Garden Market Monitor. NB Amenity is a distribution channel group that includes the likes of Landscapers, Property Developers, Local Authorities and Parks & Gardens
F
Page 15Sustainable Lifestyle Horticulture Project – Final report Feb 08
Trends shaping the future - Stakeholder roles & dynamics
Types of stakeholders
• The Lifestyle Industry has four types of stakeholders;
– Enterprises comprises both private and public entities that undertake commercial activity in the lifestyle horticultural market.
– Industry sector organisations (Nursery, Landscape, Irrigation, etc)
– Regulators and Government support agencies.
– ACLH, which provides a common forum and voice for sector industry organisations, resource providers, and regulators that operate in the lifestyle horticulture market.
• This mixture of stakeholders, particularly the ACLH role, requires consideration in determining the planning agenda and the scope for complimentary action from each stakeholder. The scope of value that can be added by each stakeholder must also be considered.
• Feedback gained in the project indicates that ACLH is yet to earn the full support of members and enterprises in the industry.
• In order to improve their effectiveness, ACLH should consider the following:
– The boundaries between commercial and industry organisation activity
– Dysfunction within the ACLH
– Stakeholder conflicts of interest
– A Queensland Government mandate to become an effective common industry voice
– Engaging the industry and facilitating market improvement through effective R&D and extension.
• The requirement is to define a set of planning outcomes and accountabilities that allow strategies to be undertaken with more focus. This would deliver more alignment across the ACLH membersand produce stronger and more complementary outputs.
R&D investments for stakeholders
• The management of R&D investment and extension is a key platform. The following principles are common in guiding these investments:
– An industry can have a shared vision, but it cannot move as one entity.
– Commercial improvement and growth is generated by stakeholders who operate as enterprises in supply chains.
– The activity of enterprises can be aided and enabled by the likes of industry organisations.
– Change is led by a few and followed by most.
• Given the above, the options for investment include:
Resources for ACLH
– Across Australian horticulture, there are precedents to invest R&D funds into sector based IDOs. This tendency is typically higher with many small enterprises as industry participants, who are the constituents of the sector organisations.
– Providing support for bodies that need to develop an effective structure.
Provide support for those who will co-invest
– This is enabled through programs that are based on providing support to those who will co-invest according to certain criteria. This criteria serves to direct the nature of the investment; and the participants’ commitment is captured by requiring matched investment.
Direct investment in market communications
– Designed to arrest declining consumption.
Project sub contracting
– Appropriate when specific short life projects may lend themselves to using external resources on a short term basis.
Implications • In developing growth strategy and implementation plans there is a
need to consider which stakeholders can effectively do what.
G
Page 16Sustainable Lifestyle Horticulture Project – Final report Feb 08
Trends shaping the future - Environmental awareness
Greening Consumer
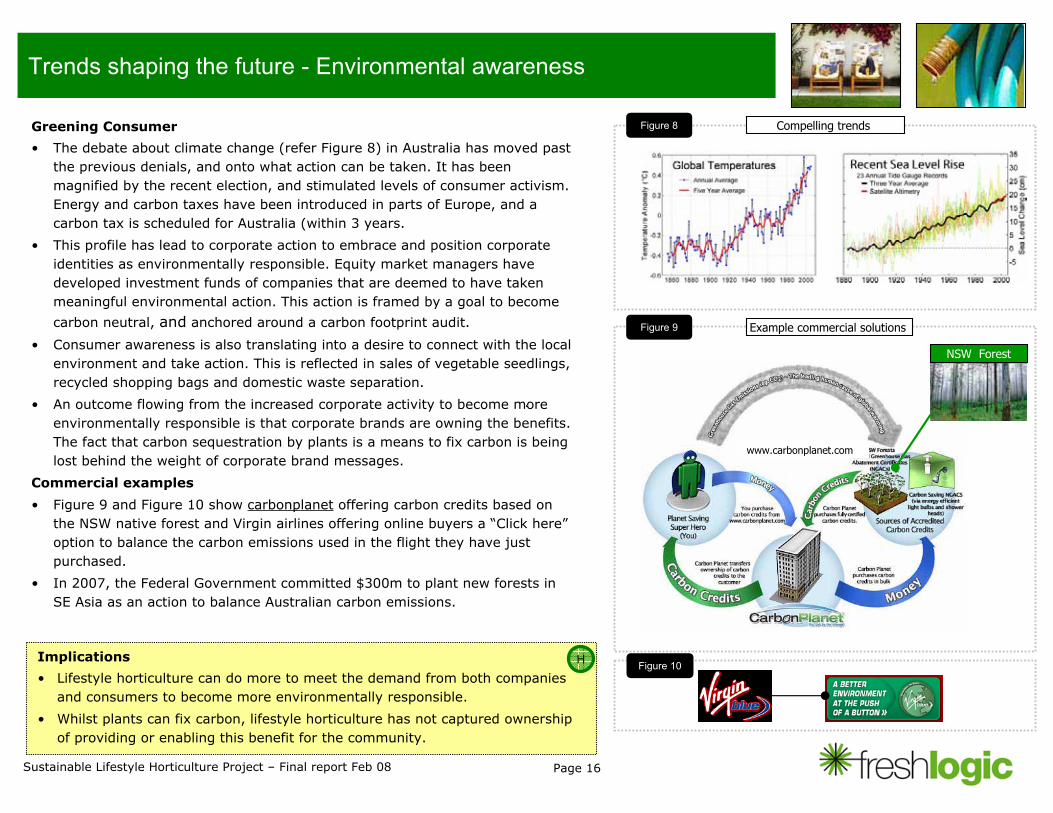
• The debate about climate change (refer Figure 8) in Australia has moved past the previous denials, and onto what action can be taken. It has been magnified by the recent election, and stimulated levels of consumer activism. Energy and carbon taxes have been introduced in parts of Europe, and a carbon tax is scheduled for Australia (within 3 years.
• This profile has lead to corporate action to embrace and position corporate identities as environmentally responsible. Equity market managers have developed investment funds of companies that are deemed to have taken meaningful environmental action. This action is framed by a goal to become
carbon neutral, and anchored around a carbon footprint audit.
• Consumer awareness is also translating into a desire to connect with the local environment and take action. This is reflected in sales of vegetable seedlings, recycled shopping bags and domestic waste separation.
• An outcome flowing from the increased corporate activity to become more environmentally responsible is that corporate brands are owning the benefits. The fact that carbon sequestration by plants is a means to fix carbon is being lost behind the weight of corporate brand messages.
Commercial examples
• Figure 9 and Figure 10 show carbonplanet offering carbon credits based on the NSW native forest and Virgin airlines offering online buyers a “Click here”option to balance the carbon emissions used in the flight they have just purchased.
• In 2007, the Federal Government committed $300m to plant new forests in SE Asia as an action to balance Australian carbon emissions.
Implications
• Lifestyle horticulture can do more to meet the demand from both companies and consumers to become more environmentally responsible.
• Whilst plants can fix carbon, lifestyle horticulture has not captured ownership of providing or enabling this benefit for the community.
NSW Forest
Compelling trends
Example commercial solutions
www.carbonplanet.com
Figure 8
Figure 9
Figure 10H
Page 17Sustainable Lifestyle Horticulture Project – Final report Feb 08
Urban landscape benefits
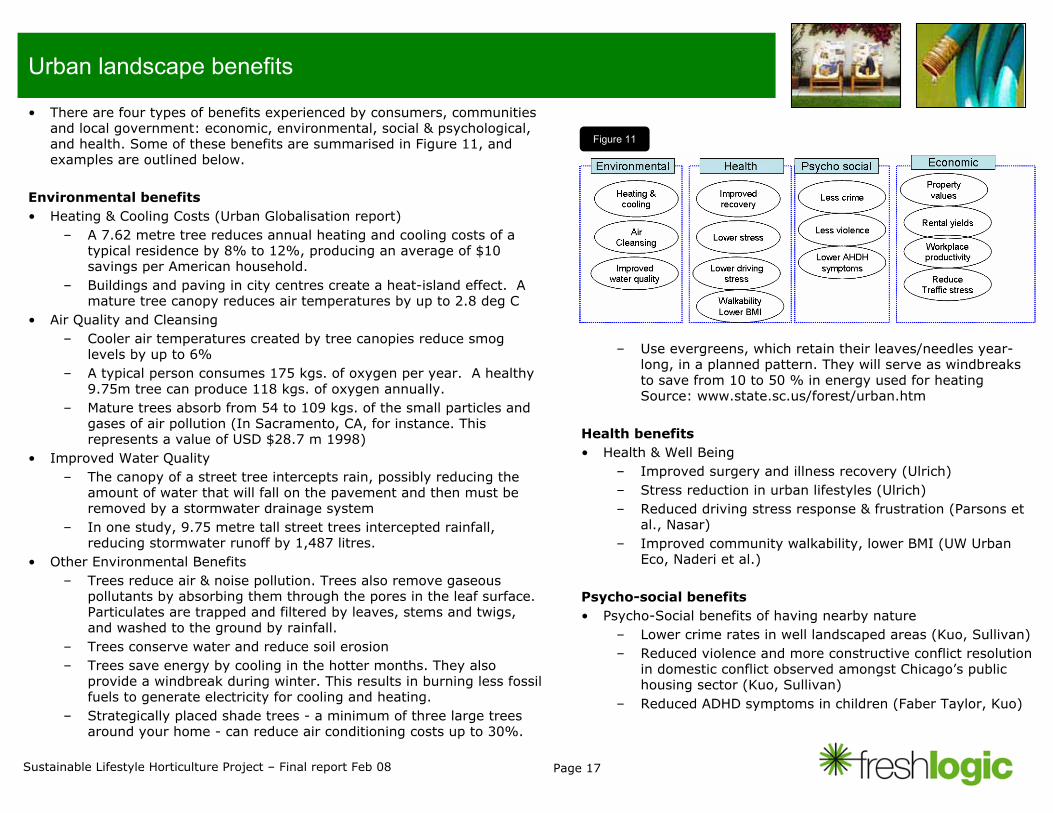
• There are four types of benefits experienced by consumers, communities and local government: economic, environmental, social & psychological, and health. Some of these benefits are summarised in Figure 11, and examples are outlined below.
Environmental benefits• Heating & Cooling Costs (Urban Globalisation report)
– A 7.62 metre tree reduces annual heating and cooling costs of a typical residence by 8% to 12%, producing an average of $10 savings per American household.
– Buildings and paving in city centres create a heat-island effect. A mature tree canopy reduces air temperatures by up to 2.8 deg C
• Air Quality and Cleansing– Cooler air temperatures created by tree canopies reduce smog
levels by up to 6%– A typical person consumes 175 kgs. of oxygen per year. A healthy
9.75m tree can produce 118 kgs. of oxygen annually.– Mature trees absorb from 54 to 109 kgs. of the small particles and
gases of air pollution (In Sacramento, CA, for instance. This represents a value of USD $28.7 m 1998)
• Improved Water Quality– The canopy of a street tree intercepts rain, possibly reducing the
amount of water that will fall on the pavement and then must be removed by a stormwater drainage system
– In one study, 9.75 metre tall street trees intercepted rainfall,reducing stormwater runoff by 1,487 litres.
• Other Environmental Benefits– Trees reduce air & noise pollution. Trees also remove gaseous
pollutants by absorbing them through the pores in the leaf surface. Particulates are trapped and filtered by leaves, stems and twigs, and washed to the ground by rainfall.
– Trees conserve water and reduce soil erosion– Trees save energy by cooling in the hotter months. They also
provide a windbreak during winter. This results in burning less fossil fuels to generate electricity for cooling and heating.
– Strategically placed shade trees - a minimum of three large trees around your home - can reduce air conditioning costs up to 30%.
– Use evergreens, which retain their leaves/needles year-long, in a planned pattern. They will serve as windbreaks to save from 10 to 50 % in energy used for heating Source: www.state.sc.us/forest/urban.htm
Health benefits• Health & Well Being
– Improved surgery and illness recovery (Ulrich)– Stress reduction in urban lifestyles (Ulrich)– Reduced driving stress response & frustration (Parsons et
al., Nasar)– Improved community walkability, lower BMI (UW Urban
Eco, Naderi et al.)
Psycho-social benefits• Psycho-Social benefits of having nearby nature
– Lower crime rates in well landscaped areas (Kuo, Sullivan)– Reduced violence and more constructive conflict resolution
in domestic conflict observed amongst Chicago’s public housing sector (Kuo, Sullivan)
– Reduced ADHD symptoms in children (Faber Taylor, Kuo)
Figure 11
Page 18Sustainable Lifestyle Horticulture Project – Final report Feb 08
Urban landscape benefits
Economic Benefits• Trees and Residential Property Values (2001 USA valuation &
benefits study)– Data from > 800 home sales - it was noted that houses with
large trees in the front yard enjoyed an increase in the sale price (0.88% or $1K per $115K home value) Anderson & Cordell
– Buyers are willing to pay 3-15% more for residential properties with ample trees
• Parks and Property values– Assessed value of properties - 10 to 20% higher– Conditions for higher value – must have good visibility, be well
maintained • Landscape & Commercial Building Rental Yields
– Office and industrial space in a wooded setting is in more demand and is more valuable to sell or rent.
– Quality landscaping lifted office rentals by 7% per annum (Davey Resource Group, USA, 2003)
• Urban Benefits in Retail Environments– higher willingness to pay for all types of goods i.e. higher in
districts with trees: 9-12%• Workplace Nature Views
– Well-being: desk workers without nature views reported 23% more ailments in the 6 months prior to the study
– Job Satisfaction: less frustrated and more patient; higher overall job satisfaction and enthusiasm / reduction in workplace fatigue
• Plants in the Workplace – Productivity: 12% quicker reaction on computer tasks & more
attentive– Stress Reduction: lower systolic blood – Higher job satisfaction, reduced absenteeism (R. Kaplan)
• Roadside Landscape & Traffic Stress Response – Roadside Features - driving simulations such as being
surrounded by nature, greenery, golf course, strip mall etc led to improved psychological response ie lower blood pressure, immunisation effect, less response to new stresses (study result)
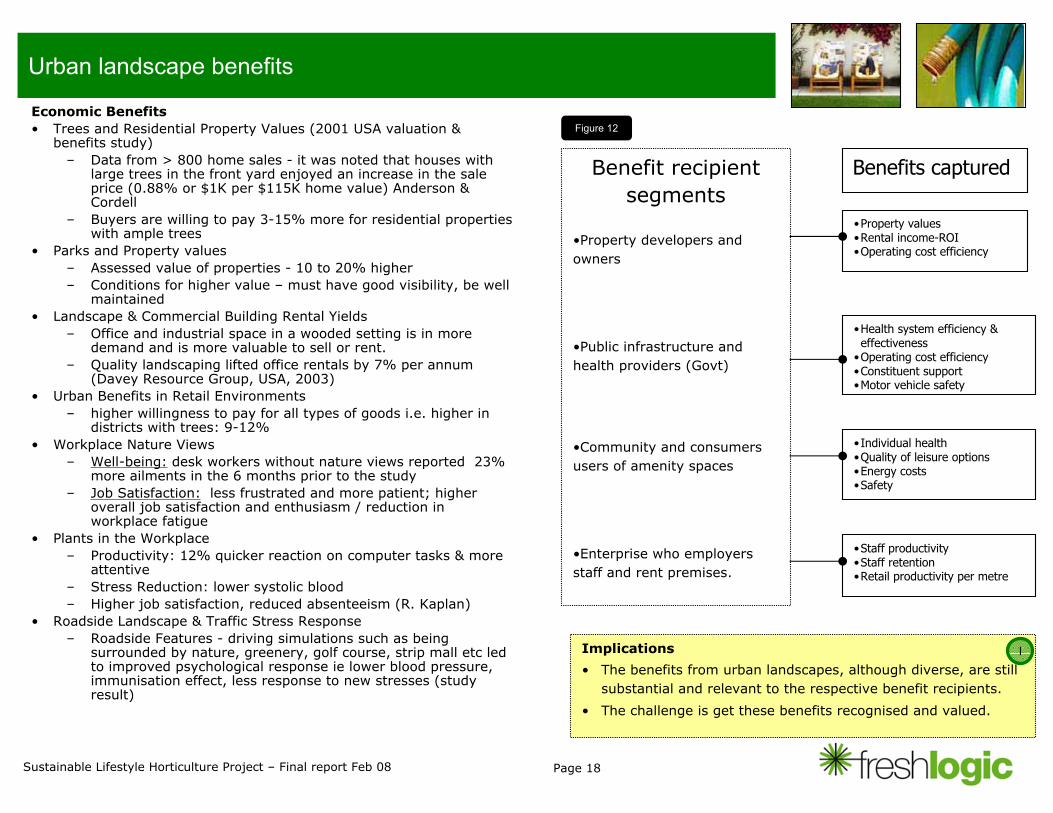
Implications
• The benefits from urban landscapes, although diverse, are still substantial and relevant to the respective benefit recipients.
• The challenge is get these benefits recognised and valued.
Benefit recipient segments
•Property developers and owners
•Public infrastructure and health providers (Govt)
•Community and consumers users of amenity spaces
•Enterprise who employers staff and rent premises.
•Property values•Rental income-ROI•Operating cost efficiency
•Health system efficiency & effectiveness
•Operating cost efficiency•Constituent support•Motor vehicle safety
•Individual health •Quality of leisure options•Energy costs•Safety
•Staff productivity•Staff retention•Retail productivity per metre
Benefits captured
Figure 12
I
Page 19Sustainable Lifestyle Horticulture Project – Final report Feb 08
Product diversification
Status & drivers• Product and service diversification has been driven by what is seen as
normal commercial behaviour responding to market demand signals. The level of activity signals that commercial gains have been created in current market conditions.
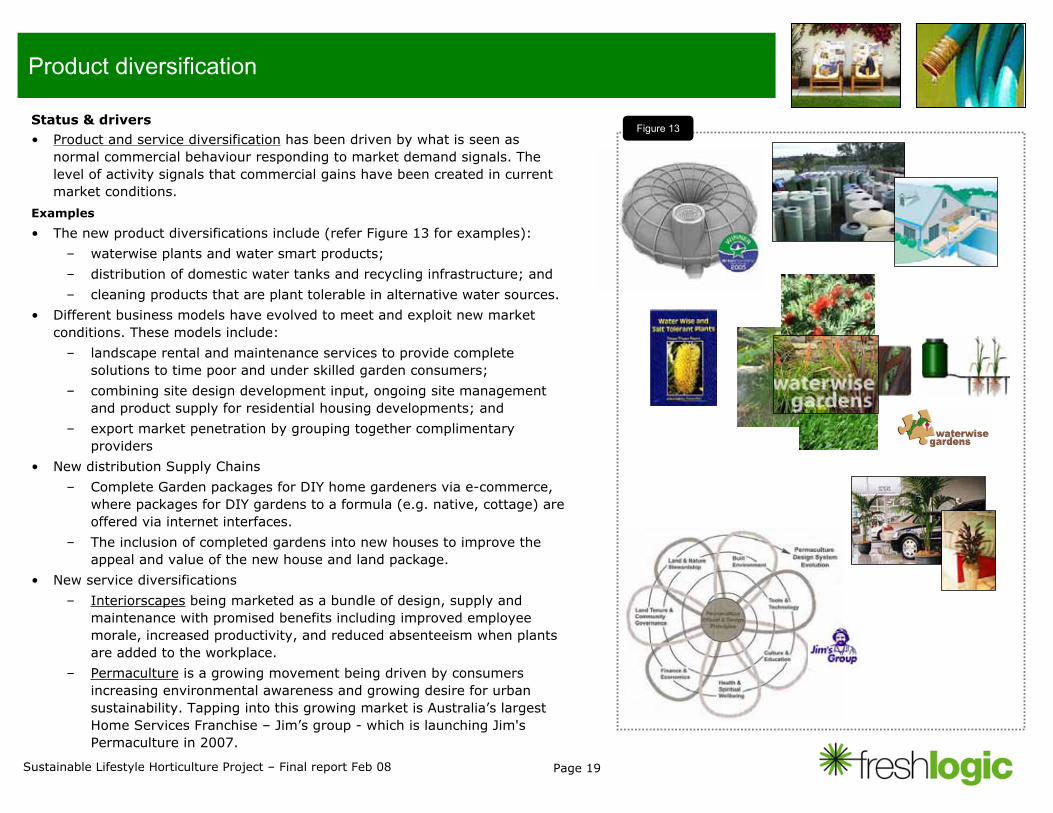
Examples
• The new product diversifications include (refer Figure 13 for examples):
– waterwise plants and water smart products;
– distribution of domestic water tanks and recycling infrastructure; and
– cleaning products that are plant tolerable in alternative water sources.
• Different business models have evolved to meet and exploit new market conditions. These models include:
– landscape rental and maintenance services to provide complete solutions to time poor and under skilled garden consumers;
– combining site design development input, ongoing site managementand product supply for residential housing developments; and
– export market penetration by grouping together complimentary providers
• New distribution Supply Chains
– Complete Garden packages for DIY home gardeners via e-commerce, where packages for DIY gardens to a formula (e.g. native, cottage) are offered via internet interfaces.
– The inclusion of completed gardens into new houses to improve the appeal and value of the new house and land package.
• New service diversifications
– Interiorscapes being marketed as a bundle of design, supply and maintenance with promised benefits including improved employee morale, increased productivity, and reduced absenteeism when plants are added to the workplace.
– Permaculture is a growing movement being driven by consumers increasing environmental awareness and growing desire for urban sustainability. Tapping into this growing market is Australia’s largest Home Services Franchise – Jim’s group - which is launching Jim's Permaculture in 2007.
Figure 13
Page 20Sustainable Lifestyle Horticulture Project – Final report Feb 08
Product diversification - continued
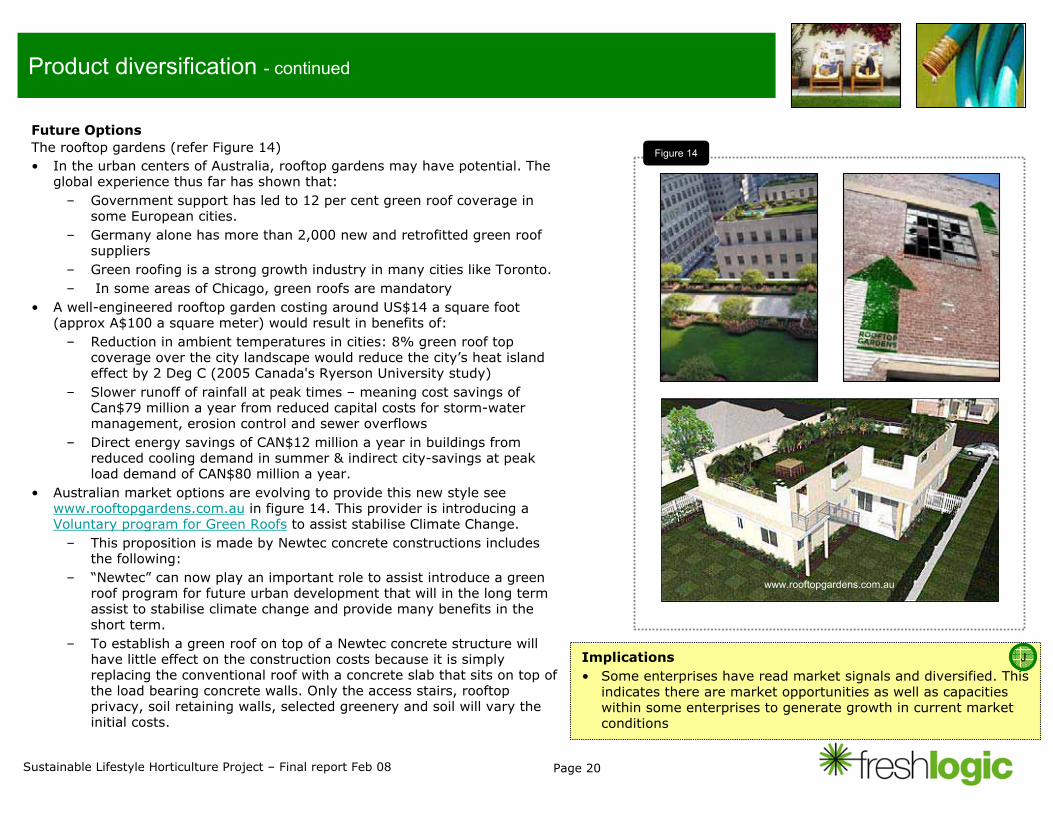
Future Options The rooftop gardens (refer Figure 14)• In the urban centers of Australia, rooftop gardens may have potential. The
global experience thus far has shown that:– Government support has led to 12 per cent green roof coverage in
some European cities. – Germany alone has more than 2,000 new and retrofitted green roof
suppliers– Green roofing is a strong growth industry in many cities like Toronto.– In some areas of Chicago, green roofs are mandatory
• A well-engineered rooftop garden costing around US$14 a square foot (approx A$100 a square meter) would result in benefits of:
– Reduction in ambient temperatures in cities: 8% green roof top coverage over the city landscape would reduce the city’s heat island effect by 2 Deg C (2005 Canada's Ryerson University study)
– Slower runoff of rainfall at peak times – meaning cost savings of Can$79 million a year from reduced capital costs for storm-water management, erosion control and sewer overflows
– Direct energy savings of CAN$12 million a year in buildings fromreduced cooling demand in summer & indirect city-savings at peak load demand of CAN$80 million a year.
• Australian market options are evolving to provide this new style see www.rooftopgardens.com.au in figure 14. This provider is introducing a Voluntary program for Green Roofs to assist stabilise Climate Change.
– This proposition is made by Newtec concrete constructions includes the following:
– “Newtec” can now play an important role to assist introduce a green roof program for future urban development that will in the long term assist to stabilise climate change and provide many benefits in the short term.
– To establish a green roof on top of a Newtec concrete structure will have little effect on the construction costs because it is simply replacing the conventional roof with a concrete slab that sits on top of the load bearing concrete walls. Only the access stairs, rooftopprivacy, soil retaining walls, selected greenery and soil will vary the initial costs.
Implications • Some enterprises have read market signals and diversified. This
indicates there are market opportunities as well as capacities within some enterprises to generate growth in current market conditions
Figure 14
J
www.rooftopgardens.com.au
Page 21Sustainable Lifestyle Horticulture Project – Final report Feb 08
Regional development
Variations
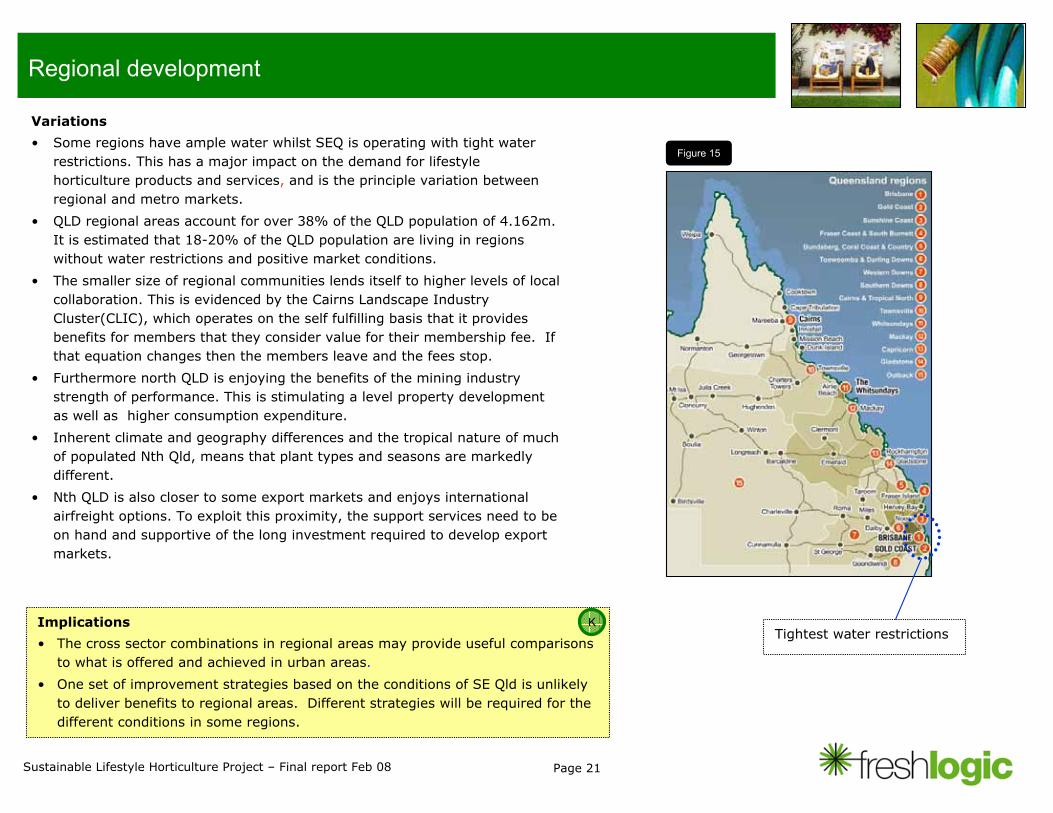
• Some regions have ample water whilst SEQ is operating with tight water restrictions. This has a major impact on the demand for lifestyle horticulture products and services, and is the principle variation between regional and metro markets.
• QLD regional areas account for over 38% of the QLD population of 4.162m. It is estimated that 18-20% of the QLD population are living in regions without water restrictions and positive market conditions.
• The smaller size of regional communities lends itself to higher levels of local collaboration. This is evidenced by the Cairns Landscape Industry Cluster(CLIC), which operates on the self fulfilling basis that it provides benefits for members that they consider value for their membership fee. If that equation changes then the members leave and the fees stop.
• Furthermore north QLD is enjoying the benefits of the mining industry strength of performance. This is stimulating a level property development as well as higher consumption expenditure.
• Inherent climate and geography differences and the tropical nature of much of populated Nth Qld, means that plant types and seasons are markedly different.
• Nth QLD is also closer to some export markets and enjoys international airfreight options. To exploit this proximity, the support services need to be on hand and supportive of the long investment required to develop export markets.
Implications
• The cross sector combinations in regional areas may provide useful comparisons to what is offered and achieved in urban areas.
• One set of improvement strategies based on the conditions of SE Qld is unlikely to deliver benefits to regional areas. Different strategies will be required for the different conditions in some regions.
Tightest water restrictions
Figure 15
K
Page 22Sustainable Lifestyle Horticulture Project – Final report Feb 08
Plant Export ValueTotal Australia & Qld
$0
$1,000
$2,000
$3,000
$4,000
$5,000
$6,000
$7,000
$8,000
$9,000
$10,000
$11,000
$12,000
FY2003 FY2004 FY2005 FY2006 FY2007
Period
Valu
e (A
$'00
0)QueenslandTotal Australia
Plant Export ValueTotal Australia by category
$0
$2,000
$4,000
$6,000
$8,000
$10,000
$12,000
FY2003 FY2004 FY2005 FY2006 FY2007
Period
Valu
e (A
$'00
0)
Bulbs & tubers dormant Bulbs & tubers in growth Unrooted cuttings and slipsTrees & shrubs Rhododendrons & azaleas RosesLive plants (excl live cuttings and slips)
Export opportunities
Performance
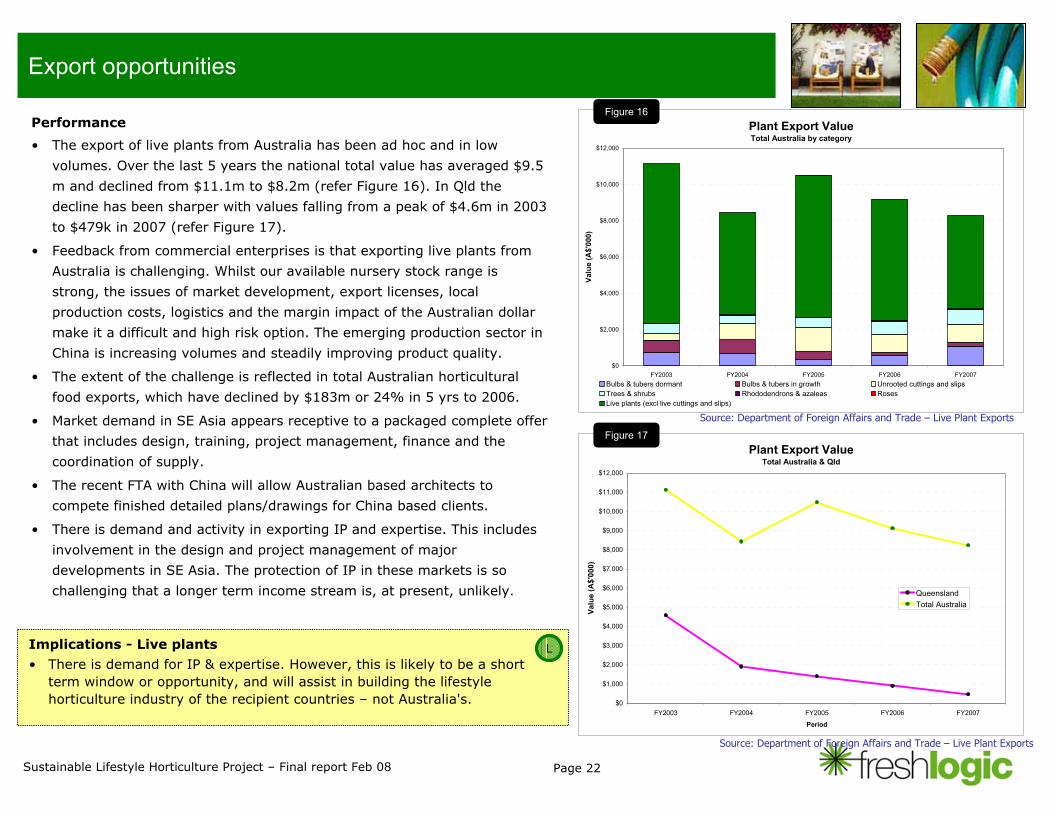
• The export of live plants from Australia has been ad hoc and in low
volumes. Over the last 5 years the national total value has averaged $9.5
m and declined from $11.1m to $8.2m (refer Figure 16). In Qld the
decline has been sharper with values falling from a peak of $4.6m in 2003
to $479k in 2007 (refer Figure 17).
• Feedback from commercial enterprises is that exporting live plants from
Australia is challenging. Whilst our available nursery stock range is
strong, the issues of market development, export licenses, local
production costs, logistics and the margin impact of the Australian dollar
make it a difficult and high risk option. The emerging production sector in
China is increasing volumes and steadily improving product quality.
• The extent of the challenge is reflected in total Australian horticultural
food exports, which have declined by $183m or 24% in 5 yrs to 2006.
• Market demand in SE Asia appears receptive to a packaged complete offer
that includes design, training, project management, finance and the
coordination of supply.
• The recent FTA with China will allow Australian based architects to
compete finished detailed plans/drawings for China based clients.
• There is demand and activity in exporting IP and expertise. This includes
involvement in the design and project management of major
developments in SE Asia. The protection of IP in these markets is so
challenging that a longer term income stream is, at present, unlikely.
Implications - Live plants
• There is demand for IP & expertise. However, this is likely to be a short term window or opportunity, and will assist in building the lifestyle horticulture industry of the recipient countries – not Australia's.
Figure 16
Figure 17
Source: Department of Foreign Affairs and Trade – Live Plant Exports
Source: Department of Foreign Affairs and Trade – Live Plant Exports
L
Page 23Sustainable Lifestyle Horticulture Project – Final report Feb 08
Export opportunities
Performance
• Cut Flowers & Foliage enjoys a larger global market than live plants. This is influenced by their perishable nature and the ensuing repeat consumption patterns. As a participant in this market, Australia has some advantages in product, growing conditions and seasonal supply windows.
• Definitive data on export sales of cut flowers and foliage is not available. This is due to some Queensland produced product being exported out of other states and DFAT data capture of nominal pre auction consignment values rather than final selling price.
• However, best industry estimates place the value of cut flower & foliage exported overseas out of Queensland at $13m per annum for the calendar year 2007.
• Feedback from exporters indicates there is market price resistance due to the stronger AUD$ and/or pressure to trade in another currency.
• Japan, United States, and the Netherlands are the top three destinations for exports of Australian cut flowers. All three of these countries have been showing a decline in export value over the last five years.
• The information gap on market values for the Cut Flowers & Foliage sector is a vulnerability. It undermines the provision of support as the impact of market development investments cannot be measured.
Developing exports
• Trade missions that have built relationships with key property developers are reported to have delivered positive flow on results.
• Indications are that the enterprises who understand export markets and the basis on which they need to compete, are best placed to further develop export markets. However, several export development agencies have a performance measure based on the number of businesses exporting, which is in conflict with this conclusion.
• Recent activity on exporting tissue cultured stock has shown positive results.
Implications - Cut flowers exports
• The national exports of cut flowers are more substantial than live plants but still a small commercial base. There is demand for dried, died, bleached or impregnated cut flowers out of QLD.
• Given the export market conditions and Australian competitive disadvantages, generating growth by supporting existing exporters is a lower risk option than stimulating expansion in the number of businesses exporting.
M
Current ACLH export directions
• An ACLH draft export strategy has been defined an ACLH export
subcommittee. This plan identifies the impediments, which
include and range from lack of production and low market
knowledge to logistical shortfalls and weak IP protection.
• The confidence to invest in export is low and indications are a
high level of development is required to move non exporters into
competent and successful exporters.
• The plan confirms that export demand for services is stronger
than the overall for products, with the exception of wildflowers.
• Action plans address a diverse agenda of export culture,
capabilities, business structures, promotion, regulator liaison and
market research.
• This report concludes that the scope of these actions are
appropriate but optimistic and concludes that higher overall
industry growth is likely be achieved by supporting enterprises
who have the culture, capability and business structure.
Page 24Sustainable Lifestyle Horticulture Project – Final report Feb 08
Key issues and strategy implications
Growth options need to embrace support providers and not be limited to those who produce, trade, or maintain primary product.
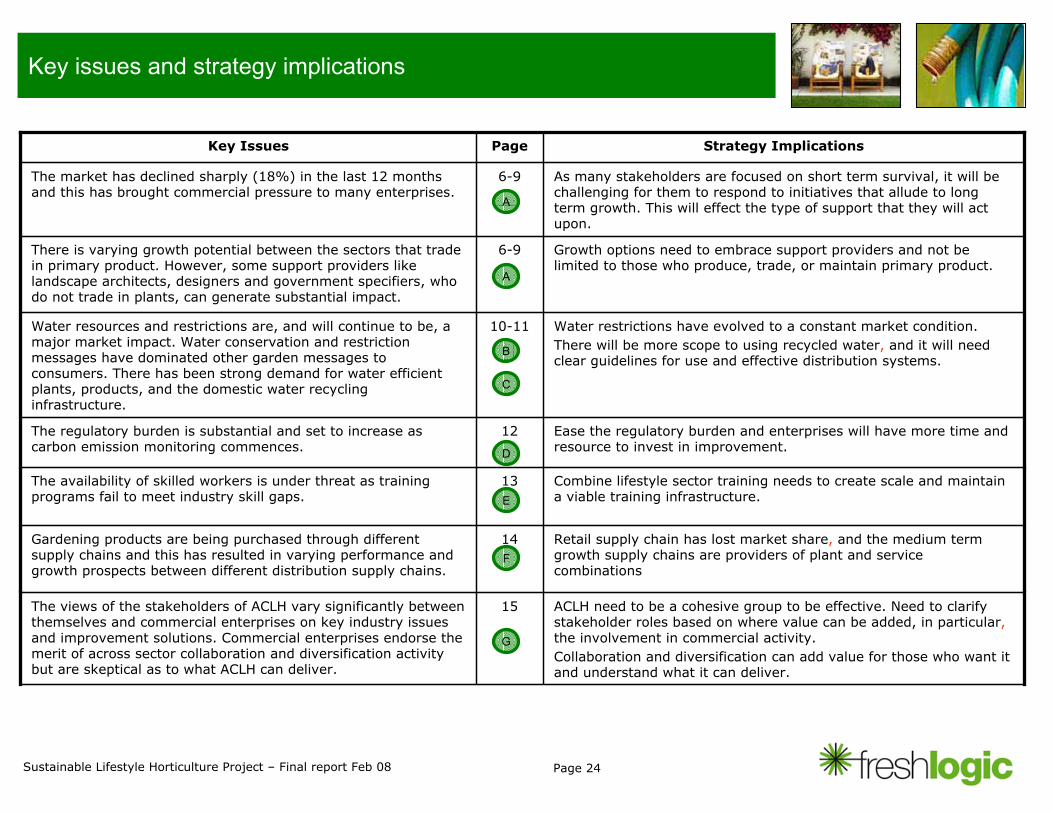
6-9There is varying growth potential between the sectors that tradein primary product. However, some support providers like landscape architects, designers and government specifiers, who do not trade in plants, can generate substantial impact.
Combine lifestyle sector training needs to create scale and maintain a viable training infrastructure.
13The availability of skilled workers is under threat as training programs fail to meet industry skill gaps.
15
14
12
10-11
6-9
Page
Ease the regulatory burden and enterprises will have more time and resource to invest in improvement.
The regulatory burden is substantial and set to increase as carbon emission monitoring commences.
As many stakeholders are focused on short term survival, it will be challenging for them to respond to initiatives that allude to long term growth. This will effect the type of support that they will act upon.
The market has declined sharply (18%) in the last 12 months and this has brought commercial pressure to many enterprises.
ACLH need to be a cohesive group to be effective. Need to clarify stakeholder roles based on where value can be added, in particular,the involvement in commercial activity. Collaboration and diversification can add value for those who want it and understand what it can deliver.
The views of the stakeholders of ACLH vary significantly betweenthemselves and commercial enterprises on key industry issues and improvement solutions. Commercial enterprises endorse the merit of across sector collaboration and diversification activity but are skeptical as to what ACLH can deliver.
Strategy ImplicationsKey Issues
Retail supply chain has lost market share, and the medium term growth supply chains are providers of plant and service combinations
Gardening products are being purchased through different supply chains and this has resulted in varying performance and growth prospects between different distribution supply chains.
Water restrictions have evolved to a constant market condition.There will be more scope to using recycled water, and it will need clear guidelines for use and effective distribution systems.
Water resources and restrictions are, and will continue to be, amajor market impact. Water conservation and restriction messages have dominated other garden messages to consumers. There has been strong demand for water efficient plants, products, and the domestic water recycling infrastructure.
A
B
C
D
E
F
G
A
Page 25Sustainable Lifestyle Horticulture Project – Final report Feb 08
Key issues and strategy implications
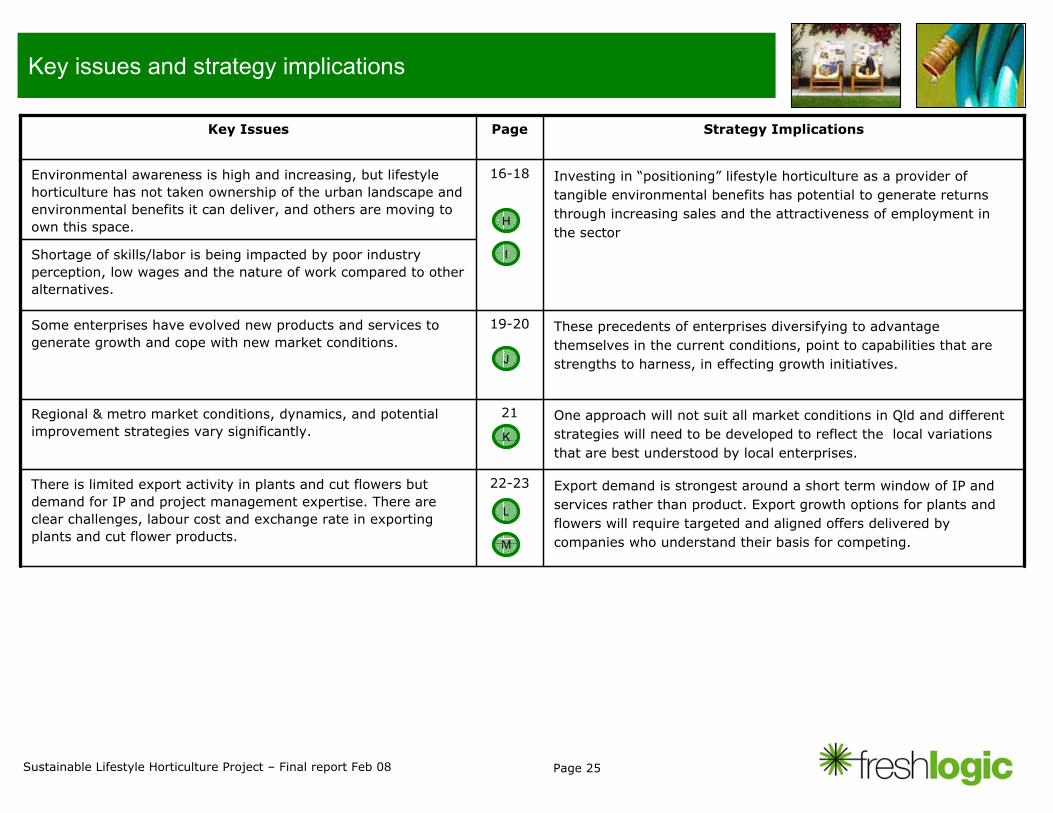
Investing in “positioning” lifestyle horticulture as a provider of tangible environmental benefits has potential to generate returns through increasing sales and the attractiveness of employment inthe sector
16-18Environmental awareness is high and increasing, but lifestyle horticulture has not taken ownership of the urban landscape and environmental benefits it can deliver, and others are moving to own this space.
Shortage of skills/labor is being impacted by poor industry perception, low wages and the nature of work compared to other alternatives.
These precedents of enterprises diversifying to advantage themselves in the current conditions, point to capabilities that are strengths to harness, in effecting growth initiatives.
19-20Some enterprises have evolved new products and services to generate growth and cope with new market conditions.
22-23
21
Page
Export demand is strongest around a short term window of IP and services rather than product. Export growth options for plants and flowers will require targeted and aligned offers delivered by companies who understand their basis for competing.
There is limited export activity in plants and cut flowers but demand for IP and project management expertise. There are clear challenges, labour cost and exchange rate in exporting plants and cut flower products.
One approach will not suit all market conditions in Qld and different strategies will need to be developed to reflect the local variationsthat are best understood by local enterprises.
Regional & metro market conditions, dynamics, and potential improvement strategies vary significantly.
Strategy ImplicationsKey Issues
J
K
L
M
H
I
Page 26Sustainable Lifestyle Horticulture Project – Final report Feb 08
Opportunities and strategies
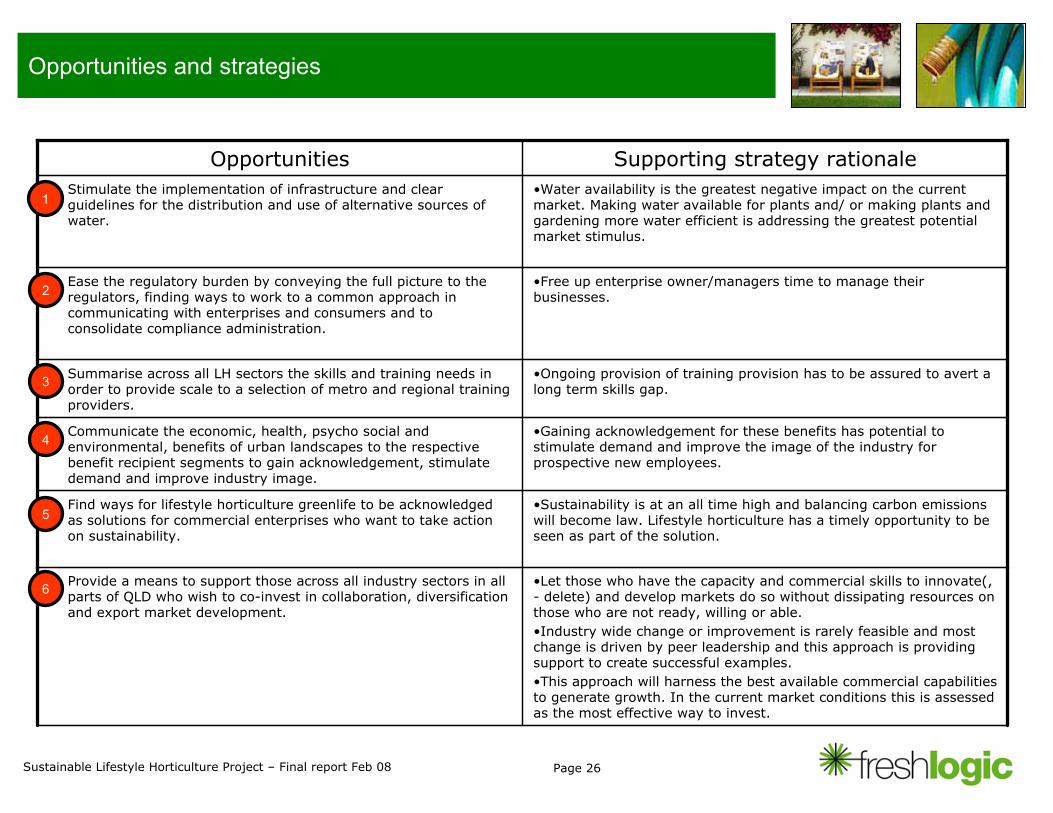
•Let those who have the capacity and commercial skills to innovate(, - delete) and develop markets do so without dissipating resources on those who are not ready, willing or able. •Industry wide change or improvement is rarely feasible and most change is driven by peer leadership and this approach is providing support to create successful examples. •This approach will harness the best available commercial capabilities to generate growth. In the current market conditions this is assessed as the most effective way to invest.
• Provide a means to support those across all industry sectors in all parts of QLD who wish to co-invest in collaboration, diversification and export market development.
•Sustainability is at an all time high and balancing carbon emissions will become law. Lifestyle horticulture has a timely opportunity to be seen as part of the solution.
• Find ways for lifestyle horticulture greenlife to be acknowledged as solutions for commercial enterprises who want to take action on sustainability.
•Gaining acknowledgement for these benefits has potential to stimulate demand and improve the image of the industry for prospective new employees.
• Communicate the economic, health, psycho social and environmental, benefits of urban landscapes to the respective benefit recipient segments to gain acknowledgement, stimulate demand and improve industry image.
•Ongoing provision of training provision has to be assured to avert a long term skills gap.
• Summarise across all LH sectors the skills and training needs inorder to provide scale to a selection of metro and regional training providers.
•Free up enterprise owner/managers time to manage their businesses.
• Ease the regulatory burden by conveying the full picture to the regulators, finding ways to work to a common approach in communicating with enterprises and consumers and to consolidate compliance administration.
•Water availability is the greatest negative impact on the current market. Making water available for plants and/ or making plants and gardening more water efficient is addressing the greatest potential market stimulus.
• Stimulate the implementation of infrastructure and clear guidelines for the distribution and use of alternative sources of water.
Supporting strategy rationale Opportunities
1
2
3
4
5
6
Page 27Sustainable Lifestyle Horticulture Project – Final report Feb 08
Vision statement, value proposition and future role
Overview
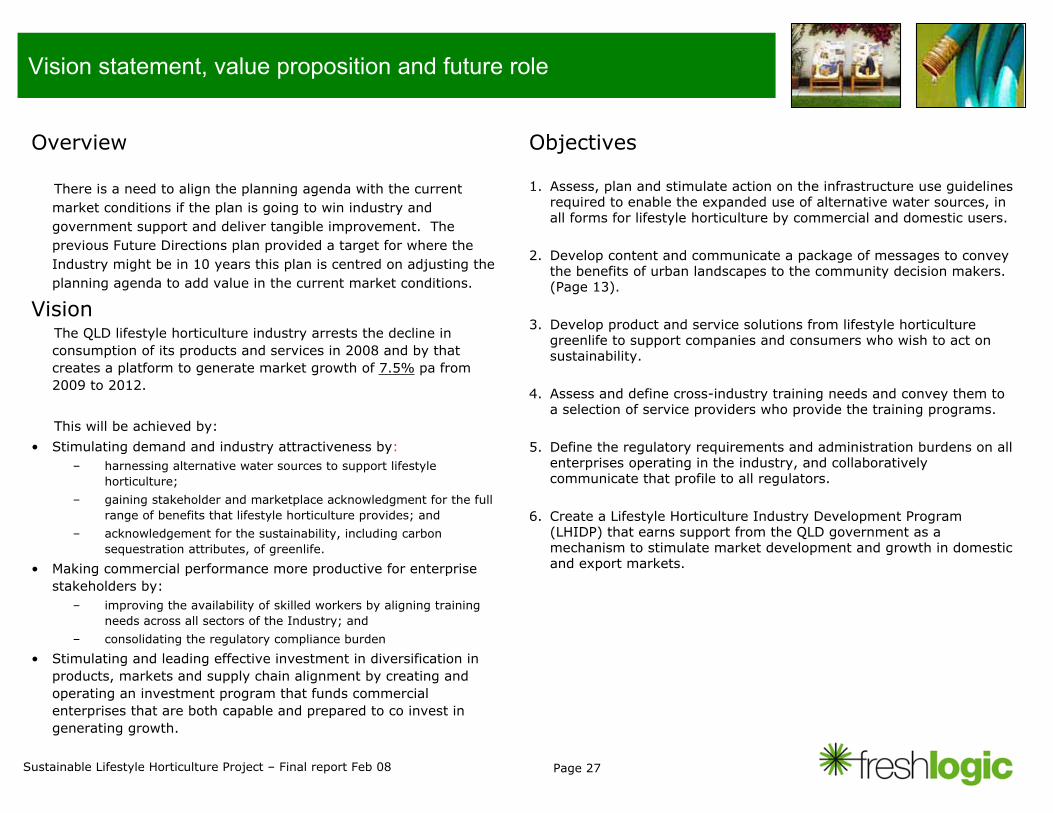
There is a need to align the planning agenda with the current market conditions if the plan is going to win industry and government support and deliver tangible improvement. The previous Future Directions plan provided a target for where the Industry might be in 10 years this plan is centred on adjusting the planning agenda to add value in the current market conditions.
VisionThe QLD lifestyle horticulture industry arrests the decline in consumption of its products and services in 2008 and by that creates a platform to generate market growth of 7.5% pa from 2009 to 2012.
This will be achieved by:
• Stimulating demand and industry attractiveness by:– harnessing alternative water sources to support lifestyle
horticulture;
– gaining stakeholder and marketplace acknowledgment for the full range of benefits that lifestyle horticulture provides; and
– acknowledgement for the sustainability, including carbon sequestration attributes, of greenlife.
• Making commercial performance more productive for enterprise stakeholders by:
– improving the availability of skilled workers by aligning training needs across all sectors of the Industry; and
– consolidating the regulatory compliance burden
• Stimulating and leading effective investment in diversification in products, markets and supply chain alignment by creating and operating an investment program that funds commercial enterprises that are both capable and prepared to co invest in generating growth.
Objectives
1. Assess, plan and stimulate action on the infrastructure use guidelines required to enable the expanded use of alternative water sources, in all forms for lifestyle horticulture by commercial and domestic users.
2. Develop content and communicate a package of messages to convey the benefits of urban landscapes to the community decision makers. (Page 13).
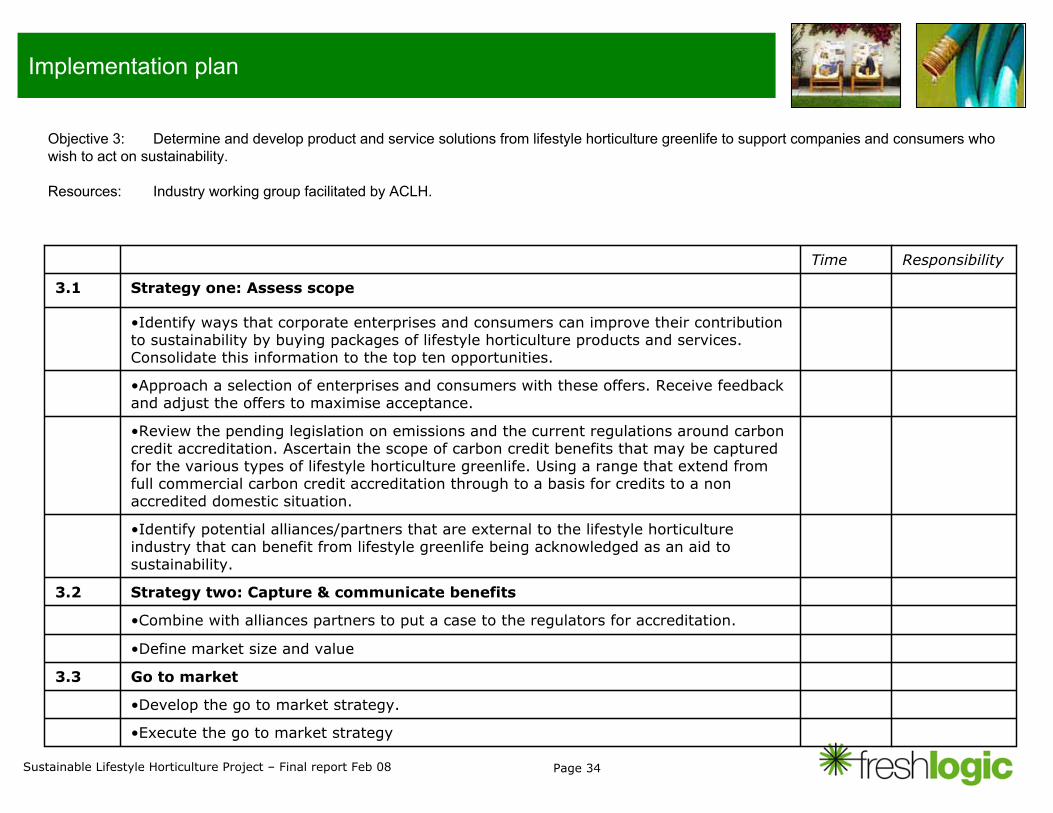
3. Develop product and service solutions from lifestyle horticulture greenlife to support companies and consumers who wish to act on sustainability.
4. Assess and define cross-industry training needs and convey them to a selection of service providers who provide the training programs.
5. Define the regulatory requirements and administration burdens on all enterprises operating in the industry, and collaboratively communicate that profile to all regulators.
6. Create a Lifestyle Horticulture Industry Development Program (LHIDP) that earns support from the QLD government as a mechanism to stimulate market development and growth in domesticand export markets.
Page 28Sustainable Lifestyle Horticulture Project – Final report Feb 08
Implementation rationale and funding
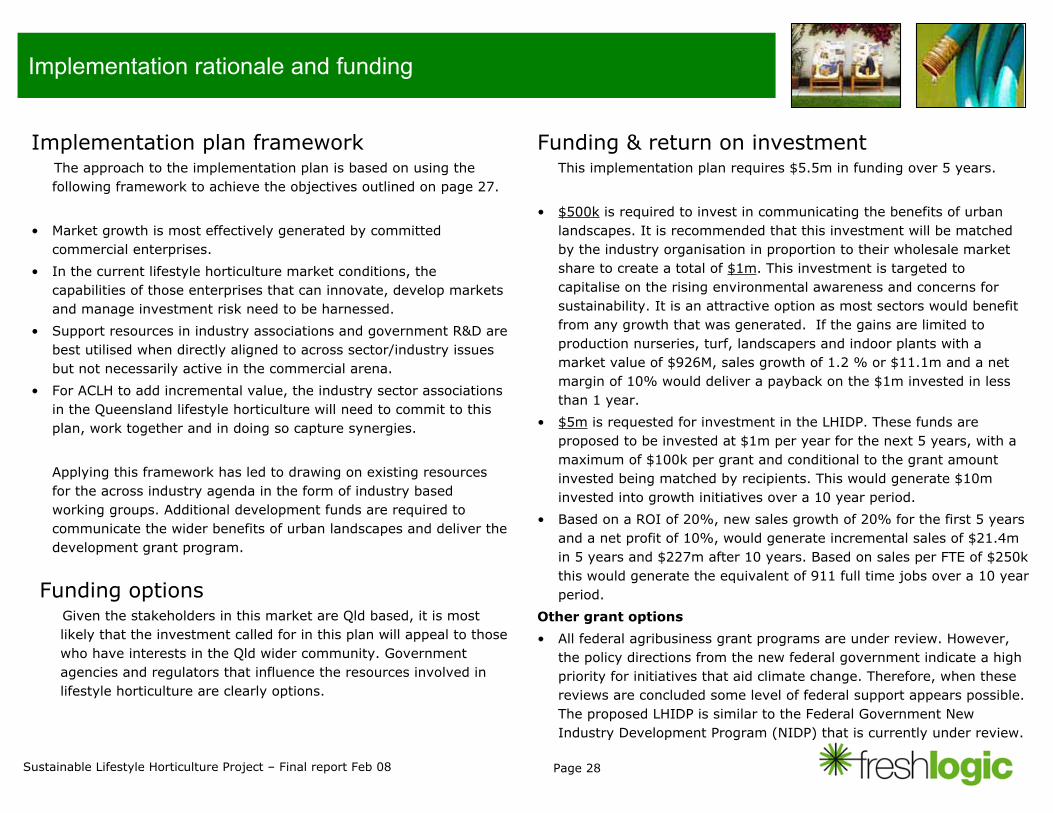
Implementation plan frameworkThe approach to the implementation plan is based on using the following framework to achieve the objectives outlined on page 27.
• Market growth is most effectively generated by committed commercial enterprises.
• In the current lifestyle horticulture market conditions, the capabilities of those enterprises that can innovate, develop markets and manage investment risk need to be harnessed.
• Support resources in industry associations and government R&D are best utilised when directly aligned to across sector/industry issues but not necessarily active in the commercial arena.
• For ACLH to add incremental value, the industry sector associations in the Queensland lifestyle horticulture will need to commit to this plan, work together and in doing so capture synergies.
Applying this framework has led to drawing on existing resourcesfor the across industry agenda in the form of industry based working groups. Additional development funds are required to communicate the wider benefits of urban landscapes and deliver the development grant program.
Funding & return on investment This implementation plan requires $5.5m in funding over 5 years.
• $500k is required to invest in communicating the benefits of urban landscapes. It is recommended that this investment will be matched by the industry organisation in proportion to their wholesale market share to create a total of $1m. This investment is targeted to capitalise on the rising environmental awareness and concerns for sustainability. It is an attractive option as most sectors would benefit from any growth that was generated. If the gains are limited toproduction nurseries, turf, landscapers and indoor plants with amarket value of $926M, sales growth of 1.2 % or $11.1m and a netmargin of 10% would deliver a payback on the $1m invested in less than 1 year.
• $5m is requested for investment in the LHIDP. These funds are proposed to be invested at $1m per year for the next 5 years, with a maximum of $100k per grant and conditional to the grant amount invested being matched by recipients. This would generate $10m invested into growth initiatives over a 10 year period.
• Based on a ROI of 20%, new sales growth of 20% for the first 5 years and a net profit of 10%, would generate incremental sales of $21.4m in 5 years and $227m after 10 years. Based on sales per FTE of $250k this would generate the equivalent of 911 full time jobs over a 10 year period.
Other grant options
• All federal agribusiness grant programs are under review. However, the policy directions from the new federal government indicate a high priority for initiatives that aid climate change. Therefore, when these reviews are concluded some level of federal support appears possible. The proposed LHIDP is similar to the Federal Government New Industry Development Program (NIDP) that is currently under review.
Funding optionsGiven the stakeholders in this market are Qld based, it is most likely that the investment called for in this plan will appeal to those who have interests in the Qld wider community. Government agencies and regulators that influence the resources involved inlifestyle horticulture are clearly options.
Page 29Sustainable Lifestyle Horticulture Project – Final report Feb 08
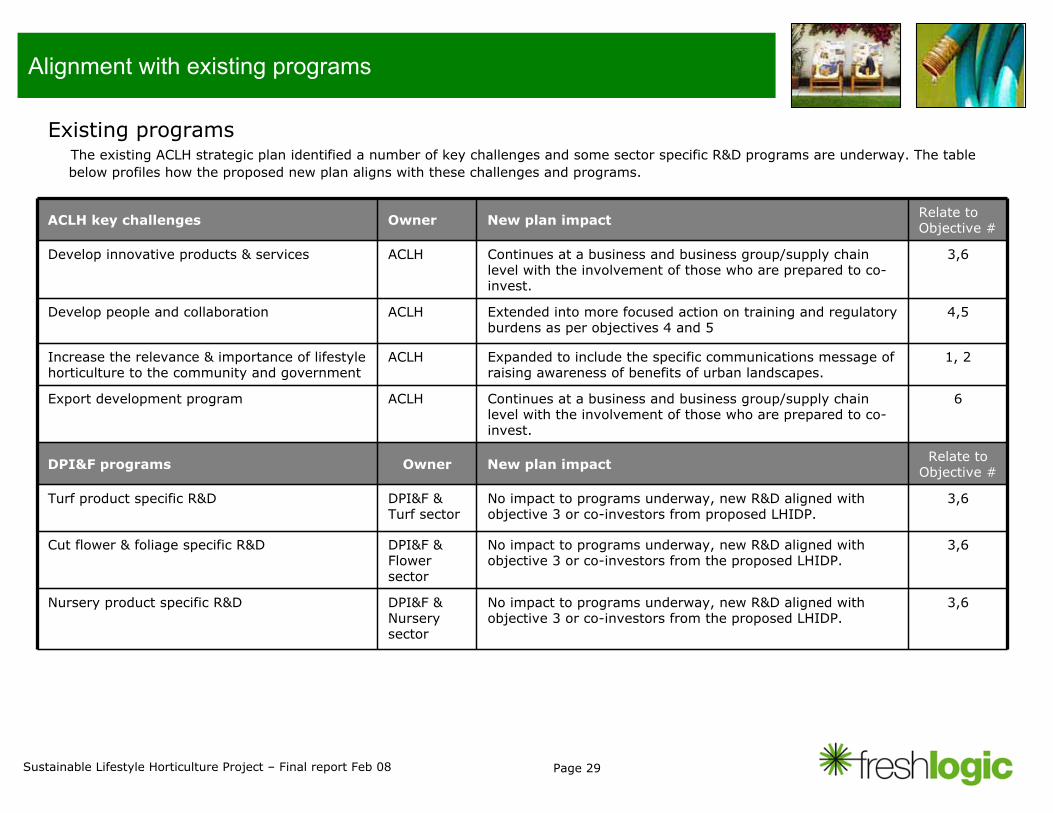
Alignment with existing programs
Existing programs The existing ACLH strategic plan identified a number of key challenges and some sector specific R&D programs are underway. The tablebelow profiles how the proposed new plan aligns with these challenges and programs.
3,6No impact to programs underway, new R&D aligned with objective 3 or co-investors from the proposed LHIDP.
DPI&F & Nursery sector
Nursery product specific R&D
3,6No impact to programs underway, new R&D aligned with objective 3 or co-investors from the proposed LHIDP.
DPI&F & Flowersector
Cut flower & foliage specific R&D
3,6No impact to programs underway, new R&D aligned with objective 3 or co-investors from proposed LHIDP.
DPI&F & Turf sector
Turf product specific R&D
Relate to Objective #New plan impactOwnerDPI&F programs
ACLH
ACLH
ACLH
ACLH
Owner
6Continues at a business and business group/supply chain level with the involvement of those who are prepared to co-invest.
Export development program
1, 2Expanded to include the specific communications message of raising awareness of benefits of urban landscapes.
Increase the relevance & importance of lifestyle horticulture to the community and government
4,5Extended into more focused action on training and regulatory burdens as per objectives 4 and 5
Develop people and collaboration
3,6Continues at a business and business group/supply chain level with the involvement of those who are prepared to co-invest.
Develop innovative products & services
Relate to Objective #New plan impactACLH key challenges
Page 30Sustainable Lifestyle Horticulture Project – Final report Feb 08
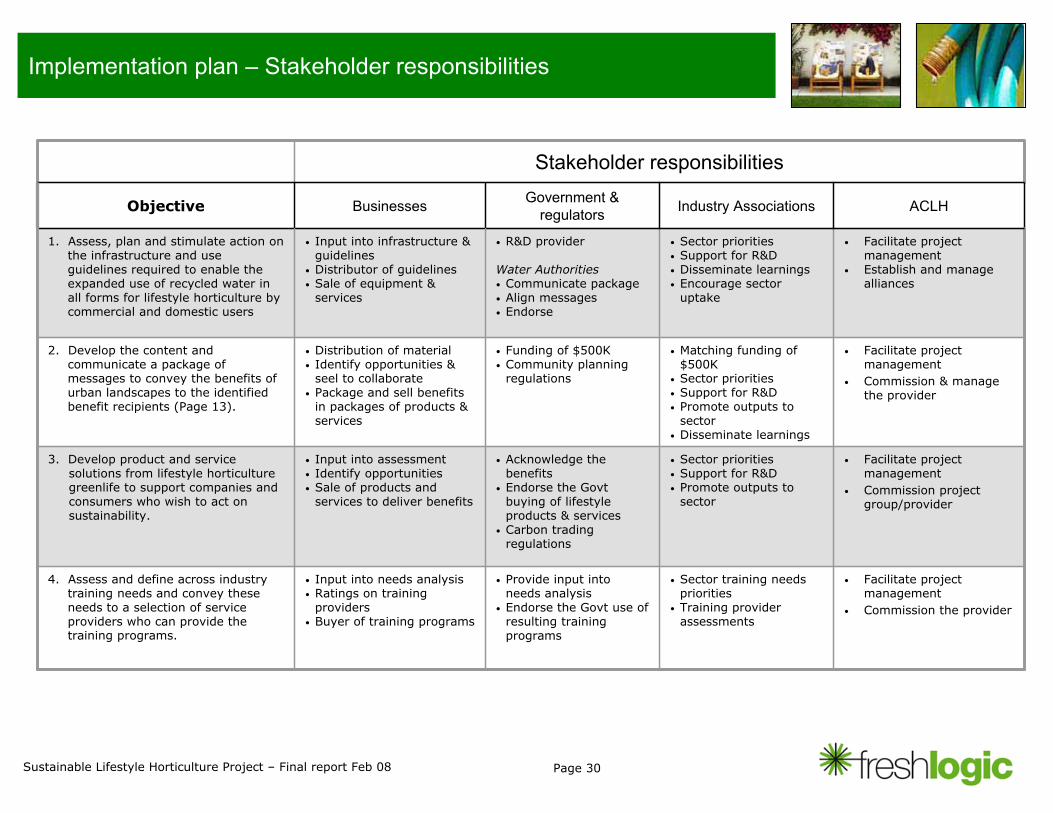
Implementation plan – Stakeholder responsibilities
• Sector training needs priorities
• Training provider assessments
• Sector priorities• Support for R&D • Promote outputs to
sector
• Matching funding of $500K
• Sector priorities• Support for R&D• Promote outputs to
sector• Disseminate learnings
• Sector priorities• Support for R&D• Disseminate learnings • Encourage sector
uptake
Industry Associations
Stakeholder responsibilities
ACLHGovernment & regulatorsBusinessesObjective
• Facilitate project management
• Commission the provider
• Provide input into needs analysis
• Endorse the Govt use of resulting training programs
• Input into needs analysis• Ratings on training
providers• Buyer of training programs
4. Assess and define across industry training needs and convey these needs to a selection of service providers who can provide the training programs.
• Facilitate project management
• Commission project group/provider
• Acknowledge the benefits
• Endorse the Govt buying of lifestyle products & services
• Carbon trading regulations
• Input into assessment• Identify opportunities• Sale of products and
services to deliver benefits
3. Develop product and service solutions from lifestyle horticulture greenlife to support companies and consumers who wish to act on sustainability.
• Facilitate project management
• Commission & manage the provider
• Funding of $500K• Community planning
regulations
• Distribution of material • Identify opportunities &
seel to collaborate• Package and sell benefits
in packages of products & services
2. Develop the content and communicate a package of messages to convey the benefits of urban landscapes to the identified benefit recipients (Page 13).
• Facilitate project management
• Establish and manage alliances
• R&D provider
Water Authorities• Communicate package• Align messages• Endorse
• Input into infrastructure & guidelines
• Distributor of guidelines• Sale of equipment &
services
1. Assess, plan and stimulate action on the infrastructure and use guidelines required to enable the expanded use of recycled water in all forms for lifestyle horticulture by commercial and domestic users
Page 31Sustainable Lifestyle Horticulture Project – Final report Feb 08
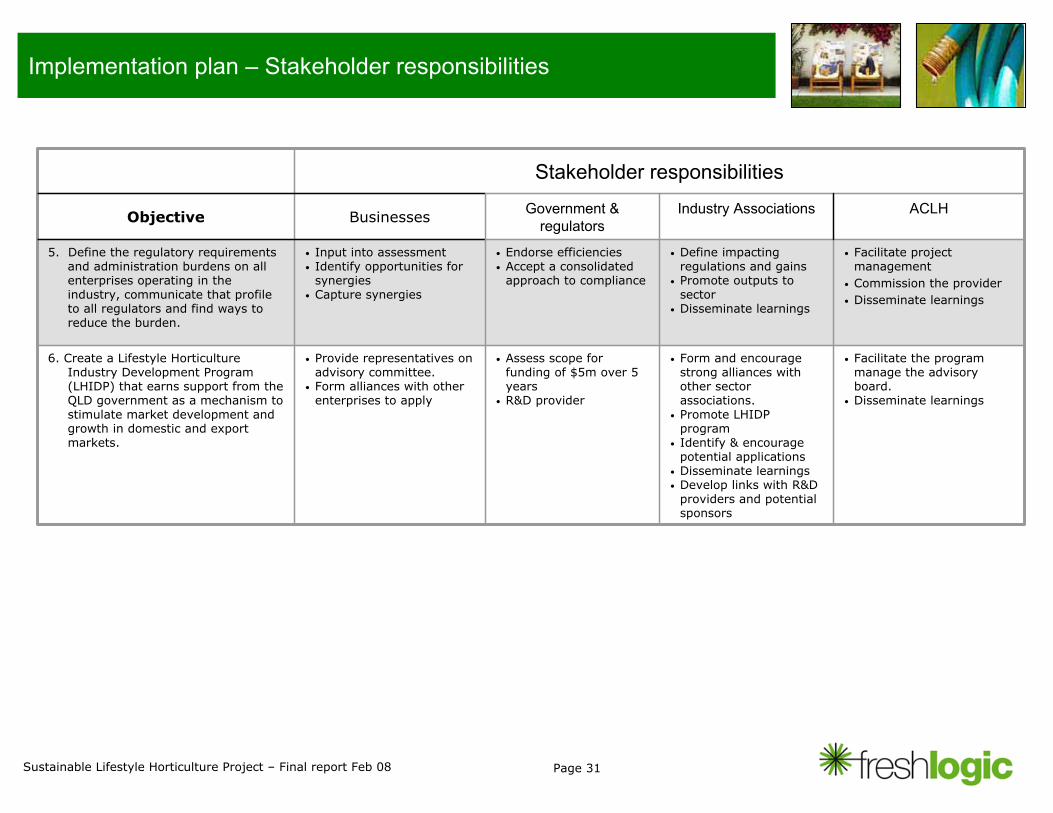
Implementation plan – Stakeholder responsibilities
• Form and encourage strong alliances with other sector associations.
• Promote LHIDP program
• Identify & encourage potential applications
• Disseminate learnings• Develop links with R&D
providers and potential sponsors
• Define impacting regulations and gains
• Promote outputs to sector
• Disseminate learnings
Industry Associations
Stakeholder responsibilities
ACLHGovernment & regulatorsBusinessesObjective
• Facilitate the program manage the advisory board.
• Disseminate learnings
• Assess scope for funding of $5m over 5 years
• R&D provider
• Provide representatives on advisory committee.
• Form alliances with other enterprises to apply
6. Create a Lifestyle Horticulture Industry Development Program (LHIDP) that earns support from the QLD government as a mechanism to stimulate market development and growth in domestic and export markets.
• Facilitate project management
• Commission the provider • Disseminate learnings
• Endorse efficiencies • Accept a consolidated
approach to compliance
• Input into assessment• Identify opportunities for
synergies• Capture synergies
5. Define the regulatory requirements and administration burdens on all enterprises operating in the industry, communicate that profile to all regulators and find ways to reduce the burden.
Page 32Sustainable Lifestyle Horticulture Project – Final report Feb 08
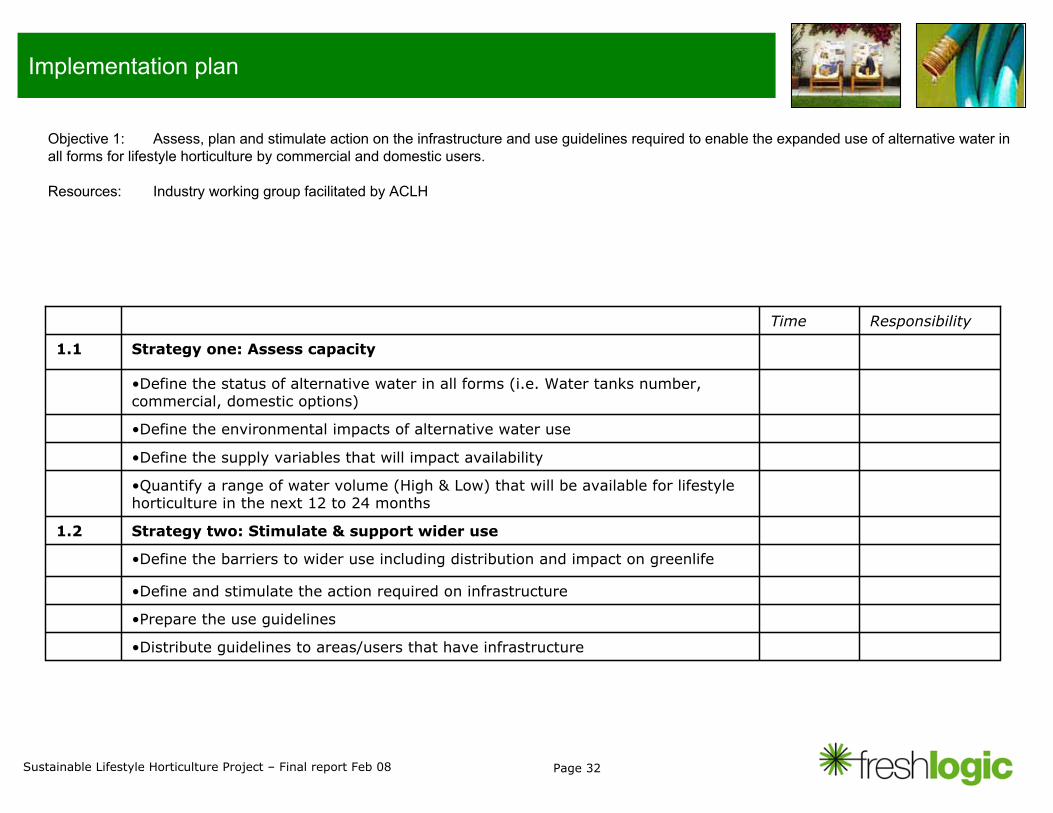
Implementation plan
•Define the status of alternative water in all forms (i.e. Water tanks number, commercial, domestic options)
Time
•Distribute guidelines to areas/users that have infrastructure
Strategy one: Assess capacity1.1
•Prepare the use guidelines
•Define and stimulate the action required on infrastructure
•Define the barriers to wider use including distribution and impact on greenlife
Strategy two: Stimulate & support wider use1.2
•Quantify a range of water volume (High & Low) that will be available for lifestyle horticulture in the next 12 to 24 months
•Define the supply variables that will impact availability
•Define the environmental impacts of alternative water use
Responsibility
Objective 1: Assess, plan and stimulate action on the infrastructure and use guidelines required to enable the expanded use of alternative water in all forms for lifestyle horticulture by commercial and domestic users.
Resources: Industry working group facilitated by ACLH
Page 33Sustainable Lifestyle Horticulture Project – Final report Feb 08
Implementation plan
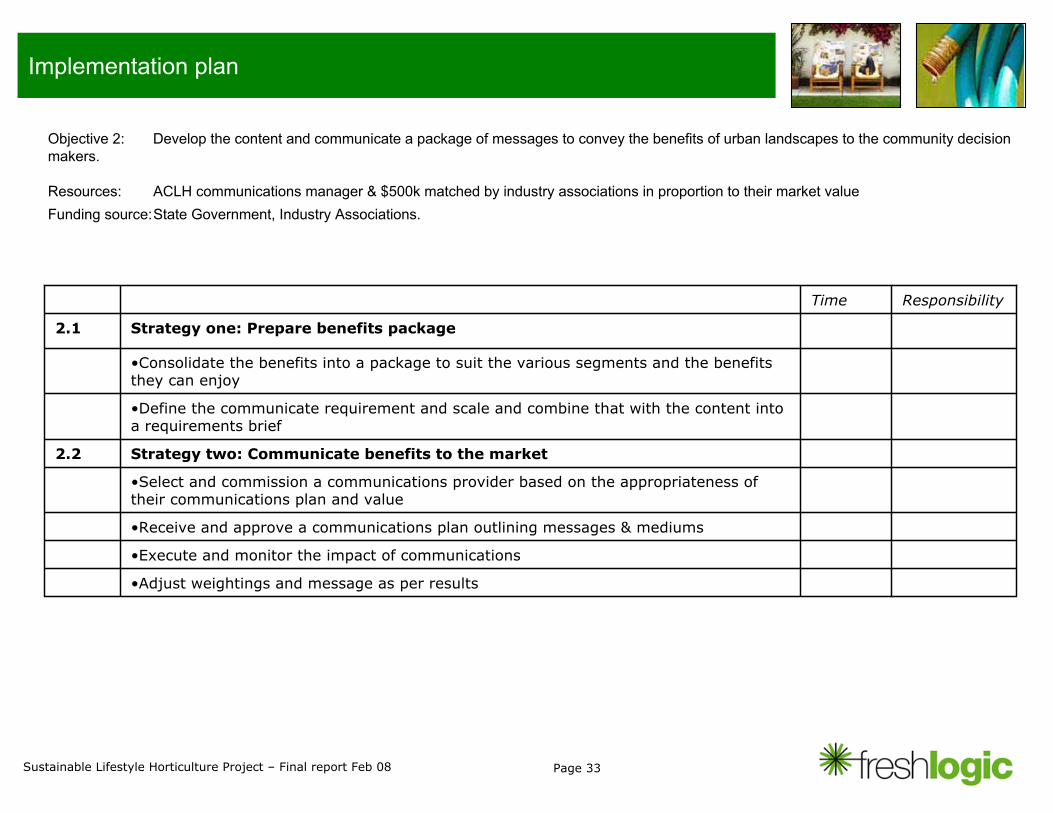
•Adjust weightings and message as per results
Strategy one: Prepare benefits package2.1
•Execute and monitor the impact of communications
•Receive and approve a communications plan outlining messages & mediums
•Select and commission a communications provider based on the appropriateness of their communications plan and value
Strategy two: Communicate benefits to the market2.2
•Define the communicate requirement and scale and combine that with the content into a requirements brief
•Consolidate the benefits into a package to suit the various segments and the benefits they can enjoy
ResponsibilityTime
Objective 2: Develop the content and communicate a package of messages to convey the benefits of urban landscapes to the community decision makers.
Resources: ACLH communications manager & $500k matched by industry associations in proportion to their market valueFunding source:State Government, Industry Associations.
Page 34Sustainable Lifestyle Horticulture Project – Final report Feb 08
Implementation plan
•Approach a selection of enterprises and consumers with these offers. Receive feedback and adjust the offers to maximise acceptance.
•Execute the go to market strategy
•Review the pending legislation on emissions and the current regulations around carbon credit accreditation. Ascertain the scope of carbon credit benefits that may be captured for the various types of lifestyle horticulture greenlife. Using a range that extend from full commercial carbon credit accreditation through to a basis for credits to a non accredited domestic situation.
•Develop the go to market strategy.
Strategy one: Assess scope3.1
Go to market3.3
•Define market size and value
•Combine with alliances partners to put a case to the regulators for accreditation.
Strategy two: Capture & communicate benefits3.2
•Identify potential alliances/partners that are external to the lifestyle horticulture industry that can benefit from lifestyle greenlife being acknowledged as an aid to sustainability.
•Identify ways that corporate enterprises and consumers can improve their contribution to sustainability by buying packages of lifestyle horticulture products and services. Consolidate this information to the top ten opportunities.
ResponsibilityTime
Objective 3: Determine and develop product and service solutions from lifestyle horticulture greenlife to support companies and consumers whowish to act on sustainability.
Resources: Industry working group facilitated by ACLH.
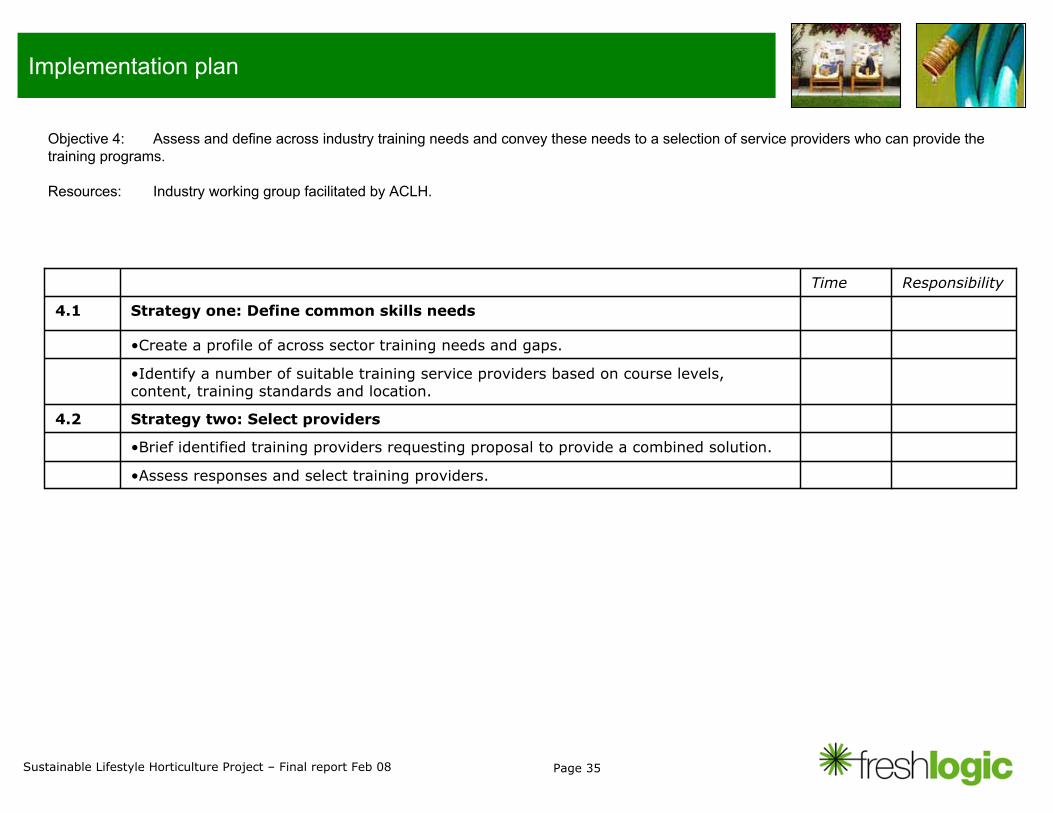
Page 35Sustainable Lifestyle Horticulture Project – Final report Feb 08
Implementation plan
•Identify a number of suitable training service providers based on course levels, content, training standards and location.
Strategy one: Define common skills needs4.1
•Assess responses and select training providers.
•Brief identified training providers requesting proposal to provide a combined solution.
Strategy two: Select providers4.2
•Create a profile of across sector training needs and gaps.
ResponsibilityTime
Objective 4: Assess and define across industry training needs and convey these needs to a selection of service providers who can provide the training programs.
Resources: Industry working group facilitated by ACLH.
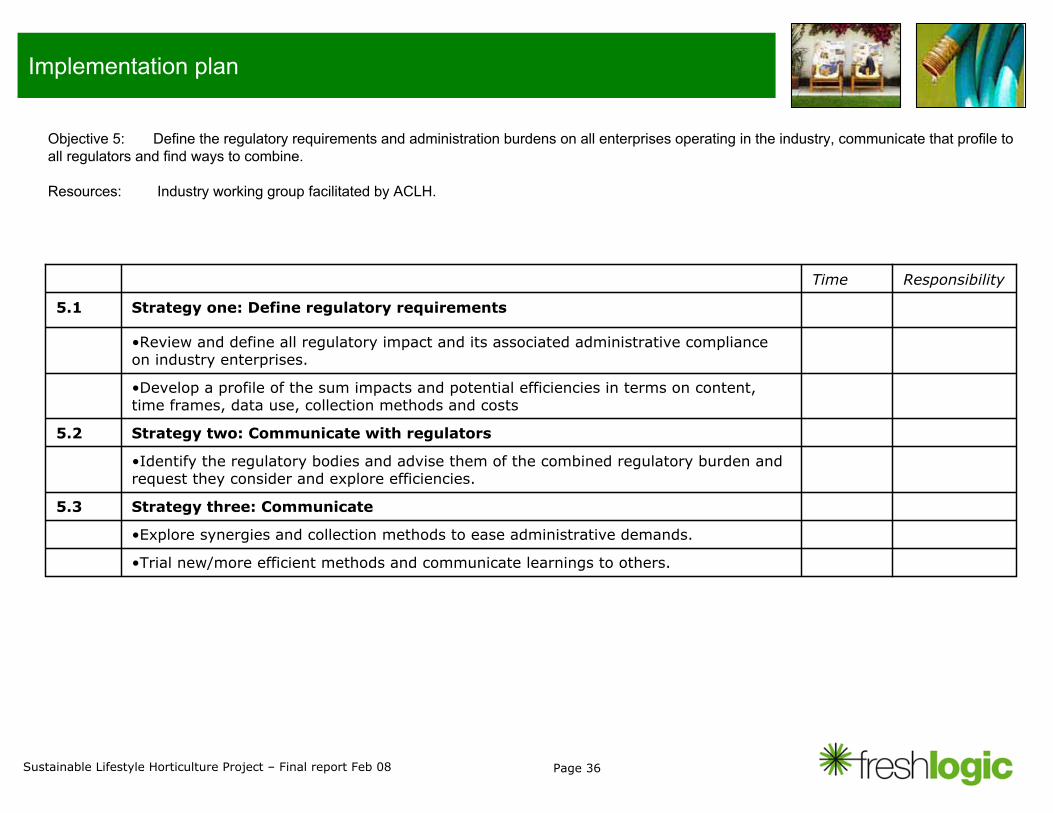
Page 36Sustainable Lifestyle Horticulture Project – Final report Feb 08
Implementation plan
•Trial new/more efficient methods and communicate learnings to others.
•Develop a profile of the sum impacts and potential efficiencies in terms on content, time frames, data use, collection methods and costs
•Explore synergies and collection methods to ease administrative demands.
Strategy one: Define regulatory requirements5.1
Strategy three: Communicate 5.3
•Identify the regulatory bodies and advise them of the combined regulatory burden and request they consider and explore efficiencies.
Strategy two: Communicate with regulators5.2
•Review and define all regulatory impact and its associated administrative compliance on industry enterprises.
ResponsibilityTime
Objective 5: Define the regulatory requirements and administration burdens on all enterprises operating in the industry, communicate that profile to all regulators and find ways to combine.
Resources: Industry working group facilitated by ACLH.
Page 37Sustainable Lifestyle Horticulture Project – Final report Feb 08
Implementation plan
•Determine program manager solution
•Advertise for application for first rounds
•Define and map out a program process including solution for managing.
•Select and commission advisory committee
Strategy one: Define proposed LHIDP process 6.1
Strategy three: Operation program (Subject to approval) 6.3
•Compile and communicate proposal to appropriate stakeholders for 3 yrs initial program life.
Strategy two: Request funding support 6.2
•Define and agree program principles based on;•Stimulating investment and generating growth•Matched funding circa $50 - $100k per project (target 10 per year) •Open to all parts of Qld, domestic regional and metro markets and export market•Applicants subject to providing learnings for communication to wider industry•Project selection criteria & assessment process based;
•Quantum of incremental value added•Collaborative activity & number of enterprises involved•Level of innovation and/or diversification
•Advisory committee of commercial industry stakeholders•Standard Conflict of Interest considerations•Manage program with ACLH resources and facilities
ResponsibilityTimeProgram funding request $5m over 5 years
Objective 6: Create a Lifestyle Horticulture Industry Development Program (LHIDP) that earns support from the QLD government as a mechanism to stimulate market development and growth in both domestic and export markets.
Resourced by: Funding of $5M over 5 years at $1M per yearFunding sources: Federal & State government
Page 38Sustainable Lifestyle Horticulture Project – Final report Feb 08
Supporting appendices Page
A - Market size & structure 39 B - Water 40-43C - Regulatory impact 44-45D - Skills 46-48E - Stakeholder roles & dynamics 49F - Urban landscape benefits 50-51G - Export opportunities 55H - Questionnaire 53-55
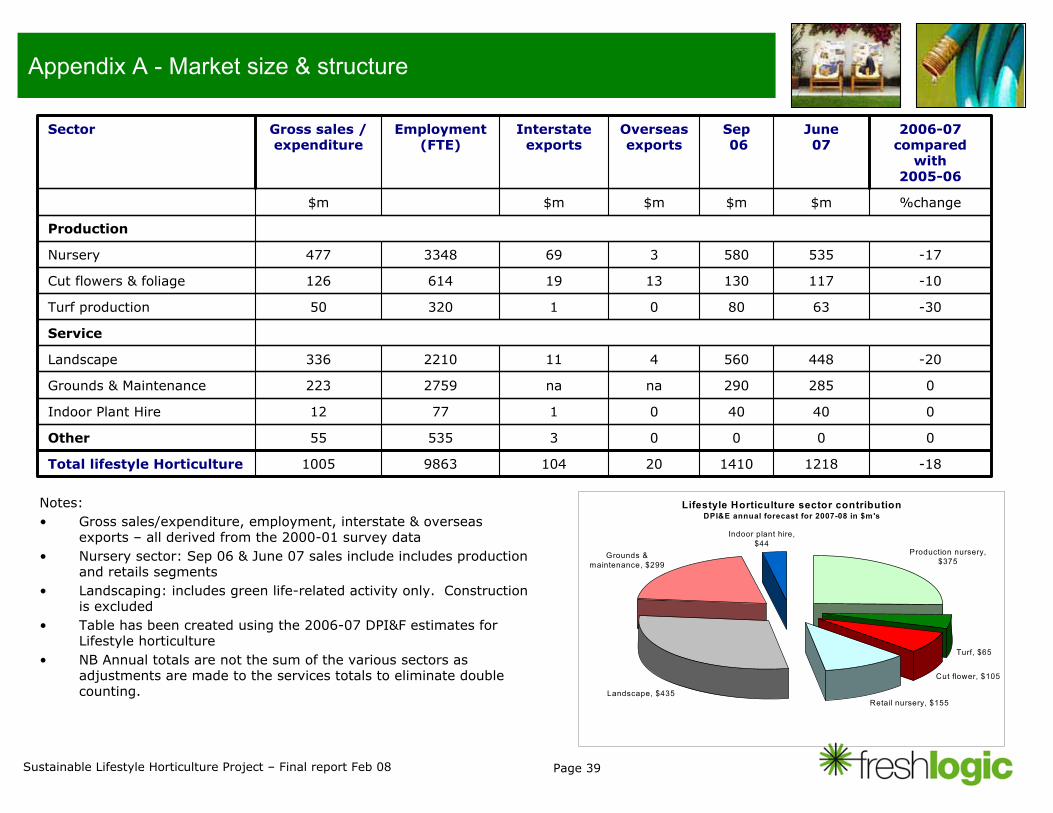
Page 39Sustainable Lifestyle Horticulture Project – Final report Feb 08
Appendix A - Market size & structure
Notes:• Gross sales/expenditure, employment, interstate & overseas
exports – all derived from the 2000-01 survey data• Nursery sector: Sep 06 & June 07 sales include includes production
and retails segments• Landscaping: includes green life-related activity only. Construction
is excluded• Table has been created using the 2006-07 DPI&F estimates for
Lifestyle horticulture • NB Annual totals are not the sum of the various sectors as
adjustments are made to the services totals to eliminate double counting.
-18121814102010498631005Total lifestyle Horticulture
0000353555Other
04040017712Indoor Plant Hire
0285290nana2759223Grounds & Maintenance
-204485604112210336Landscape
Service
-3063800132050Turf production
-101171301319614126Cut flowers & foliage
-175355803693348477Nursery
Production
%change$m$m$m$m$m
2006-07 compared
with 2005-06
June07
Sep06
Overseas exports
Interstate exports
Employment (FTE)
Gross sales / expenditure
Sector
Lifestyle Horticulture sector contribution DPI&E annual forecast for 2007-08 in $m's
Production nursery, $375
Turf, $65
Cut flower, $105
Retail nursery, $155Landscape, $435
Grounds & maintenance, $299
Indoor plant hire, $44
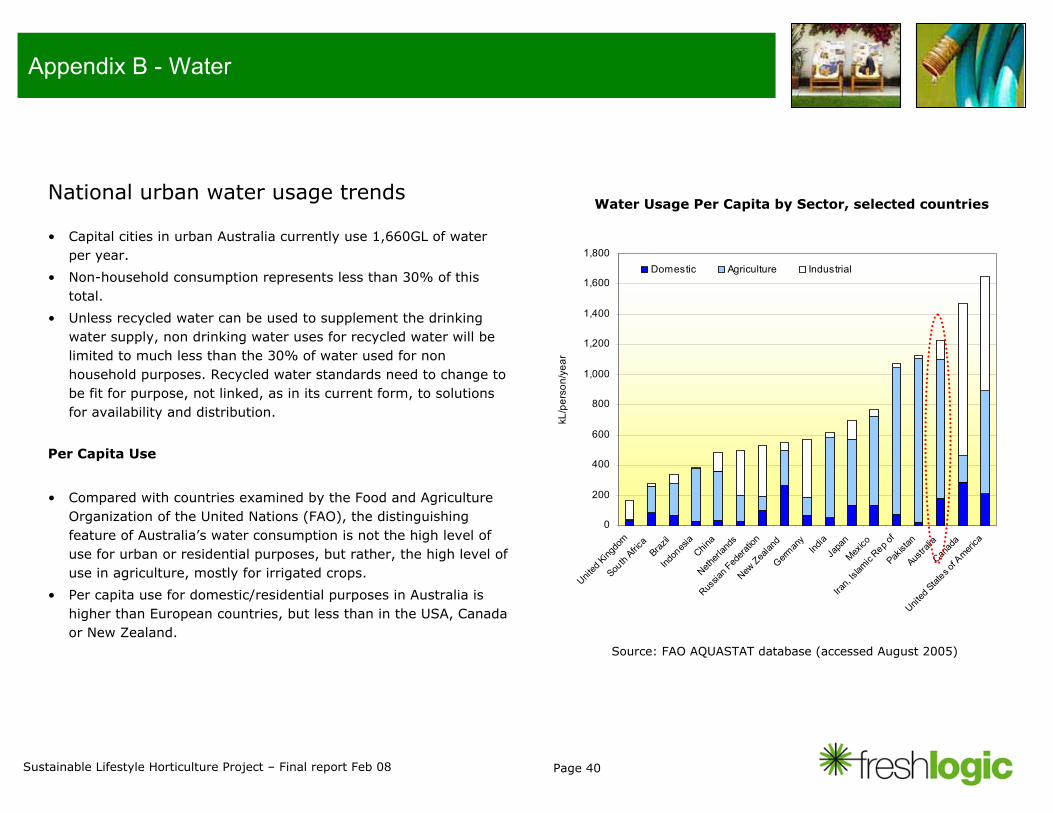
Page 40Sustainable Lifestyle Horticulture Project – Final report Feb 08
Appendix B - Water
National urban water usage trends
• Capital cities in urban Australia currently use 1,660GL of waterper year.
• Non-household consumption represents less than 30% of this total.
• Unless recycled water can be used to supplement the drinking water supply, non drinking water uses for recycled water will belimited to much less than the 30% of water used for non household purposes. Recycled water standards need to change to be fit for purpose, not linked, as in its current form, to solutions for availability and distribution.
Per Capita Use
• Compared with countries examined by the Food and Agriculture Organization of the United Nations (FAO), the distinguishing feature of Australia’s water consumption is not the high level of use for urban or residential purposes, but rather, the high level of use in agriculture, mostly for irrigated crops.
• Per capita use for domestic/residential purposes in Australia ishigher than European countries, but less than in the USA, Canadaor New Zealand.
Water Usage Per Capita by Sector, selected countries
0
200
400
600
800
1,000
1,200
1,400
1,600
1,800
United
Kingdo
m
South
Africa
Brazil
Indon
esia
China
Netherl
ands
Russia
n Fed
eratio
n
NewZea
land
German
yInd
iaJa
pan
Mexico
Iran,
Islam
icRep o
f
Pakist
an
Austra
lia
Canad
a
United
States o
f Ameri
ca
kL/p
erso
n/ye
ar
Domestic Agriculture Industrial
Source: FAO AQUASTAT database (accessed August 2005)
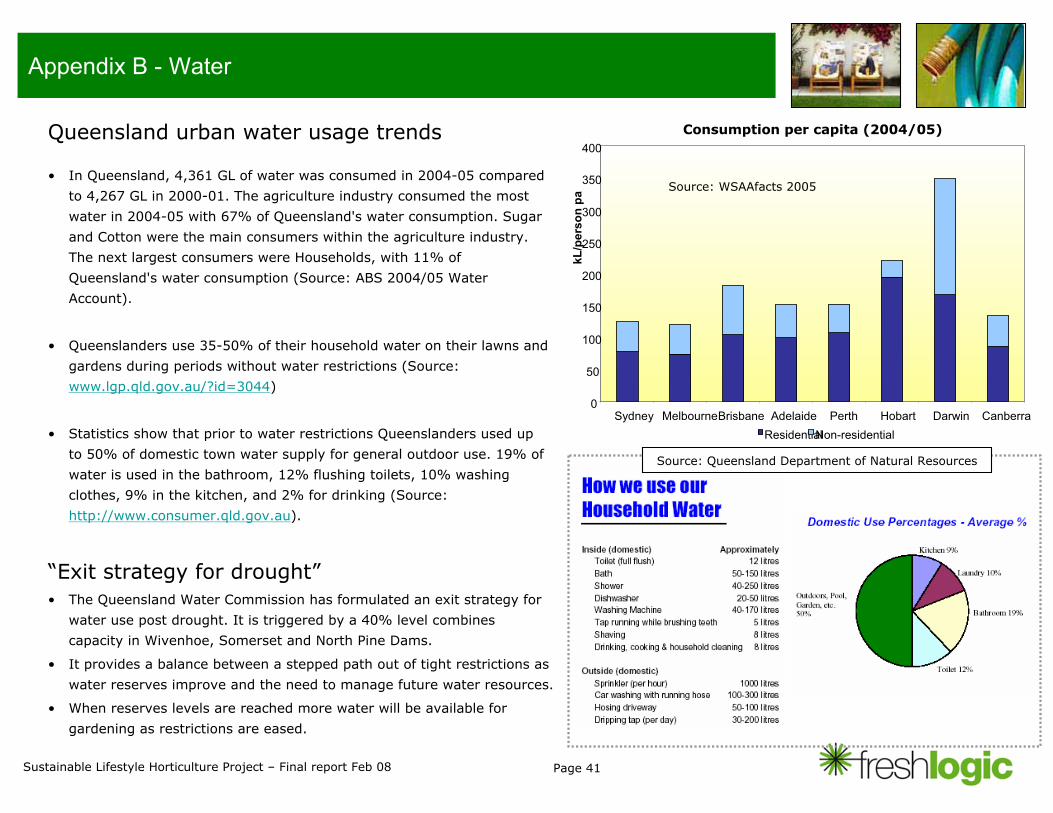
Page 41Sustainable Lifestyle Horticulture Project – Final report Feb 08
0
50
100
150
200
250
300
350
400
Sydney MelbourneBrisbane Adelaide Perth Hobart Darwin Canberra
kL/p
erso
n pa
Residential Non-residential
Appendix B - Water
Queensland urban water usage trends
• In Queensland, 4,361 GL of water was consumed in 2004-05 compared
to 4,267 GL in 2000-01. The agriculture industry consumed the most
water in 2004-05 with 67% of Queensland's water consumption. Sugar
and Cotton were the main consumers within the agriculture industry.
The next largest consumers were Households, with 11% of
Queensland's water consumption (Source: ABS 2004/05 Water
Account).
• Queenslanders use 35-50% of their household water on their lawns and
gardens during periods without water restrictions (Source:
www.lgp.qld.gov.au/?id=3044)
• Statistics show that prior to water restrictions Queenslanders used up
to 50% of domestic town water supply for general outdoor use. 19% of
water is used in the bathroom, 12% flushing toilets, 10% washing
clothes, 9% in the kitchen, and 2% for drinking (Source:
http://www.consumer.qld.gov.au).
“Exit strategy for drought”• The Queensland Water Commission has formulated an exit strategy for
water use post drought. It is triggered by a 40% level combines
capacity in Wivenhoe, Somerset and North Pine Dams.
• It provides a balance between a stepped path out of tight restrictions as
water reserves improve and the need to manage future water resources.
• When reserves levels are reached more water will be available for
gardening as restrictions are eased.
Consumption per capita (2004/05)
Source: WSAAfacts 2005
Source: Queensland Department of Natural Resources
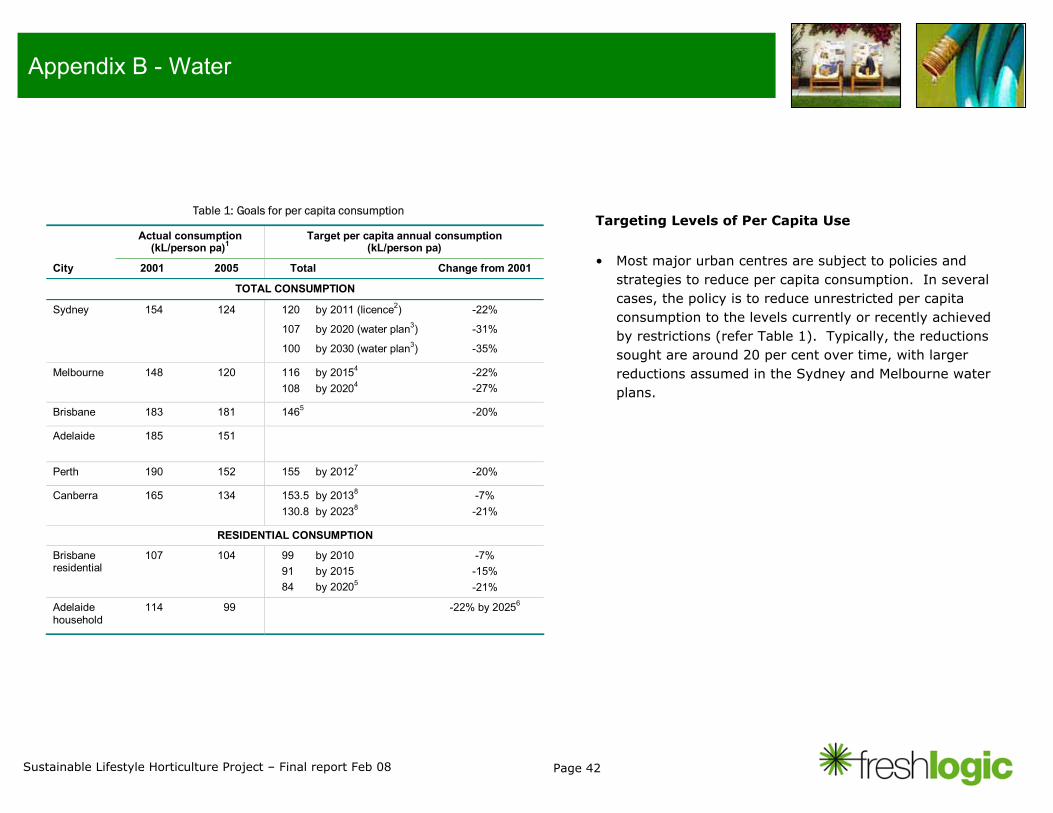
Page 42Sustainable Lifestyle Horticulture Project – Final report Feb 08
Appendix B - Water
Targeting Levels of Per Capita Use
• Most major urban centres are subject to policies and strategies to reduce per capita consumption. In several cases, the policy is to reduce unrestricted per capita consumption to the levels currently or recently achieved by restrictions (refer Table 1). Typically, the reductions sought are around 20 per cent over time, with larger reductions assumed in the Sydney and Melbourne water plans.
Table 1: Goals for per capita consumption
Actual consumption (kL/person pa)1
Target per capita annual consumption (kL/person pa)
City 2001 2005 Total Change from 2001
TOTAL CONSUMPTION
Sydney 154 124 120 by 2011 (licence2)
107 by 2020 (water plan3)
100 by 2030 (water plan3)
-22%
-31%
-35%
Melbourne 148 120 116 by 20154
108 by 20204-22% -27%
Brisbane 183 181 1465 -20%
Adelaide 185 151
Perth 190 152 155 by 20127 -20%
Canberra 165 134 153.5 by 20138
130.8 by 20238-7%-21%
RESIDENTIAL CONSUMPTION
Brisbane residential
107 104 99 by 2010 91 by 2015 84 by 20205
-7%-15% -21%
Adelaide household
114 99 -22% by 20256
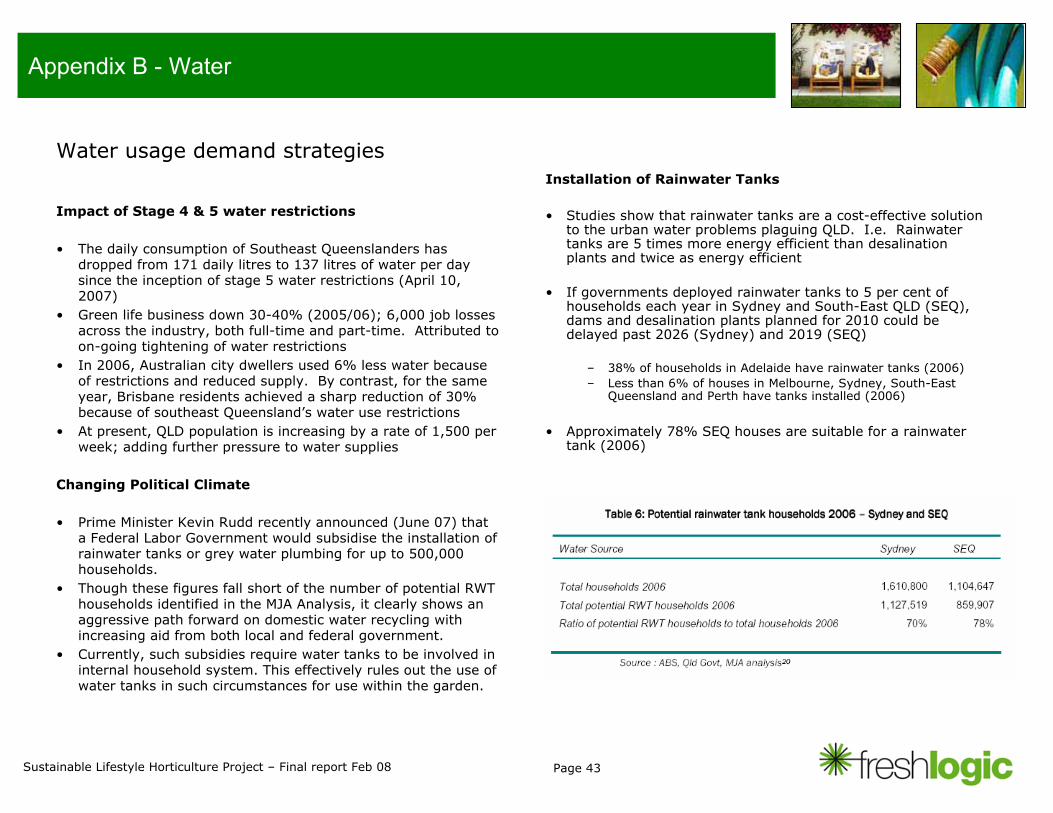
Page 43Sustainable Lifestyle Horticulture Project – Final report Feb 08
Appendix B - Water
Water usage demand strategies
Impact of Stage 4 & 5 water restrictions
• The daily consumption of Southeast Queenslanders has dropped from 171 daily litres to 137 litres of water per day since the inception of stage 5 water restrictions (April 10, 2007)
• Green life business down 30-40% (2005/06); 6,000 job losses across the industry, both full-time and part-time. Attributed to on-going tightening of water restrictions
• In 2006, Australian city dwellers used 6% less water because of restrictions and reduced supply. By contrast, for the same year, Brisbane residents achieved a sharp reduction of 30% because of southeast Queensland’s water use restrictions
• At present, QLD population is increasing by a rate of 1,500 per week; adding further pressure to water supplies
Changing Political Climate
• Prime Minister Kevin Rudd recently announced (June 07) that a Federal Labor Government would subsidise the installation of rainwater tanks or grey water plumbing for up to 500,000 households.
• Though these figures fall short of the number of potential RWT households identified in the MJA Analysis, it clearly shows an aggressive path forward on domestic water recycling with increasing aid from both local and federal government.
• Currently, such subsidies require water tanks to be involved in internal household system. This effectively rules out the use ofwater tanks in such circumstances for use within the garden.
Installation of Rainwater Tanks
• Studies show that rainwater tanks are a cost-effective solution to the urban water problems plaguing QLD. I.e. Rainwater tanks are 5 times more energy efficient than desalination plants and twice as energy efficient
• If governments deployed rainwater tanks to 5 per cent of households each year in Sydney and South-East QLD (SEQ), dams and desalination plants planned for 2010 could be delayed past 2026 (Sydney) and 2019 (SEQ)
– 38% of households in Adelaide have rainwater tanks (2006)– Less than 6% of houses in Melbourne, Sydney, South-East
Queensland and Perth have tanks installed (2006)
• Approximately 78% SEQ houses are suitable for a rainwater tank (2006)
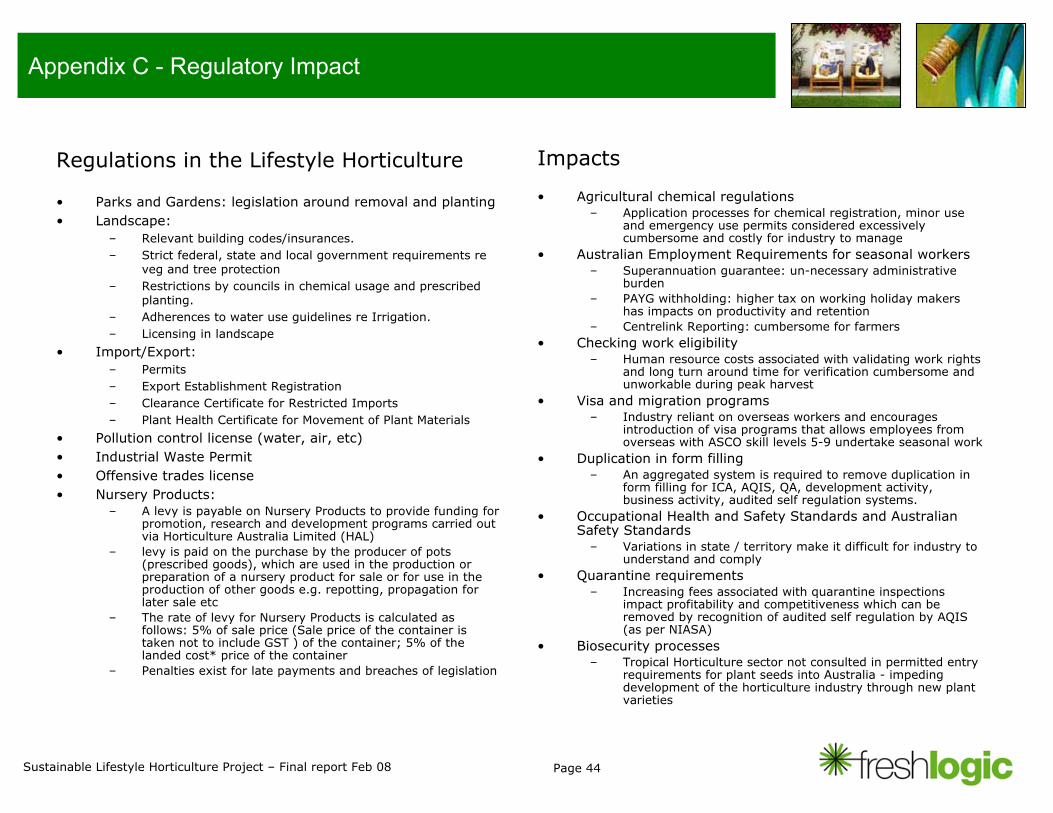
Page 44Sustainable Lifestyle Horticulture Project – Final report Feb 08
Appendix C - Regulatory Impact
Regulations in the Lifestyle Horticulture
• Parks and Gardens: legislation around removal and planting• Landscape:
– Relevant building codes/insurances. – Strict federal, state and local government requirements re
veg and tree protection– Restrictions by councils in chemical usage and prescribed
planting. – Adherences to water use guidelines re Irrigation. – Licensing in landscape
• Import/Export:– Permits– Export Establishment Registration– Clearance Certificate for Restricted Imports– Plant Health Certificate for Movement of Plant Materials
• Pollution control license (water, air, etc)• Industrial Waste Permit • Offensive trades license• Nursery Products:
– A levy is payable on Nursery Products to provide funding for promotion, research and development programs carried out via Horticulture Australia Limited (HAL)
– levy is paid on the purchase by the producer of pots (prescribed goods), which are used in the production or preparation of a nursery product for sale or for use in the production of other goods e.g. repotting, propagation for later sale etc
– The rate of levy for Nursery Products is calculated as follows: 5% of sale price (Sale price of the container is taken not to include GST ) of the container; 5% of the landed cost* price of the container
– Penalties exist for late payments and breaches of legislation
Impacts
• Agricultural chemical regulations– Application processes for chemical registration, minor use
and emergency use permits considered excessively cumbersome and costly for industry to manage
• Australian Employment Requirements for seasonal workers– Superannuation guarantee: un-necessary administrative
burden– PAYG withholding: higher tax on working holiday makers
has impacts on productivity and retention– Centrelink Reporting: cumbersome for farmers
• Checking work eligibility– Human resource costs associated with validating work rights
and long turn around time for verification cumbersome and unworkable during peak harvest
• Visa and migration programs– Industry reliant on overseas workers and encourages
introduction of visa programs that allows employees from overseas with ASCO skill levels 5-9 undertake seasonal work
• Duplication in form filling– An aggregated system is required to remove duplication in
form filling for ICA, AQIS, QA, development activity, business activity, audited self regulation systems.
• Occupational Health and Safety Standards and Australian Safety Standards
– Variations in state / territory make it difficult for industry to understand and comply
• Quarantine requirements– Increasing fees associated with quarantine inspections
impact profitability and competitiveness which can be removed by recognition of audited self regulation by AQIS (as per NIASA)
• Biosecurity processes– Tropical Horticulture sector not consulted in permitted entry
requirements for plant seeds into Australia - impeding development of the horticulture industry through new plant varieties
Page 45Sustainable Lifestyle Horticulture Project – Final report Feb 08
Appendix C - Regulatory Impact
Regulations specific to Cut Flower & Nursery
• Growing Plant Products– Growers in the cut flower and nursery industries identified plant breeder's rights,
planning and construction requirements for horticultural structures, water supply, inspections of imported plant materials and government labour on-costs as their key regulatory issues of concern
– The issues raised regarding plant breeder's rights, water supply and labour regulation relate to costs imposed on the industries. However, planning and construction issues focused on regulatory design, specifically, the application of a consistent and flexible approach by local government and building surveyors to the successful granting of permits for horticultural structures.
– Alleged lack of knowledge and appropriate expertise within AQIS was the key issue raised in relation to inspections of imported plant material
• Selling Plant Products– Inconvenience and high cost of DNRE inspections and permits required for interstate
movements
– High charges for AQIS export inspections and the alleged lack of knowledge and appropriate expertise within AQIS in relation to inspections of both exported and imported plant material
– Lack of coordination between AQIS and DNRE in conducting inspections at exporters’properties.
• Allied Industries– Off-label use of agvet chemicals: key agvet chemical issue facing the industries
was the off-label use of agvet chemicals for minor crops within the cut flower and nursery industries. Industry participants indicated to the Task Force that they often use agvet chemicals off-label because the current agvet chemical registration process means that some chemicals are often not registered for use on minor crops within the industries
– Cost of chemical registration
Page 46Sustainable Lifestyle Horticulture Project – Final report Feb 08
Appendix D – Skills
Labour, training, professional development and skill issues
• A number of labour, training, professional development and skillissues are reported to be an emerging challenge for the industry. This is despite the fact that a recent DPI&F report indicated that the three main production sectors of the lifestyle horticulture industry (production nurseries, turf grass growing and cut flower and foliage production) had the largest proportion of farmers with formal post-school qualifications.
• One of the main problems appears to be that school leavers are increasingly viewing horticulture as an unattractive career option due to relatively low award wage rates and the perceived lack of career paths when compared with other vocations. Some of these issues are partially an outcome of the large number of small firms in the industry.
• Some industry leaders also argue that the current vocational training system is not providing entry level employees with appropriate skill sets to meet the industry’s requirements. However, at this stage the extent of this problem is not clear.
• Further work is needed to more clearly specify the training, professional development and skills challenges facing the industry, and to develop a coordinated whole-of-industry strategy to address these issues in partnership with government, training providers and other stakeholders.
Industry Needs
• Industry requires training delivery to be flexible and to be assessable by workplace assessors in accordance with industry standards.
• Agriculture, forestry, fishing and horticulture industries support assessment by qualified industry assessors, using assessment tools based on national competency standards.
• Identified need for flexible delivery: just in time training, some use of on-line learning and assessment strategies, resources to support workplace delivery, audiovisual materials.
• Need for skills recognition processes by RTO’s suitable for primary industries.
• VET in schools programs in fishing, forestry, agriculture and horticulture.
• Trend to need more highly skilled workers to operate complex plant and equipment.
• Increasing recognition of need for Occupational Health and Safety training.
• Short courses/skills sets designed for nature of employment
• Cross primary industries skilling
• Up skilling of current employees
Page 47Sustainable Lifestyle Horticulture Project – Final report Feb 08
Appendix D – Skills
Training Trends & ImplicationsTrends
• More Australians are completing higher degrees or vocational education programs. Increasing numbers are participating in skilled agriculture or horticulture programs as apprentices or vocational training under the Australian Qualifications Framework.
• Education and training is seen as an increasingly important component of the lifestyle horticulture industry. A survey conducted in September 2000 by the Australian Institute of Horticulture incorporated (AIH) of the businesses it represented at that time showed that (outlier ignored) there was an average of 2.1 persons per enterprise qualified in horticulture at trade level or higher, 1.6 that were currently studying and 2.8 that wished to access training in the near future.
• Figures for traineeships and apprenticeships (mostly workplace-based) for lifestyle horticulture industries show large increases in commencements. In 1995–96, there were 241 commencements, which increased to 1328 in 2002.
• Commencements and completions are not directly comparable because a number of participants roll their training over to other courses. Completions of traineeships and apprenticeships in lifestyle horticulture have, however, also increased, from 31 in 1995–96 to 622 in 2002.
• In 1996, there were 6500 enrolments in Queensland for all horticulture courses provided through the vocational and educational training system (VET) system. This decreased to 6115 in 1999 and increased to 9043 in 2002.
• Figures for training in the VET system in Queensland show that in 2002 there were 975 students enrolled in courses related to parks and gardens, 574 in courses related to nursery, 728 in courses related to landscape, 111 in courses related to turf and 34 in courses related to floriculture.
• Australians in general are also becoming increasingly educated — the proportion of Australians with post-school qualifications increased from 41.7% to 48.2% between May 1992 and May 2002.
• Those holding a bachelor degree or higher increased from 9.6% of Australians over the age of 15 in May 1992 to 17.8% in May 2002. Between May 1992 and May 2002, the proportion of the Australian population over the age of 15 holding advanced diploma or below qualifications as the highest education level attained decreased slightly from 31.7% to 29.8%.
• The number of people in Australia doing workplace apprenticeships and training doubled from 128 600 in 1984–85 to 256 500 in 1998–99.
• Numbers participating in training that are from the occupation groups of horticulture, and skilled agriculture and horticulture, increased from 3200 in 1988 to 3700 in 1999.
• Total completions of training increased from 31 700 in 1995–96 to 60 200 in 1998–99.
• Although numbers in training for skilled agriculture and horticulture workers showed a 2.1% annual growth rate between 1995 and 1999, completions of training for skilled agriculture and horticulture workers declined from 700 in 1995–96 to 600 in 1998–99.
Impacts and Implications
• Increased numbers in training reflect the trend for the consumer to employ gardeners and for councils across the state to increase their parks and gardens maintenance staff in response to public demand for well-managed parklands.
• Participants in training are looking for workplace competencies hence many are not completing courses but are studying individual subjects either to upgrade their competencies or out of interest.
• Students are being more selective in choosing to study and train in areas of interest.
• Increased participation rates in training will improve the image of the industry to the general public.
Page 48Sustainable Lifestyle Horticulture Project – Final report Feb 08
Appendix D – Skills
Lifestyle Horticulture Training Statistics
• 41% Growth in Apprentice and Trainee Commencements for Qualifications in Amenity Horticulture (RTF) between 2004 and 2005
• 2005 Commencements contain 60% Certificate III level
• A National Skills Study Summary Report for the Nursery and Garden Industry Australia (2006) identified current priority training needs for the industry as a whole to be
– pests and diseases– employees’ effective working practices (managing own tasks
and priorities)– interacting with customers which includes selling skills– irrigation– occupational health and safety (OHS)
• The report further identified future priority training needs for the industry to cover
– water recycling– marketing and promotion– environmental work practices– business plans and budgets and– pests and diseases
• The nursery industry has a strong need for middle level supervisors/managers
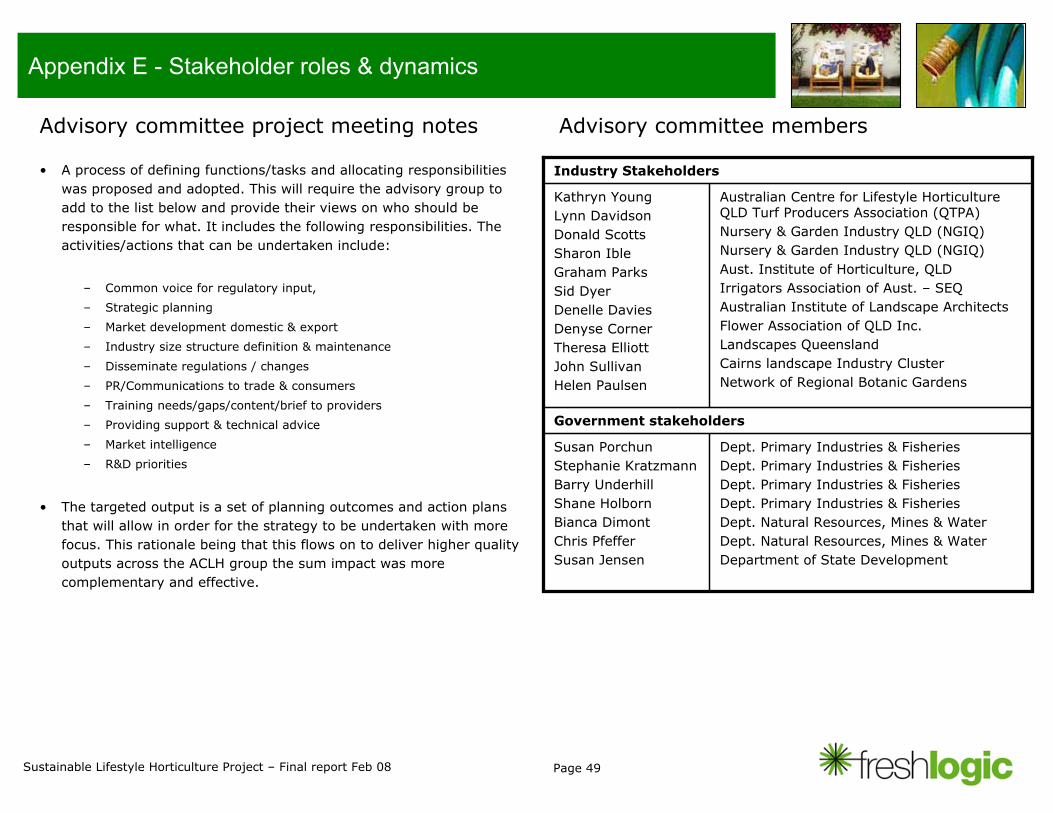
Page 49Sustainable Lifestyle Horticulture Project – Final report Feb 08
Appendix E - Stakeholder roles & dynamics
Advisory committee project meeting notes
• A process of defining functions/tasks and allocating responsibilities was proposed and adopted. This will require the advisory group to add to the list below and provide their views on who should be responsible for what. It includes the following responsibilities. The activities/actions that can be undertaken include:
– Common voice for regulatory input,
– Strategic planning
– Market development domestic & export
– Industry size structure definition & maintenance
– Disseminate regulations / changes
– PR/Communications to trade & consumers
– Training needs/gaps/content/brief to providers
– Providing support & technical advice
– Market intelligence
– R&D priorities
• The targeted output is a set of planning outcomes and action plans that will allow in order for the strategy to be undertaken with more focus. This rationale being that this flows on to deliver higher quality outputs across the ACLH group the sum impact was more complementary and effective.
Advisory committee members
Government stakeholders
Industry Stakeholders
Dept. Primary Industries & Fisheries Dept. Primary Industries & FisheriesDept. Primary Industries & Fisheries Dept. Primary Industries & Fisheries Dept. Natural Resources, Mines & Water Dept. Natural Resources, Mines & WaterDepartment of State Development
Susan PorchunStephanie Kratzmann Barry UnderhillShane HolbornBianca DimontChris PfefferSusan Jensen
Australian Centre for Lifestyle Horticulture QLD Turf Producers Association (QTPA)Nursery & Garden Industry QLD (NGIQ)Nursery & Garden Industry QLD (NGIQ)Aust. Institute of Horticulture, QLDIrrigators Association of Aust. – SEQ Australian Institute of Landscape ArchitectsFlower Association of QLD Inc.Landscapes Queensland Cairns landscape Industry Cluster Network of Regional Botanic Gardens
Kathryn Young Lynn Davidson Donald ScottsSharon Ible Graham ParksSid Dyer Denelle DaviesDenyse Corner Theresa ElliottJohn SullivanHelen Paulsen
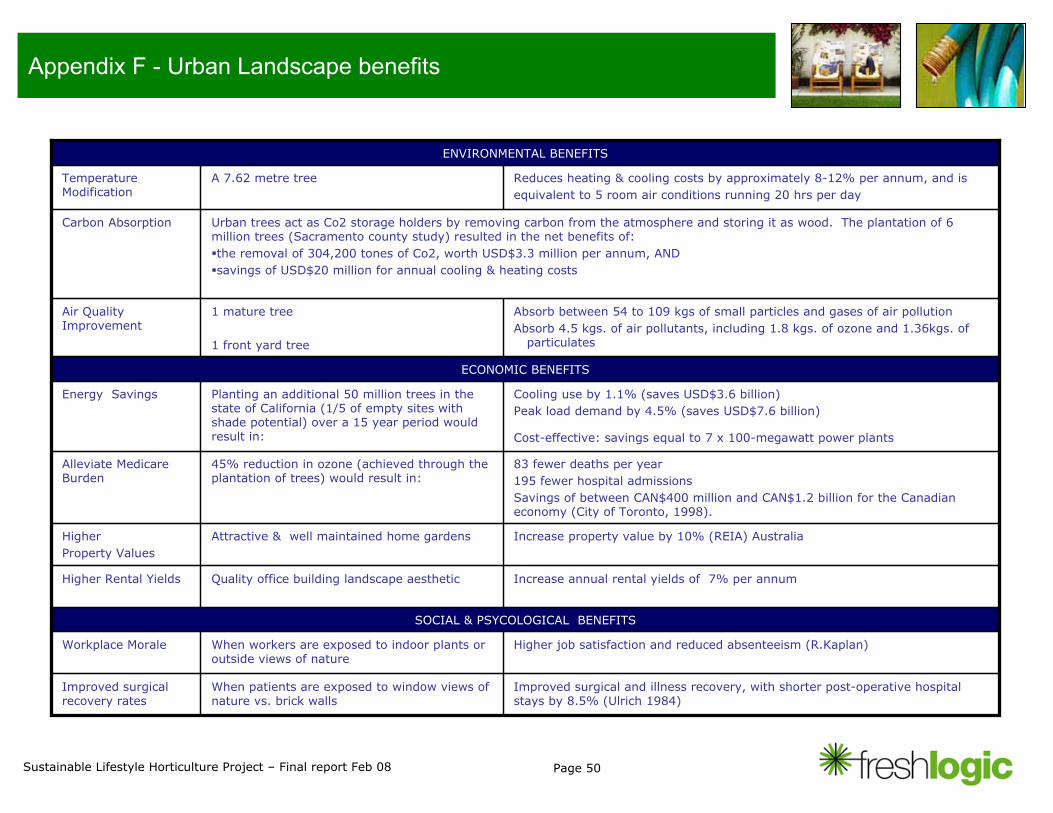
Page 50Sustainable Lifestyle Horticulture Project – Final report Feb 08
Appendix F - Urban Landscape benefits
83 fewer deaths per year195 fewer hospital admissions Savings of between CAN$400 million and CAN$1.2 billion for the Canadian economy (City of Toronto, 1998).
45% reduction in ozone (achieved through the plantation of trees) would result in:
Alleviate Medicare Burden
Cooling use by 1.1% (saves USD$3.6 billion)Peak load demand by 4.5% (saves USD$7.6 billion)
Cost-effective: savings equal to 7 x 100-megawatt power plants
Planting an additional 50 million trees in the state of California (1/5 of empty sites with shade potential) over a 15 year period would result in:
Energy Savings
Improved surgical and illness recovery, with shorter post-operative hospital stays by 8.5% (Ulrich 1984)
When patients are exposed to window views of nature vs. brick walls
Improved surgical recovery rates
Higher job satisfaction and reduced absenteeism (R.Kaplan)When workers are exposed to indoor plants or outside views of nature
Workplace Morale
SOCIAL & PSYCOLOGICAL BENEFITS
Increase annual rental yields of 7% per annumQuality office building landscape aestheticHigher Rental Yields
Increase property value by 10% (REIA) AustraliaAttractive & well maintained home gardensHigher Property Values
ECONOMIC BENEFITS
Absorb between 54 to 109 kgs of small particles and gases of air pollutionAbsorb 4.5 kgs. of air pollutants, including 1.8 kgs. of ozone and 1.36kgs. of
particulates
1 mature tree
1 front yard tree
Air Quality Improvement
Urban trees act as Co2 storage holders by removing carbon from the atmosphere and storing it as wood. The plantation of 6 million trees (Sacramento county study) resulted in the net benefits of:the removal of 304,200 tones of Co2, worth USD$3.3 million per annum, ANDsavings of USD$20 million for annual cooling & heating costs
Carbon Absorption
Reduces heating & cooling costs by approximately 8-12% per annum, and isequivalent to 5 room air conditions running 20 hrs per day
A 7.62 metre treeTemperature Modification
ENVIRONMENTAL BENEFITS
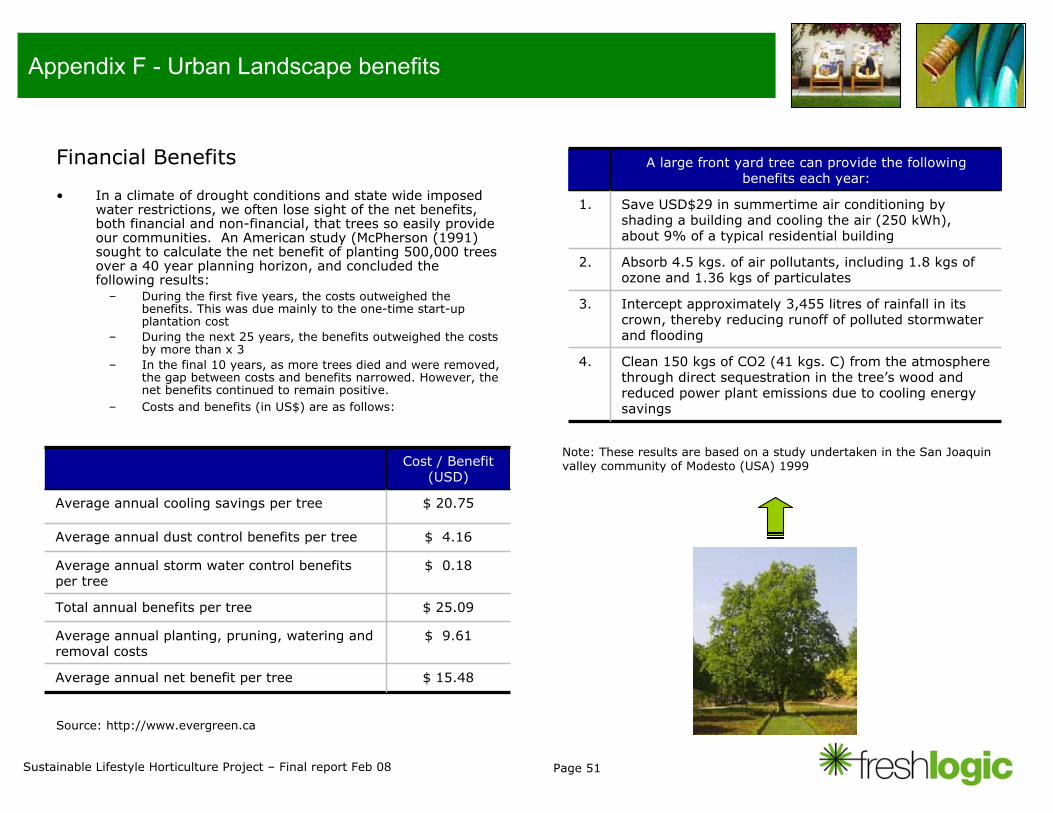
Page 51Sustainable Lifestyle Horticulture Project – Final report Feb 08
Appendix F - Urban Landscape benefits
Financial Benefits
• In a climate of drought conditions and state wide imposed water restrictions, we often lose sight of the net benefits, both financial and non-financial, that trees so easily provide our communities. An American study (McPherson (1991) sought to calculate the net benefit of planting 500,000 trees over a 40 year planning horizon, and concluded the following results:
– During the first five years, the costs outweighed the benefits. This was due mainly to the one-time start-up plantation cost
– During the next 25 years, the benefits outweighed the costs by more than x 3
– In the final 10 years, as more trees died and were removed, the gap between costs and benefits narrowed. However, the net benefits continued to remain positive.
– Costs and benefits (in US$) are as follows:
$ 15.48Average annual net benefit per tree
$ 9.61Average annual planting, pruning, watering and removal costs
$ 25.09Total annual benefits per tree
$ 0.18Average annual storm water control benefits per tree
$ 4.16Average annual dust control benefits per tree
$ 20.75 Average annual cooling savings per tree
Cost / Benefit (USD)
Source: http://www.evergreen.ca
Clean 150 kgs of CO2 (41 kgs. C) from the atmosphere through direct sequestration in the tree’s wood and reduced power plant emissions due to cooling energy savings
4.
Intercept approximately 3,455 litres of rainfall in its crown, thereby reducing runoff of polluted stormwater and flooding
3.
Absorb 4.5 kgs. of air pollutants, including 1.8 kgs of ozone and 1.36 kgs of particulates
2.
Save USD$29 in summertime air conditioning by shading a building and cooling the air (250 kWh), about 9% of a typical residential building
1.
A large front yard tree can provide the following benefits each year:
Note: These results are based on a study undertaken in the San Joaquin valley community of Modesto (USA) 1999
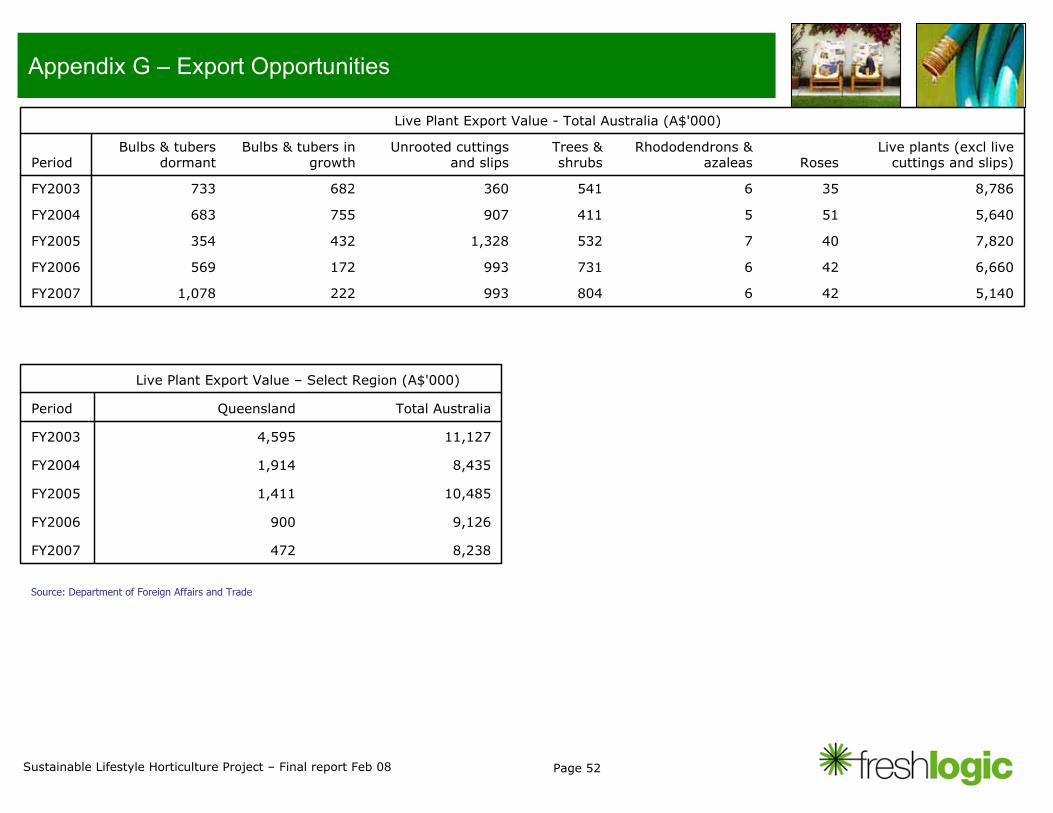
Page 52Sustainable Lifestyle Horticulture Project – Final report Feb 08
Appendix G – Export Opportunities
5,1404268049932221,078FY2007
6,660426731993172569FY2006
7,8204075321,328432354FY2005
5,640515411907755683FY2004
8,786356541360682733FY2003
Live plants (excl live cuttings and slips)Roses
Rhododendrons & azaleas
Trees & shrubs
Unrooted cuttings and slips
Bulbs & tubers in growth
Bulbs & tubers dormantPeriod
Live Plant Export Value - Total Australia (A$'000)
8,238472FY2007
9,126900FY2006
10,4851,411FY2005
8,4351,914FY2004
11,1274,595FY2003
Total AustraliaQueenslandPeriod
Live Plant Export Value – Select Region (A$'000)
Source: Department of Foreign Affairs and Trade
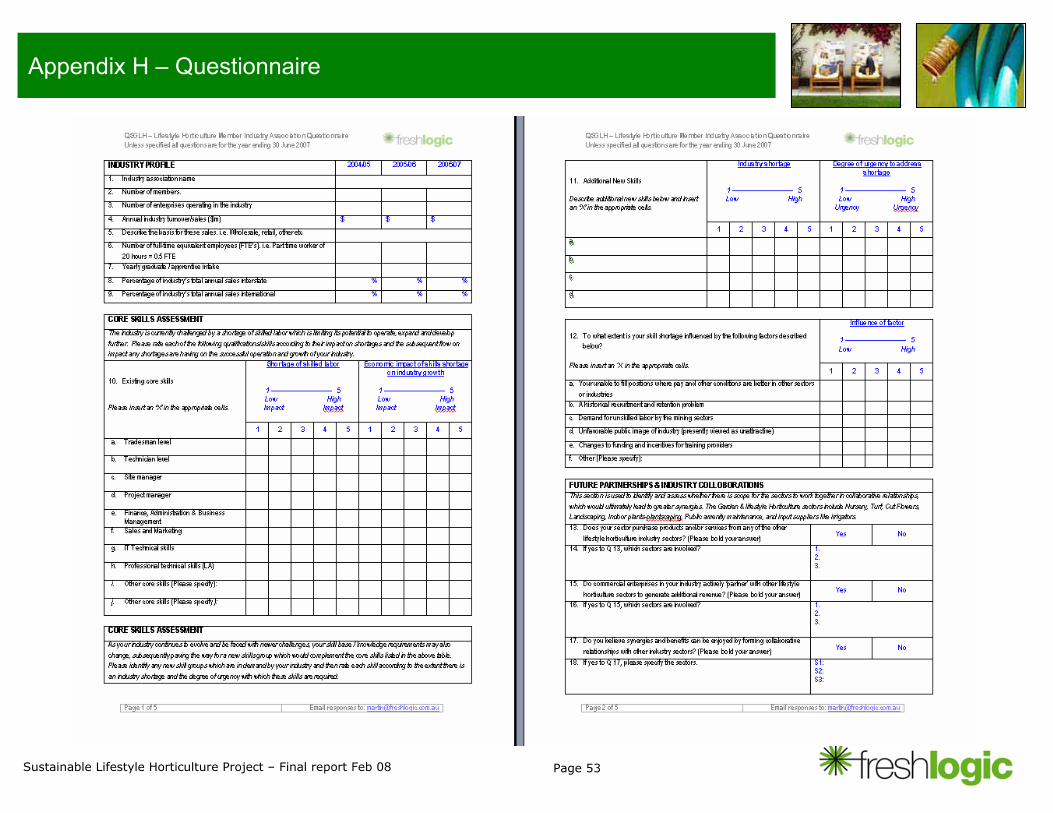
Page 53Sustainable Lifestyle Horticulture Project – Final report Feb 08
Appendix H – Questionnaire
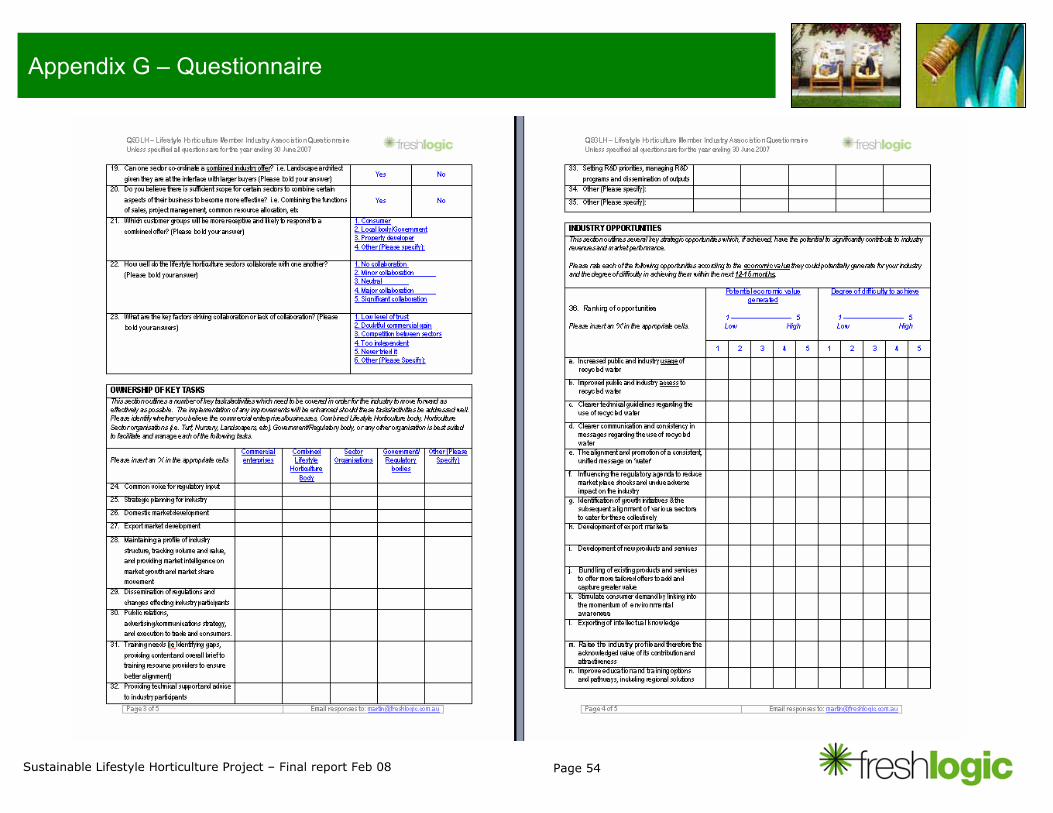
Page 54Sustainable Lifestyle Horticulture Project – Final report Feb 08
Appendix G – Questionnaire
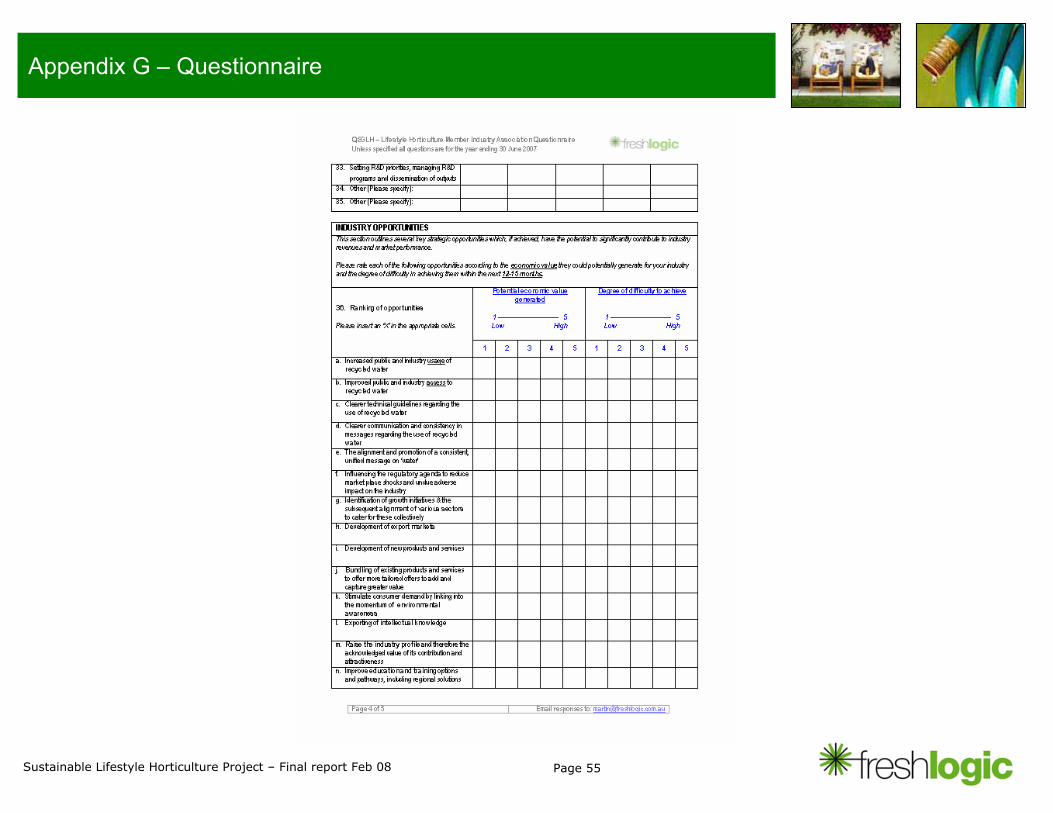
Page 55Sustainable Lifestyle Horticulture Project – Final report Feb 08
Appendix G – Questionnaire
Page 56Sustainable Lifestyle Horticulture Project – Final report Feb 08
ReferencesWater Resource References• ABS 2004/05 Water Account• Consumption per capita graph : WSAAfacts 2005• Food and Agriculture Organization of the United Nations (FAO) AQUASTAT database (accessed August 2005)• Household Water Usage Graph: Queensland Department of Natural Resources• Marsden Jacob Associates, “Securing Australia’s urban water supplies: opportunities and impediments”, November 2006, Federal Government
Discussion Paper• Marsden Jacob Associates, “The economics of rainwater tanks and alternative water supply options”, April 2007, A report prepared for Australian
Conservation Foundation, Nature Conservation Council (NSW) and Environment Victoria• Population Patterns Australia: ABS, 2005• QLD Household Water Usage: www.lgp.qld.gov.au/?id=3044• QLD Consumer Water Usage: http://www.consumer.qld.gov.au• Results from the WSAA releases urban water management position paper (WSAA 2005 release )
Urban Landscape Benefits• E. G McPherson1, J R. Simpson, P J. Peper, and Qingfu Xiao, BENEFIT-COST ANALYSIS OF MODESTO’S MUNICIPAL URBAN FOREST, Journal of
Arboriculture 25(5): September 1999• R.J. Laverne & K. Winson, Davey Resource Group, ‘Urban Globalization’, September 2003, J of Arb• Wolf, K., Does Money Really Grow on Trees? Economic Benefits of Urban Trees, University of Washington, Seattle• Wolf, K., Human Dimensions of the Urban Forest, Fact Sheet #1, Center for Urban Horticulture, University of Washington, Seattle, WA, Nov 1998.• Wolf, K., Human Dimensions of the Urban Forest, Fact Sheet #6, Center for Urban Horticulture, University of Washington, Seattle, WA, Nov 1998.• Wolf, K., Human Dimensions of Urban Ecology, University of Washington – Forest Resources• Wolf, K., Human Dimensions of the Urban Forest, Fact Sheet #29, Center for Urban Horticulture, University of Washington, Seattle, WA, Nov 1998.• Wolf, K., Psychological & Social Benefits of Urban Trees & Green Space, Review of Scientific Studies, University of Washington• Evergreen: http://www.evergreen.ca• Landscape & Commercial Building Rental Yields: Davey Resource Group, USA, 2003 • South Carolina Forestry Commission: http://www.state.sc.us/forest/urbben.htm• Sustainable Urban Landscape Information Series: http://www.sustland.umn.edu• Trees and Residential Property Values: 2001 USA valuation & benefits study• Urban Forest Research, Pacific Southwest Research Station, USDA Forest Services, Davies, California
The Rooftop Garden• 2005 Canada's Ryerson University study
Other• Hall, T., Where Have All the Gardens Gone? An Investigation into the Disappearance of Back Yards in the Newer Australian Suburb, Urban Research
Program Research Paper 13, Griffith University, Aug 2007.• Jury, A., Mayors' vision for capital works, The Australian Financial Review, Aug 2007.• Australian Centre for Lifestyle Horticulture, Draft Export Strategy, Strategic approach to export development, June 2007.
Page 57Sustainable Lifestyle Horticulture Project – Final report Feb 08
Glossary
Australian Quarantine and Inspection Service
AQIS
The margin earned by the seller of goodsthat is expressed as a percentage of thetotal selling price.
Gross margin percentage
Wholesale buyers and resellers of productsthat are grouped by their commoncharacteristics, like Retail Nurseries,Landscapers.
Distribution Channel
Industry development officerIDO
Live plants Greenlife
A Distribution Channel that provides acombination of bulk products and transportservices.
Garden Supplies
A distribution channel that includes thoseWho provide garden maintenance services,(Lawnmowing & Gardening contractors)
GardenMaintenance
Full time employeesFTE’s
Do it yourself gardenDIY Garden
A Discount Department store, which is aRetail distribution channel. ( IncludesKmart, Big W etc)
DDS
Seedlings and bloomersBedding Plants
All non-greenlife garden products. IE Fertiliser, Potting mix & Chemicals
Allied Garden Products
A distribution channel group that includesLandscapers, Local & Municipal Authorities,Sports Grounds, Revegetation & Plant Hire.
Amenity
Australian Centre for Lifestyle HorticultureACLH
Lifestyle Horticulture Industry development program
LHIDP
Lifestyle HorticultureLH
Producers of plants who sell their product to other distributors like retailers and landscapers.
Wholesale Greenlife Producers
A Distribution Channel that is predominantly servicing trade customers but also sells some product “direct” to consumers.
Wholesale Direct
A product category group that includes bulk products, construction and services.
Services & Bulk
A business that retails home gardenproducts to the consumers. Also known as Garden Centres.
Retail Nursery
Those who on sell a product in the form itwas purchased, as opposed to using it in a production process.
Resellers
Producers of greenlife material that selltheir product to others for use as aproduction input. (IE Timber Plantations, Fruit Trees)
Propagators
Products that are grouped by theircommon characteristics.
Product Category
A Distribution Channel that is typicallyselling fresh food & craft and operatesfrom temporary or part time retaillocations.
Markets
A business which supply plants and orprovides installation & constructionservices for building gardens withgreenlife, irrigation systems and or hardgarden elements.
Landscapers


