
wwwthinkSRScom
Stanford Research Systems (408)744-9040
QCM100- Quartz Crystal Microbalance Theory and Calibration This chapter provides a brief introduction to the measurement techniques and calibration procedures available to QCM100 users and describes the most popular theoretical models used to interpret results
Background Sauerbrey1 was the first to recognize the potential usefulness of the Quartz Crystal Microbalance (QCM) technology and demonstrate the extremely sensitive nature of these piezoelectric devices towards mass changes at the surface of QCM electrodes The results of his work are embodied in the Sauerbrey equation which relates the mass change per unit area at the QCM electrode surface to the observed change in oscillation frequency of the crystal
∆f = - Cf ∆m (equation 1) where ∆f - the observed frequency change in Hz ∆m - the change in mass per unit area in gcm2 and Cf - the sensitivity factor for the crystal used (ie 566 Hz microg-1 cm2 for a
5MHz AT-cut quartz crystal at room temperature)
The Sauerbrey equation relies on a linear sensitivity factor Cf which is a fundamental property of the QCM crystal Thus in theory the QCM mass sensor does not require calibration However it must be kept in mind that the Sauerbrey equation is only strictly applicable to uniform rigid thin-film deposits 2 Vacuum and gas phase thin-film depositions which fail to fulfill any of these conditions actually exhibit more complicated frequency-mass correlations and often require some calibration to yield accurate results For many years QCMs were just regarded as gas-phase mass detectors however more recently their application has been extended since scientists realized that they can be operated in contact with liquids and viscoelastic deposits In this case both frequency and series resonance resistance of the quartz oscillator are important to completely characterize the material in contact with the crystal electrode The development of QCM Systems for use in fluids opened a new world of applications including electrochemistry and micro-rheology More recent developments have focused on tailoring electrode surface
wwwthinkSRScom
Stanford Research Systems (408)744-9040
chemistry (ie specialized polymer coatings) so that these devices can be applied as discriminating mass detectors for (1) specific gas detection (2) environmental monitoring (3) biosensing and (3) basic surface-molecule interaction studies The purpose of this chapter is to provide a brief introduction to the different measurement and calibration techniques available to QCM100 users and to briefly describe the most popular theoretical models used to interpret the results A complete coverage of these subjects is obviously beyond the scope of this note However many articles have been published on the operation and calibration of QCMs in applications ranging from vacuum thin-film deposition to electrochemical experiments and QCM users are referred to the publications list at the end of this chapter for more detailed information
The QCM oscillator The Butterworth van Dyke (BVD) electrical model3 for a quartz crystal resonator is shown in Figure 1 This model is often used to represent the electrical behavior of a crystal resonator near series resonance The model has also been useful in predicting the frequency shifts and losses of an AT-cut quartz crystal in QCM applications
Figure 1 Butterworth-van Dyke model of Quartz Crystal Resonator The BVD electrical model consists of two arms The motional arm has three series components modified by the mass and viscous loading of the crystal (1) Rm (resistor) corresponds to the dissipation of the oscillation energy from mounting structures and from the medium in contact with the crystal (ie losses induced by a viscous solution) (2) Cm (capacitor) corresponds to the stored energy in the oscillation and is related to the elasticity of the quartz and the surrounding medium and (3) Lm (inductor) corresponds to the inertial component of the oscillation which is related to the mass displaced during the vibration Typical values of these parameters for a 1rdquo diameter 5MHz crystal used in the QCM100 system are Cm=33fF Lm=30mH and Rm=10Ω (for a dry crystal)
RmCm Lm
C0
wwwthinkSRScom
Stanford Research Systems (408)744-9040
Rm=400Ω (for a crystal with one face in water) or Rm=3500Ω (for a crystal with one face in 88 glycerol) The motional arm is shunted by the parasitic capacitance Co which represents the sum of the static capacitances of the crystalrsquos electrodes holder and connector capacitance In the QCM100 system4 Co is about 20pF a value which has been kept small by placing the electronics directly on the crystal holder thereby eliminating any cable capacitance In a QCM application the motional inductance Lm is increased when mass is added to the crystal electrode - the frequency shift of the series resonance is a sensitive indicator of the added mass and films of less than 1ngcm2 can be easily resolved by the QCM The motional resistance Rm can also provide important information about a process since soft films and viscous liquids will increase motional losses and so increase the value of Rm
Figure 2 Oscillator Circuit consisting of AGC Amplifier Quartz
Resonator and Load Resistor Placing the crystal in an oscillator circuit provides a simple way to measure its motional parameters5 Figure 2 shows the BVD crystal model driven by an automatic gain control amplifier (AGC) and terminated into a load resistor RL By returning the voltage on RL to the input of the AGC amplifier the circuit will oscillate at a frequency for which the phase shift around the loop is 0deg (or an integral multiple of 360deg) provided there is sufficient gain (The Barkhausen condition) Absent Co it is easy to see that the phase condition is satisfied at the series resonance of Cm and Lm (ie fSR = [ 1 [2 Π (Lm Cm)12 ]) At series resonance the reactance of Cm and Lm cancel leaving only Rm In this case an amplifier gain of Av= (Rm + RL) RL will provide a loop gain of 1 to sustain oscillation Unfortunately Co cannot be ignored in QCM applications In the circuit shown in Figure 2 Co injects a leading current into RL which must be canceled by a
Rm Cm Lm
C0
RL
AGC Amp
wwwthinkSRScom
Stanford Research Systems (408)744-9040
lagging current via the motional arm in order to achieve the zero phase condition This requires the circuit run above series resonance where the net reactance of Cm and Lm is inductive In fact if Rm is large enough it is possible that the motional arm will not be able to contribute enough lagging current to cancel the leading current via Co and the circuit will not oscillate at all
Figure 3 Oscillator Circuit with Varactor Nulling of C0 A method to cancel Co is shown in Figure 3 In this circuit the AGC amplifier drives a transformer with two secondary windings One secondary drives the crystal and load as before while the other secondary inverts the voltage The inverted voltage source injects a current via an adjustable capacitor Cv to cancel the current injected via Co Exact cancellation is achieved when the adjustable capacitor is made equal to Co In the SRS QCM25 Crystal Controller Cv is a varactor which is made equal to Co by finding the bias setting which minimizes the gain required to sustain oscillation
Figure 4 Oscillator Circuit Model with C0 cancelled by Cv
With Co canceled the circuit simplifies to that shown in Figure 4 For this circuit the zero phase condition is achieved at series resonance where the reactance of Cm and Lm cancel At series resonance Rm and RL form a resistive
Rm Cm Lm
C0
RL
AGC Amp
Cv
Rm Cm Lm
RL
AGC Amp
ZLm + ZCm = 0
wwwthinkSRScom
Stanford Research Systems (408)744-9040
attenuator requiring an AGC gain of Av = (Rm + RL) RL to sustain oscillation By knowing the AGC gain6 Av required to sustain oscillation we can determine Rm = RL
( Av - 1)
Capacitance Cancellation The QCM100 System incorporates a method of nulling Co capacitance insuring that the frequency and resistance values measured correspond to the true series resonant parameters of the quartz oscillator The front panel of the QCM100 Analog Controller includes (1) a ten-turn DIAL to control the bias voltage required by the varactor (Cv) and (2) a switch to set the controller into the Adjust Mode for nulling Co There are two ways to operate the QCM100 Analog Controller to null Co and so oscillate at series resonance
1 The unit-to-unit variations in Co are small enough and the reproducibly of Cv is good enough ( plusmn2pF) that most users can just set the varactor bias to a fixed value and forget about the whole issue Set the ten-turn dial to 50 which will provide 60 volts of reverse bias to the varactor making Cv about 18pF This method is recommended for ldquodryrdquo applications where Rm is low and is not recommended for ldquostickyrdquo applications (such as solutions of glycerol) where Rm can be very high
2 Null Co with the conductance lock-in peak detection circuit In the Adjust Mode the unit will modulate the varactor bias with a 75Hz sine wave and indicate if the Co compensation is High Low or Nulled Start with ten-turn dial set to 50 (the LED should indicate that the crystal is oscillating) and switch to Adjust Mode Reduce the setting on the dial if the High LED is ldquoonrdquo increase the setting if the Low LED is ldquoonrdquo and lock the dial at the middle of range of values for which both Null LEDs glow with equal intensity Return the switch to the HOLD Mode setting when done
As a general rule diams Capacitance cancellation is essential for accurate measurements of liquids
and lossy (ie soft) films diams Capacitance cancellation should be checked and readjusted everytime the
environment of the crystal is changed For example when transitioning from air to a liquid phase
diams The cancellation adjustment must be performed with the crystal holder and crystal in the actual measurement environment
Frequency Measurement
wwwthinkSRScom
Stanford Research Systems (408)744-9040
The QCM100 provides a Frequency output port (BNC) Virtually any commercially available frequency counter can measure the frequency of the 24Vpp square wave in 50Ω provided by the QCM100 Frequency Output Counters are relatively simple to set-up and read via their computer interfaces Frequency Counter Selection Criteria The selection criteria for a frequency counter for QCM application include resolution speed time-base stability computer interfaces and software drivers Careful selection is required otherwise the frequency counter may degrade the quality of mass measurements The table below lists the typical characteristics of the frequency signal from the QCM100 controller for a crystal in water
Item Description Typical Value
1 Frequency 5 plusmn001 MHz 2 Waveform (into 50Ω) 24V square wave 3 Stability (second to second) 0002 Hz 4 Stability (minute to minute) 010 Hz 5 Temperature coefficient 8 Hz ordmC 6 Frequencymass coefficient 0057 Hz (ngcm2)
Many of the frequency counterrsquos characteristics are determined by its time-base if the time-base changes frequency by 10ppm the reported values will also change by 10ppm While the accuracy of the counterrsquos time-base is not particularly important the stability of the time-base is critically important as variations in the time-base will be indistinguishable from changes in accumulated mass on the surface of the crystal Often manufacturers will specify accuracy and aging but do not specify short-term stability In virtually all counters the short-term stability will improve if they are allowed to warm-up for an extended period of time To avoid degrading frequency measurements the time-base should have a 1 second stability of better than 002Hz 5MHz or 14middot10-10 The speedresolution of a counter is also important the accumulated mass can change rapidly in a typical QCM measurement and it is desirable to make frequency measurements with a resolution of 110-10 in a one second interval so as not to significantly degrade the mass resolution of or add noise to the measurement Simply counting cycles of the frequency output over a one second interval can not provide resolution better than 1 5middot106 and so a more elaborate
wwwthinkSRScom
Stanford Research Systems (408)744-9040
ldquocounterrdquo architecture is required A ldquoreciprocal-interpolatingrdquo counter can provide a much better frequency resolution than plusmn1 cycle per gate interval Virtually all frequency counters can measure the frequency of the 24Vpp square wave in 50Ω provided by the QCM100 Frequency Output Counters are available with either RS-232 or IEEE-488 (or both) to facilitate interfacing the counter to a computer for data acquisition The speed of the interface is not very critical as typically only one reading is taken each second Counters are relatively simple to set-up and read via their computer interfaces Software drivers for National Instruments Lab View products or other data acquisition programs are often available Frequency counters used at SRS for QCM measurements are listed below Manufacturer Model DigitsSecond Base Price
(102002) Stanford Research Systems
SR620 10 $4950
Agilent 53131 10 $1862 Agilent 53132 12 $2888 Errors in the measurement of frequency The QCM25 Crystal Controller will oscillate at the frequency such that the phase shift around the entire loop is 360ordm Important sources of phase shift within the network include
1 180ordm from the inverting amplifier A1 2 180ordm + [37microordm Hz deviation from 5MHz] from the low pass filter 3 0ordm + [020ordmpF (Rm = 40Ω) or 081ordmpF (Rm =375Ω)] from uncompensated
Co 4 0ordm + [020ordmHz (Rm =40Ω) or 004ordmHz( Rm =375Ω) deviation from series
resonance] from the crystal in the Rs Rm RL network
If an extraneous phase shift (2 or 3) is present the oscillator will operate away from series resonance allowing the crystal network (4 above) to cancel the extraneous phase shift The small value of the extraneous phase shifts together with the large dφdf of the crystal network keeps these frequency errors small The QCM25 Crystal Controller is intended to operate only with 5MHz crystals Typical accuracy of the crystal frequency is 100ppm or 500Hz The low pass filter will add an additional phase shift of 37microordm Hz deviation x 500Hz = 00185ordm when operated 500Hz from 5MHz which will cause a dry crystal to run 00185ordm 020ordmHz = 0092Hz off series resonance or a wet crystal to run 00185ordm
wwwthinkSRScom
Stanford Research Systems (408)744-9040
004ordmHz = 0462Hz off series resonance Since the dφdf of the low pass filter is 1000x smaller than the dφdf of a wet crystal the low pass filter does not contribute a significant error to the measurement of the series resonant frequency By modulating the varactor capacitance which nulls Co and using synchronous detection to locate the minimum gain operating point the QCM100 allows the user to reproducibly null Co to plusmn001pF The corresponding phase error for a wet crystal is plusmn001pF times 081ordmpF = plusmn 00081ordm which gives rise to a frequency reproducibility of plusmn 00081ordm 004ordmHz = plusmn020Hz for a wet crystal This error is virtually insignificant In water the dominate source of frequency drift comes from the temperature dependence of the viscosity of the liquid The series resonant frequency of a 5MHz AT-cut crystal in water will increase by about 8HzordmC Summary of sources of frequency error (in Water ∆∆∆∆f=700Hz)
Source of Error Typical magnitude of Error for wet crystal
Phase shift in low pass filter 065 Hz (lt01)
Reproducibility of Co null lt020 Hz Temperature dependence of viscosity asymp08 Hz01ordmC
Resistance Measurement The QCM100 Analog Controller provides a Conductance7 Voltage output (BNC port) that is related to the crystalrsquos motional series resonance resistance
Rm = 10000 middot 10-Vc5 -75 (equation 2) Where Rm - motional series resonance resistance in Ω Vc - conductance voltage output in V
A high-precision digital voltmeter8 with at least 6 digits of resolution and computer interface is recommended for this measurement
wwwthinkSRScom
Stanford Research Systems (408)744-9040
Resistance Calculation
Figure 5 QCM Gain Model A gain model of the QCM25 Crystal Controller is shown in Figure 5 At series resonance the reactance of the crystalrsquos motional inductance and motional capacitance cancel and so the crystal may be represented by just Rm the motional resistance of the crystal (It is also assumed that the static capacitance Co has been nulled as previously described) The circuit will oscillate at the frequency for which the net phase shift around the loop is 360deg providing there is sufficient gain to overcome the circuit losses Two network elements in the model provide a phase shift The inverting amplifier provides 180deg of phase shift The low pass filter is adjusted to provide 180ordm of phase shift at 5MHz Hence the circuit will oscillate at the frequency for which the crystal is resistive ie at series resonance The loop gain is the product of the gain (or attenuation) of each of the network elements If the loop gain is exactly one then the oscillation amplitude will be maintained at a fixed level An AGC circuit controls the loop gain via a voltage controlled variable attenuator From left to right the circuit consists of the following 1 A voltage controlled variable attenuator with attenuation of Aa An automatic gain control circuit generates a voltage to maintain the oscillation amplitude at a fixed level of 1Vpp The attenuator is controlled by this voltage between 0 and 1Vdc providing an attenuation of 50dBvolt so that Aa=10-Vagc˙50 20 The AGC voltage is amplified by 5x in the QCM25 Crystal Controller and by 25x in the QCM100 Analog Controller before being output via the Conductance BNC on the front panel of the QCM100 Hence referenced to the voltage Vc at the QCM100 Conductance output BNC Aa = 10-Vc5
X5 X25
Aa x A1 x At x An x A2 x Af =1
Rm RL
AGC
AHN LPF+
Rs
21
-50dBV Vc
Gains
wwwthinkSRScom
Stanford Research Systems (408)744-9040
2 A fixed gain amplifier with gain A1 = 45dB + 20 log (250200) = 4694dB (or -222x) This inverting amplifier has a bandwidth of 500MHz and so introduces very little extraneous phase shift 3 A source resistance Rs of 100Ω This source resistance consists of two series 50Ω resistors one of which is inside the amplifier A1 This source impedance is reduced by a factor of 4x to 25Ω by the 21 transformer which follows 4 An isolation transformer with a 21 turns ratio hence an attenuation of At = 05x This transformer allows galvanic isolation of the crystal from the oscillator circuit which is important in electrochemistry applications In addition to reducing the source impedance by 4x the transformer also increases the load impedance seen at the input of the transformer by 4x so that when Rm=0Ω the load will be 200Ω 5 Rm the motional resistance of the crystal at series resonance Rm can vary from about 10-40Ω for a dry crystal to about 375Ω for a crystal in water to about 5kΩ for a crystal in 90 (ww) glycerolwater solution 6 A second isolation transformer with a turns ratio of 11 This transformer allows galvanic isolation of the crystal from the oscillator circuit 7 A load resistance RL of 50Ω The network of Rs Rm and RL provide a network attenuation An which depends on the crystalrsquos motional resistance An = RL ( Rs4 + Rm + RL ) 8 An RF amplifier with an adjustable gain A2 of about 443x The gain of this amplifier A2 is set during calibration to compensate for gain variations of all the other circuit elements 9 A low pass filter This filter is a 5th order Bessel low pass filter with fc = 37MHz adjusted so as to provide 180ordm of phase shift at 5MHz The phase shift of this filter together with the 180ordm phase shift of the inverting amplifier A1 provides the 360ordm of phase shift necessary for oscillation The low pass filter is required to suppress spurious oscillations which would occur due to the high bandwidth of the loop amplifiers The low pass filter attenuates a signal at 5MHz by about Af = -78dB (or 0407x) The motional resistance of the crystal at series resonance can now be computed The product of the gain (or attenuation) of all of the elements around the loop is exactly one when the circuit is oscillating at constant amplitude Hence Aa middot A1 middot At middot An middot A2 middot Af = 1
wwwthinkSRScom
Stanford Research Systems (408)744-9040
Rearranging and substituting the equation for An 1 An = ( Rs4 + Rm + RL ) RL = Aa middot (A1 middot At middot A2 middot Af ) Solving for Rm Rm = RL middot Aa middot (A1 middot At middot A2 middot Af ) ndash RL ndash Rs 4 From the characteristics of the voltage variable attenuator described above Aa = 10-Vc5 where Vc is the voltage at the Conductance output BNC on the QCM100 A2 is adjusted during factory calibration so that the product of the gains (A1 middot At middot A2 middot Af ) = 200 So we have
Rm = 10000 middot 10-Vc5 -75 Where Rm- motional series resonance resistance in Ω Vc- conductance voltage output in V
The motional resistance of the crystal at series resonance Rm can be
computed from the above equation Figure 6 below graphs Rm vs Vc
wwwthinkSRScom
Stanford Research Systems (408)744-9040
Figure 6 Motional series resonance resistance vs conductance voltage
Errors in the measurement of Rm Errors in the measurement of Rm will be less than 3Ω + 3 of Rm (for Rm lt 2kΩ) and are dominated by the departure of the voltage controlled attenuator from its nominal (voltagegain) characteristic Keep also in mind that the resistance measurement in liquids and soft films is also affected by temperature mostly through the temperature coefficient of the viscocity For example a 4ΩdegC drift in resistance is to be expected in water around room temperature Noise in the measurement of Rm Vc varies logarithmically with Rm over most of the range of interest There is an important advantage in this the fractional resolution of the resistance is nearly independent of the resistance and so allows detailed and low-noise
Motional Resistance vs Conductance VoltageRm = (10000 x 10^(-Vc5) - 75) Ohms
1
10
100
1000
10000
0 1 2 3 4 5 6 7 8 9 10 11
Conductance Voltage (Volts)
wwwthinkSRScom
Stanford Research Systems (408)744-9040
measurement of the viscous losses To estimate the noise in resistance measurements we can take the derivative of the equation for the motional resistance (units are Ohms and OhmsVolt) Rm = (10000 middot10-Vc5 -75) dRm dVc = 10000 middot 10 ndashVc5 middot ln (10) middot (-15)
= -2000 middot ln (10) middot 10 ndashVc5 asymp -4605 middot 10 ndashVc5
asymp -04605 middot (Rm + 75) Noise on the Vc signal ∆ Vc is typically plusmn 50microV (with one second averaging) The Rm for a 5MHz crystal in water is about 375Ω The fractional noise in the resistance measurement is then ∆∆∆∆RmRm = ∆Vc middot [dRm dVc ] Rm = ∆ Vc middot [-04605 middot (Rm + 75)] Rm = plusmn 28 ppm This low noise floor for fractional resistance measurements allows very small changes in dissipation losses to be measured This is also the reason why a high precision voltmeter (ie with at least six digits of resolution) is recommended for these measurements Calibration of Rm Resistance measurements for the QCM25 Crystal ControllerQCM100 are calibrated by replacing the crystal with a precision resistor in parallel with a 15pF capacitor Two resistor values are used 5110Ω and 1000kΩ The equation for Rm may be inverted to determine the calibration value for Vc (Motional resistance Rm in Ω and conductance voltage output Vc in volts) Rm = (10000 10-Vc5 - 75) Vc = 5 log [ 10000 (Rm + 75) ] The low pass filter is adjusted so that the QCM25 Crystal Controller oscillates at 5MHz with the 5110Ω resistor in place of the crystal The varactor dial is adjusted so that the Crystal Controller oscillates at 5MHz with the 1000kΩ resistor in place of the crystal Calibration potentiometers in the QCM25 Crystal Controller are adjusted so that Vc = 9496Vdc with a calibration resistor of 5110Ω and so that Vc = 4843Vdc with a calibration resistor of 1000kΩ
wwwthinkSRScom
Stanford Research Systems (408)744-9040
Gas-Phase Measurements The first use of QCMs was as mass sensors and thickness monitors in gas phase thin-film depositions To this date this continues to be one of the most important areas of application for this technology Sauerbrey Equation Sauerbreyrsquos equation (equation 1) is often used to calculate mass loadings and thin-film thicknesses in vacuum depositions The basic assumption is that the incremental change in mass from the foreign film is treated as though it were really an extension of the thickness of the underlying quartz The foreign film is considered rigid and so thin that it does not experience any shear forces during vibration As a result the sensitivity factor Cf is a fundamental property of the quartz crystal and does not consider any of the properties of the foreign film (ie it is only dependent on the acousto-elastic properties of quartz)
Cf = 2nfo2(ρqmicroq)12 (equation 3)
where n - number of the harmonic at which the crystal is driven fo - the resonant frequency of the fundamental mode of the crystal in Hz ρq - density of quartz ndash 2648 g cm-3 and microq - shear modulus of quartz - 29471011 gcm-1s-2
The dependence of the frequency change on the mass coverage per unit area emphasizes the fact that within certain limits the sensitivity factor is independent of the electrode geometry Thus in theory the QCM mass sensor does not require calibration for this application This ability to calculate mass loading from first principles is obviously a very active feature of these devices Film thickness is often the parameter of interest in gas-phase thin-film depositions If the mass coverage is believed to be uniform the thickness of the film is easily calculated dividing the mass per unit area provided by Sauerbreyrsquos equation by the materialrsquos density
Tf = ∆m ρf (equation 4) where ρf - density of film material in gcm3 ∆m - change in mass per unit area in gcm2 (calculated from Sauerbreyrsquos equation) and
wwwthinkSRScom
Stanford Research Systems (408)744-9040
Tf - Thickness of the film in cm
Z-match Method It is generally accepted that when the mass loading from the deposit causes a change in frequency of less than 2 of the frequency of the unloaded crystal Sauerbreyrsquos equation can be used to obtain accurate results in thin-film thickness calculations9 As the thickness of the film increases the Sauerbrey equation must be extended to incorporate the elasticity of the deposit Lu and Lewis10 gave a specially simple equation (equation 5) for the calculation of the dependence of ∆f on ∆m which is currently applied by most QCM users to calculate rigid thin-film thicknesses in gas phase depositions ∆m = [(Nq
ρq)(Π Z fL)] tan-1[ Z tan[Π (fU - fL) fU]] (equation 5) where ∆m - change in mass per unit area in gcm2 Nq - Frequency Constant for AT-cut quartz crystal 16681013 Hz Aring ρq - density of quartz 2648 g cm-3 ρf - density of film material in g cm-3 fU - Frequency of unloaded crystal (prior to deposition) in Hz fL - Frequency of loaded crystal in Hz microq -shear modulus of quartz 29471011 g cm-1 s-2 microf - shear modulus of film material and Z Z-Factor of film material = [(ρρρρq micromicromicromicroq) (ρρρρf micromicromicromicrof)]12
This analysis of frequency changes including the acoustic impedances of the quartz and film is often called the ldquoZ-matchrdquo method The accuracy of the mass load and film-thickness calculation is often limited by how well the Z-Factor and density of the material are known Density and Z-Factor values are typically very close to bulk values The bulk density and shear modulus values for common film materials can be found in many material reference handbooks The Lu and Lewis equation is generally considered to be a good match to the experimental results11 for frequency changes up to 40 (relative to the unloaded crystal) Keep also in mind that the Z-match equation strictly applies to ldquorigidrdquo deposits Films which behave viscoelastic such as some organic polymer films with large thickness or viscosity will exhibit significant deviations from both equations 1 and 5 Crystal failures are also often seen before a 40 shift in frequency is reached Common problems are (1) shorts in the crystal electrodes due to excessive buildup (2) mode hoping to other (anharmonic) resonant frequencies due to the
wwwthinkSRScom
Stanford Research Systems (408)744-9040
buildup of composite resonant modes (3) deviations from theory due to fringing electrode fields developed between the electrodes and the film (4) unexpected shifts in fundamental frequency due to stress build up on the crystal surface (5) spitting of source material resulting in non-uniform films etc
wwwthinkSRScom
Stanford Research Systems (408)744-9040
Liquid Contact Measurements Until recently its was believed that excessive viscous loading would prohibit use of the QCM in liquids In fact operation in liquids is indeed possible12 and the response of the QCM is still extremely sensitive to mass changes at the solid-solution interface For many years QCMs have been used in direct contact with liquids andor viscoelastic films to assess changes in mass and viscoelastic properties during chemical and electrochemical surface processes When the QCM comes in contact with a solution there is a decrease in frequency that is dependent upon the viscocity and the density of the solution A quantitative understanding of the resonator behavior is a prerequisite for proper interpretation of experimental results under total liquid immersion This problem was first treated by Glassford13 and later by Kanazawa and Gordon14 Kanazawarsquos treatment of the influence of the solution properties on the crystal (equation 6) permits the prediction of the change in resonance frequency which accompanies immersion of the crystal into a viscous medium
∆f = - fu32 [(ρL ηL) (Π
ρq microq)]12 (equation 6)
where fu - frequency of oscillation of unloaded crystal ρq - density of quartz ndash 2648 g cm-3 microq - shear modulus of quartz- 29471011 gcm-1s-2 ρL - density of the liquid in contact with the electrode and ηL - viscosity of the liquid in contact with the electrode
Viscous coupling of the liquid medium to the oscillating crystal surface results not only in a decrease in the series resonant frequency but also in damping of the resonant oscillation- the viscous loss is manifested as an increase in series resonance resistance R of the QCM resonator Thus R serves as an excellent independent measure of viscous loading by the medium (ie liquid or soft-film) at the crystalrsquos surface ∆f and ∆R measurements are both routinely used as independent indicators of mass loading and viscosity at the crystal-liquid interface of the QCM resonator during chemical and electrochemical depositions in solution15 In a separate study16 a Butterworth-Van Dyke equivalent circuit model (Figure 1) was applied to derive a linear relationship between the change in series resonance resistance ∆R of the quartz oscillator and (ρL
ηL)12 under liquid
loading
wwwthinkSRScom
Stanford Research Systems (408)744-9040
∆R = [n ωs Lu Π][ (2 ωs
ρL ηL) (ρq
microq)]12 (equation 7)
Where ∆R - change in series resonance resistance in Ω n - number of sides in contact with liquid ωs - angular frequency at series resonance(= 2Πfs where fs is the oscillation frequency in solution in Hz) and Lu - Inductance for the unperturbed (ie dry) resonator usually in mH
The QCM100 System was specifically designed for operation under heavy viscous loading The standard Crystal Holder supports operation in gas and liquid environments and provides single-electrode exposure to liquids17 (ie n =1 in equation 7) as required for compatibility with electrochemical QCM measurements The QCM25 Crystal Controller provides both frequency and resistance change signals and will maintain oscillation up to a series resonance resistance of about 5 KΩ (ie it will support crystal operation in highly viscous solutions up to 88 (ww) glycerol in water)
wwwthinkSRScom
Stanford Research Systems (408)744-9040
Figure 7 ∆f and ∆R versus glycerol weight percentage (in water) as predicted by theory and as measured with QCM100 and a 5MHz polished
crystal As an example equation 6 predicts a decrease in f0 of 715Hz on transfer from vacuum to pure water18 at 20degC in agreement with the results observed with a QCM100 using 1inch diameter polished 5MHz crystals mounted on a standard Crystal Holder Excellent agreement between the frequency and resistance equations and the experimental results has been proved19 making the QCM an
0
500
1000
1500
2000
2500
3000
3500
4000
4500
5000
0 10 20 30 40 50 60 70 80 90 100
Wt Glycerol
QCM100Theory
-12000
-11000
-10000
-9000
-8000
-7000
-6000
-5000
-4000
-3000
-2000
-1000
0
0 10 20 30 40 50 60 70 80 90 100
Wt glycerol
f H
zQCM100Theory
wwwthinkSRScom
Stanford Research Systems (408)744-9040
excellent tool for the evaluation of fluid properties Application examples include in situ monitoring of lubricant and petroleum properties20 The tight correspondence between theory (equations 6 amp 7) and experiment is clearly illustrated by Figure 7 Dissipation Technique An alternative method21 for studying the properties of the loaded QCM Sensor called the ldquoDissipation Techniquerdquo has been used in gaseous as well as in liquid environments In this case the crystal is driven at its resonant frequency by an oscillator that can be intermittently disconnected causing the crystal oscillation amplitude to decay exponentially From the recorded decay curve the absolute Q-factor (inversely proportional to R) and the frequency of the oscillator are simultaneously obtained Independent studies22 have shown that as long as the effect of the parasitic capacitance (C0) is properly cancelled the results provided by the Dissipation Technique should be in good agreement with the measurements provided by the QCM100 System
Temperature The intrinsic dependence of the resonant frequency of a quartz crystal on temperature is well known and generally quite small In fact the AT-cut quartz crystal commonly used in QCM experiments owe their popularity to their near zero coefficient at room temperature As a result the intrinsic temperature dependence of the QCM sensor crystals is negligible at or around room temperature (asymp 1-3 HzdegC) and is generally ignored for monolayer adsorptiondesorption processes in the gas phase Much larger changes in frequency with temperature are observed when QCM crystals are immersed in liquids This is due to the coupling of the shear mode oscillation with the temperature dependent viscosity and density of the fluid- the temperature coefficient due to this effect is asymp 8Hz ordmC for water As a result for experiments in liquid phase in which the frequency is to be monitored at length the temperature must be controlled to at least 01degC and preferably better In electrochemical experiments this is often achieved with temperature controlled baths and jacketed cells If temperature control is not possible or practical it is always good practice to wait at least 30 minutes before performing any accurate measurements after the crystal comes in contact with a new medium and measure the temperature of the solution around the crystal during the experiments to perform temperature compensation It is also common practice to soak the mounted crystal(s) in the solution overnight before performing any experiments to assure more stable readings Careful control of the temperature is required in high accuracy measurements to avoid frequency hysterisis effects- the dependence of resonator frequency at a
wwwthinkSRScom
Stanford Research Systems (408)744-9040
specific temperature on the prior temperature history of the resonator For example it is often observed that the frequency vs temperature curve obtained going from T1 to T2 will not coincide with the one obtained immediately after going from T2 to T1 This effect must be carefully considered during accurate determinations Each individual QCM user must determine the effect of temperature on the experiments being performed and either control the temperature accordingly or measure the temperature and compensate for it Electrode Polishing Electrode surface roughness can cause large apparent mass loadings due to the liquid that is trapped within pores at the crystal surface23 As a general rule optically polished crystals (50Aring average surface roughness) are required to obtain good agreement between theory and experiment during liquid immersion experiments The water immersion checkup test (below) provides a quick-and-easy way to test the crystal finish for liquid-QCM applications System Checkup A comparison against the theoretical predictions of equation 6 (amp7) is usually a good starting point when testing a new experimental liquid-QCM100 setup Two common ldquocheckuprdquo procedures are described diams Water Immersion For a 5MHz polished crystal and assuming that the
electrode capacitance has been properly cancelled a decrease in frequency of asymp715 Hz and an increase in series resonance resistance of asymp380 Ω is expected when switching from air to complete immersion in water at 20degC
diams GlycerolH2O Immersion Figure 7 shows resistance and frequency change values expected for a polished 5MHz crystal immersed in a series of viscous glycerolwater solutions at 20ordmC Operation at increasing glycerol concentrations is an excellent test of a QCM experimental setup and should provide predictable results up to more than 88 glycerol
In both procedures an agreement between measured and expected values within +- 25 is generally considered acceptable for glycerol concentrations up to 70 Frequency shifts are much larger (ie at least a factor of two) and unpredictable for unpolished crystals so they are not recommended for system checkup
wwwthinkSRScom
Stanford Research Systems (408)744-9040
Electrochemical Quartz Crystal Microbalance In most electrochemical experiments mass changes occur as material is deposited or lost from the ldquoworkingrdquo electrode It is of interest to monitor those changes simultaneously with the electrochemical response and the QCM is the standard means of doing so As a gravimetric probe the QCM has been used in many types of electrochemical studies including underpotential deposition of metals24 corrosion oxide formation dissolution studies25 adsorptiondesorption of surfactants26 and changes in conductive polymer films during redox processes27 The basic principles and applications of the QCM to electrochemical processes have been extensively reviewed in the electrochemical literature28 and will only be discussed briefly in this manual Please refer to the publications list at the end of this chapter for more detailed information Electrochemical Apparatus A schematic diagram of the apparatus for electrochemical quartz crystal microbalance (EQCM) experiments is given in Figure 8 In this example a 1inch diameter polished QCM crystal is mounted on a crystal holder with only one electrode exposed to the conductive solution The crystal holder is connected to a QCM25 Crystal Controller and the liquid-contact electrode is connected to the ldquoworking electroderdquo lead of the potentiostat (through the ldquoCrystal Face Biasrdquo connector of the QCM25 Crystal Controller) A QCM100 Analog Controller provides independent frequency and conductance outputs which are read and displayed by a frequency counter and a digital multimeter (or AD converter) respectively
wwwthinkSRScom
Stanford Research Systems (408)744-9040
Figure 8 Schematic of EQCM apparatus
A PC (not shown) is often interfaced to the potentiostat frequency counter and DMM and integrates the QCM and electrochemical data into a single software package Note The QCM25 Crystal Controller provides transformer isolation of the crystal front face electrode This allows direct electrical connection of the quartz crystal face to the ldquoworking electroderdquo pin of any standard potentiostatgalvanostat With the instrument in Figure 8 a typical cyclic voltammetric-EQCM experiment would involve the application of the electrochemical waveform to the working electrode and the simultaneous measurement of the current flowing through the electrochemical cell and the oscillation frequency and series resonance resistance of the crystal Figure 9 is an example of a typical voltammogram-massogram plot obtained from a 10mM solution of CuSO4 in 01M H2SO4 using a 1inch diameter Au coated quartz crystal mounted in a standard holder as the working electrode
Digital Multimeter
QCM25
Reference Electrode
Counter Electrode
Work Electrode
Potentiostat
QCM100 Analog Controller
Frequency Counter
Crystal Holder
wwwthinkSRScom
Stanford Research Systems (408)744-9040
Figure 9 Cyclic voltammogram and massogram data for Cu deposition on a Au
electrode The frequency ndashpotential diagram shows a frequency decrease in perfect sync with the deposition of Cu metal on the crystalrsquos surface
Calibration It has been amply demonstrated in the literature that when experiments involve only relative frequency shifts which are measured in a fixed solution the offset caused by the viscous loading of the liquid has negligible effect on the accuracy of the Sauerbrey equation for the determination of small mass changes in rigid deposits29 Quantitative interpretation of the EQCM data in those cases is based on the combination of the Sauerbrey equation (equation 1) and Faradayrsquos law The former relates change in frequency to change in mass for thin rigid deposits whereas the latter relates charge passed in an electrochemical experiment to the number of moles of material electrolyzed Therefore frequency changes can be related to the total charge passed An example would be the electrodeposition of Ag on a Pt electrode QCM crystal The charge Q is an integral measure of the total number of electrons delivered at the interface during the reduction process To the extent that each electron supplied results in the deposition of one atom of Ag there should be a linear relationship between Q and ∆f as is given by equation 8
∆f = 106 Mw Cf Q (n F A) (equation 8) where
wwwthinkSRScom
Stanford Research Systems (408)744-9040
∆f - frequency change in Hz Mw - apparent molar mass of the depositing species in gramsmole Cf - Sauerbreyrsquos sensitivity factor for the crystal used (see equation 1) Q - integrated charge during the reduction in Coulomb A - Active deposition area of the working (ie liquid contact) electrode in cm2 F - Faradayrsquos constant 9648 104 Coulombmole and n - number of electrons transferred to induce deposition (ie n =1 for Ag deposition) (The factor of 106 provides for the unit conversion from mg in Cf to g in Mw)
A plot of ldquo∆f vs Qrdquo will deliver the apparent mass per electron of the deposited species when n is taken into account This is often used to elucidate the mass changes that accompany redox processes and hence is very useful for characterizing the mechanisms of electron-transfer reactions However before any calculations can be performed based on equation 8 the EQCM must be calibrated in order to properly derive (1) the proportionality constant Cf of the Sauerbrey equation in solution and (2) to account for the effective area of the working electrode This is generally done using a well behaved electrochemical reaction- typically electrodeposition of silver copper or lead on a Au or Pt electrode The EQCM calibration method favored by Stanford Research Systems for its QCM100 system is based on the galvanostatic deposition of Ag A 50mM solution of AgNO3 in 05M HNO3 is subjected to a reducing potential and Ag is deposited with a fixed cathodic current density of 50-500 microAcm2 The cathodic current is integrated to obtain the charge as a function of time Excellent linearity is generally observed in ldquo∆f vs Qrdquo plots for depositions within 1 microgcm2 providing a very reliable way to calibrate the proportionality constant of equation 8 Several calibration procedures are also described in the electrochemistry literature30 and users are referred to the publications list at the end of this chapter for details Polymer Modified Electrodes The EQCM has been extensively used to study polymer modified electrodes particularly as a gravimetric tool to follow redox processes31 However for the linear frequency-to-mass relationship (described by equation 8) to hold true the polymer overlayer must exhibit no changes in rigidity during the electrochemical process Otherwise the viscoelastic changes will also contribute to the frequency change leading to an erroneous interpretation of the mass changes32 As a
wwwthinkSRScom
Stanford Research Systems (408)744-9040
consequence it is essential to determine whether or not viscoelastic properties of the polymer film influence the frequency measurement during polymer film experiments
Figure 10 Votammogram and massogram data for the oxidation of pyrrole to form a polypyrrole film on a gold coated QCM Sensor Crystal Seven cycles of
voltammetry between - 04 and 095 V were conducted in this experiment Pyrrole monomer can be oxidized to its radical at 065V As this happens a thin polypyrrole film is formed on the crystal surface resulting in a decrease in the
fundamental frequency of oscillation of the crystal The continuous growth of the film is evidenced by the irreversible decrease in frequency during the scans
A starightforward way to detect changes in film viscoelastic properties of redox films is to simultaneously monitor the series resonance resistance R of the quartz oscillator during the electrochemical experiment33 Some theoretical models34 based on the simultaneous measurement of ∆f and ∆R have been discussed in the literature for the extension of EQCM gravimetric measurements to non-rigid films The viscoelastic analyis of polymeric thin films in EQCM systems is complex because the shear wave exists simultaneously in the quartz crystal the viscoelastic film and the adjacent solution so reflection of the shear wave must be taken into account However solution of this problem would be worthwhile specially if the material properties of the film could be derived This would allow correlation of the electrochemical behavior of the film with its material properties35
01M Pyrrole in 01M HCLO4
wwwthinkSRScom
Stanford Research Systems (408)744-9040
The unique property of the QCM technique is its ability to determine the mass of very thin layers while simultaneously giving information about their viscoelastic properties The ability to measure both mass and structural changes means it is possible to detect phase-transitions cross-linking and swelling in polymeric thin films36
wwwthinkSRScom
Stanford Research Systems (408)744-9040
Chemical and Biological Sensors Anything that has mass can generate a response from a QCM sensor The universal response of the device is the reason for the wide range of application of the technology However the downside of such universal sensitivity is that you always have a great danger of interferences For analytical purposes it is imperative to find ways of getting the QCM sensor to respond only to what you are interested in (ie build sensitivity into the device) This usually involves the addition of a sensitive layer on the surface of the crystal37 Organic polymers comprise the most common type of coating used with QCM sensors due to their capability to reversibly sorb vapors and liquids38 In much of the work published on the use of polymer coatings for vapor sensing the acoustic properties of the polymer material have been neglected The relative importance of the mass-loading and viscoelastic contributions of the film to the observed QCM response is a subject that has yet to be resolved In no area have the QCM applications seen such dramatic increase in recent years as in the field of biochemical analysis QCM devices are routinely used as biochemical and immunological probes39 as well as for the investigation andor monitoring of biochemcially significant processes Sensitive selective detection of biochemically active compounds can be achieved by employing antigen-antibody40 enzyme substrates and other receptor ndashprotein pairs The potential analytical uses of these materials has been reviewed particularly with respect to the development of biochemical sensors41 QCM studies have provided detailed information about the functionalized surfaces developed for a range of biochip and biosensor applications QCM Systems are applied routinely by biologists and biochemists to obtain information about processes such as (1) protein adsorptiondesorption42 (2) cell adhesion43 (3) Protein-protein interaction (4) Degradation of polymers (5) biofouling and biofilm formation (6) drug analysis44 and (7) DNA Biosensors45
References 1 G Sauerbrey Z Phys 155 (1959) 206 2 Daniel Buttry ldquoApplications of the QCM to Electrochemistryrdquo in A Series of Advances in Electroanalytical Chemistry edited by Allen Bard Marcel Dekker 1991 p 23-33 3 John Henderson ldquoElectronic Devices Concepts and Applicationsrdquo Prentice Hall NJ (1991) p 357 4 For example QCM10 crystal holder with a 1inch 5MHz crystal connected directly to an SRS QCM25 Crystal Controller
wwwthinkSRScom
Stanford Research Systems (408)744-9040
5 C Chagnard P Gilbert N Watkins T Beeler and David W Paul ldquoAn electronic oscillator with automatic gain controlEQCM Applicationsrdquo Sensors and Actuators B 32(1996) 129-136 A Arnau T Sogorb and Y Jimenez ldquoCircuit for continuous motional series resonat frequency and motional resistance monitoring of quartz crystal resonators by parallel capacitance cancellationrdquo Rev Sci Instrum 73(7)(2002) 2724 6 For example from the Conductance Output of the QCM100 7 Conductance is the inverse of resistance Conductance = 1 Resistance or Resistance = 1 Conductance The units of resistance are Ohms [Ω = VA] and the units of conductance are Siemens (S = AV] 8 For example Agilent 34401A with 6 digit resolution or 3458 with eight digits resolution 9 DR Denison ldquoLinearity of a Heavily Loaded Quartz Crystal Microbalancerdquo J Vac Sci Technol 10(1) (1973) 126 Klaus H Behrndt ldquoLong Term Operation of Crystal Oscillators in Thin-Film Depositionrdquo J Vac Sci technol 8(5)(1971) 622 10 C Lu and O Lewis ldquoInvestigation of film-thickness determination by oscillating quartz resonators with large mass loadrdquo J Appl Phys 43 (1972) 4385 Chih-shun Lu ldquoMass determination with piezoelectric quartz crystal resonatorsrdquo J Vac Sci Technol 12(1) (1975) 578 11 D R Denison ldquoLinearity of Heavily Loaded Quartz Crystal Microbalancerdquo J Vac Sci Technol 10(1973) 126 K H Behrndt ldquoLong Term Operation of Crystal Oscillators in Thin-Film Depositionrdquo J Vac Sci Technol 8(5) (1971) 622 12 T Nomura and M Okuhara Anal Chim Acta 142(1982) 281 13 A P M Glassford ldquoResponse of a Quartz Crystal Microbalance to a liquid Depositrdquo J Vac Sci Technol 15(6)(1978) 1836 14 K Keiji Kanazawa and Joseph Gordon II ldquoFrequency of a Quartz Microbalance in Contact with Liquidrdquo Anal Chem 57(1985) 1770 K Keiji Kanazawa and Joseph G Gordon II Analytica Chimica Acta 175(1985) 99-105 15 Stephen J Martin James J Spates Kurt O Wesendorf thomas Schnneider and Robert J Huber ldquoResonator Oscillator Response to Liquid Loadingrdquo Anal Chem 69(1997) 2050 16 Stephen Martin Victoria Edwards Granstaff and Gregory C Frye ldquoCharacterization of a Quartz Crystal Microbalance with Simultaneous Mass and Liquid Loadingrdquo Anal Chem 63 (1991) 2272 17 Operation in liquids requires that the crystal be mounted in a holder such that only the front surface of the crystal is in contact with the fluid while at the same time providing an electrical connection to both electrodes 18 For pure water at 20C ρL 09982 g cm-3 and ηL 100210-2 g cm-1 s-1 19 H Muramatsu Eiichi Tamiya and Isao Karube ldquoComputation of Equivalent Circuit Parameters of Quartz Crystals in Contact with Liquids and Study of Liquid Propertiesrdquo Anal Chem 60(1988) 2142 SJ Geelhood C W Frank and K Kanazawa ldquoTransient Quartz Crystal Microbalance Behaviors Comparedrdquo Journal of the Electrochemical Society 149(2002) H33-H38 Mengsu Yang and Michael Thompson ldquoMultiple Chemical Information from the Thickness Shear Mode Acoustic Wave Sensor in the liquid Phaserdquo Anal Chem 65(1993) 1158
wwwthinkSRScom
Stanford Research Systems (408)744-9040
20 S J Martin R W Cernosek and JJ Spates ldquoSensing Liquid Properties with Shear-mode Resonator Sensorsrdquo in Proceeds from TransducersEurosensors IX Stockholm Sweden (1995) 21 Michael Rodahl Fredrik Hook Anatol Krozer Peter Brzezinski and Bengt Kasemo ldquoQCM setup for frequency and Q-factor measurements in gaseous and liquid environmentsrdquo Rev Sci Instrum 66(7)(1995)3924 22 S J Geelhood CW Frank and K Kanazawa ldquoTransient QCM Behaviors Comparedrdquo J of the Electrochemical Societyrdquo 149(1)(2002)H33 23 Stephen Martin et al rdquoEffect of Surface Roughness on the Response of Thickness-Shear Mode Resonators in Liquidsrdquo Anal Chem 65(1993)2910 Michael Ward and Edward J Delawski ldquoRadial Mass Sensitivity of the Quartz Crystal Microbalance in Liquid Mediardquo Anal Chem 63(1991) 886 24 Mark R Deakin and Owen Melroy ldquoUnderpotential Metal Deposition on Au monitorred in situ with a Quartz Microbalancerdquo J Electroanal Chem 239(1988) 321 O Melroy K Kanazawa JG Gordon II and D Buttry ldquoDirect Determination of the Mass of an Underpotentially Deposited Monolayer of Lead on Goldrdquo Langmuir 2(1986)697 Masahiro Seo Masaki Aomi and Kengo Yoshida ldquoA combined Piezoelectric and EQCM study of Underpotential Deposition of Silver on Gold Electrodesrdquo Electrochimica Acta 39(89) (1994) 1039 Youngran Lim and Euijin Hwang ldquoAn Electrochemical QCM study of Oxygen reducttion during the Underpotential Depoosition of Lead on a Gold Electroderdquo Bull Korean Chem Soc 17(12)(1996)1091 25 EQCMWall Jet Split-Ring Disk Electrode study on Copper dissolution in Chloride Aqueous solutionrdquo Anal Sciences16(2000)1049 Michael Benje Matthias Eiermann Udo Pittermann and Konrad G Weil ldquoAn improved Quartz Microbalnce Applications to Electrocrystallizatuion and dissolution of Niquelrdquo Ber Bunsenges Phys Chem 90(1986) 435 26 Jorg Auge Peter Hauptmann Frank Eichelbaum and Stephen Rosler ldquoQCM sensor in liquidsrdquo Sensors and Actuators B 18-19 (1994) 518 27 Adrian W Bott ldquoCharacterization of Films Immobilized on an Electrode Surface Using the EQCMrdquo Current Separations 183(1999)79 28 Mark Deakin and Daniel Buttry ldquoElectrochemical Applications of the Quartz Crystal Microbalancerdquo Anal Chem 61(20)(1989)183 Daniel Buttry and Michael Ward ldquoMeasurement of Interfacial Processes at electrode surfaces with the EQCMrdquo Chem Rev 92(6) (1992) 1355 29 Wolfgang Stockel and Rolf Schumacher ldquoIn situ Microweighing at the Junction MetalElectrolyterdquo Ber Bunsenges Phys Chem 91(1987)345 30 C Gabrielli M Keddam and R Torrei ldquoCalibration of the Electrochemical Quartz Crystal Microbalancerdquo J Electrochem Soc 139(9) (1991) 2657 Note A calibration procedure based on the deposition of Ag on Au electrodes is described Graeme Andrew Snook Investigation of Solid-State Reactions by Electrochemical and Quartz Crystal Microbalance Measurements PhD Thesis 2000 Department of Chemistry Monash University Clayton 3168 Melbourne Australia and Division of Minerals CSIRO Clayton South 3169 Melbourne Australia under the supervision of Professor Alan Maxwell Bond (Monash) and Professor Stephen Fletcher (CSIRO)
wwwthinkSRScom
Stanford Research Systems (408)744-9040
Available for download from httpwww-bondchemmonasheduautheses Note the use of Lead acetate is proposed as a better alternative to Cu and Ag deposition Bruckenstein S and Shay M ldquoExperimental aspects of use of the quartz crystal microbalance in solutionrdquo Electrochim Acta 30(1985) 1295 31 Duke Orata and Daniel A Buttry ldquoDetermination of Ion Populations and Solvent Content as fucntions of Redox State and pH in Polyanilinerdquo J Am Chem Soc 109(1987)3574 32 Michael Ward ldquoInvestigation of Open Circuit Reactions of Polymer Films Using the QCM Reactions of Polyvinylferrocene Filmsrdquo J Phys Chem 92(1988)2049 Charles K Baker and John R Reynolds ldquoA quartz microbalance study of the electrosynthesis of polypyrrolerdquo J Electroanal Chem 251(1988) 307 33 Stephen Martin Victoria Edwards Granstaff and Gregory C Frye ldquoCharacterization of a Quartz Crystal Microbalance with Simultaneouus Mass and Liquid Loadingrdquo Anal Chem 63 (1991) 2272 Ralf Lucklum and Peter Hauptmann ldquoThe Df-DR QCM technique an approach to an advanced sensor signal interpretationrdquo Electrochimica Acta 45(2000) 3907 34 RA Etchenique and E L CalvordquoGravimetric measurement in redox polymer electrodes with the EQCM beyond the Sauerbrey limitrdquo Electrochemistry Communications 1(5)(1999)167 RA Etchenique and E J Calvo ldquoElectrochemical Quartz Crystal Impedance Study of Redox Hydrogel Mediators for Amperometryic Enzyme Electrodesrdquo Anal Chem 69(1997)4833 35 E J Calvo R Etchenique P N Bartlett K Singhal and Santamaria ldquoQuartz Crystal Impedance studies at 10MHz of viscoelastic liquids and filmsrdquo Faraday Discuss107(1997)141 Diethelm Johannsmann ldquoViscoelastic Analysis of Organic Thin Filmsrdquo on quartz resonatorsrdquo Macromol Chem Phys 200(1999)501 36 C E Reed K Keiji Kanazawa and J Kaufman ldquoPhysical description of a viscoelastically loaded AT-cut quartz resonatorrdquo J Appl Phys 68(5) (1990) 1993 37 D S Ballantine R M White S J Martin A J Rico E T Zellers G C Frye and H Woltjen ldquoAcoustic Wave Sensors Theory Design and Physico-Chemical Applicationsrdquo Acad Press London UK 1997 Chapter 5 (Chemical and Biological Sensors) p 222 38 GG Guilbault and J Jordan ldquoAnalytical uses of piezoelectric crystalsrdquo CRC Reviews 19 p 1-28 W H King ldquoPiezoelectric Sorption Detectorrdquo Anal Chem 36 (1964) 1735 39 Iddo Ben-Dov and Itamar Willmer ldquoPiezoelectric Immunosensors for Urine Specimens of Chlamidia trachomatis Employing QCM Microgravimetric Analysisrdquo Anal Chem 69(1997) 3506 40 A Hengerer C Koumlsslinger1 J Decker S Hauck1 I Queitsch2 H Wolf and S Duumlbel2 ldquoDetermination of Phage Antibody Affinities to Antigen by a Microbalance Sensor Systemrdquo BioTechniques 26956-964 (May 1999) 41 G G Guibault ldquoAnalytical uses of immobilized Enzymes Modern Monographs in Analytical Chemistryrdquo Vol 2Marcel Dekker New York (1984) G M Minunni M Mascini GG Guilbault B Hock ldquoThe Quartz Crystal Microbalance as Biosensor A Status Report on its Futurerdquo Anal Lett 28 5(1995) 749 S Tombelli M Mascini ldquoPiezoelectric Quartz Crystal Biosensor Recent Immobilisation Schemesrdquo Anal Lett 33(11) 2000 pp 2129-2151
wwwthinkSRScom
Stanford Research Systems (408)744-9040
Kim R Rogers ldquoPrinciples of Affinity Based Biosensorsrdquo Molecular Biotechnology 14(2000)109 42 Fredrik Hook et al ldquoStructural changes in hemoglobin during adsorption to solid surfaces effects of pH ionic strength and ligand bindingrdquo Proc Natl Acad Sci USA 95(1998)12271 43 C Fredriksson S Kihlman M Rodahl and B Kasemo ldquoThe Piezoelectric Quartz crystal Mass and Dissipation Sensor A means of studyinng Cell adhesionrdquo Langmuir 19(1998) 248 Ann-Sofie Cans et al ldquoMeasurement of the Dynamics of Exocytosis and Vesicle Retrieval at Cell Populations Using a QCMrdquo Anal Chem 73(2001)5805 C A Keller and B KasemordquoSurface Specific Kinetics of Lipid Vesicle Adsorption Measured with a QCMrdquo Biophysical Journal 75(1998) 1397 44 Wei W Z et al ldquoSelective pharmaceutical analyis technique with sensitive piezoelectric quartz sensorsrdquo Anal Lett 26(11)(1993)2371 45 Storri S Santoni T Mascini MrdquoA piezoelectric biosensor for DNA hybridization detectionrdquo Anal Lett 31(11)(1998)1795

wwwthinkSRScom
Stanford Research Systems (408)744-9040
2 A fixed gain amplifier with gain A1 = 45dB + 20 log (250200) = 4694dB (or -222x) This inverting amplifier has a bandwidth of 500MHz and so introduces very little extraneous phase shift 3 A source resistance Rs of 100Ω This source resistance consists of two series 50Ω resistors one of which is inside the amplifier A1 This source impedance is reduced by a factor of 4x to 25Ω by the 21 transformer which follows 4 An isolation transformer with a 21 turns ratio hence an attenuation of At = 05x This transformer allows galvanic isolation of the crystal from the oscillator circuit which is important in electrochemistry applications In addition to reducing the source impedance by 4x the transformer also increases the load impedance seen at the input of the transformer by 4x so that when Rm=0Ω the load will be 200Ω 5 Rm the motional resistance of the crystal at series resonance Rm can vary from about 10-40Ω for a dry crystal to about 375Ω for a crystal in water to about 5kΩ for a crystal in 90 (ww) glycerolwater solution 6 A second isolation transformer with a turns ratio of 11 This transformer allows galvanic isolation of the crystal from the oscillator circuit 7 A load resistance RL of 50Ω The network of Rs Rm and RL provide a network attenuation An which depends on the crystalrsquos motional resistance An = RL ( Rs4 + Rm + RL ) 8 An RF amplifier with an adjustable gain A2 of about 443x The gain of this amplifier A2 is set during calibration to compensate for gain variations of all the other circuit elements 9 A low pass filter This filter is a 5th order Bessel low pass filter with fc = 37MHz adjusted so as to provide 180ordm of phase shift at 5MHz The phase shift of this filter together with the 180ordm phase shift of the inverting amplifier A1 provides the 360ordm of phase shift necessary for oscillation The low pass filter is required to suppress spurious oscillations which would occur due to the high bandwidth of the loop amplifiers The low pass filter attenuates a signal at 5MHz by about Af = -78dB (or 0407x) The motional resistance of the crystal at series resonance can now be computed The product of the gain (or attenuation) of all of the elements around the loop is exactly one when the circuit is oscillating at constant amplitude Hence Aa middot A1 middot At middot An middot A2 middot Af = 1
wwwthinkSRScom
Stanford Research Systems (408)744-9040
Rearranging and substituting the equation for An 1 An = ( Rs4 + Rm + RL ) RL = Aa middot (A1 middot At middot A2 middot Af ) Solving for Rm Rm = RL middot Aa middot (A1 middot At middot A2 middot Af ) ndash RL ndash Rs 4 From the characteristics of the voltage variable attenuator described above Aa = 10-Vc5 where Vc is the voltage at the Conductance output BNC on the QCM100 A2 is adjusted during factory calibration so that the product of the gains (A1 middot At middot A2 middot Af ) = 200 So we have
Rm = 10000 middot 10-Vc5 -75 Where Rm- motional series resonance resistance in Ω Vc- conductance voltage output in V
The motional resistance of the crystal at series resonance Rm can be
computed from the above equation Figure 6 below graphs Rm vs Vc
wwwthinkSRScom
Stanford Research Systems (408)744-9040
Figure 6 Motional series resonance resistance vs conductance voltage
Errors in the measurement of Rm Errors in the measurement of Rm will be less than 3Ω + 3 of Rm (for Rm lt 2kΩ) and are dominated by the departure of the voltage controlled attenuator from its nominal (voltagegain) characteristic Keep also in mind that the resistance measurement in liquids and soft films is also affected by temperature mostly through the temperature coefficient of the viscocity For example a 4ΩdegC drift in resistance is to be expected in water around room temperature Noise in the measurement of Rm Vc varies logarithmically with Rm over most of the range of interest There is an important advantage in this the fractional resolution of the resistance is nearly independent of the resistance and so allows detailed and low-noise
Motional Resistance vs Conductance VoltageRm = (10000 x 10^(-Vc5) - 75) Ohms
1
10
100
1000
10000
0 1 2 3 4 5 6 7 8 9 10 11
Conductance Voltage (Volts)
wwwthinkSRScom
Stanford Research Systems (408)744-9040
measurement of the viscous losses To estimate the noise in resistance measurements we can take the derivative of the equation for the motional resistance (units are Ohms and OhmsVolt) Rm = (10000 middot10-Vc5 -75) dRm dVc = 10000 middot 10 ndashVc5 middot ln (10) middot (-15)
= -2000 middot ln (10) middot 10 ndashVc5 asymp -4605 middot 10 ndashVc5
asymp -04605 middot (Rm + 75) Noise on the Vc signal ∆ Vc is typically plusmn 50microV (with one second averaging) The Rm for a 5MHz crystal in water is about 375Ω The fractional noise in the resistance measurement is then ∆∆∆∆RmRm = ∆Vc middot [dRm dVc ] Rm = ∆ Vc middot [-04605 middot (Rm + 75)] Rm = plusmn 28 ppm This low noise floor for fractional resistance measurements allows very small changes in dissipation losses to be measured This is also the reason why a high precision voltmeter (ie with at least six digits of resolution) is recommended for these measurements Calibration of Rm Resistance measurements for the QCM25 Crystal ControllerQCM100 are calibrated by replacing the crystal with a precision resistor in parallel with a 15pF capacitor Two resistor values are used 5110Ω and 1000kΩ The equation for Rm may be inverted to determine the calibration value for Vc (Motional resistance Rm in Ω and conductance voltage output Vc in volts) Rm = (10000 10-Vc5 - 75) Vc = 5 log [ 10000 (Rm + 75) ] The low pass filter is adjusted so that the QCM25 Crystal Controller oscillates at 5MHz with the 5110Ω resistor in place of the crystal The varactor dial is adjusted so that the Crystal Controller oscillates at 5MHz with the 1000kΩ resistor in place of the crystal Calibration potentiometers in the QCM25 Crystal Controller are adjusted so that Vc = 9496Vdc with a calibration resistor of 5110Ω and so that Vc = 4843Vdc with a calibration resistor of 1000kΩ
wwwthinkSRScom
Stanford Research Systems (408)744-9040
Gas-Phase Measurements The first use of QCMs was as mass sensors and thickness monitors in gas phase thin-film depositions To this date this continues to be one of the most important areas of application for this technology Sauerbrey Equation Sauerbreyrsquos equation (equation 1) is often used to calculate mass loadings and thin-film thicknesses in vacuum depositions The basic assumption is that the incremental change in mass from the foreign film is treated as though it were really an extension of the thickness of the underlying quartz The foreign film is considered rigid and so thin that it does not experience any shear forces during vibration As a result the sensitivity factor Cf is a fundamental property of the quartz crystal and does not consider any of the properties of the foreign film (ie it is only dependent on the acousto-elastic properties of quartz)
Cf = 2nfo2(ρqmicroq)12 (equation 3)
where n - number of the harmonic at which the crystal is driven fo - the resonant frequency of the fundamental mode of the crystal in Hz ρq - density of quartz ndash 2648 g cm-3 and microq - shear modulus of quartz - 29471011 gcm-1s-2
The dependence of the frequency change on the mass coverage per unit area emphasizes the fact that within certain limits the sensitivity factor is independent of the electrode geometry Thus in theory the QCM mass sensor does not require calibration for this application This ability to calculate mass loading from first principles is obviously a very active feature of these devices Film thickness is often the parameter of interest in gas-phase thin-film depositions If the mass coverage is believed to be uniform the thickness of the film is easily calculated dividing the mass per unit area provided by Sauerbreyrsquos equation by the materialrsquos density
Tf = ∆m ρf (equation 4) where ρf - density of film material in gcm3 ∆m - change in mass per unit area in gcm2 (calculated from Sauerbreyrsquos equation) and
wwwthinkSRScom
Stanford Research Systems (408)744-9040
Tf - Thickness of the film in cm
Z-match Method It is generally accepted that when the mass loading from the deposit causes a change in frequency of less than 2 of the frequency of the unloaded crystal Sauerbreyrsquos equation can be used to obtain accurate results in thin-film thickness calculations9 As the thickness of the film increases the Sauerbrey equation must be extended to incorporate the elasticity of the deposit Lu and Lewis10 gave a specially simple equation (equation 5) for the calculation of the dependence of ∆f on ∆m which is currently applied by most QCM users to calculate rigid thin-film thicknesses in gas phase depositions ∆m = [(Nq
ρq)(Π Z fL)] tan-1[ Z tan[Π (fU - fL) fU]] (equation 5) where ∆m - change in mass per unit area in gcm2 Nq - Frequency Constant for AT-cut quartz crystal 16681013 Hz Aring ρq - density of quartz 2648 g cm-3 ρf - density of film material in g cm-3 fU - Frequency of unloaded crystal (prior to deposition) in Hz fL - Frequency of loaded crystal in Hz microq -shear modulus of quartz 29471011 g cm-1 s-2 microf - shear modulus of film material and Z Z-Factor of film material = [(ρρρρq micromicromicromicroq) (ρρρρf micromicromicromicrof)]12
This analysis of frequency changes including the acoustic impedances of the quartz and film is often called the ldquoZ-matchrdquo method The accuracy of the mass load and film-thickness calculation is often limited by how well the Z-Factor and density of the material are known Density and Z-Factor values are typically very close to bulk values The bulk density and shear modulus values for common film materials can be found in many material reference handbooks The Lu and Lewis equation is generally considered to be a good match to the experimental results11 for frequency changes up to 40 (relative to the unloaded crystal) Keep also in mind that the Z-match equation strictly applies to ldquorigidrdquo deposits Films which behave viscoelastic such as some organic polymer films with large thickness or viscosity will exhibit significant deviations from both equations 1 and 5 Crystal failures are also often seen before a 40 shift in frequency is reached Common problems are (1) shorts in the crystal electrodes due to excessive buildup (2) mode hoping to other (anharmonic) resonant frequencies due to the
wwwthinkSRScom
Stanford Research Systems (408)744-9040
buildup of composite resonant modes (3) deviations from theory due to fringing electrode fields developed between the electrodes and the film (4) unexpected shifts in fundamental frequency due to stress build up on the crystal surface (5) spitting of source material resulting in non-uniform films etc
wwwthinkSRScom
Stanford Research Systems (408)744-9040
Liquid Contact Measurements Until recently its was believed that excessive viscous loading would prohibit use of the QCM in liquids In fact operation in liquids is indeed possible12 and the response of the QCM is still extremely sensitive to mass changes at the solid-solution interface For many years QCMs have been used in direct contact with liquids andor viscoelastic films to assess changes in mass and viscoelastic properties during chemical and electrochemical surface processes When the QCM comes in contact with a solution there is a decrease in frequency that is dependent upon the viscocity and the density of the solution A quantitative understanding of the resonator behavior is a prerequisite for proper interpretation of experimental results under total liquid immersion This problem was first treated by Glassford13 and later by Kanazawa and Gordon14 Kanazawarsquos treatment of the influence of the solution properties on the crystal (equation 6) permits the prediction of the change in resonance frequency which accompanies immersion of the crystal into a viscous medium
∆f = - fu32 [(ρL ηL) (Π
ρq microq)]12 (equation 6)
where fu - frequency of oscillation of unloaded crystal ρq - density of quartz ndash 2648 g cm-3 microq - shear modulus of quartz- 29471011 gcm-1s-2 ρL - density of the liquid in contact with the electrode and ηL - viscosity of the liquid in contact with the electrode
Viscous coupling of the liquid medium to the oscillating crystal surface results not only in a decrease in the series resonant frequency but also in damping of the resonant oscillation- the viscous loss is manifested as an increase in series resonance resistance R of the QCM resonator Thus R serves as an excellent independent measure of viscous loading by the medium (ie liquid or soft-film) at the crystalrsquos surface ∆f and ∆R measurements are both routinely used as independent indicators of mass loading and viscosity at the crystal-liquid interface of the QCM resonator during chemical and electrochemical depositions in solution15 In a separate study16 a Butterworth-Van Dyke equivalent circuit model (Figure 1) was applied to derive a linear relationship between the change in series resonance resistance ∆R of the quartz oscillator and (ρL
ηL)12 under liquid
loading
wwwthinkSRScom
Stanford Research Systems (408)744-9040
∆R = [n ωs Lu Π][ (2 ωs
ρL ηL) (ρq
microq)]12 (equation 7)
Where ∆R - change in series resonance resistance in Ω n - number of sides in contact with liquid ωs - angular frequency at series resonance(= 2Πfs where fs is the oscillation frequency in solution in Hz) and Lu - Inductance for the unperturbed (ie dry) resonator usually in mH
The QCM100 System was specifically designed for operation under heavy viscous loading The standard Crystal Holder supports operation in gas and liquid environments and provides single-electrode exposure to liquids17 (ie n =1 in equation 7) as required for compatibility with electrochemical QCM measurements The QCM25 Crystal Controller provides both frequency and resistance change signals and will maintain oscillation up to a series resonance resistance of about 5 KΩ (ie it will support crystal operation in highly viscous solutions up to 88 (ww) glycerol in water)
wwwthinkSRScom
Stanford Research Systems (408)744-9040
Figure 7 ∆f and ∆R versus glycerol weight percentage (in water) as predicted by theory and as measured with QCM100 and a 5MHz polished
crystal As an example equation 6 predicts a decrease in f0 of 715Hz on transfer from vacuum to pure water18 at 20degC in agreement with the results observed with a QCM100 using 1inch diameter polished 5MHz crystals mounted on a standard Crystal Holder Excellent agreement between the frequency and resistance equations and the experimental results has been proved19 making the QCM an
0
500
1000
1500
2000
2500
3000
3500
4000
4500
5000
0 10 20 30 40 50 60 70 80 90 100
Wt Glycerol
QCM100Theory
-12000
-11000
-10000
-9000
-8000
-7000
-6000
-5000
-4000
-3000
-2000
-1000
0
0 10 20 30 40 50 60 70 80 90 100
Wt glycerol
f H
zQCM100Theory
wwwthinkSRScom
Stanford Research Systems (408)744-9040
excellent tool for the evaluation of fluid properties Application examples include in situ monitoring of lubricant and petroleum properties20 The tight correspondence between theory (equations 6 amp 7) and experiment is clearly illustrated by Figure 7 Dissipation Technique An alternative method21 for studying the properties of the loaded QCM Sensor called the ldquoDissipation Techniquerdquo has been used in gaseous as well as in liquid environments In this case the crystal is driven at its resonant frequency by an oscillator that can be intermittently disconnected causing the crystal oscillation amplitude to decay exponentially From the recorded decay curve the absolute Q-factor (inversely proportional to R) and the frequency of the oscillator are simultaneously obtained Independent studies22 have shown that as long as the effect of the parasitic capacitance (C0) is properly cancelled the results provided by the Dissipation Technique should be in good agreement with the measurements provided by the QCM100 System
Temperature The intrinsic dependence of the resonant frequency of a quartz crystal on temperature is well known and generally quite small In fact the AT-cut quartz crystal commonly used in QCM experiments owe their popularity to their near zero coefficient at room temperature As a result the intrinsic temperature dependence of the QCM sensor crystals is negligible at or around room temperature (asymp 1-3 HzdegC) and is generally ignored for monolayer adsorptiondesorption processes in the gas phase Much larger changes in frequency with temperature are observed when QCM crystals are immersed in liquids This is due to the coupling of the shear mode oscillation with the temperature dependent viscosity and density of the fluid- the temperature coefficient due to this effect is asymp 8Hz ordmC for water As a result for experiments in liquid phase in which the frequency is to be monitored at length the temperature must be controlled to at least 01degC and preferably better In electrochemical experiments this is often achieved with temperature controlled baths and jacketed cells If temperature control is not possible or practical it is always good practice to wait at least 30 minutes before performing any accurate measurements after the crystal comes in contact with a new medium and measure the temperature of the solution around the crystal during the experiments to perform temperature compensation It is also common practice to soak the mounted crystal(s) in the solution overnight before performing any experiments to assure more stable readings Careful control of the temperature is required in high accuracy measurements to avoid frequency hysterisis effects- the dependence of resonator frequency at a
wwwthinkSRScom
Stanford Research Systems (408)744-9040
specific temperature on the prior temperature history of the resonator For example it is often observed that the frequency vs temperature curve obtained going from T1 to T2 will not coincide with the one obtained immediately after going from T2 to T1 This effect must be carefully considered during accurate determinations Each individual QCM user must determine the effect of temperature on the experiments being performed and either control the temperature accordingly or measure the temperature and compensate for it Electrode Polishing Electrode surface roughness can cause large apparent mass loadings due to the liquid that is trapped within pores at the crystal surface23 As a general rule optically polished crystals (50Aring average surface roughness) are required to obtain good agreement between theory and experiment during liquid immersion experiments The water immersion checkup test (below) provides a quick-and-easy way to test the crystal finish for liquid-QCM applications System Checkup A comparison against the theoretical predictions of equation 6 (amp7) is usually a good starting point when testing a new experimental liquid-QCM100 setup Two common ldquocheckuprdquo procedures are described diams Water Immersion For a 5MHz polished crystal and assuming that the
electrode capacitance has been properly cancelled a decrease in frequency of asymp715 Hz and an increase in series resonance resistance of asymp380 Ω is expected when switching from air to complete immersion in water at 20degC
diams GlycerolH2O Immersion Figure 7 shows resistance and frequency change values expected for a polished 5MHz crystal immersed in a series of viscous glycerolwater solutions at 20ordmC Operation at increasing glycerol concentrations is an excellent test of a QCM experimental setup and should provide predictable results up to more than 88 glycerol
In both procedures an agreement between measured and expected values within +- 25 is generally considered acceptable for glycerol concentrations up to 70 Frequency shifts are much larger (ie at least a factor of two) and unpredictable for unpolished crystals so they are not recommended for system checkup
wwwthinkSRScom
Stanford Research Systems (408)744-9040
Electrochemical Quartz Crystal Microbalance In most electrochemical experiments mass changes occur as material is deposited or lost from the ldquoworkingrdquo electrode It is of interest to monitor those changes simultaneously with the electrochemical response and the QCM is the standard means of doing so As a gravimetric probe the QCM has been used in many types of electrochemical studies including underpotential deposition of metals24 corrosion oxide formation dissolution studies25 adsorptiondesorption of surfactants26 and changes in conductive polymer films during redox processes27 The basic principles and applications of the QCM to electrochemical processes have been extensively reviewed in the electrochemical literature28 and will only be discussed briefly in this manual Please refer to the publications list at the end of this chapter for more detailed information Electrochemical Apparatus A schematic diagram of the apparatus for electrochemical quartz crystal microbalance (EQCM) experiments is given in Figure 8 In this example a 1inch diameter polished QCM crystal is mounted on a crystal holder with only one electrode exposed to the conductive solution The crystal holder is connected to a QCM25 Crystal Controller and the liquid-contact electrode is connected to the ldquoworking electroderdquo lead of the potentiostat (through the ldquoCrystal Face Biasrdquo connector of the QCM25 Crystal Controller) A QCM100 Analog Controller provides independent frequency and conductance outputs which are read and displayed by a frequency counter and a digital multimeter (or AD converter) respectively
wwwthinkSRScom
Stanford Research Systems (408)744-9040
Figure 8 Schematic of EQCM apparatus
A PC (not shown) is often interfaced to the potentiostat frequency counter and DMM and integrates the QCM and electrochemical data into a single software package Note The QCM25 Crystal Controller provides transformer isolation of the crystal front face electrode This allows direct electrical connection of the quartz crystal face to the ldquoworking electroderdquo pin of any standard potentiostatgalvanostat With the instrument in Figure 8 a typical cyclic voltammetric-EQCM experiment would involve the application of the electrochemical waveform to the working electrode and the simultaneous measurement of the current flowing through the electrochemical cell and the oscillation frequency and series resonance resistance of the crystal Figure 9 is an example of a typical voltammogram-massogram plot obtained from a 10mM solution of CuSO4 in 01M H2SO4 using a 1inch diameter Au coated quartz crystal mounted in a standard holder as the working electrode
Digital Multimeter
QCM25
Reference Electrode
Counter Electrode
Work Electrode
Potentiostat
QCM100 Analog Controller
Frequency Counter
Crystal Holder
wwwthinkSRScom
Stanford Research Systems (408)744-9040
Figure 9 Cyclic voltammogram and massogram data for Cu deposition on a Au
electrode The frequency ndashpotential diagram shows a frequency decrease in perfect sync with the deposition of Cu metal on the crystalrsquos surface
Calibration It has been amply demonstrated in the literature that when experiments involve only relative frequency shifts which are measured in a fixed solution the offset caused by the viscous loading of the liquid has negligible effect on the accuracy of the Sauerbrey equation for the determination of small mass changes in rigid deposits29 Quantitative interpretation of the EQCM data in those cases is based on the combination of the Sauerbrey equation (equation 1) and Faradayrsquos law The former relates change in frequency to change in mass for thin rigid deposits whereas the latter relates charge passed in an electrochemical experiment to the number of moles of material electrolyzed Therefore frequency changes can be related to the total charge passed An example would be the electrodeposition of Ag on a Pt electrode QCM crystal The charge Q is an integral measure of the total number of electrons delivered at the interface during the reduction process To the extent that each electron supplied results in the deposition of one atom of Ag there should be a linear relationship between Q and ∆f as is given by equation 8
∆f = 106 Mw Cf Q (n F A) (equation 8) where
wwwthinkSRScom
Stanford Research Systems (408)744-9040
∆f - frequency change in Hz Mw - apparent molar mass of the depositing species in gramsmole Cf - Sauerbreyrsquos sensitivity factor for the crystal used (see equation 1) Q - integrated charge during the reduction in Coulomb A - Active deposition area of the working (ie liquid contact) electrode in cm2 F - Faradayrsquos constant 9648 104 Coulombmole and n - number of electrons transferred to induce deposition (ie n =1 for Ag deposition) (The factor of 106 provides for the unit conversion from mg in Cf to g in Mw)
A plot of ldquo∆f vs Qrdquo will deliver the apparent mass per electron of the deposited species when n is taken into account This is often used to elucidate the mass changes that accompany redox processes and hence is very useful for characterizing the mechanisms of electron-transfer reactions However before any calculations can be performed based on equation 8 the EQCM must be calibrated in order to properly derive (1) the proportionality constant Cf of the Sauerbrey equation in solution and (2) to account for the effective area of the working electrode This is generally done using a well behaved electrochemical reaction- typically electrodeposition of silver copper or lead on a Au or Pt electrode The EQCM calibration method favored by Stanford Research Systems for its QCM100 system is based on the galvanostatic deposition of Ag A 50mM solution of AgNO3 in 05M HNO3 is subjected to a reducing potential and Ag is deposited with a fixed cathodic current density of 50-500 microAcm2 The cathodic current is integrated to obtain the charge as a function of time Excellent linearity is generally observed in ldquo∆f vs Qrdquo plots for depositions within 1 microgcm2 providing a very reliable way to calibrate the proportionality constant of equation 8 Several calibration procedures are also described in the electrochemistry literature30 and users are referred to the publications list at the end of this chapter for details Polymer Modified Electrodes The EQCM has been extensively used to study polymer modified electrodes particularly as a gravimetric tool to follow redox processes31 However for the linear frequency-to-mass relationship (described by equation 8) to hold true the polymer overlayer must exhibit no changes in rigidity during the electrochemical process Otherwise the viscoelastic changes will also contribute to the frequency change leading to an erroneous interpretation of the mass changes32 As a
wwwthinkSRScom
Stanford Research Systems (408)744-9040
consequence it is essential to determine whether or not viscoelastic properties of the polymer film influence the frequency measurement during polymer film experiments
Figure 10 Votammogram and massogram data for the oxidation of pyrrole to form a polypyrrole film on a gold coated QCM Sensor Crystal Seven cycles of
voltammetry between - 04 and 095 V were conducted in this experiment Pyrrole monomer can be oxidized to its radical at 065V As this happens a thin polypyrrole film is formed on the crystal surface resulting in a decrease in the
fundamental frequency of oscillation of the crystal The continuous growth of the film is evidenced by the irreversible decrease in frequency during the scans
A starightforward way to detect changes in film viscoelastic properties of redox films is to simultaneously monitor the series resonance resistance R of the quartz oscillator during the electrochemical experiment33 Some theoretical models34 based on the simultaneous measurement of ∆f and ∆R have been discussed in the literature for the extension of EQCM gravimetric measurements to non-rigid films The viscoelastic analyis of polymeric thin films in EQCM systems is complex because the shear wave exists simultaneously in the quartz crystal the viscoelastic film and the adjacent solution so reflection of the shear wave must be taken into account However solution of this problem would be worthwhile specially if the material properties of the film could be derived This would allow correlation of the electrochemical behavior of the film with its material properties35
01M Pyrrole in 01M HCLO4
wwwthinkSRScom
Stanford Research Systems (408)744-9040
The unique property of the QCM technique is its ability to determine the mass of very thin layers while simultaneously giving information about their viscoelastic properties The ability to measure both mass and structural changes means it is possible to detect phase-transitions cross-linking and swelling in polymeric thin films36
wwwthinkSRScom
Stanford Research Systems (408)744-9040
Chemical and Biological Sensors Anything that has mass can generate a response from a QCM sensor The universal response of the device is the reason for the wide range of application of the technology However the downside of such universal sensitivity is that you always have a great danger of interferences For analytical purposes it is imperative to find ways of getting the QCM sensor to respond only to what you are interested in (ie build sensitivity into the device) This usually involves the addition of a sensitive layer on the surface of the crystal37 Organic polymers comprise the most common type of coating used with QCM sensors due to their capability to reversibly sorb vapors and liquids38 In much of the work published on the use of polymer coatings for vapor sensing the acoustic properties of the polymer material have been neglected The relative importance of the mass-loading and viscoelastic contributions of the film to the observed QCM response is a subject that has yet to be resolved In no area have the QCM applications seen such dramatic increase in recent years as in the field of biochemical analysis QCM devices are routinely used as biochemical and immunological probes39 as well as for the investigation andor monitoring of biochemcially significant processes Sensitive selective detection of biochemically active compounds can be achieved by employing antigen-antibody40 enzyme substrates and other receptor ndashprotein pairs The potential analytical uses of these materials has been reviewed particularly with respect to the development of biochemical sensors41 QCM studies have provided detailed information about the functionalized surfaces developed for a range of biochip and biosensor applications QCM Systems are applied routinely by biologists and biochemists to obtain information about processes such as (1) protein adsorptiondesorption42 (2) cell adhesion43 (3) Protein-protein interaction (4) Degradation of polymers (5) biofouling and biofilm formation (6) drug analysis44 and (7) DNA Biosensors45
References 1 G Sauerbrey Z Phys 155 (1959) 206 2 Daniel Buttry ldquoApplications of the QCM to Electrochemistryrdquo in A Series of Advances in Electroanalytical Chemistry edited by Allen Bard Marcel Dekker 1991 p 23-33 3 John Henderson ldquoElectronic Devices Concepts and Applicationsrdquo Prentice Hall NJ (1991) p 357 4 For example QCM10 crystal holder with a 1inch 5MHz crystal connected directly to an SRS QCM25 Crystal Controller
wwwthinkSRScom
Stanford Research Systems (408)744-9040
5 C Chagnard P Gilbert N Watkins T Beeler and David W Paul ldquoAn electronic oscillator with automatic gain controlEQCM Applicationsrdquo Sensors and Actuators B 32(1996) 129-136 A Arnau T Sogorb and Y Jimenez ldquoCircuit for continuous motional series resonat frequency and motional resistance monitoring of quartz crystal resonators by parallel capacitance cancellationrdquo Rev Sci Instrum 73(7)(2002) 2724 6 For example from the Conductance Output of the QCM100 7 Conductance is the inverse of resistance Conductance = 1 Resistance or Resistance = 1 Conductance The units of resistance are Ohms [Ω = VA] and the units of conductance are Siemens (S = AV] 8 For example Agilent 34401A with 6 digit resolution or 3458 with eight digits resolution 9 DR Denison ldquoLinearity of a Heavily Loaded Quartz Crystal Microbalancerdquo J Vac Sci Technol 10(1) (1973) 126 Klaus H Behrndt ldquoLong Term Operation of Crystal Oscillators in Thin-Film Depositionrdquo J Vac Sci technol 8(5)(1971) 622 10 C Lu and O Lewis ldquoInvestigation of film-thickness determination by oscillating quartz resonators with large mass loadrdquo J Appl Phys 43 (1972) 4385 Chih-shun Lu ldquoMass determination with piezoelectric quartz crystal resonatorsrdquo J Vac Sci Technol 12(1) (1975) 578 11 D R Denison ldquoLinearity of Heavily Loaded Quartz Crystal Microbalancerdquo J Vac Sci Technol 10(1973) 126 K H Behrndt ldquoLong Term Operation of Crystal Oscillators in Thin-Film Depositionrdquo J Vac Sci Technol 8(5) (1971) 622 12 T Nomura and M Okuhara Anal Chim Acta 142(1982) 281 13 A P M Glassford ldquoResponse of a Quartz Crystal Microbalance to a liquid Depositrdquo J Vac Sci Technol 15(6)(1978) 1836 14 K Keiji Kanazawa and Joseph Gordon II ldquoFrequency of a Quartz Microbalance in Contact with Liquidrdquo Anal Chem 57(1985) 1770 K Keiji Kanazawa and Joseph G Gordon II Analytica Chimica Acta 175(1985) 99-105 15 Stephen J Martin James J Spates Kurt O Wesendorf thomas Schnneider and Robert J Huber ldquoResonator Oscillator Response to Liquid Loadingrdquo Anal Chem 69(1997) 2050 16 Stephen Martin Victoria Edwards Granstaff and Gregory C Frye ldquoCharacterization of a Quartz Crystal Microbalance with Simultaneous Mass and Liquid Loadingrdquo Anal Chem 63 (1991) 2272 17 Operation in liquids requires that the crystal be mounted in a holder such that only the front surface of the crystal is in contact with the fluid while at the same time providing an electrical connection to both electrodes 18 For pure water at 20C ρL 09982 g cm-3 and ηL 100210-2 g cm-1 s-1 19 H Muramatsu Eiichi Tamiya and Isao Karube ldquoComputation of Equivalent Circuit Parameters of Quartz Crystals in Contact with Liquids and Study of Liquid Propertiesrdquo Anal Chem 60(1988) 2142 SJ Geelhood C W Frank and K Kanazawa ldquoTransient Quartz Crystal Microbalance Behaviors Comparedrdquo Journal of the Electrochemical Society 149(2002) H33-H38 Mengsu Yang and Michael Thompson ldquoMultiple Chemical Information from the Thickness Shear Mode Acoustic Wave Sensor in the liquid Phaserdquo Anal Chem 65(1993) 1158
wwwthinkSRScom
Stanford Research Systems (408)744-9040
20 S J Martin R W Cernosek and JJ Spates ldquoSensing Liquid Properties with Shear-mode Resonator Sensorsrdquo in Proceeds from TransducersEurosensors IX Stockholm Sweden (1995) 21 Michael Rodahl Fredrik Hook Anatol Krozer Peter Brzezinski and Bengt Kasemo ldquoQCM setup for frequency and Q-factor measurements in gaseous and liquid environmentsrdquo Rev Sci Instrum 66(7)(1995)3924 22 S J Geelhood CW Frank and K Kanazawa ldquoTransient QCM Behaviors Comparedrdquo J of the Electrochemical Societyrdquo 149(1)(2002)H33 23 Stephen Martin et al rdquoEffect of Surface Roughness on the Response of Thickness-Shear Mode Resonators in Liquidsrdquo Anal Chem 65(1993)2910 Michael Ward and Edward J Delawski ldquoRadial Mass Sensitivity of the Quartz Crystal Microbalance in Liquid Mediardquo Anal Chem 63(1991) 886 24 Mark R Deakin and Owen Melroy ldquoUnderpotential Metal Deposition on Au monitorred in situ with a Quartz Microbalancerdquo J Electroanal Chem 239(1988) 321 O Melroy K Kanazawa JG Gordon II and D Buttry ldquoDirect Determination of the Mass of an Underpotentially Deposited Monolayer of Lead on Goldrdquo Langmuir 2(1986)697 Masahiro Seo Masaki Aomi and Kengo Yoshida ldquoA combined Piezoelectric and EQCM study of Underpotential Deposition of Silver on Gold Electrodesrdquo Electrochimica Acta 39(89) (1994) 1039 Youngran Lim and Euijin Hwang ldquoAn Electrochemical QCM study of Oxygen reducttion during the Underpotential Depoosition of Lead on a Gold Electroderdquo Bull Korean Chem Soc 17(12)(1996)1091 25 EQCMWall Jet Split-Ring Disk Electrode study on Copper dissolution in Chloride Aqueous solutionrdquo Anal Sciences16(2000)1049 Michael Benje Matthias Eiermann Udo Pittermann and Konrad G Weil ldquoAn improved Quartz Microbalnce Applications to Electrocrystallizatuion and dissolution of Niquelrdquo Ber Bunsenges Phys Chem 90(1986) 435 26 Jorg Auge Peter Hauptmann Frank Eichelbaum and Stephen Rosler ldquoQCM sensor in liquidsrdquo Sensors and Actuators B 18-19 (1994) 518 27 Adrian W Bott ldquoCharacterization of Films Immobilized on an Electrode Surface Using the EQCMrdquo Current Separations 183(1999)79 28 Mark Deakin and Daniel Buttry ldquoElectrochemical Applications of the Quartz Crystal Microbalancerdquo Anal Chem 61(20)(1989)183 Daniel Buttry and Michael Ward ldquoMeasurement of Interfacial Processes at electrode surfaces with the EQCMrdquo Chem Rev 92(6) (1992) 1355 29 Wolfgang Stockel and Rolf Schumacher ldquoIn situ Microweighing at the Junction MetalElectrolyterdquo Ber Bunsenges Phys Chem 91(1987)345 30 C Gabrielli M Keddam and R Torrei ldquoCalibration of the Electrochemical Quartz Crystal Microbalancerdquo J Electrochem Soc 139(9) (1991) 2657 Note A calibration procedure based on the deposition of Ag on Au electrodes is described Graeme Andrew Snook Investigation of Solid-State Reactions by Electrochemical and Quartz Crystal Microbalance Measurements PhD Thesis 2000 Department of Chemistry Monash University Clayton 3168 Melbourne Australia and Division of Minerals CSIRO Clayton South 3169 Melbourne Australia under the supervision of Professor Alan Maxwell Bond (Monash) and Professor Stephen Fletcher (CSIRO)
wwwthinkSRScom
Stanford Research Systems (408)744-9040
Available for download from httpwww-bondchemmonasheduautheses Note the use of Lead acetate is proposed as a better alternative to Cu and Ag deposition Bruckenstein S and Shay M ldquoExperimental aspects of use of the quartz crystal microbalance in solutionrdquo Electrochim Acta 30(1985) 1295 31 Duke Orata and Daniel A Buttry ldquoDetermination of Ion Populations and Solvent Content as fucntions of Redox State and pH in Polyanilinerdquo J Am Chem Soc 109(1987)3574 32 Michael Ward ldquoInvestigation of Open Circuit Reactions of Polymer Films Using the QCM Reactions of Polyvinylferrocene Filmsrdquo J Phys Chem 92(1988)2049 Charles K Baker and John R Reynolds ldquoA quartz microbalance study of the electrosynthesis of polypyrrolerdquo J Electroanal Chem 251(1988) 307 33 Stephen Martin Victoria Edwards Granstaff and Gregory C Frye ldquoCharacterization of a Quartz Crystal Microbalance with Simultaneouus Mass and Liquid Loadingrdquo Anal Chem 63 (1991) 2272 Ralf Lucklum and Peter Hauptmann ldquoThe Df-DR QCM technique an approach to an advanced sensor signal interpretationrdquo Electrochimica Acta 45(2000) 3907 34 RA Etchenique and E L CalvordquoGravimetric measurement in redox polymer electrodes with the EQCM beyond the Sauerbrey limitrdquo Electrochemistry Communications 1(5)(1999)167 RA Etchenique and E J Calvo ldquoElectrochemical Quartz Crystal Impedance Study of Redox Hydrogel Mediators for Amperometryic Enzyme Electrodesrdquo Anal Chem 69(1997)4833 35 E J Calvo R Etchenique P N Bartlett K Singhal and Santamaria ldquoQuartz Crystal Impedance studies at 10MHz of viscoelastic liquids and filmsrdquo Faraday Discuss107(1997)141 Diethelm Johannsmann ldquoViscoelastic Analysis of Organic Thin Filmsrdquo on quartz resonatorsrdquo Macromol Chem Phys 200(1999)501 36 C E Reed K Keiji Kanazawa and J Kaufman ldquoPhysical description of a viscoelastically loaded AT-cut quartz resonatorrdquo J Appl Phys 68(5) (1990) 1993 37 D S Ballantine R M White S J Martin A J Rico E T Zellers G C Frye and H Woltjen ldquoAcoustic Wave Sensors Theory Design and Physico-Chemical Applicationsrdquo Acad Press London UK 1997 Chapter 5 (Chemical and Biological Sensors) p 222 38 GG Guilbault and J Jordan ldquoAnalytical uses of piezoelectric crystalsrdquo CRC Reviews 19 p 1-28 W H King ldquoPiezoelectric Sorption Detectorrdquo Anal Chem 36 (1964) 1735 39 Iddo Ben-Dov and Itamar Willmer ldquoPiezoelectric Immunosensors for Urine Specimens of Chlamidia trachomatis Employing QCM Microgravimetric Analysisrdquo Anal Chem 69(1997) 3506 40 A Hengerer C Koumlsslinger1 J Decker S Hauck1 I Queitsch2 H Wolf and S Duumlbel2 ldquoDetermination of Phage Antibody Affinities to Antigen by a Microbalance Sensor Systemrdquo BioTechniques 26956-964 (May 1999) 41 G G Guibault ldquoAnalytical uses of immobilized Enzymes Modern Monographs in Analytical Chemistryrdquo Vol 2Marcel Dekker New York (1984) G M Minunni M Mascini GG Guilbault B Hock ldquoThe Quartz Crystal Microbalance as Biosensor A Status Report on its Futurerdquo Anal Lett 28 5(1995) 749 S Tombelli M Mascini ldquoPiezoelectric Quartz Crystal Biosensor Recent Immobilisation Schemesrdquo Anal Lett 33(11) 2000 pp 2129-2151
wwwthinkSRScom
Stanford Research Systems (408)744-9040
Kim R Rogers ldquoPrinciples of Affinity Based Biosensorsrdquo Molecular Biotechnology 14(2000)109 42 Fredrik Hook et al ldquoStructural changes in hemoglobin during adsorption to solid surfaces effects of pH ionic strength and ligand bindingrdquo Proc Natl Acad Sci USA 95(1998)12271 43 C Fredriksson S Kihlman M Rodahl and B Kasemo ldquoThe Piezoelectric Quartz crystal Mass and Dissipation Sensor A means of studyinng Cell adhesionrdquo Langmuir 19(1998) 248 Ann-Sofie Cans et al ldquoMeasurement of the Dynamics of Exocytosis and Vesicle Retrieval at Cell Populations Using a QCMrdquo Anal Chem 73(2001)5805 C A Keller and B KasemordquoSurface Specific Kinetics of Lipid Vesicle Adsorption Measured with a QCMrdquo Biophysical Journal 75(1998) 1397 44 Wei W Z et al ldquoSelective pharmaceutical analyis technique with sensitive piezoelectric quartz sensorsrdquo Anal Lett 26(11)(1993)2371 45 Storri S Santoni T Mascini MrdquoA piezoelectric biosensor for DNA hybridization detectionrdquo Anal Lett 31(11)(1998)1795
wwwthinkSRScom
Stanford Research Systems (408)744-9040
Rearranging and substituting the equation for An 1 An = ( Rs4 + Rm + RL ) RL = Aa middot (A1 middot At middot A2 middot Af ) Solving for Rm Rm = RL middot Aa middot (A1 middot At middot A2 middot Af ) ndash RL ndash Rs 4 From the characteristics of the voltage variable attenuator described above Aa = 10-Vc5 where Vc is the voltage at the Conductance output BNC on the QCM100 A2 is adjusted during factory calibration so that the product of the gains (A1 middot At middot A2 middot Af ) = 200 So we have
Rm = 10000 middot 10-Vc5 -75 Where Rm- motional series resonance resistance in Ω Vc- conductance voltage output in V
The motional resistance of the crystal at series resonance Rm can be
computed from the above equation Figure 6 below graphs Rm vs Vc
wwwthinkSRScom
Stanford Research Systems (408)744-9040
Figure 6 Motional series resonance resistance vs conductance voltage
Errors in the measurement of Rm Errors in the measurement of Rm will be less than 3Ω + 3 of Rm (for Rm lt 2kΩ) and are dominated by the departure of the voltage controlled attenuator from its nominal (voltagegain) characteristic Keep also in mind that the resistance measurement in liquids and soft films is also affected by temperature mostly through the temperature coefficient of the viscocity For example a 4ΩdegC drift in resistance is to be expected in water around room temperature Noise in the measurement of Rm Vc varies logarithmically with Rm over most of the range of interest There is an important advantage in this the fractional resolution of the resistance is nearly independent of the resistance and so allows detailed and low-noise
Motional Resistance vs Conductance VoltageRm = (10000 x 10^(-Vc5) - 75) Ohms
1
10
100
1000
10000
0 1 2 3 4 5 6 7 8 9 10 11
Conductance Voltage (Volts)
wwwthinkSRScom
Stanford Research Systems (408)744-9040
measurement of the viscous losses To estimate the noise in resistance measurements we can take the derivative of the equation for the motional resistance (units are Ohms and OhmsVolt) Rm = (10000 middot10-Vc5 -75) dRm dVc = 10000 middot 10 ndashVc5 middot ln (10) middot (-15)
= -2000 middot ln (10) middot 10 ndashVc5 asymp -4605 middot 10 ndashVc5
asymp -04605 middot (Rm + 75) Noise on the Vc signal ∆ Vc is typically plusmn 50microV (with one second averaging) The Rm for a 5MHz crystal in water is about 375Ω The fractional noise in the resistance measurement is then ∆∆∆∆RmRm = ∆Vc middot [dRm dVc ] Rm = ∆ Vc middot [-04605 middot (Rm + 75)] Rm = plusmn 28 ppm This low noise floor for fractional resistance measurements allows very small changes in dissipation losses to be measured This is also the reason why a high precision voltmeter (ie with at least six digits of resolution) is recommended for these measurements Calibration of Rm Resistance measurements for the QCM25 Crystal ControllerQCM100 are calibrated by replacing the crystal with a precision resistor in parallel with a 15pF capacitor Two resistor values are used 5110Ω and 1000kΩ The equation for Rm may be inverted to determine the calibration value for Vc (Motional resistance Rm in Ω and conductance voltage output Vc in volts) Rm = (10000 10-Vc5 - 75) Vc = 5 log [ 10000 (Rm + 75) ] The low pass filter is adjusted so that the QCM25 Crystal Controller oscillates at 5MHz with the 5110Ω resistor in place of the crystal The varactor dial is adjusted so that the Crystal Controller oscillates at 5MHz with the 1000kΩ resistor in place of the crystal Calibration potentiometers in the QCM25 Crystal Controller are adjusted so that Vc = 9496Vdc with a calibration resistor of 5110Ω and so that Vc = 4843Vdc with a calibration resistor of 1000kΩ
wwwthinkSRScom
Stanford Research Systems (408)744-9040
Gas-Phase Measurements The first use of QCMs was as mass sensors and thickness monitors in gas phase thin-film depositions To this date this continues to be one of the most important areas of application for this technology Sauerbrey Equation Sauerbreyrsquos equation (equation 1) is often used to calculate mass loadings and thin-film thicknesses in vacuum depositions The basic assumption is that the incremental change in mass from the foreign film is treated as though it were really an extension of the thickness of the underlying quartz The foreign film is considered rigid and so thin that it does not experience any shear forces during vibration As a result the sensitivity factor Cf is a fundamental property of the quartz crystal and does not consider any of the properties of the foreign film (ie it is only dependent on the acousto-elastic properties of quartz)
Cf = 2nfo2(ρqmicroq)12 (equation 3)
where n - number of the harmonic at which the crystal is driven fo - the resonant frequency of the fundamental mode of the crystal in Hz ρq - density of quartz ndash 2648 g cm-3 and microq - shear modulus of quartz - 29471011 gcm-1s-2
The dependence of the frequency change on the mass coverage per unit area emphasizes the fact that within certain limits the sensitivity factor is independent of the electrode geometry Thus in theory the QCM mass sensor does not require calibration for this application This ability to calculate mass loading from first principles is obviously a very active feature of these devices Film thickness is often the parameter of interest in gas-phase thin-film depositions If the mass coverage is believed to be uniform the thickness of the film is easily calculated dividing the mass per unit area provided by Sauerbreyrsquos equation by the materialrsquos density
Tf = ∆m ρf (equation 4) where ρf - density of film material in gcm3 ∆m - change in mass per unit area in gcm2 (calculated from Sauerbreyrsquos equation) and
wwwthinkSRScom
Stanford Research Systems (408)744-9040
Tf - Thickness of the film in cm
Z-match Method It is generally accepted that when the mass loading from the deposit causes a change in frequency of less than 2 of the frequency of the unloaded crystal Sauerbreyrsquos equation can be used to obtain accurate results in thin-film thickness calculations9 As the thickness of the film increases the Sauerbrey equation must be extended to incorporate the elasticity of the deposit Lu and Lewis10 gave a specially simple equation (equation 5) for the calculation of the dependence of ∆f on ∆m which is currently applied by most QCM users to calculate rigid thin-film thicknesses in gas phase depositions ∆m = [(Nq
ρq)(Π Z fL)] tan-1[ Z tan[Π (fU - fL) fU]] (equation 5) where ∆m - change in mass per unit area in gcm2 Nq - Frequency Constant for AT-cut quartz crystal 16681013 Hz Aring ρq - density of quartz 2648 g cm-3 ρf - density of film material in g cm-3 fU - Frequency of unloaded crystal (prior to deposition) in Hz fL - Frequency of loaded crystal in Hz microq -shear modulus of quartz 29471011 g cm-1 s-2 microf - shear modulus of film material and Z Z-Factor of film material = [(ρρρρq micromicromicromicroq) (ρρρρf micromicromicromicrof)]12
This analysis of frequency changes including the acoustic impedances of the quartz and film is often called the ldquoZ-matchrdquo method The accuracy of the mass load and film-thickness calculation is often limited by how well the Z-Factor and density of the material are known Density and Z-Factor values are typically very close to bulk values The bulk density and shear modulus values for common film materials can be found in many material reference handbooks The Lu and Lewis equation is generally considered to be a good match to the experimental results11 for frequency changes up to 40 (relative to the unloaded crystal) Keep also in mind that the Z-match equation strictly applies to ldquorigidrdquo deposits Films which behave viscoelastic such as some organic polymer films with large thickness or viscosity will exhibit significant deviations from both equations 1 and 5 Crystal failures are also often seen before a 40 shift in frequency is reached Common problems are (1) shorts in the crystal electrodes due to excessive buildup (2) mode hoping to other (anharmonic) resonant frequencies due to the
wwwthinkSRScom
Stanford Research Systems (408)744-9040
buildup of composite resonant modes (3) deviations from theory due to fringing electrode fields developed between the electrodes and the film (4) unexpected shifts in fundamental frequency due to stress build up on the crystal surface (5) spitting of source material resulting in non-uniform films etc
wwwthinkSRScom
Stanford Research Systems (408)744-9040
Liquid Contact Measurements Until recently its was believed that excessive viscous loading would prohibit use of the QCM in liquids In fact operation in liquids is indeed possible12 and the response of the QCM is still extremely sensitive to mass changes at the solid-solution interface For many years QCMs have been used in direct contact with liquids andor viscoelastic films to assess changes in mass and viscoelastic properties during chemical and electrochemical surface processes When the QCM comes in contact with a solution there is a decrease in frequency that is dependent upon the viscocity and the density of the solution A quantitative understanding of the resonator behavior is a prerequisite for proper interpretation of experimental results under total liquid immersion This problem was first treated by Glassford13 and later by Kanazawa and Gordon14 Kanazawarsquos treatment of the influence of the solution properties on the crystal (equation 6) permits the prediction of the change in resonance frequency which accompanies immersion of the crystal into a viscous medium
∆f = - fu32 [(ρL ηL) (Π
ρq microq)]12 (equation 6)
where fu - frequency of oscillation of unloaded crystal ρq - density of quartz ndash 2648 g cm-3 microq - shear modulus of quartz- 29471011 gcm-1s-2 ρL - density of the liquid in contact with the electrode and ηL - viscosity of the liquid in contact with the electrode
Viscous coupling of the liquid medium to the oscillating crystal surface results not only in a decrease in the series resonant frequency but also in damping of the resonant oscillation- the viscous loss is manifested as an increase in series resonance resistance R of the QCM resonator Thus R serves as an excellent independent measure of viscous loading by the medium (ie liquid or soft-film) at the crystalrsquos surface ∆f and ∆R measurements are both routinely used as independent indicators of mass loading and viscosity at the crystal-liquid interface of the QCM resonator during chemical and electrochemical depositions in solution15 In a separate study16 a Butterworth-Van Dyke equivalent circuit model (Figure 1) was applied to derive a linear relationship between the change in series resonance resistance ∆R of the quartz oscillator and (ρL
ηL)12 under liquid
loading
wwwthinkSRScom
Stanford Research Systems (408)744-9040
∆R = [n ωs Lu Π][ (2 ωs
ρL ηL) (ρq
microq)]12 (equation 7)
Where ∆R - change in series resonance resistance in Ω n - number of sides in contact with liquid ωs - angular frequency at series resonance(= 2Πfs where fs is the oscillation frequency in solution in Hz) and Lu - Inductance for the unperturbed (ie dry) resonator usually in mH
The QCM100 System was specifically designed for operation under heavy viscous loading The standard Crystal Holder supports operation in gas and liquid environments and provides single-electrode exposure to liquids17 (ie n =1 in equation 7) as required for compatibility with electrochemical QCM measurements The QCM25 Crystal Controller provides both frequency and resistance change signals and will maintain oscillation up to a series resonance resistance of about 5 KΩ (ie it will support crystal operation in highly viscous solutions up to 88 (ww) glycerol in water)
wwwthinkSRScom
Stanford Research Systems (408)744-9040
Figure 7 ∆f and ∆R versus glycerol weight percentage (in water) as predicted by theory and as measured with QCM100 and a 5MHz polished
crystal As an example equation 6 predicts a decrease in f0 of 715Hz on transfer from vacuum to pure water18 at 20degC in agreement with the results observed with a QCM100 using 1inch diameter polished 5MHz crystals mounted on a standard Crystal Holder Excellent agreement between the frequency and resistance equations and the experimental results has been proved19 making the QCM an
0
500
1000
1500
2000
2500
3000
3500
4000
4500
5000
0 10 20 30 40 50 60 70 80 90 100
Wt Glycerol
QCM100Theory
-12000
-11000
-10000
-9000
-8000
-7000
-6000
-5000
-4000
-3000
-2000
-1000
0
0 10 20 30 40 50 60 70 80 90 100
Wt glycerol
f H
zQCM100Theory
wwwthinkSRScom
Stanford Research Systems (408)744-9040
excellent tool for the evaluation of fluid properties Application examples include in situ monitoring of lubricant and petroleum properties20 The tight correspondence between theory (equations 6 amp 7) and experiment is clearly illustrated by Figure 7 Dissipation Technique An alternative method21 for studying the properties of the loaded QCM Sensor called the ldquoDissipation Techniquerdquo has been used in gaseous as well as in liquid environments In this case the crystal is driven at its resonant frequency by an oscillator that can be intermittently disconnected causing the crystal oscillation amplitude to decay exponentially From the recorded decay curve the absolute Q-factor (inversely proportional to R) and the frequency of the oscillator are simultaneously obtained Independent studies22 have shown that as long as the effect of the parasitic capacitance (C0) is properly cancelled the results provided by the Dissipation Technique should be in good agreement with the measurements provided by the QCM100 System
Temperature The intrinsic dependence of the resonant frequency of a quartz crystal on temperature is well known and generally quite small In fact the AT-cut quartz crystal commonly used in QCM experiments owe their popularity to their near zero coefficient at room temperature As a result the intrinsic temperature dependence of the QCM sensor crystals is negligible at or around room temperature (asymp 1-3 HzdegC) and is generally ignored for monolayer adsorptiondesorption processes in the gas phase Much larger changes in frequency with temperature are observed when QCM crystals are immersed in liquids This is due to the coupling of the shear mode oscillation with the temperature dependent viscosity and density of the fluid- the temperature coefficient due to this effect is asymp 8Hz ordmC for water As a result for experiments in liquid phase in which the frequency is to be monitored at length the temperature must be controlled to at least 01degC and preferably better In electrochemical experiments this is often achieved with temperature controlled baths and jacketed cells If temperature control is not possible or practical it is always good practice to wait at least 30 minutes before performing any accurate measurements after the crystal comes in contact with a new medium and measure the temperature of the solution around the crystal during the experiments to perform temperature compensation It is also common practice to soak the mounted crystal(s) in the solution overnight before performing any experiments to assure more stable readings Careful control of the temperature is required in high accuracy measurements to avoid frequency hysterisis effects- the dependence of resonator frequency at a
wwwthinkSRScom
Stanford Research Systems (408)744-9040
specific temperature on the prior temperature history of the resonator For example it is often observed that the frequency vs temperature curve obtained going from T1 to T2 will not coincide with the one obtained immediately after going from T2 to T1 This effect must be carefully considered during accurate determinations Each individual QCM user must determine the effect of temperature on the experiments being performed and either control the temperature accordingly or measure the temperature and compensate for it Electrode Polishing Electrode surface roughness can cause large apparent mass loadings due to the liquid that is trapped within pores at the crystal surface23 As a general rule optically polished crystals (50Aring average surface roughness) are required to obtain good agreement between theory and experiment during liquid immersion experiments The water immersion checkup test (below) provides a quick-and-easy way to test the crystal finish for liquid-QCM applications System Checkup A comparison against the theoretical predictions of equation 6 (amp7) is usually a good starting point when testing a new experimental liquid-QCM100 setup Two common ldquocheckuprdquo procedures are described diams Water Immersion For a 5MHz polished crystal and assuming that the
electrode capacitance has been properly cancelled a decrease in frequency of asymp715 Hz and an increase in series resonance resistance of asymp380 Ω is expected when switching from air to complete immersion in water at 20degC
diams GlycerolH2O Immersion Figure 7 shows resistance and frequency change values expected for a polished 5MHz crystal immersed in a series of viscous glycerolwater solutions at 20ordmC Operation at increasing glycerol concentrations is an excellent test of a QCM experimental setup and should provide predictable results up to more than 88 glycerol
In both procedures an agreement between measured and expected values within +- 25 is generally considered acceptable for glycerol concentrations up to 70 Frequency shifts are much larger (ie at least a factor of two) and unpredictable for unpolished crystals so they are not recommended for system checkup
wwwthinkSRScom
Stanford Research Systems (408)744-9040
Electrochemical Quartz Crystal Microbalance In most electrochemical experiments mass changes occur as material is deposited or lost from the ldquoworkingrdquo electrode It is of interest to monitor those changes simultaneously with the electrochemical response and the QCM is the standard means of doing so As a gravimetric probe the QCM has been used in many types of electrochemical studies including underpotential deposition of metals24 corrosion oxide formation dissolution studies25 adsorptiondesorption of surfactants26 and changes in conductive polymer films during redox processes27 The basic principles and applications of the QCM to electrochemical processes have been extensively reviewed in the electrochemical literature28 and will only be discussed briefly in this manual Please refer to the publications list at the end of this chapter for more detailed information Electrochemical Apparatus A schematic diagram of the apparatus for electrochemical quartz crystal microbalance (EQCM) experiments is given in Figure 8 In this example a 1inch diameter polished QCM crystal is mounted on a crystal holder with only one electrode exposed to the conductive solution The crystal holder is connected to a QCM25 Crystal Controller and the liquid-contact electrode is connected to the ldquoworking electroderdquo lead of the potentiostat (through the ldquoCrystal Face Biasrdquo connector of the QCM25 Crystal Controller) A QCM100 Analog Controller provides independent frequency and conductance outputs which are read and displayed by a frequency counter and a digital multimeter (or AD converter) respectively
wwwthinkSRScom
Stanford Research Systems (408)744-9040
Figure 8 Schematic of EQCM apparatus
A PC (not shown) is often interfaced to the potentiostat frequency counter and DMM and integrates the QCM and electrochemical data into a single software package Note The QCM25 Crystal Controller provides transformer isolation of the crystal front face electrode This allows direct electrical connection of the quartz crystal face to the ldquoworking electroderdquo pin of any standard potentiostatgalvanostat With the instrument in Figure 8 a typical cyclic voltammetric-EQCM experiment would involve the application of the electrochemical waveform to the working electrode and the simultaneous measurement of the current flowing through the electrochemical cell and the oscillation frequency and series resonance resistance of the crystal Figure 9 is an example of a typical voltammogram-massogram plot obtained from a 10mM solution of CuSO4 in 01M H2SO4 using a 1inch diameter Au coated quartz crystal mounted in a standard holder as the working electrode
Digital Multimeter
QCM25
Reference Electrode
Counter Electrode
Work Electrode
Potentiostat
QCM100 Analog Controller
Frequency Counter
Crystal Holder
wwwthinkSRScom
Stanford Research Systems (408)744-9040
Figure 9 Cyclic voltammogram and massogram data for Cu deposition on a Au
electrode The frequency ndashpotential diagram shows a frequency decrease in perfect sync with the deposition of Cu metal on the crystalrsquos surface
Calibration It has been amply demonstrated in the literature that when experiments involve only relative frequency shifts which are measured in a fixed solution the offset caused by the viscous loading of the liquid has negligible effect on the accuracy of the Sauerbrey equation for the determination of small mass changes in rigid deposits29 Quantitative interpretation of the EQCM data in those cases is based on the combination of the Sauerbrey equation (equation 1) and Faradayrsquos law The former relates change in frequency to change in mass for thin rigid deposits whereas the latter relates charge passed in an electrochemical experiment to the number of moles of material electrolyzed Therefore frequency changes can be related to the total charge passed An example would be the electrodeposition of Ag on a Pt electrode QCM crystal The charge Q is an integral measure of the total number of electrons delivered at the interface during the reduction process To the extent that each electron supplied results in the deposition of one atom of Ag there should be a linear relationship between Q and ∆f as is given by equation 8
∆f = 106 Mw Cf Q (n F A) (equation 8) where
wwwthinkSRScom
Stanford Research Systems (408)744-9040
∆f - frequency change in Hz Mw - apparent molar mass of the depositing species in gramsmole Cf - Sauerbreyrsquos sensitivity factor for the crystal used (see equation 1) Q - integrated charge during the reduction in Coulomb A - Active deposition area of the working (ie liquid contact) electrode in cm2 F - Faradayrsquos constant 9648 104 Coulombmole and n - number of electrons transferred to induce deposition (ie n =1 for Ag deposition) (The factor of 106 provides for the unit conversion from mg in Cf to g in Mw)
A plot of ldquo∆f vs Qrdquo will deliver the apparent mass per electron of the deposited species when n is taken into account This is often used to elucidate the mass changes that accompany redox processes and hence is very useful for characterizing the mechanisms of electron-transfer reactions However before any calculations can be performed based on equation 8 the EQCM must be calibrated in order to properly derive (1) the proportionality constant Cf of the Sauerbrey equation in solution and (2) to account for the effective area of the working electrode This is generally done using a well behaved electrochemical reaction- typically electrodeposition of silver copper or lead on a Au or Pt electrode The EQCM calibration method favored by Stanford Research Systems for its QCM100 system is based on the galvanostatic deposition of Ag A 50mM solution of AgNO3 in 05M HNO3 is subjected to a reducing potential and Ag is deposited with a fixed cathodic current density of 50-500 microAcm2 The cathodic current is integrated to obtain the charge as a function of time Excellent linearity is generally observed in ldquo∆f vs Qrdquo plots for depositions within 1 microgcm2 providing a very reliable way to calibrate the proportionality constant of equation 8 Several calibration procedures are also described in the electrochemistry literature30 and users are referred to the publications list at the end of this chapter for details Polymer Modified Electrodes The EQCM has been extensively used to study polymer modified electrodes particularly as a gravimetric tool to follow redox processes31 However for the linear frequency-to-mass relationship (described by equation 8) to hold true the polymer overlayer must exhibit no changes in rigidity during the electrochemical process Otherwise the viscoelastic changes will also contribute to the frequency change leading to an erroneous interpretation of the mass changes32 As a
wwwthinkSRScom
Stanford Research Systems (408)744-9040
consequence it is essential to determine whether or not viscoelastic properties of the polymer film influence the frequency measurement during polymer film experiments
Figure 10 Votammogram and massogram data for the oxidation of pyrrole to form a polypyrrole film on a gold coated QCM Sensor Crystal Seven cycles of
voltammetry between - 04 and 095 V were conducted in this experiment Pyrrole monomer can be oxidized to its radical at 065V As this happens a thin polypyrrole film is formed on the crystal surface resulting in a decrease in the
fundamental frequency of oscillation of the crystal The continuous growth of the film is evidenced by the irreversible decrease in frequency during the scans
A starightforward way to detect changes in film viscoelastic properties of redox films is to simultaneously monitor the series resonance resistance R of the quartz oscillator during the electrochemical experiment33 Some theoretical models34 based on the simultaneous measurement of ∆f and ∆R have been discussed in the literature for the extension of EQCM gravimetric measurements to non-rigid films The viscoelastic analyis of polymeric thin films in EQCM systems is complex because the shear wave exists simultaneously in the quartz crystal the viscoelastic film and the adjacent solution so reflection of the shear wave must be taken into account However solution of this problem would be worthwhile specially if the material properties of the film could be derived This would allow correlation of the electrochemical behavior of the film with its material properties35
01M Pyrrole in 01M HCLO4
wwwthinkSRScom
Stanford Research Systems (408)744-9040
The unique property of the QCM technique is its ability to determine the mass of very thin layers while simultaneously giving information about their viscoelastic properties The ability to measure both mass and structural changes means it is possible to detect phase-transitions cross-linking and swelling in polymeric thin films36
wwwthinkSRScom
Stanford Research Systems (408)744-9040
Chemical and Biological Sensors Anything that has mass can generate a response from a QCM sensor The universal response of the device is the reason for the wide range of application of the technology However the downside of such universal sensitivity is that you always have a great danger of interferences For analytical purposes it is imperative to find ways of getting the QCM sensor to respond only to what you are interested in (ie build sensitivity into the device) This usually involves the addition of a sensitive layer on the surface of the crystal37 Organic polymers comprise the most common type of coating used with QCM sensors due to their capability to reversibly sorb vapors and liquids38 In much of the work published on the use of polymer coatings for vapor sensing the acoustic properties of the polymer material have been neglected The relative importance of the mass-loading and viscoelastic contributions of the film to the observed QCM response is a subject that has yet to be resolved In no area have the QCM applications seen such dramatic increase in recent years as in the field of biochemical analysis QCM devices are routinely used as biochemical and immunological probes39 as well as for the investigation andor monitoring of biochemcially significant processes Sensitive selective detection of biochemically active compounds can be achieved by employing antigen-antibody40 enzyme substrates and other receptor ndashprotein pairs The potential analytical uses of these materials has been reviewed particularly with respect to the development of biochemical sensors41 QCM studies have provided detailed information about the functionalized surfaces developed for a range of biochip and biosensor applications QCM Systems are applied routinely by biologists and biochemists to obtain information about processes such as (1) protein adsorptiondesorption42 (2) cell adhesion43 (3) Protein-protein interaction (4) Degradation of polymers (5) biofouling and biofilm formation (6) drug analysis44 and (7) DNA Biosensors45
References 1 G Sauerbrey Z Phys 155 (1959) 206 2 Daniel Buttry ldquoApplications of the QCM to Electrochemistryrdquo in A Series of Advances in Electroanalytical Chemistry edited by Allen Bard Marcel Dekker 1991 p 23-33 3 John Henderson ldquoElectronic Devices Concepts and Applicationsrdquo Prentice Hall NJ (1991) p 357 4 For example QCM10 crystal holder with a 1inch 5MHz crystal connected directly to an SRS QCM25 Crystal Controller
wwwthinkSRScom
Stanford Research Systems (408)744-9040
5 C Chagnard P Gilbert N Watkins T Beeler and David W Paul ldquoAn electronic oscillator with automatic gain controlEQCM Applicationsrdquo Sensors and Actuators B 32(1996) 129-136 A Arnau T Sogorb and Y Jimenez ldquoCircuit for continuous motional series resonat frequency and motional resistance monitoring of quartz crystal resonators by parallel capacitance cancellationrdquo Rev Sci Instrum 73(7)(2002) 2724 6 For example from the Conductance Output of the QCM100 7 Conductance is the inverse of resistance Conductance = 1 Resistance or Resistance = 1 Conductance The units of resistance are Ohms [Ω = VA] and the units of conductance are Siemens (S = AV] 8 For example Agilent 34401A with 6 digit resolution or 3458 with eight digits resolution 9 DR Denison ldquoLinearity of a Heavily Loaded Quartz Crystal Microbalancerdquo J Vac Sci Technol 10(1) (1973) 126 Klaus H Behrndt ldquoLong Term Operation of Crystal Oscillators in Thin-Film Depositionrdquo J Vac Sci technol 8(5)(1971) 622 10 C Lu and O Lewis ldquoInvestigation of film-thickness determination by oscillating quartz resonators with large mass loadrdquo J Appl Phys 43 (1972) 4385 Chih-shun Lu ldquoMass determination with piezoelectric quartz crystal resonatorsrdquo J Vac Sci Technol 12(1) (1975) 578 11 D R Denison ldquoLinearity of Heavily Loaded Quartz Crystal Microbalancerdquo J Vac Sci Technol 10(1973) 126 K H Behrndt ldquoLong Term Operation of Crystal Oscillators in Thin-Film Depositionrdquo J Vac Sci Technol 8(5) (1971) 622 12 T Nomura and M Okuhara Anal Chim Acta 142(1982) 281 13 A P M Glassford ldquoResponse of a Quartz Crystal Microbalance to a liquid Depositrdquo J Vac Sci Technol 15(6)(1978) 1836 14 K Keiji Kanazawa and Joseph Gordon II ldquoFrequency of a Quartz Microbalance in Contact with Liquidrdquo Anal Chem 57(1985) 1770 K Keiji Kanazawa and Joseph G Gordon II Analytica Chimica Acta 175(1985) 99-105 15 Stephen J Martin James J Spates Kurt O Wesendorf thomas Schnneider and Robert J Huber ldquoResonator Oscillator Response to Liquid Loadingrdquo Anal Chem 69(1997) 2050 16 Stephen Martin Victoria Edwards Granstaff and Gregory C Frye ldquoCharacterization of a Quartz Crystal Microbalance with Simultaneous Mass and Liquid Loadingrdquo Anal Chem 63 (1991) 2272 17 Operation in liquids requires that the crystal be mounted in a holder such that only the front surface of the crystal is in contact with the fluid while at the same time providing an electrical connection to both electrodes 18 For pure water at 20C ρL 09982 g cm-3 and ηL 100210-2 g cm-1 s-1 19 H Muramatsu Eiichi Tamiya and Isao Karube ldquoComputation of Equivalent Circuit Parameters of Quartz Crystals in Contact with Liquids and Study of Liquid Propertiesrdquo Anal Chem 60(1988) 2142 SJ Geelhood C W Frank and K Kanazawa ldquoTransient Quartz Crystal Microbalance Behaviors Comparedrdquo Journal of the Electrochemical Society 149(2002) H33-H38 Mengsu Yang and Michael Thompson ldquoMultiple Chemical Information from the Thickness Shear Mode Acoustic Wave Sensor in the liquid Phaserdquo Anal Chem 65(1993) 1158
wwwthinkSRScom
Stanford Research Systems (408)744-9040
20 S J Martin R W Cernosek and JJ Spates ldquoSensing Liquid Properties with Shear-mode Resonator Sensorsrdquo in Proceeds from TransducersEurosensors IX Stockholm Sweden (1995) 21 Michael Rodahl Fredrik Hook Anatol Krozer Peter Brzezinski and Bengt Kasemo ldquoQCM setup for frequency and Q-factor measurements in gaseous and liquid environmentsrdquo Rev Sci Instrum 66(7)(1995)3924 22 S J Geelhood CW Frank and K Kanazawa ldquoTransient QCM Behaviors Comparedrdquo J of the Electrochemical Societyrdquo 149(1)(2002)H33 23 Stephen Martin et al rdquoEffect of Surface Roughness on the Response of Thickness-Shear Mode Resonators in Liquidsrdquo Anal Chem 65(1993)2910 Michael Ward and Edward J Delawski ldquoRadial Mass Sensitivity of the Quartz Crystal Microbalance in Liquid Mediardquo Anal Chem 63(1991) 886 24 Mark R Deakin and Owen Melroy ldquoUnderpotential Metal Deposition on Au monitorred in situ with a Quartz Microbalancerdquo J Electroanal Chem 239(1988) 321 O Melroy K Kanazawa JG Gordon II and D Buttry ldquoDirect Determination of the Mass of an Underpotentially Deposited Monolayer of Lead on Goldrdquo Langmuir 2(1986)697 Masahiro Seo Masaki Aomi and Kengo Yoshida ldquoA combined Piezoelectric and EQCM study of Underpotential Deposition of Silver on Gold Electrodesrdquo Electrochimica Acta 39(89) (1994) 1039 Youngran Lim and Euijin Hwang ldquoAn Electrochemical QCM study of Oxygen reducttion during the Underpotential Depoosition of Lead on a Gold Electroderdquo Bull Korean Chem Soc 17(12)(1996)1091 25 EQCMWall Jet Split-Ring Disk Electrode study on Copper dissolution in Chloride Aqueous solutionrdquo Anal Sciences16(2000)1049 Michael Benje Matthias Eiermann Udo Pittermann and Konrad G Weil ldquoAn improved Quartz Microbalnce Applications to Electrocrystallizatuion and dissolution of Niquelrdquo Ber Bunsenges Phys Chem 90(1986) 435 26 Jorg Auge Peter Hauptmann Frank Eichelbaum and Stephen Rosler ldquoQCM sensor in liquidsrdquo Sensors and Actuators B 18-19 (1994) 518 27 Adrian W Bott ldquoCharacterization of Films Immobilized on an Electrode Surface Using the EQCMrdquo Current Separations 183(1999)79 28 Mark Deakin and Daniel Buttry ldquoElectrochemical Applications of the Quartz Crystal Microbalancerdquo Anal Chem 61(20)(1989)183 Daniel Buttry and Michael Ward ldquoMeasurement of Interfacial Processes at electrode surfaces with the EQCMrdquo Chem Rev 92(6) (1992) 1355 29 Wolfgang Stockel and Rolf Schumacher ldquoIn situ Microweighing at the Junction MetalElectrolyterdquo Ber Bunsenges Phys Chem 91(1987)345 30 C Gabrielli M Keddam and R Torrei ldquoCalibration of the Electrochemical Quartz Crystal Microbalancerdquo J Electrochem Soc 139(9) (1991) 2657 Note A calibration procedure based on the deposition of Ag on Au electrodes is described Graeme Andrew Snook Investigation of Solid-State Reactions by Electrochemical and Quartz Crystal Microbalance Measurements PhD Thesis 2000 Department of Chemistry Monash University Clayton 3168 Melbourne Australia and Division of Minerals CSIRO Clayton South 3169 Melbourne Australia under the supervision of Professor Alan Maxwell Bond (Monash) and Professor Stephen Fletcher (CSIRO)
wwwthinkSRScom
Stanford Research Systems (408)744-9040
Available for download from httpwww-bondchemmonasheduautheses Note the use of Lead acetate is proposed as a better alternative to Cu and Ag deposition Bruckenstein S and Shay M ldquoExperimental aspects of use of the quartz crystal microbalance in solutionrdquo Electrochim Acta 30(1985) 1295 31 Duke Orata and Daniel A Buttry ldquoDetermination of Ion Populations and Solvent Content as fucntions of Redox State and pH in Polyanilinerdquo J Am Chem Soc 109(1987)3574 32 Michael Ward ldquoInvestigation of Open Circuit Reactions of Polymer Films Using the QCM Reactions of Polyvinylferrocene Filmsrdquo J Phys Chem 92(1988)2049 Charles K Baker and John R Reynolds ldquoA quartz microbalance study of the electrosynthesis of polypyrrolerdquo J Electroanal Chem 251(1988) 307 33 Stephen Martin Victoria Edwards Granstaff and Gregory C Frye ldquoCharacterization of a Quartz Crystal Microbalance with Simultaneouus Mass and Liquid Loadingrdquo Anal Chem 63 (1991) 2272 Ralf Lucklum and Peter Hauptmann ldquoThe Df-DR QCM technique an approach to an advanced sensor signal interpretationrdquo Electrochimica Acta 45(2000) 3907 34 RA Etchenique and E L CalvordquoGravimetric measurement in redox polymer electrodes with the EQCM beyond the Sauerbrey limitrdquo Electrochemistry Communications 1(5)(1999)167 RA Etchenique and E J Calvo ldquoElectrochemical Quartz Crystal Impedance Study of Redox Hydrogel Mediators for Amperometryic Enzyme Electrodesrdquo Anal Chem 69(1997)4833 35 E J Calvo R Etchenique P N Bartlett K Singhal and Santamaria ldquoQuartz Crystal Impedance studies at 10MHz of viscoelastic liquids and filmsrdquo Faraday Discuss107(1997)141 Diethelm Johannsmann ldquoViscoelastic Analysis of Organic Thin Filmsrdquo on quartz resonatorsrdquo Macromol Chem Phys 200(1999)501 36 C E Reed K Keiji Kanazawa and J Kaufman ldquoPhysical description of a viscoelastically loaded AT-cut quartz resonatorrdquo J Appl Phys 68(5) (1990) 1993 37 D S Ballantine R M White S J Martin A J Rico E T Zellers G C Frye and H Woltjen ldquoAcoustic Wave Sensors Theory Design and Physico-Chemical Applicationsrdquo Acad Press London UK 1997 Chapter 5 (Chemical and Biological Sensors) p 222 38 GG Guilbault and J Jordan ldquoAnalytical uses of piezoelectric crystalsrdquo CRC Reviews 19 p 1-28 W H King ldquoPiezoelectric Sorption Detectorrdquo Anal Chem 36 (1964) 1735 39 Iddo Ben-Dov and Itamar Willmer ldquoPiezoelectric Immunosensors for Urine Specimens of Chlamidia trachomatis Employing QCM Microgravimetric Analysisrdquo Anal Chem 69(1997) 3506 40 A Hengerer C Koumlsslinger1 J Decker S Hauck1 I Queitsch2 H Wolf and S Duumlbel2 ldquoDetermination of Phage Antibody Affinities to Antigen by a Microbalance Sensor Systemrdquo BioTechniques 26956-964 (May 1999) 41 G G Guibault ldquoAnalytical uses of immobilized Enzymes Modern Monographs in Analytical Chemistryrdquo Vol 2Marcel Dekker New York (1984) G M Minunni M Mascini GG Guilbault B Hock ldquoThe Quartz Crystal Microbalance as Biosensor A Status Report on its Futurerdquo Anal Lett 28 5(1995) 749 S Tombelli M Mascini ldquoPiezoelectric Quartz Crystal Biosensor Recent Immobilisation Schemesrdquo Anal Lett 33(11) 2000 pp 2129-2151
wwwthinkSRScom
Stanford Research Systems (408)744-9040
Kim R Rogers ldquoPrinciples of Affinity Based Biosensorsrdquo Molecular Biotechnology 14(2000)109 42 Fredrik Hook et al ldquoStructural changes in hemoglobin during adsorption to solid surfaces effects of pH ionic strength and ligand bindingrdquo Proc Natl Acad Sci USA 95(1998)12271 43 C Fredriksson S Kihlman M Rodahl and B Kasemo ldquoThe Piezoelectric Quartz crystal Mass and Dissipation Sensor A means of studyinng Cell adhesionrdquo Langmuir 19(1998) 248 Ann-Sofie Cans et al ldquoMeasurement of the Dynamics of Exocytosis and Vesicle Retrieval at Cell Populations Using a QCMrdquo Anal Chem 73(2001)5805 C A Keller and B KasemordquoSurface Specific Kinetics of Lipid Vesicle Adsorption Measured with a QCMrdquo Biophysical Journal 75(1998) 1397 44 Wei W Z et al ldquoSelective pharmaceutical analyis technique with sensitive piezoelectric quartz sensorsrdquo Anal Lett 26(11)(1993)2371 45 Storri S Santoni T Mascini MrdquoA piezoelectric biosensor for DNA hybridization detectionrdquo Anal Lett 31(11)(1998)1795

wwwthinkSRScom
Stanford Research Systems (408)744-9040
Tf - Thickness of the film in cm
Z-match Method It is generally accepted that when the mass loading from the deposit causes a change in frequency of less than 2 of the frequency of the unloaded crystal Sauerbreyrsquos equation can be used to obtain accurate results in thin-film thickness calculations9 As the thickness of the film increases the Sauerbrey equation must be extended to incorporate the elasticity of the deposit Lu and Lewis10 gave a specially simple equation (equation 5) for the calculation of the dependence of ∆f on ∆m which is currently applied by most QCM users to calculate rigid thin-film thicknesses in gas phase depositions ∆m = [(Nq
ρq)(Π Z fL)] tan-1[ Z tan[Π (fU - fL) fU]] (equation 5) where ∆m - change in mass per unit area in gcm2 Nq - Frequency Constant for AT-cut quartz crystal 16681013 Hz Aring ρq - density of quartz 2648 g cm-3 ρf - density of film material in g cm-3 fU - Frequency of unloaded crystal (prior to deposition) in Hz fL - Frequency of loaded crystal in Hz microq -shear modulus of quartz 29471011 g cm-1 s-2 microf - shear modulus of film material and Z Z-Factor of film material = [(ρρρρq micromicromicromicroq) (ρρρρf micromicromicromicrof)]12
This analysis of frequency changes including the acoustic impedances of the quartz and film is often called the ldquoZ-matchrdquo method The accuracy of the mass load and film-thickness calculation is often limited by how well the Z-Factor and density of the material are known Density and Z-Factor values are typically very close to bulk values The bulk density and shear modulus values for common film materials can be found in many material reference handbooks The Lu and Lewis equation is generally considered to be a good match to the experimental results11 for frequency changes up to 40 (relative to the unloaded crystal) Keep also in mind that the Z-match equation strictly applies to ldquorigidrdquo deposits Films which behave viscoelastic such as some organic polymer films with large thickness or viscosity will exhibit significant deviations from both equations 1 and 5 Crystal failures are also often seen before a 40 shift in frequency is reached Common problems are (1) shorts in the crystal electrodes due to excessive buildup (2) mode hoping to other (anharmonic) resonant frequencies due to the
wwwthinkSRScom
Stanford Research Systems (408)744-9040
buildup of composite resonant modes (3) deviations from theory due to fringing electrode fields developed between the electrodes and the film (4) unexpected shifts in fundamental frequency due to stress build up on the crystal surface (5) spitting of source material resulting in non-uniform films etc
wwwthinkSRScom
Stanford Research Systems (408)744-9040
Liquid Contact Measurements Until recently its was believed that excessive viscous loading would prohibit use of the QCM in liquids In fact operation in liquids is indeed possible12 and the response of the QCM is still extremely sensitive to mass changes at the solid-solution interface For many years QCMs have been used in direct contact with liquids andor viscoelastic films to assess changes in mass and viscoelastic properties during chemical and electrochemical surface processes When the QCM comes in contact with a solution there is a decrease in frequency that is dependent upon the viscocity and the density of the solution A quantitative understanding of the resonator behavior is a prerequisite for proper interpretation of experimental results under total liquid immersion This problem was first treated by Glassford13 and later by Kanazawa and Gordon14 Kanazawarsquos treatment of the influence of the solution properties on the crystal (equation 6) permits the prediction of the change in resonance frequency which accompanies immersion of the crystal into a viscous medium
∆f = - fu32 [(ρL ηL) (Π
ρq microq)]12 (equation 6)
where fu - frequency of oscillation of unloaded crystal ρq - density of quartz ndash 2648 g cm-3 microq - shear modulus of quartz- 29471011 gcm-1s-2 ρL - density of the liquid in contact with the electrode and ηL - viscosity of the liquid in contact with the electrode
Viscous coupling of the liquid medium to the oscillating crystal surface results not only in a decrease in the series resonant frequency but also in damping of the resonant oscillation- the viscous loss is manifested as an increase in series resonance resistance R of the QCM resonator Thus R serves as an excellent independent measure of viscous loading by the medium (ie liquid or soft-film) at the crystalrsquos surface ∆f and ∆R measurements are both routinely used as independent indicators of mass loading and viscosity at the crystal-liquid interface of the QCM resonator during chemical and electrochemical depositions in solution15 In a separate study16 a Butterworth-Van Dyke equivalent circuit model (Figure 1) was applied to derive a linear relationship between the change in series resonance resistance ∆R of the quartz oscillator and (ρL
ηL)12 under liquid
loading
wwwthinkSRScom
Stanford Research Systems (408)744-9040
∆R = [n ωs Lu Π][ (2 ωs
ρL ηL) (ρq
microq)]12 (equation 7)
Where ∆R - change in series resonance resistance in Ω n - number of sides in contact with liquid ωs - angular frequency at series resonance(= 2Πfs where fs is the oscillation frequency in solution in Hz) and Lu - Inductance for the unperturbed (ie dry) resonator usually in mH
The QCM100 System was specifically designed for operation under heavy viscous loading The standard Crystal Holder supports operation in gas and liquid environments and provides single-electrode exposure to liquids17 (ie n =1 in equation 7) as required for compatibility with electrochemical QCM measurements The QCM25 Crystal Controller provides both frequency and resistance change signals and will maintain oscillation up to a series resonance resistance of about 5 KΩ (ie it will support crystal operation in highly viscous solutions up to 88 (ww) glycerol in water)
wwwthinkSRScom
Stanford Research Systems (408)744-9040
Figure 7 ∆f and ∆R versus glycerol weight percentage (in water) as predicted by theory and as measured with QCM100 and a 5MHz polished
crystal As an example equation 6 predicts a decrease in f0 of 715Hz on transfer from vacuum to pure water18 at 20degC in agreement with the results observed with a QCM100 using 1inch diameter polished 5MHz crystals mounted on a standard Crystal Holder Excellent agreement between the frequency and resistance equations and the experimental results has been proved19 making the QCM an
0
500
1000
1500
2000
2500
3000
3500
4000
4500
5000
0 10 20 30 40 50 60 70 80 90 100
Wt Glycerol
QCM100Theory
-12000
-11000
-10000
-9000
-8000
-7000
-6000
-5000
-4000
-3000
-2000
-1000
0
0 10 20 30 40 50 60 70 80 90 100
Wt glycerol
f H
zQCM100Theory
wwwthinkSRScom
Stanford Research Systems (408)744-9040
excellent tool for the evaluation of fluid properties Application examples include in situ monitoring of lubricant and petroleum properties20 The tight correspondence between theory (equations 6 amp 7) and experiment is clearly illustrated by Figure 7 Dissipation Technique An alternative method21 for studying the properties of the loaded QCM Sensor called the ldquoDissipation Techniquerdquo has been used in gaseous as well as in liquid environments In this case the crystal is driven at its resonant frequency by an oscillator that can be intermittently disconnected causing the crystal oscillation amplitude to decay exponentially From the recorded decay curve the absolute Q-factor (inversely proportional to R) and the frequency of the oscillator are simultaneously obtained Independent studies22 have shown that as long as the effect of the parasitic capacitance (C0) is properly cancelled the results provided by the Dissipation Technique should be in good agreement with the measurements provided by the QCM100 System
Temperature The intrinsic dependence of the resonant frequency of a quartz crystal on temperature is well known and generally quite small In fact the AT-cut quartz crystal commonly used in QCM experiments owe their popularity to their near zero coefficient at room temperature As a result the intrinsic temperature dependence of the QCM sensor crystals is negligible at or around room temperature (asymp 1-3 HzdegC) and is generally ignored for monolayer adsorptiondesorption processes in the gas phase Much larger changes in frequency with temperature are observed when QCM crystals are immersed in liquids This is due to the coupling of the shear mode oscillation with the temperature dependent viscosity and density of the fluid- the temperature coefficient due to this effect is asymp 8Hz ordmC for water As a result for experiments in liquid phase in which the frequency is to be monitored at length the temperature must be controlled to at least 01degC and preferably better In electrochemical experiments this is often achieved with temperature controlled baths and jacketed cells If temperature control is not possible or practical it is always good practice to wait at least 30 minutes before performing any accurate measurements after the crystal comes in contact with a new medium and measure the temperature of the solution around the crystal during the experiments to perform temperature compensation It is also common practice to soak the mounted crystal(s) in the solution overnight before performing any experiments to assure more stable readings Careful control of the temperature is required in high accuracy measurements to avoid frequency hysterisis effects- the dependence of resonator frequency at a
wwwthinkSRScom
Stanford Research Systems (408)744-9040
specific temperature on the prior temperature history of the resonator For example it is often observed that the frequency vs temperature curve obtained going from T1 to T2 will not coincide with the one obtained immediately after going from T2 to T1 This effect must be carefully considered during accurate determinations Each individual QCM user must determine the effect of temperature on the experiments being performed and either control the temperature accordingly or measure the temperature and compensate for it Electrode Polishing Electrode surface roughness can cause large apparent mass loadings due to the liquid that is trapped within pores at the crystal surface23 As a general rule optically polished crystals (50Aring average surface roughness) are required to obtain good agreement between theory and experiment during liquid immersion experiments The water immersion checkup test (below) provides a quick-and-easy way to test the crystal finish for liquid-QCM applications System Checkup A comparison against the theoretical predictions of equation 6 (amp7) is usually a good starting point when testing a new experimental liquid-QCM100 setup Two common ldquocheckuprdquo procedures are described diams Water Immersion For a 5MHz polished crystal and assuming that the
electrode capacitance has been properly cancelled a decrease in frequency of asymp715 Hz and an increase in series resonance resistance of asymp380 Ω is expected when switching from air to complete immersion in water at 20degC
diams GlycerolH2O Immersion Figure 7 shows resistance and frequency change values expected for a polished 5MHz crystal immersed in a series of viscous glycerolwater solutions at 20ordmC Operation at increasing glycerol concentrations is an excellent test of a QCM experimental setup and should provide predictable results up to more than 88 glycerol
In both procedures an agreement between measured and expected values within +- 25 is generally considered acceptable for glycerol concentrations up to 70 Frequency shifts are much larger (ie at least a factor of two) and unpredictable for unpolished crystals so they are not recommended for system checkup
wwwthinkSRScom
Stanford Research Systems (408)744-9040
Electrochemical Quartz Crystal Microbalance In most electrochemical experiments mass changes occur as material is deposited or lost from the ldquoworkingrdquo electrode It is of interest to monitor those changes simultaneously with the electrochemical response and the QCM is the standard means of doing so As a gravimetric probe the QCM has been used in many types of electrochemical studies including underpotential deposition of metals24 corrosion oxide formation dissolution studies25 adsorptiondesorption of surfactants26 and changes in conductive polymer films during redox processes27 The basic principles and applications of the QCM to electrochemical processes have been extensively reviewed in the electrochemical literature28 and will only be discussed briefly in this manual Please refer to the publications list at the end of this chapter for more detailed information Electrochemical Apparatus A schematic diagram of the apparatus for electrochemical quartz crystal microbalance (EQCM) experiments is given in Figure 8 In this example a 1inch diameter polished QCM crystal is mounted on a crystal holder with only one electrode exposed to the conductive solution The crystal holder is connected to a QCM25 Crystal Controller and the liquid-contact electrode is connected to the ldquoworking electroderdquo lead of the potentiostat (through the ldquoCrystal Face Biasrdquo connector of the QCM25 Crystal Controller) A QCM100 Analog Controller provides independent frequency and conductance outputs which are read and displayed by a frequency counter and a digital multimeter (or AD converter) respectively
wwwthinkSRScom
Stanford Research Systems (408)744-9040
Figure 8 Schematic of EQCM apparatus
A PC (not shown) is often interfaced to the potentiostat frequency counter and DMM and integrates the QCM and electrochemical data into a single software package Note The QCM25 Crystal Controller provides transformer isolation of the crystal front face electrode This allows direct electrical connection of the quartz crystal face to the ldquoworking electroderdquo pin of any standard potentiostatgalvanostat With the instrument in Figure 8 a typical cyclic voltammetric-EQCM experiment would involve the application of the electrochemical waveform to the working electrode and the simultaneous measurement of the current flowing through the electrochemical cell and the oscillation frequency and series resonance resistance of the crystal Figure 9 is an example of a typical voltammogram-massogram plot obtained from a 10mM solution of CuSO4 in 01M H2SO4 using a 1inch diameter Au coated quartz crystal mounted in a standard holder as the working electrode
Digital Multimeter
QCM25
Reference Electrode
Counter Electrode
Work Electrode
Potentiostat
QCM100 Analog Controller
Frequency Counter
Crystal Holder
wwwthinkSRScom
Stanford Research Systems (408)744-9040
Figure 9 Cyclic voltammogram and massogram data for Cu deposition on a Au
electrode The frequency ndashpotential diagram shows a frequency decrease in perfect sync with the deposition of Cu metal on the crystalrsquos surface
Calibration It has been amply demonstrated in the literature that when experiments involve only relative frequency shifts which are measured in a fixed solution the offset caused by the viscous loading of the liquid has negligible effect on the accuracy of the Sauerbrey equation for the determination of small mass changes in rigid deposits29 Quantitative interpretation of the EQCM data in those cases is based on the combination of the Sauerbrey equation (equation 1) and Faradayrsquos law The former relates change in frequency to change in mass for thin rigid deposits whereas the latter relates charge passed in an electrochemical experiment to the number of moles of material electrolyzed Therefore frequency changes can be related to the total charge passed An example would be the electrodeposition of Ag on a Pt electrode QCM crystal The charge Q is an integral measure of the total number of electrons delivered at the interface during the reduction process To the extent that each electron supplied results in the deposition of one atom of Ag there should be a linear relationship between Q and ∆f as is given by equation 8
∆f = 106 Mw Cf Q (n F A) (equation 8) where
wwwthinkSRScom
Stanford Research Systems (408)744-9040
∆f - frequency change in Hz Mw - apparent molar mass of the depositing species in gramsmole Cf - Sauerbreyrsquos sensitivity factor for the crystal used (see equation 1) Q - integrated charge during the reduction in Coulomb A - Active deposition area of the working (ie liquid contact) electrode in cm2 F - Faradayrsquos constant 9648 104 Coulombmole and n - number of electrons transferred to induce deposition (ie n =1 for Ag deposition) (The factor of 106 provides for the unit conversion from mg in Cf to g in Mw)
A plot of ldquo∆f vs Qrdquo will deliver the apparent mass per electron of the deposited species when n is taken into account This is often used to elucidate the mass changes that accompany redox processes and hence is very useful for characterizing the mechanisms of electron-transfer reactions However before any calculations can be performed based on equation 8 the EQCM must be calibrated in order to properly derive (1) the proportionality constant Cf of the Sauerbrey equation in solution and (2) to account for the effective area of the working electrode This is generally done using a well behaved electrochemical reaction- typically electrodeposition of silver copper or lead on a Au or Pt electrode The EQCM calibration method favored by Stanford Research Systems for its QCM100 system is based on the galvanostatic deposition of Ag A 50mM solution of AgNO3 in 05M HNO3 is subjected to a reducing potential and Ag is deposited with a fixed cathodic current density of 50-500 microAcm2 The cathodic current is integrated to obtain the charge as a function of time Excellent linearity is generally observed in ldquo∆f vs Qrdquo plots for depositions within 1 microgcm2 providing a very reliable way to calibrate the proportionality constant of equation 8 Several calibration procedures are also described in the electrochemistry literature30 and users are referred to the publications list at the end of this chapter for details Polymer Modified Electrodes The EQCM has been extensively used to study polymer modified electrodes particularly as a gravimetric tool to follow redox processes31 However for the linear frequency-to-mass relationship (described by equation 8) to hold true the polymer overlayer must exhibit no changes in rigidity during the electrochemical process Otherwise the viscoelastic changes will also contribute to the frequency change leading to an erroneous interpretation of the mass changes32 As a
wwwthinkSRScom
Stanford Research Systems (408)744-9040
consequence it is essential to determine whether or not viscoelastic properties of the polymer film influence the frequency measurement during polymer film experiments
Figure 10 Votammogram and massogram data for the oxidation of pyrrole to form a polypyrrole film on a gold coated QCM Sensor Crystal Seven cycles of
voltammetry between - 04 and 095 V were conducted in this experiment Pyrrole monomer can be oxidized to its radical at 065V As this happens a thin polypyrrole film is formed on the crystal surface resulting in a decrease in the
fundamental frequency of oscillation of the crystal The continuous growth of the film is evidenced by the irreversible decrease in frequency during the scans
A starightforward way to detect changes in film viscoelastic properties of redox films is to simultaneously monitor the series resonance resistance R of the quartz oscillator during the electrochemical experiment33 Some theoretical models34 based on the simultaneous measurement of ∆f and ∆R have been discussed in the literature for the extension of EQCM gravimetric measurements to non-rigid films The viscoelastic analyis of polymeric thin films in EQCM systems is complex because the shear wave exists simultaneously in the quartz crystal the viscoelastic film and the adjacent solution so reflection of the shear wave must be taken into account However solution of this problem would be worthwhile specially if the material properties of the film could be derived This would allow correlation of the electrochemical behavior of the film with its material properties35
01M Pyrrole in 01M HCLO4
wwwthinkSRScom
Stanford Research Systems (408)744-9040
The unique property of the QCM technique is its ability to determine the mass of very thin layers while simultaneously giving information about their viscoelastic properties The ability to measure both mass and structural changes means it is possible to detect phase-transitions cross-linking and swelling in polymeric thin films36
wwwthinkSRScom
Stanford Research Systems (408)744-9040
Chemical and Biological Sensors Anything that has mass can generate a response from a QCM sensor The universal response of the device is the reason for the wide range of application of the technology However the downside of such universal sensitivity is that you always have a great danger of interferences For analytical purposes it is imperative to find ways of getting the QCM sensor to respond only to what you are interested in (ie build sensitivity into the device) This usually involves the addition of a sensitive layer on the surface of the crystal37 Organic polymers comprise the most common type of coating used with QCM sensors due to their capability to reversibly sorb vapors and liquids38 In much of the work published on the use of polymer coatings for vapor sensing the acoustic properties of the polymer material have been neglected The relative importance of the mass-loading and viscoelastic contributions of the film to the observed QCM response is a subject that has yet to be resolved In no area have the QCM applications seen such dramatic increase in recent years as in the field of biochemical analysis QCM devices are routinely used as biochemical and immunological probes39 as well as for the investigation andor monitoring of biochemcially significant processes Sensitive selective detection of biochemically active compounds can be achieved by employing antigen-antibody40 enzyme substrates and other receptor ndashprotein pairs The potential analytical uses of these materials has been reviewed particularly with respect to the development of biochemical sensors41 QCM studies have provided detailed information about the functionalized surfaces developed for a range of biochip and biosensor applications QCM Systems are applied routinely by biologists and biochemists to obtain information about processes such as (1) protein adsorptiondesorption42 (2) cell adhesion43 (3) Protein-protein interaction (4) Degradation of polymers (5) biofouling and biofilm formation (6) drug analysis44 and (7) DNA Biosensors45
References 1 G Sauerbrey Z Phys 155 (1959) 206 2 Daniel Buttry ldquoApplications of the QCM to Electrochemistryrdquo in A Series of Advances in Electroanalytical Chemistry edited by Allen Bard Marcel Dekker 1991 p 23-33 3 John Henderson ldquoElectronic Devices Concepts and Applicationsrdquo Prentice Hall NJ (1991) p 357 4 For example QCM10 crystal holder with a 1inch 5MHz crystal connected directly to an SRS QCM25 Crystal Controller
wwwthinkSRScom
Stanford Research Systems (408)744-9040
5 C Chagnard P Gilbert N Watkins T Beeler and David W Paul ldquoAn electronic oscillator with automatic gain controlEQCM Applicationsrdquo Sensors and Actuators B 32(1996) 129-136 A Arnau T Sogorb and Y Jimenez ldquoCircuit for continuous motional series resonat frequency and motional resistance monitoring of quartz crystal resonators by parallel capacitance cancellationrdquo Rev Sci Instrum 73(7)(2002) 2724 6 For example from the Conductance Output of the QCM100 7 Conductance is the inverse of resistance Conductance = 1 Resistance or Resistance = 1 Conductance The units of resistance are Ohms [Ω = VA] and the units of conductance are Siemens (S = AV] 8 For example Agilent 34401A with 6 digit resolution or 3458 with eight digits resolution 9 DR Denison ldquoLinearity of a Heavily Loaded Quartz Crystal Microbalancerdquo J Vac Sci Technol 10(1) (1973) 126 Klaus H Behrndt ldquoLong Term Operation of Crystal Oscillators in Thin-Film Depositionrdquo J Vac Sci technol 8(5)(1971) 622 10 C Lu and O Lewis ldquoInvestigation of film-thickness determination by oscillating quartz resonators with large mass loadrdquo J Appl Phys 43 (1972) 4385 Chih-shun Lu ldquoMass determination with piezoelectric quartz crystal resonatorsrdquo J Vac Sci Technol 12(1) (1975) 578 11 D R Denison ldquoLinearity of Heavily Loaded Quartz Crystal Microbalancerdquo J Vac Sci Technol 10(1973) 126 K H Behrndt ldquoLong Term Operation of Crystal Oscillators in Thin-Film Depositionrdquo J Vac Sci Technol 8(5) (1971) 622 12 T Nomura and M Okuhara Anal Chim Acta 142(1982) 281 13 A P M Glassford ldquoResponse of a Quartz Crystal Microbalance to a liquid Depositrdquo J Vac Sci Technol 15(6)(1978) 1836 14 K Keiji Kanazawa and Joseph Gordon II ldquoFrequency of a Quartz Microbalance in Contact with Liquidrdquo Anal Chem 57(1985) 1770 K Keiji Kanazawa and Joseph G Gordon II Analytica Chimica Acta 175(1985) 99-105 15 Stephen J Martin James J Spates Kurt O Wesendorf thomas Schnneider and Robert J Huber ldquoResonator Oscillator Response to Liquid Loadingrdquo Anal Chem 69(1997) 2050 16 Stephen Martin Victoria Edwards Granstaff and Gregory C Frye ldquoCharacterization of a Quartz Crystal Microbalance with Simultaneous Mass and Liquid Loadingrdquo Anal Chem 63 (1991) 2272 17 Operation in liquids requires that the crystal be mounted in a holder such that only the front surface of the crystal is in contact with the fluid while at the same time providing an electrical connection to both electrodes 18 For pure water at 20C ρL 09982 g cm-3 and ηL 100210-2 g cm-1 s-1 19 H Muramatsu Eiichi Tamiya and Isao Karube ldquoComputation of Equivalent Circuit Parameters of Quartz Crystals in Contact with Liquids and Study of Liquid Propertiesrdquo Anal Chem 60(1988) 2142 SJ Geelhood C W Frank and K Kanazawa ldquoTransient Quartz Crystal Microbalance Behaviors Comparedrdquo Journal of the Electrochemical Society 149(2002) H33-H38 Mengsu Yang and Michael Thompson ldquoMultiple Chemical Information from the Thickness Shear Mode Acoustic Wave Sensor in the liquid Phaserdquo Anal Chem 65(1993) 1158
wwwthinkSRScom
Stanford Research Systems (408)744-9040
20 S J Martin R W Cernosek and JJ Spates ldquoSensing Liquid Properties with Shear-mode Resonator Sensorsrdquo in Proceeds from TransducersEurosensors IX Stockholm Sweden (1995) 21 Michael Rodahl Fredrik Hook Anatol Krozer Peter Brzezinski and Bengt Kasemo ldquoQCM setup for frequency and Q-factor measurements in gaseous and liquid environmentsrdquo Rev Sci Instrum 66(7)(1995)3924 22 S J Geelhood CW Frank and K Kanazawa ldquoTransient QCM Behaviors Comparedrdquo J of the Electrochemical Societyrdquo 149(1)(2002)H33 23 Stephen Martin et al rdquoEffect of Surface Roughness on the Response of Thickness-Shear Mode Resonators in Liquidsrdquo Anal Chem 65(1993)2910 Michael Ward and Edward J Delawski ldquoRadial Mass Sensitivity of the Quartz Crystal Microbalance in Liquid Mediardquo Anal Chem 63(1991) 886 24 Mark R Deakin and Owen Melroy ldquoUnderpotential Metal Deposition on Au monitorred in situ with a Quartz Microbalancerdquo J Electroanal Chem 239(1988) 321 O Melroy K Kanazawa JG Gordon II and D Buttry ldquoDirect Determination of the Mass of an Underpotentially Deposited Monolayer of Lead on Goldrdquo Langmuir 2(1986)697 Masahiro Seo Masaki Aomi and Kengo Yoshida ldquoA combined Piezoelectric and EQCM study of Underpotential Deposition of Silver on Gold Electrodesrdquo Electrochimica Acta 39(89) (1994) 1039 Youngran Lim and Euijin Hwang ldquoAn Electrochemical QCM study of Oxygen reducttion during the Underpotential Depoosition of Lead on a Gold Electroderdquo Bull Korean Chem Soc 17(12)(1996)1091 25 EQCMWall Jet Split-Ring Disk Electrode study on Copper dissolution in Chloride Aqueous solutionrdquo Anal Sciences16(2000)1049 Michael Benje Matthias Eiermann Udo Pittermann and Konrad G Weil ldquoAn improved Quartz Microbalnce Applications to Electrocrystallizatuion and dissolution of Niquelrdquo Ber Bunsenges Phys Chem 90(1986) 435 26 Jorg Auge Peter Hauptmann Frank Eichelbaum and Stephen Rosler ldquoQCM sensor in liquidsrdquo Sensors and Actuators B 18-19 (1994) 518 27 Adrian W Bott ldquoCharacterization of Films Immobilized on an Electrode Surface Using the EQCMrdquo Current Separations 183(1999)79 28 Mark Deakin and Daniel Buttry ldquoElectrochemical Applications of the Quartz Crystal Microbalancerdquo Anal Chem 61(20)(1989)183 Daniel Buttry and Michael Ward ldquoMeasurement of Interfacial Processes at electrode surfaces with the EQCMrdquo Chem Rev 92(6) (1992) 1355 29 Wolfgang Stockel and Rolf Schumacher ldquoIn situ Microweighing at the Junction MetalElectrolyterdquo Ber Bunsenges Phys Chem 91(1987)345 30 C Gabrielli M Keddam and R Torrei ldquoCalibration of the Electrochemical Quartz Crystal Microbalancerdquo J Electrochem Soc 139(9) (1991) 2657 Note A calibration procedure based on the deposition of Ag on Au electrodes is described Graeme Andrew Snook Investigation of Solid-State Reactions by Electrochemical and Quartz Crystal Microbalance Measurements PhD Thesis 2000 Department of Chemistry Monash University Clayton 3168 Melbourne Australia and Division of Minerals CSIRO Clayton South 3169 Melbourne Australia under the supervision of Professor Alan Maxwell Bond (Monash) and Professor Stephen Fletcher (CSIRO)
wwwthinkSRScom
Stanford Research Systems (408)744-9040
Available for download from httpwww-bondchemmonasheduautheses Note the use of Lead acetate is proposed as a better alternative to Cu and Ag deposition Bruckenstein S and Shay M ldquoExperimental aspects of use of the quartz crystal microbalance in solutionrdquo Electrochim Acta 30(1985) 1295 31 Duke Orata and Daniel A Buttry ldquoDetermination of Ion Populations and Solvent Content as fucntions of Redox State and pH in Polyanilinerdquo J Am Chem Soc 109(1987)3574 32 Michael Ward ldquoInvestigation of Open Circuit Reactions of Polymer Films Using the QCM Reactions of Polyvinylferrocene Filmsrdquo J Phys Chem 92(1988)2049 Charles K Baker and John R Reynolds ldquoA quartz microbalance study of the electrosynthesis of polypyrrolerdquo J Electroanal Chem 251(1988) 307 33 Stephen Martin Victoria Edwards Granstaff and Gregory C Frye ldquoCharacterization of a Quartz Crystal Microbalance with Simultaneouus Mass and Liquid Loadingrdquo Anal Chem 63 (1991) 2272 Ralf Lucklum and Peter Hauptmann ldquoThe Df-DR QCM technique an approach to an advanced sensor signal interpretationrdquo Electrochimica Acta 45(2000) 3907 34 RA Etchenique and E L CalvordquoGravimetric measurement in redox polymer electrodes with the EQCM beyond the Sauerbrey limitrdquo Electrochemistry Communications 1(5)(1999)167 RA Etchenique and E J Calvo ldquoElectrochemical Quartz Crystal Impedance Study of Redox Hydrogel Mediators for Amperometryic Enzyme Electrodesrdquo Anal Chem 69(1997)4833 35 E J Calvo R Etchenique P N Bartlett K Singhal and Santamaria ldquoQuartz Crystal Impedance studies at 10MHz of viscoelastic liquids and filmsrdquo Faraday Discuss107(1997)141 Diethelm Johannsmann ldquoViscoelastic Analysis of Organic Thin Filmsrdquo on quartz resonatorsrdquo Macromol Chem Phys 200(1999)501 36 C E Reed K Keiji Kanazawa and J Kaufman ldquoPhysical description of a viscoelastically loaded AT-cut quartz resonatorrdquo J Appl Phys 68(5) (1990) 1993 37 D S Ballantine R M White S J Martin A J Rico E T Zellers G C Frye and H Woltjen ldquoAcoustic Wave Sensors Theory Design and Physico-Chemical Applicationsrdquo Acad Press London UK 1997 Chapter 5 (Chemical and Biological Sensors) p 222 38 GG Guilbault and J Jordan ldquoAnalytical uses of piezoelectric crystalsrdquo CRC Reviews 19 p 1-28 W H King ldquoPiezoelectric Sorption Detectorrdquo Anal Chem 36 (1964) 1735 39 Iddo Ben-Dov and Itamar Willmer ldquoPiezoelectric Immunosensors for Urine Specimens of Chlamidia trachomatis Employing QCM Microgravimetric Analysisrdquo Anal Chem 69(1997) 3506 40 A Hengerer C Koumlsslinger1 J Decker S Hauck1 I Queitsch2 H Wolf and S Duumlbel2 ldquoDetermination of Phage Antibody Affinities to Antigen by a Microbalance Sensor Systemrdquo BioTechniques 26956-964 (May 1999) 41 G G Guibault ldquoAnalytical uses of immobilized Enzymes Modern Monographs in Analytical Chemistryrdquo Vol 2Marcel Dekker New York (1984) G M Minunni M Mascini GG Guilbault B Hock ldquoThe Quartz Crystal Microbalance as Biosensor A Status Report on its Futurerdquo Anal Lett 28 5(1995) 749 S Tombelli M Mascini ldquoPiezoelectric Quartz Crystal Biosensor Recent Immobilisation Schemesrdquo Anal Lett 33(11) 2000 pp 2129-2151
wwwthinkSRScom
Stanford Research Systems (408)744-9040
Kim R Rogers ldquoPrinciples of Affinity Based Biosensorsrdquo Molecular Biotechnology 14(2000)109 42 Fredrik Hook et al ldquoStructural changes in hemoglobin during adsorption to solid surfaces effects of pH ionic strength and ligand bindingrdquo Proc Natl Acad Sci USA 95(1998)12271 43 C Fredriksson S Kihlman M Rodahl and B Kasemo ldquoThe Piezoelectric Quartz crystal Mass and Dissipation Sensor A means of studyinng Cell adhesionrdquo Langmuir 19(1998) 248 Ann-Sofie Cans et al ldquoMeasurement of the Dynamics of Exocytosis and Vesicle Retrieval at Cell Populations Using a QCMrdquo Anal Chem 73(2001)5805 C A Keller and B KasemordquoSurface Specific Kinetics of Lipid Vesicle Adsorption Measured with a QCMrdquo Biophysical Journal 75(1998) 1397 44 Wei W Z et al ldquoSelective pharmaceutical analyis technique with sensitive piezoelectric quartz sensorsrdquo Anal Lett 26(11)(1993)2371 45 Storri S Santoni T Mascini MrdquoA piezoelectric biosensor for DNA hybridization detectionrdquo Anal Lett 31(11)(1998)1795
wwwthinkSRScom
Stanford Research Systems (408)744-9040
buildup of composite resonant modes (3) deviations from theory due to fringing electrode fields developed between the electrodes and the film (4) unexpected shifts in fundamental frequency due to stress build up on the crystal surface (5) spitting of source material resulting in non-uniform films etc
wwwthinkSRScom
Stanford Research Systems (408)744-9040
Liquid Contact Measurements Until recently its was believed that excessive viscous loading would prohibit use of the QCM in liquids In fact operation in liquids is indeed possible12 and the response of the QCM is still extremely sensitive to mass changes at the solid-solution interface For many years QCMs have been used in direct contact with liquids andor viscoelastic films to assess changes in mass and viscoelastic properties during chemical and electrochemical surface processes When the QCM comes in contact with a solution there is a decrease in frequency that is dependent upon the viscocity and the density of the solution A quantitative understanding of the resonator behavior is a prerequisite for proper interpretation of experimental results under total liquid immersion This problem was first treated by Glassford13 and later by Kanazawa and Gordon14 Kanazawarsquos treatment of the influence of the solution properties on the crystal (equation 6) permits the prediction of the change in resonance frequency which accompanies immersion of the crystal into a viscous medium
∆f = - fu32 [(ρL ηL) (Π
ρq microq)]12 (equation 6)
where fu - frequency of oscillation of unloaded crystal ρq - density of quartz ndash 2648 g cm-3 microq - shear modulus of quartz- 29471011 gcm-1s-2 ρL - density of the liquid in contact with the electrode and ηL - viscosity of the liquid in contact with the electrode
Viscous coupling of the liquid medium to the oscillating crystal surface results not only in a decrease in the series resonant frequency but also in damping of the resonant oscillation- the viscous loss is manifested as an increase in series resonance resistance R of the QCM resonator Thus R serves as an excellent independent measure of viscous loading by the medium (ie liquid or soft-film) at the crystalrsquos surface ∆f and ∆R measurements are both routinely used as independent indicators of mass loading and viscosity at the crystal-liquid interface of the QCM resonator during chemical and electrochemical depositions in solution15 In a separate study16 a Butterworth-Van Dyke equivalent circuit model (Figure 1) was applied to derive a linear relationship between the change in series resonance resistance ∆R of the quartz oscillator and (ρL
ηL)12 under liquid
loading
wwwthinkSRScom
Stanford Research Systems (408)744-9040
∆R = [n ωs Lu Π][ (2 ωs
ρL ηL) (ρq
microq)]12 (equation 7)
Where ∆R - change in series resonance resistance in Ω n - number of sides in contact with liquid ωs - angular frequency at series resonance(= 2Πfs where fs is the oscillation frequency in solution in Hz) and Lu - Inductance for the unperturbed (ie dry) resonator usually in mH
The QCM100 System was specifically designed for operation under heavy viscous loading The standard Crystal Holder supports operation in gas and liquid environments and provides single-electrode exposure to liquids17 (ie n =1 in equation 7) as required for compatibility with electrochemical QCM measurements The QCM25 Crystal Controller provides both frequency and resistance change signals and will maintain oscillation up to a series resonance resistance of about 5 KΩ (ie it will support crystal operation in highly viscous solutions up to 88 (ww) glycerol in water)
wwwthinkSRScom
Stanford Research Systems (408)744-9040
Figure 7 ∆f and ∆R versus glycerol weight percentage (in water) as predicted by theory and as measured with QCM100 and a 5MHz polished
crystal As an example equation 6 predicts a decrease in f0 of 715Hz on transfer from vacuum to pure water18 at 20degC in agreement with the results observed with a QCM100 using 1inch diameter polished 5MHz crystals mounted on a standard Crystal Holder Excellent agreement between the frequency and resistance equations and the experimental results has been proved19 making the QCM an
0
500
1000
1500
2000
2500
3000
3500
4000
4500
5000
0 10 20 30 40 50 60 70 80 90 100
Wt Glycerol
QCM100Theory
-12000
-11000
-10000
-9000
-8000
-7000
-6000
-5000
-4000
-3000
-2000
-1000
0
0 10 20 30 40 50 60 70 80 90 100
Wt glycerol
f H
zQCM100Theory
wwwthinkSRScom
Stanford Research Systems (408)744-9040
excellent tool for the evaluation of fluid properties Application examples include in situ monitoring of lubricant and petroleum properties20 The tight correspondence between theory (equations 6 amp 7) and experiment is clearly illustrated by Figure 7 Dissipation Technique An alternative method21 for studying the properties of the loaded QCM Sensor called the ldquoDissipation Techniquerdquo has been used in gaseous as well as in liquid environments In this case the crystal is driven at its resonant frequency by an oscillator that can be intermittently disconnected causing the crystal oscillation amplitude to decay exponentially From the recorded decay curve the absolute Q-factor (inversely proportional to R) and the frequency of the oscillator are simultaneously obtained Independent studies22 have shown that as long as the effect of the parasitic capacitance (C0) is properly cancelled the results provided by the Dissipation Technique should be in good agreement with the measurements provided by the QCM100 System
Temperature The intrinsic dependence of the resonant frequency of a quartz crystal on temperature is well known and generally quite small In fact the AT-cut quartz crystal commonly used in QCM experiments owe their popularity to their near zero coefficient at room temperature As a result the intrinsic temperature dependence of the QCM sensor crystals is negligible at or around room temperature (asymp 1-3 HzdegC) and is generally ignored for monolayer adsorptiondesorption processes in the gas phase Much larger changes in frequency with temperature are observed when QCM crystals are immersed in liquids This is due to the coupling of the shear mode oscillation with the temperature dependent viscosity and density of the fluid- the temperature coefficient due to this effect is asymp 8Hz ordmC for water As a result for experiments in liquid phase in which the frequency is to be monitored at length the temperature must be controlled to at least 01degC and preferably better In electrochemical experiments this is often achieved with temperature controlled baths and jacketed cells If temperature control is not possible or practical it is always good practice to wait at least 30 minutes before performing any accurate measurements after the crystal comes in contact with a new medium and measure the temperature of the solution around the crystal during the experiments to perform temperature compensation It is also common practice to soak the mounted crystal(s) in the solution overnight before performing any experiments to assure more stable readings Careful control of the temperature is required in high accuracy measurements to avoid frequency hysterisis effects- the dependence of resonator frequency at a
wwwthinkSRScom
Stanford Research Systems (408)744-9040
specific temperature on the prior temperature history of the resonator For example it is often observed that the frequency vs temperature curve obtained going from T1 to T2 will not coincide with the one obtained immediately after going from T2 to T1 This effect must be carefully considered during accurate determinations Each individual QCM user must determine the effect of temperature on the experiments being performed and either control the temperature accordingly or measure the temperature and compensate for it Electrode Polishing Electrode surface roughness can cause large apparent mass loadings due to the liquid that is trapped within pores at the crystal surface23 As a general rule optically polished crystals (50Aring average surface roughness) are required to obtain good agreement between theory and experiment during liquid immersion experiments The water immersion checkup test (below) provides a quick-and-easy way to test the crystal finish for liquid-QCM applications System Checkup A comparison against the theoretical predictions of equation 6 (amp7) is usually a good starting point when testing a new experimental liquid-QCM100 setup Two common ldquocheckuprdquo procedures are described diams Water Immersion For a 5MHz polished crystal and assuming that the
electrode capacitance has been properly cancelled a decrease in frequency of asymp715 Hz and an increase in series resonance resistance of asymp380 Ω is expected when switching from air to complete immersion in water at 20degC
diams GlycerolH2O Immersion Figure 7 shows resistance and frequency change values expected for a polished 5MHz crystal immersed in a series of viscous glycerolwater solutions at 20ordmC Operation at increasing glycerol concentrations is an excellent test of a QCM experimental setup and should provide predictable results up to more than 88 glycerol
In both procedures an agreement between measured and expected values within +- 25 is generally considered acceptable for glycerol concentrations up to 70 Frequency shifts are much larger (ie at least a factor of two) and unpredictable for unpolished crystals so they are not recommended for system checkup
wwwthinkSRScom
Stanford Research Systems (408)744-9040
Electrochemical Quartz Crystal Microbalance In most electrochemical experiments mass changes occur as material is deposited or lost from the ldquoworkingrdquo electrode It is of interest to monitor those changes simultaneously with the electrochemical response and the QCM is the standard means of doing so As a gravimetric probe the QCM has been used in many types of electrochemical studies including underpotential deposition of metals24 corrosion oxide formation dissolution studies25 adsorptiondesorption of surfactants26 and changes in conductive polymer films during redox processes27 The basic principles and applications of the QCM to electrochemical processes have been extensively reviewed in the electrochemical literature28 and will only be discussed briefly in this manual Please refer to the publications list at the end of this chapter for more detailed information Electrochemical Apparatus A schematic diagram of the apparatus for electrochemical quartz crystal microbalance (EQCM) experiments is given in Figure 8 In this example a 1inch diameter polished QCM crystal is mounted on a crystal holder with only one electrode exposed to the conductive solution The crystal holder is connected to a QCM25 Crystal Controller and the liquid-contact electrode is connected to the ldquoworking electroderdquo lead of the potentiostat (through the ldquoCrystal Face Biasrdquo connector of the QCM25 Crystal Controller) A QCM100 Analog Controller provides independent frequency and conductance outputs which are read and displayed by a frequency counter and a digital multimeter (or AD converter) respectively
wwwthinkSRScom
Stanford Research Systems (408)744-9040
Figure 8 Schematic of EQCM apparatus
A PC (not shown) is often interfaced to the potentiostat frequency counter and DMM and integrates the QCM and electrochemical data into a single software package Note The QCM25 Crystal Controller provides transformer isolation of the crystal front face electrode This allows direct electrical connection of the quartz crystal face to the ldquoworking electroderdquo pin of any standard potentiostatgalvanostat With the instrument in Figure 8 a typical cyclic voltammetric-EQCM experiment would involve the application of the electrochemical waveform to the working electrode and the simultaneous measurement of the current flowing through the electrochemical cell and the oscillation frequency and series resonance resistance of the crystal Figure 9 is an example of a typical voltammogram-massogram plot obtained from a 10mM solution of CuSO4 in 01M H2SO4 using a 1inch diameter Au coated quartz crystal mounted in a standard holder as the working electrode
Digital Multimeter
QCM25
Reference Electrode
Counter Electrode
Work Electrode
Potentiostat
QCM100 Analog Controller
Frequency Counter
Crystal Holder
wwwthinkSRScom
Stanford Research Systems (408)744-9040
Figure 9 Cyclic voltammogram and massogram data for Cu deposition on a Au
electrode The frequency ndashpotential diagram shows a frequency decrease in perfect sync with the deposition of Cu metal on the crystalrsquos surface
Calibration It has been amply demonstrated in the literature that when experiments involve only relative frequency shifts which are measured in a fixed solution the offset caused by the viscous loading of the liquid has negligible effect on the accuracy of the Sauerbrey equation for the determination of small mass changes in rigid deposits29 Quantitative interpretation of the EQCM data in those cases is based on the combination of the Sauerbrey equation (equation 1) and Faradayrsquos law The former relates change in frequency to change in mass for thin rigid deposits whereas the latter relates charge passed in an electrochemical experiment to the number of moles of material electrolyzed Therefore frequency changes can be related to the total charge passed An example would be the electrodeposition of Ag on a Pt electrode QCM crystal The charge Q is an integral measure of the total number of electrons delivered at the interface during the reduction process To the extent that each electron supplied results in the deposition of one atom of Ag there should be a linear relationship between Q and ∆f as is given by equation 8
∆f = 106 Mw Cf Q (n F A) (equation 8) where
wwwthinkSRScom
Stanford Research Systems (408)744-9040
∆f - frequency change in Hz Mw - apparent molar mass of the depositing species in gramsmole Cf - Sauerbreyrsquos sensitivity factor for the crystal used (see equation 1) Q - integrated charge during the reduction in Coulomb A - Active deposition area of the working (ie liquid contact) electrode in cm2 F - Faradayrsquos constant 9648 104 Coulombmole and n - number of electrons transferred to induce deposition (ie n =1 for Ag deposition) (The factor of 106 provides for the unit conversion from mg in Cf to g in Mw)
A plot of ldquo∆f vs Qrdquo will deliver the apparent mass per electron of the deposited species when n is taken into account This is often used to elucidate the mass changes that accompany redox processes and hence is very useful for characterizing the mechanisms of electron-transfer reactions However before any calculations can be performed based on equation 8 the EQCM must be calibrated in order to properly derive (1) the proportionality constant Cf of the Sauerbrey equation in solution and (2) to account for the effective area of the working electrode This is generally done using a well behaved electrochemical reaction- typically electrodeposition of silver copper or lead on a Au or Pt electrode The EQCM calibration method favored by Stanford Research Systems for its QCM100 system is based on the galvanostatic deposition of Ag A 50mM solution of AgNO3 in 05M HNO3 is subjected to a reducing potential and Ag is deposited with a fixed cathodic current density of 50-500 microAcm2 The cathodic current is integrated to obtain the charge as a function of time Excellent linearity is generally observed in ldquo∆f vs Qrdquo plots for depositions within 1 microgcm2 providing a very reliable way to calibrate the proportionality constant of equation 8 Several calibration procedures are also described in the electrochemistry literature30 and users are referred to the publications list at the end of this chapter for details Polymer Modified Electrodes The EQCM has been extensively used to study polymer modified electrodes particularly as a gravimetric tool to follow redox processes31 However for the linear frequency-to-mass relationship (described by equation 8) to hold true the polymer overlayer must exhibit no changes in rigidity during the electrochemical process Otherwise the viscoelastic changes will also contribute to the frequency change leading to an erroneous interpretation of the mass changes32 As a
wwwthinkSRScom
Stanford Research Systems (408)744-9040
consequence it is essential to determine whether or not viscoelastic properties of the polymer film influence the frequency measurement during polymer film experiments
Figure 10 Votammogram and massogram data for the oxidation of pyrrole to form a polypyrrole film on a gold coated QCM Sensor Crystal Seven cycles of
voltammetry between - 04 and 095 V were conducted in this experiment Pyrrole monomer can be oxidized to its radical at 065V As this happens a thin polypyrrole film is formed on the crystal surface resulting in a decrease in the
fundamental frequency of oscillation of the crystal The continuous growth of the film is evidenced by the irreversible decrease in frequency during the scans
A starightforward way to detect changes in film viscoelastic properties of redox films is to simultaneously monitor the series resonance resistance R of the quartz oscillator during the electrochemical experiment33 Some theoretical models34 based on the simultaneous measurement of ∆f and ∆R have been discussed in the literature for the extension of EQCM gravimetric measurements to non-rigid films The viscoelastic analyis of polymeric thin films in EQCM systems is complex because the shear wave exists simultaneously in the quartz crystal the viscoelastic film and the adjacent solution so reflection of the shear wave must be taken into account However solution of this problem would be worthwhile specially if the material properties of the film could be derived This would allow correlation of the electrochemical behavior of the film with its material properties35
01M Pyrrole in 01M HCLO4
wwwthinkSRScom
Stanford Research Systems (408)744-9040
The unique property of the QCM technique is its ability to determine the mass of very thin layers while simultaneously giving information about their viscoelastic properties The ability to measure both mass and structural changes means it is possible to detect phase-transitions cross-linking and swelling in polymeric thin films36
wwwthinkSRScom
Stanford Research Systems (408)744-9040
Chemical and Biological Sensors Anything that has mass can generate a response from a QCM sensor The universal response of the device is the reason for the wide range of application of the technology However the downside of such universal sensitivity is that you always have a great danger of interferences For analytical purposes it is imperative to find ways of getting the QCM sensor to respond only to what you are interested in (ie build sensitivity into the device) This usually involves the addition of a sensitive layer on the surface of the crystal37 Organic polymers comprise the most common type of coating used with QCM sensors due to their capability to reversibly sorb vapors and liquids38 In much of the work published on the use of polymer coatings for vapor sensing the acoustic properties of the polymer material have been neglected The relative importance of the mass-loading and viscoelastic contributions of the film to the observed QCM response is a subject that has yet to be resolved In no area have the QCM applications seen such dramatic increase in recent years as in the field of biochemical analysis QCM devices are routinely used as biochemical and immunological probes39 as well as for the investigation andor monitoring of biochemcially significant processes Sensitive selective detection of biochemically active compounds can be achieved by employing antigen-antibody40 enzyme substrates and other receptor ndashprotein pairs The potential analytical uses of these materials has been reviewed particularly with respect to the development of biochemical sensors41 QCM studies have provided detailed information about the functionalized surfaces developed for a range of biochip and biosensor applications QCM Systems are applied routinely by biologists and biochemists to obtain information about processes such as (1) protein adsorptiondesorption42 (2) cell adhesion43 (3) Protein-protein interaction (4) Degradation of polymers (5) biofouling and biofilm formation (6) drug analysis44 and (7) DNA Biosensors45
References 1 G Sauerbrey Z Phys 155 (1959) 206 2 Daniel Buttry ldquoApplications of the QCM to Electrochemistryrdquo in A Series of Advances in Electroanalytical Chemistry edited by Allen Bard Marcel Dekker 1991 p 23-33 3 John Henderson ldquoElectronic Devices Concepts and Applicationsrdquo Prentice Hall NJ (1991) p 357 4 For example QCM10 crystal holder with a 1inch 5MHz crystal connected directly to an SRS QCM25 Crystal Controller
wwwthinkSRScom
Stanford Research Systems (408)744-9040
5 C Chagnard P Gilbert N Watkins T Beeler and David W Paul ldquoAn electronic oscillator with automatic gain controlEQCM Applicationsrdquo Sensors and Actuators B 32(1996) 129-136 A Arnau T Sogorb and Y Jimenez ldquoCircuit for continuous motional series resonat frequency and motional resistance monitoring of quartz crystal resonators by parallel capacitance cancellationrdquo Rev Sci Instrum 73(7)(2002) 2724 6 For example from the Conductance Output of the QCM100 7 Conductance is the inverse of resistance Conductance = 1 Resistance or Resistance = 1 Conductance The units of resistance are Ohms [Ω = VA] and the units of conductance are Siemens (S = AV] 8 For example Agilent 34401A with 6 digit resolution or 3458 with eight digits resolution 9 DR Denison ldquoLinearity of a Heavily Loaded Quartz Crystal Microbalancerdquo J Vac Sci Technol 10(1) (1973) 126 Klaus H Behrndt ldquoLong Term Operation of Crystal Oscillators in Thin-Film Depositionrdquo J Vac Sci technol 8(5)(1971) 622 10 C Lu and O Lewis ldquoInvestigation of film-thickness determination by oscillating quartz resonators with large mass loadrdquo J Appl Phys 43 (1972) 4385 Chih-shun Lu ldquoMass determination with piezoelectric quartz crystal resonatorsrdquo J Vac Sci Technol 12(1) (1975) 578 11 D R Denison ldquoLinearity of Heavily Loaded Quartz Crystal Microbalancerdquo J Vac Sci Technol 10(1973) 126 K H Behrndt ldquoLong Term Operation of Crystal Oscillators in Thin-Film Depositionrdquo J Vac Sci Technol 8(5) (1971) 622 12 T Nomura and M Okuhara Anal Chim Acta 142(1982) 281 13 A P M Glassford ldquoResponse of a Quartz Crystal Microbalance to a liquid Depositrdquo J Vac Sci Technol 15(6)(1978) 1836 14 K Keiji Kanazawa and Joseph Gordon II ldquoFrequency of a Quartz Microbalance in Contact with Liquidrdquo Anal Chem 57(1985) 1770 K Keiji Kanazawa and Joseph G Gordon II Analytica Chimica Acta 175(1985) 99-105 15 Stephen J Martin James J Spates Kurt O Wesendorf thomas Schnneider and Robert J Huber ldquoResonator Oscillator Response to Liquid Loadingrdquo Anal Chem 69(1997) 2050 16 Stephen Martin Victoria Edwards Granstaff and Gregory C Frye ldquoCharacterization of a Quartz Crystal Microbalance with Simultaneous Mass and Liquid Loadingrdquo Anal Chem 63 (1991) 2272 17 Operation in liquids requires that the crystal be mounted in a holder such that only the front surface of the crystal is in contact with the fluid while at the same time providing an electrical connection to both electrodes 18 For pure water at 20C ρL 09982 g cm-3 and ηL 100210-2 g cm-1 s-1 19 H Muramatsu Eiichi Tamiya and Isao Karube ldquoComputation of Equivalent Circuit Parameters of Quartz Crystals in Contact with Liquids and Study of Liquid Propertiesrdquo Anal Chem 60(1988) 2142 SJ Geelhood C W Frank and K Kanazawa ldquoTransient Quartz Crystal Microbalance Behaviors Comparedrdquo Journal of the Electrochemical Society 149(2002) H33-H38 Mengsu Yang and Michael Thompson ldquoMultiple Chemical Information from the Thickness Shear Mode Acoustic Wave Sensor in the liquid Phaserdquo Anal Chem 65(1993) 1158
wwwthinkSRScom
Stanford Research Systems (408)744-9040
20 S J Martin R W Cernosek and JJ Spates ldquoSensing Liquid Properties with Shear-mode Resonator Sensorsrdquo in Proceeds from TransducersEurosensors IX Stockholm Sweden (1995) 21 Michael Rodahl Fredrik Hook Anatol Krozer Peter Brzezinski and Bengt Kasemo ldquoQCM setup for frequency and Q-factor measurements in gaseous and liquid environmentsrdquo Rev Sci Instrum 66(7)(1995)3924 22 S J Geelhood CW Frank and K Kanazawa ldquoTransient QCM Behaviors Comparedrdquo J of the Electrochemical Societyrdquo 149(1)(2002)H33 23 Stephen Martin et al rdquoEffect of Surface Roughness on the Response of Thickness-Shear Mode Resonators in Liquidsrdquo Anal Chem 65(1993)2910 Michael Ward and Edward J Delawski ldquoRadial Mass Sensitivity of the Quartz Crystal Microbalance in Liquid Mediardquo Anal Chem 63(1991) 886 24 Mark R Deakin and Owen Melroy ldquoUnderpotential Metal Deposition on Au monitorred in situ with a Quartz Microbalancerdquo J Electroanal Chem 239(1988) 321 O Melroy K Kanazawa JG Gordon II and D Buttry ldquoDirect Determination of the Mass of an Underpotentially Deposited Monolayer of Lead on Goldrdquo Langmuir 2(1986)697 Masahiro Seo Masaki Aomi and Kengo Yoshida ldquoA combined Piezoelectric and EQCM study of Underpotential Deposition of Silver on Gold Electrodesrdquo Electrochimica Acta 39(89) (1994) 1039 Youngran Lim and Euijin Hwang ldquoAn Electrochemical QCM study of Oxygen reducttion during the Underpotential Depoosition of Lead on a Gold Electroderdquo Bull Korean Chem Soc 17(12)(1996)1091 25 EQCMWall Jet Split-Ring Disk Electrode study on Copper dissolution in Chloride Aqueous solutionrdquo Anal Sciences16(2000)1049 Michael Benje Matthias Eiermann Udo Pittermann and Konrad G Weil ldquoAn improved Quartz Microbalnce Applications to Electrocrystallizatuion and dissolution of Niquelrdquo Ber Bunsenges Phys Chem 90(1986) 435 26 Jorg Auge Peter Hauptmann Frank Eichelbaum and Stephen Rosler ldquoQCM sensor in liquidsrdquo Sensors and Actuators B 18-19 (1994) 518 27 Adrian W Bott ldquoCharacterization of Films Immobilized on an Electrode Surface Using the EQCMrdquo Current Separations 183(1999)79 28 Mark Deakin and Daniel Buttry ldquoElectrochemical Applications of the Quartz Crystal Microbalancerdquo Anal Chem 61(20)(1989)183 Daniel Buttry and Michael Ward ldquoMeasurement of Interfacial Processes at electrode surfaces with the EQCMrdquo Chem Rev 92(6) (1992) 1355 29 Wolfgang Stockel and Rolf Schumacher ldquoIn situ Microweighing at the Junction MetalElectrolyterdquo Ber Bunsenges Phys Chem 91(1987)345 30 C Gabrielli M Keddam and R Torrei ldquoCalibration of the Electrochemical Quartz Crystal Microbalancerdquo J Electrochem Soc 139(9) (1991) 2657 Note A calibration procedure based on the deposition of Ag on Au electrodes is described Graeme Andrew Snook Investigation of Solid-State Reactions by Electrochemical and Quartz Crystal Microbalance Measurements PhD Thesis 2000 Department of Chemistry Monash University Clayton 3168 Melbourne Australia and Division of Minerals CSIRO Clayton South 3169 Melbourne Australia under the supervision of Professor Alan Maxwell Bond (Monash) and Professor Stephen Fletcher (CSIRO)
wwwthinkSRScom
Stanford Research Systems (408)744-9040
Available for download from httpwww-bondchemmonasheduautheses Note the use of Lead acetate is proposed as a better alternative to Cu and Ag deposition Bruckenstein S and Shay M ldquoExperimental aspects of use of the quartz crystal microbalance in solutionrdquo Electrochim Acta 30(1985) 1295 31 Duke Orata and Daniel A Buttry ldquoDetermination of Ion Populations and Solvent Content as fucntions of Redox State and pH in Polyanilinerdquo J Am Chem Soc 109(1987)3574 32 Michael Ward ldquoInvestigation of Open Circuit Reactions of Polymer Films Using the QCM Reactions of Polyvinylferrocene Filmsrdquo J Phys Chem 92(1988)2049 Charles K Baker and John R Reynolds ldquoA quartz microbalance study of the electrosynthesis of polypyrrolerdquo J Electroanal Chem 251(1988) 307 33 Stephen Martin Victoria Edwards Granstaff and Gregory C Frye ldquoCharacterization of a Quartz Crystal Microbalance with Simultaneouus Mass and Liquid Loadingrdquo Anal Chem 63 (1991) 2272 Ralf Lucklum and Peter Hauptmann ldquoThe Df-DR QCM technique an approach to an advanced sensor signal interpretationrdquo Electrochimica Acta 45(2000) 3907 34 RA Etchenique and E L CalvordquoGravimetric measurement in redox polymer electrodes with the EQCM beyond the Sauerbrey limitrdquo Electrochemistry Communications 1(5)(1999)167 RA Etchenique and E J Calvo ldquoElectrochemical Quartz Crystal Impedance Study of Redox Hydrogel Mediators for Amperometryic Enzyme Electrodesrdquo Anal Chem 69(1997)4833 35 E J Calvo R Etchenique P N Bartlett K Singhal and Santamaria ldquoQuartz Crystal Impedance studies at 10MHz of viscoelastic liquids and filmsrdquo Faraday Discuss107(1997)141 Diethelm Johannsmann ldquoViscoelastic Analysis of Organic Thin Filmsrdquo on quartz resonatorsrdquo Macromol Chem Phys 200(1999)501 36 C E Reed K Keiji Kanazawa and J Kaufman ldquoPhysical description of a viscoelastically loaded AT-cut quartz resonatorrdquo J Appl Phys 68(5) (1990) 1993 37 D S Ballantine R M White S J Martin A J Rico E T Zellers G C Frye and H Woltjen ldquoAcoustic Wave Sensors Theory Design and Physico-Chemical Applicationsrdquo Acad Press London UK 1997 Chapter 5 (Chemical and Biological Sensors) p 222 38 GG Guilbault and J Jordan ldquoAnalytical uses of piezoelectric crystalsrdquo CRC Reviews 19 p 1-28 W H King ldquoPiezoelectric Sorption Detectorrdquo Anal Chem 36 (1964) 1735 39 Iddo Ben-Dov and Itamar Willmer ldquoPiezoelectric Immunosensors for Urine Specimens of Chlamidia trachomatis Employing QCM Microgravimetric Analysisrdquo Anal Chem 69(1997) 3506 40 A Hengerer C Koumlsslinger1 J Decker S Hauck1 I Queitsch2 H Wolf and S Duumlbel2 ldquoDetermination of Phage Antibody Affinities to Antigen by a Microbalance Sensor Systemrdquo BioTechniques 26956-964 (May 1999) 41 G G Guibault ldquoAnalytical uses of immobilized Enzymes Modern Monographs in Analytical Chemistryrdquo Vol 2Marcel Dekker New York (1984) G M Minunni M Mascini GG Guilbault B Hock ldquoThe Quartz Crystal Microbalance as Biosensor A Status Report on its Futurerdquo Anal Lett 28 5(1995) 749 S Tombelli M Mascini ldquoPiezoelectric Quartz Crystal Biosensor Recent Immobilisation Schemesrdquo Anal Lett 33(11) 2000 pp 2129-2151
wwwthinkSRScom
Stanford Research Systems (408)744-9040
Kim R Rogers ldquoPrinciples of Affinity Based Biosensorsrdquo Molecular Biotechnology 14(2000)109 42 Fredrik Hook et al ldquoStructural changes in hemoglobin during adsorption to solid surfaces effects of pH ionic strength and ligand bindingrdquo Proc Natl Acad Sci USA 95(1998)12271 43 C Fredriksson S Kihlman M Rodahl and B Kasemo ldquoThe Piezoelectric Quartz crystal Mass and Dissipation Sensor A means of studyinng Cell adhesionrdquo Langmuir 19(1998) 248 Ann-Sofie Cans et al ldquoMeasurement of the Dynamics of Exocytosis and Vesicle Retrieval at Cell Populations Using a QCMrdquo Anal Chem 73(2001)5805 C A Keller and B KasemordquoSurface Specific Kinetics of Lipid Vesicle Adsorption Measured with a QCMrdquo Biophysical Journal 75(1998) 1397 44 Wei W Z et al ldquoSelective pharmaceutical analyis technique with sensitive piezoelectric quartz sensorsrdquo Anal Lett 26(11)(1993)2371 45 Storri S Santoni T Mascini MrdquoA piezoelectric biosensor for DNA hybridization detectionrdquo Anal Lett 31(11)(1998)1795

wwwthinkSRScom
Stanford Research Systems (408)744-9040
∆R = [n ωs Lu Π][ (2 ωs
ρL ηL) (ρq
microq)]12 (equation 7)
Where ∆R - change in series resonance resistance in Ω n - number of sides in contact with liquid ωs - angular frequency at series resonance(= 2Πfs where fs is the oscillation frequency in solution in Hz) and Lu - Inductance for the unperturbed (ie dry) resonator usually in mH
The QCM100 System was specifically designed for operation under heavy viscous loading The standard Crystal Holder supports operation in gas and liquid environments and provides single-electrode exposure to liquids17 (ie n =1 in equation 7) as required for compatibility with electrochemical QCM measurements The QCM25 Crystal Controller provides both frequency and resistance change signals and will maintain oscillation up to a series resonance resistance of about 5 KΩ (ie it will support crystal operation in highly viscous solutions up to 88 (ww) glycerol in water)
wwwthinkSRScom
Stanford Research Systems (408)744-9040
Figure 7 ∆f and ∆R versus glycerol weight percentage (in water) as predicted by theory and as measured with QCM100 and a 5MHz polished
crystal As an example equation 6 predicts a decrease in f0 of 715Hz on transfer from vacuum to pure water18 at 20degC in agreement with the results observed with a QCM100 using 1inch diameter polished 5MHz crystals mounted on a standard Crystal Holder Excellent agreement between the frequency and resistance equations and the experimental results has been proved19 making the QCM an
0
500
1000
1500
2000
2500
3000
3500
4000
4500
5000
0 10 20 30 40 50 60 70 80 90 100
Wt Glycerol
QCM100Theory
-12000
-11000
-10000
-9000
-8000
-7000
-6000
-5000
-4000
-3000
-2000
-1000
0
0 10 20 30 40 50 60 70 80 90 100
Wt glycerol
f H
zQCM100Theory
wwwthinkSRScom
Stanford Research Systems (408)744-9040
excellent tool for the evaluation of fluid properties Application examples include in situ monitoring of lubricant and petroleum properties20 The tight correspondence between theory (equations 6 amp 7) and experiment is clearly illustrated by Figure 7 Dissipation Technique An alternative method21 for studying the properties of the loaded QCM Sensor called the ldquoDissipation Techniquerdquo has been used in gaseous as well as in liquid environments In this case the crystal is driven at its resonant frequency by an oscillator that can be intermittently disconnected causing the crystal oscillation amplitude to decay exponentially From the recorded decay curve the absolute Q-factor (inversely proportional to R) and the frequency of the oscillator are simultaneously obtained Independent studies22 have shown that as long as the effect of the parasitic capacitance (C0) is properly cancelled the results provided by the Dissipation Technique should be in good agreement with the measurements provided by the QCM100 System
Temperature The intrinsic dependence of the resonant frequency of a quartz crystal on temperature is well known and generally quite small In fact the AT-cut quartz crystal commonly used in QCM experiments owe their popularity to their near zero coefficient at room temperature As a result the intrinsic temperature dependence of the QCM sensor crystals is negligible at or around room temperature (asymp 1-3 HzdegC) and is generally ignored for monolayer adsorptiondesorption processes in the gas phase Much larger changes in frequency with temperature are observed when QCM crystals are immersed in liquids This is due to the coupling of the shear mode oscillation with the temperature dependent viscosity and density of the fluid- the temperature coefficient due to this effect is asymp 8Hz ordmC for water As a result for experiments in liquid phase in which the frequency is to be monitored at length the temperature must be controlled to at least 01degC and preferably better In electrochemical experiments this is often achieved with temperature controlled baths and jacketed cells If temperature control is not possible or practical it is always good practice to wait at least 30 minutes before performing any accurate measurements after the crystal comes in contact with a new medium and measure the temperature of the solution around the crystal during the experiments to perform temperature compensation It is also common practice to soak the mounted crystal(s) in the solution overnight before performing any experiments to assure more stable readings Careful control of the temperature is required in high accuracy measurements to avoid frequency hysterisis effects- the dependence of resonator frequency at a
wwwthinkSRScom
Stanford Research Systems (408)744-9040
specific temperature on the prior temperature history of the resonator For example it is often observed that the frequency vs temperature curve obtained going from T1 to T2 will not coincide with the one obtained immediately after going from T2 to T1 This effect must be carefully considered during accurate determinations Each individual QCM user must determine the effect of temperature on the experiments being performed and either control the temperature accordingly or measure the temperature and compensate for it Electrode Polishing Electrode surface roughness can cause large apparent mass loadings due to the liquid that is trapped within pores at the crystal surface23 As a general rule optically polished crystals (50Aring average surface roughness) are required to obtain good agreement between theory and experiment during liquid immersion experiments The water immersion checkup test (below) provides a quick-and-easy way to test the crystal finish for liquid-QCM applications System Checkup A comparison against the theoretical predictions of equation 6 (amp7) is usually a good starting point when testing a new experimental liquid-QCM100 setup Two common ldquocheckuprdquo procedures are described diams Water Immersion For a 5MHz polished crystal and assuming that the
electrode capacitance has been properly cancelled a decrease in frequency of asymp715 Hz and an increase in series resonance resistance of asymp380 Ω is expected when switching from air to complete immersion in water at 20degC
diams GlycerolH2O Immersion Figure 7 shows resistance and frequency change values expected for a polished 5MHz crystal immersed in a series of viscous glycerolwater solutions at 20ordmC Operation at increasing glycerol concentrations is an excellent test of a QCM experimental setup and should provide predictable results up to more than 88 glycerol
In both procedures an agreement between measured and expected values within +- 25 is generally considered acceptable for glycerol concentrations up to 70 Frequency shifts are much larger (ie at least a factor of two) and unpredictable for unpolished crystals so they are not recommended for system checkup
wwwthinkSRScom
Stanford Research Systems (408)744-9040
Electrochemical Quartz Crystal Microbalance In most electrochemical experiments mass changes occur as material is deposited or lost from the ldquoworkingrdquo electrode It is of interest to monitor those changes simultaneously with the electrochemical response and the QCM is the standard means of doing so As a gravimetric probe the QCM has been used in many types of electrochemical studies including underpotential deposition of metals24 corrosion oxide formation dissolution studies25 adsorptiondesorption of surfactants26 and changes in conductive polymer films during redox processes27 The basic principles and applications of the QCM to electrochemical processes have been extensively reviewed in the electrochemical literature28 and will only be discussed briefly in this manual Please refer to the publications list at the end of this chapter for more detailed information Electrochemical Apparatus A schematic diagram of the apparatus for electrochemical quartz crystal microbalance (EQCM) experiments is given in Figure 8 In this example a 1inch diameter polished QCM crystal is mounted on a crystal holder with only one electrode exposed to the conductive solution The crystal holder is connected to a QCM25 Crystal Controller and the liquid-contact electrode is connected to the ldquoworking electroderdquo lead of the potentiostat (through the ldquoCrystal Face Biasrdquo connector of the QCM25 Crystal Controller) A QCM100 Analog Controller provides independent frequency and conductance outputs which are read and displayed by a frequency counter and a digital multimeter (or AD converter) respectively
wwwthinkSRScom
Stanford Research Systems (408)744-9040
Figure 8 Schematic of EQCM apparatus
A PC (not shown) is often interfaced to the potentiostat frequency counter and DMM and integrates the QCM and electrochemical data into a single software package Note The QCM25 Crystal Controller provides transformer isolation of the crystal front face electrode This allows direct electrical connection of the quartz crystal face to the ldquoworking electroderdquo pin of any standard potentiostatgalvanostat With the instrument in Figure 8 a typical cyclic voltammetric-EQCM experiment would involve the application of the electrochemical waveform to the working electrode and the simultaneous measurement of the current flowing through the electrochemical cell and the oscillation frequency and series resonance resistance of the crystal Figure 9 is an example of a typical voltammogram-massogram plot obtained from a 10mM solution of CuSO4 in 01M H2SO4 using a 1inch diameter Au coated quartz crystal mounted in a standard holder as the working electrode
Digital Multimeter
QCM25
Reference Electrode
Counter Electrode
Work Electrode
Potentiostat
QCM100 Analog Controller
Frequency Counter
Crystal Holder
wwwthinkSRScom
Stanford Research Systems (408)744-9040
Figure 9 Cyclic voltammogram and massogram data for Cu deposition on a Au
electrode The frequency ndashpotential diagram shows a frequency decrease in perfect sync with the deposition of Cu metal on the crystalrsquos surface
Calibration It has been amply demonstrated in the literature that when experiments involve only relative frequency shifts which are measured in a fixed solution the offset caused by the viscous loading of the liquid has negligible effect on the accuracy of the Sauerbrey equation for the determination of small mass changes in rigid deposits29 Quantitative interpretation of the EQCM data in those cases is based on the combination of the Sauerbrey equation (equation 1) and Faradayrsquos law The former relates change in frequency to change in mass for thin rigid deposits whereas the latter relates charge passed in an electrochemical experiment to the number of moles of material electrolyzed Therefore frequency changes can be related to the total charge passed An example would be the electrodeposition of Ag on a Pt electrode QCM crystal The charge Q is an integral measure of the total number of electrons delivered at the interface during the reduction process To the extent that each electron supplied results in the deposition of one atom of Ag there should be a linear relationship between Q and ∆f as is given by equation 8
∆f = 106 Mw Cf Q (n F A) (equation 8) where
wwwthinkSRScom
Stanford Research Systems (408)744-9040
∆f - frequency change in Hz Mw - apparent molar mass of the depositing species in gramsmole Cf - Sauerbreyrsquos sensitivity factor for the crystal used (see equation 1) Q - integrated charge during the reduction in Coulomb A - Active deposition area of the working (ie liquid contact) electrode in cm2 F - Faradayrsquos constant 9648 104 Coulombmole and n - number of electrons transferred to induce deposition (ie n =1 for Ag deposition) (The factor of 106 provides for the unit conversion from mg in Cf to g in Mw)
A plot of ldquo∆f vs Qrdquo will deliver the apparent mass per electron of the deposited species when n is taken into account This is often used to elucidate the mass changes that accompany redox processes and hence is very useful for characterizing the mechanisms of electron-transfer reactions However before any calculations can be performed based on equation 8 the EQCM must be calibrated in order to properly derive (1) the proportionality constant Cf of the Sauerbrey equation in solution and (2) to account for the effective area of the working electrode This is generally done using a well behaved electrochemical reaction- typically electrodeposition of silver copper or lead on a Au or Pt electrode The EQCM calibration method favored by Stanford Research Systems for its QCM100 system is based on the galvanostatic deposition of Ag A 50mM solution of AgNO3 in 05M HNO3 is subjected to a reducing potential and Ag is deposited with a fixed cathodic current density of 50-500 microAcm2 The cathodic current is integrated to obtain the charge as a function of time Excellent linearity is generally observed in ldquo∆f vs Qrdquo plots for depositions within 1 microgcm2 providing a very reliable way to calibrate the proportionality constant of equation 8 Several calibration procedures are also described in the electrochemistry literature30 and users are referred to the publications list at the end of this chapter for details Polymer Modified Electrodes The EQCM has been extensively used to study polymer modified electrodes particularly as a gravimetric tool to follow redox processes31 However for the linear frequency-to-mass relationship (described by equation 8) to hold true the polymer overlayer must exhibit no changes in rigidity during the electrochemical process Otherwise the viscoelastic changes will also contribute to the frequency change leading to an erroneous interpretation of the mass changes32 As a
wwwthinkSRScom
Stanford Research Systems (408)744-9040
consequence it is essential to determine whether or not viscoelastic properties of the polymer film influence the frequency measurement during polymer film experiments
Figure 10 Votammogram and massogram data for the oxidation of pyrrole to form a polypyrrole film on a gold coated QCM Sensor Crystal Seven cycles of
voltammetry between - 04 and 095 V were conducted in this experiment Pyrrole monomer can be oxidized to its radical at 065V As this happens a thin polypyrrole film is formed on the crystal surface resulting in a decrease in the
fundamental frequency of oscillation of the crystal The continuous growth of the film is evidenced by the irreversible decrease in frequency during the scans
A starightforward way to detect changes in film viscoelastic properties of redox films is to simultaneously monitor the series resonance resistance R of the quartz oscillator during the electrochemical experiment33 Some theoretical models34 based on the simultaneous measurement of ∆f and ∆R have been discussed in the literature for the extension of EQCM gravimetric measurements to non-rigid films The viscoelastic analyis of polymeric thin films in EQCM systems is complex because the shear wave exists simultaneously in the quartz crystal the viscoelastic film and the adjacent solution so reflection of the shear wave must be taken into account However solution of this problem would be worthwhile specially if the material properties of the film could be derived This would allow correlation of the electrochemical behavior of the film with its material properties35
01M Pyrrole in 01M HCLO4
wwwthinkSRScom
Stanford Research Systems (408)744-9040
The unique property of the QCM technique is its ability to determine the mass of very thin layers while simultaneously giving information about their viscoelastic properties The ability to measure both mass and structural changes means it is possible to detect phase-transitions cross-linking and swelling in polymeric thin films36
wwwthinkSRScom
Stanford Research Systems (408)744-9040
Chemical and Biological Sensors Anything that has mass can generate a response from a QCM sensor The universal response of the device is the reason for the wide range of application of the technology However the downside of such universal sensitivity is that you always have a great danger of interferences For analytical purposes it is imperative to find ways of getting the QCM sensor to respond only to what you are interested in (ie build sensitivity into the device) This usually involves the addition of a sensitive layer on the surface of the crystal37 Organic polymers comprise the most common type of coating used with QCM sensors due to their capability to reversibly sorb vapors and liquids38 In much of the work published on the use of polymer coatings for vapor sensing the acoustic properties of the polymer material have been neglected The relative importance of the mass-loading and viscoelastic contributions of the film to the observed QCM response is a subject that has yet to be resolved In no area have the QCM applications seen such dramatic increase in recent years as in the field of biochemical analysis QCM devices are routinely used as biochemical and immunological probes39 as well as for the investigation andor monitoring of biochemcially significant processes Sensitive selective detection of biochemically active compounds can be achieved by employing antigen-antibody40 enzyme substrates and other receptor ndashprotein pairs The potential analytical uses of these materials has been reviewed particularly with respect to the development of biochemical sensors41 QCM studies have provided detailed information about the functionalized surfaces developed for a range of biochip and biosensor applications QCM Systems are applied routinely by biologists and biochemists to obtain information about processes such as (1) protein adsorptiondesorption42 (2) cell adhesion43 (3) Protein-protein interaction (4) Degradation of polymers (5) biofouling and biofilm formation (6) drug analysis44 and (7) DNA Biosensors45
References 1 G Sauerbrey Z Phys 155 (1959) 206 2 Daniel Buttry ldquoApplications of the QCM to Electrochemistryrdquo in A Series of Advances in Electroanalytical Chemistry edited by Allen Bard Marcel Dekker 1991 p 23-33 3 John Henderson ldquoElectronic Devices Concepts and Applicationsrdquo Prentice Hall NJ (1991) p 357 4 For example QCM10 crystal holder with a 1inch 5MHz crystal connected directly to an SRS QCM25 Crystal Controller
wwwthinkSRScom
Stanford Research Systems (408)744-9040
5 C Chagnard P Gilbert N Watkins T Beeler and David W Paul ldquoAn electronic oscillator with automatic gain controlEQCM Applicationsrdquo Sensors and Actuators B 32(1996) 129-136 A Arnau T Sogorb and Y Jimenez ldquoCircuit for continuous motional series resonat frequency and motional resistance monitoring of quartz crystal resonators by parallel capacitance cancellationrdquo Rev Sci Instrum 73(7)(2002) 2724 6 For example from the Conductance Output of the QCM100 7 Conductance is the inverse of resistance Conductance = 1 Resistance or Resistance = 1 Conductance The units of resistance are Ohms [Ω = VA] and the units of conductance are Siemens (S = AV] 8 For example Agilent 34401A with 6 digit resolution or 3458 with eight digits resolution 9 DR Denison ldquoLinearity of a Heavily Loaded Quartz Crystal Microbalancerdquo J Vac Sci Technol 10(1) (1973) 126 Klaus H Behrndt ldquoLong Term Operation of Crystal Oscillators in Thin-Film Depositionrdquo J Vac Sci technol 8(5)(1971) 622 10 C Lu and O Lewis ldquoInvestigation of film-thickness determination by oscillating quartz resonators with large mass loadrdquo J Appl Phys 43 (1972) 4385 Chih-shun Lu ldquoMass determination with piezoelectric quartz crystal resonatorsrdquo J Vac Sci Technol 12(1) (1975) 578 11 D R Denison ldquoLinearity of Heavily Loaded Quartz Crystal Microbalancerdquo J Vac Sci Technol 10(1973) 126 K H Behrndt ldquoLong Term Operation of Crystal Oscillators in Thin-Film Depositionrdquo J Vac Sci Technol 8(5) (1971) 622 12 T Nomura and M Okuhara Anal Chim Acta 142(1982) 281 13 A P M Glassford ldquoResponse of a Quartz Crystal Microbalance to a liquid Depositrdquo J Vac Sci Technol 15(6)(1978) 1836 14 K Keiji Kanazawa and Joseph Gordon II ldquoFrequency of a Quartz Microbalance in Contact with Liquidrdquo Anal Chem 57(1985) 1770 K Keiji Kanazawa and Joseph G Gordon II Analytica Chimica Acta 175(1985) 99-105 15 Stephen J Martin James J Spates Kurt O Wesendorf thomas Schnneider and Robert J Huber ldquoResonator Oscillator Response to Liquid Loadingrdquo Anal Chem 69(1997) 2050 16 Stephen Martin Victoria Edwards Granstaff and Gregory C Frye ldquoCharacterization of a Quartz Crystal Microbalance with Simultaneous Mass and Liquid Loadingrdquo Anal Chem 63 (1991) 2272 17 Operation in liquids requires that the crystal be mounted in a holder such that only the front surface of the crystal is in contact with the fluid while at the same time providing an electrical connection to both electrodes 18 For pure water at 20C ρL 09982 g cm-3 and ηL 100210-2 g cm-1 s-1 19 H Muramatsu Eiichi Tamiya and Isao Karube ldquoComputation of Equivalent Circuit Parameters of Quartz Crystals in Contact with Liquids and Study of Liquid Propertiesrdquo Anal Chem 60(1988) 2142 SJ Geelhood C W Frank and K Kanazawa ldquoTransient Quartz Crystal Microbalance Behaviors Comparedrdquo Journal of the Electrochemical Society 149(2002) H33-H38 Mengsu Yang and Michael Thompson ldquoMultiple Chemical Information from the Thickness Shear Mode Acoustic Wave Sensor in the liquid Phaserdquo Anal Chem 65(1993) 1158
wwwthinkSRScom
Stanford Research Systems (408)744-9040
20 S J Martin R W Cernosek and JJ Spates ldquoSensing Liquid Properties with Shear-mode Resonator Sensorsrdquo in Proceeds from TransducersEurosensors IX Stockholm Sweden (1995) 21 Michael Rodahl Fredrik Hook Anatol Krozer Peter Brzezinski and Bengt Kasemo ldquoQCM setup for frequency and Q-factor measurements in gaseous and liquid environmentsrdquo Rev Sci Instrum 66(7)(1995)3924 22 S J Geelhood CW Frank and K Kanazawa ldquoTransient QCM Behaviors Comparedrdquo J of the Electrochemical Societyrdquo 149(1)(2002)H33 23 Stephen Martin et al rdquoEffect of Surface Roughness on the Response of Thickness-Shear Mode Resonators in Liquidsrdquo Anal Chem 65(1993)2910 Michael Ward and Edward J Delawski ldquoRadial Mass Sensitivity of the Quartz Crystal Microbalance in Liquid Mediardquo Anal Chem 63(1991) 886 24 Mark R Deakin and Owen Melroy ldquoUnderpotential Metal Deposition on Au monitorred in situ with a Quartz Microbalancerdquo J Electroanal Chem 239(1988) 321 O Melroy K Kanazawa JG Gordon II and D Buttry ldquoDirect Determination of the Mass of an Underpotentially Deposited Monolayer of Lead on Goldrdquo Langmuir 2(1986)697 Masahiro Seo Masaki Aomi and Kengo Yoshida ldquoA combined Piezoelectric and EQCM study of Underpotential Deposition of Silver on Gold Electrodesrdquo Electrochimica Acta 39(89) (1994) 1039 Youngran Lim and Euijin Hwang ldquoAn Electrochemical QCM study of Oxygen reducttion during the Underpotential Depoosition of Lead on a Gold Electroderdquo Bull Korean Chem Soc 17(12)(1996)1091 25 EQCMWall Jet Split-Ring Disk Electrode study on Copper dissolution in Chloride Aqueous solutionrdquo Anal Sciences16(2000)1049 Michael Benje Matthias Eiermann Udo Pittermann and Konrad G Weil ldquoAn improved Quartz Microbalnce Applications to Electrocrystallizatuion and dissolution of Niquelrdquo Ber Bunsenges Phys Chem 90(1986) 435 26 Jorg Auge Peter Hauptmann Frank Eichelbaum and Stephen Rosler ldquoQCM sensor in liquidsrdquo Sensors and Actuators B 18-19 (1994) 518 27 Adrian W Bott ldquoCharacterization of Films Immobilized on an Electrode Surface Using the EQCMrdquo Current Separations 183(1999)79 28 Mark Deakin and Daniel Buttry ldquoElectrochemical Applications of the Quartz Crystal Microbalancerdquo Anal Chem 61(20)(1989)183 Daniel Buttry and Michael Ward ldquoMeasurement of Interfacial Processes at electrode surfaces with the EQCMrdquo Chem Rev 92(6) (1992) 1355 29 Wolfgang Stockel and Rolf Schumacher ldquoIn situ Microweighing at the Junction MetalElectrolyterdquo Ber Bunsenges Phys Chem 91(1987)345 30 C Gabrielli M Keddam and R Torrei ldquoCalibration of the Electrochemical Quartz Crystal Microbalancerdquo J Electrochem Soc 139(9) (1991) 2657 Note A calibration procedure based on the deposition of Ag on Au electrodes is described Graeme Andrew Snook Investigation of Solid-State Reactions by Electrochemical and Quartz Crystal Microbalance Measurements PhD Thesis 2000 Department of Chemistry Monash University Clayton 3168 Melbourne Australia and Division of Minerals CSIRO Clayton South 3169 Melbourne Australia under the supervision of Professor Alan Maxwell Bond (Monash) and Professor Stephen Fletcher (CSIRO)
wwwthinkSRScom
Stanford Research Systems (408)744-9040
Available for download from httpwww-bondchemmonasheduautheses Note the use of Lead acetate is proposed as a better alternative to Cu and Ag deposition Bruckenstein S and Shay M ldquoExperimental aspects of use of the quartz crystal microbalance in solutionrdquo Electrochim Acta 30(1985) 1295 31 Duke Orata and Daniel A Buttry ldquoDetermination of Ion Populations and Solvent Content as fucntions of Redox State and pH in Polyanilinerdquo J Am Chem Soc 109(1987)3574 32 Michael Ward ldquoInvestigation of Open Circuit Reactions of Polymer Films Using the QCM Reactions of Polyvinylferrocene Filmsrdquo J Phys Chem 92(1988)2049 Charles K Baker and John R Reynolds ldquoA quartz microbalance study of the electrosynthesis of polypyrrolerdquo J Electroanal Chem 251(1988) 307 33 Stephen Martin Victoria Edwards Granstaff and Gregory C Frye ldquoCharacterization of a Quartz Crystal Microbalance with Simultaneouus Mass and Liquid Loadingrdquo Anal Chem 63 (1991) 2272 Ralf Lucklum and Peter Hauptmann ldquoThe Df-DR QCM technique an approach to an advanced sensor signal interpretationrdquo Electrochimica Acta 45(2000) 3907 34 RA Etchenique and E L CalvordquoGravimetric measurement in redox polymer electrodes with the EQCM beyond the Sauerbrey limitrdquo Electrochemistry Communications 1(5)(1999)167 RA Etchenique and E J Calvo ldquoElectrochemical Quartz Crystal Impedance Study of Redox Hydrogel Mediators for Amperometryic Enzyme Electrodesrdquo Anal Chem 69(1997)4833 35 E J Calvo R Etchenique P N Bartlett K Singhal and Santamaria ldquoQuartz Crystal Impedance studies at 10MHz of viscoelastic liquids and filmsrdquo Faraday Discuss107(1997)141 Diethelm Johannsmann ldquoViscoelastic Analysis of Organic Thin Filmsrdquo on quartz resonatorsrdquo Macromol Chem Phys 200(1999)501 36 C E Reed K Keiji Kanazawa and J Kaufman ldquoPhysical description of a viscoelastically loaded AT-cut quartz resonatorrdquo J Appl Phys 68(5) (1990) 1993 37 D S Ballantine R M White S J Martin A J Rico E T Zellers G C Frye and H Woltjen ldquoAcoustic Wave Sensors Theory Design and Physico-Chemical Applicationsrdquo Acad Press London UK 1997 Chapter 5 (Chemical and Biological Sensors) p 222 38 GG Guilbault and J Jordan ldquoAnalytical uses of piezoelectric crystalsrdquo CRC Reviews 19 p 1-28 W H King ldquoPiezoelectric Sorption Detectorrdquo Anal Chem 36 (1964) 1735 39 Iddo Ben-Dov and Itamar Willmer ldquoPiezoelectric Immunosensors for Urine Specimens of Chlamidia trachomatis Employing QCM Microgravimetric Analysisrdquo Anal Chem 69(1997) 3506 40 A Hengerer C Koumlsslinger1 J Decker S Hauck1 I Queitsch2 H Wolf and S Duumlbel2 ldquoDetermination of Phage Antibody Affinities to Antigen by a Microbalance Sensor Systemrdquo BioTechniques 26956-964 (May 1999) 41 G G Guibault ldquoAnalytical uses of immobilized Enzymes Modern Monographs in Analytical Chemistryrdquo Vol 2Marcel Dekker New York (1984) G M Minunni M Mascini GG Guilbault B Hock ldquoThe Quartz Crystal Microbalance as Biosensor A Status Report on its Futurerdquo Anal Lett 28 5(1995) 749 S Tombelli M Mascini ldquoPiezoelectric Quartz Crystal Biosensor Recent Immobilisation Schemesrdquo Anal Lett 33(11) 2000 pp 2129-2151
wwwthinkSRScom
Stanford Research Systems (408)744-9040
Kim R Rogers ldquoPrinciples of Affinity Based Biosensorsrdquo Molecular Biotechnology 14(2000)109 42 Fredrik Hook et al ldquoStructural changes in hemoglobin during adsorption to solid surfaces effects of pH ionic strength and ligand bindingrdquo Proc Natl Acad Sci USA 95(1998)12271 43 C Fredriksson S Kihlman M Rodahl and B Kasemo ldquoThe Piezoelectric Quartz crystal Mass and Dissipation Sensor A means of studyinng Cell adhesionrdquo Langmuir 19(1998) 248 Ann-Sofie Cans et al ldquoMeasurement of the Dynamics of Exocytosis and Vesicle Retrieval at Cell Populations Using a QCMrdquo Anal Chem 73(2001)5805 C A Keller and B KasemordquoSurface Specific Kinetics of Lipid Vesicle Adsorption Measured with a QCMrdquo Biophysical Journal 75(1998) 1397 44 Wei W Z et al ldquoSelective pharmaceutical analyis technique with sensitive piezoelectric quartz sensorsrdquo Anal Lett 26(11)(1993)2371 45 Storri S Santoni T Mascini MrdquoA piezoelectric biosensor for DNA hybridization detectionrdquo Anal Lett 31(11)(1998)1795
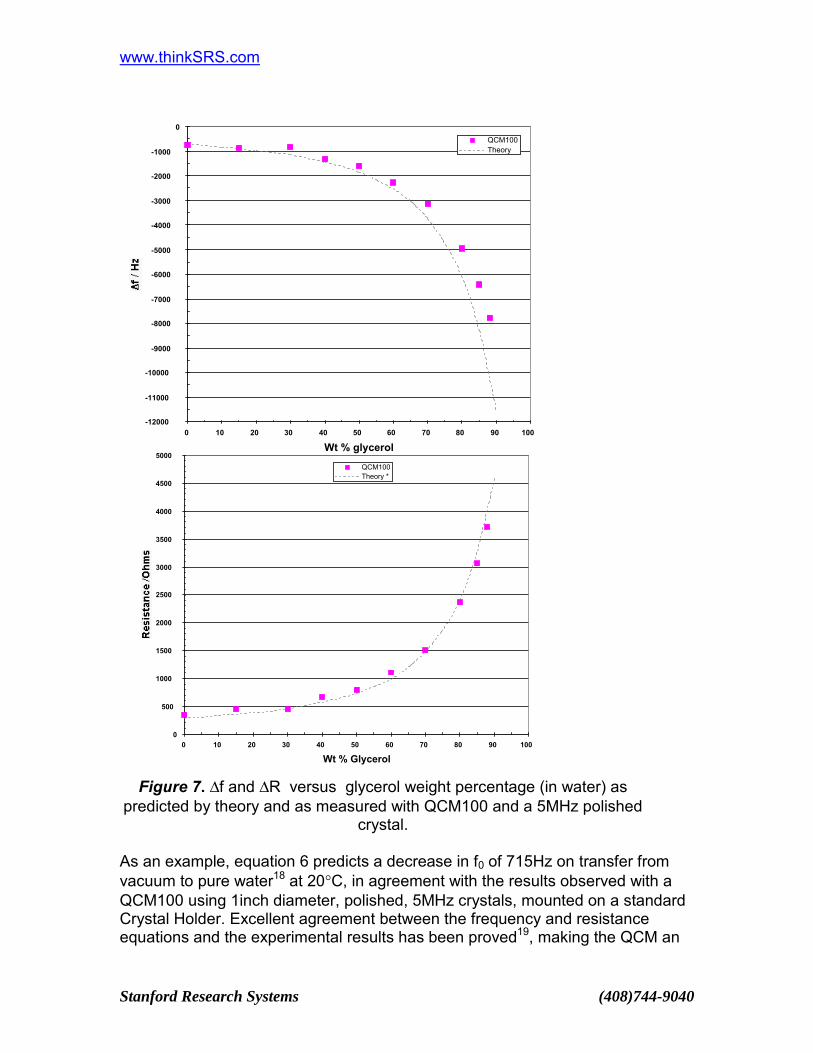
wwwthinkSRScom
Stanford Research Systems (408)744-9040
specific temperature on the prior temperature history of the resonator For example it is often observed that the frequency vs temperature curve obtained going from T1 to T2 will not coincide with the one obtained immediately after going from T2 to T1 This effect must be carefully considered during accurate determinations Each individual QCM user must determine the effect of temperature on the experiments being performed and either control the temperature accordingly or measure the temperature and compensate for it Electrode Polishing Electrode surface roughness can cause large apparent mass loadings due to the liquid that is trapped within pores at the crystal surface23 As a general rule optically polished crystals (50Aring average surface roughness) are required to obtain good agreement between theory and experiment during liquid immersion experiments The water immersion checkup test (below) provides a quick-and-easy way to test the crystal finish for liquid-QCM applications System Checkup A comparison against the theoretical predictions of equation 6 (amp7) is usually a good starting point when testing a new experimental liquid-QCM100 setup Two common ldquocheckuprdquo procedures are described diams Water Immersion For a 5MHz polished crystal and assuming that the
electrode capacitance has been properly cancelled a decrease in frequency of asymp715 Hz and an increase in series resonance resistance of asymp380 Ω is expected when switching from air to complete immersion in water at 20degC
diams GlycerolH2O Immersion Figure 7 shows resistance and frequency change values expected for a polished 5MHz crystal immersed in a series of viscous glycerolwater solutions at 20ordmC Operation at increasing glycerol concentrations is an excellent test of a QCM experimental setup and should provide predictable results up to more than 88 glycerol
In both procedures an agreement between measured and expected values within +- 25 is generally considered acceptable for glycerol concentrations up to 70 Frequency shifts are much larger (ie at least a factor of two) and unpredictable for unpolished crystals so they are not recommended for system checkup
wwwthinkSRScom
Stanford Research Systems (408)744-9040
Electrochemical Quartz Crystal Microbalance In most electrochemical experiments mass changes occur as material is deposited or lost from the ldquoworkingrdquo electrode It is of interest to monitor those changes simultaneously with the electrochemical response and the QCM is the standard means of doing so As a gravimetric probe the QCM has been used in many types of electrochemical studies including underpotential deposition of metals24 corrosion oxide formation dissolution studies25 adsorptiondesorption of surfactants26 and changes in conductive polymer films during redox processes27 The basic principles and applications of the QCM to electrochemical processes have been extensively reviewed in the electrochemical literature28 and will only be discussed briefly in this manual Please refer to the publications list at the end of this chapter for more detailed information Electrochemical Apparatus A schematic diagram of the apparatus for electrochemical quartz crystal microbalance (EQCM) experiments is given in Figure 8 In this example a 1inch diameter polished QCM crystal is mounted on a crystal holder with only one electrode exposed to the conductive solution The crystal holder is connected to a QCM25 Crystal Controller and the liquid-contact electrode is connected to the ldquoworking electroderdquo lead of the potentiostat (through the ldquoCrystal Face Biasrdquo connector of the QCM25 Crystal Controller) A QCM100 Analog Controller provides independent frequency and conductance outputs which are read and displayed by a frequency counter and a digital multimeter (or AD converter) respectively
wwwthinkSRScom
Stanford Research Systems (408)744-9040
Figure 8 Schematic of EQCM apparatus
A PC (not shown) is often interfaced to the potentiostat frequency counter and DMM and integrates the QCM and electrochemical data into a single software package Note The QCM25 Crystal Controller provides transformer isolation of the crystal front face electrode This allows direct electrical connection of the quartz crystal face to the ldquoworking electroderdquo pin of any standard potentiostatgalvanostat With the instrument in Figure 8 a typical cyclic voltammetric-EQCM experiment would involve the application of the electrochemical waveform to the working electrode and the simultaneous measurement of the current flowing through the electrochemical cell and the oscillation frequency and series resonance resistance of the crystal Figure 9 is an example of a typical voltammogram-massogram plot obtained from a 10mM solution of CuSO4 in 01M H2SO4 using a 1inch diameter Au coated quartz crystal mounted in a standard holder as the working electrode
Digital Multimeter
QCM25
Reference Electrode
Counter Electrode
Work Electrode
Potentiostat
QCM100 Analog Controller
Frequency Counter
Crystal Holder
wwwthinkSRScom
Stanford Research Systems (408)744-9040
Figure 9 Cyclic voltammogram and massogram data for Cu deposition on a Au
electrode The frequency ndashpotential diagram shows a frequency decrease in perfect sync with the deposition of Cu metal on the crystalrsquos surface
Calibration It has been amply demonstrated in the literature that when experiments involve only relative frequency shifts which are measured in a fixed solution the offset caused by the viscous loading of the liquid has negligible effect on the accuracy of the Sauerbrey equation for the determination of small mass changes in rigid deposits29 Quantitative interpretation of the EQCM data in those cases is based on the combination of the Sauerbrey equation (equation 1) and Faradayrsquos law The former relates change in frequency to change in mass for thin rigid deposits whereas the latter relates charge passed in an electrochemical experiment to the number of moles of material electrolyzed Therefore frequency changes can be related to the total charge passed An example would be the electrodeposition of Ag on a Pt electrode QCM crystal The charge Q is an integral measure of the total number of electrons delivered at the interface during the reduction process To the extent that each electron supplied results in the deposition of one atom of Ag there should be a linear relationship between Q and ∆f as is given by equation 8
∆f = 106 Mw Cf Q (n F A) (equation 8) where
wwwthinkSRScom
Stanford Research Systems (408)744-9040
∆f - frequency change in Hz Mw - apparent molar mass of the depositing species in gramsmole Cf - Sauerbreyrsquos sensitivity factor for the crystal used (see equation 1) Q - integrated charge during the reduction in Coulomb A - Active deposition area of the working (ie liquid contact) electrode in cm2 F - Faradayrsquos constant 9648 104 Coulombmole and n - number of electrons transferred to induce deposition (ie n =1 for Ag deposition) (The factor of 106 provides for the unit conversion from mg in Cf to g in Mw)
A plot of ldquo∆f vs Qrdquo will deliver the apparent mass per electron of the deposited species when n is taken into account This is often used to elucidate the mass changes that accompany redox processes and hence is very useful for characterizing the mechanisms of electron-transfer reactions However before any calculations can be performed based on equation 8 the EQCM must be calibrated in order to properly derive (1) the proportionality constant Cf of the Sauerbrey equation in solution and (2) to account for the effective area of the working electrode This is generally done using a well behaved electrochemical reaction- typically electrodeposition of silver copper or lead on a Au or Pt electrode The EQCM calibration method favored by Stanford Research Systems for its QCM100 system is based on the galvanostatic deposition of Ag A 50mM solution of AgNO3 in 05M HNO3 is subjected to a reducing potential and Ag is deposited with a fixed cathodic current density of 50-500 microAcm2 The cathodic current is integrated to obtain the charge as a function of time Excellent linearity is generally observed in ldquo∆f vs Qrdquo plots for depositions within 1 microgcm2 providing a very reliable way to calibrate the proportionality constant of equation 8 Several calibration procedures are also described in the electrochemistry literature30 and users are referred to the publications list at the end of this chapter for details Polymer Modified Electrodes The EQCM has been extensively used to study polymer modified electrodes particularly as a gravimetric tool to follow redox processes31 However for the linear frequency-to-mass relationship (described by equation 8) to hold true the polymer overlayer must exhibit no changes in rigidity during the electrochemical process Otherwise the viscoelastic changes will also contribute to the frequency change leading to an erroneous interpretation of the mass changes32 As a
wwwthinkSRScom
Stanford Research Systems (408)744-9040
consequence it is essential to determine whether or not viscoelastic properties of the polymer film influence the frequency measurement during polymer film experiments
Figure 10 Votammogram and massogram data for the oxidation of pyrrole to form a polypyrrole film on a gold coated QCM Sensor Crystal Seven cycles of
voltammetry between - 04 and 095 V were conducted in this experiment Pyrrole monomer can be oxidized to its radical at 065V As this happens a thin polypyrrole film is formed on the crystal surface resulting in a decrease in the
fundamental frequency of oscillation of the crystal The continuous growth of the film is evidenced by the irreversible decrease in frequency during the scans
A starightforward way to detect changes in film viscoelastic properties of redox films is to simultaneously monitor the series resonance resistance R of the quartz oscillator during the electrochemical experiment33 Some theoretical models34 based on the simultaneous measurement of ∆f and ∆R have been discussed in the literature for the extension of EQCM gravimetric measurements to non-rigid films The viscoelastic analyis of polymeric thin films in EQCM systems is complex because the shear wave exists simultaneously in the quartz crystal the viscoelastic film and the adjacent solution so reflection of the shear wave must be taken into account However solution of this problem would be worthwhile specially if the material properties of the film could be derived This would allow correlation of the electrochemical behavior of the film with its material properties35
01M Pyrrole in 01M HCLO4
wwwthinkSRScom
Stanford Research Systems (408)744-9040
The unique property of the QCM technique is its ability to determine the mass of very thin layers while simultaneously giving information about their viscoelastic properties The ability to measure both mass and structural changes means it is possible to detect phase-transitions cross-linking and swelling in polymeric thin films36
wwwthinkSRScom
Stanford Research Systems (408)744-9040
Chemical and Biological Sensors Anything that has mass can generate a response from a QCM sensor The universal response of the device is the reason for the wide range of application of the technology However the downside of such universal sensitivity is that you always have a great danger of interferences For analytical purposes it is imperative to find ways of getting the QCM sensor to respond only to what you are interested in (ie build sensitivity into the device) This usually involves the addition of a sensitive layer on the surface of the crystal37 Organic polymers comprise the most common type of coating used with QCM sensors due to their capability to reversibly sorb vapors and liquids38 In much of the work published on the use of polymer coatings for vapor sensing the acoustic properties of the polymer material have been neglected The relative importance of the mass-loading and viscoelastic contributions of the film to the observed QCM response is a subject that has yet to be resolved In no area have the QCM applications seen such dramatic increase in recent years as in the field of biochemical analysis QCM devices are routinely used as biochemical and immunological probes39 as well as for the investigation andor monitoring of biochemcially significant processes Sensitive selective detection of biochemically active compounds can be achieved by employing antigen-antibody40 enzyme substrates and other receptor ndashprotein pairs The potential analytical uses of these materials has been reviewed particularly with respect to the development of biochemical sensors41 QCM studies have provided detailed information about the functionalized surfaces developed for a range of biochip and biosensor applications QCM Systems are applied routinely by biologists and biochemists to obtain information about processes such as (1) protein adsorptiondesorption42 (2) cell adhesion43 (3) Protein-protein interaction (4) Degradation of polymers (5) biofouling and biofilm formation (6) drug analysis44 and (7) DNA Biosensors45
References 1 G Sauerbrey Z Phys 155 (1959) 206 2 Daniel Buttry ldquoApplications of the QCM to Electrochemistryrdquo in A Series of Advances in Electroanalytical Chemistry edited by Allen Bard Marcel Dekker 1991 p 23-33 3 John Henderson ldquoElectronic Devices Concepts and Applicationsrdquo Prentice Hall NJ (1991) p 357 4 For example QCM10 crystal holder with a 1inch 5MHz crystal connected directly to an SRS QCM25 Crystal Controller
wwwthinkSRScom
Stanford Research Systems (408)744-9040
5 C Chagnard P Gilbert N Watkins T Beeler and David W Paul ldquoAn electronic oscillator with automatic gain controlEQCM Applicationsrdquo Sensors and Actuators B 32(1996) 129-136 A Arnau T Sogorb and Y Jimenez ldquoCircuit for continuous motional series resonat frequency and motional resistance monitoring of quartz crystal resonators by parallel capacitance cancellationrdquo Rev Sci Instrum 73(7)(2002) 2724 6 For example from the Conductance Output of the QCM100 7 Conductance is the inverse of resistance Conductance = 1 Resistance or Resistance = 1 Conductance The units of resistance are Ohms [Ω = VA] and the units of conductance are Siemens (S = AV] 8 For example Agilent 34401A with 6 digit resolution or 3458 with eight digits resolution 9 DR Denison ldquoLinearity of a Heavily Loaded Quartz Crystal Microbalancerdquo J Vac Sci Technol 10(1) (1973) 126 Klaus H Behrndt ldquoLong Term Operation of Crystal Oscillators in Thin-Film Depositionrdquo J Vac Sci technol 8(5)(1971) 622 10 C Lu and O Lewis ldquoInvestigation of film-thickness determination by oscillating quartz resonators with large mass loadrdquo J Appl Phys 43 (1972) 4385 Chih-shun Lu ldquoMass determination with piezoelectric quartz crystal resonatorsrdquo J Vac Sci Technol 12(1) (1975) 578 11 D R Denison ldquoLinearity of Heavily Loaded Quartz Crystal Microbalancerdquo J Vac Sci Technol 10(1973) 126 K H Behrndt ldquoLong Term Operation of Crystal Oscillators in Thin-Film Depositionrdquo J Vac Sci Technol 8(5) (1971) 622 12 T Nomura and M Okuhara Anal Chim Acta 142(1982) 281 13 A P M Glassford ldquoResponse of a Quartz Crystal Microbalance to a liquid Depositrdquo J Vac Sci Technol 15(6)(1978) 1836 14 K Keiji Kanazawa and Joseph Gordon II ldquoFrequency of a Quartz Microbalance in Contact with Liquidrdquo Anal Chem 57(1985) 1770 K Keiji Kanazawa and Joseph G Gordon II Analytica Chimica Acta 175(1985) 99-105 15 Stephen J Martin James J Spates Kurt O Wesendorf thomas Schnneider and Robert J Huber ldquoResonator Oscillator Response to Liquid Loadingrdquo Anal Chem 69(1997) 2050 16 Stephen Martin Victoria Edwards Granstaff and Gregory C Frye ldquoCharacterization of a Quartz Crystal Microbalance with Simultaneous Mass and Liquid Loadingrdquo Anal Chem 63 (1991) 2272 17 Operation in liquids requires that the crystal be mounted in a holder such that only the front surface of the crystal is in contact with the fluid while at the same time providing an electrical connection to both electrodes 18 For pure water at 20C ρL 09982 g cm-3 and ηL 100210-2 g cm-1 s-1 19 H Muramatsu Eiichi Tamiya and Isao Karube ldquoComputation of Equivalent Circuit Parameters of Quartz Crystals in Contact with Liquids and Study of Liquid Propertiesrdquo Anal Chem 60(1988) 2142 SJ Geelhood C W Frank and K Kanazawa ldquoTransient Quartz Crystal Microbalance Behaviors Comparedrdquo Journal of the Electrochemical Society 149(2002) H33-H38 Mengsu Yang and Michael Thompson ldquoMultiple Chemical Information from the Thickness Shear Mode Acoustic Wave Sensor in the liquid Phaserdquo Anal Chem 65(1993) 1158
wwwthinkSRScom
Stanford Research Systems (408)744-9040
20 S J Martin R W Cernosek and JJ Spates ldquoSensing Liquid Properties with Shear-mode Resonator Sensorsrdquo in Proceeds from TransducersEurosensors IX Stockholm Sweden (1995) 21 Michael Rodahl Fredrik Hook Anatol Krozer Peter Brzezinski and Bengt Kasemo ldquoQCM setup for frequency and Q-factor measurements in gaseous and liquid environmentsrdquo Rev Sci Instrum 66(7)(1995)3924 22 S J Geelhood CW Frank and K Kanazawa ldquoTransient QCM Behaviors Comparedrdquo J of the Electrochemical Societyrdquo 149(1)(2002)H33 23 Stephen Martin et al rdquoEffect of Surface Roughness on the Response of Thickness-Shear Mode Resonators in Liquidsrdquo Anal Chem 65(1993)2910 Michael Ward and Edward J Delawski ldquoRadial Mass Sensitivity of the Quartz Crystal Microbalance in Liquid Mediardquo Anal Chem 63(1991) 886 24 Mark R Deakin and Owen Melroy ldquoUnderpotential Metal Deposition on Au monitorred in situ with a Quartz Microbalancerdquo J Electroanal Chem 239(1988) 321 O Melroy K Kanazawa JG Gordon II and D Buttry ldquoDirect Determination of the Mass of an Underpotentially Deposited Monolayer of Lead on Goldrdquo Langmuir 2(1986)697 Masahiro Seo Masaki Aomi and Kengo Yoshida ldquoA combined Piezoelectric and EQCM study of Underpotential Deposition of Silver on Gold Electrodesrdquo Electrochimica Acta 39(89) (1994) 1039 Youngran Lim and Euijin Hwang ldquoAn Electrochemical QCM study of Oxygen reducttion during the Underpotential Depoosition of Lead on a Gold Electroderdquo Bull Korean Chem Soc 17(12)(1996)1091 25 EQCMWall Jet Split-Ring Disk Electrode study on Copper dissolution in Chloride Aqueous solutionrdquo Anal Sciences16(2000)1049 Michael Benje Matthias Eiermann Udo Pittermann and Konrad G Weil ldquoAn improved Quartz Microbalnce Applications to Electrocrystallizatuion and dissolution of Niquelrdquo Ber Bunsenges Phys Chem 90(1986) 435 26 Jorg Auge Peter Hauptmann Frank Eichelbaum and Stephen Rosler ldquoQCM sensor in liquidsrdquo Sensors and Actuators B 18-19 (1994) 518 27 Adrian W Bott ldquoCharacterization of Films Immobilized on an Electrode Surface Using the EQCMrdquo Current Separations 183(1999)79 28 Mark Deakin and Daniel Buttry ldquoElectrochemical Applications of the Quartz Crystal Microbalancerdquo Anal Chem 61(20)(1989)183 Daniel Buttry and Michael Ward ldquoMeasurement of Interfacial Processes at electrode surfaces with the EQCMrdquo Chem Rev 92(6) (1992) 1355 29 Wolfgang Stockel and Rolf Schumacher ldquoIn situ Microweighing at the Junction MetalElectrolyterdquo Ber Bunsenges Phys Chem 91(1987)345 30 C Gabrielli M Keddam and R Torrei ldquoCalibration of the Electrochemical Quartz Crystal Microbalancerdquo J Electrochem Soc 139(9) (1991) 2657 Note A calibration procedure based on the deposition of Ag on Au electrodes is described Graeme Andrew Snook Investigation of Solid-State Reactions by Electrochemical and Quartz Crystal Microbalance Measurements PhD Thesis 2000 Department of Chemistry Monash University Clayton 3168 Melbourne Australia and Division of Minerals CSIRO Clayton South 3169 Melbourne Australia under the supervision of Professor Alan Maxwell Bond (Monash) and Professor Stephen Fletcher (CSIRO)
wwwthinkSRScom
Stanford Research Systems (408)744-9040
Available for download from httpwww-bondchemmonasheduautheses Note the use of Lead acetate is proposed as a better alternative to Cu and Ag deposition Bruckenstein S and Shay M ldquoExperimental aspects of use of the quartz crystal microbalance in solutionrdquo Electrochim Acta 30(1985) 1295 31 Duke Orata and Daniel A Buttry ldquoDetermination of Ion Populations and Solvent Content as fucntions of Redox State and pH in Polyanilinerdquo J Am Chem Soc 109(1987)3574 32 Michael Ward ldquoInvestigation of Open Circuit Reactions of Polymer Films Using the QCM Reactions of Polyvinylferrocene Filmsrdquo J Phys Chem 92(1988)2049 Charles K Baker and John R Reynolds ldquoA quartz microbalance study of the electrosynthesis of polypyrrolerdquo J Electroanal Chem 251(1988) 307 33 Stephen Martin Victoria Edwards Granstaff and Gregory C Frye ldquoCharacterization of a Quartz Crystal Microbalance with Simultaneouus Mass and Liquid Loadingrdquo Anal Chem 63 (1991) 2272 Ralf Lucklum and Peter Hauptmann ldquoThe Df-DR QCM technique an approach to an advanced sensor signal interpretationrdquo Electrochimica Acta 45(2000) 3907 34 RA Etchenique and E L CalvordquoGravimetric measurement in redox polymer electrodes with the EQCM beyond the Sauerbrey limitrdquo Electrochemistry Communications 1(5)(1999)167 RA Etchenique and E J Calvo ldquoElectrochemical Quartz Crystal Impedance Study of Redox Hydrogel Mediators for Amperometryic Enzyme Electrodesrdquo Anal Chem 69(1997)4833 35 E J Calvo R Etchenique P N Bartlett K Singhal and Santamaria ldquoQuartz Crystal Impedance studies at 10MHz of viscoelastic liquids and filmsrdquo Faraday Discuss107(1997)141 Diethelm Johannsmann ldquoViscoelastic Analysis of Organic Thin Filmsrdquo on quartz resonatorsrdquo Macromol Chem Phys 200(1999)501 36 C E Reed K Keiji Kanazawa and J Kaufman ldquoPhysical description of a viscoelastically loaded AT-cut quartz resonatorrdquo J Appl Phys 68(5) (1990) 1993 37 D S Ballantine R M White S J Martin A J Rico E T Zellers G C Frye and H Woltjen ldquoAcoustic Wave Sensors Theory Design and Physico-Chemical Applicationsrdquo Acad Press London UK 1997 Chapter 5 (Chemical and Biological Sensors) p 222 38 GG Guilbault and J Jordan ldquoAnalytical uses of piezoelectric crystalsrdquo CRC Reviews 19 p 1-28 W H King ldquoPiezoelectric Sorption Detectorrdquo Anal Chem 36 (1964) 1735 39 Iddo Ben-Dov and Itamar Willmer ldquoPiezoelectric Immunosensors for Urine Specimens of Chlamidia trachomatis Employing QCM Microgravimetric Analysisrdquo Anal Chem 69(1997) 3506 40 A Hengerer C Koumlsslinger1 J Decker S Hauck1 I Queitsch2 H Wolf and S Duumlbel2 ldquoDetermination of Phage Antibody Affinities to Antigen by a Microbalance Sensor Systemrdquo BioTechniques 26956-964 (May 1999) 41 G G Guibault ldquoAnalytical uses of immobilized Enzymes Modern Monographs in Analytical Chemistryrdquo Vol 2Marcel Dekker New York (1984) G M Minunni M Mascini GG Guilbault B Hock ldquoThe Quartz Crystal Microbalance as Biosensor A Status Report on its Futurerdquo Anal Lett 28 5(1995) 749 S Tombelli M Mascini ldquoPiezoelectric Quartz Crystal Biosensor Recent Immobilisation Schemesrdquo Anal Lett 33(11) 2000 pp 2129-2151
wwwthinkSRScom
Stanford Research Systems (408)744-9040
Kim R Rogers ldquoPrinciples of Affinity Based Biosensorsrdquo Molecular Biotechnology 14(2000)109 42 Fredrik Hook et al ldquoStructural changes in hemoglobin during adsorption to solid surfaces effects of pH ionic strength and ligand bindingrdquo Proc Natl Acad Sci USA 95(1998)12271 43 C Fredriksson S Kihlman M Rodahl and B Kasemo ldquoThe Piezoelectric Quartz crystal Mass and Dissipation Sensor A means of studyinng Cell adhesionrdquo Langmuir 19(1998) 248 Ann-Sofie Cans et al ldquoMeasurement of the Dynamics of Exocytosis and Vesicle Retrieval at Cell Populations Using a QCMrdquo Anal Chem 73(2001)5805 C A Keller and B KasemordquoSurface Specific Kinetics of Lipid Vesicle Adsorption Measured with a QCMrdquo Biophysical Journal 75(1998) 1397 44 Wei W Z et al ldquoSelective pharmaceutical analyis technique with sensitive piezoelectric quartz sensorsrdquo Anal Lett 26(11)(1993)2371 45 Storri S Santoni T Mascini MrdquoA piezoelectric biosensor for DNA hybridization detectionrdquo Anal Lett 31(11)(1998)1795
wwwthinkSRScom
Stanford Research Systems (408)744-9040
Electrochemical Quartz Crystal Microbalance In most electrochemical experiments mass changes occur as material is deposited or lost from the ldquoworkingrdquo electrode It is of interest to monitor those changes simultaneously with the electrochemical response and the QCM is the standard means of doing so As a gravimetric probe the QCM has been used in many types of electrochemical studies including underpotential deposition of metals24 corrosion oxide formation dissolution studies25 adsorptiondesorption of surfactants26 and changes in conductive polymer films during redox processes27 The basic principles and applications of the QCM to electrochemical processes have been extensively reviewed in the electrochemical literature28 and will only be discussed briefly in this manual Please refer to the publications list at the end of this chapter for more detailed information Electrochemical Apparatus A schematic diagram of the apparatus for electrochemical quartz crystal microbalance (EQCM) experiments is given in Figure 8 In this example a 1inch diameter polished QCM crystal is mounted on a crystal holder with only one electrode exposed to the conductive solution The crystal holder is connected to a QCM25 Crystal Controller and the liquid-contact electrode is connected to the ldquoworking electroderdquo lead of the potentiostat (through the ldquoCrystal Face Biasrdquo connector of the QCM25 Crystal Controller) A QCM100 Analog Controller provides independent frequency and conductance outputs which are read and displayed by a frequency counter and a digital multimeter (or AD converter) respectively
wwwthinkSRScom
Stanford Research Systems (408)744-9040
Figure 8 Schematic of EQCM apparatus
A PC (not shown) is often interfaced to the potentiostat frequency counter and DMM and integrates the QCM and electrochemical data into a single software package Note The QCM25 Crystal Controller provides transformer isolation of the crystal front face electrode This allows direct electrical connection of the quartz crystal face to the ldquoworking electroderdquo pin of any standard potentiostatgalvanostat With the instrument in Figure 8 a typical cyclic voltammetric-EQCM experiment would involve the application of the electrochemical waveform to the working electrode and the simultaneous measurement of the current flowing through the electrochemical cell and the oscillation frequency and series resonance resistance of the crystal Figure 9 is an example of a typical voltammogram-massogram plot obtained from a 10mM solution of CuSO4 in 01M H2SO4 using a 1inch diameter Au coated quartz crystal mounted in a standard holder as the working electrode
Digital Multimeter
QCM25
Reference Electrode
Counter Electrode
Work Electrode
Potentiostat
QCM100 Analog Controller
Frequency Counter
Crystal Holder
wwwthinkSRScom
Stanford Research Systems (408)744-9040
Figure 9 Cyclic voltammogram and massogram data for Cu deposition on a Au
electrode The frequency ndashpotential diagram shows a frequency decrease in perfect sync with the deposition of Cu metal on the crystalrsquos surface
Calibration It has been amply demonstrated in the literature that when experiments involve only relative frequency shifts which are measured in a fixed solution the offset caused by the viscous loading of the liquid has negligible effect on the accuracy of the Sauerbrey equation for the determination of small mass changes in rigid deposits29 Quantitative interpretation of the EQCM data in those cases is based on the combination of the Sauerbrey equation (equation 1) and Faradayrsquos law The former relates change in frequency to change in mass for thin rigid deposits whereas the latter relates charge passed in an electrochemical experiment to the number of moles of material electrolyzed Therefore frequency changes can be related to the total charge passed An example would be the electrodeposition of Ag on a Pt electrode QCM crystal The charge Q is an integral measure of the total number of electrons delivered at the interface during the reduction process To the extent that each electron supplied results in the deposition of one atom of Ag there should be a linear relationship between Q and ∆f as is given by equation 8
∆f = 106 Mw Cf Q (n F A) (equation 8) where
wwwthinkSRScom
Stanford Research Systems (408)744-9040
∆f - frequency change in Hz Mw - apparent molar mass of the depositing species in gramsmole Cf - Sauerbreyrsquos sensitivity factor for the crystal used (see equation 1) Q - integrated charge during the reduction in Coulomb A - Active deposition area of the working (ie liquid contact) electrode in cm2 F - Faradayrsquos constant 9648 104 Coulombmole and n - number of electrons transferred to induce deposition (ie n =1 for Ag deposition) (The factor of 106 provides for the unit conversion from mg in Cf to g in Mw)
A plot of ldquo∆f vs Qrdquo will deliver the apparent mass per electron of the deposited species when n is taken into account This is often used to elucidate the mass changes that accompany redox processes and hence is very useful for characterizing the mechanisms of electron-transfer reactions However before any calculations can be performed based on equation 8 the EQCM must be calibrated in order to properly derive (1) the proportionality constant Cf of the Sauerbrey equation in solution and (2) to account for the effective area of the working electrode This is generally done using a well behaved electrochemical reaction- typically electrodeposition of silver copper or lead on a Au or Pt electrode The EQCM calibration method favored by Stanford Research Systems for its QCM100 system is based on the galvanostatic deposition of Ag A 50mM solution of AgNO3 in 05M HNO3 is subjected to a reducing potential and Ag is deposited with a fixed cathodic current density of 50-500 microAcm2 The cathodic current is integrated to obtain the charge as a function of time Excellent linearity is generally observed in ldquo∆f vs Qrdquo plots for depositions within 1 microgcm2 providing a very reliable way to calibrate the proportionality constant of equation 8 Several calibration procedures are also described in the electrochemistry literature30 and users are referred to the publications list at the end of this chapter for details Polymer Modified Electrodes The EQCM has been extensively used to study polymer modified electrodes particularly as a gravimetric tool to follow redox processes31 However for the linear frequency-to-mass relationship (described by equation 8) to hold true the polymer overlayer must exhibit no changes in rigidity during the electrochemical process Otherwise the viscoelastic changes will also contribute to the frequency change leading to an erroneous interpretation of the mass changes32 As a
wwwthinkSRScom
Stanford Research Systems (408)744-9040
consequence it is essential to determine whether or not viscoelastic properties of the polymer film influence the frequency measurement during polymer film experiments
Figure 10 Votammogram and massogram data for the oxidation of pyrrole to form a polypyrrole film on a gold coated QCM Sensor Crystal Seven cycles of
voltammetry between - 04 and 095 V were conducted in this experiment Pyrrole monomer can be oxidized to its radical at 065V As this happens a thin polypyrrole film is formed on the crystal surface resulting in a decrease in the
fundamental frequency of oscillation of the crystal The continuous growth of the film is evidenced by the irreversible decrease in frequency during the scans
A starightforward way to detect changes in film viscoelastic properties of redox films is to simultaneously monitor the series resonance resistance R of the quartz oscillator during the electrochemical experiment33 Some theoretical models34 based on the simultaneous measurement of ∆f and ∆R have been discussed in the literature for the extension of EQCM gravimetric measurements to non-rigid films The viscoelastic analyis of polymeric thin films in EQCM systems is complex because the shear wave exists simultaneously in the quartz crystal the viscoelastic film and the adjacent solution so reflection of the shear wave must be taken into account However solution of this problem would be worthwhile specially if the material properties of the film could be derived This would allow correlation of the electrochemical behavior of the film with its material properties35
01M Pyrrole in 01M HCLO4
wwwthinkSRScom
Stanford Research Systems (408)744-9040
The unique property of the QCM technique is its ability to determine the mass of very thin layers while simultaneously giving information about their viscoelastic properties The ability to measure both mass and structural changes means it is possible to detect phase-transitions cross-linking and swelling in polymeric thin films36
wwwthinkSRScom
Stanford Research Systems (408)744-9040
Chemical and Biological Sensors Anything that has mass can generate a response from a QCM sensor The universal response of the device is the reason for the wide range of application of the technology However the downside of such universal sensitivity is that you always have a great danger of interferences For analytical purposes it is imperative to find ways of getting the QCM sensor to respond only to what you are interested in (ie build sensitivity into the device) This usually involves the addition of a sensitive layer on the surface of the crystal37 Organic polymers comprise the most common type of coating used with QCM sensors due to their capability to reversibly sorb vapors and liquids38 In much of the work published on the use of polymer coatings for vapor sensing the acoustic properties of the polymer material have been neglected The relative importance of the mass-loading and viscoelastic contributions of the film to the observed QCM response is a subject that has yet to be resolved In no area have the QCM applications seen such dramatic increase in recent years as in the field of biochemical analysis QCM devices are routinely used as biochemical and immunological probes39 as well as for the investigation andor monitoring of biochemcially significant processes Sensitive selective detection of biochemically active compounds can be achieved by employing antigen-antibody40 enzyme substrates and other receptor ndashprotein pairs The potential analytical uses of these materials has been reviewed particularly with respect to the development of biochemical sensors41 QCM studies have provided detailed information about the functionalized surfaces developed for a range of biochip and biosensor applications QCM Systems are applied routinely by biologists and biochemists to obtain information about processes such as (1) protein adsorptiondesorption42 (2) cell adhesion43 (3) Protein-protein interaction (4) Degradation of polymers (5) biofouling and biofilm formation (6) drug analysis44 and (7) DNA Biosensors45
References 1 G Sauerbrey Z Phys 155 (1959) 206 2 Daniel Buttry ldquoApplications of the QCM to Electrochemistryrdquo in A Series of Advances in Electroanalytical Chemistry edited by Allen Bard Marcel Dekker 1991 p 23-33 3 John Henderson ldquoElectronic Devices Concepts and Applicationsrdquo Prentice Hall NJ (1991) p 357 4 For example QCM10 crystal holder with a 1inch 5MHz crystal connected directly to an SRS QCM25 Crystal Controller
wwwthinkSRScom
Stanford Research Systems (408)744-9040
5 C Chagnard P Gilbert N Watkins T Beeler and David W Paul ldquoAn electronic oscillator with automatic gain controlEQCM Applicationsrdquo Sensors and Actuators B 32(1996) 129-136 A Arnau T Sogorb and Y Jimenez ldquoCircuit for continuous motional series resonat frequency and motional resistance monitoring of quartz crystal resonators by parallel capacitance cancellationrdquo Rev Sci Instrum 73(7)(2002) 2724 6 For example from the Conductance Output of the QCM100 7 Conductance is the inverse of resistance Conductance = 1 Resistance or Resistance = 1 Conductance The units of resistance are Ohms [Ω = VA] and the units of conductance are Siemens (S = AV] 8 For example Agilent 34401A with 6 digit resolution or 3458 with eight digits resolution 9 DR Denison ldquoLinearity of a Heavily Loaded Quartz Crystal Microbalancerdquo J Vac Sci Technol 10(1) (1973) 126 Klaus H Behrndt ldquoLong Term Operation of Crystal Oscillators in Thin-Film Depositionrdquo J Vac Sci technol 8(5)(1971) 622 10 C Lu and O Lewis ldquoInvestigation of film-thickness determination by oscillating quartz resonators with large mass loadrdquo J Appl Phys 43 (1972) 4385 Chih-shun Lu ldquoMass determination with piezoelectric quartz crystal resonatorsrdquo J Vac Sci Technol 12(1) (1975) 578 11 D R Denison ldquoLinearity of Heavily Loaded Quartz Crystal Microbalancerdquo J Vac Sci Technol 10(1973) 126 K H Behrndt ldquoLong Term Operation of Crystal Oscillators in Thin-Film Depositionrdquo J Vac Sci Technol 8(5) (1971) 622 12 T Nomura and M Okuhara Anal Chim Acta 142(1982) 281 13 A P M Glassford ldquoResponse of a Quartz Crystal Microbalance to a liquid Depositrdquo J Vac Sci Technol 15(6)(1978) 1836 14 K Keiji Kanazawa and Joseph Gordon II ldquoFrequency of a Quartz Microbalance in Contact with Liquidrdquo Anal Chem 57(1985) 1770 K Keiji Kanazawa and Joseph G Gordon II Analytica Chimica Acta 175(1985) 99-105 15 Stephen J Martin James J Spates Kurt O Wesendorf thomas Schnneider and Robert J Huber ldquoResonator Oscillator Response to Liquid Loadingrdquo Anal Chem 69(1997) 2050 16 Stephen Martin Victoria Edwards Granstaff and Gregory C Frye ldquoCharacterization of a Quartz Crystal Microbalance with Simultaneous Mass and Liquid Loadingrdquo Anal Chem 63 (1991) 2272 17 Operation in liquids requires that the crystal be mounted in a holder such that only the front surface of the crystal is in contact with the fluid while at the same time providing an electrical connection to both electrodes 18 For pure water at 20C ρL 09982 g cm-3 and ηL 100210-2 g cm-1 s-1 19 H Muramatsu Eiichi Tamiya and Isao Karube ldquoComputation of Equivalent Circuit Parameters of Quartz Crystals in Contact with Liquids and Study of Liquid Propertiesrdquo Anal Chem 60(1988) 2142 SJ Geelhood C W Frank and K Kanazawa ldquoTransient Quartz Crystal Microbalance Behaviors Comparedrdquo Journal of the Electrochemical Society 149(2002) H33-H38 Mengsu Yang and Michael Thompson ldquoMultiple Chemical Information from the Thickness Shear Mode Acoustic Wave Sensor in the liquid Phaserdquo Anal Chem 65(1993) 1158
wwwthinkSRScom
Stanford Research Systems (408)744-9040
20 S J Martin R W Cernosek and JJ Spates ldquoSensing Liquid Properties with Shear-mode Resonator Sensorsrdquo in Proceeds from TransducersEurosensors IX Stockholm Sweden (1995) 21 Michael Rodahl Fredrik Hook Anatol Krozer Peter Brzezinski and Bengt Kasemo ldquoQCM setup for frequency and Q-factor measurements in gaseous and liquid environmentsrdquo Rev Sci Instrum 66(7)(1995)3924 22 S J Geelhood CW Frank and K Kanazawa ldquoTransient QCM Behaviors Comparedrdquo J of the Electrochemical Societyrdquo 149(1)(2002)H33 23 Stephen Martin et al rdquoEffect of Surface Roughness on the Response of Thickness-Shear Mode Resonators in Liquidsrdquo Anal Chem 65(1993)2910 Michael Ward and Edward J Delawski ldquoRadial Mass Sensitivity of the Quartz Crystal Microbalance in Liquid Mediardquo Anal Chem 63(1991) 886 24 Mark R Deakin and Owen Melroy ldquoUnderpotential Metal Deposition on Au monitorred in situ with a Quartz Microbalancerdquo J Electroanal Chem 239(1988) 321 O Melroy K Kanazawa JG Gordon II and D Buttry ldquoDirect Determination of the Mass of an Underpotentially Deposited Monolayer of Lead on Goldrdquo Langmuir 2(1986)697 Masahiro Seo Masaki Aomi and Kengo Yoshida ldquoA combined Piezoelectric and EQCM study of Underpotential Deposition of Silver on Gold Electrodesrdquo Electrochimica Acta 39(89) (1994) 1039 Youngran Lim and Euijin Hwang ldquoAn Electrochemical QCM study of Oxygen reducttion during the Underpotential Depoosition of Lead on a Gold Electroderdquo Bull Korean Chem Soc 17(12)(1996)1091 25 EQCMWall Jet Split-Ring Disk Electrode study on Copper dissolution in Chloride Aqueous solutionrdquo Anal Sciences16(2000)1049 Michael Benje Matthias Eiermann Udo Pittermann and Konrad G Weil ldquoAn improved Quartz Microbalnce Applications to Electrocrystallizatuion and dissolution of Niquelrdquo Ber Bunsenges Phys Chem 90(1986) 435 26 Jorg Auge Peter Hauptmann Frank Eichelbaum and Stephen Rosler ldquoQCM sensor in liquidsrdquo Sensors and Actuators B 18-19 (1994) 518 27 Adrian W Bott ldquoCharacterization of Films Immobilized on an Electrode Surface Using the EQCMrdquo Current Separations 183(1999)79 28 Mark Deakin and Daniel Buttry ldquoElectrochemical Applications of the Quartz Crystal Microbalancerdquo Anal Chem 61(20)(1989)183 Daniel Buttry and Michael Ward ldquoMeasurement of Interfacial Processes at electrode surfaces with the EQCMrdquo Chem Rev 92(6) (1992) 1355 29 Wolfgang Stockel and Rolf Schumacher ldquoIn situ Microweighing at the Junction MetalElectrolyterdquo Ber Bunsenges Phys Chem 91(1987)345 30 C Gabrielli M Keddam and R Torrei ldquoCalibration of the Electrochemical Quartz Crystal Microbalancerdquo J Electrochem Soc 139(9) (1991) 2657 Note A calibration procedure based on the deposition of Ag on Au electrodes is described Graeme Andrew Snook Investigation of Solid-State Reactions by Electrochemical and Quartz Crystal Microbalance Measurements PhD Thesis 2000 Department of Chemistry Monash University Clayton 3168 Melbourne Australia and Division of Minerals CSIRO Clayton South 3169 Melbourne Australia under the supervision of Professor Alan Maxwell Bond (Monash) and Professor Stephen Fletcher (CSIRO)
wwwthinkSRScom
Stanford Research Systems (408)744-9040
Available for download from httpwww-bondchemmonasheduautheses Note the use of Lead acetate is proposed as a better alternative to Cu and Ag deposition Bruckenstein S and Shay M ldquoExperimental aspects of use of the quartz crystal microbalance in solutionrdquo Electrochim Acta 30(1985) 1295 31 Duke Orata and Daniel A Buttry ldquoDetermination of Ion Populations and Solvent Content as fucntions of Redox State and pH in Polyanilinerdquo J Am Chem Soc 109(1987)3574 32 Michael Ward ldquoInvestigation of Open Circuit Reactions of Polymer Films Using the QCM Reactions of Polyvinylferrocene Filmsrdquo J Phys Chem 92(1988)2049 Charles K Baker and John R Reynolds ldquoA quartz microbalance study of the electrosynthesis of polypyrrolerdquo J Electroanal Chem 251(1988) 307 33 Stephen Martin Victoria Edwards Granstaff and Gregory C Frye ldquoCharacterization of a Quartz Crystal Microbalance with Simultaneouus Mass and Liquid Loadingrdquo Anal Chem 63 (1991) 2272 Ralf Lucklum and Peter Hauptmann ldquoThe Df-DR QCM technique an approach to an advanced sensor signal interpretationrdquo Electrochimica Acta 45(2000) 3907 34 RA Etchenique and E L CalvordquoGravimetric measurement in redox polymer electrodes with the EQCM beyond the Sauerbrey limitrdquo Electrochemistry Communications 1(5)(1999)167 RA Etchenique and E J Calvo ldquoElectrochemical Quartz Crystal Impedance Study of Redox Hydrogel Mediators for Amperometryic Enzyme Electrodesrdquo Anal Chem 69(1997)4833 35 E J Calvo R Etchenique P N Bartlett K Singhal and Santamaria ldquoQuartz Crystal Impedance studies at 10MHz of viscoelastic liquids and filmsrdquo Faraday Discuss107(1997)141 Diethelm Johannsmann ldquoViscoelastic Analysis of Organic Thin Filmsrdquo on quartz resonatorsrdquo Macromol Chem Phys 200(1999)501 36 C E Reed K Keiji Kanazawa and J Kaufman ldquoPhysical description of a viscoelastically loaded AT-cut quartz resonatorrdquo J Appl Phys 68(5) (1990) 1993 37 D S Ballantine R M White S J Martin A J Rico E T Zellers G C Frye and H Woltjen ldquoAcoustic Wave Sensors Theory Design and Physico-Chemical Applicationsrdquo Acad Press London UK 1997 Chapter 5 (Chemical and Biological Sensors) p 222 38 GG Guilbault and J Jordan ldquoAnalytical uses of piezoelectric crystalsrdquo CRC Reviews 19 p 1-28 W H King ldquoPiezoelectric Sorption Detectorrdquo Anal Chem 36 (1964) 1735 39 Iddo Ben-Dov and Itamar Willmer ldquoPiezoelectric Immunosensors for Urine Specimens of Chlamidia trachomatis Employing QCM Microgravimetric Analysisrdquo Anal Chem 69(1997) 3506 40 A Hengerer C Koumlsslinger1 J Decker S Hauck1 I Queitsch2 H Wolf and S Duumlbel2 ldquoDetermination of Phage Antibody Affinities to Antigen by a Microbalance Sensor Systemrdquo BioTechniques 26956-964 (May 1999) 41 G G Guibault ldquoAnalytical uses of immobilized Enzymes Modern Monographs in Analytical Chemistryrdquo Vol 2Marcel Dekker New York (1984) G M Minunni M Mascini GG Guilbault B Hock ldquoThe Quartz Crystal Microbalance as Biosensor A Status Report on its Futurerdquo Anal Lett 28 5(1995) 749 S Tombelli M Mascini ldquoPiezoelectric Quartz Crystal Biosensor Recent Immobilisation Schemesrdquo Anal Lett 33(11) 2000 pp 2129-2151
wwwthinkSRScom
Stanford Research Systems (408)744-9040
Kim R Rogers ldquoPrinciples of Affinity Based Biosensorsrdquo Molecular Biotechnology 14(2000)109 42 Fredrik Hook et al ldquoStructural changes in hemoglobin during adsorption to solid surfaces effects of pH ionic strength and ligand bindingrdquo Proc Natl Acad Sci USA 95(1998)12271 43 C Fredriksson S Kihlman M Rodahl and B Kasemo ldquoThe Piezoelectric Quartz crystal Mass and Dissipation Sensor A means of studyinng Cell adhesionrdquo Langmuir 19(1998) 248 Ann-Sofie Cans et al ldquoMeasurement of the Dynamics of Exocytosis and Vesicle Retrieval at Cell Populations Using a QCMrdquo Anal Chem 73(2001)5805 C A Keller and B KasemordquoSurface Specific Kinetics of Lipid Vesicle Adsorption Measured with a QCMrdquo Biophysical Journal 75(1998) 1397 44 Wei W Z et al ldquoSelective pharmaceutical analyis technique with sensitive piezoelectric quartz sensorsrdquo Anal Lett 26(11)(1993)2371 45 Storri S Santoni T Mascini MrdquoA piezoelectric biosensor for DNA hybridization detectionrdquo Anal Lett 31(11)(1998)1795
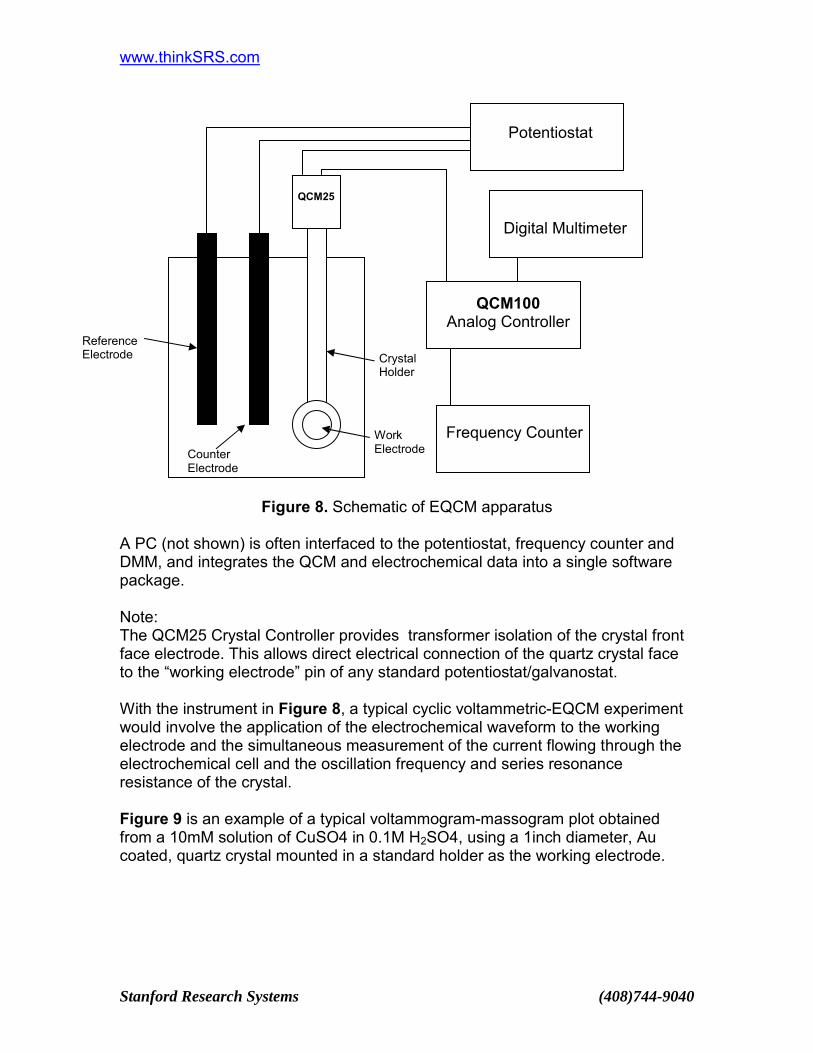
wwwthinkSRScom
Stanford Research Systems (408)744-9040
Figure 8 Schematic of EQCM apparatus
A PC (not shown) is often interfaced to the potentiostat frequency counter and DMM and integrates the QCM and electrochemical data into a single software package Note The QCM25 Crystal Controller provides transformer isolation of the crystal front face electrode This allows direct electrical connection of the quartz crystal face to the ldquoworking electroderdquo pin of any standard potentiostatgalvanostat With the instrument in Figure 8 a typical cyclic voltammetric-EQCM experiment would involve the application of the electrochemical waveform to the working electrode and the simultaneous measurement of the current flowing through the electrochemical cell and the oscillation frequency and series resonance resistance of the crystal Figure 9 is an example of a typical voltammogram-massogram plot obtained from a 10mM solution of CuSO4 in 01M H2SO4 using a 1inch diameter Au coated quartz crystal mounted in a standard holder as the working electrode
Digital Multimeter
QCM25
Reference Electrode
Counter Electrode
Work Electrode
Potentiostat
QCM100 Analog Controller
Frequency Counter
Crystal Holder
wwwthinkSRScom
Stanford Research Systems (408)744-9040
Figure 9 Cyclic voltammogram and massogram data for Cu deposition on a Au
electrode The frequency ndashpotential diagram shows a frequency decrease in perfect sync with the deposition of Cu metal on the crystalrsquos surface
Calibration It has been amply demonstrated in the literature that when experiments involve only relative frequency shifts which are measured in a fixed solution the offset caused by the viscous loading of the liquid has negligible effect on the accuracy of the Sauerbrey equation for the determination of small mass changes in rigid deposits29 Quantitative interpretation of the EQCM data in those cases is based on the combination of the Sauerbrey equation (equation 1) and Faradayrsquos law The former relates change in frequency to change in mass for thin rigid deposits whereas the latter relates charge passed in an electrochemical experiment to the number of moles of material electrolyzed Therefore frequency changes can be related to the total charge passed An example would be the electrodeposition of Ag on a Pt electrode QCM crystal The charge Q is an integral measure of the total number of electrons delivered at the interface during the reduction process To the extent that each electron supplied results in the deposition of one atom of Ag there should be a linear relationship between Q and ∆f as is given by equation 8
∆f = 106 Mw Cf Q (n F A) (equation 8) where
wwwthinkSRScom
Stanford Research Systems (408)744-9040
∆f - frequency change in Hz Mw - apparent molar mass of the depositing species in gramsmole Cf - Sauerbreyrsquos sensitivity factor for the crystal used (see equation 1) Q - integrated charge during the reduction in Coulomb A - Active deposition area of the working (ie liquid contact) electrode in cm2 F - Faradayrsquos constant 9648 104 Coulombmole and n - number of electrons transferred to induce deposition (ie n =1 for Ag deposition) (The factor of 106 provides for the unit conversion from mg in Cf to g in Mw)
A plot of ldquo∆f vs Qrdquo will deliver the apparent mass per electron of the deposited species when n is taken into account This is often used to elucidate the mass changes that accompany redox processes and hence is very useful for characterizing the mechanisms of electron-transfer reactions However before any calculations can be performed based on equation 8 the EQCM must be calibrated in order to properly derive (1) the proportionality constant Cf of the Sauerbrey equation in solution and (2) to account for the effective area of the working electrode This is generally done using a well behaved electrochemical reaction- typically electrodeposition of silver copper or lead on a Au or Pt electrode The EQCM calibration method favored by Stanford Research Systems for its QCM100 system is based on the galvanostatic deposition of Ag A 50mM solution of AgNO3 in 05M HNO3 is subjected to a reducing potential and Ag is deposited with a fixed cathodic current density of 50-500 microAcm2 The cathodic current is integrated to obtain the charge as a function of time Excellent linearity is generally observed in ldquo∆f vs Qrdquo plots for depositions within 1 microgcm2 providing a very reliable way to calibrate the proportionality constant of equation 8 Several calibration procedures are also described in the electrochemistry literature30 and users are referred to the publications list at the end of this chapter for details Polymer Modified Electrodes The EQCM has been extensively used to study polymer modified electrodes particularly as a gravimetric tool to follow redox processes31 However for the linear frequency-to-mass relationship (described by equation 8) to hold true the polymer overlayer must exhibit no changes in rigidity during the electrochemical process Otherwise the viscoelastic changes will also contribute to the frequency change leading to an erroneous interpretation of the mass changes32 As a
wwwthinkSRScom
Stanford Research Systems (408)744-9040
consequence it is essential to determine whether or not viscoelastic properties of the polymer film influence the frequency measurement during polymer film experiments
Figure 10 Votammogram and massogram data for the oxidation of pyrrole to form a polypyrrole film on a gold coated QCM Sensor Crystal Seven cycles of
voltammetry between - 04 and 095 V were conducted in this experiment Pyrrole monomer can be oxidized to its radical at 065V As this happens a thin polypyrrole film is formed on the crystal surface resulting in a decrease in the
fundamental frequency of oscillation of the crystal The continuous growth of the film is evidenced by the irreversible decrease in frequency during the scans
A starightforward way to detect changes in film viscoelastic properties of redox films is to simultaneously monitor the series resonance resistance R of the quartz oscillator during the electrochemical experiment33 Some theoretical models34 based on the simultaneous measurement of ∆f and ∆R have been discussed in the literature for the extension of EQCM gravimetric measurements to non-rigid films The viscoelastic analyis of polymeric thin films in EQCM systems is complex because the shear wave exists simultaneously in the quartz crystal the viscoelastic film and the adjacent solution so reflection of the shear wave must be taken into account However solution of this problem would be worthwhile specially if the material properties of the film could be derived This would allow correlation of the electrochemical behavior of the film with its material properties35
01M Pyrrole in 01M HCLO4
wwwthinkSRScom
Stanford Research Systems (408)744-9040
The unique property of the QCM technique is its ability to determine the mass of very thin layers while simultaneously giving information about their viscoelastic properties The ability to measure both mass and structural changes means it is possible to detect phase-transitions cross-linking and swelling in polymeric thin films36
wwwthinkSRScom
Stanford Research Systems (408)744-9040
Chemical and Biological Sensors Anything that has mass can generate a response from a QCM sensor The universal response of the device is the reason for the wide range of application of the technology However the downside of such universal sensitivity is that you always have a great danger of interferences For analytical purposes it is imperative to find ways of getting the QCM sensor to respond only to what you are interested in (ie build sensitivity into the device) This usually involves the addition of a sensitive layer on the surface of the crystal37 Organic polymers comprise the most common type of coating used with QCM sensors due to their capability to reversibly sorb vapors and liquids38 In much of the work published on the use of polymer coatings for vapor sensing the acoustic properties of the polymer material have been neglected The relative importance of the mass-loading and viscoelastic contributions of the film to the observed QCM response is a subject that has yet to be resolved In no area have the QCM applications seen such dramatic increase in recent years as in the field of biochemical analysis QCM devices are routinely used as biochemical and immunological probes39 as well as for the investigation andor monitoring of biochemcially significant processes Sensitive selective detection of biochemically active compounds can be achieved by employing antigen-antibody40 enzyme substrates and other receptor ndashprotein pairs The potential analytical uses of these materials has been reviewed particularly with respect to the development of biochemical sensors41 QCM studies have provided detailed information about the functionalized surfaces developed for a range of biochip and biosensor applications QCM Systems are applied routinely by biologists and biochemists to obtain information about processes such as (1) protein adsorptiondesorption42 (2) cell adhesion43 (3) Protein-protein interaction (4) Degradation of polymers (5) biofouling and biofilm formation (6) drug analysis44 and (7) DNA Biosensors45
References 1 G Sauerbrey Z Phys 155 (1959) 206 2 Daniel Buttry ldquoApplications of the QCM to Electrochemistryrdquo in A Series of Advances in Electroanalytical Chemistry edited by Allen Bard Marcel Dekker 1991 p 23-33 3 John Henderson ldquoElectronic Devices Concepts and Applicationsrdquo Prentice Hall NJ (1991) p 357 4 For example QCM10 crystal holder with a 1inch 5MHz crystal connected directly to an SRS QCM25 Crystal Controller
wwwthinkSRScom
Stanford Research Systems (408)744-9040
5 C Chagnard P Gilbert N Watkins T Beeler and David W Paul ldquoAn electronic oscillator with automatic gain controlEQCM Applicationsrdquo Sensors and Actuators B 32(1996) 129-136 A Arnau T Sogorb and Y Jimenez ldquoCircuit for continuous motional series resonat frequency and motional resistance monitoring of quartz crystal resonators by parallel capacitance cancellationrdquo Rev Sci Instrum 73(7)(2002) 2724 6 For example from the Conductance Output of the QCM100 7 Conductance is the inverse of resistance Conductance = 1 Resistance or Resistance = 1 Conductance The units of resistance are Ohms [Ω = VA] and the units of conductance are Siemens (S = AV] 8 For example Agilent 34401A with 6 digit resolution or 3458 with eight digits resolution 9 DR Denison ldquoLinearity of a Heavily Loaded Quartz Crystal Microbalancerdquo J Vac Sci Technol 10(1) (1973) 126 Klaus H Behrndt ldquoLong Term Operation of Crystal Oscillators in Thin-Film Depositionrdquo J Vac Sci technol 8(5)(1971) 622 10 C Lu and O Lewis ldquoInvestigation of film-thickness determination by oscillating quartz resonators with large mass loadrdquo J Appl Phys 43 (1972) 4385 Chih-shun Lu ldquoMass determination with piezoelectric quartz crystal resonatorsrdquo J Vac Sci Technol 12(1) (1975) 578 11 D R Denison ldquoLinearity of Heavily Loaded Quartz Crystal Microbalancerdquo J Vac Sci Technol 10(1973) 126 K H Behrndt ldquoLong Term Operation of Crystal Oscillators in Thin-Film Depositionrdquo J Vac Sci Technol 8(5) (1971) 622 12 T Nomura and M Okuhara Anal Chim Acta 142(1982) 281 13 A P M Glassford ldquoResponse of a Quartz Crystal Microbalance to a liquid Depositrdquo J Vac Sci Technol 15(6)(1978) 1836 14 K Keiji Kanazawa and Joseph Gordon II ldquoFrequency of a Quartz Microbalance in Contact with Liquidrdquo Anal Chem 57(1985) 1770 K Keiji Kanazawa and Joseph G Gordon II Analytica Chimica Acta 175(1985) 99-105 15 Stephen J Martin James J Spates Kurt O Wesendorf thomas Schnneider and Robert J Huber ldquoResonator Oscillator Response to Liquid Loadingrdquo Anal Chem 69(1997) 2050 16 Stephen Martin Victoria Edwards Granstaff and Gregory C Frye ldquoCharacterization of a Quartz Crystal Microbalance with Simultaneous Mass and Liquid Loadingrdquo Anal Chem 63 (1991) 2272 17 Operation in liquids requires that the crystal be mounted in a holder such that only the front surface of the crystal is in contact with the fluid while at the same time providing an electrical connection to both electrodes 18 For pure water at 20C ρL 09982 g cm-3 and ηL 100210-2 g cm-1 s-1 19 H Muramatsu Eiichi Tamiya and Isao Karube ldquoComputation of Equivalent Circuit Parameters of Quartz Crystals in Contact with Liquids and Study of Liquid Propertiesrdquo Anal Chem 60(1988) 2142 SJ Geelhood C W Frank and K Kanazawa ldquoTransient Quartz Crystal Microbalance Behaviors Comparedrdquo Journal of the Electrochemical Society 149(2002) H33-H38 Mengsu Yang and Michael Thompson ldquoMultiple Chemical Information from the Thickness Shear Mode Acoustic Wave Sensor in the liquid Phaserdquo Anal Chem 65(1993) 1158
wwwthinkSRScom
Stanford Research Systems (408)744-9040
20 S J Martin R W Cernosek and JJ Spates ldquoSensing Liquid Properties with Shear-mode Resonator Sensorsrdquo in Proceeds from TransducersEurosensors IX Stockholm Sweden (1995) 21 Michael Rodahl Fredrik Hook Anatol Krozer Peter Brzezinski and Bengt Kasemo ldquoQCM setup for frequency and Q-factor measurements in gaseous and liquid environmentsrdquo Rev Sci Instrum 66(7)(1995)3924 22 S J Geelhood CW Frank and K Kanazawa ldquoTransient QCM Behaviors Comparedrdquo J of the Electrochemical Societyrdquo 149(1)(2002)H33 23 Stephen Martin et al rdquoEffect of Surface Roughness on the Response of Thickness-Shear Mode Resonators in Liquidsrdquo Anal Chem 65(1993)2910 Michael Ward and Edward J Delawski ldquoRadial Mass Sensitivity of the Quartz Crystal Microbalance in Liquid Mediardquo Anal Chem 63(1991) 886 24 Mark R Deakin and Owen Melroy ldquoUnderpotential Metal Deposition on Au monitorred in situ with a Quartz Microbalancerdquo J Electroanal Chem 239(1988) 321 O Melroy K Kanazawa JG Gordon II and D Buttry ldquoDirect Determination of the Mass of an Underpotentially Deposited Monolayer of Lead on Goldrdquo Langmuir 2(1986)697 Masahiro Seo Masaki Aomi and Kengo Yoshida ldquoA combined Piezoelectric and EQCM study of Underpotential Deposition of Silver on Gold Electrodesrdquo Electrochimica Acta 39(89) (1994) 1039 Youngran Lim and Euijin Hwang ldquoAn Electrochemical QCM study of Oxygen reducttion during the Underpotential Depoosition of Lead on a Gold Electroderdquo Bull Korean Chem Soc 17(12)(1996)1091 25 EQCMWall Jet Split-Ring Disk Electrode study on Copper dissolution in Chloride Aqueous solutionrdquo Anal Sciences16(2000)1049 Michael Benje Matthias Eiermann Udo Pittermann and Konrad G Weil ldquoAn improved Quartz Microbalnce Applications to Electrocrystallizatuion and dissolution of Niquelrdquo Ber Bunsenges Phys Chem 90(1986) 435 26 Jorg Auge Peter Hauptmann Frank Eichelbaum and Stephen Rosler ldquoQCM sensor in liquidsrdquo Sensors and Actuators B 18-19 (1994) 518 27 Adrian W Bott ldquoCharacterization of Films Immobilized on an Electrode Surface Using the EQCMrdquo Current Separations 183(1999)79 28 Mark Deakin and Daniel Buttry ldquoElectrochemical Applications of the Quartz Crystal Microbalancerdquo Anal Chem 61(20)(1989)183 Daniel Buttry and Michael Ward ldquoMeasurement of Interfacial Processes at electrode surfaces with the EQCMrdquo Chem Rev 92(6) (1992) 1355 29 Wolfgang Stockel and Rolf Schumacher ldquoIn situ Microweighing at the Junction MetalElectrolyterdquo Ber Bunsenges Phys Chem 91(1987)345 30 C Gabrielli M Keddam and R Torrei ldquoCalibration of the Electrochemical Quartz Crystal Microbalancerdquo J Electrochem Soc 139(9) (1991) 2657 Note A calibration procedure based on the deposition of Ag on Au electrodes is described Graeme Andrew Snook Investigation of Solid-State Reactions by Electrochemical and Quartz Crystal Microbalance Measurements PhD Thesis 2000 Department of Chemistry Monash University Clayton 3168 Melbourne Australia and Division of Minerals CSIRO Clayton South 3169 Melbourne Australia under the supervision of Professor Alan Maxwell Bond (Monash) and Professor Stephen Fletcher (CSIRO)
wwwthinkSRScom
Stanford Research Systems (408)744-9040
Available for download from httpwww-bondchemmonasheduautheses Note the use of Lead acetate is proposed as a better alternative to Cu and Ag deposition Bruckenstein S and Shay M ldquoExperimental aspects of use of the quartz crystal microbalance in solutionrdquo Electrochim Acta 30(1985) 1295 31 Duke Orata and Daniel A Buttry ldquoDetermination of Ion Populations and Solvent Content as fucntions of Redox State and pH in Polyanilinerdquo J Am Chem Soc 109(1987)3574 32 Michael Ward ldquoInvestigation of Open Circuit Reactions of Polymer Films Using the QCM Reactions of Polyvinylferrocene Filmsrdquo J Phys Chem 92(1988)2049 Charles K Baker and John R Reynolds ldquoA quartz microbalance study of the electrosynthesis of polypyrrolerdquo J Electroanal Chem 251(1988) 307 33 Stephen Martin Victoria Edwards Granstaff and Gregory C Frye ldquoCharacterization of a Quartz Crystal Microbalance with Simultaneouus Mass and Liquid Loadingrdquo Anal Chem 63 (1991) 2272 Ralf Lucklum and Peter Hauptmann ldquoThe Df-DR QCM technique an approach to an advanced sensor signal interpretationrdquo Electrochimica Acta 45(2000) 3907 34 RA Etchenique and E L CalvordquoGravimetric measurement in redox polymer electrodes with the EQCM beyond the Sauerbrey limitrdquo Electrochemistry Communications 1(5)(1999)167 RA Etchenique and E J Calvo ldquoElectrochemical Quartz Crystal Impedance Study of Redox Hydrogel Mediators for Amperometryic Enzyme Electrodesrdquo Anal Chem 69(1997)4833 35 E J Calvo R Etchenique P N Bartlett K Singhal and Santamaria ldquoQuartz Crystal Impedance studies at 10MHz of viscoelastic liquids and filmsrdquo Faraday Discuss107(1997)141 Diethelm Johannsmann ldquoViscoelastic Analysis of Organic Thin Filmsrdquo on quartz resonatorsrdquo Macromol Chem Phys 200(1999)501 36 C E Reed K Keiji Kanazawa and J Kaufman ldquoPhysical description of a viscoelastically loaded AT-cut quartz resonatorrdquo J Appl Phys 68(5) (1990) 1993 37 D S Ballantine R M White S J Martin A J Rico E T Zellers G C Frye and H Woltjen ldquoAcoustic Wave Sensors Theory Design and Physico-Chemical Applicationsrdquo Acad Press London UK 1997 Chapter 5 (Chemical and Biological Sensors) p 222 38 GG Guilbault and J Jordan ldquoAnalytical uses of piezoelectric crystalsrdquo CRC Reviews 19 p 1-28 W H King ldquoPiezoelectric Sorption Detectorrdquo Anal Chem 36 (1964) 1735 39 Iddo Ben-Dov and Itamar Willmer ldquoPiezoelectric Immunosensors for Urine Specimens of Chlamidia trachomatis Employing QCM Microgravimetric Analysisrdquo Anal Chem 69(1997) 3506 40 A Hengerer C Koumlsslinger1 J Decker S Hauck1 I Queitsch2 H Wolf and S Duumlbel2 ldquoDetermination of Phage Antibody Affinities to Antigen by a Microbalance Sensor Systemrdquo BioTechniques 26956-964 (May 1999) 41 G G Guibault ldquoAnalytical uses of immobilized Enzymes Modern Monographs in Analytical Chemistryrdquo Vol 2Marcel Dekker New York (1984) G M Minunni M Mascini GG Guilbault B Hock ldquoThe Quartz Crystal Microbalance as Biosensor A Status Report on its Futurerdquo Anal Lett 28 5(1995) 749 S Tombelli M Mascini ldquoPiezoelectric Quartz Crystal Biosensor Recent Immobilisation Schemesrdquo Anal Lett 33(11) 2000 pp 2129-2151
wwwthinkSRScom
Stanford Research Systems (408)744-9040
Kim R Rogers ldquoPrinciples of Affinity Based Biosensorsrdquo Molecular Biotechnology 14(2000)109 42 Fredrik Hook et al ldquoStructural changes in hemoglobin during adsorption to solid surfaces effects of pH ionic strength and ligand bindingrdquo Proc Natl Acad Sci USA 95(1998)12271 43 C Fredriksson S Kihlman M Rodahl and B Kasemo ldquoThe Piezoelectric Quartz crystal Mass and Dissipation Sensor A means of studyinng Cell adhesionrdquo Langmuir 19(1998) 248 Ann-Sofie Cans et al ldquoMeasurement of the Dynamics of Exocytosis and Vesicle Retrieval at Cell Populations Using a QCMrdquo Anal Chem 73(2001)5805 C A Keller and B KasemordquoSurface Specific Kinetics of Lipid Vesicle Adsorption Measured with a QCMrdquo Biophysical Journal 75(1998) 1397 44 Wei W Z et al ldquoSelective pharmaceutical analyis technique with sensitive piezoelectric quartz sensorsrdquo Anal Lett 26(11)(1993)2371 45 Storri S Santoni T Mascini MrdquoA piezoelectric biosensor for DNA hybridization detectionrdquo Anal Lett 31(11)(1998)1795
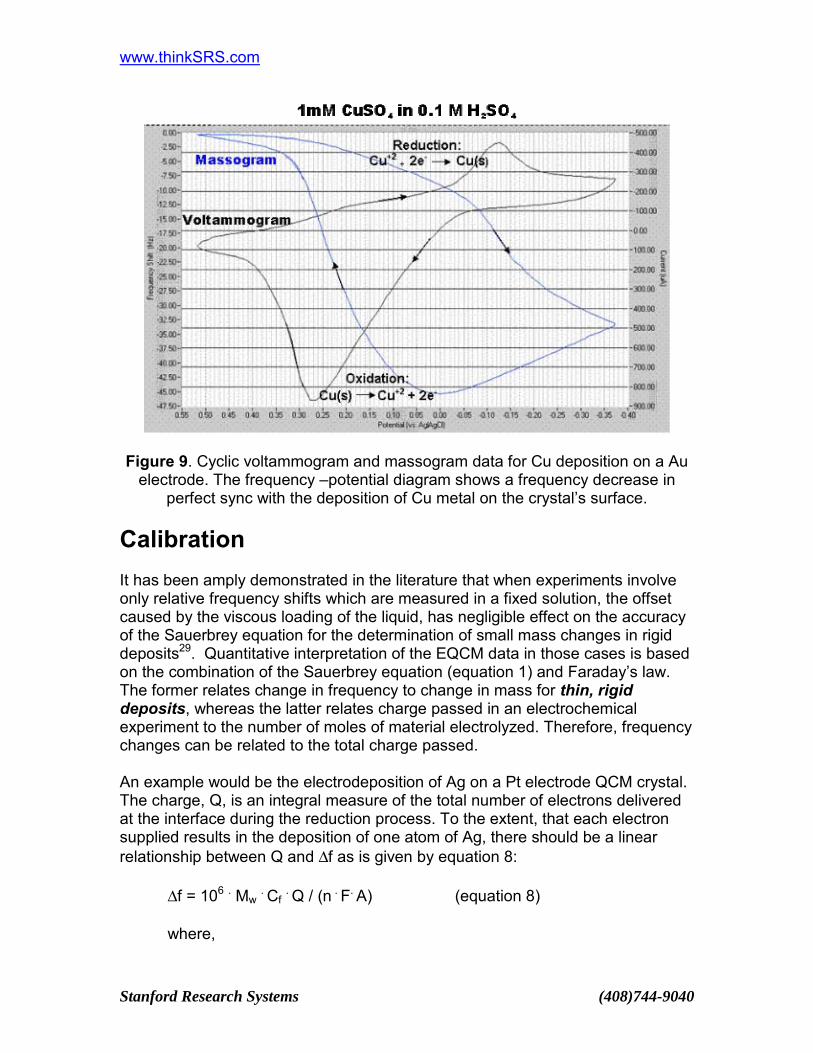
wwwthinkSRScom
Stanford Research Systems (408)744-9040
Figure 9 Cyclic voltammogram and massogram data for Cu deposition on a Au
electrode The frequency ndashpotential diagram shows a frequency decrease in perfect sync with the deposition of Cu metal on the crystalrsquos surface
Calibration It has been amply demonstrated in the literature that when experiments involve only relative frequency shifts which are measured in a fixed solution the offset caused by the viscous loading of the liquid has negligible effect on the accuracy of the Sauerbrey equation for the determination of small mass changes in rigid deposits29 Quantitative interpretation of the EQCM data in those cases is based on the combination of the Sauerbrey equation (equation 1) and Faradayrsquos law The former relates change in frequency to change in mass for thin rigid deposits whereas the latter relates charge passed in an electrochemical experiment to the number of moles of material electrolyzed Therefore frequency changes can be related to the total charge passed An example would be the electrodeposition of Ag on a Pt electrode QCM crystal The charge Q is an integral measure of the total number of electrons delivered at the interface during the reduction process To the extent that each electron supplied results in the deposition of one atom of Ag there should be a linear relationship between Q and ∆f as is given by equation 8
∆f = 106 Mw Cf Q (n F A) (equation 8) where
wwwthinkSRScom
Stanford Research Systems (408)744-9040
∆f - frequency change in Hz Mw - apparent molar mass of the depositing species in gramsmole Cf - Sauerbreyrsquos sensitivity factor for the crystal used (see equation 1) Q - integrated charge during the reduction in Coulomb A - Active deposition area of the working (ie liquid contact) electrode in cm2 F - Faradayrsquos constant 9648 104 Coulombmole and n - number of electrons transferred to induce deposition (ie n =1 for Ag deposition) (The factor of 106 provides for the unit conversion from mg in Cf to g in Mw)
A plot of ldquo∆f vs Qrdquo will deliver the apparent mass per electron of the deposited species when n is taken into account This is often used to elucidate the mass changes that accompany redox processes and hence is very useful for characterizing the mechanisms of electron-transfer reactions However before any calculations can be performed based on equation 8 the EQCM must be calibrated in order to properly derive (1) the proportionality constant Cf of the Sauerbrey equation in solution and (2) to account for the effective area of the working electrode This is generally done using a well behaved electrochemical reaction- typically electrodeposition of silver copper or lead on a Au or Pt electrode The EQCM calibration method favored by Stanford Research Systems for its QCM100 system is based on the galvanostatic deposition of Ag A 50mM solution of AgNO3 in 05M HNO3 is subjected to a reducing potential and Ag is deposited with a fixed cathodic current density of 50-500 microAcm2 The cathodic current is integrated to obtain the charge as a function of time Excellent linearity is generally observed in ldquo∆f vs Qrdquo plots for depositions within 1 microgcm2 providing a very reliable way to calibrate the proportionality constant of equation 8 Several calibration procedures are also described in the electrochemistry literature30 and users are referred to the publications list at the end of this chapter for details Polymer Modified Electrodes The EQCM has been extensively used to study polymer modified electrodes particularly as a gravimetric tool to follow redox processes31 However for the linear frequency-to-mass relationship (described by equation 8) to hold true the polymer overlayer must exhibit no changes in rigidity during the electrochemical process Otherwise the viscoelastic changes will also contribute to the frequency change leading to an erroneous interpretation of the mass changes32 As a
wwwthinkSRScom
Stanford Research Systems (408)744-9040
consequence it is essential to determine whether or not viscoelastic properties of the polymer film influence the frequency measurement during polymer film experiments
Figure 10 Votammogram and massogram data for the oxidation of pyrrole to form a polypyrrole film on a gold coated QCM Sensor Crystal Seven cycles of
voltammetry between - 04 and 095 V were conducted in this experiment Pyrrole monomer can be oxidized to its radical at 065V As this happens a thin polypyrrole film is formed on the crystal surface resulting in a decrease in the
fundamental frequency of oscillation of the crystal The continuous growth of the film is evidenced by the irreversible decrease in frequency during the scans
A starightforward way to detect changes in film viscoelastic properties of redox films is to simultaneously monitor the series resonance resistance R of the quartz oscillator during the electrochemical experiment33 Some theoretical models34 based on the simultaneous measurement of ∆f and ∆R have been discussed in the literature for the extension of EQCM gravimetric measurements to non-rigid films The viscoelastic analyis of polymeric thin films in EQCM systems is complex because the shear wave exists simultaneously in the quartz crystal the viscoelastic film and the adjacent solution so reflection of the shear wave must be taken into account However solution of this problem would be worthwhile specially if the material properties of the film could be derived This would allow correlation of the electrochemical behavior of the film with its material properties35
01M Pyrrole in 01M HCLO4
wwwthinkSRScom
Stanford Research Systems (408)744-9040
The unique property of the QCM technique is its ability to determine the mass of very thin layers while simultaneously giving information about their viscoelastic properties The ability to measure both mass and structural changes means it is possible to detect phase-transitions cross-linking and swelling in polymeric thin films36
wwwthinkSRScom
Stanford Research Systems (408)744-9040
Chemical and Biological Sensors Anything that has mass can generate a response from a QCM sensor The universal response of the device is the reason for the wide range of application of the technology However the downside of such universal sensitivity is that you always have a great danger of interferences For analytical purposes it is imperative to find ways of getting the QCM sensor to respond only to what you are interested in (ie build sensitivity into the device) This usually involves the addition of a sensitive layer on the surface of the crystal37 Organic polymers comprise the most common type of coating used with QCM sensors due to their capability to reversibly sorb vapors and liquids38 In much of the work published on the use of polymer coatings for vapor sensing the acoustic properties of the polymer material have been neglected The relative importance of the mass-loading and viscoelastic contributions of the film to the observed QCM response is a subject that has yet to be resolved In no area have the QCM applications seen such dramatic increase in recent years as in the field of biochemical analysis QCM devices are routinely used as biochemical and immunological probes39 as well as for the investigation andor monitoring of biochemcially significant processes Sensitive selective detection of biochemically active compounds can be achieved by employing antigen-antibody40 enzyme substrates and other receptor ndashprotein pairs The potential analytical uses of these materials has been reviewed particularly with respect to the development of biochemical sensors41 QCM studies have provided detailed information about the functionalized surfaces developed for a range of biochip and biosensor applications QCM Systems are applied routinely by biologists and biochemists to obtain information about processes such as (1) protein adsorptiondesorption42 (2) cell adhesion43 (3) Protein-protein interaction (4) Degradation of polymers (5) biofouling and biofilm formation (6) drug analysis44 and (7) DNA Biosensors45
References 1 G Sauerbrey Z Phys 155 (1959) 206 2 Daniel Buttry ldquoApplications of the QCM to Electrochemistryrdquo in A Series of Advances in Electroanalytical Chemistry edited by Allen Bard Marcel Dekker 1991 p 23-33 3 John Henderson ldquoElectronic Devices Concepts and Applicationsrdquo Prentice Hall NJ (1991) p 357 4 For example QCM10 crystal holder with a 1inch 5MHz crystal connected directly to an SRS QCM25 Crystal Controller
wwwthinkSRScom
Stanford Research Systems (408)744-9040
5 C Chagnard P Gilbert N Watkins T Beeler and David W Paul ldquoAn electronic oscillator with automatic gain controlEQCM Applicationsrdquo Sensors and Actuators B 32(1996) 129-136 A Arnau T Sogorb and Y Jimenez ldquoCircuit for continuous motional series resonat frequency and motional resistance monitoring of quartz crystal resonators by parallel capacitance cancellationrdquo Rev Sci Instrum 73(7)(2002) 2724 6 For example from the Conductance Output of the QCM100 7 Conductance is the inverse of resistance Conductance = 1 Resistance or Resistance = 1 Conductance The units of resistance are Ohms [Ω = VA] and the units of conductance are Siemens (S = AV] 8 For example Agilent 34401A with 6 digit resolution or 3458 with eight digits resolution 9 DR Denison ldquoLinearity of a Heavily Loaded Quartz Crystal Microbalancerdquo J Vac Sci Technol 10(1) (1973) 126 Klaus H Behrndt ldquoLong Term Operation of Crystal Oscillators in Thin-Film Depositionrdquo J Vac Sci technol 8(5)(1971) 622 10 C Lu and O Lewis ldquoInvestigation of film-thickness determination by oscillating quartz resonators with large mass loadrdquo J Appl Phys 43 (1972) 4385 Chih-shun Lu ldquoMass determination with piezoelectric quartz crystal resonatorsrdquo J Vac Sci Technol 12(1) (1975) 578 11 D R Denison ldquoLinearity of Heavily Loaded Quartz Crystal Microbalancerdquo J Vac Sci Technol 10(1973) 126 K H Behrndt ldquoLong Term Operation of Crystal Oscillators in Thin-Film Depositionrdquo J Vac Sci Technol 8(5) (1971) 622 12 T Nomura and M Okuhara Anal Chim Acta 142(1982) 281 13 A P M Glassford ldquoResponse of a Quartz Crystal Microbalance to a liquid Depositrdquo J Vac Sci Technol 15(6)(1978) 1836 14 K Keiji Kanazawa and Joseph Gordon II ldquoFrequency of a Quartz Microbalance in Contact with Liquidrdquo Anal Chem 57(1985) 1770 K Keiji Kanazawa and Joseph G Gordon II Analytica Chimica Acta 175(1985) 99-105 15 Stephen J Martin James J Spates Kurt O Wesendorf thomas Schnneider and Robert J Huber ldquoResonator Oscillator Response to Liquid Loadingrdquo Anal Chem 69(1997) 2050 16 Stephen Martin Victoria Edwards Granstaff and Gregory C Frye ldquoCharacterization of a Quartz Crystal Microbalance with Simultaneous Mass and Liquid Loadingrdquo Anal Chem 63 (1991) 2272 17 Operation in liquids requires that the crystal be mounted in a holder such that only the front surface of the crystal is in contact with the fluid while at the same time providing an electrical connection to both electrodes 18 For pure water at 20C ρL 09982 g cm-3 and ηL 100210-2 g cm-1 s-1 19 H Muramatsu Eiichi Tamiya and Isao Karube ldquoComputation of Equivalent Circuit Parameters of Quartz Crystals in Contact with Liquids and Study of Liquid Propertiesrdquo Anal Chem 60(1988) 2142 SJ Geelhood C W Frank and K Kanazawa ldquoTransient Quartz Crystal Microbalance Behaviors Comparedrdquo Journal of the Electrochemical Society 149(2002) H33-H38 Mengsu Yang and Michael Thompson ldquoMultiple Chemical Information from the Thickness Shear Mode Acoustic Wave Sensor in the liquid Phaserdquo Anal Chem 65(1993) 1158
wwwthinkSRScom
Stanford Research Systems (408)744-9040
20 S J Martin R W Cernosek and JJ Spates ldquoSensing Liquid Properties with Shear-mode Resonator Sensorsrdquo in Proceeds from TransducersEurosensors IX Stockholm Sweden (1995) 21 Michael Rodahl Fredrik Hook Anatol Krozer Peter Brzezinski and Bengt Kasemo ldquoQCM setup for frequency and Q-factor measurements in gaseous and liquid environmentsrdquo Rev Sci Instrum 66(7)(1995)3924 22 S J Geelhood CW Frank and K Kanazawa ldquoTransient QCM Behaviors Comparedrdquo J of the Electrochemical Societyrdquo 149(1)(2002)H33 23 Stephen Martin et al rdquoEffect of Surface Roughness on the Response of Thickness-Shear Mode Resonators in Liquidsrdquo Anal Chem 65(1993)2910 Michael Ward and Edward J Delawski ldquoRadial Mass Sensitivity of the Quartz Crystal Microbalance in Liquid Mediardquo Anal Chem 63(1991) 886 24 Mark R Deakin and Owen Melroy ldquoUnderpotential Metal Deposition on Au monitorred in situ with a Quartz Microbalancerdquo J Electroanal Chem 239(1988) 321 O Melroy K Kanazawa JG Gordon II and D Buttry ldquoDirect Determination of the Mass of an Underpotentially Deposited Monolayer of Lead on Goldrdquo Langmuir 2(1986)697 Masahiro Seo Masaki Aomi and Kengo Yoshida ldquoA combined Piezoelectric and EQCM study of Underpotential Deposition of Silver on Gold Electrodesrdquo Electrochimica Acta 39(89) (1994) 1039 Youngran Lim and Euijin Hwang ldquoAn Electrochemical QCM study of Oxygen reducttion during the Underpotential Depoosition of Lead on a Gold Electroderdquo Bull Korean Chem Soc 17(12)(1996)1091 25 EQCMWall Jet Split-Ring Disk Electrode study on Copper dissolution in Chloride Aqueous solutionrdquo Anal Sciences16(2000)1049 Michael Benje Matthias Eiermann Udo Pittermann and Konrad G Weil ldquoAn improved Quartz Microbalnce Applications to Electrocrystallizatuion and dissolution of Niquelrdquo Ber Bunsenges Phys Chem 90(1986) 435 26 Jorg Auge Peter Hauptmann Frank Eichelbaum and Stephen Rosler ldquoQCM sensor in liquidsrdquo Sensors and Actuators B 18-19 (1994) 518 27 Adrian W Bott ldquoCharacterization of Films Immobilized on an Electrode Surface Using the EQCMrdquo Current Separations 183(1999)79 28 Mark Deakin and Daniel Buttry ldquoElectrochemical Applications of the Quartz Crystal Microbalancerdquo Anal Chem 61(20)(1989)183 Daniel Buttry and Michael Ward ldquoMeasurement of Interfacial Processes at electrode surfaces with the EQCMrdquo Chem Rev 92(6) (1992) 1355 29 Wolfgang Stockel and Rolf Schumacher ldquoIn situ Microweighing at the Junction MetalElectrolyterdquo Ber Bunsenges Phys Chem 91(1987)345 30 C Gabrielli M Keddam and R Torrei ldquoCalibration of the Electrochemical Quartz Crystal Microbalancerdquo J Electrochem Soc 139(9) (1991) 2657 Note A calibration procedure based on the deposition of Ag on Au electrodes is described Graeme Andrew Snook Investigation of Solid-State Reactions by Electrochemical and Quartz Crystal Microbalance Measurements PhD Thesis 2000 Department of Chemistry Monash University Clayton 3168 Melbourne Australia and Division of Minerals CSIRO Clayton South 3169 Melbourne Australia under the supervision of Professor Alan Maxwell Bond (Monash) and Professor Stephen Fletcher (CSIRO)
wwwthinkSRScom
Stanford Research Systems (408)744-9040
Available for download from httpwww-bondchemmonasheduautheses Note the use of Lead acetate is proposed as a better alternative to Cu and Ag deposition Bruckenstein S and Shay M ldquoExperimental aspects of use of the quartz crystal microbalance in solutionrdquo Electrochim Acta 30(1985) 1295 31 Duke Orata and Daniel A Buttry ldquoDetermination of Ion Populations and Solvent Content as fucntions of Redox State and pH in Polyanilinerdquo J Am Chem Soc 109(1987)3574 32 Michael Ward ldquoInvestigation of Open Circuit Reactions of Polymer Films Using the QCM Reactions of Polyvinylferrocene Filmsrdquo J Phys Chem 92(1988)2049 Charles K Baker and John R Reynolds ldquoA quartz microbalance study of the electrosynthesis of polypyrrolerdquo J Electroanal Chem 251(1988) 307 33 Stephen Martin Victoria Edwards Granstaff and Gregory C Frye ldquoCharacterization of a Quartz Crystal Microbalance with Simultaneouus Mass and Liquid Loadingrdquo Anal Chem 63 (1991) 2272 Ralf Lucklum and Peter Hauptmann ldquoThe Df-DR QCM technique an approach to an advanced sensor signal interpretationrdquo Electrochimica Acta 45(2000) 3907 34 RA Etchenique and E L CalvordquoGravimetric measurement in redox polymer electrodes with the EQCM beyond the Sauerbrey limitrdquo Electrochemistry Communications 1(5)(1999)167 RA Etchenique and E J Calvo ldquoElectrochemical Quartz Crystal Impedance Study of Redox Hydrogel Mediators for Amperometryic Enzyme Electrodesrdquo Anal Chem 69(1997)4833 35 E J Calvo R Etchenique P N Bartlett K Singhal and Santamaria ldquoQuartz Crystal Impedance studies at 10MHz of viscoelastic liquids and filmsrdquo Faraday Discuss107(1997)141 Diethelm Johannsmann ldquoViscoelastic Analysis of Organic Thin Filmsrdquo on quartz resonatorsrdquo Macromol Chem Phys 200(1999)501 36 C E Reed K Keiji Kanazawa and J Kaufman ldquoPhysical description of a viscoelastically loaded AT-cut quartz resonatorrdquo J Appl Phys 68(5) (1990) 1993 37 D S Ballantine R M White S J Martin A J Rico E T Zellers G C Frye and H Woltjen ldquoAcoustic Wave Sensors Theory Design and Physico-Chemical Applicationsrdquo Acad Press London UK 1997 Chapter 5 (Chemical and Biological Sensors) p 222 38 GG Guilbault and J Jordan ldquoAnalytical uses of piezoelectric crystalsrdquo CRC Reviews 19 p 1-28 W H King ldquoPiezoelectric Sorption Detectorrdquo Anal Chem 36 (1964) 1735 39 Iddo Ben-Dov and Itamar Willmer ldquoPiezoelectric Immunosensors for Urine Specimens of Chlamidia trachomatis Employing QCM Microgravimetric Analysisrdquo Anal Chem 69(1997) 3506 40 A Hengerer C Koumlsslinger1 J Decker S Hauck1 I Queitsch2 H Wolf and S Duumlbel2 ldquoDetermination of Phage Antibody Affinities to Antigen by a Microbalance Sensor Systemrdquo BioTechniques 26956-964 (May 1999) 41 G G Guibault ldquoAnalytical uses of immobilized Enzymes Modern Monographs in Analytical Chemistryrdquo Vol 2Marcel Dekker New York (1984) G M Minunni M Mascini GG Guilbault B Hock ldquoThe Quartz Crystal Microbalance as Biosensor A Status Report on its Futurerdquo Anal Lett 28 5(1995) 749 S Tombelli M Mascini ldquoPiezoelectric Quartz Crystal Biosensor Recent Immobilisation Schemesrdquo Anal Lett 33(11) 2000 pp 2129-2151
wwwthinkSRScom
Stanford Research Systems (408)744-9040
Kim R Rogers ldquoPrinciples of Affinity Based Biosensorsrdquo Molecular Biotechnology 14(2000)109 42 Fredrik Hook et al ldquoStructural changes in hemoglobin during adsorption to solid surfaces effects of pH ionic strength and ligand bindingrdquo Proc Natl Acad Sci USA 95(1998)12271 43 C Fredriksson S Kihlman M Rodahl and B Kasemo ldquoThe Piezoelectric Quartz crystal Mass and Dissipation Sensor A means of studyinng Cell adhesionrdquo Langmuir 19(1998) 248 Ann-Sofie Cans et al ldquoMeasurement of the Dynamics of Exocytosis and Vesicle Retrieval at Cell Populations Using a QCMrdquo Anal Chem 73(2001)5805 C A Keller and B KasemordquoSurface Specific Kinetics of Lipid Vesicle Adsorption Measured with a QCMrdquo Biophysical Journal 75(1998) 1397 44 Wei W Z et al ldquoSelective pharmaceutical analyis technique with sensitive piezoelectric quartz sensorsrdquo Anal Lett 26(11)(1993)2371 45 Storri S Santoni T Mascini MrdquoA piezoelectric biosensor for DNA hybridization detectionrdquo Anal Lett 31(11)(1998)1795
wwwthinkSRScom
Stanford Research Systems (408)744-9040
∆f - frequency change in Hz Mw - apparent molar mass of the depositing species in gramsmole Cf - Sauerbreyrsquos sensitivity factor for the crystal used (see equation 1) Q - integrated charge during the reduction in Coulomb A - Active deposition area of the working (ie liquid contact) electrode in cm2 F - Faradayrsquos constant 9648 104 Coulombmole and n - number of electrons transferred to induce deposition (ie n =1 for Ag deposition) (The factor of 106 provides for the unit conversion from mg in Cf to g in Mw)
A plot of ldquo∆f vs Qrdquo will deliver the apparent mass per electron of the deposited species when n is taken into account This is often used to elucidate the mass changes that accompany redox processes and hence is very useful for characterizing the mechanisms of electron-transfer reactions However before any calculations can be performed based on equation 8 the EQCM must be calibrated in order to properly derive (1) the proportionality constant Cf of the Sauerbrey equation in solution and (2) to account for the effective area of the working electrode This is generally done using a well behaved electrochemical reaction- typically electrodeposition of silver copper or lead on a Au or Pt electrode The EQCM calibration method favored by Stanford Research Systems for its QCM100 system is based on the galvanostatic deposition of Ag A 50mM solution of AgNO3 in 05M HNO3 is subjected to a reducing potential and Ag is deposited with a fixed cathodic current density of 50-500 microAcm2 The cathodic current is integrated to obtain the charge as a function of time Excellent linearity is generally observed in ldquo∆f vs Qrdquo plots for depositions within 1 microgcm2 providing a very reliable way to calibrate the proportionality constant of equation 8 Several calibration procedures are also described in the electrochemistry literature30 and users are referred to the publications list at the end of this chapter for details Polymer Modified Electrodes The EQCM has been extensively used to study polymer modified electrodes particularly as a gravimetric tool to follow redox processes31 However for the linear frequency-to-mass relationship (described by equation 8) to hold true the polymer overlayer must exhibit no changes in rigidity during the electrochemical process Otherwise the viscoelastic changes will also contribute to the frequency change leading to an erroneous interpretation of the mass changes32 As a
wwwthinkSRScom
Stanford Research Systems (408)744-9040
consequence it is essential to determine whether or not viscoelastic properties of the polymer film influence the frequency measurement during polymer film experiments
Figure 10 Votammogram and massogram data for the oxidation of pyrrole to form a polypyrrole film on a gold coated QCM Sensor Crystal Seven cycles of
voltammetry between - 04 and 095 V were conducted in this experiment Pyrrole monomer can be oxidized to its radical at 065V As this happens a thin polypyrrole film is formed on the crystal surface resulting in a decrease in the
fundamental frequency of oscillation of the crystal The continuous growth of the film is evidenced by the irreversible decrease in frequency during the scans
A starightforward way to detect changes in film viscoelastic properties of redox films is to simultaneously monitor the series resonance resistance R of the quartz oscillator during the electrochemical experiment33 Some theoretical models34 based on the simultaneous measurement of ∆f and ∆R have been discussed in the literature for the extension of EQCM gravimetric measurements to non-rigid films The viscoelastic analyis of polymeric thin films in EQCM systems is complex because the shear wave exists simultaneously in the quartz crystal the viscoelastic film and the adjacent solution so reflection of the shear wave must be taken into account However solution of this problem would be worthwhile specially if the material properties of the film could be derived This would allow correlation of the electrochemical behavior of the film with its material properties35
01M Pyrrole in 01M HCLO4
wwwthinkSRScom
Stanford Research Systems (408)744-9040
The unique property of the QCM technique is its ability to determine the mass of very thin layers while simultaneously giving information about their viscoelastic properties The ability to measure both mass and structural changes means it is possible to detect phase-transitions cross-linking and swelling in polymeric thin films36
wwwthinkSRScom
Stanford Research Systems (408)744-9040
Chemical and Biological Sensors Anything that has mass can generate a response from a QCM sensor The universal response of the device is the reason for the wide range of application of the technology However the downside of such universal sensitivity is that you always have a great danger of interferences For analytical purposes it is imperative to find ways of getting the QCM sensor to respond only to what you are interested in (ie build sensitivity into the device) This usually involves the addition of a sensitive layer on the surface of the crystal37 Organic polymers comprise the most common type of coating used with QCM sensors due to their capability to reversibly sorb vapors and liquids38 In much of the work published on the use of polymer coatings for vapor sensing the acoustic properties of the polymer material have been neglected The relative importance of the mass-loading and viscoelastic contributions of the film to the observed QCM response is a subject that has yet to be resolved In no area have the QCM applications seen such dramatic increase in recent years as in the field of biochemical analysis QCM devices are routinely used as biochemical and immunological probes39 as well as for the investigation andor monitoring of biochemcially significant processes Sensitive selective detection of biochemically active compounds can be achieved by employing antigen-antibody40 enzyme substrates and other receptor ndashprotein pairs The potential analytical uses of these materials has been reviewed particularly with respect to the development of biochemical sensors41 QCM studies have provided detailed information about the functionalized surfaces developed for a range of biochip and biosensor applications QCM Systems are applied routinely by biologists and biochemists to obtain information about processes such as (1) protein adsorptiondesorption42 (2) cell adhesion43 (3) Protein-protein interaction (4) Degradation of polymers (5) biofouling and biofilm formation (6) drug analysis44 and (7) DNA Biosensors45
References 1 G Sauerbrey Z Phys 155 (1959) 206 2 Daniel Buttry ldquoApplications of the QCM to Electrochemistryrdquo in A Series of Advances in Electroanalytical Chemistry edited by Allen Bard Marcel Dekker 1991 p 23-33 3 John Henderson ldquoElectronic Devices Concepts and Applicationsrdquo Prentice Hall NJ (1991) p 357 4 For example QCM10 crystal holder with a 1inch 5MHz crystal connected directly to an SRS QCM25 Crystal Controller
wwwthinkSRScom
Stanford Research Systems (408)744-9040
5 C Chagnard P Gilbert N Watkins T Beeler and David W Paul ldquoAn electronic oscillator with automatic gain controlEQCM Applicationsrdquo Sensors and Actuators B 32(1996) 129-136 A Arnau T Sogorb and Y Jimenez ldquoCircuit for continuous motional series resonat frequency and motional resistance monitoring of quartz crystal resonators by parallel capacitance cancellationrdquo Rev Sci Instrum 73(7)(2002) 2724 6 For example from the Conductance Output of the QCM100 7 Conductance is the inverse of resistance Conductance = 1 Resistance or Resistance = 1 Conductance The units of resistance are Ohms [Ω = VA] and the units of conductance are Siemens (S = AV] 8 For example Agilent 34401A with 6 digit resolution or 3458 with eight digits resolution 9 DR Denison ldquoLinearity of a Heavily Loaded Quartz Crystal Microbalancerdquo J Vac Sci Technol 10(1) (1973) 126 Klaus H Behrndt ldquoLong Term Operation of Crystal Oscillators in Thin-Film Depositionrdquo J Vac Sci technol 8(5)(1971) 622 10 C Lu and O Lewis ldquoInvestigation of film-thickness determination by oscillating quartz resonators with large mass loadrdquo J Appl Phys 43 (1972) 4385 Chih-shun Lu ldquoMass determination with piezoelectric quartz crystal resonatorsrdquo J Vac Sci Technol 12(1) (1975) 578 11 D R Denison ldquoLinearity of Heavily Loaded Quartz Crystal Microbalancerdquo J Vac Sci Technol 10(1973) 126 K H Behrndt ldquoLong Term Operation of Crystal Oscillators in Thin-Film Depositionrdquo J Vac Sci Technol 8(5) (1971) 622 12 T Nomura and M Okuhara Anal Chim Acta 142(1982) 281 13 A P M Glassford ldquoResponse of a Quartz Crystal Microbalance to a liquid Depositrdquo J Vac Sci Technol 15(6)(1978) 1836 14 K Keiji Kanazawa and Joseph Gordon II ldquoFrequency of a Quartz Microbalance in Contact with Liquidrdquo Anal Chem 57(1985) 1770 K Keiji Kanazawa and Joseph G Gordon II Analytica Chimica Acta 175(1985) 99-105 15 Stephen J Martin James J Spates Kurt O Wesendorf thomas Schnneider and Robert J Huber ldquoResonator Oscillator Response to Liquid Loadingrdquo Anal Chem 69(1997) 2050 16 Stephen Martin Victoria Edwards Granstaff and Gregory C Frye ldquoCharacterization of a Quartz Crystal Microbalance with Simultaneous Mass and Liquid Loadingrdquo Anal Chem 63 (1991) 2272 17 Operation in liquids requires that the crystal be mounted in a holder such that only the front surface of the crystal is in contact with the fluid while at the same time providing an electrical connection to both electrodes 18 For pure water at 20C ρL 09982 g cm-3 and ηL 100210-2 g cm-1 s-1 19 H Muramatsu Eiichi Tamiya and Isao Karube ldquoComputation of Equivalent Circuit Parameters of Quartz Crystals in Contact with Liquids and Study of Liquid Propertiesrdquo Anal Chem 60(1988) 2142 SJ Geelhood C W Frank and K Kanazawa ldquoTransient Quartz Crystal Microbalance Behaviors Comparedrdquo Journal of the Electrochemical Society 149(2002) H33-H38 Mengsu Yang and Michael Thompson ldquoMultiple Chemical Information from the Thickness Shear Mode Acoustic Wave Sensor in the liquid Phaserdquo Anal Chem 65(1993) 1158
wwwthinkSRScom
Stanford Research Systems (408)744-9040
20 S J Martin R W Cernosek and JJ Spates ldquoSensing Liquid Properties with Shear-mode Resonator Sensorsrdquo in Proceeds from TransducersEurosensors IX Stockholm Sweden (1995) 21 Michael Rodahl Fredrik Hook Anatol Krozer Peter Brzezinski and Bengt Kasemo ldquoQCM setup for frequency and Q-factor measurements in gaseous and liquid environmentsrdquo Rev Sci Instrum 66(7)(1995)3924 22 S J Geelhood CW Frank and K Kanazawa ldquoTransient QCM Behaviors Comparedrdquo J of the Electrochemical Societyrdquo 149(1)(2002)H33 23 Stephen Martin et al rdquoEffect of Surface Roughness on the Response of Thickness-Shear Mode Resonators in Liquidsrdquo Anal Chem 65(1993)2910 Michael Ward and Edward J Delawski ldquoRadial Mass Sensitivity of the Quartz Crystal Microbalance in Liquid Mediardquo Anal Chem 63(1991) 886 24 Mark R Deakin and Owen Melroy ldquoUnderpotential Metal Deposition on Au monitorred in situ with a Quartz Microbalancerdquo J Electroanal Chem 239(1988) 321 O Melroy K Kanazawa JG Gordon II and D Buttry ldquoDirect Determination of the Mass of an Underpotentially Deposited Monolayer of Lead on Goldrdquo Langmuir 2(1986)697 Masahiro Seo Masaki Aomi and Kengo Yoshida ldquoA combined Piezoelectric and EQCM study of Underpotential Deposition of Silver on Gold Electrodesrdquo Electrochimica Acta 39(89) (1994) 1039 Youngran Lim and Euijin Hwang ldquoAn Electrochemical QCM study of Oxygen reducttion during the Underpotential Depoosition of Lead on a Gold Electroderdquo Bull Korean Chem Soc 17(12)(1996)1091 25 EQCMWall Jet Split-Ring Disk Electrode study on Copper dissolution in Chloride Aqueous solutionrdquo Anal Sciences16(2000)1049 Michael Benje Matthias Eiermann Udo Pittermann and Konrad G Weil ldquoAn improved Quartz Microbalnce Applications to Electrocrystallizatuion and dissolution of Niquelrdquo Ber Bunsenges Phys Chem 90(1986) 435 26 Jorg Auge Peter Hauptmann Frank Eichelbaum and Stephen Rosler ldquoQCM sensor in liquidsrdquo Sensors and Actuators B 18-19 (1994) 518 27 Adrian W Bott ldquoCharacterization of Films Immobilized on an Electrode Surface Using the EQCMrdquo Current Separations 183(1999)79 28 Mark Deakin and Daniel Buttry ldquoElectrochemical Applications of the Quartz Crystal Microbalancerdquo Anal Chem 61(20)(1989)183 Daniel Buttry and Michael Ward ldquoMeasurement of Interfacial Processes at electrode surfaces with the EQCMrdquo Chem Rev 92(6) (1992) 1355 29 Wolfgang Stockel and Rolf Schumacher ldquoIn situ Microweighing at the Junction MetalElectrolyterdquo Ber Bunsenges Phys Chem 91(1987)345 30 C Gabrielli M Keddam and R Torrei ldquoCalibration of the Electrochemical Quartz Crystal Microbalancerdquo J Electrochem Soc 139(9) (1991) 2657 Note A calibration procedure based on the deposition of Ag on Au electrodes is described Graeme Andrew Snook Investigation of Solid-State Reactions by Electrochemical and Quartz Crystal Microbalance Measurements PhD Thesis 2000 Department of Chemistry Monash University Clayton 3168 Melbourne Australia and Division of Minerals CSIRO Clayton South 3169 Melbourne Australia under the supervision of Professor Alan Maxwell Bond (Monash) and Professor Stephen Fletcher (CSIRO)
wwwthinkSRScom
Stanford Research Systems (408)744-9040
Available for download from httpwww-bondchemmonasheduautheses Note the use of Lead acetate is proposed as a better alternative to Cu and Ag deposition Bruckenstein S and Shay M ldquoExperimental aspects of use of the quartz crystal microbalance in solutionrdquo Electrochim Acta 30(1985) 1295 31 Duke Orata and Daniel A Buttry ldquoDetermination of Ion Populations and Solvent Content as fucntions of Redox State and pH in Polyanilinerdquo J Am Chem Soc 109(1987)3574 32 Michael Ward ldquoInvestigation of Open Circuit Reactions of Polymer Films Using the QCM Reactions of Polyvinylferrocene Filmsrdquo J Phys Chem 92(1988)2049 Charles K Baker and John R Reynolds ldquoA quartz microbalance study of the electrosynthesis of polypyrrolerdquo J Electroanal Chem 251(1988) 307 33 Stephen Martin Victoria Edwards Granstaff and Gregory C Frye ldquoCharacterization of a Quartz Crystal Microbalance with Simultaneouus Mass and Liquid Loadingrdquo Anal Chem 63 (1991) 2272 Ralf Lucklum and Peter Hauptmann ldquoThe Df-DR QCM technique an approach to an advanced sensor signal interpretationrdquo Electrochimica Acta 45(2000) 3907 34 RA Etchenique and E L CalvordquoGravimetric measurement in redox polymer electrodes with the EQCM beyond the Sauerbrey limitrdquo Electrochemistry Communications 1(5)(1999)167 RA Etchenique and E J Calvo ldquoElectrochemical Quartz Crystal Impedance Study of Redox Hydrogel Mediators for Amperometryic Enzyme Electrodesrdquo Anal Chem 69(1997)4833 35 E J Calvo R Etchenique P N Bartlett K Singhal and Santamaria ldquoQuartz Crystal Impedance studies at 10MHz of viscoelastic liquids and filmsrdquo Faraday Discuss107(1997)141 Diethelm Johannsmann ldquoViscoelastic Analysis of Organic Thin Filmsrdquo on quartz resonatorsrdquo Macromol Chem Phys 200(1999)501 36 C E Reed K Keiji Kanazawa and J Kaufman ldquoPhysical description of a viscoelastically loaded AT-cut quartz resonatorrdquo J Appl Phys 68(5) (1990) 1993 37 D S Ballantine R M White S J Martin A J Rico E T Zellers G C Frye and H Woltjen ldquoAcoustic Wave Sensors Theory Design and Physico-Chemical Applicationsrdquo Acad Press London UK 1997 Chapter 5 (Chemical and Biological Sensors) p 222 38 GG Guilbault and J Jordan ldquoAnalytical uses of piezoelectric crystalsrdquo CRC Reviews 19 p 1-28 W H King ldquoPiezoelectric Sorption Detectorrdquo Anal Chem 36 (1964) 1735 39 Iddo Ben-Dov and Itamar Willmer ldquoPiezoelectric Immunosensors for Urine Specimens of Chlamidia trachomatis Employing QCM Microgravimetric Analysisrdquo Anal Chem 69(1997) 3506 40 A Hengerer C Koumlsslinger1 J Decker S Hauck1 I Queitsch2 H Wolf and S Duumlbel2 ldquoDetermination of Phage Antibody Affinities to Antigen by a Microbalance Sensor Systemrdquo BioTechniques 26956-964 (May 1999) 41 G G Guibault ldquoAnalytical uses of immobilized Enzymes Modern Monographs in Analytical Chemistryrdquo Vol 2Marcel Dekker New York (1984) G M Minunni M Mascini GG Guilbault B Hock ldquoThe Quartz Crystal Microbalance as Biosensor A Status Report on its Futurerdquo Anal Lett 28 5(1995) 749 S Tombelli M Mascini ldquoPiezoelectric Quartz Crystal Biosensor Recent Immobilisation Schemesrdquo Anal Lett 33(11) 2000 pp 2129-2151
wwwthinkSRScom
Stanford Research Systems (408)744-9040
Kim R Rogers ldquoPrinciples of Affinity Based Biosensorsrdquo Molecular Biotechnology 14(2000)109 42 Fredrik Hook et al ldquoStructural changes in hemoglobin during adsorption to solid surfaces effects of pH ionic strength and ligand bindingrdquo Proc Natl Acad Sci USA 95(1998)12271 43 C Fredriksson S Kihlman M Rodahl and B Kasemo ldquoThe Piezoelectric Quartz crystal Mass and Dissipation Sensor A means of studyinng Cell adhesionrdquo Langmuir 19(1998) 248 Ann-Sofie Cans et al ldquoMeasurement of the Dynamics of Exocytosis and Vesicle Retrieval at Cell Populations Using a QCMrdquo Anal Chem 73(2001)5805 C A Keller and B KasemordquoSurface Specific Kinetics of Lipid Vesicle Adsorption Measured with a QCMrdquo Biophysical Journal 75(1998) 1397 44 Wei W Z et al ldquoSelective pharmaceutical analyis technique with sensitive piezoelectric quartz sensorsrdquo Anal Lett 26(11)(1993)2371 45 Storri S Santoni T Mascini MrdquoA piezoelectric biosensor for DNA hybridization detectionrdquo Anal Lett 31(11)(1998)1795

wwwthinkSRScom
Stanford Research Systems (408)744-9040
Kim R Rogers ldquoPrinciples of Affinity Based Biosensorsrdquo Molecular Biotechnology 14(2000)109 42 Fredrik Hook et al ldquoStructural changes in hemoglobin during adsorption to solid surfaces effects of pH ionic strength and ligand bindingrdquo Proc Natl Acad Sci USA 95(1998)12271 43 C Fredriksson S Kihlman M Rodahl and B Kasemo ldquoThe Piezoelectric Quartz crystal Mass and Dissipation Sensor A means of studyinng Cell adhesionrdquo Langmuir 19(1998) 248 Ann-Sofie Cans et al ldquoMeasurement of the Dynamics of Exocytosis and Vesicle Retrieval at Cell Populations Using a QCMrdquo Anal Chem 73(2001)5805 C A Keller and B KasemordquoSurface Specific Kinetics of Lipid Vesicle Adsorption Measured with a QCMrdquo Biophysical Journal 75(1998) 1397 44 Wei W Z et al ldquoSelective pharmaceutical analyis technique with sensitive piezoelectric quartz sensorsrdquo Anal Lett 26(11)(1993)2371 45 Storri S Santoni T Mascini MrdquoA piezoelectric biosensor for DNA hybridization detectionrdquo Anal Lett 31(11)(1998)1795


