The INL is a U.S. Department of Energy National Laboratory operated by Battelle Energy Alliance
INL/EXT-15-36869 Revision 0
Procter & Gamble Technology Process Assessment for Bioenergy Production
Hongqiang Hu Richard Boardman Christopher T. Wright
January 2016
DISCLAIMER
This information was prepared as an account of work sponsored by an agency of the U.S. Government. Neither the U.S. Government nor any agency thereof, nor any of their employees, makes any warranty, expressed or implied, or usefulness, of any information, apparatus, product, or process disclosed, or represents that its use would not infringe privately owned rights. References herein to any specific commercial product, process, or service by trade name, trade mark, manufacturer, or otherwise, does not necessarily constitute or imply its endorsement, recommendation, or favoring by the U.S. Government or any agency thereof. The views and opinions of authors expressed herein do not necessarily state or reflect those of the U.S. Government or any agency thereof.
1
INL/EXT-16-36869 Revision 0
Procter and Gamble Technology Process Assessment for Bioenergy Production
Hongqiang Hu Richard Boardman
Christopher T. Wright
January 2016
Idaho National Laboratory Advanced Processing and Decision Systems Department
PO BOX 1625 Idaho Falls, Idaho 83415
http://www.inl.gov
Prepared for Procter & Gamble Box Elder Plant, Tremonton, Utah
2
Table of Contents
1. Project Scope …………………………………………………………………..………………………………..…..52. Overall Biomass and Waste and the Conversion Routes ……………………………………………………….53. Basic Heat and Power Needs of P&G…………………………………………………………………………..…84. Total Biomass and Energy Availability for P&G Facility…………………………………………..………..……95. Biomass Conversion Processes for P&G…………………………………………..……………………..…..….156. Summary………………………………………………………………………………………………………….….177. Reference…………………………………………………………………………………………………………….17
Tables and Figures
Table 1. Numbers of operating anaerobic digesters by animal types in U.S…………………………………………….8 Table 2. Average energy consumption of P&G in calendar year 2014 and expectation for future…………………....10 Table 3. Biomass and energy available from agriculture residues………………………………………………..……...11 Table 4. Biomass and energy available from refuse waste………………………………………………………..…..….11 Table 5. Biomass and energy available from wastewater and sludge……………………….…………….…………….12 Table 6. Biomass and energy available from organic waste stream…………………………………….…………..…...13 Table 7. Biomass and energy available from cattle/cow manure……………………………………………..…………..14 Table 8. Biomass and energy available from food wastes……………………………………………………………..….14 Table 9. Characteristics of food waste……………………………………………………………………………………….15 Table 10. Summary of total availability of biomass and energy for P&G ……..…………..……………………………..16
Figure 1. Share of bioenergy in the world energy mix………………………………………….……………..……………5 Figure 2A/B. Overall conversion routes of biomass and waste to bioenergy…………..……………………………..…6/7 Figure 3. Conceptual degradation stages of anaerobic digestion process ……………………………………………...7 Figure 4. Conceptual fluid bed fast pyrolysis process …………………………………………………………………..…9 Figure 5. Conceptual gasification steps……………………………………………………………………………….…….10 Figure 6. Distribution of theoretical availability of bioenergy for P&G……………………………………..……………..16 Figure 7. Distribution of practical estimation of bioenergy for P&G…………………………………………………..…..17 Figure 8. Development status of some conversion processes…………………………………………………..………..17 Figure 9. Overall biomass and waste conversion processes for P&G…………………………………………………...18 Figure 10. Allocation of theoretical availability of bioenergy for P&G between AD and other process …………..…..19 Figure 11. Allocation of practical estimation of bioenergy for P&G between AD and other process ………….….…..19
3
Executive Summary
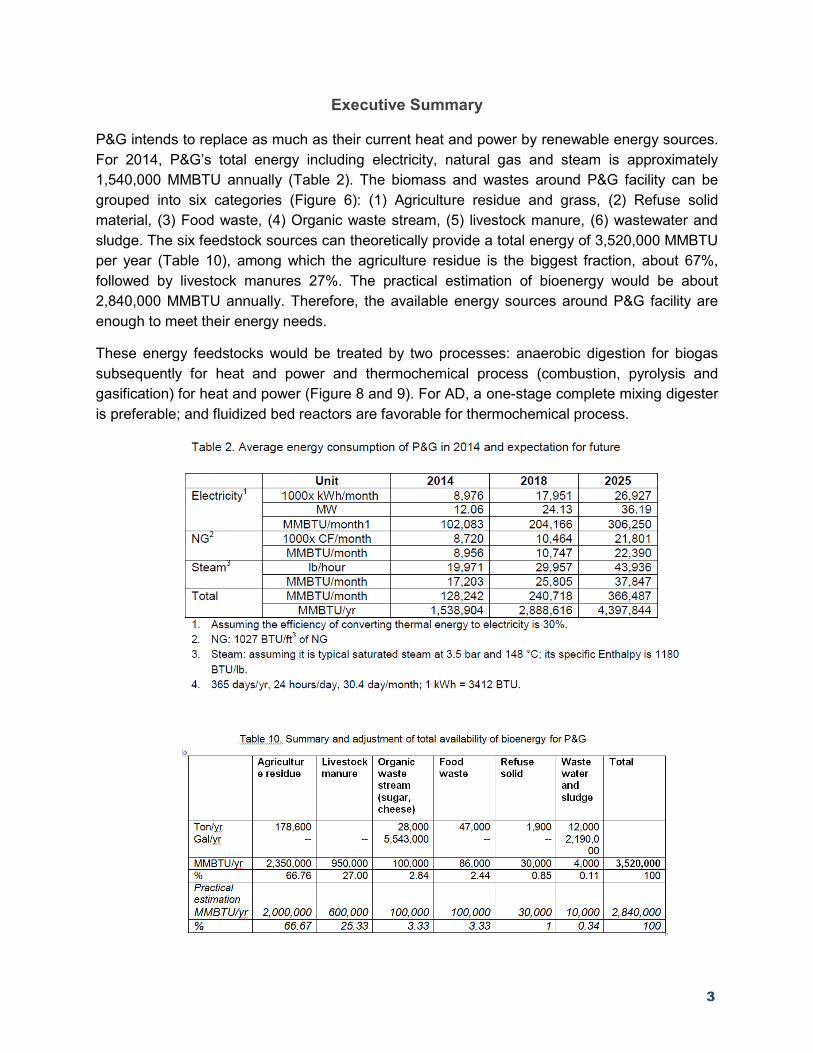
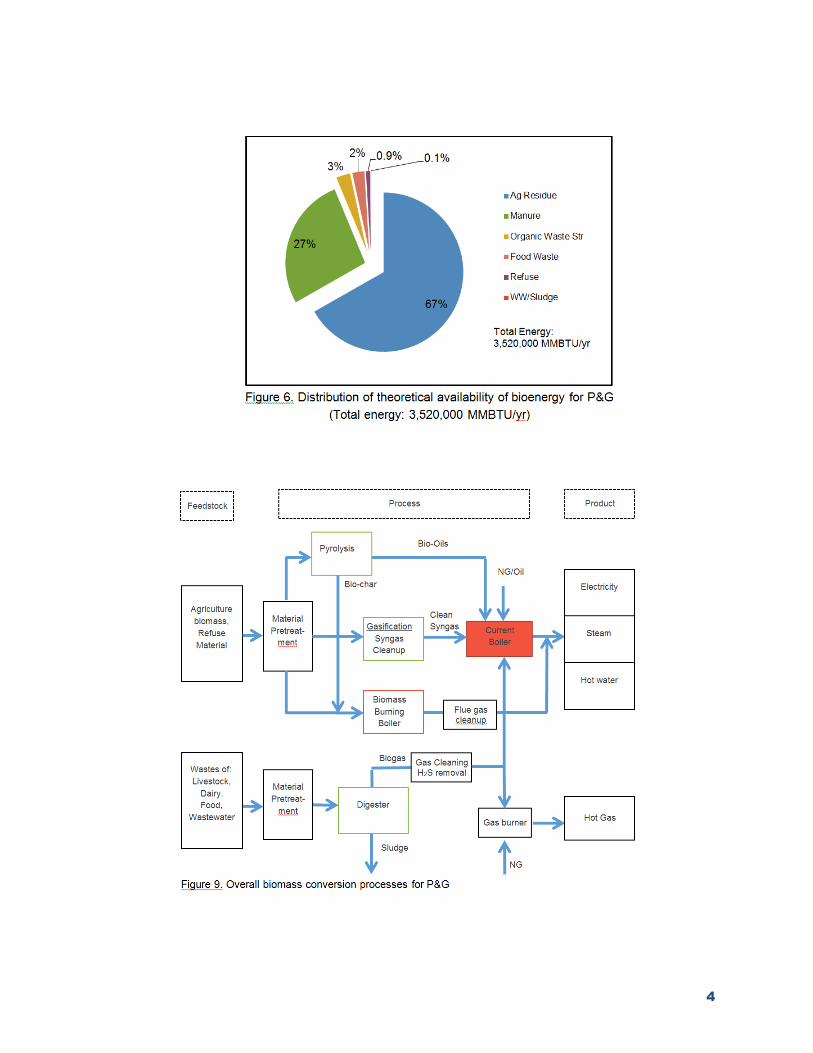
P&G intends to replace as much as their current heat and power by renewable energy sources. For 2014, P&G’s total energy including electricity, natural gas and steam is approximately 1,540,000 MMBTU annually (Table 2). The biomass and wastes around P&G facility can be grouped into six categories (Figure 6): (1) Agriculture residue and grass, (2) Refuse solid material, (3) Food waste, (4) Organic waste stream, (5) livestock manure, (6) wastewater and sludge. The six feedstock sources can theoretically provide a total energy of 3,520,000 MMBTU per year (Table 10), among which the agriculture residue is the biggest fraction, about 67%, followed by livestock manures 27%. The practical estimation of bioenergy would be about 2,840,000 MMBTU annually. Therefore, the available energy sources around P&G facility are enough to meet their energy needs.
These energy feedstocks would be treated by two processes: anaerobic digestion for biogas subsequently for heat and power and thermochemical process (combustion, pyrolysis and gasification) for heat and power (Figure 8 and 9). For AD, a one-stage complete mixing digester is preferable; and fluidized bed reactors are favorable for thermochemical process.
4
5
PROCTOR AND GAMBLE
INL – TECHNOLOGY PROCESS ASSESSMENT
September 15, 2015
1. Project ScopeBased on all the unspecified biomass and waste resources available for P&G’s Box Elder facility, propose a set of biomass and waste conversion options to meet the basic heat and power needs of P&G’s Box Elder facility.
2. Overall Biomass and Waste and the Conversion Routes2.1. Types of biomass and waste
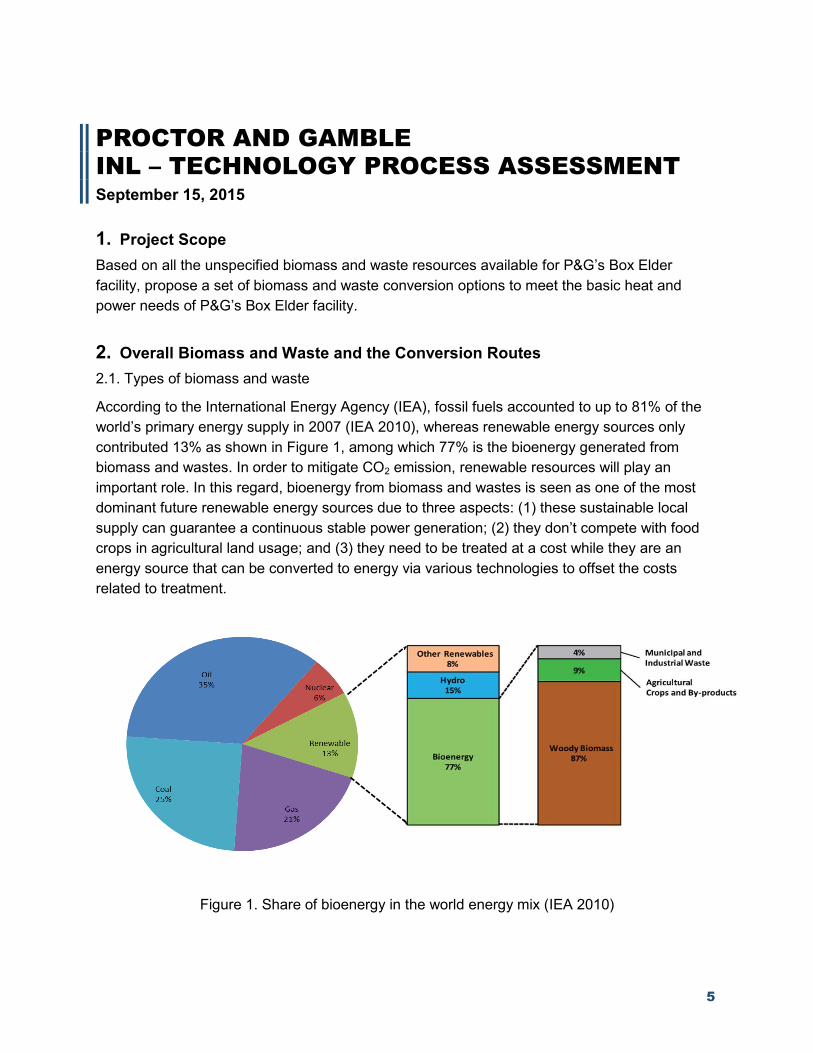
According to the International Energy Agency (IEA), fossil fuels accounted to up to 81% of the world’s primary energy supply in 2007 (IEA 2010), whereas renewable energy sources only contributed 13% as shown in Figure 1, among which 77% is the bioenergy generated from biomass and wastes. In order to mitigate CO2 emission, renewable resources will play an important role. In this regard, bioenergy from biomass and wastes is seen as one of the most dominant future renewable energy sources due to three aspects: (1) these sustainable local supply can guarantee a continuous stable power generation; (2) they don’t compete with food crops in agricultural land usage; and (3) they need to be treated at a cost while they are an energy source that can be converted to energy via various technologies to offset the costs related to treatment.
Figure 1. Share of bioenergy in the world energy mix (IEA 2010)
6
Biomass consists of any organic matter of vegetable or animal origin. It is available in many forms and from many different sources e.g. forestry products (biomass from logging, residue, process residues such as sawdust and black liquor, etc.); agricultural products (crops, harvest residues, food processing waste, animal dung, etc.);and municipal and other waste (waste wood, sewage sludge, organic components of municipal solid waste, etc).
2.2. Conversion technologies
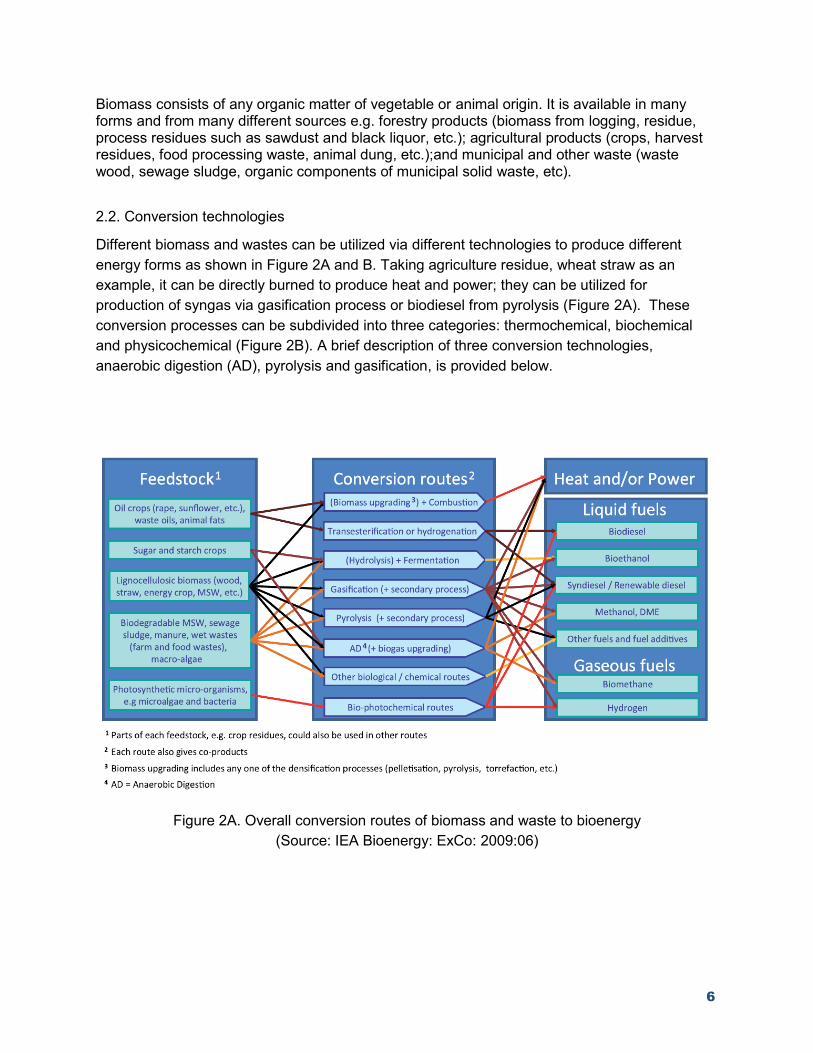
Different biomass and wastes can be utilized via different technologies to produce different energy forms as shown in Figure 2A and B. Taking agriculture residue, wheat straw as an example, it can be directly burned to produce heat and power; they can be utilized for production of syngas via gasification process or biodiesel from pyrolysis (Figure 2A). These conversion processes can be subdivided into three categories: thermochemical, biochemical and physicochemical (Figure 2B). A brief description of three conversion technologies, anaerobic digestion (AD), pyrolysis and gasification, is provided below.
Figure 2A. Overall conversion routes of biomass and waste to bioenergy (Source: IEA Bioenergy: ExCo: 2009:06)
7
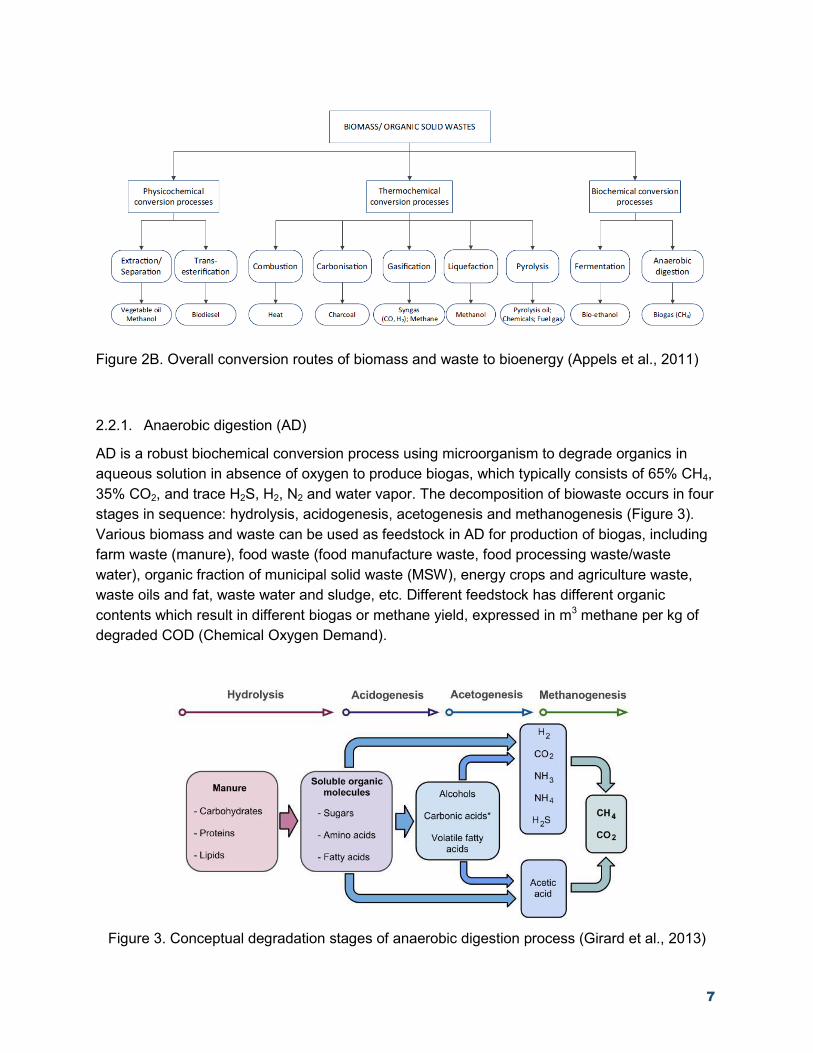
Figure 2B. Overall conversion routes of biomass and waste to bioenergy (Appels et al., 2011)
2.2.1. Anaerobic digestion (AD)
AD is a robust biochemical conversion process using microorganism to degrade organics in aqueous solution in absence of oxygen to produce biogas, which typically consists of 65% CH4, 35% CO2, and trace H2S, H2, N2 and water vapor. The decomposition of biowaste occurs in four stages in sequence: hydrolysis, acidogenesis, acetogenesis and methanogenesis (Figure 3). Various biomass and waste can be used as feedstock in AD for production of biogas, including farm waste (manure), food waste (food manufacture waste, food processing waste/waste water), organic fraction of municipal solid waste (MSW), energy crops and agriculture waste, waste oils and fat, waste water and sludge, etc. Different feedstock has different organic contents which result in different biogas or methane yield, expressed in m3 methane per kg of degraded COD (Chemical Oxygen Demand).
Figure 3. Conceptual degradation stages of anaerobic digestion process (Girard et al., 2013)
8
COD is used to quantify the amount of organic matter in waste streams and predict the potential for biogas production. COD conversion is the basis for estimating the methane yield from various feedstock in the following part of this report. Different feedstocks for AD have different COD values. For example, 1 g carbohydrates (sugar is typical example) is equal to 1.07 g COD, 1 g protein provides 1.5 g COD, while 2.91 g COD from 1 g lipid (Zeeman and Gerbens). If COD value is not available for some wastes, the volatile solids (VS) content with a factor adjustment can be used as an approximation of COD. The ratio of COD/VS could be 1 to 2. In this report, the methane yield is taking as 0.35 m3 CH4 per kg COD degraded based on several references(Zeeman and Gerbens; Moriarty K 2013; Cornell University 2004; USDA 2007).
There are a wide variety of digesters, while the most common digester types are covered lagoon, completer mixed digester, plug flow digester. AD is widely applied throughout the world. As for commercial scale livestock facilities, there are more than 6,800 digesters currently operating in German while 157 projects in USA (C2ES 2015, EPA 2010). As illustrated in Table 1, about half of operating digester projects in the United States use plug flow digesters. Complete mix systems are the second most common digester type, at about 23 percent, followed closely by covered lagoons, at 19 percent. Plug flow digesters are prevalent because this technology is commonly used for scraped manure systems at dairies, and dairy farms currently represent almost 80 percent of the digester projects in the United States.
Table 1. Numbers of operating anaerobic digesters by animal type in U.S. Farm Total
Digester Plug Flow Complete
mix Covered lagoon
others
Dairy 126 74 27 16 9 Swine 24 2 5 15 2 Poultry 5 1 4 0 0 Beef 2 2 0 0 0 Total 157 79 36 31 11
2.2.2. Pyrolysis
Pyrolysis is the controlled thermal decomposition of biomass occurring at about 500 °C to produce a liquid boi-oil, a mixture of gas (syngas) and solid charcoal (biochar). Like AD, pyrolysis operates in anaerobic environment (absence of oxygen). Based on the residence times in the reactor, there are two main types of pyrolysis processes: fast and slow, leading to different proportions of the liquid, gas and solid fractions. Slow pyrolysis favors the production of bio-char, which can be substituted in any applications using coal; on the other hand fast pyrolysis maximizes the production of bio-oil, which makes this process more attractive and suitable for industrial applications (Figure 4).
The essential features of a fast pyrolysis are: (1) very high heating and heat transfer rates, which usually requires a finely ground biomass feed; (2) carefully controlled pyrolysis reaction temperature of around 500 °C in the vapor phase, with short vapor residence times of typically
9
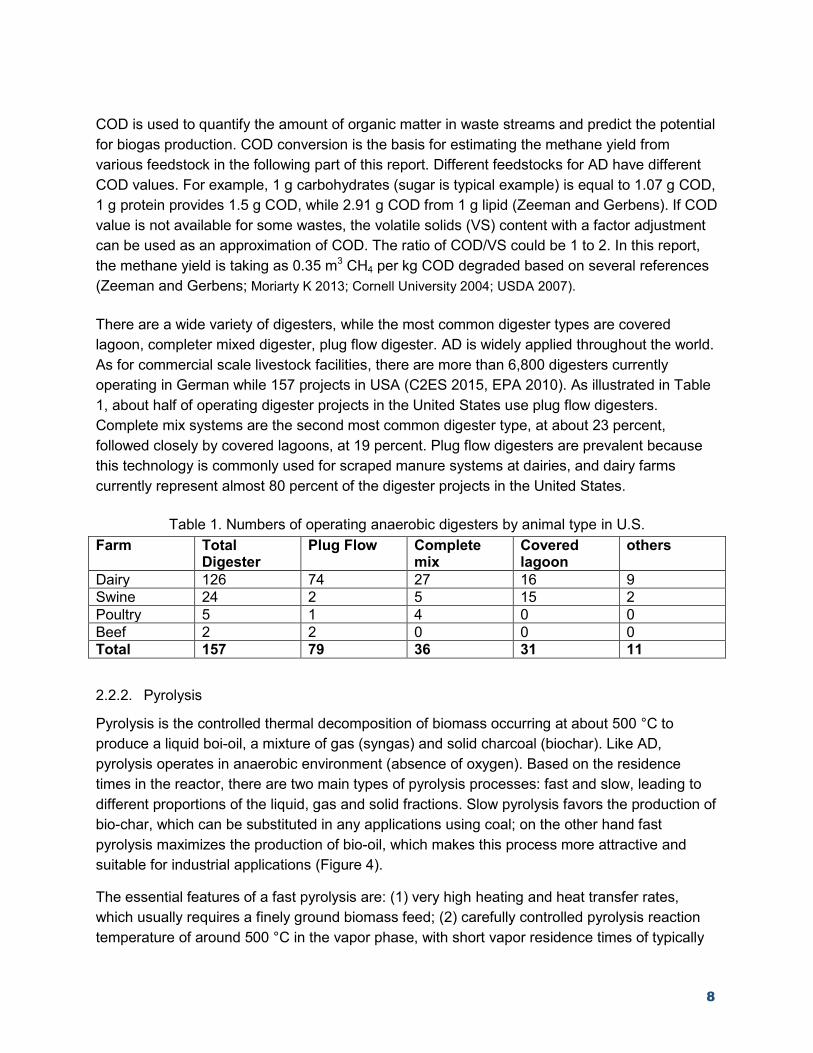
less than 2 s; (3) rapid cooling of the pyrolysis vapors to give the bio-oil product. The main product, bio-oil, is a miscible mixture of polar organics (about 75±80 wt%) and water (about 20± 25 wt%). Its yield is up to 80 wt% on dry feed, together with by-product char and gas which can be used within the process so there are no waste streams.
Figure 4. Conceptual fluid bed fast pyrolysis process (Bridgewater et al., 1999)
2.2.3. Gasification
Biomass gasification of biomass occurs by partial oxidation into a gaseous product, syngas, consisting primarily of hydrogen and carbon monoxide, with lesser amounts of CO2, water, methane, and nitrogen (N2). The reactions are carried out at elevated temperatures, 500-1400 °C, and atmospheric or elevated pressures up to 33 bar. The oxidant used is essential for the gasification processes and can be air, pure oxygen, steam or a mixture of these gases. Air-based gasifiers typically produce a product gas containing a relatively high concentration of nitrogen with a low heating value between 4 and 6 MJ/m3 (107-161 Btu/ft3). Oxygen and steam-based gasifiers produce a product gas containing a relatively high concentration of hydrogen and CO with a heating value between 10 and 20 MJ/m3 (268-537 Btu/ft3).
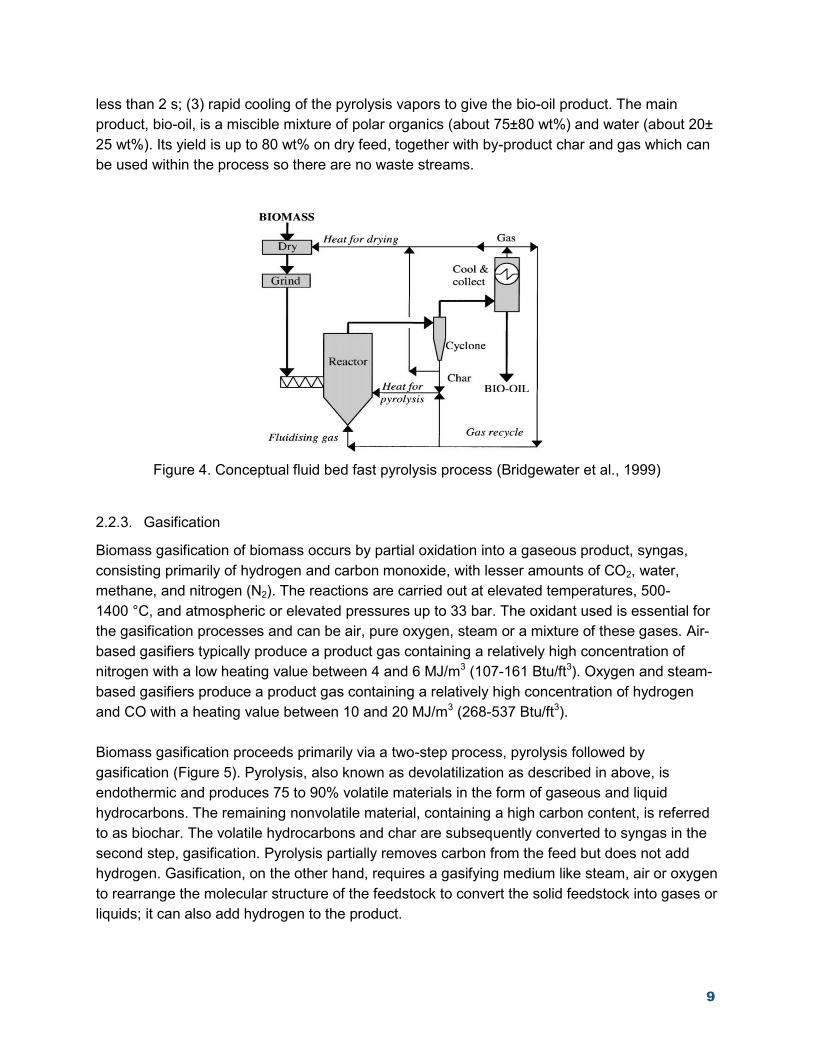
Biomass gasification proceeds primarily via a two-step process, pyrolysis followed by gasification (Figure 5). Pyrolysis, also known as devolatilization as described in above, is endothermic and produces 75 to 90% volatile materials in the form of gaseous and liquid hydrocarbons. The remaining nonvolatile material, containing a high carbon content, is referred to as biochar. The volatile hydrocarbons and char are subsequently converted to syngas in the second step, gasification. Pyrolysis partially removes carbon from the feed but does not add hydrogen. Gasification, on the other hand, requires a gasifying medium like steam, air or oxygen to rearrange the molecular structure of the feedstock to convert the solid feedstock into gases or liquids; it can also add hydrogen to the product.
10
Figure 5. Gasification steps (Ciferno and Marano 2002)
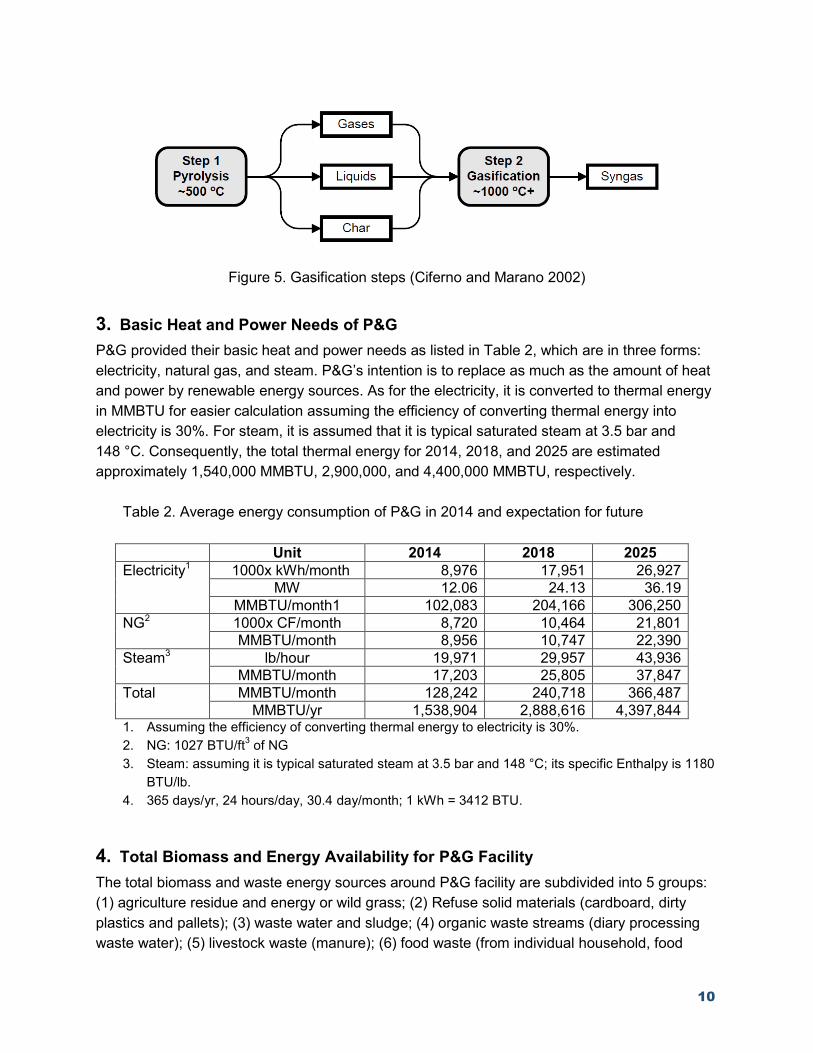
3. Basic Heat and Power Needs of P&GP&G provided their basic heat and power needs as listed in Table 2, which are in three forms: electricity, natural gas, and steam. P&G’s intention is to replace as much as the amount of heat and power by renewable energy sources. As for the electricity, it is converted to thermal energy in MMBTU for easier calculation assuming the efficiency of converting thermal energy into electricity is 30%. For steam, it is assumed that it is typical saturated steam at 3.5 bar and 148 °C. Consequently, the total thermal energy for 2014, 2018, and 2025 are estimated approximately 1,540,000 MMBTU, 2,900,000, and 4,400,000 MMBTU, respectively.
Table 2. Average energy consumption of P&G in 2014 and expectation for future
Unit 2014 2018 2025 Electricity1 1000x kWh/month 8,976 17,951 26,927
MW 12.06 24.13 36.19 MMBTU/month1 102,083 204,166 306,250
NG2 1000x CF/month 8,720 10,464 21,801 MMBTU/month 8,956 10,747 22,390
Steam3 lb/hour 19,971 29,957 43,936 MMBTU/month 17,203 25,805 37,847
Total MMBTU/month 128,242 240,718 366,487 MMBTU/yr 1,538,904 2,888,616 4,397,844
1. Assuming the efficiency of converting thermal energy to electricity is 30%.2. NG: 1027 BTU/ft3 of NG3. Steam: assuming it is typical saturated steam at 3.5 bar and 148 °C; its specific Enthalpy is 1180
BTU/lb.4. 365 days/yr, 24 hours/day, 30.4 day/month; 1 kWh = 3412 BTU.
4. Total Biomass and Energy Availability for P&G FacilityThe total biomass and waste energy sources around P&G facility are subdivided into 5 groups: (1) agriculture residue and energy or wild grass; (2) Refuse solid materials (cardboard, dirty plastics and pallets); (3) waste water and sludge; (4) organic waste streams (diary processing waste water); (5) livestock waste (manure); (6) food waste (from individual household, food
11
manufactures and processing companies). The amount of biomass and waste were from Bonner’s report (2015).
4.1. Agriculture residue and grass:
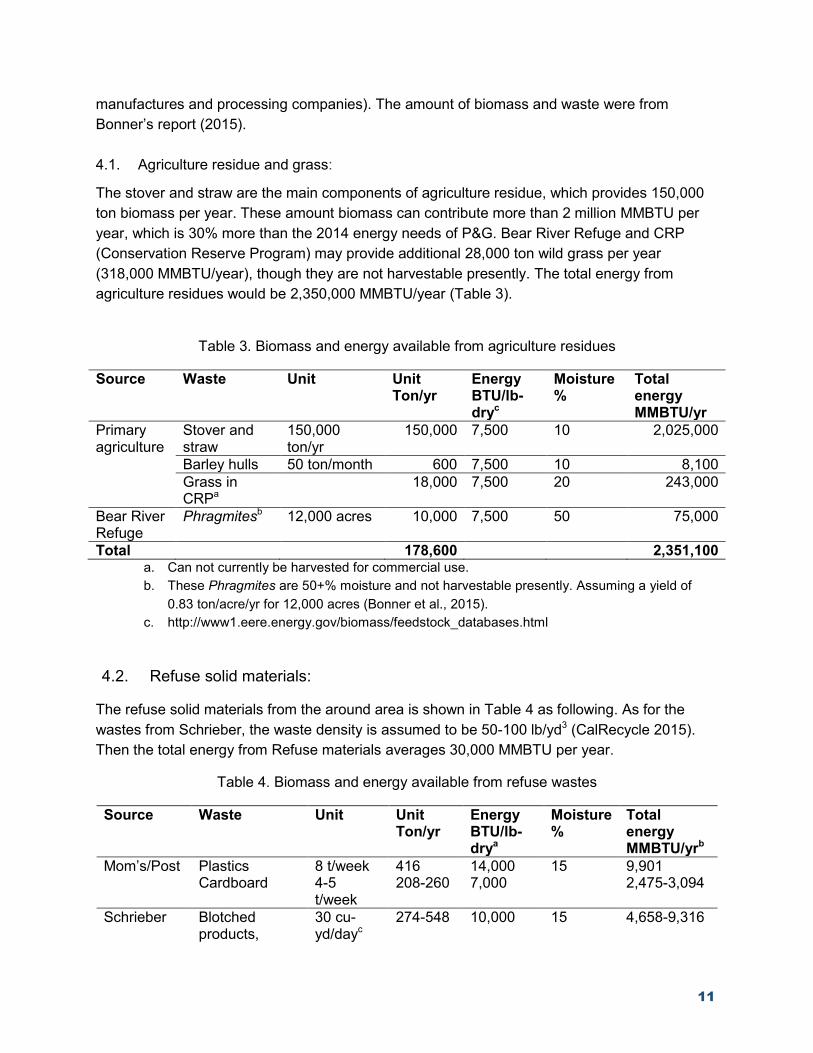
The stover and straw are the main components of agriculture residue, which provides 150,000 ton biomass per year. These amount biomass can contribute more than 2 million MMBTU per year, which is 30% more than the 2014 energy needs of P&G. Bear River Refuge and CRP (Conservation Reserve Program) may provide additional 28,000 ton wild grass per year (318,000 MMBTU/year), though they are not harvestable presently. The total energy from agriculture residues would be 2,350,000 MMBTU/year (Table 3).
Table 3. Biomass and energy available from agriculture residues
Source Waste Unit Unit Ton/yr
Energy BTU/lb-dryc
Moisture %
Total energy MMBTU/yr
Primary agriculture
Stover and straw
150,000 ton/yr
150,000 7,500 10 2,025,000
Barley hulls 50 ton/month 600 7,500 10 8,100 Grass in CRPa
18,000 7,500 20 243,000
Bear River Refuge
Phragmitesb 12,000 acres 10,000 7,500 50 75,000
Total 178,600 2,351,100 a. Can not currently be harvested for commercial use.b. These Phragmites are 50+% moisture and not harvestable presently. Assuming a yield of
0.83 ton/acre/yr for 12,000 acres (Bonner et al., 2015).c. http://www1.eere.energy.gov/biomass/feedstock_databases.html
4.2. Refuse solid materials:
The refuse solid materials from the around area is shown in Table 4 as following. As for the wastes from Schrieber, the waste density is assumed to be 50-100 lb/yd3 (CalRecycle 2015). Then the total energy from Refuse materials averages 30,000 MMBTU per year.
Table 4. Biomass and energy available from refuse wastes
Source Waste Unit Unit Ton/yr
Energy BTU/lb-drya
Moisture %
Total energy MMBTU/yrb
Mom’s/Post Plastics Cardboard
8 t/week 4-5 t/week
416 208-260
14,0007,000
15 9,901 2,475-3,094
Schrieber Blotched products,
30 cu-yd/dayc
274-548 10,000 15 4,658-9,316
12
cardboard, dirty plastics and pallets
Loft house Food contaminated paper and plastics
60-90 t/month
720-1080
7,000 15 8,568-12,852
Total 1,618-2,304
25,602-35,163
a. Themielis NJ, et al., 2011.b. Assuming 15% moisture for all the Refuse waste.c. The waste density is assumed to be 50-100 lb/yd3 (CalRecycle 2015).
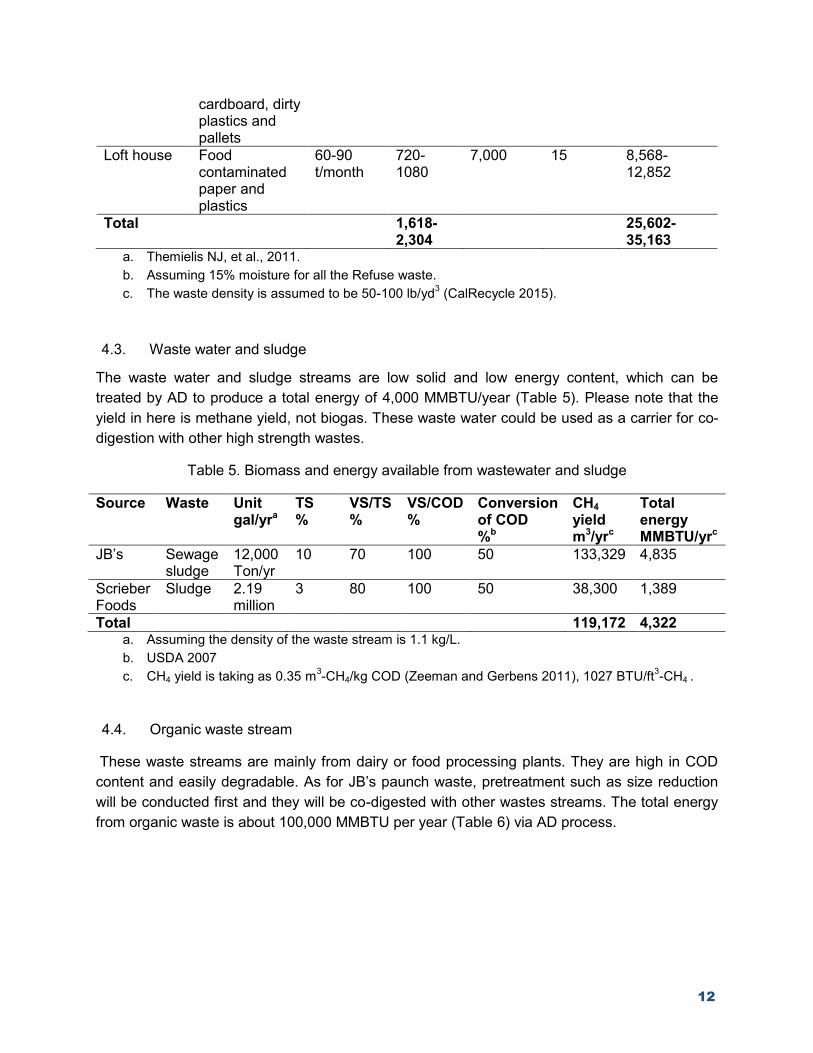
4.3. Waste water and sludge
The waste water and sludge streams are low solid and low energy content, which can be treated by AD to produce a total energy of 4,000 MMBTU/year (Table 5). Please note that the yield in here is methane yield, not biogas. These waste water could be used as a carrier for co-digestion with other high strength wastes.
Table 5. Biomass and energy available from wastewater and sludge
Source Waste Unit gal/yra
TS %
VS/TS %
VS/COD %
Conversion of COD %b
CH4 yield m3/yrc
Total energy MMBTU/yrc
JB’s Sewage sludge
12,000 Ton/yr
10 70 100 50 133,329 4,835
Scrieber Foods
Sludge 2.19million
3 80 100 50 38,300 1,389
Total 119,172 4,322 a. Assuming the density of the waste stream is 1.1 kg/L.b. USDA 2007c. CH4 yield is taking as 0.35 m3-CH4/kg COD (Zeeman and Gerbens 2011), 1027 BTU/ft3-CH4 .
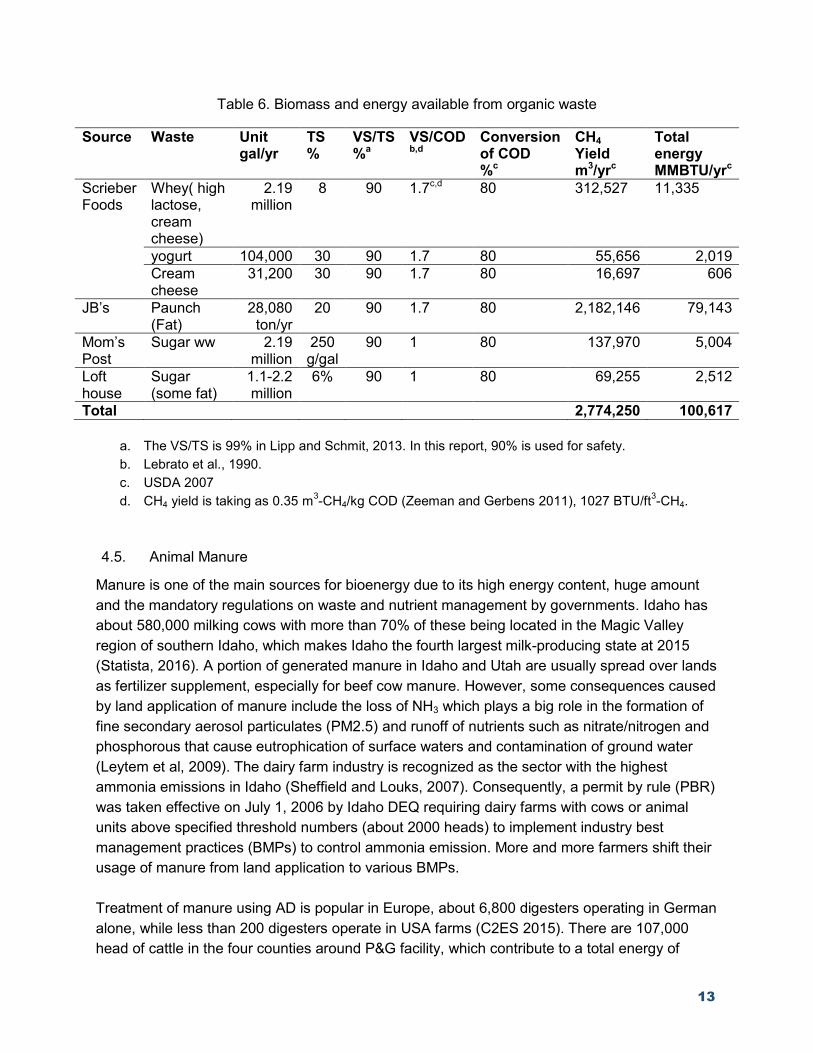
4.4. Organic waste stream
These waste streams are mainly from dairy or food processing plants. They are high in COD content and easily degradable. As for JB’s paunch waste, pretreatment such as size reduction will be conducted first and they will be co-digested with other wastes streams. The total energy from organic waste is about 100,000 MMBTU per year (Table 6) via AD process.
13
Table 6. Biomass and energy available from organic waste
Source Waste Unit gal/yr
TS %
VS/TS %a
VS/COD b,d
Conversion of COD %c
CH4 Yield m3/yrc
Total energy MMBTU/yrc
Scrieber Foods
Whey( high lactose, cream cheese)
2.19 million
8 90 1.7c,d 80 312,527 11,335
yogurt 104,000 30 90 1.7 80 55,656 2,019 Cream cheese
31,200 30 90 1.7 80 16,697 606
JB’s Paunch (Fat)
28,080 ton/yr
20 90 1.7 80 2,182,146 79,143
Mom’s Post
Sugar ww 2.19 million
250 g/gal
90 1 80 137,970 5,004
Loft house
Sugar (some fat)
1.1-2.2 million
6% 90 1 80 69,255 2,512
Total 2,774,250 100,617
a. The VS/TS is 99% in Lipp and Schmit, 2013. In this report, 90% is used for safety.b. Lebrato et al., 1990.c. USDA 2007d. CH4 yield is taking as 0.35 m3-CH4/kg COD (Zeeman and Gerbens 2011), 1027 BTU/ft3-CH4.
4.5. Animal Manure
Manure is one of the main sources for bioenergy due to its high energy content, huge amount and the mandatory regulations on waste and nutrient management by governments. Idaho has about 580,000 milking cows with more than 70% of these being located in the Magic Valley region of southern Idaho, which makes Idaho the fourth largest milk-producing state at 2015 (Statista, 2016). A portion of generated manure in Idaho and Utah are usually spread over lands as fertilizer supplement, especially for beef cow manure. However, some consequences caused by land application of manure include the loss of NH3 which plays a big role in the formation of fine secondary aerosol particulates (PM2.5) and runoff of nutrients such as nitrate/nitrogen and phosphorous that cause eutrophication of surface waters and contamination of ground water (Leytem et al, 2009). The dairy farm industry is recognized as the sector with the highest ammonia emissions in Idaho (Sheffield and Louks, 2007). Consequently, a permit by rule (PBR) was taken effective on July 1, 2006 by Idaho DEQ requiring dairy farms with cows or animal units above specified threshold numbers (about 2000 heads) to implement industry best management practices (BMPs) to control ammonia emission. More and more farmers shift their usage of manure from land application to various BMPs.
Treatment of manure using AD is popular in Europe, about 6,800 digesters operating in German alone, while less than 200 digesters operate in USA farms (C2ES 2015). There are 107,000 head of cattle in the four counties around P&G facility, which contribute to a total energy of
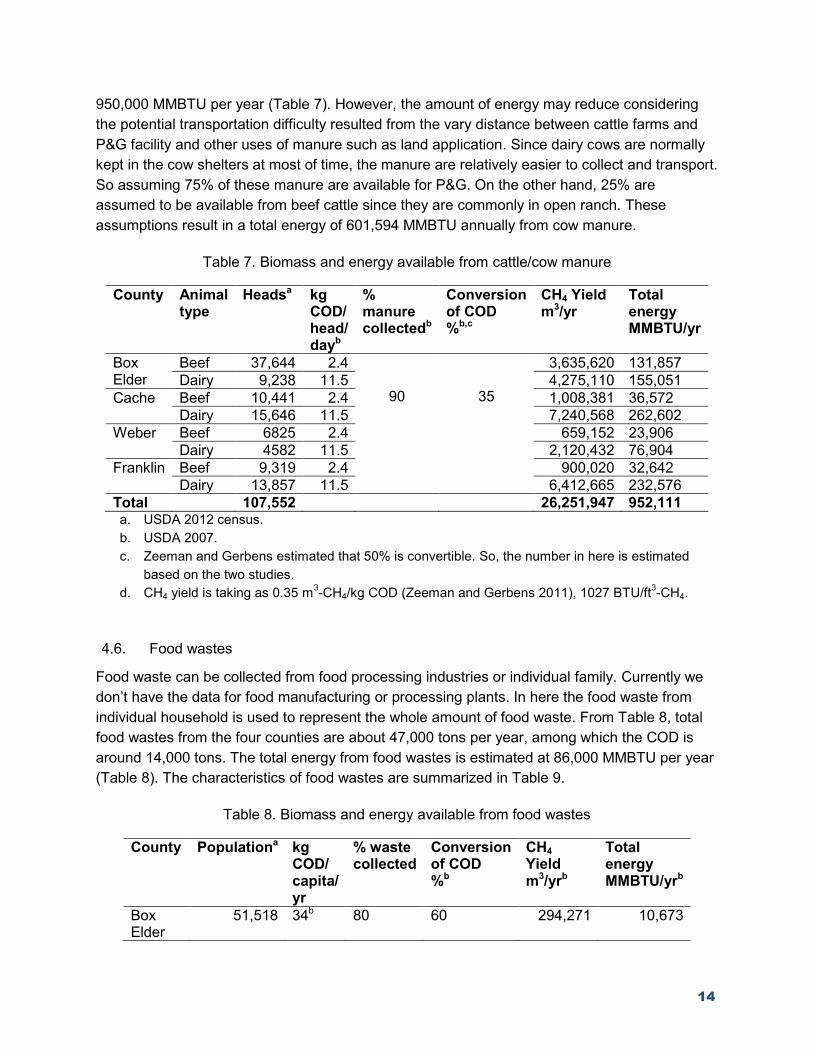
14
950,000 MMBTU per year (Table 7). However, the amount of energy may reduce considering the potential transportation difficulty resulted from the vary distance between cattle farms and P&G facility and other uses of manure such as land application. Since dairy cows are normally kept in the cow shelters at most of time, the manure are relatively easier to collect and transport. So assuming 75% of these manure are available for P&G. On the other hand, 25% are assumed to be available from beef cattle since they are commonly in open ranch. These assumptions result in a total energy of 601,594 MMBTU annually from cow manure.
Table 7. Biomass and energy available from cattle/cow manure
County Animal type
Headsa kg COD/ head/ dayb
% manure collectedb
Conversion of COD %b,c
CH4 Yield m3/yr
Total energy MMBTU/yr
Box Elder
Beef 37,644 2.4
90 35
3,635,620 131,857 Dairy 9,238 11.5 4,275,110 155,051
Cache Beef 10,441 2.4 1,008,381 36,572 Dairy 15,646 11.5 7,240,568 262,602
Weber Beef 6825 2.4 659,152 23,906 Dairy 4582 11.5 2,120,432 76,904
Franklin Beef 9,319 2.4 900,020 32,642 Dairy 13,857 11.5 6,412,665 232,576
Total 107,552 26,251,947 952,111 a. USDA 2012 census.b. USDA 2007.c. Zeeman and Gerbens estimated that 50% is convertible. So, the number in here is estimated
based on the two studies.d. CH4 yield is taking as 0.35 m3-CH4/kg COD (Zeeman and Gerbens 2011), 1027 BTU/ft3-CH4.
4.6. Food wastes
Food waste can be collected from food processing industries or individual family. Currently we don’t have the data for food manufacturing or processing plants. In here the food waste from individual household is used to represent the whole amount of food waste. From Table 8, total food wastes from the four counties are about 47,000 tons per year, among which the COD is around 14,000 tons. The total energy from food wastes is estimated at 86,000 MMBTU per year (Table 8). The characteristics of food wastes are summarized in Table 9.
Table 8. Biomass and energy available from food wastes
County Populationa kg COD/ capita/ yr
% waste collected
Conversion of COD %b
CH4 Yield m3/yrb
Total energy MMBTU/yrb
Box Elder
51,518 34b 80 60 294,271 10,673
15
Cache 118,343 675,975 24,516 Weber 240,475 1,373,593 49,818 Franklin 13,021 74,376 2,697 Total 423,357 2,418,215 87,704
a. US Census Bureau, 2014.b. Busby and Hyman (2012) estimated that 0.3kg food/capita/day was wasted, which is equal to
34kg COD/capita/yr, considering the TS, VS and COD contents.
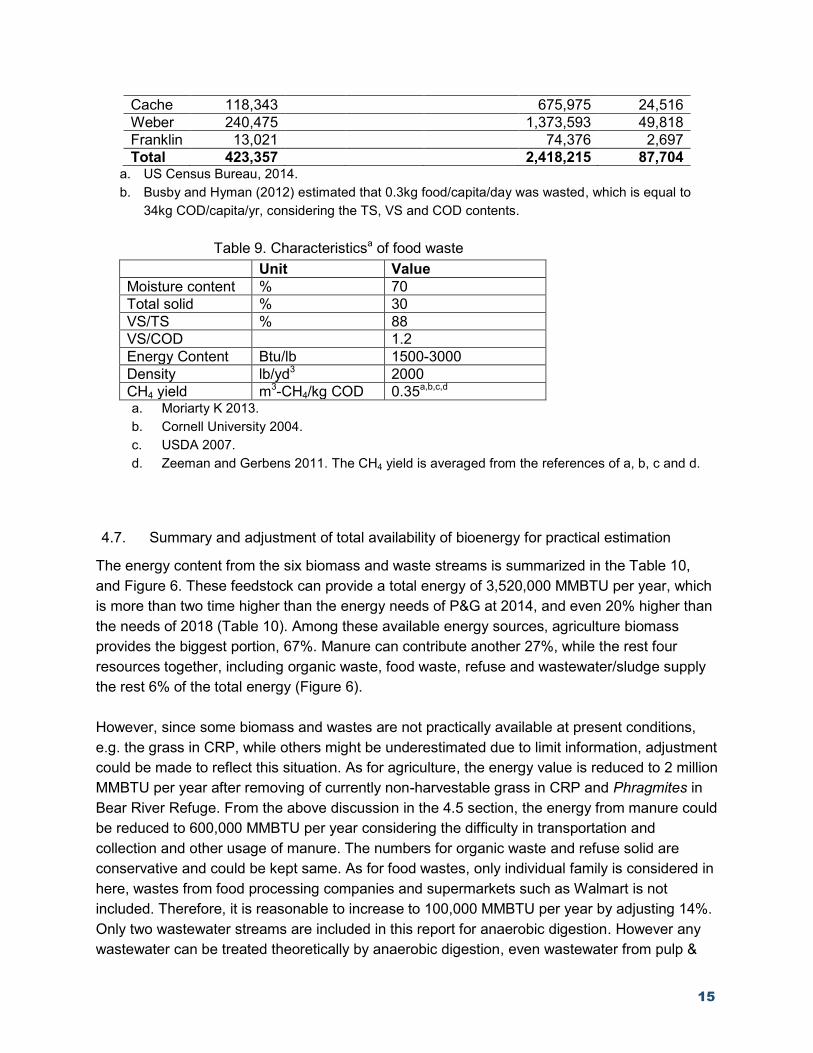
Table 9. Characteristicsa of food waste Unit Value
Moisture content % 70 Total solid % 30 VS/TS % 88 VS/COD 1.2 Energy Content Btu/lb 1500-3000 Density lb/yd3 2000 CH4 yield m3-CH4/kg COD 0.35a,b,c,d a. Moriarty K 2013.b. Cornell University 2004.c. USDA 2007.d. Zeeman and Gerbens 2011. The CH4 yield is averaged from the references of a, b, c and d.
4.7. Summary and adjustment of total availability of bioenergy for practical estimation
The energy content from the six biomass and waste streams is summarized in the Table 10, and Figure 6. These feedstock can provide a total energy of 3,520,000 MMBTU per year, which is more than two time higher than the energy needs of P&G at 2014, and even 20% higher than the needs of 2018 (Table 10). Among these available energy sources, agriculture biomass provides the biggest portion, 67%. Manure can contribute another 27%, while the rest four resources together, including organic waste, food waste, refuse and wastewater/sludge supply the rest 6% of the total energy (Figure 6).
However, since some biomass and wastes are not practically available at present conditions, e.g. the grass in CRP, while others might be underestimated due to limit information, adjustment could be made to reflect this situation. As for agriculture, the energy value is reduced to 2 million MMBTU per year after removing of currently non-harvestable grass in CRP and Phragmites in Bear River Refuge. From the above discussion in the 4.5 section, the energy from manure could be reduced to 600,000 MMBTU per year considering the difficulty in transportation and collection and other usage of manure. The numbers for organic waste and refuse solid are conservative and could be kept same. As for food wastes, only individual family is considered in here, wastes from food processing companies and supermarkets such as Walmart is not included. Therefore, it is reasonable to increase to 100,000 MMBTU per year by adjusting 14%. Only two wastewater streams are included in this report for anaerobic digestion. However any wastewater can be treated theoretically by anaerobic digestion, even wastewater from pulp &
16
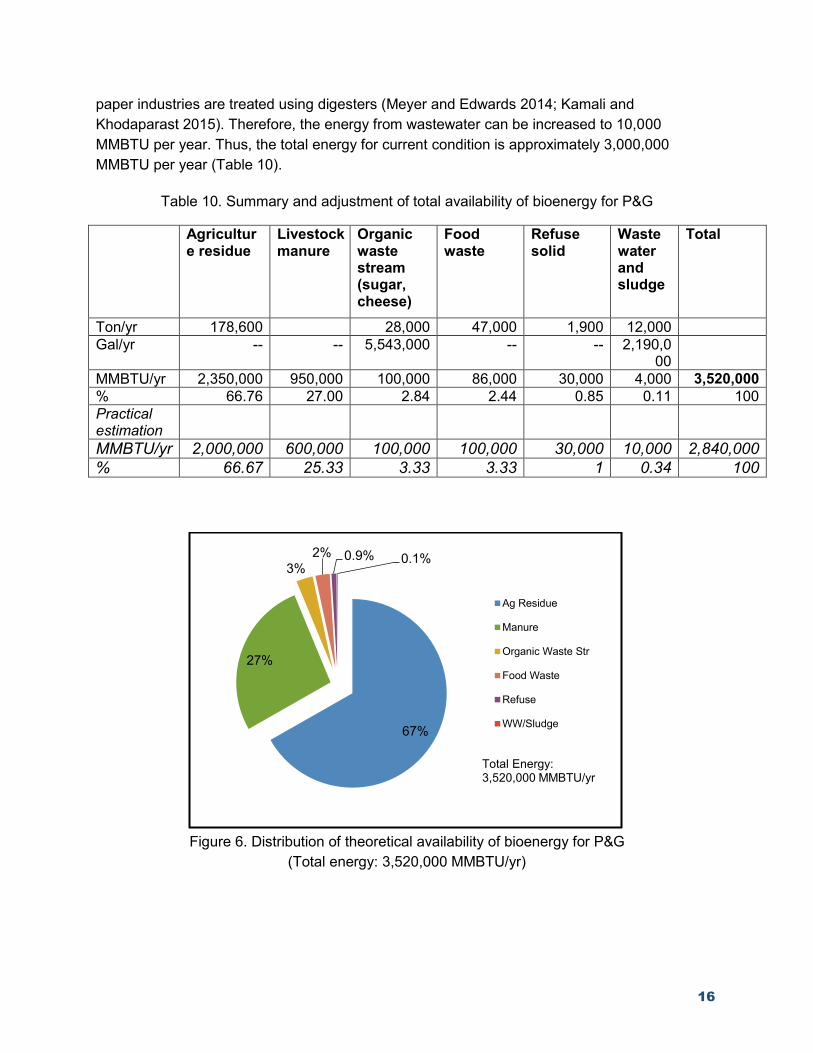
paper industries are treated using digesters (Meyer and Edwards 2014; Kamali and Khodaparast 2015). Therefore, the energy from wastewater can be increased to 10,000 MMBTU per year. Thus, the total energy for current condition is approximately 3,000,000 MMBTU per year (Table 10).
Table 10. Summary and adjustment of total availability of bioenergy for P&G
Agriculture residue
Livestock manure
Organic waste stream (sugar, cheese)
Food waste
Refuse solid
Waste water and sludge
Total
Ton/yr 178,600 28,000 47,000 1,900 12,000 Gal/yr -- -- 5,543,000 -- -- 2,190,0
00 MMBTU/yr 2,350,000 950,000 100,000 86,000 30,000 4,000 3,520,000 % 66.76 27.00 2.84 2.44 0.85 0.11 100 Practical estimation MMBTU/yr 2,000,000 600,000 100,000 100,000 30,000 10,000 2,840,000 % 66.67 25.33 3.33 3.33 1 0.34 100
Figure 6. Distribution of theoretical availability of bioenergy for P&G (Total energy: 3,520,000 MMBTU/yr)
67%
27%
3% 2% 0.9% 0.1%
Ag Residue
Manure
Organic Waste Str
Food Waste
Refuse
WW/Sludge
Total Energy: 3,520,000 MMBTU/yr
17
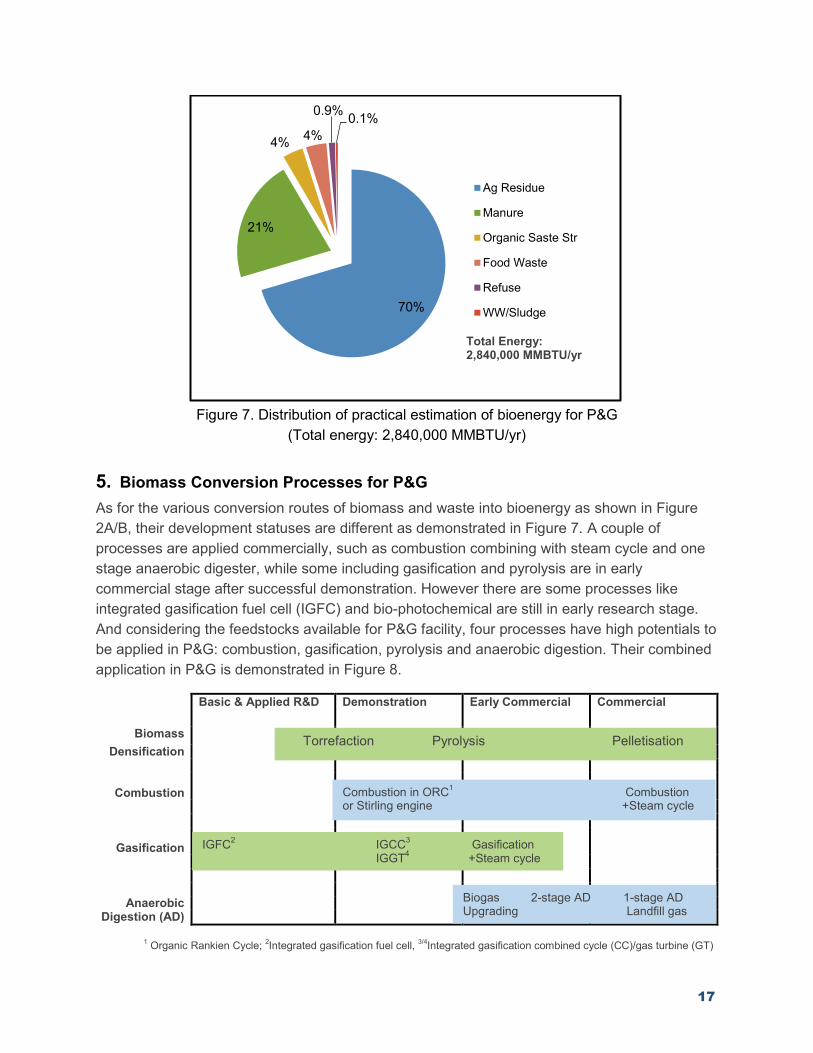
Figure 7. Distribution of practical estimation of bioenergy for P&G (Total energy: 2,840,000 MMBTU/yr)
5. Biomass Conversion Processes for P&GAs for the various conversion routes of biomass and waste into bioenergy as shown in Figure 2A/B, their development statuses are different as demonstrated in Figure 7. A couple of processes are applied commercially, such as combustion combining with steam cycle and one stage anaerobic digester, while some including gasification and pyrolysis are in early commercial stage after successful demonstration. However there are some processes like integrated gasification fuel cell (IGFC) and bio-photochemical are still in early research stage. And considering the feedstocks available for P&G facility, four processes have high potentials to be applied in P&G: combustion, gasification, pyrolysis and anaerobic digestion. Their combined application in P&G is demonstrated in Figure 8.
Basic & Applied R&D Demonstration Early Commercial Commercial
Biomass Densification
Combustion
Gasification
Anaerobic Digestion (AD)
1 Organic Rankien Cycle; 2Integrated gasification fuel cell, 3/4Integrated gasification combined cycle (CC)/gas turbine (GT)
70%
21%
4% 4%
0.9% 0.1%
Ag Residue
Manure
Organic Saste Str
Food Waste
Refuse
WW/Sludge
Torrefaction Pyrolysis Pelletisation
Combustion in ORC1 Combustion or Stirling engine +Steam cycle
IGFC2 IGCC3 Gasification IGGT4 +Steam cycle
Biogas 2-stage AD 1-stage AD Upgrading Landfill gas
Total Energy: 2,840,000 MMBTU/yr
18
Figure 8. Development status of some conversion processes (IEA Bioenergy 2009)
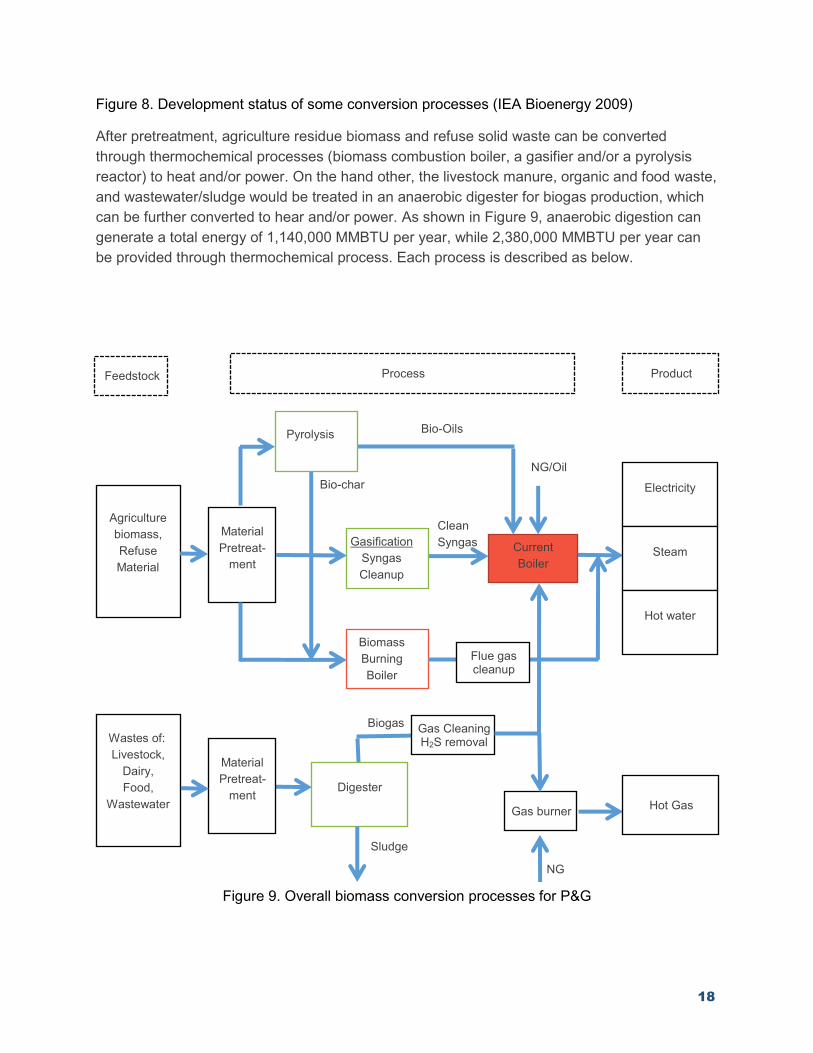
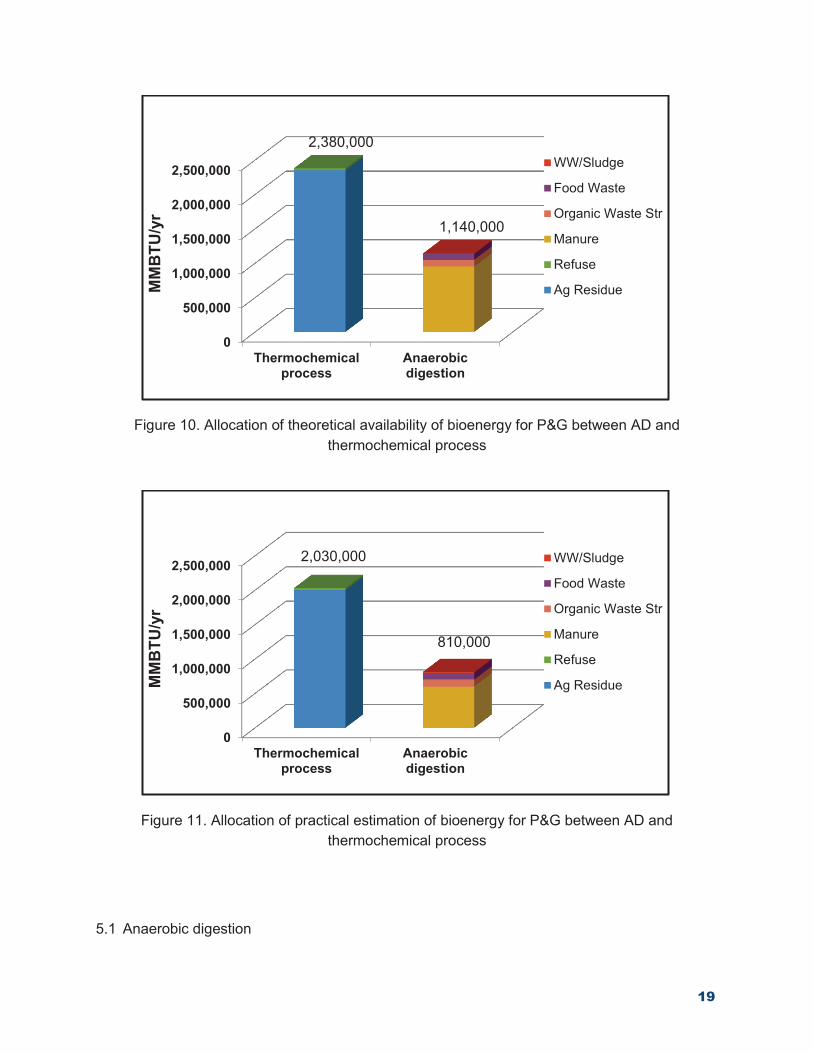
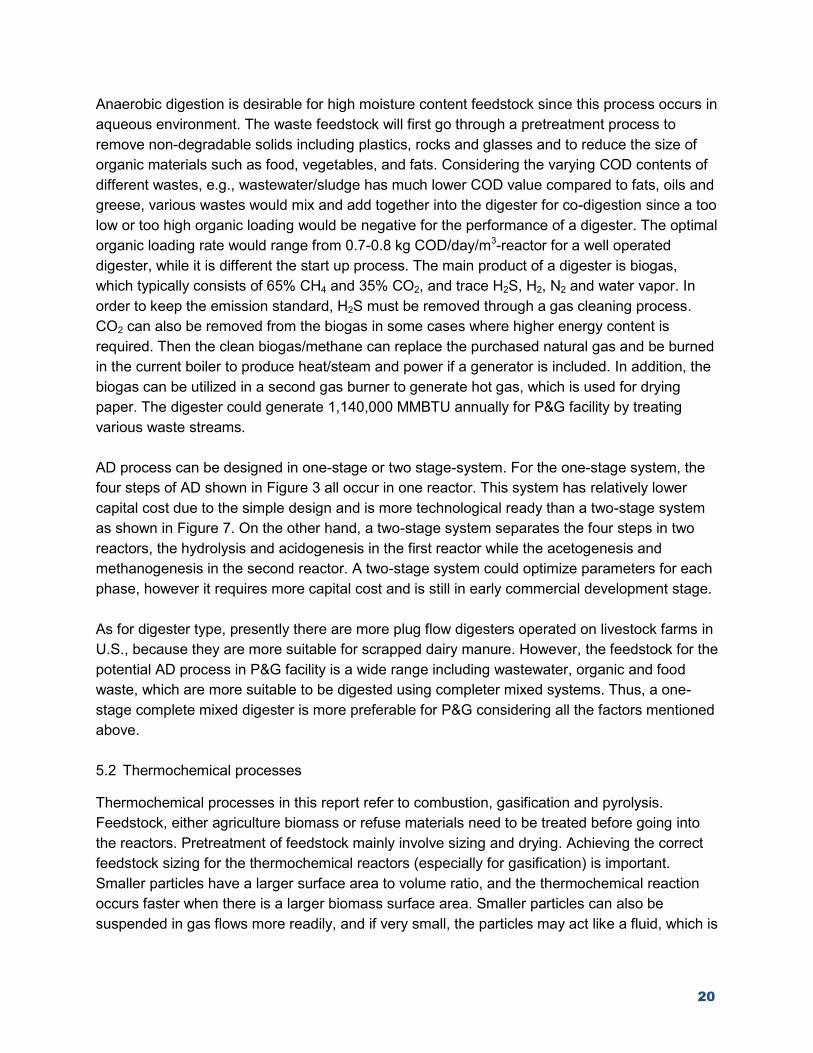
After pretreatment, agriculture residue biomass and refuse solid waste can be converted through thermochemical processes (biomass combustion boiler, a gasifier and/or a pyrolysis reactor) to heat and/or power. On the hand other, the livestock manure, organic and food waste, and wastewater/sludge would be treated in an anaerobic digester for biogas production, which can be further converted to hear and/or power. As shown in Figure 9, anaerobic digestion can generate a total energy of 1,140,000 MMBTU per year, while 2,380,000 MMBTU per year can be provided through thermochemical process. Each process is described as below.
Figure 9. Overall biomass conversion processes for P&G
Clean Syngas
Biogas
Sludge
NG/Oil
Bio-Oils
Bio-char
Material Pretreat-
ment Current Boiler
Electricity
Steam
Hot water
Biomass Burning Boiler
Gasification Syngas Cleanup
Pyrolysis
Agriculture biomass, Refuse Material
Digester
Material Pretreat-
ment
Wastes of: Livestock,
Dairy, Food,
Wastewater
Gas Cleaning H2S removal
Flue gas cleanup
Gas burner Hot Gas
Process Feedstock Product
NG
19
20
Anaerobic digestion is desirable for high moisture content feedstock since this process occurs in aqueous environment. The waste feedstock will first go through a pretreatment process to remove non-degradable solids including plastics, rocks and glasses and to reduce the size of organic materials such as food, vegetables, and fats. Considering the varying COD contents of different wastes, e.g., wastewater/sludge has much lower COD value compared to fats, oils and greese, various wastes would mix and add together into the digester for co-digestion since a too low or too high organic loading would be negative for the performance of a digester. The optimal organic loading rate would range from 0.7-0.8 kg COD/day/m3-reactor for a well operated digester, while it is different the start up process. The main product of a digester is biogas, which typically consists of 65% CH4 and 35% CO2, and trace H2S, H2, N2 and water vapor. In order to keep the emission standard, H2S must be removed through a gas cleaning process. CO2 can also be removed from the biogas in some cases where higher energy content is required. Then the clean biogas/methane can replace the purchased natural gas and be burned in the current boiler to produce heat/steam and power if a generator is included. In addition, the biogas can be utilized in a second gas burner to generate hot gas, which is used for drying paper. The digester could generate 1,140,000 MMBTU annually for P&G facility by treating various waste streams.
AD process can be designed in one-stage or two stage-system. For the one-stage system, the four steps of AD shown in Figure 3 all occur in one reactor. This system has relatively lower capital cost due to the simple design and is more technological ready than a two-stage system as shown in Figure 7. On the other hand, a two-stage system separates the four steps in two reactors, the hydrolysis and acidogenesis in the first reactor while the acetogenesis and methanogenesis in the second reactor. A two-stage system could optimize parameters for each phase, however it requires more capital cost and is still in early commercial development stage.
As for digester type, presently there are more plug flow digesters operated on livestock farms in U.S., because they are more suitable for scrapped dairy manure. However, the feedstock for the potential AD process in P&G facility is a wide range including wastewater, organic and food waste, which are more suitable to be digested using completer mixed systems. Thus, a one-stage complete mixed digester is more preferable for P&G considering all the factors mentioned above.
5.2 Thermochemical processes
Thermochemical processes in this report refer to combustion, gasification and pyrolysis. Feedstock, either agriculture biomass or refuse materials need to be treated before going into the reactors. Pretreatment of feedstock mainly involve sizing and drying. Achieving the correct feedstock sizing for the thermochemical reactors (especially for gasification) is important. Smaller particles have a larger surface area to volume ratio, and the thermochemical reaction occurs faster when there is a larger biomass surface area. Smaller particles can also be suspended in gas flows more readily, and if very small, the particles may act like a fluid, which is
21
especially important for a fluidized gasifier or combustion boiler. A screening process is often used to ensure any remaining larger particles and extraneous materials are removed.
For solid feedstock, thermochemical processes prefer a moisture content in the 10-20% range. The heat for drying can be provided externally, or extracted from the gasifier syngas or biogas from the digester. The reactor efficiency increases with drier biomass, but drying costs also increase quickly below 10% moisture.
After sizing and drying, feedstock could be divided into three steams. First, half of the total feedstock could be fed into a combustion boiler, either a conventional stoker boiler or a modern fluidized bed combustion (FBC) boiler that offers multiple benefits - compact boiler design, fuel flexibility, higher combustion efficiency and reduced emission of noxious pollutants such as SOx and NOx. The flue gas needs to be cleaned to meet national emission standards.
Second, fast pyrolysis could treat one quarter of the total feedstock for generation of liquid fuel, bio-oil. A wide range of reactor configuration have been investigated and operated, which can be grouped into three methods of achieving the fast pyrolysis, (1) ablative hydrolysis, (2) fluid bed or circulating fluid bed hydrolysis, and (3) vacuum hydrolysis. Among the various reactor configurations, fluid beds are the most popular one due to their easy of operation and ready scale up as depictured in Figure 2. The by-products of gas and char are utilized to provide processing heat. The characteristics of produced bio-oils vary considerably according to feedstock and pyrolysis process parameters. They are highly oxygenated with a HHV (dry basis) of 22.5 MJ/kg. The bio-oils can be directly burned in boiler for heat or used in engine or turbine for electricity.
Third, another quarter of the total feedstock could be gasified in a gasifier to generate syngas. The gasifier mainly have three types: (1) fixed bed (also called moving bed) gasifiers including down and updraft design; (2) fluidized bed reactors including bubbling fluidized beds (BFB) and circulated fluidized beds (CFB); (3) entrained-flow gasifiers. Of these reactor configurations, fluidized beds are most popular because of their multiple advantages: (1) smaller reactor volume due to high heat exchange and reaction rates resulted from intense mixing of the fluidized bed; (2) wider range of acceptable feedstock conditions; (3) more scalable and applicable for large installations; (4) more uniform and narrow temperature profile without hot spots; (5) higher conversion rates. With minor cleanup, the produced syngas can be directly burned in a boiler for steam/heat generation or a turbine for electricity. The choice of gasifying medium affects the composition and heating values of produced syngas. Air, steam and oxygen are the main gasifying agents used for gasification. Oxygen gasification has the highest heating value, while steam gasification generates a syngas having the highest H/C ratio.
It is worth noting that ThermoChem Recovery International LLC (TRI) has developed a proprietary biomass gasification process. TRI gasifiers employ a deep steam fluidized bed that is indirectly heated with pulsed combustion heat exchangers (PC heaters) that are fully submerged inside the fluid bed to convert any carbonaceous feedstock including liquid into high
22
quality syngas (TRI, 2015). Since 2003, a TRI gasifier has been in commercial-scale operation gasifying black liquor from pulp and paper mills in Canada. In addition, TRI has also proved their ability to successfully gasify a wide range of feedstocks (woody biomass, agricultural residues, Refuse Derived Fuel, lignite, subbituminous coal, etc.) into a consistent and reliable medium-calorific (300-350 BTU/ft3) syngas. Therefore, gasification could provide reliable energy for P&G facility.
6. SummaryP&G intends to replace as much as their current heat and power by renewable energy sources. For 2014, P&G’s total energy including electricity, natural gas and steam is approximately 1,540,000 MMBTU annually. The biomass and wastes around P&G facility can be grouped into six categories (Figure 6): (1) Agriculture residue and grass, (2) Refuse solid material, (3) Food waste, (4) Organic waste stream, (5) livestock manure, (6) wastewater and sludge. The six feedstock sources can provide a total energy of 3,520,000 MMBTU per year (Table 10), among which the agriculture residue is the biggest fraction, about 67%, followed by livestock manures 27%. Therefore, the available energy sources around P&G facility are enough to meet their energy needs.
These energy feedstocks would be treated by two processes: anaerobic digestion for biogas subsequently for heat and power and thermochemical process (combustion, pyrolysis and gasification) for heat and power (Figure 8 and 9). For AD, a one-stage complete mixing digester is preferable; and fluidized bed reactors are favorable for thermochemical process.
7. Reference:1. Appels L, Lauwers J. et al., 2011. Anaerobic digestion in global bioenergy production: potential and research
challenges. Renewable and Sustainable Energy Reviews, 15, 4295-4301.2. Bonner I., Heath B., Wright CT. 2015. Procter & Gamble bioenergy resources assessment. Idaho National
Laboratory.3. Bridgewater AV, Meier D, Radlein D 1999. An overview of fast pyrolysis of biomass. Organic Geochemistry
30, 1479-1493.4. Buzby J, and Hyman J. 2012 “Total and per capita value of food loss in the United States”, Food Policy, 37,
561-570.5. CA Dept of Resources Recycling and Recovery (CalRecycle).
http://www.calrecycle.ca.gov/lgcentral/library/dsg/irecycl.htm . Accessed at Sept 2015.6. Center for Climate and Energy Solutions (C2ES). http://www.c2es.org/technology/factsheet/anaerobic-
digesters . Accessed at September 2015.7. Ciferno JP, Marano JJ 2002. Benchmarking biomass gasification technologies for fuels, chemicals and
hydrogen production. DOE NETL.8. Cornell University
http://www.manuremanagement.cornell.edu/Pages/General_Docs/Fact_Sheets/Codigestion_factsheet.pdf9. EERE. http://www1.eere.energy.gov/biomass/feedstock_databases.html10. EPA AgStar, 2010. U.S. Anaerobic Digester Status Report.
http://www.epa.gov/outreach/agstar/documents/digester_status_report2010.pdf11. De Mes TZ, Stams AJM, Reith JH, Zeeman G. 2009. Methane production by anaerobic digestion of
wastewater and solid wastes.
23
http://www.sswm.info/sites/default/files/reference_attachments/MES%202003%20Chapter%204.%20Methane%20production%20by%20anaerobic%20digestion%20of%20wastewater%20and%20solid%20wastes.pdf
12. Firard M, Palacios JH, Belzile M, Godbout S, Pelletier F 2013. Biodegradation in animal manuremanagement, biodegradation – engineering and technology. DOI:10.5772/56151.
13. IEA 2010. International Energy Agency, World Primary Energy Supply.14. IEA Bioenergy 2009. Bioenergy: a sustainable and reliable energy sources; a review of status and
prospects. ExCo IEA Bioenergy.15. IPCC 2007. Intergovernmental Panel on Climate Change, Mitigation of Climate Change. Working Group III,
Chapter 4 of the 4th Assessment Report.16. Kamali M, Khodaparast Z 2015. Review on recent developments on pulp and paper mill wastewater
treatment. Ecotoxicology and Environmental Safety 114, 326-342.17. Lebrato J, Perez Rodriguez JL, Maqueda C, Morillo E. 1990. Cheese factory wateawter treatment by
anaerobic semicontinuoue digestion. Resources Conservation and Recycling, 3, 193-199.http://digital.csic.es/bitstream/10261/62125/1/Cheese%20factory%20wastewater%20treatment%20by%20anaerobic%20semicontinuous%20digestion.pdf
18. Leytem AB, Bjorneberg DL, Sheffield RE, de Haro Marti ME. 2009. Case study: on-farm evaluation of liquiddairy manure application methods to reduce ammonia losses.http://www.extension.uidaho.edu/nutrient/wastemanagement/pdf/ars1343.pdf
19. Lipp B, Schmit C. 2013. Anaerobic respirometery studies of fats, oils and grease.http://www.sdstate.edu/weerc/projects/completed/upload/Anaerobic-Respirometry-Studies-of-FOGs-report.pdf
20. Meyer T, Edwards EA 2014. Anaerobic digestion of pulp and paper mill wastewater and sludge. WaterResearch 65, 321-349.
21. Moriarty Kristi 2013. Feasibility study of anaerobic digestion of food waste in St. Bernard, LA. NREL/TP-7A30-57082.
22. Statista, http://www.statista.com/statistics/194962/top-10-us-states-by-number-of-milk-cows/ accessed atJan 2016.
23. Sheffield RE and Louks B. 2007. Dairy ammonia control practices.http://www.cals.uidaho.edu/edComm/pdf/CIS/CIS1138.pdf
24. Themeilis NJ, Castaldi MJ, Bhatti J, Arsova L. 2011. Energy and economic value of non-recycled plastics(NRP) and municipal solid wastes (MSW) that are currently landfilled in the fifty states. Columbia UniversityEarth Engineering Center.http://www.seas.columbia.edu/earth/wtert/sofos/ACC_Final_Report_August23_2011.pdf
25. TRI, 2015 TRI Biomass gasification technology. http://www.tri-inc.net/pdfs/TRI%20How%20It%20Works%20Overview.pdf
26. US Census Bureau 2014. http://quickfacts.census.gov/qfd/states/49/49003.html ;http://quickfacts.census.gov/qfd/states/16/16041.html
27. USDA 2007. An analysis of energy production costs from anaerobic digestion systems on U.S. livestockproduction facilities. USDA Natural Resources Conservation Service, Technical Note No.1, October 2007.http://www.agmrc.org/media/cms/manuredigesters_FC5C31F0F7B78.pdf
28. USDA 2012 Census: County Level Data:http://www.agcensus.usda.gov/Publications/2012/Full_Report/Volume_1,_Chapter_2_County_Level/Utah/st49_2_011_011.pdfhttp://www.agcensus.usda.gov/Publications/2012/Full_Report/Volume_1,_Chapter_2_County_Level/Idaho/st16_2_011_011.pdf
29. Zeeman G and Gerbens S. CH4 Emissions from Animal Manure. Good Practice Guidance and UncertaintyManagement in National Greenhouse Gas Inventories. http://www.ipcc-nggip.iges.or.jp/public/gp/bgp/4_3_CH4_Animal_Manure.pdfEPA. 2015. AgSTAR data and trends.http://www2.epa.gov/agstar/agstar-data-and-trends


