
The 31st Annual Federal Securities Institute
Private Equity, LBO & Venture Capital Panel
February 14th & 15th, 2013 Private Equity Market Overview Andrew J. Stull Houlihan Lokey
Private Equity Market Trends
Current Observations
Private equity transaction volume in 2012 was lower than what was expected
Remains a very favorable market for sellers
Debt capital markets “could not be stronger”
Transaction multiples are approaching or exceeding pre-crisis peak levels in the middle market
Private equity exit activity has increased for a third straight year
Despite increase in private equity exits the average holding period remains at an all time high - 5.4 years
Competition for deals among private equity firms remains very intense
Middle market has become very efficient
Firms have become highly specialized in terms of industry focus and transaction type
Firms are being more creative on transaction origination in order to gain an edge
Secondary buyouts has become more common and accepted
More sales to private equity buyers than corporates for the first time in 2012
Fundraising by private equity firms continues to be a difficult process
The 31st Annual Federal Securities
Institute Panel
1
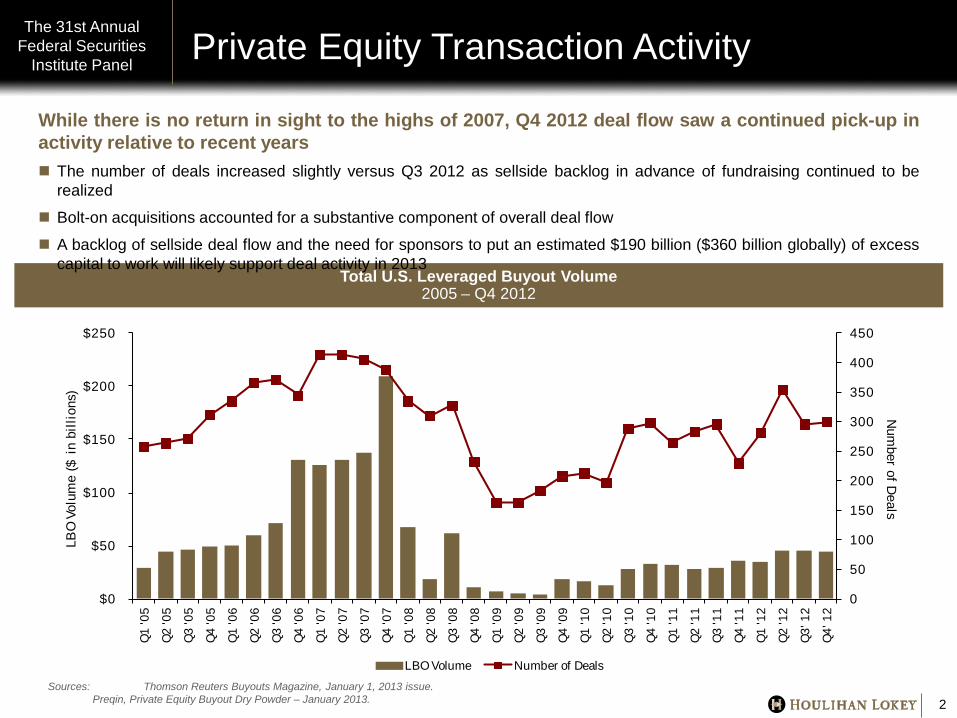
Private Equity Transaction Activity The 31st Annual
Federal Securities Institute Panel
2
Total U.S. Leveraged Buyout Volume 2005 – Q4 2012
While there is no return in sight to the highs of 2007, Q4 2012 deal flow saw a continued pick-up in activity relative to recent years The number of deals increased slightly versus Q3 2012 as sellside backlog in advance of fundraising continued to be
realized
Bolt-on acquisitions accounted for a substantive component of overall deal flow
A backlog of sellside deal flow and the need for sponsors to put an estimated $190 billion ($360 billion globally) of excess capital to work will likely support deal activity in 2013
0
50
100
150
200
250
300
350
400
450
$0
$50
$100
$150
$200
$250
Q1
'05
Q2
'05
Q3
'05
Q4
'05
Q1
'06
Q2
'06
Q3
'06
Q4
'06
Q1
'07
Q2
'07
Q3
'07
Q4
'07
Q1
'08
Q2
'08
Q3
'08
Q4
'08
Q1
'09
Q2
'09
Q3
'09
Q4
'09
Q1
'10
Q2
'10
Q3
'10
Q4
'10
Q1
'11
Q2
'11
Q3
'11
Q4
'11
Q1
'12
Q2
'12
Q3'
12
Q4'
12
Num
ber of Deals
LBO
Vol
ume
($ i
n bi
llion
s)
LBO Volume Number of DealsSources: Thomson Reuters Buyouts Magazine, January 1, 2013 issue. Preqin, Private Equity Buyout Dry Powder – January 2013.
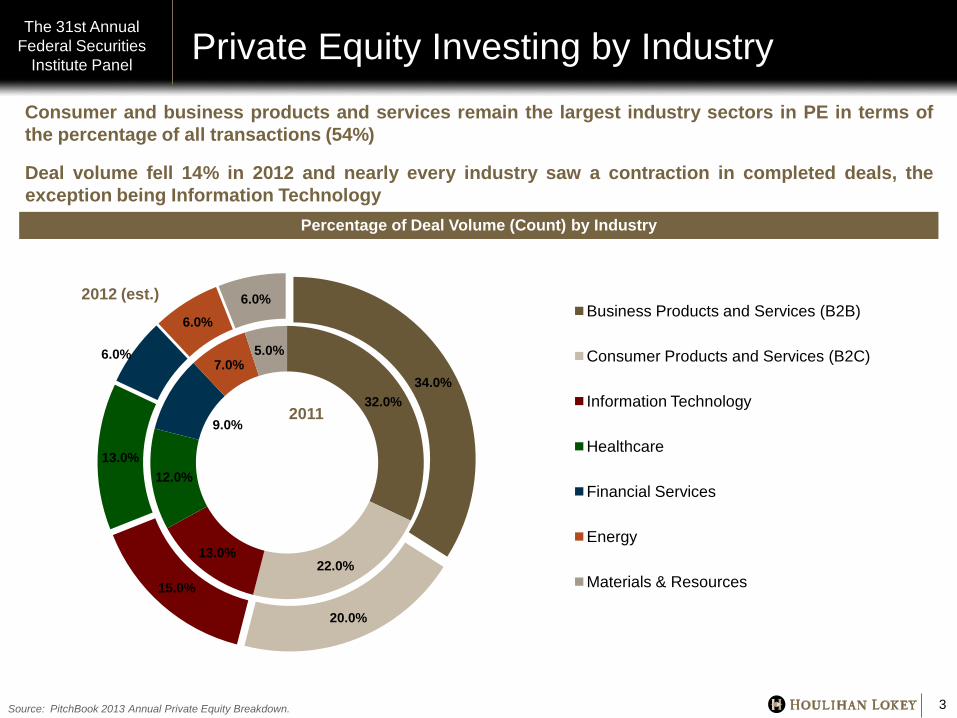
Private Equity Investing by Industry Consumer and business products and services remain the largest industry sectors in PE in terms of the percentage of all transactions (54%)
Deal volume fell 14% in 2012 and nearly every industry saw a contraction in completed deals, the exception being Information Technology
The 31st Annual Federal Securities
Institute Panel
3 Source: PitchBook 2013 Annual Private Equity Breakdown.
Percentage of Deal Volume (Count) by Industry
2012 (est.)
32.0%
22.0% 13.0%
12.0%
9.0%
7.0% 5.0%
34.0%
20.0%
15.0%
13.0%
6.0%
6.0% 6.0%
Business Products and Services (B2B)
Consumer Products and Services (B2C)
Information Technology
Healthcare
Financial Services
Energy
Materials & Resources
2011
Private Equity Divestitures The 31st Annual
Federal Securities Institute Panel
4
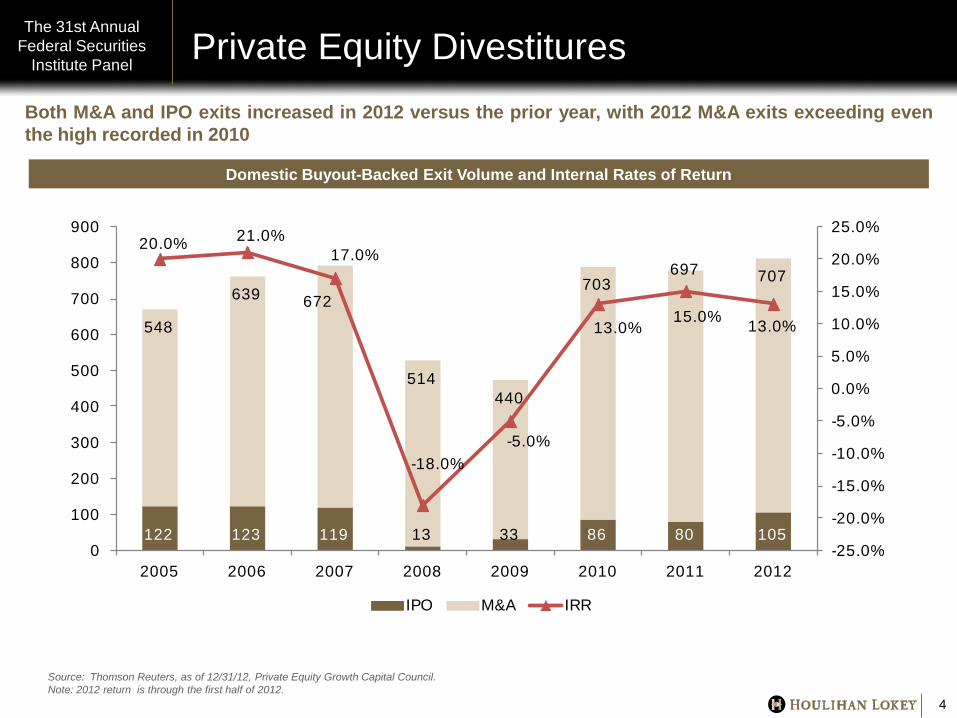
Both M&A and IPO exits increased in 2012 versus the prior year, with 2012 M&A exits exceeding even the high recorded in 2010
Domestic Buyout-Backed Exit Volume and Internal Rates of Return
Source: Thomson Reuters, as of 12/31/12, Private Equity Growth Capital Council. Note: 2012 return is through the first half of 2012.
122 123 119 13 33 86 80 105
548
639 672
514440
703697 707
20.0% 21.0%17.0%
-18.0%-5.0%
13.0%15.0% 13.0%
-25.0%
-20.0%
-15.0%
-10.0%
-5.0%
0.0%
5.0%
10.0%
15.0%
20.0%
25.0%
0
100
200
300
400
500
600
700
800
900
2005 2006 2007 2008 2009 2010 2011 2012
IPO M&A IRR
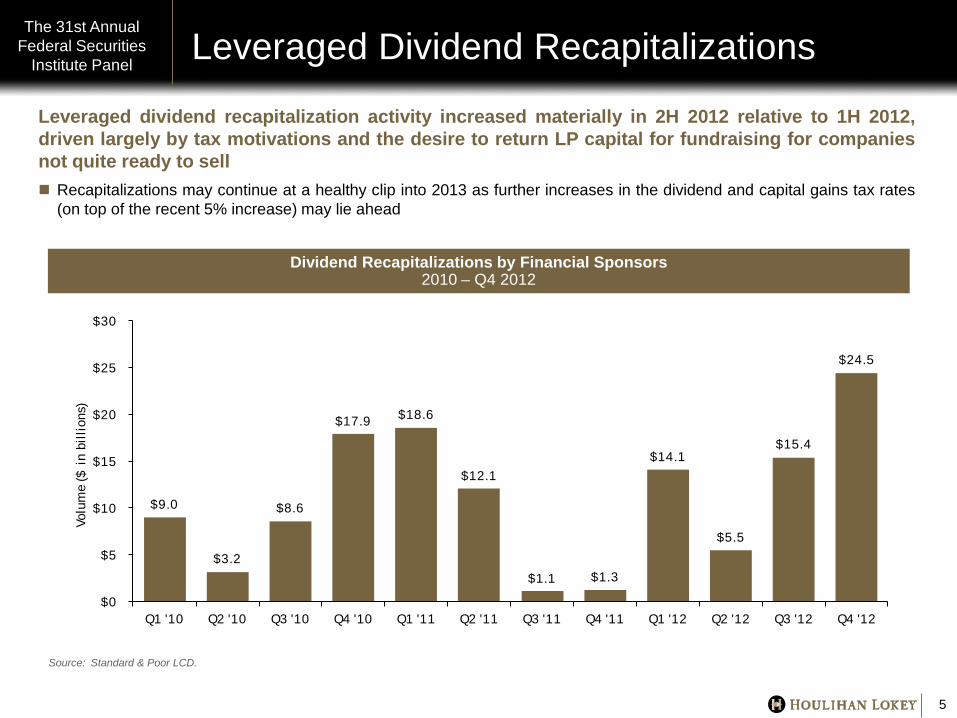
Leveraged Dividend Recapitalizations The 31st Annual
Federal Securities Institute Panel
5
Dividend Recapitalizations by Financial Sponsors 2010 – Q4 2012
Source: Standard & Poor LCD.
Leveraged dividend recapitalization activity increased materially in 2H 2012 relative to 1H 2012, driven largely by tax motivations and the desire to return LP capital for fundraising for companies not quite ready to sell Recapitalizations may continue at a healthy clip into 2013 as further increases in the dividend and capital gains tax rates
(on top of the recent 5% increase) may lie ahead
$9.0
$3.2
$8.6
$17.9 $18.6
$12.1
$1.1 $1.3
$14.1
$5.5
$15.4
$24.5
$0
$5
$10
$15
$20
$25
$30
Q1 '10 Q2 '10 Q3 '10 Q4 '10 Q1 '11 Q2 '11 Q3 '11 Q4 '11 Q1 '12 Q2 '12 Q3 '12 Q4 '12
Volu
me
($ i
n bi
llion
s)
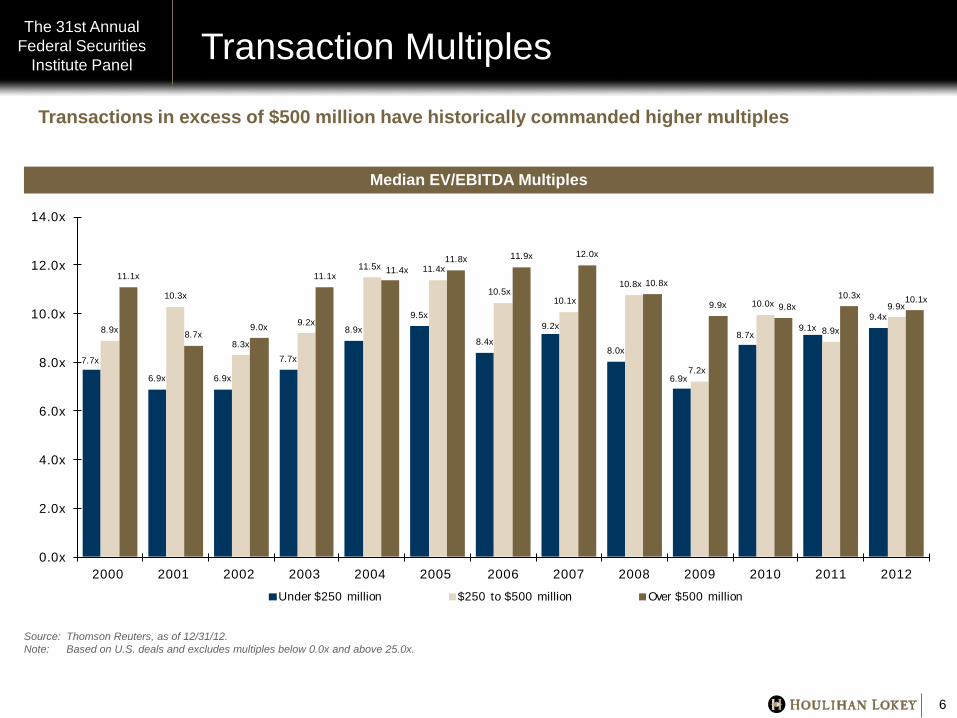
Transaction Multiples
6
Median EV/EBITDA Multiples
Source: Thomson Reuters, as of 12/31/12. Note: Based on U.S. deals and excludes multiples below 0.0x and above 25.0x.
Transactions in excess of $500 million have historically commanded higher multiples
7.7x
6.9x 6.9x
7.7x
8.9x9.5x
8.4x
9.2x
8.0x
6.9x
8.7x9.1x
9.4x8.9x
10.3x
8.3x
9.2x
11.5x 11.4x
10.5x10.1x
10.8x
7.2x
10.0x
8.9x
9.9x
11.1x
8.7x9.0x
11.1x11.4x
11.8x 11.9x 12.0x
10.8x
9.9x 9.8x10.3x 10.1x
0.0x
2.0x
4.0x
6.0x
8.0x
10.0x
12.0x
14.0x
2000 2001 2002 2003 2004 2005 2006 2007 2008 2009 2010 2011 2012
Under $250 million $250 to $500 million Over $500 million
The 31st Annual Federal Securities
Institute Panel
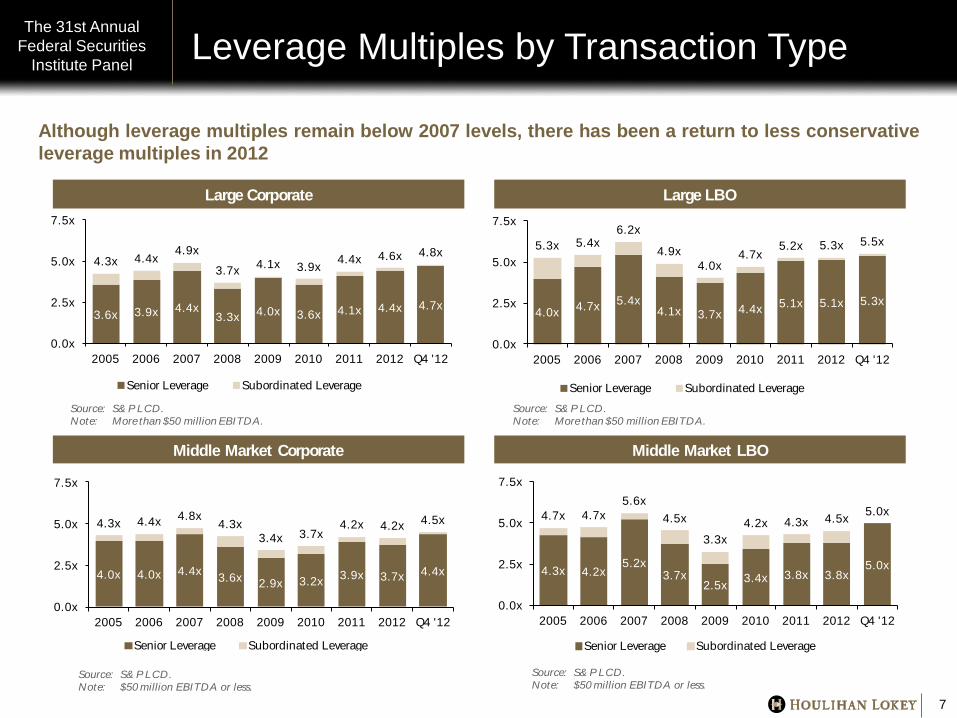
Leverage Multiples by Transaction Type The 31st Annual
Federal Securities Institute Panel
7
Although leverage multiples remain below 2007 levels, there has been a return to less conservative leverage multiples in 2012
Large Corporate Large LBO
Middle Market Corporate Middle Market LBO
3.6x 3.9x 4.4x3.3x 4.0x 3.6x 4.1x 4.4x 4.7x
4.3x 4.4x4.9x
3.7x 4.1x 3.9x 4.4x 4.6x 4.8x
0.0x
2.5x
5.0x
7.5x
2005 2006 2007 2008 2009 2010 2011 2012 Q4 '12
Senior Leverage Subordinated Leverage
Source: S& P LCD.Note: More than $50 million EBITDA.
4.0x 4.7x 5.4x4.1x 3.7x 4.4x 5.1x 5.1x 5.3x
5.3x 5.4x6.2x
4.9x4.0x
4.7x5.2x 5.3x 5.5x
0.0x
2.5x
5.0x
7.5x
2005 2006 2007 2008 2009 2010 2011 2012 Q4 '12
Senior Leverage Subordinated Leverage
Source: S& P LCD.Note: More than $50 million EBITDA.
4.0x 4.0x 4.4x 3.6x 2.9x 3.2x 3.9x 3.7x 4.4x
4.3x 4.4x 4.8x4.3x
3.4x 3.7x4.2x 4.2x 4.5x
0.0x
2.5x
5.0x
7.5x
2005 2006 2007 2008 2009 2010 2011 2012 Q4 '12
Senior Leverage Subordinated Leverage
Source: S& P LCD.Note: $50 million EBITDA or less.
4.3x 4.2x5.2x
3.7x2.5x 3.4x 3.8x 3.8x
5.0x
4.7x 4.7x5.6x
4.5x
3.3x4.2x 4.3x 4.5x 5.0x
0.0x
2.5x
5.0x
7.5x
2005 2006 2007 2008 2009 2010 2011 2012 Q4 '12
Senior Leverage Subordinated Leverage
Source: S& P LCD.Note: $50 million EBITDA or less.
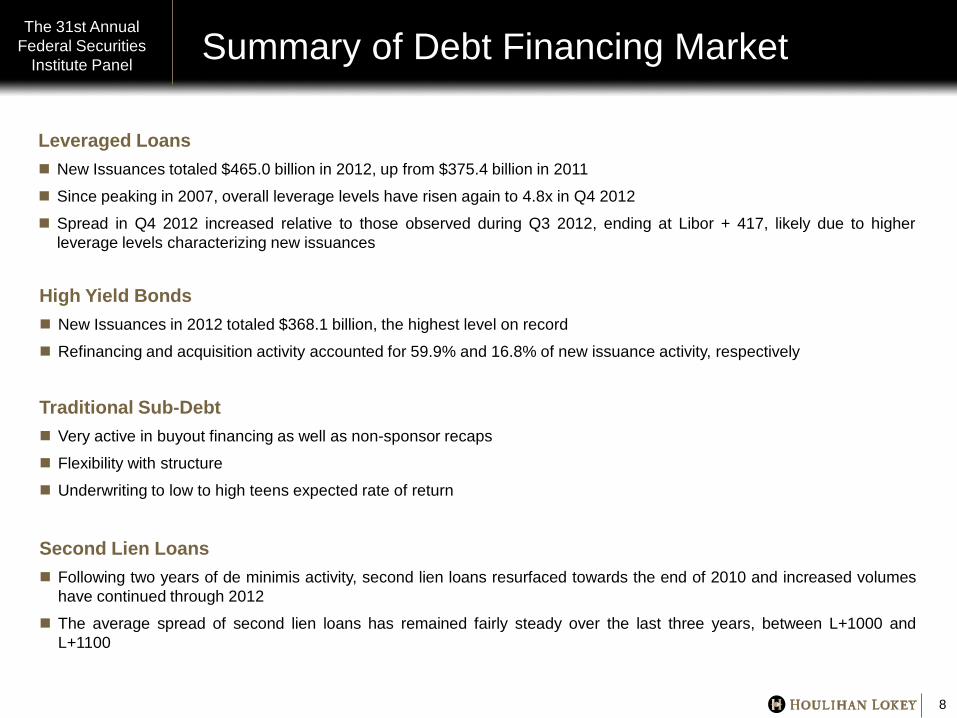
Summary of Debt Financing Market The 31st Annual
Federal Securities Institute Panel
8
Leveraged Loans New Issuances totaled $465.0 billion in 2012, up from $375.4 billion in 2011
Since peaking in 2007, overall leverage levels have risen again to 4.8x in Q4 2012
Spread in Q4 2012 increased relative to those observed during Q3 2012, ending at Libor + 417, likely due to higher leverage levels characterizing new issuances
High Yield Bonds New Issuances in 2012 totaled $368.1 billion, the highest level on record
Refinancing and acquisition activity accounted for 59.9% and 16.8% of new issuance activity, respectively
Second Lien Loans Following two years of de minimis activity, second lien loans resurfaced towards the end of 2010 and increased volumes
have continued through 2012
The average spread of second lien loans has remained fairly steady over the last three years, between L+1000 and L+1100
Traditional Sub-Debt Very active in buyout financing as well as non-sponsor recaps
Flexibility with structure
Underwriting to low to high teens expected rate of return
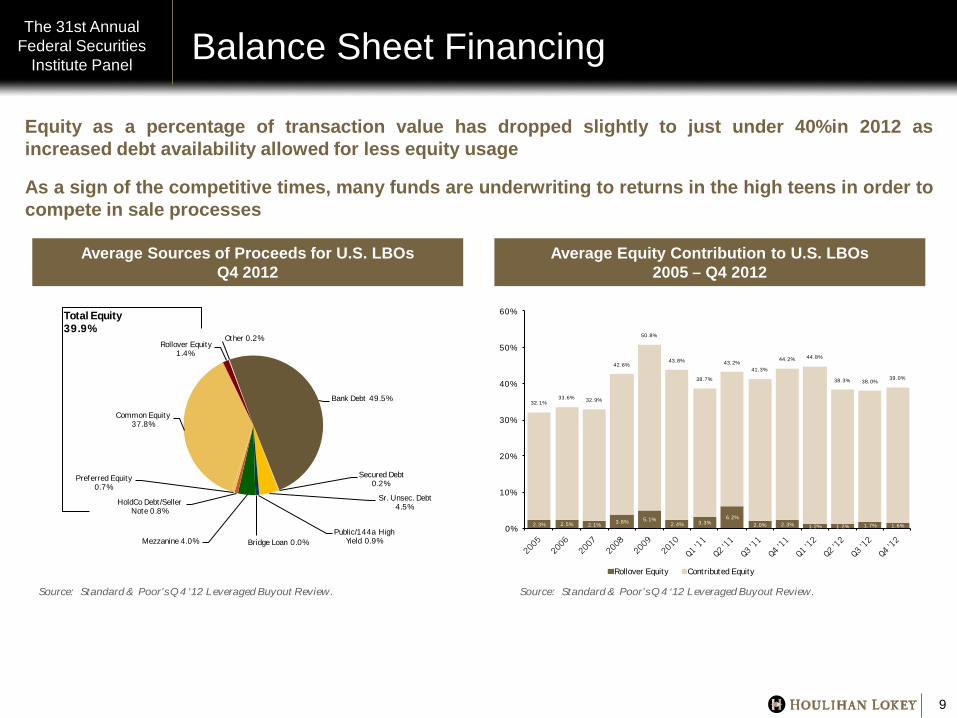
Balance Sheet Financing The 31st Annual
Federal Securities Institute Panel
9
Equity as a percentage of transaction value has dropped slightly to just under 40%in 2012 as increased debt availability allowed for less equity usage
As a sign of the competitive times, many funds are underwriting to returns in the high teens in order to compete in sale processes
Average Sources of Proceeds for U.S. LBOs Q4 2012
Average Equity Contribution to U.S. LBOs 2005 – Q4 2012
Bank Debt 49.5%
Secured Debt 0.2%
Sr. Unsec. Debt 4.5%
Public/144a High Yield 0.9%Bridge Loan 0.0%Mezzanine 4.0%
HoldCo Debt/Seller Note 0.8%
Preferred Equity 0.7%
Common Equity 37.8%
Rollover Equity 1.4%
Other 0.2%
Total Equity39.9%
Source: Standard & Poor’s Q4 ‘12 Leveraged Buyout Review.
2.3% 2.5% 2.1% 3.8% 5.1%2.4% 3.3%
6.2%2.0% 2.3% 1.2% 1.2% 1.7% 1.6%
32.1%33.6% 32.9%
42.6%
50.8%
43.8%
38.7%
43.2%41.3%
44.2% 44.8%
38.3% 38.0%39.0%
0%
10%
20%
30%
40%
50%
60%
Rollover Equity Contributed Equity
Source: Standard & Poor’s Q4 ‘12 Leveraged Buyout Review.
Southeast PE Deal Activity The 31st Annual
Federal Securities Institute Panel
10
Number of Deals Volume ($ billions)
Average Deal Size ($ millions)
Median EV/EBITDA Multiple
Median 1-Day Stock Price Premium
2012 2011 2012 2011 2012 2011 2012 2011 2012 2011
Buy-Side(1) 119 82 $15.0 $18.4 $126 $225 10.8x 10.7x 22.6% 29.9%
Sell-Side(1) 113 91 $44.6 $54.9 $394 $603 9.1x 11.4x 32.8% 34.0%
PE-to-PE(1) 35 33 $7.9 $10.4 $227 $316 9.9x 10.9x 28.0% 29.6%
Recent Key Southeast Deals
(1) Limited to transactions with implied Enterprise Value greater than $25 million.
Source: Capital IQ (includes announced transactions where a private investment firm is a buyer and/or seller).
Announce Date Deal Value ($M) Target Company Buyer Name Seller
1/9/2013 NA Express Oil, LLC Carousel Capital Partners Thompson Street Capital Partners
12/31/2012 $380.0 Viking Range Corporation M iddleby M arshall Stephens Capital Partners
12/6/2012 $337.2 Valent Aerostructures, LLC LM I Aerospace Inc. Tech Investments
10/8/2012 $158.0 Air Serv Corporation ABM Industries Incorporated Symmetric Capital, Petra
6/25/2012 $113.0 J. Alexander's Corp. American Blue Ribbon Holdings Andreeff Equity Advisors
5/22/2012 $295.7 Benihana Inc. Angelo, Gordon & Co. Andreeff Equity Advisors
4/11/2012 $257.0 Guilford M ills, Inc. Lear Corp. Cerberus Capital M anagement
3/26/2012 $74.5 Comverge, Inc. Bayside Capital Ardsley Partners
2/3/2012 $80.0 Aquilex Holdings LLC Centerbridge Partners Ontario Teachers Pension Fund
Venture Capital Overview The 31st Annual
Federal Securities Institute Panel
11
Source: The Wall Street Journal
Investment in U.S. venture backed companies was $6.9 billion across 820 deals in 3Q 2012, down from $10.1 billion and 906 deals in the prior year period.
High profile IPOs in 2012 that disappointed (i.e. Groupon, Facebook, Zynga) caused a tail off in venture investing in 2H 2012
Areas that continue to attract venture investing include: mobile, infrastructure, enterprise software and niche social media
Venture investing model has changed from a shorter investment horizon, IPO-driven exit to a longer term hold period and an M&A driven exit
Distressed M&A Observations The 31st Annual
Federal Securities Institute Panel
12
Source: Schulte Roth & Zabel LLP Distressed Investing M&A report, Thomson Reuters.
Payment default rates on leveraged loans reached a post-2007 low of 2.2% in Q4 2012
2007 default rate was 0.6%, the previous low
2009 default rate was 10.7%, a 20-year high
Globally, the ongoing eurozone crisis and macroeconomic concerns in emerging markets are likely to create a number of distressed opportunities in the coming year
Eurozone banks remain undercapitalized
Less accommodative capital markets
The Energy sector is expected to be active for distressed mergers & acquisitions, partly due to low U.S. natural gas prices and regulatory shifts negatively affecting several sectors such as:
Coal Producers
Alternative Energy
Utilities
Other sectors seeing levels of distress:
“Old” Media Companies
Conventional Retail
Transportation
Outlook for 2013 – Key Questions
Will PE deal volume and valuation increase in 2013?
Will the debt market stay highly accommodative?
Will the Dell take private transaction kick off a new buyout wave?
What are some of the tactics and strategies private equity firms will deploy on the buyside in the face of highly competitive processes?
What trends do we expect for transaction terms in middle market deals?
What is the outlook for distressed deals?
Any interesting trends in private equity on the sellside?
The 31st Annual Federal Securities
Institute Panel
13


