PREQIN SPECIAL REPORT:ASIAN PRIVATE EQUITY & VENTURE CAPITAL
SEPTEMBER 2017
alternative assets. intelligent data.

© Preqin Ltd. 2017 / www.preqin.com2
PREQIN SPECIAL REPORT: ASIAN PRIVATE EQUITY & VENTURE CAPITAL
CONTENTS
All rights reserved. The entire contents of Preqin Special Report: Asian Private Equity & Venture Capital, September 2017 are the Copyright of Preqin Ltd. No part of this publication or any information contained in it may be copied, transmitted by any electronic means, or stored in any electronic or other data storage medium, or printed or published in any document, report or publication, without the express prior written approval of Preqin Ltd. The information presented in Preqin Special Report: Asian Private Equity & Venture Capital, September 2017 is for information purposes only and does not constitute and should not be construed as a solicitation or other offer, or recommendation to acquire or dispose of any investment or to engage in any other transaction, or as advice of any nature whatsoever. If the reader seeks advice rather than information then he should seek an independent financial advisor and hereby agrees that he will not hold Preqin Ltd. responsible in law or equity for any decisions of whatever nature the reader makes or refrains from making following its use of Preqin Special Report: Asian Private Equity & Venture Capital, September 2017. While reasonable efforts have been made to obtain information from sources that are believed to be accurate, and to confirm the accuracy of such information wherever possible, Preqin Ltd. does not make any representation or warranty that the information or opinions contained in Preqin Special Report: Asian Private Equity & Venture Capital, September 2017 are accurate, reliable, up-to-date or complete. Although every reasonable effort has been made to ensure the accuracy of this publication Preqin Ltd. does not accept any responsibility for any errors or omissions within Preqin Special Report: Asian Private Equity & Venture Capital, September 2017 or for any expense or other loss alleged to have arisen in any way with a reader’s use of this publication.
p3 CEO’s Foreword
p4 Key Stats
p5 Optimism and Opportunities Seen in Asia-Pacific - Alexandre Schmitz, Capstone Partners
p7 Asian Private Equity & Venture Capital Universe
p10 Assets under Management
p12 Performance
p13 Fund Manager and Investor Outlook
p15 Buyout
p16 Growth
p17 Fund of Funds
p18 Venture Capital
p19 Greater China
p20 Northeast Asia
p21 ASEAN
p22 South Asia
PRIVATE EQUITY ONLINE
Private Equity Online is Preqin’s flagship online private equity information resource and encompasses all of Preqin’s private equity and venture capital databases, with unrivalled data and intelligence on all aspects of the asset class, including fund terms and conditions, fundraising, fund managers, institutional investors, fund performance, deals and exits and more.
Constantly updated by our teams of dedicated researchers strategically located in industry centres around the globe, Private Equity Online represents the most comprehensive source of industry intelligence available today.
www.preqin.com/privateequity

alternative assets. intelligent data.
3
DOWNLOAD DATA PACK: www.preqin.com/PEASIA17
Where does Asian private equity & venture capital sit within the global industry, and what are its prospects?
Looked at on most metrics, Asia accounts for approximately 15% of the global private equity & venture capital industry. Aggregate capital raised for Asia-Pacific-focused private capital funds over the period 2007-2016 accounted for 14% of the global total, although its share has fluctuated over this period (see page 5). Asia rebounded more quickly than North America and Europe after the Global Financial Crisis, reaching 23% of global capital raised in 2011, but more recently North America and Europe have regained their pre-2008 levels, while Asia has decreased from its 2014 peak in absolute terms.
Dig beneath the surface, and there are some major evolving trends. The returns that investors have earned on Asia-focused private equity & venture capital funds have been very similar to those from North America- and Europe-focused funds – neither significantly better, nor significantly worse (see page 12). Until now, the big difference has been cash flows: starting in 2011 in North America and in 2013 in Europe, investors began to see significant positive net cash flows from their private equity & venture capital investments. The criticism levelled at Asia-focused funds has always been: “Yes, the IRRs are OK, but when do we get our money back?” Starting in 2016, that question now appears to be answered: Asia-focused funds are now delivering strong positive net cash flows back to their LPs. If this continues, then the implications for the industry in Asia will be profound: the one significant factor holding some LPs back from committing to Asia-focused funds will have been removed, and significant growth and success are likely to lie ahead.
The potential for growth in Asia can already be seen in the tremendous expansion in venture capital deal activity over the period 2013-2017 (see page 18). Greater China now rivals the US as a hub of venture capital activity and deal flow has never been stronger. Nor is the venture capital growth story limited to Greater China: Northeast Asia, ASEAN and South Asia are all seeing rapid growth and development in their venture capital industries (see pages 19-22).
The bottom line is that the outlook for growth in Asian private equity & venture capital has rarely looked stronger: continued economic growth, favourable demographics, a burgeoning middle class and a maturing industry delivering positive net cash flows to its investors all point to major long-term growth.
Preqin is therefore delighted to present our 2017 report on Asian Private Equity & Venture Capital; we hope you will find it to be a useful pointer to the growing opportunities for investors and fund managers alike. The report forms a small part of Preqin’s expanding commitment to the region: starting with our regional hub in Singapore in 2010, Hong Kong and Manila were added in 2016, and our new China research centre opens in Guangzhou in October 2017. Our growing research, sales and customer service teams are committed to enhancing the quality of data and level of service that we offer our customers in the region – and indeed to our global customers who also rely on the best data in Asia.
We thank our customers for your support, and will continue to develop the service to meet your requirements.
Happy investing,
Mark O’Hare
CEO’s FOREWORD- Mark O’Hare
© Preqin Ltd. 2017 / www.preqin.com4
PREQIN SPECIAL REPORT: ASIAN PRIVATE EQUITY & VENTURE CAPITAL
KEY STATS
China
India
898
232
83
328
Japan
217 206
Hong Kong
200
87
South Korea
150100
Malaysia
5619
Singapore
193
64
KEY FACTSASIA-BASED PRIVATE EQUITY & VENTURE
CAPITAL FUNDRAISING IN 2017 YTD BY FUND MANAGER LOCATION (AS AT AUGUST 2017)
LOCATION OF ASIA-BASED PRIVATE EQUITY & VENTURE CAPITAL FUND MANAGERS AND INSTITUTIONAL INVESTORS
$562bnAmount of capital raised by Asia-focused private equity & venture capital vehicles since 2010.
$484bnSize of the Asian private equity & venture capital industry as at December 2016.
$521bnAggregate value of buyout and venture capital deals completed in Asia since 2010.
GreaterChina
NortheastAsia
ASEAN South Asia
51
119
1616.2
3.0 1.4 1.8
No. of Funds Closed Aggregate Capital Raised ($bn)
Fund ManagersInvestors
Other
72
172
alternative assets. intelligent data.
5
DOWNLOAD DATA PACK: www.preqin.com/PEASIA17
OPTIMISM AND OPPORTUNITIES SEEN IN ASIA-PACIFIC
- Alexandre Schmitz, Capstone Partners
CURRENT STATE OF THE PRIVATE MARKET INDUSTRY IN ASIA-PACIFICAs illustrated by Fig. 1, funds focused on the Asia-Pacific region represent 14% of the $5.9tn raised over the last decade. Across this time period, the majority of the Asia-Pacific-focused funds are fairly evenly split between buyout, growth, venture capital and real estate strategies.
Following the GFC, the amount of capital raised for closed-end funds focused on the Asia-Pacific region rebounded more quickly than for funds focused on the West. At the end of 2011, 23% of the money raised globally was dedicated to investment in the region and, as seen in Fig. 2, it was the second largest destination for deploying money, after North America and before Europe. Over the last two years, North America and Europe have recovered to their pre-2008 levels while the Asia-Pacific region has decreased from its 2014 peak in absolute terms. The most recent figures show that the amount raised during the last 12 months by funds focused on Asia-Pacific ($70bn at the end of June 2017) was 24% below the peak at the end of 2014 ($93bn), and is now less than 10% of the amount raised globally.
The two main drivers of this negative trend are the decreasing amount of capital raised by Japan-based managers and the limited number of international managers raising money to be deployed in the Asia-Pacific region since the end of 2014. Over the last few months, more than 10 Japanese buyout funds have been closed in a row. Furthermore, the recent close of KKR Asia III at $9.3bn and the anticipated raises of several other global private equity houses imply a potential reversal of this decline.
ASIA-PACIFIC FUND PERFORMANCE COMPARED TO OTHER REGIONSHistorically, funds dedicated to the Asia-Pacific region have performed
well compared to their Western peers. This is particularly the case for venture capital funds in China and buyout funds in Australia which generated the best performance at a global level in their respective segments. For the region as a whole, the return premium to invest
in private rather than listed markets has been higher in Asia-Pacific than in North America or Europe.
Nevertheless, international investors remain cautious with their allocations for investment outside the West. The two
0
50
100
150
200
250
300
350
400
450
500
Q4
Q1
Q2
Q3
Q4
Q1
Q2
Q3
Q4
Q1
Q2
Q3
Q4
Q1
Q2
Q3
Q4
Q1
Q2
Q3
Q4
Q1
Q2
Q3
Q4
Q1
Q2
Q3
Q4
Q1
Q2
Q3
Q4
Q1
Q2
2008 2009 2010 2011 2012 2013 2014 2015 2016 2017
North America Europe Asia-Pacific Rest of World
Source: Preqin, Capstone Analysis
Aggr
egat
e Ca
pita
l Rai
sed
($bn
)
Fig. 2: Aggregate Capital Raised by Closed-End Private Capital Funds, 2008 - 2017 (Rolling Total for Previous 12 Months)
Fig. 1: Aggregate Capital Raised Globally by Closed-End Private Capital Funds, 2007 - 2016
Source: Preqin, Capstone Analysis
100%
0%
20%
40%
60%
80%
North America56.3%
Europe24.9%
Asia-Pacific14.3%
Latin America1.7%
ROW2.8%
13.0% Other
5.0% Funds of Funds
9.3% Debt & Special Situations
6.8% Infrastructure
18.9% Real Estate
8.9% Venture Capital
7.1% Growth Capital
31.0% Buyout
Total %
Legend: “ROW” = Rest of the World = Africa, Israel and Middle East. “Other” = Co-Investment Multi-Manager, Secondaries, Direct Secondaries, Natural Resources, Special Situations, Timber and Turnaround

© Preqin Ltd. 2017 / www.preqin.com6
PREQIN SPECIAL REPORT: ASIAN PRIVATE EQUITY & VENTURE CAPITAL
main issues for global investors active in the region are a greater divergence between the top quartile and poor performers, and a relatively low realization rate of the value created. Indeed, too many funds, which have reached the end of their investment period, are characterized by DPI below 50%, particularly the ones exposed to China and India.
While it seems that there is no material premium to investing in Asia rather than in the West, it is important to note that the nature of the performance differs compared to the West. In Europe, over 80% of the funds dedicated to private equity investment have been raised for leverage buyouts, while the bulk of the funds focused on the emerging Asia region target venture capital or growth capital investments. Moreover, the few managers utilizing a control strategy typically only rely on moderate financial engineering. As a result, in addition to the multiple expansion, most of the value created is driven by growth rather than financial leverage. Buying minority stakes in growing companies with the hope of a listing also implies longer than average holding periods. In China, for example, private equity managers have invested in more than 10,000 companies, while only about 250 IPOs are transacted on a yearly basis. Going forward, more trade sales and secondary transactions will be needed.
APPETITE OF GLOBAL LPs FOR PRIVATE INVESTMENTS IN ASIA-PACIFICGiven the disparity of the performance between top-quartile and lower-quartile funds, manager selection is even more important in Asia than in North America and Europe. Therefore, investors continue to favour GPs that have demonstrated
their ability to return capital and that have built a repeatable successful business model.
A few years ago, pre-IPO strategies allowed managers to generate value without implementing operational changes in the portfolio companies. Today, operating management skills and an ability to negotiate satisfactory corporate governance (in particular regarding exit rights) are a must to convince investors to make a commitment. Alongside large pan-regional GPs that have imported best practices from the West, local managers that have developed a sector expertise should continue to attract LP interest.
Overall, there will continue to be two different types of global investors in the region. The first type is the international investor that has set up operations in Asia and is committed to allocating to Asia as a diversification play. The second type is the “fly-in” investor that is only looking to invest in opportunities where they believe they can take advantage of the reasonable valuations and attractive growth prospects to achieve premium returns that will compensate them for currency and emerging markets risk. Circumstantial evidence would suggest that the quantity and interest levels of these international “fly-in” investors should continue to increase as attendance at the large Asia regional conferences has also increased over the last several years. As the market matures, we are likely to see continued strong support from local investors augmented by the “fly-in” investors becoming a larger percentage of the committed capital.
BEST PRIVATE EQUITY OPPORTUNITIES IN ASIA-PACIFICOnly a few countries in Asia-Pacific can be characterized as having a mature private equity industry that is dominated by buyout funds, namely Australia, Japan and, to some extent, Korea. Due to limited competition for quality companies with an enterprise value below $200mn and a large ecosystem in that segment, Australia appears to offer the most attractive mid-market buyout funds on a global level. Compared to North America or Europe, over 95% of transactions are primary deals in Australia. Furthermore, compared to the Japanese market, Australia is characterized by sound macroeconomic growth prospects.
In emerging Asia, secondary managers are expected to continue to deliver above-average performance when adjusted for risk. By nature, buying into a fund entering its harvesting period or into a company owned for several years by another private equity investor reduces the intrinsic risk of an investment. It also significantly reduces the expected holding period before a liquidity event is likely to occur.
In addition, managers that have built a franchise and shown the ability to add value to companies in sectors such as technology, healthcare or education seem to be well placed to raise funds in the future. We also believe that the infrastructure and credit spaces will provide interesting investment opportunities. However, if the underlying markets are expected to grow significantly in the foreseeable future, the main issue in those two segments is the limited number of managers that have demonstrated a consistent track record.
CAPSTONE PARTNERSFounded in 2001, Capstone Partners is a leading independent placement agent focused on raising capital for private equity, credit, real assets and infrastructure firms from around the world.
ALEXANDRE SCHMITZAlexandre is a Managing Partner at Capstone Partners. He leads the distribution and the business development in Asia Pacific. Prior to joining Capstone Partners, he served for over seventeen years in Europe as a private equity investor (PAI Partners, Cobepa and BeCapital) and as a financial analyst (Bank Degroof). He has a Masters Degree in Economics from the University of Louvain (magna cum laude) and is a Certified Financial Analyst.
www.csplp.com
alternative assets. intelligent data.
7
DOWNLOAD DATA PACK: www.preqin.com/PEASIA17
ASIAN PRIVATE EQUITY & VENTURE CAPITAL UNIVERSE
The private equity & venture capital market of Asia is diverse and offers a
wide selection of investment opportunities and potential income streams. The maturing Greater China region remains the hub of Asian activity – home to more investors and fund managers than any other Asian region, it represents 75% and 44% of the value of all venture capital and buyout deals respectively completed in Asia since 2010. Northeast Asia is also a significant investment destination within Asia, with Japan witnessing record buyout deal activity in 2016. Managers based in the ASEAN region have been launching steadily increasing numbers of private equity vehicles in recent years, while South Asian venture capital activity has been generally on the up, despite a dip in aggregate deal value in 2016.
With these regions witnessing varying levels of private equity activity, Preqin’s 2017 Asian Private Equity & Venture Capital report will provide an overview of the fundraising and deal landscape across Asia, and identify the key players within the region.
THE INVESTOR UNIVERSEPreqin’s Private Equity Online tracks 863 Asia-based institutional investors active in the asset class. As seen on page 4, China is home to the greatest number of LPs in
Asia, followed by Japan and South Korea (Fig. 1).
The make-up of Asia-based investors starkly contrasts that of the global industry. In the more developed markets of North America and Europe, foundations and pension funds account for the majority of LPs, whereas corporate investors, banks and insurance companies are the most numerous Asia-based investors (Fig. 2). Recent regulatory changes surrounding the investment activity of insurance companies has enabled these institutions to participate
more directly in the industry, leading to insurance companies launching debut funds.
ASIA-FOCUSED FUNDRAISINGAsia-focused private equity & venture capital fundraising has declined in recent years, with the aggregate capital secured by funds closed in 2016 down 26% from the $89bn raised in 2014 (Fig. 3). Despite this, larger funds have been entering the market: 37% of Asia-focused funds closed in 2017 so far have secured $250mn or more, up from 27% in 2016 and 21% in 2015 (Fig. 4). It is therefore unsurprising
24%
14%
11%10%
9%
8%
7%
5%
12%
Corporate Investor
Bank/Investment Bank
Insurance Company
Family Office
Investment Company
Government Agency
Asset Manager
Private Equity Fund ofFunds ManagerOther
Source: Preqin Private Equity Online
Fig. 2: Asia-Based Private Equity & Venture Capital Investors by Type
391
513
440406
370348
259
114
6087 76 65
89 80 6639
0
100
200
300
400
500
600
2010 2011 2012 2013 2014 2015 2016 2017 YTD
No. of Funds Closed Aggregate Capital Raised ($bn)
Source: Preqin Private Equity Online
Year of Final Close
Fig. 3: Annual Asia-Focused Private Equity & Venture Capital Fundraising, 2010 - 2017 YTD (As at August 2017)
27%
24%11%
10%
10%
7%
4%7% China
Japan
South Korea
Hong Kong
India
Singapore
Taiwan
Other
Source: Preqin Private Equity Online
Fig. 1: Asia-Based Private Equity & Venture Capital Investors by Location
© Preqin Ltd. 2017 / www.preqin.com8
PREQIN SPECIAL REPORT: ASIAN PRIVATE EQUITY & VENTURE CAPITAL
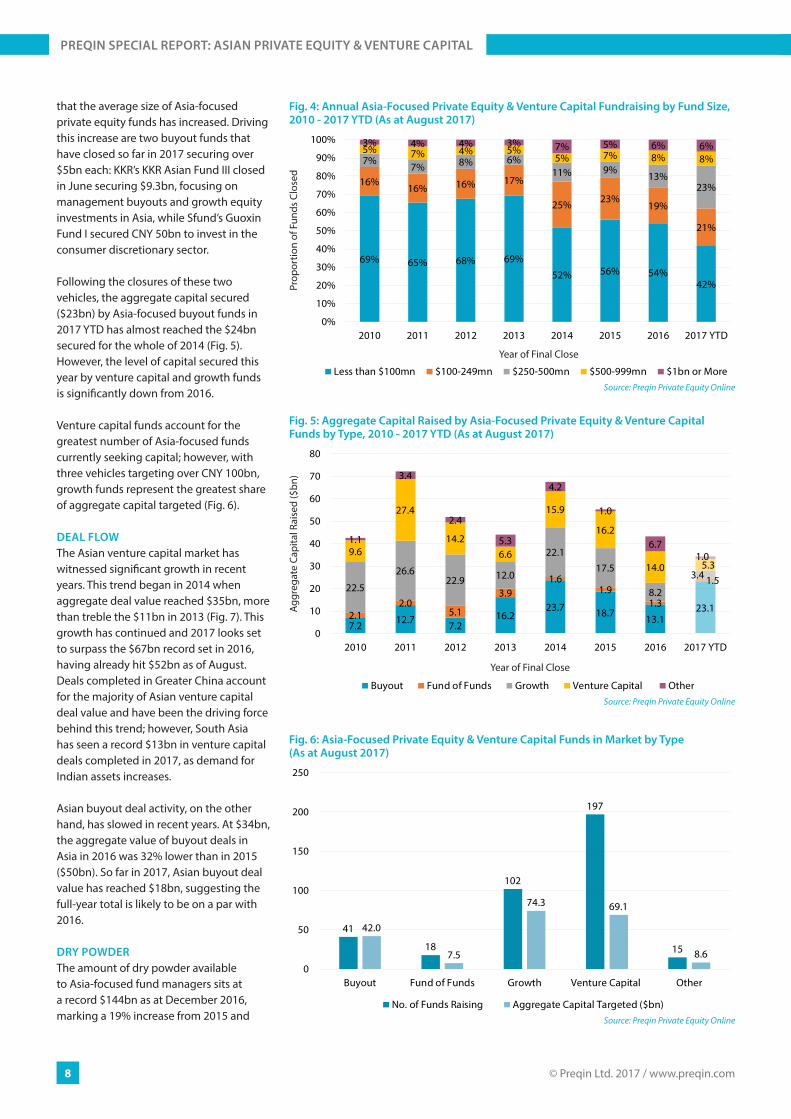
that the average size of Asia-focused private equity funds has increased. Driving this increase are two buyout funds that have closed so far in 2017 securing over $5bn each: KKR’s KKR Asian Fund III closed in June securing $9.3bn, focusing on management buyouts and growth equity investments in Asia, while Sfund’s Guoxin Fund I secured CNY 50bn to invest in the consumer discretionary sector.
Following the closures of these two vehicles, the aggregate capital secured ($23bn) by Asia-focused buyout funds in 2017 YTD has almost reached the $24bn secured for the whole of 2014 (Fig. 5). However, the level of capital secured this year by venture capital and growth funds is significantly down from 2016.
Venture capital funds account for the greatest number of Asia-focused funds currently seeking capital; however, with three vehicles targeting over CNY 100bn, growth funds represent the greatest share of aggregate capital targeted (Fig. 6).
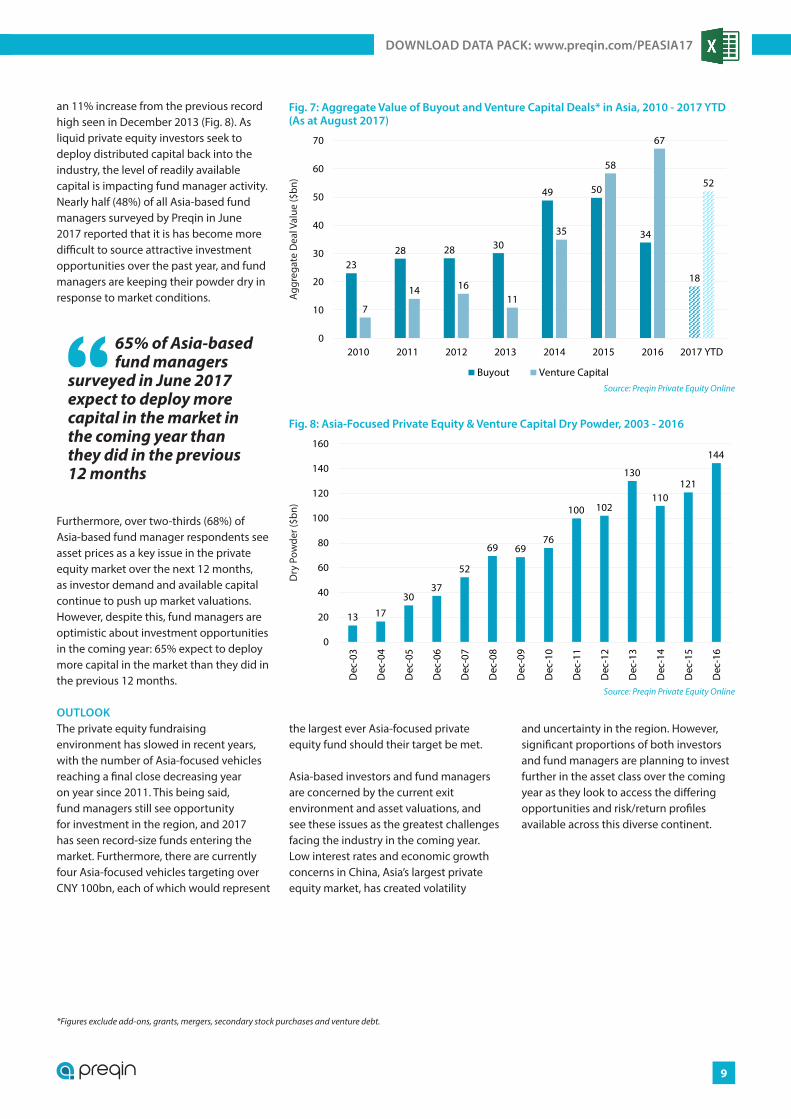
DEAL FLOW The Asian venture capital market has witnessed significant growth in recent years. This trend began in 2014 when aggregate deal value reached $35bn, more than treble the $11bn in 2013 (Fig. 7). This growth has continued and 2017 looks set to surpass the $67bn record set in 2016, having already hit $52bn as of August. Deals completed in Greater China account for the majority of Asian venture capital deal value and have been the driving force behind this trend; however, South Asia has seen a record $13bn in venture capital deals completed in 2017, as demand for Indian assets increases.
Asian buyout deal activity, on the other hand, has slowed in recent years. At $34bn, the aggregate value of buyout deals in Asia in 2016 was 32% lower than in 2015 ($50bn). So far in 2017, Asian buyout deal value has reached $18bn, suggesting the full-year total is likely to be on a par with 2016.
DRY POWDERThe amount of dry powder available to Asia-focused fund managers sits at a record $144bn as at December 2016, marking a 19% increase from 2015 and
69% 65% 68% 69%
52% 56% 54%42%
16%16% 16% 17%
25% 23%19%
21%
7%7% 8% 6%
11% 9%13%
23%
5% 7% 4% 5%5% 7% 8% 8%
3% 4% 4% 3% 7% 5% 6% 6%
0%
10%
20%
30%
40%
50%
60%
70%
80%
90%
100%
2010 2011 2012 2013 2014 2015 2016 2017 YTD
Less than $100mn $100-249mn $250-500mn $500-999mn $1bn or MoreSource: Preqin Private Equity Online
Prop
ortio
n of
Fun
ds C
lose
d
Year of Final Close
Fig. 4: Annual Asia-Focused Private Equity & Venture Capital Fundraising by Fund Size, 2010 - 2017 YTD (As at August 2017)
7.2 12.7 7.216.2
23.7 18.7 13.123.1
2.12.0
5.1
3.91.6
1.91.3
1.522.5
26.622.9 12.0
22.117.5
8.2
3.4
9.6
27.4
14.26.6
15.9
16.2
14.0 5.3
1.1
3.4
2.4
5.3
4.2
1.0
6.71.0
0
10
20
30
40
50
60
70
80
2010 2011 2012 2013 2014 2015 2016 2017 YTD
Buyout Fund of Funds Growth Venture Capital OtherSource: Preqin Private Equity Online
Aggr
egat
e Ca
pita
l Rai
sed
($bn
)
Year of Final Close
Fig. 5: Aggregate Capital Raised by Asia-Focused Private Equity & Venture Capital Funds by Type, 2010 - 2017 YTD (As at August 2017)
41
18
102
197
15
42.0
7.5
74.3 69.1
8.60
50
100
150
200
250
Buyout Fund of Funds Growth Venture Capital Other
No. of Funds Raising Aggregate Capital Targeted ($bn)Source: Preqin Private Equity Online
Fig. 6: Asia-Focused Private Equity & Venture Capital Funds in Market by Type (As at August 2017)
alternative assets. intelligent data.
9
DOWNLOAD DATA PACK: www.preqin.com/PEASIA17
an 11% increase from the previous record high seen in December 2013 (Fig. 8). As liquid private equity investors seek to deploy distributed capital back into the industry, the level of readily available capital is impacting fund manager activity.Nearly half (48%) of all Asia-based fund managers surveyed by Preqin in June 2017 reported that it is has become more difficult to source attractive investment opportunities over the past year, and fund managers are keeping their powder dry in response to market conditions.
Furthermore, over two-thirds (68%) of Asia-based fund manager respondents see asset prices as a key issue in the private equity market over the next 12 months, as investor demand and available capital continue to push up market valuations. However, despite this, fund managers are optimistic about investment opportunities in the coming year: 65% expect to deploy more capital in the market than they did in the previous 12 months.
OUTLOOK The private equity fundraising environment has slowed in recent years, with the number of Asia-focused vehicles reaching a final close decreasing year on year since 2011. This being said, fund managers still see opportunity for investment in the region, and 2017 has seen record-size funds entering the market. Furthermore, there are currently four Asia-focused vehicles targeting over CNY 100bn, each of which would represent
the largest ever Asia-focused private equity fund should their target be met.
Asia-based investors and fund managers are concerned by the current exit environment and asset valuations, and see these issues as the greatest challenges facing the industry in the coming year. Low interest rates and economic growth concerns in China, Asia’s largest private equity market, has created volatility
and uncertainty in the region. However, significant proportions of both investors and fund managers are planning to invest further in the asset class over the coming year as they look to access the differing opportunities and risk/return profiles available across this diverse continent.
2328 28 30
49 50
34
18
7
14 1611
35
58
67
52
0
10
20
30
40
50
60
70
2010 2011 2012 2013 2014 2015 2016 2017 YTD
Buyout Venture CapitalSource: Preqin Private Equity Online
Aggr
egat
e D
eal V
alue
($bn
)
Fig. 7: Aggregate Value of Buyout and Venture Capital Deals* in Asia, 2010 - 2017 YTD (As at August 2017)
13 17
3037
52
69 6976
100 102
130
110121
144
0
20
40
60
80
100
120
140
160
Dec
-03
Dec
-04
Dec
-05
Dec
-06
Dec
-07
Dec
-08
Dec
-09
Dec
-10
Dec
-11
Dec
-12
Dec
-13
Dec
-14
Dec
-15
Dec
-16
Source: Preqin Private Equity Online
Dry
Pow
der (
$bn)
Fig. 8: Asia-Focused Private Equity & Venture Capital Dry Powder, 2003 - 2016
65% of Asia-based fund managers
surveyed in June 2017 expect to deploy more capital in the market in the coming year than they did in the previous 12 months
*Figures exclude add-ons, grants, mergers, secondary stock purchases and venture debt.
© Preqin Ltd. 2017 / www.preqin.com10
PREQIN SPECIAL REPORT: ASIAN PRIVATE EQUITY & VENTURE CAPITAL
ASSETS UNDER MANAGEMENT
-40
-20
0
20
40
60
80
Dec
-00
Dec
-01
Dec
-02
Dec
-03
Dec
-04
Dec
-05
Dec
-06
Dec
-07
Dec
-08
Dec
-09
Dec
-10
Dec
-11
Dec
-12
Dec
-13
Dec
-14
Dec
-15
Dec
-16
Capital Called-up ($bn) Capital Distributed ($bn)Net Capital Distributed ($bn)
Source: Preqin Private Equity Online
Capi
tal C
alle
d/D
istr
ibut
ed ($
bn)
Fig. 11: Asia-Focused Private Equity & Venture Capital - Annual Capital Called and Distributed, 2000 - 2016
13 17 30 37 52 69 69 76 100 102 130 110 121 14412 15 21 32
54 54 70107
124161
205 233281
339
0
50
100
150
200
250
300
350
400
450
500
Dec
-03
Dec
-04
Dec
-05
Dec
-06
Dec
-07
Dec
-08
Dec
-09
Dec
-10
Dec
-11
Dec
-12
Dec
-13
Dec
-14
Dec
-15
Dec
-16
Dry Powder ($bn) Unrealized Value ($bn)Source: Preqin Private Equity Online
Ass
ets
unde
r Man
agem
ent (
$bn)
Fig. 9: Asia-Focused Private Equity & Venture Capital Assets under Management, 2003 - 2016
14.1
81.9
1.8
124.7
1.3 1.6
113.9
6.5
46.6
2.5
40.3
0.6 1.9
46.1
0
20
40
60
80
100
120
140Ba
lanc
ed
Buyo
ut
Co-In
vest
men
t
Gro
wth
Seco
ndar
ies
Turn
arou
nd
Vent
ure
Capi
tal
Unrealized Value ($bn) Dry Powder ($bn)
Source: Preqin Private Equity Online
Fig. 10: Asia-Focused Private Equity & Venture Capital Assets under Management by Fund Type (As at December 2016)
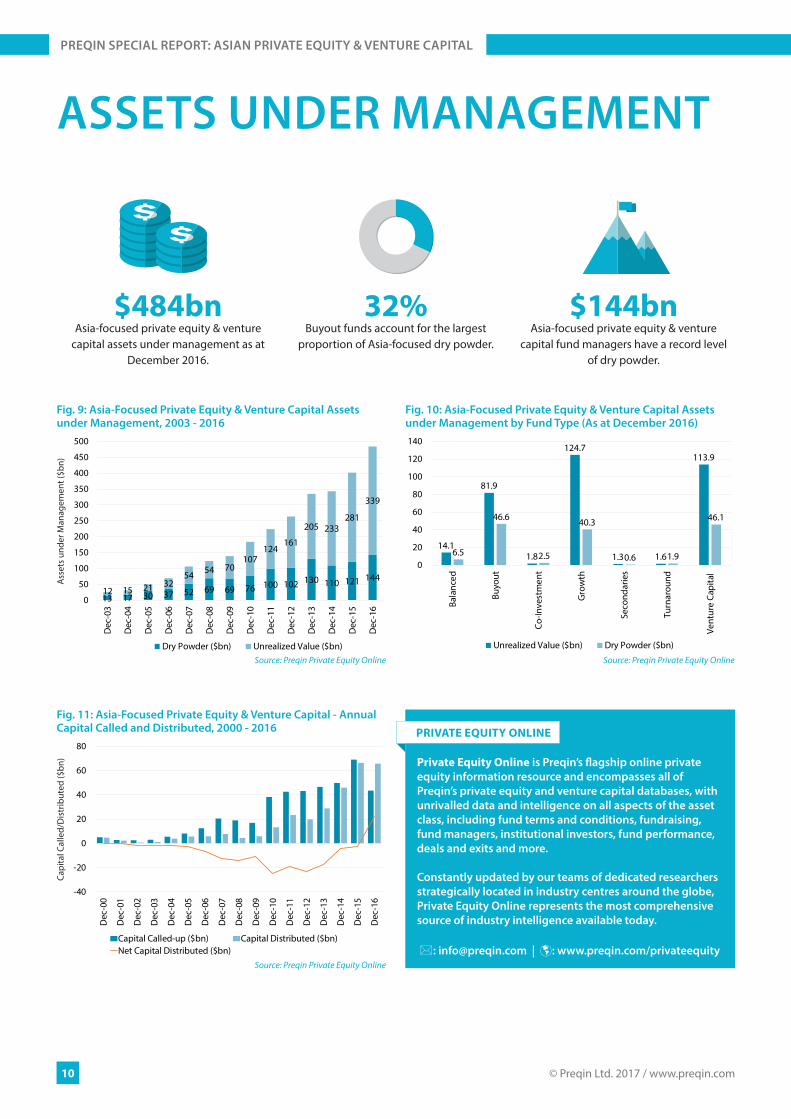
$484bnAsia-focused private equity & venture
capital assets under management as at December 2016.
32%Buyout funds account for the largest
proportion of Asia-focused dry powder.
$144bnAsia-focused private equity & venture
capital fund managers have a record level of dry powder.
PRIVATE EQUITY ONLINE
Private Equity Online is Preqin’s flagship online private equity information resource and encompasses all of Preqin’s private equity and venture capital databases, with unrivalled data and intelligence on all aspects of the asset class, including fund terms and conditions, fundraising, fund managers, institutional investors, fund performance, deals and exits and more.
Constantly updated by our teams of dedicated researchers strategically located in industry centres around the globe, Private Equity Online represents the most comprehensive source of industry intelligence available today.
: [email protected] | : www.preqin.com/privateequity

TR Capital
Global private equity fundraisingCapstone Partners (www.csplp.com) is a leading independent placement agent focused on raising capital for private equity, credit, real assets and infrastructure firms. The Capstone team includes 35 experienced professionals in North America, Europe and Asia.
www.csplp.com
Americas — Europe — Middle East — Asia Pacific
Securities placed through CSP Securities, LPMember FINRA/SIPCAuthorised by FINMACMS license holder from the MAS
We congratulate the TR Capital team on the successful closing of TR Capital III.
© Preqin Ltd. 2017 / www.preqin.com12
PREQIN SPECIAL REPORT: ASIAN PRIVATE EQUITY & VENTURE CAPITAL
PERFORMANCE
0%
2%
4%
6%
8%
10%
12%
14%
16%
18%
2004
2005
2006
2007
2008
2009
2010
2011
2012
2013
2014
North America
Europe
Asia
Source: Preqin Private Equity Online
Net
IRR
sinc
e In
cept
ion
Vintage Year
Fig. 12: Median Net IRRs of Private Equity & Venture Capital Funds by Primary Geographic Focus and Vintage Year
-100
-50
0
50
100
150
2007 2008 2009 2010 2011 2012 2013 2014 2015 2016North America Europe Asia Rest of World
Source: Preqin Private Equity Online
Net
Cas
h Fl
ow ($
bn)
Fig. 13: Annual Private Equity & Venture Capital Net Cash Flow by Primary Fund Focus, 2007 - 2016
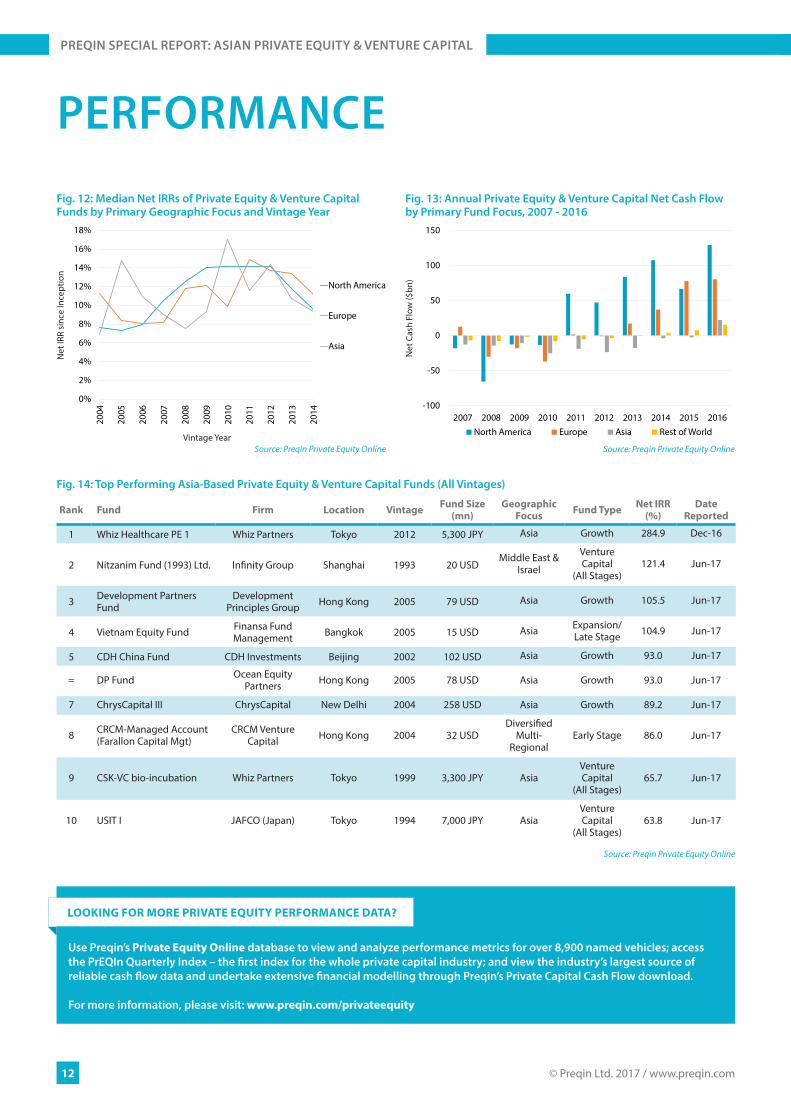
Fig. 14: Top Performing Asia-Based Private Equity & Venture Capital Funds (All Vintages)
Rank Fund Firm Location Vintage Fund Size (mn)
Geographic Focus Fund Type Net IRR
(%)Date
Reported
1 Whiz Healthcare PE 1 Whiz Partners Tokyo 2012 5,300 JPY Asia Growth 284.9 Dec-16
2 Nitzanim Fund (1993) Ltd. Infinity Group Shanghai 1993 20 USDMiddle East &
Israel
Venture Capital
(All Stages)121.4 Jun-17
3 Development Partners Fund
Development Principles Group Hong Kong 2005 79 USD Asia Growth 105.5 Jun-17
4 Vietnam Equity Fund Finansa Fund Management Bangkok 2005 15 USD Asia Expansion/
Late Stage 104.9 Jun-17
5 CDH China Fund CDH Investments Beijing 2002 102 USD Asia Growth 93.0 Jun-17
= DP Fund Ocean Equity Partners Hong Kong 2005 78 USD Asia Growth 93.0 Jun-17
7 ChrysCapital III ChrysCapital New Delhi 2004 258 USD Asia Growth 89.2 Jun-17
8 CRCM-Managed Account (Farallon Capital Mgt)
CRCM Venture Capital Hong Kong 2004 32 USD
Diversified Multi-
RegionalEarly Stage 86.0 Jun-17
9 CSK-VC bio-incubation Whiz Partners Tokyo 1999 3,300 JPY AsiaVenture Capital
(All Stages)65.7 Jun-17
10 USIT I JAFCO (Japan) Tokyo 1994 7,000 JPY AsiaVenture Capital
(All Stages)63.8 Jun-17
Source: Preqin Private Equity Online
LOOKING FOR MORE PRIVATE EQUITY PERFORMANCE DATA?
Use Preqin’s Private Equity Online database to view and analyze performance metrics for over 8,900 named vehicles; access the PrEQIn Quarterly Index – the first index for the whole private capital industry; and view the industry’s largest source of reliable cash flow data and undertake extensive financial modelling through Preqin’s Private Capital Cash Flow download.
For more information, please visit: www.preqin.com/privateequity
alternative assets. intelligent data.
13
DOWNLOAD DATA PACK: www.preqin.com/PEASIA17
FUND MANAGER AND INVESTOR OUTLOOK
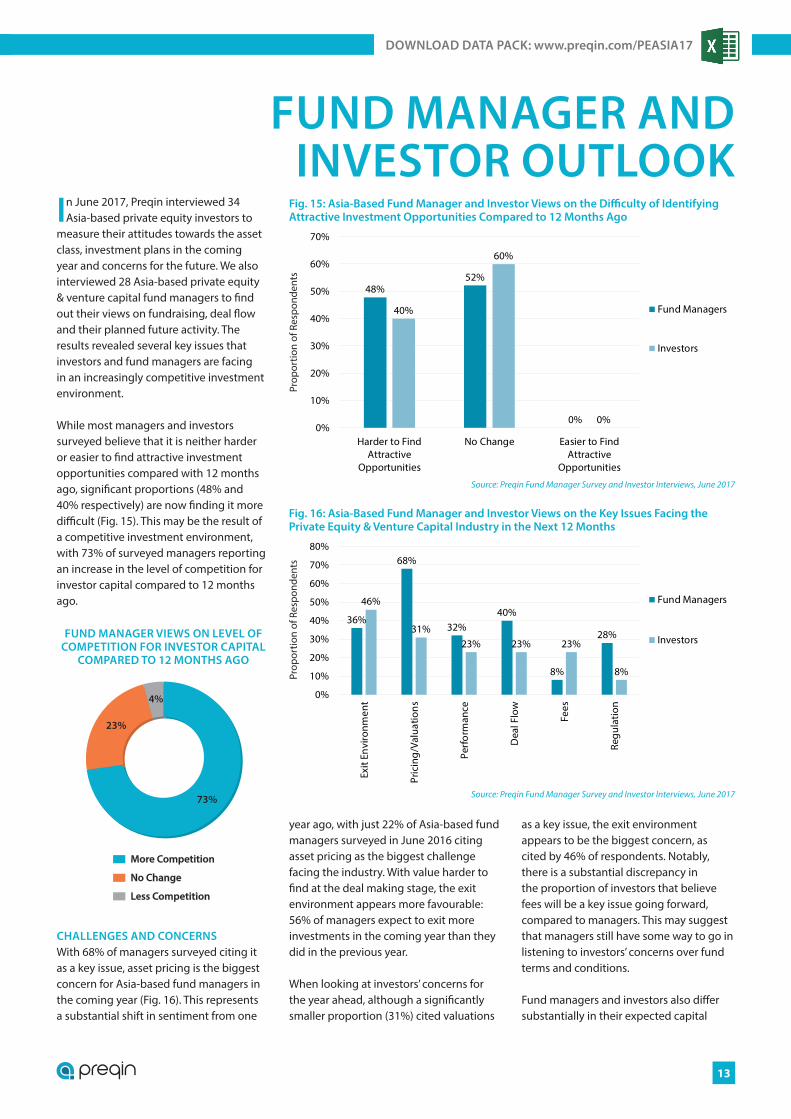
In June 2017, Preqin interviewed 34 Asia-based private equity investors to
measure their attitudes towards the asset class, investment plans in the coming year and concerns for the future. We also interviewed 28 Asia-based private equity & venture capital fund managers to find out their views on fundraising, deal flow and their planned future activity. The results revealed several key issues that investors and fund managers are facing in an increasingly competitive investment environment.
While most managers and investors surveyed believe that it is neither harder or easier to find attractive investment opportunities compared with 12 months ago, significant proportions (48% and 40% respectively) are now finding it more difficult (Fig. 15). This may be the result of a competitive investment environment, with 73% of surveyed managers reporting an increase in the level of competition for investor capital compared to 12 months ago.
CHALLENGES AND CONCERNSWith 68% of managers surveyed citing it as a key issue, asset pricing is the biggest concern for Asia-based fund managers in the coming year (Fig. 16). This represents a substantial shift in sentiment from one
year ago, with just 22% of Asia-based fund managers surveyed in June 2016 citing asset pricing as the biggest challenge facing the industry. With value harder to find at the deal making stage, the exit environment appears more favourable: 56% of managers expect to exit more investments in the coming year than they did in the previous year.
When looking at investors’ concerns for the year ahead, although a significantly smaller proportion (31%) cited valuations
as a key issue, the exit environment appears to be the biggest concern, as cited by 46% of respondents. Notably, there is a substantial discrepancy in the proportion of investors that believe fees will be a key issue going forward, compared to managers. This may suggest that managers still have some way to go in listening to investors’ concerns over fund terms and conditions.
Fund managers and investors also differ substantially in their expected capital
48%52%
0%
40%
60%
0%0%
10%
20%
30%
40%
50%
60%
70%
Harder to FindAttractive
Opportunities
No Change Easier to FindAttractive
Opportunities
Fund Managers
Investors
Source: Preqin Fund Manager Survey and Investor Interviews, June 2017
Prop
ortio
n of
Res
pond
ents
Fig. 15: Asia-Based Fund Manager and Investor Views on the Difficulty of Identifying Attractive Investment Opportunities Compared to 12 Months Ago
36%
68%
32%40%
8%
28%
46%
31%23% 23% 23%
8%
0%
10%
20%
30%
40%
50%
60%
70%
80%
Exit
Envi
ronm
ent
Pric
ing/
Valu
atio
ns
Perf
orm
ance
Dea
l Flo
w
Fees
Regu
latio
nFund Managers
Investors
Source: Preqin Fund Manager Survey and Investor Interviews, June 2017
Prop
ortio
n of
Res
pond
ents
Fig. 16: Asia-Based Fund Manager and Investor Views on the Key Issues Facing the Private Equity & Venture Capital Industry in the Next 12 Months
FUND MANAGER VIEWS ON LEVEL OF COMPETITION FOR INVESTOR CAPITAL
COMPARED TO 12 MONTHS AGO
73%
23%
4%
More Competition
No Change
Less Competition
© Preqin Ltd. 2017 / www.preqin.com14
PREQIN SPECIAL REPORT: ASIAN PRIVATE EQUITY & VENTURE CAPITAL
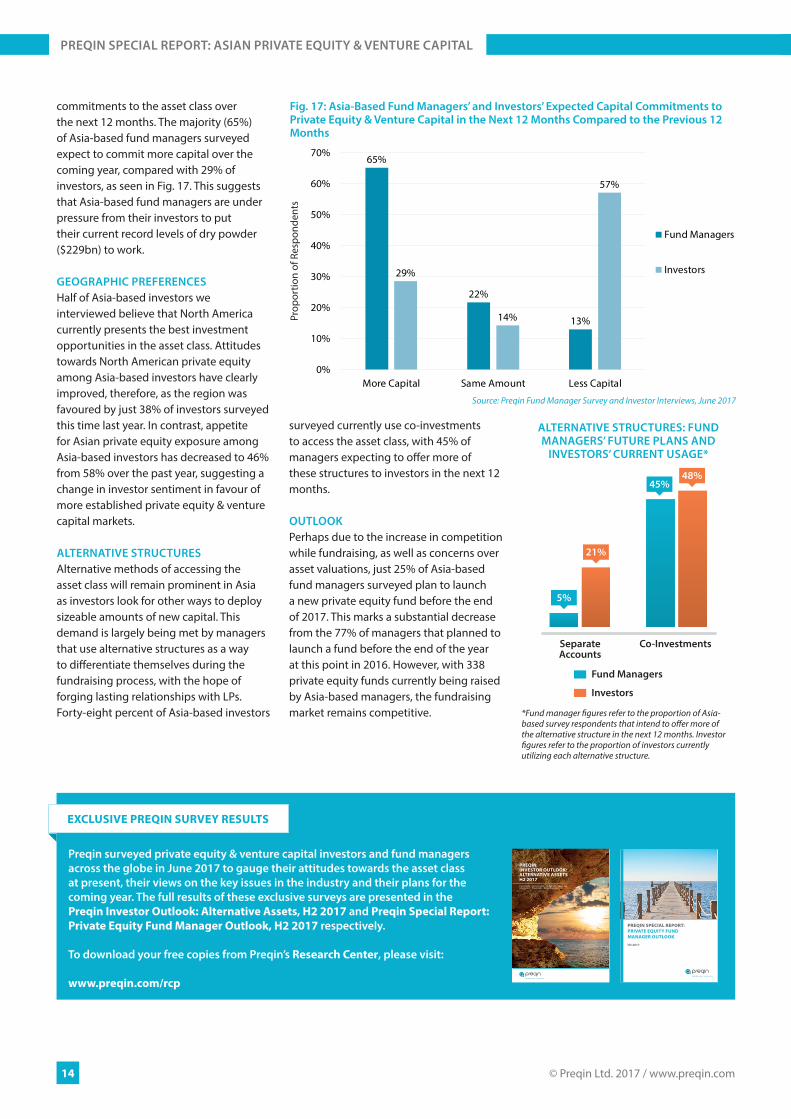
commitments to the asset class over the next 12 months. The majority (65%) of Asia-based fund managers surveyed expect to commit more capital over the coming year, compared with 29% of investors, as seen in Fig. 17. This suggests that Asia-based fund managers are under pressure from their investors to put their current record levels of dry powder ($229bn) to work.
GEOGRAPHIC PREFERENCESHalf of Asia-based investors we interviewed believe that North America currently presents the best investment opportunities in the asset class. Attitudes towards North American private equity among Asia-based investors have clearly improved, therefore, as the region was favoured by just 38% of investors surveyed this time last year. In contrast, appetite for Asian private equity exposure among Asia-based investors has decreased to 46% from 58% over the past year, suggesting a change in investor sentiment in favour of more established private equity & venture capital markets.
ALTERNATIVE STRUCTURESAlternative methods of accessing the asset class will remain prominent in Asia as investors look for other ways to deploy sizeable amounts of new capital. This demand is largely being met by managers that use alternative structures as a way to differentiate themselves during the fundraising process, with the hope of forging lasting relationships with LPs. Forty-eight percent of Asia-based investors
surveyed currently use co-investments to access the asset class, with 45% of managers expecting to offer more of these structures to investors in the next 12 months.
OUTLOOKPerhaps due to the increase in competition while fundraising, as well as concerns over asset valuations, just 25% of Asia-based fund managers surveyed plan to launch a new private equity fund before the end of 2017. This marks a substantial decrease from the 77% of managers that planned to launch a fund before the end of the year at this point in 2016. However, with 338 private equity funds currently being raised by Asia-based managers, the fundraising market remains competitive.
65%
22%
13%
29%
14%
57%
0%
10%
20%
30%
40%
50%
60%
70%
More Capital Same Amount Less Capital
Fund Managers
Investors
Source: Preqin Fund Manager Survey and Investor Interviews, June 2017
Prop
ortio
n of
Res
pond
ents
Fig. 17: Asia-Based Fund Managers’ and Investors’ Expected Capital Commitments to Private Equity & Venture Capital in the Next 12 Months Compared to the Previous 12 Months
ALTERNATIVE STRUCTURES: FUND MANAGERS’ FUTURE PLANS AND
INVESTORS’ CURRENT USAGE*
Fund Managers
Investors
Separate Accounts
Co-Investments
5%
45%
21%
48%
EXCLUSIVE PREQIN SURVEY RESULTS
Preqin surveyed private equity & venture capital investors and fund managers across the globe in June 2017 to gauge their attitudes towards the asset class at present, their views on the key issues in the industry and their plans for the coming year. The full results of these exclusive surveys are presented in the Preqin Investor Outlook: Alternative Assets, H2 2017 and Preqin Special Report: Private Equity Fund Manager Outlook, H2 2017 respectively.
To download your free copies from Preqin’s Research Center, please visit:
www.preqin.com/rcp
PREQININVESTOR OUTLOOK:ALTERNATIVE ASSETSH2 2017
alternative assets. intelligent data.
Private Equity ■ Venture Capital ■ Hedge Funds ■ Real Estate Infrastructure ■ Private Debt ■ Natural Resources
PREQIN SPECIAL REPORT:PRIVATE EQUITY FUND MANAGER OUTLOOK
H2 2017
alternative assets. intelligent data.
*Fund manager figures refer to the proportion of Asia-based survey respondents that intend to offer more of the alternative structure in the next 12 months. Investor figures refer to the proportion of investors currently utilizing each alternative structure.
alternative assets. intelligent data.
15
DOWNLOAD DATA PACK: www.preqin.com/PEASIA17
BUYOUT
1618
14
18
29 29
19 20
4.7
12.6
5.3
10.212.8
14.4 14.1 13.5
0
5
10
15
20
25
30
2010 2011 2012 2013 2014 2015 2016 2017 YTD
No. of Funds Closed Aggregate Capital Raised ($bn)
Source: Preqin Private Equity Online
Year of Final Close
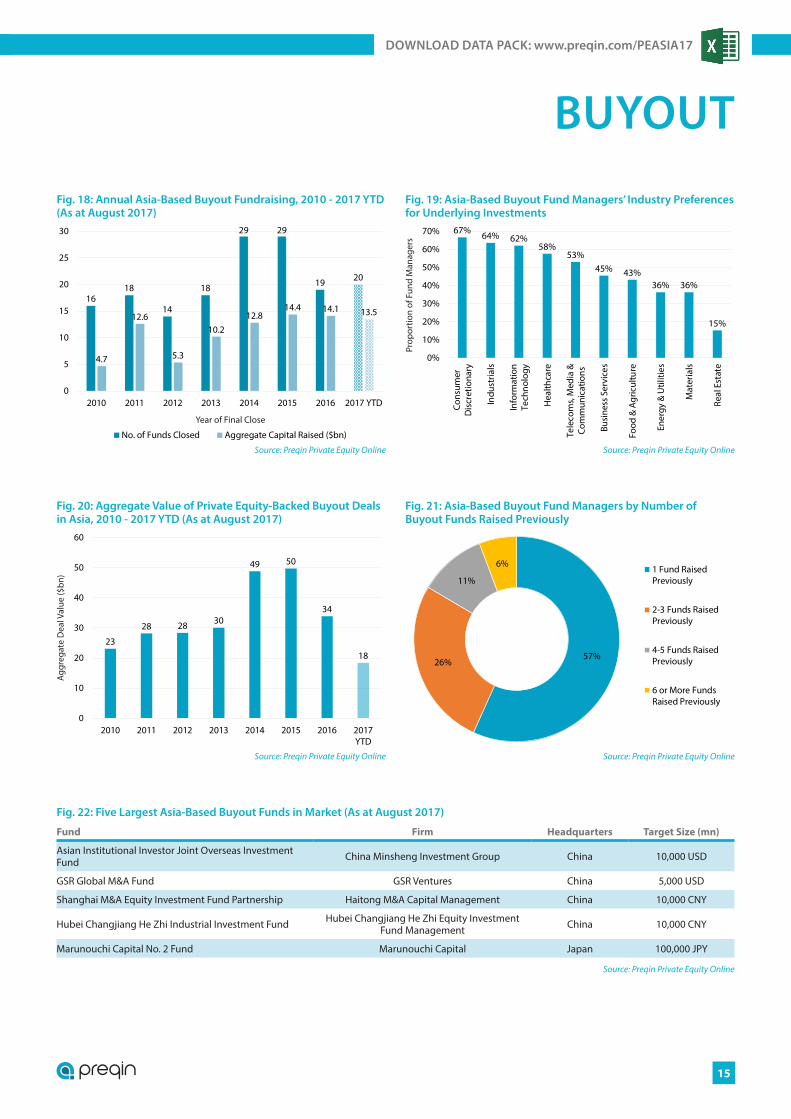
Fig. 18: Annual Asia-Based Buyout Fundraising, 2010 - 2017 YTD (As at August 2017)
67% 64% 62%58%
53%45% 43%
36% 36%
15%
0%
10%
20%
30%
40%
50%
60%
70%
Cons
umer
Dis
cret
iona
ry
Indu
stria
ls
Info
rmat
ion
Tech
nolo
gy
Hea
lthca
re
Tele
com
s, M
edia
&Co
mm
unic
atio
ns
Busi
ness
Ser
vice
s
Food
& A
gric
ultu
re
Ener
gy &
Util
ities
Mat
eria
ls
Real
Est
ate
Source: Preqin Private Equity Online
Prop
ortio
n of
Fun
d M
anag
ers
Fig. 19: Asia-Based Buyout Fund Managers’ Industry Preferences for Underlying Investments
23
28 28 30
49 50
34
18
0
10
20
30
40
50
60
2010 2011 2012 2013 2014 2015 2016 2017YTD
Source: Preqin Private Equity Online
Aggr
egat
e D
eal V
alue
($bn
)
Fig. 20: Aggregate Value of Private Equity-Backed Buyout Deals in Asia, 2010 - 2017 YTD (As at August 2017)
57%26%
11%
6% 1 Fund RaisedPreviously
2-3 Funds RaisedPreviously
4-5 Funds RaisedPreviously
6 or More FundsRaised Previously
Source: Preqin Private Equity Online
Fig. 21: Asia-Based Buyout Fund Managers by Number of Buyout Funds Raised Previously
Fig. 22: Five Largest Asia-Based Buyout Funds in Market (As at August 2017)
Fund Firm Headquarters Target Size (mn)
Asian Institutional Investor Joint Overseas Investment Fund China Minsheng Investment Group China 10,000 USD
GSR Global M&A Fund GSR Ventures China 5,000 USD
Shanghai M&A Equity Investment Fund Partnership Haitong M&A Capital Management China 10,000 CNY
Hubei Changjiang He Zhi Industrial Investment Fund Hubei Changjiang He Zhi Equity Investment Fund Management China 10,000 CNY
Marunouchi Capital No. 2 Fund Marunouchi Capital Japan 100,000 JPY
Source: Preqin Private Equity Online
© Preqin Ltd. 2017 / www.preqin.com16
PREQIN SPECIAL REPORT: ASIAN PRIVATE EQUITY & VENTURE CAPITAL
GROWTH
82
124
100 95
75
56 55
2020.2 24.8 20.210.9
19.6 16.78.2 3.4
0
20
40
60
80
100
120
140
2010 2011 2012 2013 2014 2015 2016 2017 YTD
No. of Funds Closed Aggregate Capital Raised ($bn)
Source: Preqin Private Equity Online
Year of Final Close
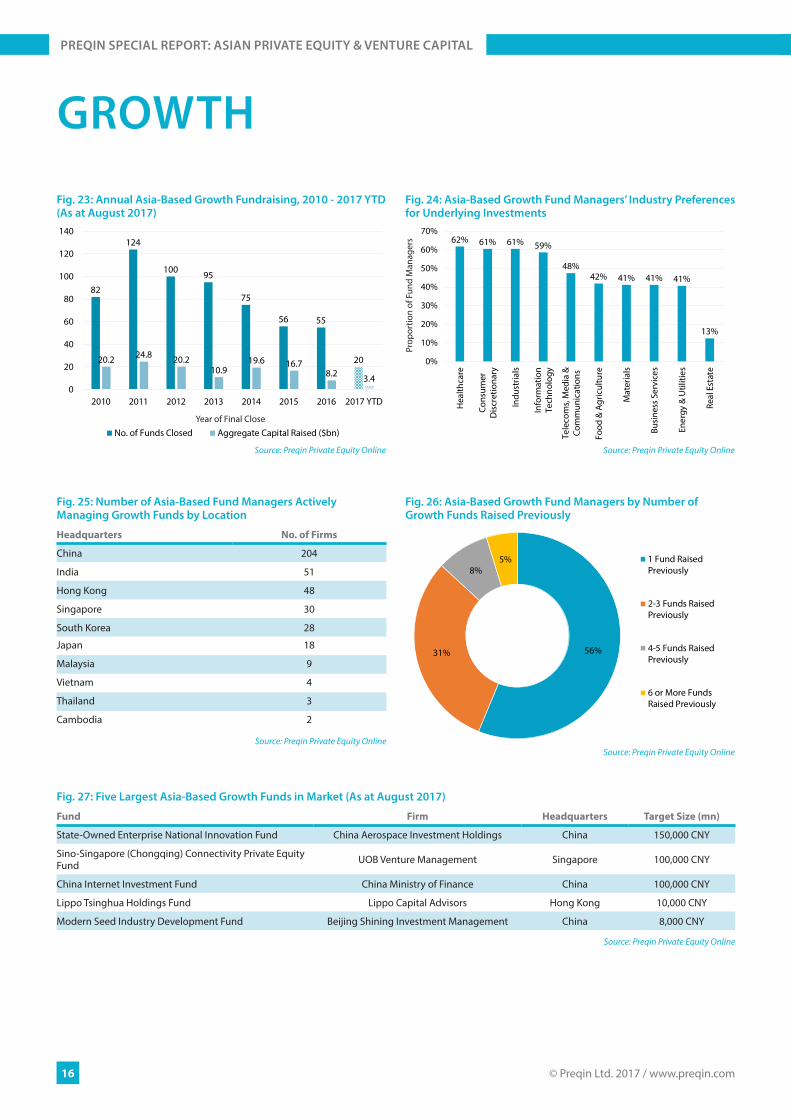
Fig. 23: Annual Asia-Based Growth Fundraising, 2010 - 2017 YTD (As at August 2017)
62% 61% 61% 59%
48%42% 41% 41% 41%
13%
0%
10%
20%
30%
40%
50%
60%
70%
Hea
lthca
re
Cons
umer
Dis
cret
iona
ry
Indu
stria
ls
Info
rmat
ion
Tech
nolo
gy
Tele
com
s, M
edia
&Co
mm
unic
atio
ns
Food
& A
gric
ultu
re
Mat
eria
ls
Busi
ness
Ser
vice
s
Ener
gy &
Util
ities
Real
Est
ate
Source: Preqin Private Equity Online
Prop
ortio
n of
Fun
d M
anag
ers
Fig. 24: Asia-Based Growth Fund Managers’ Industry Preferences for Underlying Investments
Fig. 25: Number of Asia-Based Fund Managers Actively Managing Growth Funds by Location
Headquarters No. of Firms
China 204
India 51
Hong Kong 48
Singapore 30
South Korea 28
Japan 18
Malaysia 9
Vietnam 4
Thailand 3
Cambodia 2
Source: Preqin Private Equity Online
56%31%
8%5% 1 Fund Raised
Previously
2-3 Funds RaisedPreviously
4-5 Funds RaisedPreviously
6 or More FundsRaised Previously
Source: Preqin Private Equity Online
Fig. 26: Asia-Based Growth Fund Managers by Number of Growth Funds Raised Previously
Fig. 27: Five Largest Asia-Based Growth Funds in Market (As at August 2017)
Fund Firm Headquarters Target Size (mn)
State-Owned Enterprise National Innovation Fund China Aerospace Investment Holdings China 150,000 CNY
Sino-Singapore (Chongqing) Connectivity Private Equity Fund UOB Venture Management Singapore 100,000 CNY
China Internet Investment Fund China Ministry of Finance China 100,000 CNY
Lippo Tsinghua Holdings Fund Lippo Capital Advisors Hong Kong 10,000 CNY
Modern Seed Industry Development Fund Beijing Shining Investment Management China 8,000 CNY
Source: Preqin Private Equity Online
alternative assets. intelligent data.
17
DOWNLOAD DATA PACK: www.preqin.com/PEASIA17
FUND OF FUNDS
6 6
109
6
10
5 5
1.51.1
2.73.1
1.2
2.5
1.0 1.4
0
2
4
6
8
10
12
2010 2011 2012 2013 2014 2015 2016 2017 YTD
No. of Funds Closed Aggregate Capital Raised ($bn)
Source: Preqin Private Equity Online
Year of Final Close
Fig. 28: Annual Asia-Based Private Equity Fund of Funds Fundraising, 2010 - 2017 YTD (As at August 2017)
49%
41% 41% 39% 39%
32% 32%27% 24%
5%
0%
10%
20%
30%
40%
50%
60%
Info
rmat
ion
Tech
nolo
gy
Indu
stria
ls
Hea
lthca
re
Cons
umer
Dis
cret
iona
ry
Tele
com
s, M
edia
&Co
mm
unic
atio
ns
Busi
ness
Ser
vice
s
Food
& A
gric
ultu
re
Mat
eria
ls
Ener
gy &
Util
ities
Real
Est
ate
Source: Preqin Private Equity Online
Prop
ortio
n of
Fun
d M
anag
ers
Fig. 29: Asia-Based Private Equity Fund of Funds Managers’ Industry Preferences for Underlying Investments
Fig. 30: Number of Asia-Based Fund Managers Actively Managing Private Equity Funds of Funds by Location
Headquarters No. of Firms
China 27
Hong Kong 4
Japan 4
Singapore 2
India 1
South Korea 1
Taiwan 1
Thailand 1
Source: Preqin Private Equity Online
55%33%
5%8%
1 Fund RaisedPreviously
2-3 Funds RaisedPreviously
4-5 Funds RaisedPreviously
6 or More FundsRaised Previously
Source: Preqin Private Equity Online
Fig. 31: Asia-Based Private Equity Fund of Funds Managers by Number of Funds of Funds Raised Previously
Fig. 32: Five Largest Asia-Based Private Equity Funds of Funds in Market (As at August 2017)
Fund Firm Headquarters Target Size (mn)
Guochuang Kaiyuan Fund of Funds II China Development Bank Capital China 10,000 CNY
Asia Alternatives Capital Partners V Asia Alternatives Management Hong Kong 1,300 USD
GC Oriza Fund of Funds II Oriza Holdings China 5,000 CNY
Rongqu Fund of Funds Hangzhou Touzhong 101 China 5,000 CNY
China Structural Reform Fund CCT Fund Management China 3,500 CNY
Source: Preqin Private Equity Online
© Preqin Ltd. 2017 / www.preqin.com18
PREQIN SPECIAL REPORT: ASIAN PRIVATE EQUITY & VENTURE CAPITAL
VENTURE CAPITAL
186
232
182
150167 163
94
39
8.526.5
12.9 6.0 13.9 16.2 8.7 3.80
50
100
150
200
250
2010 2011 2012 2013 2014 2015 2016 2017 YTD
No. of Funds Closed Aggregate Capital Raised ($bn)
Source: Preqin Private Equity Online
Year of Final Close
Fig. 33: Annual Asia-Based Venture Capital Fundraising, 2010 - 2017 YTD (As at August 2017)
77%
61%54% 52%
43%
31% 30% 29% 27%
5%
0%10%20%30%40%50%60%70%80%90%
Info
rmat
ion
Tech
nolo
gy
Hea
lthca
re
Tele
com
s, M
edia
&Co
mm
unic
atio
ns
Cons
umer
Dis
cret
iona
ry
Indu
stria
ls
Ener
gy &
Util
ities
Mat
eria
ls
Busi
ness
Ser
vice
s
Food
& A
gric
ultu
re
Real
Est
ate
Source: Preqin Private Equity Online
Prop
ortio
n of
Fun
d M
anag
ers
Fig. 34: Asia-Based Venture Capital Fund Managers’ Industry Preferences for Underlying Investments
55%
26%
9%
10% 1 Fund RaisedPreviously
2-3 Funds RaisedPreviously
4-5 Funds RaisedPreviously
6 or More FundsRaised Previously
Source: Preqin Private Equity Online
Fig. 36: Asia-Based Venture Capital Fund Managers by Number of Venture Capital Funds Raised Previously
7
14 1611
35
58
67
52
0
10
20
30
40
50
60
70
2010 2011 2012 2013 2014 2015 2016 2017YTD
Source: Preqin Private Equity Online
Aggr
egat
e D
eal V
alue
($bn
)
Fig. 35: Aggregate Value of Venture Capital Deals* in Asia, 2010 - 2017 YTD (As at August 2017)
Fig. 37: Five Largest Asia-Based Venture Capital Funds in Market (As at August 2017)
Fund Firm Headquarters Target Size (mn)
China State-Owned Capital Venture Investment Fund China Reform Fund Management China 200,000 CNY
Shanghai Integrated Circuit Investment Fund Shanghai Integrated Circuit Investment Fund China 50,000 CNY
Guangxi Beibu Gulf Industrial Investment Fund Guangxi Xijiang Venture Investment China 20,000 CNY
Baidu Capital Baidu Capital China 20,000 CNY
Next Orbit Ventures Fund II Next Orbit Ventures India 2,000 USD
Source: Preqin Private Equity Online
*Figures exclude add-ons, grants, mergers, secondary stock purchases and venture debt.
alternative assets. intelligent data.
19
DOWNLOAD DATA PACK: www.preqin.com/PEASIA17
GREATER CHINACHINA, HONG KONG, MACAU AND TAIWAN
19 30 22 17 31 30 13 9
184
272
194139
149 150
9742
0
10
20
30
40
50
60
0
50
100
150
200
250
300
350
2010 2011 2012 2013 2014 2015 2016 2017YTD
No. of Funds Closed (China)No. of Funds Closed (Rest of Greater China)Aggregate Capital Raised ($bn)
Source: Preqin Private Equity Online
No.
of F
unds
Clo
sed
Year of Final Close
Fig. 38: Annual Greater China-Based Private Equity & Venture Capital Fundraising, 2010 - 2017 YTD (As at August 2017)
26
17
42
64
7
25.9
7.0
48.3
56.6
4.2
0
10
20
30
40
50
60
70
Buyout Fund of Funds Growth Venture Capital Other
No. of Funds Raising Aggregate Capital Targeted ($bn)
Source: Preqin Private Equity Online
Fig. 39: Greater China-Based Private Equity & Venture Capital Funds in Market by Fund Type (As at August 2017)
Fig. 42: Five Largest Greater China-Based Private Equity & Venture Capital Fund Managers by Aggregate Capital Raised in the Last 10 Years (As at August 2017)
Firm Headquarters Primary Strategy Aggregate Capital Raised in Last 10 Years ($bn)
China Reform Fund Management China Venture Capital 20.2
China Aerospace Investment Holdings China Growth 17.1
Hony Capital China Buyout 10.9
RRJ Capital Hong Kong Buyout 10.3
CDH Investments China Growth 10.2
Source: Preqin Private Equity Online
5.8
11.8 13.4
7.1
22.4
43.7
56.7
34.3
0
10
20
30
40
50
60
2010 2011 2012 2013 2014 2015 2016 2017YTD
Source: Preqin Private Equity Online
Aggr
egat
e D
eal V
alue
($bn
)
Fig. 41: Aggregate Value of Venture Capital Deals* in Greater China, 2010 - 2017 YTD (As at August 2017)
9.7 9.611.4
13.6
23.5
28.1
10.38.3
0
5
10
15
20
25
30
2010 2011 2012 2013 2014 2015 2016 2017YTD
Source: Preqin Private Equity Online
Aggr
egat
e D
eal V
alue
($bn
)
Fig. 40: Aggregate Value of Private Equity-Backed Buyout Deals in Greater China, 2010 - 2017 YTD (As at August 2017)
Aggregate Capital Raised ($bn)
*Figures exclude add-ons, grants, mergers, secondary stock purchases and venture debt.

© Preqin Ltd. 2017 / www.preqin.com20
PREQIN SPECIAL REPORT: ASIAN PRIVATE EQUITY & VENTURE CAPITAL
NORTHEAST ASIAJAPAN AND SOUTH KOREA
22 22 2740
28 2617
9
5871
49
51
50
32
20
2012345678910
0102030405060708090
100
2010 2011 2012 2013 2014 2015 2016 2017YTD
No. of Funds Closed (Japan) No. of Funds Closed (South Korea)Aggregate Capital Raised ($bn)
Source: Preqin Private Equity Online
No.
of F
unds
Clo
sed
Year of Final Close
Fig. 43: Annual Northeast Asia-Based Private Equity & Venture Capital Fundraising, 2010 - 2017 YTD (As at August 2017)
6
1 1
15
22.5
0.5 0.1 0.6
2.5
0
2
4
6
8
10
12
14
16
Buyout Fund of Funds Growth Venture Capital Other
No. of Funds Raising Aggregate Capital Targeted ($bn)
Source: Preqin Private Equity Online
Fig. 44: Northeast Asia-Based Private Equity & Venture Capital Funds in Market by Fund Type (As at August 2017)
Fig. 47: Five Largest Northeast Asia-Based Private Equity & Venture Capital Fund Managers by Aggregate Capital Raised in the Last 10 Years (As at August 2017)
Firm Headquarters Primary Strategy Aggregate Capital Raised in Last 10 Years ($bn)
MBK Partners South Korea Buyout 8.4
JAFCO (Japan) Japan Venture Capital 4.3
Hahn & Company South Korea Buyout 3.2
Korea Development Bank South Korea Buyout 2.8
Unison Capital Japan Buyout 2.5
Source: Preqin Private Equity Online
0.1 0.2 0.3
0.7
4.8
2.6
1.5
1.9
0
1
2
3
4
5
2010 2011 2012 2013 2014 2015 2016 2017 YTD
Source: Preqin Private Equity Online
Aggr
egat
e D
eal V
alue
($bn
)
Fig. 46: Aggregate Value of Venture Capital Deals* in Northeast Asia, 2010 - 2017 YTD (As at August 2017)
7.2 7.1
10.08.8
12.4
9.9
15.6
6.0
0
2
4
6
8
10
12
14
16
2010 2011 2012 2013 2014 2015 2016 2017 YTD
Source: Preqin Private Equity Online
Aggr
egat
e D
eal V
alue
($bn
)
Fig. 45: Aggregate Value of Private Equity-Backed Buyout Deals in Northeast Asia, 2010 - 2017 YTD (As at August 2017)
Aggregate Capital Raised ($bn)
*Figures exclude add-ons, grants, mergers, secondary stock purchases and venture debt.
alternative assets. intelligent data.
21
DOWNLOAD DATA PACK: www.preqin.com/PEASIA17
ASEANINDONESIA, MALAYSIA, PHILIPPINES, SINGAPORE, THAILAND,
VIETNAM, BRUNEI, CAMBODIA, MYANMAR AND LAOS
12
3
13
24
13 15 18
7
4
1
7
6
5 4
8
2
0
1
2
3
4
5
0
5
10
15
20
25
30
35
2010 2011 2012 2013 2014 2015 2016 2017YTD
No. of Funds Closed (Rest of ASEAN)No. of Funds Closed (Singapore)Aggregate Capital Raised ($bn)
Source: Preqin Private Equity Online
No.
of F
unds
Clo
sed
Year of Final Close
Fig. 48: Annual ASEAN-Based Private Equity & Venture Capital Fundraising, 2010 - 2017 YTD (As at August 2017)
2 1
19
32
10.1 0.2
17.1
2.90.1
0
5
10
15
20
25
30
35
Buyout Fund of Funds Growth Venture Capital Other
No. of Funds Raising Aggregate Capital Targeted ($bn)
Source: Preqin Private Equity Online
Fig. 49: ASEAN-Based Private Equity & Venture Capital Funds in Market by Fund Type (As at August 2017)
Fig. 52: Five Largest ASEAN-Based Private Equity & Venture Capital Fund Managers by Aggregate Capital Raised in the Last 10 Years (As at August 2017)
Firm Headquarters Primary Strategy Aggregate Capital Raised in Last 10 Years ($bn)
Navis Capital Partners Malaysia Buyout 3.7
Axiom Asia Private Capital Singapore Fund of Funds 3.6
Northstar Group Singapore Buyout 2.1
Nalanda Capital Singapore PIPE 1.5
TAEL Partners Singapore Growth 1.3
Source: Preqin Private Equity Online
0.2 0.20.4
1.2
1.5 1.5
3.7
3.1
0
1
2
3
4
2010 2011 2012 2013 2014 2015 2016 2017YTD
Source: Preqin Private Equity Online
Aggr
egat
e D
eal V
alue
($bn
)
Fig. 51: Aggregate Value of Venture Capital Deals* in ASEAN, 2010 - 2017 YTD (As at August 2017)
3.8
6.7
2.4
6.1
16.3
7.9
5.8
1.7
0
2
4
6
8
10
12
14
16
18
2010 2011 2012 2013 2014 2015 2016 2017YTD
Source: Preqin Private Equity Online
Aggr
egat
e D
eal V
alue
($bn
)
Fig. 50: Aggregate Value of Private Equity-Backed Buyout Deals in ASEAN, 2010 - 2017 YTD (As at August 2017)
Aggregate Capital Raised ($bn)
*Figures exclude add-ons, grants, mergers, secondary stock purchases and venture debt.
© Preqin Ltd. 2017 / www.preqin.com22
PREQIN SPECIAL REPORT: ASIAN PRIVATE EQUITY & VENTURE CAPITAL
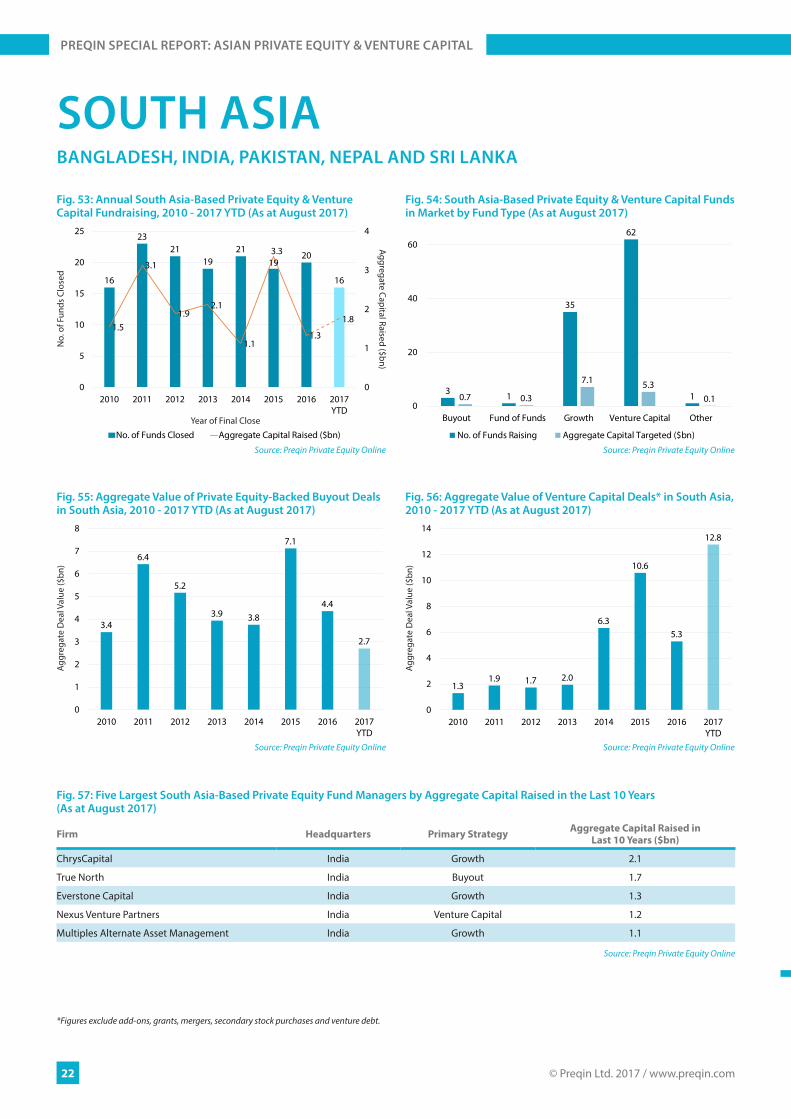
SOUTH ASIABANGLADESH, INDIA, PAKISTAN, NEPAL AND SRI LANKA
16
2321
1921
1920
16
1.5
3.1
1.92.1
1.1
3.3
1.3
1.8
0
1
2
3
4
0
5
10
15
20
25
2010 2011 2012 2013 2014 2015 2016 2017YTD
No. of Funds Closed Aggregate Capital Raised ($bn)
Source: Preqin Private Equity Online
No.
of F
unds
Clo
sed
Year of Final Close
Fig. 53: Annual South Asia-Based Private Equity & Venture Capital Fundraising, 2010 - 2017 YTD (As at August 2017)
3 1
35
62
10.7 0.3
7.1 5.30.1
0
20
40
60
Buyout Fund of Funds Growth Venture Capital Other
No. of Funds Raising Aggregate Capital Targeted ($bn)
Source: Preqin Private Equity Online
Fig. 54: South Asia-Based Private Equity & Venture Capital Funds in Market by Fund Type (As at August 2017)
Fig. 57: Five Largest South Asia-Based Private Equity Fund Managers by Aggregate Capital Raised in the Last 10 Years (As at August 2017)
Firm Headquarters Primary Strategy Aggregate Capital Raised in Last 10 Years ($bn)
ChrysCapital India Growth 2.1
True North India Buyout 1.7
Everstone Capital India Growth 1.3
Nexus Venture Partners India Venture Capital 1.2
Multiples Alternate Asset Management India Growth 1.1
Source: Preqin Private Equity Online
1.31.9 1.7 2.0
6.3
10.6
5.3
12.8
0
2
4
6
8
10
12
14
2010 2011 2012 2013 2014 2015 2016 2017YTD
Source: Preqin Private Equity Online
Aggr
egat
e D
eal V
alue
($bn
)
Fig. 56: Aggregate Value of Venture Capital Deals* in South Asia, 2010 - 2017 YTD (As at August 2017)
3.4
6.4
5.2
3.9 3.8
7.1
4.4
2.7
0
1
2
3
4
5
6
7
8
2010 2011 2012 2013 2014 2015 2016 2017YTD
Source: Preqin Private Equity Online
Aggr
egat
e D
eal V
alue
($bn
)
Fig. 55: Aggregate Value of Private Equity-Backed Buyout Deals in South Asia, 2010 - 2017 YTD (As at August 2017)
Aggregate Capital Raised ($bn)
*Figures exclude add-ons, grants, mergers, secondary stock purchases and venture debt.

Register for demo access to find out how Preqin’s Private Equity Online can help your business:
www.preqin.com/privateequity
Source new investors for funds
Identify new investment opportunities
Conduct competitor and market analysis
Find potential deal opportunities
Develop new business
alternative assets. intelligent data.
PREQIN
Alternative Assets Data & Intelligence
Preqin provides information, products and services to fund managers, investors, consultants and service providers across six main areas:
■ Investors – Allocations, Strategies/Plans and Current Portfolios ■ Fund Managers – Funds, Strategies and Track Records ■ Funds – Fundraising, Performance and Terms & Conditions ■ Deals/Exits – Portfolio Companies, Participants and Financials ■ Service Providers – Services Offered and Current Clients ■ Industry Contacts – Direct Contact Details for Industry Professionals
New York ■ London ■ Singapore ■ San Francisco ■ Hong Kong ■ Manila
PREQIN SPECIAL REPORT:ASIAN PRIVATE EQUITY & VENTURE CAPITAL
SEPTEMBER 2017
alternative assets. intelligent data.


