
PREQIN QUARTERLY UPDATE:PRIVATE EQUITY & VENTURE CAPITALQ1 2018Insight on the quarter from the leading provider of alternative assets data
Content includes:
FundraisingFunds in MarketInstitutional InvestorsBuyout Deals and ExitsVenture Capital DealsFund Performance and Dry Powder
We congratulate our clients on the successful
closing of their funds. Capstone is proud to be
associated with such an exclusive group.
Global private equity fundraisingCapstone Partners (www.csplp.com) is a leading independent placement agent focused on raising capital for private equity, credit, real assets and infrastructure firms. The Capstone team includes 35 experienced professionals in North America, Europe and Asia.
www.csplp.com
Americas — Europe — Middle East — Asia Pacific
Securities placed through CSP Securities, LPMember FINRA/SIPCAuthorised by FINMA CMS license holder from the MAS

© Preqin Ltd. 2017 / www.preqin.com3
PREQIN QUARTERLY UPDATE: PRIVATE EQUITY & VENTURE CAPITAL, Q1 2018
FOREWORD - Christopher Elvin, Preqin
In Q1 2018, 180 private equity funds reached a fi nal close raising an aggregate $80bn, the fi rst quarter since Q3 2016 in which capital commitments totalled less than $100bn. The fi rst quarter of each year typically sees a slowdown in fundraising activity following a fl urry
of fund closures at the end of the year; however, Q1 2018 saw the lowest number of funds closed in a fi ve-year period. Capital remains concentrated among the top managers: over half (59%) of capital raised in Q1 was secured by the 10 largest funds.
At the start of Q2 2018, there are a record 2,575 funds in market collectively targeting $844bn in capital commitments. Despite the variety of investment opportunities, fund manager and fund selection remains critical, and from a GP perspective, competition for investor capital remains fi erce. Fundraising has become even more competitive at the top end of the industry with the launch of two mega funds in Q1 2018: Sino-Singapore Connectivity Private Equity Fund, targeting $15.8bn, and Asian Institutional Investor Joint Overseas Investment Fund, targeting $15bn.
Strong fundraising and a challenging deal environment has resulted in dry powder levels reaching $1.09tn. Although private equity-backed buyout deal activity in Q1 was 6% lower in comparison to Q1 2017, deal value was 90% higher. No doubt deal value was buoyed by the merger of Keurig and Dr Pepper, valued at $21bn, and the takeover of the Financial and Risk Business of Thomson Reuters Corporation led by Blackstone Group, with participation from CPP Investment Board and GIC, valued at $17bn. Encouragingly, Q1 2018 marked an 11% increase in the number of venture capital-backed fi nancings compared to Q1 2017, and a 57% increase in deal value.
Buyout exit activity fell for the fi fth consecutive quarter, with 354 exits valued at an aggregate $52bn, representing the lowest quarterly number of exits since 2010. Despite this, investor appetite for private equity is still strong: with nearly $2.0tn in capital distributed since 2013, investors have more liquidity in their portfolios and the majority (59%) of those interviewed by Preqin at the end of 2017 planned to commit to four or more funds in the next 12 months.
We hope you fi nd this report useful and welcome any feedback you may have. For more information, please visit www.preqin.com or contact [email protected].
p4 Fundraising
p6 Funds in Market
p7 Institutional Investors
p8 Buyout Deals and Exits
p9 Venture Capital Deals
p10 Fund Performance and Dry Powder
All rights reserved. The entire contents of Preqin Quarterly Update: Private Equity & Venture Capital, Q1 2018 are the Copyright of Preqin Ltd. No part of this publication or any information contained in it may be copied, transmitted by any electronic means, or stored in any electronic or other data storage medium, or printed or published in any document, report or publication, without the express prior written approval of Preqin Ltd. The information presented in Preqin Quarterly Update: Private Equity & Venture Capital, Q1 2018 is for information purposes only and does not constitute and should not be construed as a solicitation or other off er, or recommendation to acquire or dispose of any investment or to engage in any other transaction, or as advice of any nature whatsoever. If the reader seeks advice rather than information then he should seek an independent fi nancial advisor and hereby agrees that he will not hold Preqin Ltd. responsible in law or equity for any decisions of whatever nature the reader makes or refrains from making following its use of Preqin Quarterly Update: Private Equity & Venture Capital, Q1 2018. While reasonable eff orts have been made to obtain information from sources that are believed to be accurate, and to confi rm the accuracy of such information wherever possible, Preqin Ltd. does not make any representation or warranty that the information or opinions contained in Preqin Quarterly Update: Private Equity & Venture Capital, Q1 2018 are accurate, reliable, up-to-date or complete. Although every reasonable eff ort has been made to ensure the accuracy of this publication Preqin Ltd. does not accept any responsibility for any errors or omissions within Preqin Quarterly Update: Private Equity & Venture Capital, Q1 2018 or for any expense or other loss alleged to have arisen in any way with a reader’s use of this publication.
4
DOWNLOAD DATA PACK: www.preqin.com/quarterlyupdate
FUNDRAISING
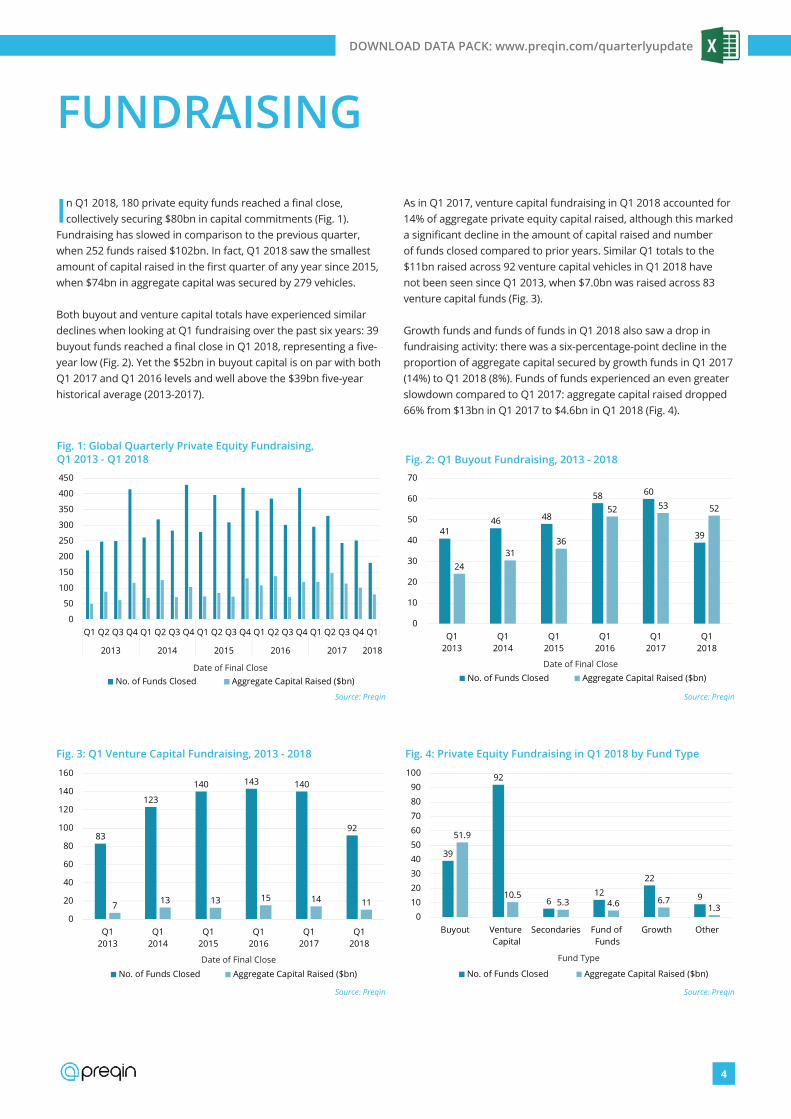
In Q1 2018, 180 private equity funds reached a fi nal close, collectively securing $80bn in capital commitments (Fig. 1).
Fundraising has slowed in comparison to the previous quarter, when 252 funds raised $102bn. In fact, Q1 2018 saw the smallest amount of capital raised in the fi rst quarter of any year since 2015, when $74bn in aggregate capital was secured by 279 vehicles.
Both buyout and venture capital totals have experienced similar declines when looking at Q1 fundraising over the past six years: 39 buyout funds reached a fi nal close in Q1 2018, representing a fi ve-year low (Fig. 2). Yet the $52bn in buyout capital is on par with both Q1 2017 and Q1 2016 levels and well above the $39bn fi ve-year historical average (2013-2017).
As in Q1 2017, venture capital fundraising in Q1 2018 accounted for 14% of aggregate private equity capital raised, although this marked a signifi cant decline in the amount of capital raised and number of funds closed compared to prior years. Similar Q1 totals to the $11bn raised across 92 venture capital vehicles in Q1 2018 have not been seen since Q1 2013, when $7.0bn was raised across 83 venture capital funds (Fig. 3).
Growth funds and funds of funds in Q1 2018 also saw a drop in fundraising activity: there was a six-percentage-point decline in the proportion of aggregate capital secured by growth funds in Q1 2017 (14%) to Q1 2018 (8%). Funds of funds experienced an even greater slowdown compared to Q1 2017: aggregate capital raised dropped 66% from $13bn in Q1 2017 to $4.6bn in Q1 2018 (Fig. 4).
0
50
100
150
200
250
300
350
400
450
Q1 Q2 Q3 Q4 Q1 Q2 Q3 Q4 Q1 Q2 Q3 Q4 Q1 Q2 Q3 Q4 Q1 Q2 Q3 Q4 Q1
2013 2014 2015 2016 2017 2018
No. of Funds Closed Aggregate Capital Raised ($bn)
Source: Preqin
Fig. 1: Global Quarterly Private Equity Fundraising, Q1 2013 - Q1 2018
4146 48
58 60
39
2431
36
52 53 52
0
10
20
30
40
50
60
70
Q12013
Q12014
Q12015
Q12016
Q12017
Q12018
No. of Funds Closed Aggregate Capital Raised ($bn)
Source: Preqin
Fig. 2: Q1 Buyout Fundraising, 2013 - 2018
83
123
140 143 140
92
7 13 13 15 14 11
0
20
40
60
80
100
120
140
160
Q12013
Q12014
Q12015
Q12016
Q12017
Q12018
No. of Funds Closed Aggregate Capital Raised ($bn)
Source: Preqin
Fig. 3: Q1 Venture Capital Fundraising, 2013 - 2018
39
92
612
22
9
51.9
10.55.3 4.6 6.7
1.30
10
20
30
40
50
60
70
80
90
100
Buyout Venture Capital
Secondaries Fund of Funds
Growth Other
No. of Funds Closed Aggregate Capital Raised ($bn)
Source: Preqin
Fig. 4: Private Equity Fundraising in Q1 2018 by Fund Type
Fund Type
Date of Final Close Date of Final Close
Date of Final Close

5
DOWNLOAD DATA PACK: www.preqin.com/quarterlyupdate
Thirty percent fewer North America-focused funds closed in Q1 2018 than in Q1 2017, and raised less than half ($32bn) the $67bn total secured in Q1 2017. Asia-focused funds experienced a 59% decrease in the number of funds closed in Q1 2018 compared to Q1 2017, and raised 83% less capital in total, securing just $4.8bn. Only Europe-focused funds raised more capital ($43bn) in Q1 2018, up 111% from Q1 2017 (Fig. 5).
Although fewer funds are closing, fundraising trends in Q1 2018 are still positive: of the 180 funds closed in Q1 2018, 82% achieved or exceeded their target size (Fig. 6), while time spent on the road has continuously decreased (Fig. 7). In fact, the largest fund closed in Q1 2018 – EQT VIII – raised €10.8bn in less than six months, exceeding its target of €8.0bn by 34% (Fig. 8).
11% 8% 6% 6% 4%
28%24% 22% 20%
18%18%
23%25% 26% 27%
30% 38%
23%23% 23% 28% 27%
25%
14% 20% 22% 18% 21% 18%
0%
10%
20%
30%
40%
50%
60%
70%
80%
90%
100%
2013 2014 2015 2016 2017 Q1 2018
125% or More
101-124%
100%
50-99%
Less than 50%
Source: Preqin
Prop
ortio
n of
Fun
ds C
lose
d
Fig. 6: Private Equity Funds Closed by Proportion of Target Size Achieved, 2013 - Q1 2018
15%26% 30% 26% 31%
46%14%
18% 15% 21%20%
21%
17%
15% 15% 14%17%
11%
26%
19% 18% 15%17%
18%28% 22% 22% 24%16%
4%
0%
10%
20%
30%
40%
50%
60%
70%
80%
90%
100%
2013 2014 2015 2016 2017 Q12018
More than 24 Months
19-24 Months
13-18 Months
7-12 Months
6 Months or Less
Source: Preqin
Prop
ortio
n of
Fun
ds C
lose
dFig. 7: Time Spent in Market by Private Equity Funds Closed in 2013 - Q1 2018
Fig. 8: Largest Private Equity Funds Closed in Q1 2018
Fund Firm Fund Size (mn) Fund Type Geographic Focus
EQT VIII EQT 10,750 EUR Buyout Europe
BC European Cap X BC Partners 7,000 EUR Buyout Europe
American Securities Partners VIII American Securities 7,000 USD Buyout North America
PAI Europe VII PAI Partners 5,000 EUR Buyout Europe
Equistone Partners Europe Fund VI Equistone Partners Europe 2,800 EUR Buyout Europe
Petershill Private Equity Goldman Sachs AIMS Private Equity 2,500 USD Growth North America
Sentinel Capital Partners VI Sentinel Capital Partners 2,150 USD Buyout North America
HarbourVest International Private Equity Partners VIII Partnership HarbourVest Partners 1,700 USD Fund of Funds Europe
Portfolio Advisors Secondary Fund III Portfolio Advisors 1,500 USD Secondaries North America
Newbury Equity Partners IV Newbury Partners 1,447 USD Secondaries North America
Source: Preqin
98
38 35
9
31.7
42.9
4.8 1.00
20
40
60
80
100
120
North America Europe Asia Rest of World
No. of Funds Closed Aggregate Capital Raised ($bn)
Source: Preqin
Primary Geographic Focus
Fig. 5: Private Equity Fundraising in Q1 2018 by Primary Geographic Focus
Date of Final Close Date of Final Close
© Preqin Ltd. 2017 / www.preqin.com6
PREQIN QUARTERLY UPDATE: PRIVATE EQUITY & VENTURE CAPITAL, Q1 2018
FUNDS IN MARKET
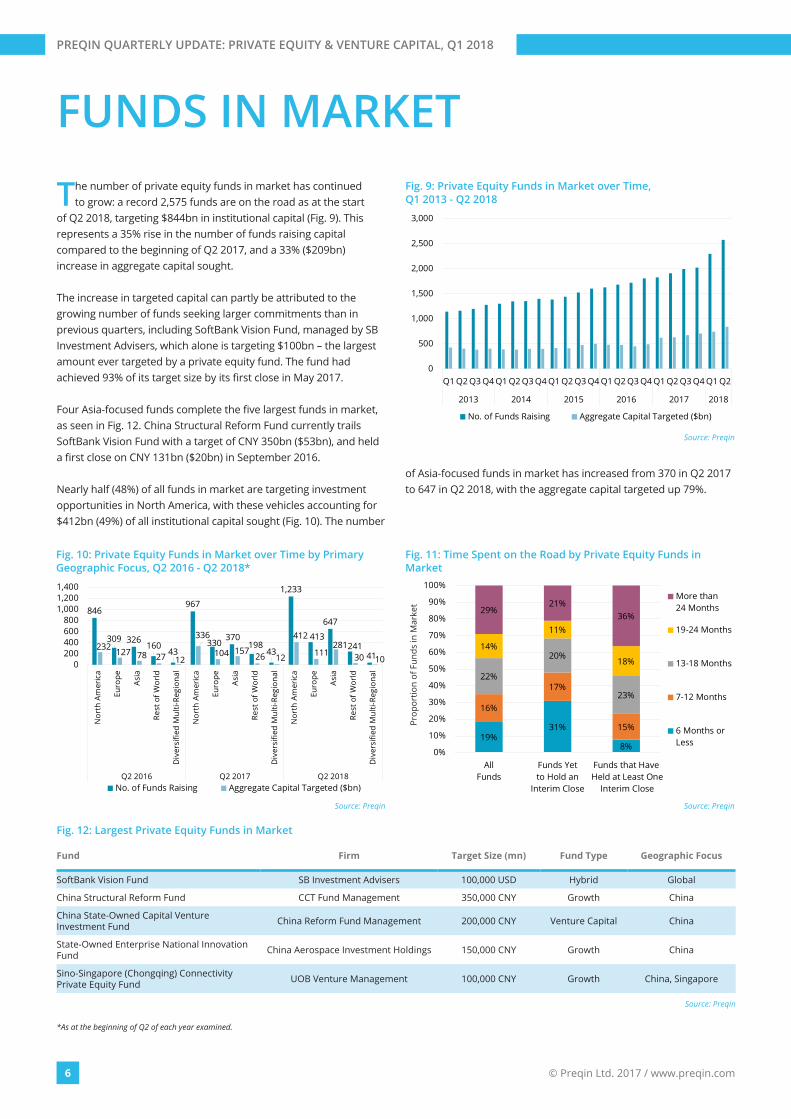
The number of private equity funds in market has continued to grow: a record 2,575 funds are on the road as at the start
of Q2 2018, targeting $844bn in institutional capital (Fig. 9). This represents a 35% rise in the number of funds raising capital compared to the beginning of Q2 2017, and a 33% ($209bn) increase in aggregate capital sought.
The increase in targeted capital can partly be attributed to the growing number of funds seeking larger commitments than in previous quarters, including SoftBank Vision Fund, managed by SB Investment Advisers, which alone is targeting $100bn – the largest amount ever targeted by a private equity fund. The fund had achieved 93% of its target size by its first close in May 2017.
Four Asia-focused funds complete the five largest funds in market, as seen in Fig. 12. China Structural Reform Fund currently trails SoftBank Vision Fund with a target of CNY 350bn ($53bn), and held a first close on CNY 131bn ($20bn) in September 2016.
Nearly half (48%) of all funds in market are targeting investment opportunities in North America, with these vehicles accounting for $412bn (49%) of all institutional capital sought (Fig. 10). The number
of Asia-focused funds in market has increased from 370 in Q2 2017 to 647 in Q2 2018, with the aggregate capital targeted up 79%.
0
500
1,000
1,500
2,000
2,500
3,000
Q1 Q2 Q3 Q4 Q1 Q2 Q3 Q4 Q1 Q2 Q3 Q4 Q1 Q2 Q3 Q4 Q1 Q2 Q3 Q4 Q1 Q2
2013 2014 2015 2016 2017 2018
No. of Funds Raising Aggregate Capital Targeted ($bn)
Source: Preqin
Fig. 9: Private Equity Funds in Market over Time, Q1 2013 - Q2 2018
846
309 326160
43
967
330370
19843
1,233
413
647
24141
232 127 78 27 12
336
104 15726 12
412
111281
30 100200400600800
1,0001,2001,400
Nor
th A
mer
ica
Euro
pe
Asia
Rest
of W
orld
Div
ersi
fied
Mul
ti-Re
gion
al
Nor
th A
mer
ica
Euro
pe
Asia
Rest
of W
orld
Div
ersi
fied
Mul
ti-Re
gion
al
Nor
th A
mer
ica
Euro
pe
Asia
Rest
of W
orld
Div
ersi
fied
Mul
ti-Re
gion
al
Q2 2016 Q2 2017 Q2 2018No. of Funds Raising Aggregate Capital Targeted ($bn)
Source: Preqin
Fig. 10: Private Equity Funds in Market over Time by Primary Geographic Focus, Q2 2016 - Q2 2018*
19%31%
8%
16%
17%
15%
22%
20%
23%
14%
11%
18%
29%21%
36%
0%
10%
20%
30%
40%
50%
60%
70%
80%
90%
100%
AllFunds
Funds Yetto Hold an
Interim Close
Funds that Have Held at Least One
Interim Close
More than24 Months
19-24 Months
13-18 Months
7-12 Months
6 Months orLess
Source: Preqin
Fig. 11: Time Spent on the Road by Private Equity Funds in Market
Prop
ortio
n of
Fun
ds in
Mar
ket
Fig. 12: Largest Private Equity Funds in Market
Fund Firm Target Size (mn) Fund Type Geographic Focus
SoftBank Vision Fund SB Investment Advisers 100,000 USD Hybrid Global
China Structural Reform Fund CCT Fund Management 350,000 CNY Growth China
China State-Owned Capital Venture Investment Fund China Reform Fund Management 200,000 CNY Venture Capital China
State-Owned Enterprise National Innovation Fund China Aerospace Investment Holdings 150,000 CNY Growth China
Sino-Singapore (Chongqing) Connectivity Private Equity Fund UOB Venture Management 100,000 CNY Growth China, Singapore
Source: Preqin
*As at the beginning of Q2 of each year examined.

7
DOWNLOAD DATA PACK: www.preqin.com/quarterlyupdate
INSTITUTIONAL INVESTORS
6% 10% 7% 9%
22%28% 36% 32%
47%
49% 42% 43%
26%13% 15% 17%
0%
10%
20%
30%
40%
50%
60%
70%
80%
90%
100%
Q1 2015 Q1 2016 Q1 2017 Q1 2018
10 Funds or More
4-9 Funds
2-3 Funds
1 Fund
Source: Preqin
Prop
ortio
n of
Fun
d Se
arch
es
Fig. 16: Number of Private Equity Funds Investors Plan to Commit to in the Next 12 Months, Q1 2015 - Q1 2018
39% 41%49%
37%
11%17% 5%
18%
27%20%
18%24%
14% 12%15%
9%
8% 9% 12% 12%
0%
10%
20%
30%
40%
50%
60%
70%
80%
90%
100%
Q1 2015 Q1 2016 Q1 2017 Q1 2018
$600mn or More
$300-599mn
$100-299mn
$50-99mn
Less than $50mn
Source: Preqin
Prop
ortio
n of
Fun
d Se
arch
es
Fig. 15: Amount of Capital Investors Plan to Commit to Private Equity Funds in the Next 12 Months, Q1 2015 - Q1 2018
70%
49%
43%
15% 13%12%
3%
64%
39%35%
28%
17%
6% 9%
67%
47% 43%
29%22%
9%10%
70%
52%49%
13%14%
8%14%
0%
10%
20%
30%
40%
50%
60%
70%
80%
Buyo
ut
Vent
ure
Capi
tal
Gro
wth
Fund
of F
unds
Seco
ndar
ies
Turn
arou
nd
Oth
erPr
ivat
e Eq
uity
*
Q1 2015
Q1 2016
Q1 2017
Q1 2018
Source: Preqin
Prop
ortio
n of
Fun
d Se
arch
es
Fig. 13: Strategies Targeted by Private Equity Investors in the Next 12 Months, Q1 2015 - Q1 2018
Strategy Targeted
68%64%
35%
14%
29%35%
47%
56%
25%
7%
19%
43%43% 39%
15%
6%11%
52%49% 51%
28%
7%
15%
48%
0%
10%
20%
30%
40%
50%
60%
70%
80%
Nor
thAm
eric
a
Euro
pe
Asia
-Pa
cific
Rest
of
Wor
ld
Emer
ging
Mar
kets
Glo
bal
Q1 2015
Q1 2016
Q1 2017
Q1 2018
Source: Preqin
Prop
ortio
n of
Fun
d Se
arch
es
Fig. 14: Regions Targeted by Private Equity Investors in the Next 12 Months, Q1 2015 - Q1 2018
Region Targeted
Buyout, venture capital and growth remain the most targeted private equity strategies among institutional investors in Q1
2018, as seen in Fig. 13. Moreover, in Q1 2018, a greater proportion of investors with active mandates searched for these strategies than in previous years, while investor appetite for funds of funds and turnaround vehicles has declined to 13% and 8% respectively.
The proportion of mandates targeting other private equity fund types (including balanced, co-investment and direct secondaries) has steadily grown in recent years. Record levels of dry powder combined with higher valuations in traditional private equity strategies may be driving investors to further diversify their traditional private equity portfolios.
The majority (51%) of institutional investors are planning to target Europe in the coming year, followed closely by North America (49%)
and global-focused funds (48%, Fig. 14). Asia-Pacifi c has seen the largest year-on-year increase in appetite, with 28% of investors targeting the region in Q1 2018 compared to 15% in Q1 2017. While all single markets witnessed increased investor appetite in Q1 2018, fewer investors are targeting global-focused opportunities than one year ago.
The largest proportion (42%) of investors are planning to commit $50-299mn to private equity over the next 12 months, compared to 23% of investors in Q1 2017 (Fig. 15). The proportion of investors planning to commit less than $50mn or more than $600mn has remained relatively on par with historical averages (42% and 10% respectively). Since Q1 2015 there have been fewer investors seeking four or more fund commitments and a greater proportion of investors seeking 2-3 fund commitments, perhaps suggesting an increase in ticket sizes (Fig. 16).
*Other Private Equity includes balanced, co-Investment, co-Investment multi-manager and direct secondaries funds.
© Preqin Ltd. 2017 / www.preqin.com8
PREQIN QUARTERLY UPDATE: PRIVATE EQUITY & VENTURE CAPITAL, Q1 2018
BUYOUT DEALS AND EXITS
0
20
40
60
80
100
120
Q1 Q2 Q3 Q4 Q1 Q2 Q3 Q4 Q1 Q2 Q3 Q4 Q1 Q2 Q3 Q4 Q1
2014 2015 2016 2017 2018
North America Europe Asia Rest of World
Source: Preqin
Fig. 18: Aggregate Value of Private Equity-Backed Buyout Deals by Region, Q1 2014 - Q1 2018
Aggr
egat
e D
eal V
alue
($bn
)
xx
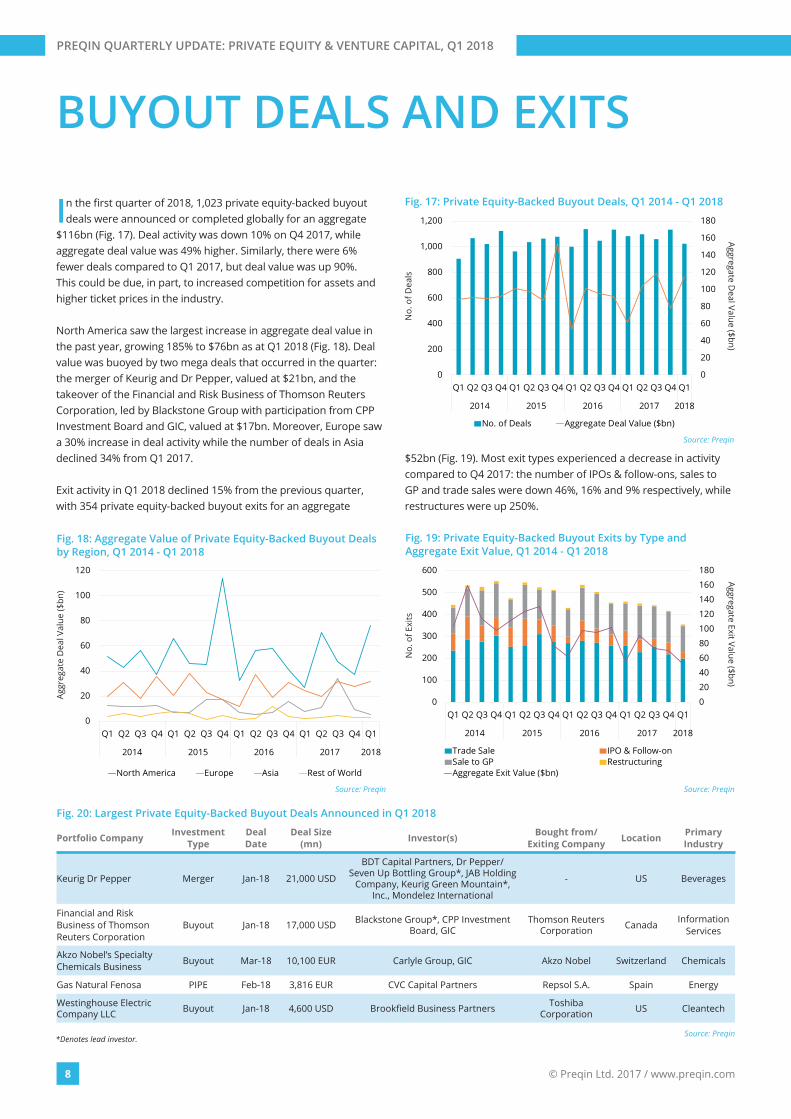
In the fi rst quarter of 2018, 1,023 private equity-backed buyout deals were announced or completed globally for an aggregate
$116bn (Fig. 17). Deal activity was down 10% on Q4 2017, while aggregate deal value was 49% higher. Similarly, there were 6% fewer deals compared to Q1 2017, but deal value was up 90%. This could be due, in part, to increased competition for assets and higher ticket prices in the industry.
North America saw the largest increase in aggregate deal value in the past year, growing 185% to $76bn as at Q1 2018 (Fig. 18). Deal value was buoyed by two mega deals that occurred in the quarter: the merger of Keurig and Dr Pepper, valued at $21bn, and the takeover of the Financial and Risk Business of Thomson Reuters Corporation, led by Blackstone Group with participation from CPP Investment Board and GIC, valued at $17bn. Moreover, Europe saw a 30% increase in deal activity while the number of deals in Asia declined 34% from Q1 2017.
Exit activity in Q1 2018 declined 15% from the previous quarter, with 354 private equity-backed buyout exits for an aggregate
$52bn (Fig. 19). Most exit types experienced a decrease in activity compared to Q4 2017: the number of IPOs & follow-ons, sales to GP and trade sales were down 46%, 16% and 9% respectively, while restructures were up 250%.
0
20
40
60
80
100
120
140
160
180
0
200
400
600
800
1,000
1,200
Q1 Q2 Q3 Q4 Q1 Q2 Q3 Q4 Q1 Q2 Q3 Q4 Q1 Q2 Q3 Q4 Q1
2014 2015 2016 2017 2018
No. of Deals Aggregate Deal Value ($bn)
Source: Preqin
Fig. 17: Private Equity-Backed Buyout Deals, Q1 2014 - Q1 2018
No.
of D
eals
Fig. 20: Largest Private Equity-Backed Buyout Deals Announced in Q1 2018
Portfolio Company Investment Type
Deal Date
Deal Size (mn) Investor(s) Bought from/
Exiting Company Location Primary Industry
Keurig Dr Pepper Merger Jan-18 21,000 USD
BDT Capital Partners, Dr Pepper/Seven Up Bottling Group*, JAB Holding
Company, Keurig Green Mountain*, Inc., Mondelez International
- US Beverages
Financial and Risk Business of Thomson Reuters Corporation
Buyout Jan-18 17,000 USD Blackstone Group*, CPP Investment Board, GIC
Thomson Reuters Corporation Canada Information
Services
Akzo Nobel’s Specialty Chemicals Business Buyout Mar-18 10,100 EUR Carlyle Group, GIC Akzo Nobel Switzerland Chemicals
Gas Natural Fenosa PIPE Feb-18 3,816 EUR CVC Capital Partners Repsol S.A. Spain Energy
Westinghouse Electric Company LLC Buyout Jan-18 4,600 USD Brookfi eld Business Partners Toshiba
Corporation US Cleantech
Source: Preqin
0
20
40
60
80
100
120
140
160
180
0
100
200
300
400
500
600
Q1 Q2 Q3 Q4 Q1 Q2 Q3 Q4 Q1 Q2 Q3 Q4 Q1 Q2 Q3 Q4 Q1
2014 2015 2016 2017 2018
Trade Sale IPO & Follow-onSale to GP RestructuringAggregate Exit Value ($bn)
Source: Preqin
Aggregate Exit Value ($bn)
No.
of E
xits
Fig. 19: Private Equity-Backed Buyout Exits by Type and Aggregate Exit Value, Q1 2014 - Q1 2018
Aggregate Deal Value ($bn)
*Denotes lead investor.

9
DOWNLOAD DATA PACK: www.preqin.com/quarterlyupdate
VENTURE CAPITAL DEALS
Fig. 24: Largest Venture Capital Deals* in Q1 2018
Portfolio Company Stage Deal Date
Deal Size (mn) Investor(s) Location Primary
Industry
Go-Jek Indonesia Series E/Round 5 Feb-18 1,500 USD
Astra International, BlackRock, Google Inc., JD.com, KKR, Meituan-Dianping, Samsung Venture Investment Corporation, Temasek Holdings, Tencent**, Warburg
Pincus
Indonesia Business Services
Ping An Healthcare Administration Co., Ltd. Series A/Round 1 Feb-18 1,150 USD IDG Capital, SB Investment Advisers, SBI Holdings China Software
Mobike Ltd. Unspecifi ed Round Jan-18 1,000 USD - China Telecoms
Ofo Bicycle Series E/Round 5 Mar-18 866 USD Alibaba Group**, Ant Financial Service Group, Haofeng Group, Junli Capital, Tianhe Capital China Telecoms
Katerra Inc. Series D/Round 4 Jan-18 865 USD
CPP Investment Board, DFJ Growth, DivcoWest, Foxconn Ventures, Greenoaks Capital, Khosla Ventures, Navitas Capital, SB Investment Advisers**, Soros Fund
Management, Tavistock Group
US Software
Source: Preqin
0
500
1,000
1,500
2,000
2,500
3,000
3,500
4,000
Q1 Q2 Q3 Q4 Q1 Q2 Q3 Q4 Q1 Q2 Q3 Q4 Q1 Q2 Q3 Q4 Q1
2014 2015 2016 2017 2018
North America Europe Greater China
India Israel Other
Source: Preqin
Fig. 22: Venture Capital Deals* by Region, Q1 2014 - Q1 2018
5%
35%
1%1%1%
29%
14%
7%4% 4%
Add-on & Other
Angel/Seed
Grant
Growth Capital/Expansion
PIPE
Series A/Round 1
Series B/Round 2
Series C/Round 3
Series D/Round 4 and Later
Venture Debt
Source: Preqin
Fig. 23: Venture Capital Deals in Q1 2018 by Stage
In Q1 2018, 3,269 venture capital fi nancings were announced globally – an 11% increase from the 2,940 deals seen in Q1 2017
(Fig. 21). Moreover, Q1 2018 was up 57% in aggregate deal value from one year ago, recording the highest quarterly fi gure for Q1 since 2007, with deal value increasing from $32bn in Q1 2017 to $51bn in Q1 2018. Several large deals in the quarter helped achieve this, notably Go-Jek Indonesia’s $1.5bn fi nancing and Ping An Healthcare Administration Co., Ltd.’s $1.2bn fundraising round.
North American venture capital deals accounted for the largest proportion (35%) of deals globally in Q1 2018, with 1,143 deals valued at $22bn, the highest Q1 deal value since 2007 (Fig. 22). China-based deals followed closely behind, with 971 venture capital fi nancings for an aggregate $18bn, and Europe-based deal-makers had another consistent quarter, with 567 deals for an aggregate $5.6bn. However, deal activity in Israel and India has declined by 7% and 12% respectively compared to Q1 2017.
Angel/seed fi nancings remain the most prominent investment stage, representing 35% of deals in Q1 2018 (Fig. 23). This is
followed by Series A/Round 1 (29%) and Series B/Round 2 (14%) fi nancings, with Q1 2018 recording the largest proportion of Series A fi nancings since Q2 2008, and the average value of Series A deals having increased 92% from Q1 2017.
0
10
20
30
40
50
60
0
500
1,000
1,500
2,000
2,500
3,000
3,500
4,000
Q1 Q2 Q3 Q4 Q1 Q2 Q3 Q4 Q1 Q2 Q3 Q4 Q1 Q2 Q3 Q4 Q1
2014 2015 2016 2017 2018
No. of Deals Aggregate Deal Value ($bn)
Source: Preqin
No.
of D
eals
Fig. 21: Venture Capital Deals*, Q1 2014 - Q1 2018
No.
of D
eals
Aggregate Deal Value ($bn)
*Figures exclude add-ons, mergers, grants, secodary stock purchases and venture debt.**Denotes lead investor.
© Preqin Ltd. 2017 / www.preqin.com10
PREQIN QUARTERLY UPDATE: PRIVATE EQUITY & VENTURE CAPITAL, Q1 2018
FUND PERFORMANCE ANDDRY POWDER
-200
-100
0
100
200
300
400
500
600
2000
2001
2002
2003
2004
2005
2006
2007
2008
2009
2010
2011
2012
2013
2014
2015
2016
H1
2017
Capital Called up ($bn) Capital Distributed ($bn) Net Cash Flow ($bn)
Source: Preqin
Fig. 27: Private Equity: Annual Amount Called up, Distributed and Net Cash Flow, 2000 - H1 2017
0
100
200
300
400
500
600
700
800
900
1,000
1,100
Dec
-07
Dec
-08
Dec
-09
Dec
-10
Dec
-11
Dec
-12
Dec
-13
Dec
-14
Dec
-15
Dec
-16
Dec
-17
Mar
-18
Growth
Buyout
Venture Capital
Other PrivateEquity*
Source: Preqin
Dry
Pow
der
($bn
)
Fig. 28: Private Equity Dry Powder by Fund Type, 2007 - 2018
0%
5%
10%
15%
20%
25%
1 Yearto Jun-17
3 Yearsto Jun-17
5 Yearsto Jun-17
10 Yearsto Jun-17
Private Equity
Buyout
Venture Capital
Fund of Funds
Source: Preqin
Annu
aliz
ed R
etur
n
Fig. 25: Private Equity: Horizon IRRs by Fund Type(As at June 2017)
0%
5%
10%
15%
20%
25%
2000
2001
2002
2003
2004
2005
2006
2007
2008
2009
2010
2011
2012
2013
2014
2015
Top Quartile NetIRR Boundary
Median Net IRR
Bottom QuartileNet IRR Boundary
Source: Preqin
Net
IRR
sinc
e In
cept
ion
Vintage Year
Fig. 26: Private Equity: Median Net IRRs and Quartile Boundaries by Vintage Year
*Other Private Equity includes balanced, co-Investment, co-Investment multi-manager, direct secondaries and turnaround funds.
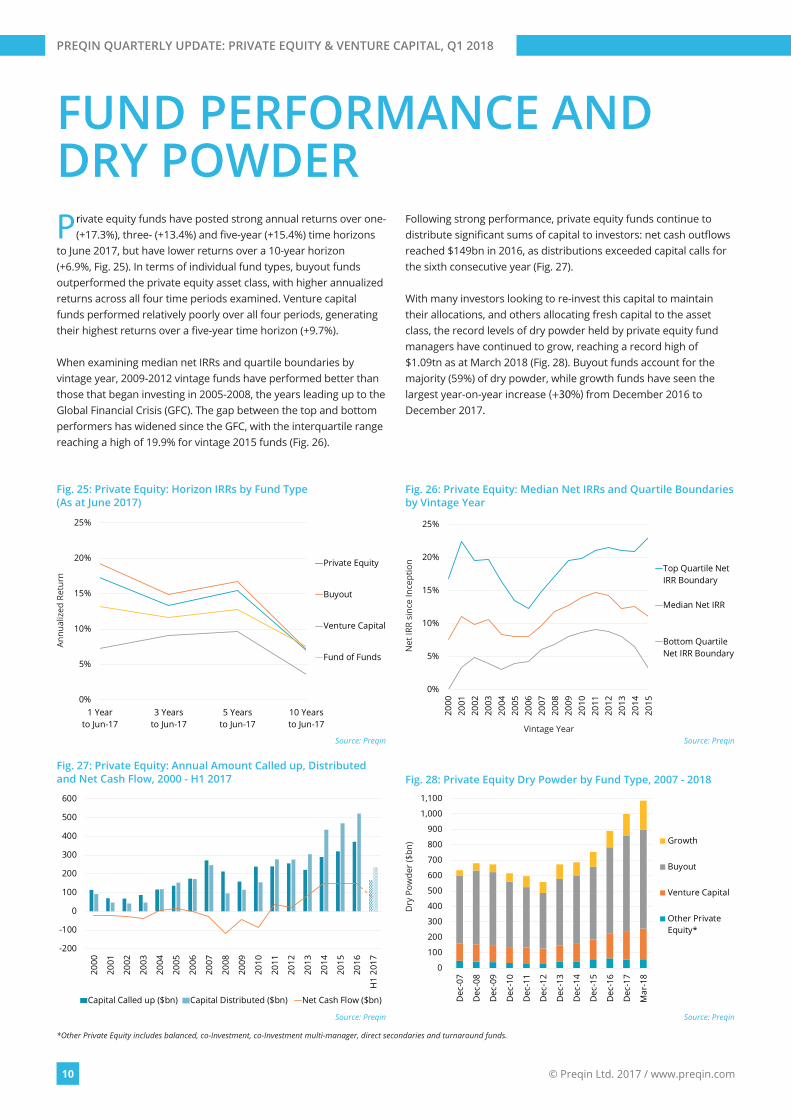
Private equity funds have posted strong annual returns over one- (+17.3%), three- (+13.4%) and fi ve-year (+15.4%) time horizons
to June 2017, but have lower returns over a 10-year horizon (+6.9%, Fig. 25). In terms of individual fund types, buyout funds outperformed the private equity asset class, with higher annualized returns across all four time periods examined. Venture capital funds performed relatively poorly over all four periods, generating their highest returns over a fi ve-year time horizon (+9.7%).
When examining median net IRRs and quartile boundaries by vintage year, 2009-2012 vintage funds have performed better than those that began investing in 2005-2008, the years leading up to the Global Financial Crisis (GFC). The gap between the top and bottom performers has widened since the GFC, with the interquartile range reaching a high of 19.9% for vintage 2015 funds (Fig. 26).
Following strong performance, private equity funds continue to distribute signifi cant sums of capital to investors: net cash outfl ows reached $149bn in 2016, as distributions exceeded capital calls for the sixth consecutive year (Fig. 27).
With many investors looking to re-invest this capital to maintain their allocations, and others allocating fresh capital to the asset class, the record levels of dry powder held by private equity fund managers have continued to grow, reaching a record high of $1.09tn as at March 2018 (Fig. 28). Buyout funds account for the majority (59%) of dry powder, while growth funds have seen the largest year-on-year increase (+30%) from December 2016 to December 2017.
BE SEENby thousands of investors and decision-makers around the world
CONTRIBUTEto industry benchmarks and help further research into this area
ENSUREthat the data we hold for your fi rm and funds is correct
REASONS TOCONTRIBUTE DATA
Contributing data is free and simple. For more information, please visit:
www.preqin.com/sharedata
GENERATEincoming leads from industry professionals seeing your profi le
More than 60,000 alternative assets professionals rely on our global data, tools, insights and intelligence to achieve their objectives:
■ Investors: asset allocation, manager selection and portfolio management ■ Fund managers: fundraising, portfolio monitoring and investor relations ■ Service providers and advisors: business development and in-depth market knowledge ■ The wider alternative assets industry: insight, understanding and information
New York ■ London ■ Singapore ■ San Francisco ■ Hong Kong ■ Manila ■ Guangzhou
PREQIN QUARTERLY UPDATE:PRIVATE EQUITY & VENTURE CAPITALQ1 2018


