A proposal to correct errors and discontinuity, add web metrics, instruct client in the uses of web analytics through an instruction manual, and
directly teach its uses for the downtownyogashala.com web page.
Prepared for
Veronica Cruz 450 South First Street
San José, CA 95113
May 20, 2011
Prepared by Team SAP
One Washington Square MH 208
San José, CA 95192-0249
408-924-5060

Team SAP’s Development Managers One Washington Square MH 208 San José, CA 95192-0249 May 20, 2011 Veronica Cruz 450 South First Street San José, CA 95113 Dear Veronica Cruz: Thank you for providing the members of Team SAP, Alvin Alindogan, Peter Brookfield, Mitchell Ong, Cameron Taslim, Daniel Winsor, and myself, Megan Chan, the opportunity to work on your company’s webpage. We want to incorporate Google Analytics™ and fix the errors that were previously created during the development of your webpage. Google Analytics™ will give your company feedback about who is visiting your webpage and how you can cater your business to them. By fixing the errors on your page, your webpage will appear more professional and easier to follow. We will also be instructing your webpage handler and you to be able to access Google Analytics™ so that you may use the information for your business purposes. We plan on incorporating everything onto your webpage by dividing up the work evenly amongst our team. Our internal control will allow us to monitor and make sure that your webpage’s changes will be completed on time. Our external control will contact you in the event that more information or when final decisions need to be made as well as keep you up to date with what our team has completed. We have enjoyed working with your team and are looking forward to working with you on this exciting and important project. We hope this proposal will meet your business, technology, quality, and budgetary objectives, and can assure you that we are committed to delivering the highest value to Downtown Yoga Shala. We look forward to hearing your response to this proposal by May 20, 2011. Please feel free to call me at any day before 5:30pm (408-924-5060) if you have any questions.
Sincerely, Team SAP’s Development Managers

A proposal to correct errors and discontinuity, add web metrics, instruct client in the uses of web analytics through an instruction manual, and
directly teach its uses for the downtownyogashala.com web page. by Team SAP
Abstract Improvements needed to be made to the downtownyogashala.com website that would enable users to easily navigate the website’s pages and measure the website’s internet traffic. The navigation issue was addressed by correcting errors found within the Instructors page and Class Description page pertaining to extraneous information. Adjustments were made to the code that would allow only specific information to show on the screen as each instructor name or class description was clicked on. The internet traffic issue was addressed by employing Google Analytics™!, a tool used in optimizing web usage by providing an analysis of a website’s traffic. Additionally, a Google Analytics™ instruction manual was created to be used as a reference. (112)
Yoga Shala Google Analytics™ Team SAP
May 20, 2011 Page 5 of 75
Table of Contents Project Contact Information ...................................................................................6!Our Understanding ................................................................................................7!
Business Context ...............................................................................................7!Key Objectives ...................................................................................................8!Our SCOPE........................................................................................................8!History ..............................................................................................................10!Product and Service Offering ...........................................................................10!Functionally complete ......................................................................................11!
Methodology ........................................................................................................12!Discovery..........................................................................................................12!Definition ..........................................................................................................14!Design ..............................................................................................................16!Development ....................................................................................................18!Deployment ......................................................................................................20!
Appendix A: Annotated Bibliography ...................................................................22!Appendix B: Works Cited.....................................................................................27!Appendix C: Gantt Chart......................................................................................28!Appendix D: Progress Reports ............................................................................30!
Phase I: Discovery ...........................................................................................30 Phase II: Definition ...........................................................................................32!Phase III: Design..............................................................................................33!Phase IV: Development ...................................................................................34!Phase V: Deployment ......................................................................................35
Appendix E: Google Analytics™ Book.................................................................36
Yoga Shala Google Analytics™ Team SAP
May 20, 2011 Page 6 of 75
Project Contact Information
Team SAP One Washington Square MH 208 San José, CA 95192-0249 408-924-5060
Yoga Shala Veronica Cruz Founder and Owner 450 South First Street San José, CA 95113 (408)885-1000 [email protected]
Megan Chan Phase IV: Development Manager Alvin Alindogan Phase IV: Development Manager Peter Brookfield Phase V: Deployment Manager Mitchell Ong Phase III: Design Manager Cameron Taslim Phase II: Definition Manager Daniel Winsor Phase I: Discovery Manager
San José State University Computer Science Dept. One Washington Square MQH 208 San José, CA 95192-0249 (408)924-5060 (408)924-5062 [email protected]

Yoga Shala Google Analytics™ Team SAP
May 20, 2011 Page 7 of 75
Our Understanding
Business Context Yoga Shala is located in scenic downtown San José in order to spread the message of yoga to the busy hustle and bustle of the residents of the city. As of recently, the company has had a revolving door of customers where new customers will participate in only a few sessions of yoga before moving on to a new yoga center. There are currently only a few returning customers that have stayed to participate on a regular basis at Yoga Shala. The main option to keep this from happening is to provide the customers with a clearer understanding of what classes are available and to keep classes that the customers would want.
The owner, Veronica Cruz, has decided that her first directive should be to complete her business webpage; which, originally looked like a blog rather than an official and professional webpage. As of fall 2010, her webpage for Yoga Shala, downtownyogashala.com was given a new look with its style completely redone and photographs updated. The current direction she would like to go is to get more people to “like” Yoga Shala on Facebook™. While this is an important aspect in getting feedback from her customers, it is much more important that she should get feedback from her customer base through her webpage by monitoring what pages are actually read by her customers. Ms. Cruz would like to encourage more people to join her Facebook™ page for Yoga Shala by: 1. increasing the size of the link of Facebook™ on her webpage; and 2. by spreading the news of the Facebook™ page to her customers. She believes by increasing the number of people who join Facebook™, she will be able to get feedback, spread the knowledge of her classes, and increase her regular customer flow.

Yoga Shala Google Analytics™ Team SAP
May 20, 2011 Page 8 of 75
Key Objectives 10 Key Objectives: 1. Incorporate Google Analytics™ to webpage 2. Correct misspelled words 3. Correct links to photos 4. Correct classes error 5. Complete instructors page 6. Create manual on Google Analytics™ 7. Make larger Facebook™ link 8. Edit thumbnails of pictures so that they show the image at a good quality. 9. Ask about newsletter and possible implementation onto webpage rather than
on long email 10. Train Veronica on Google Analytics™
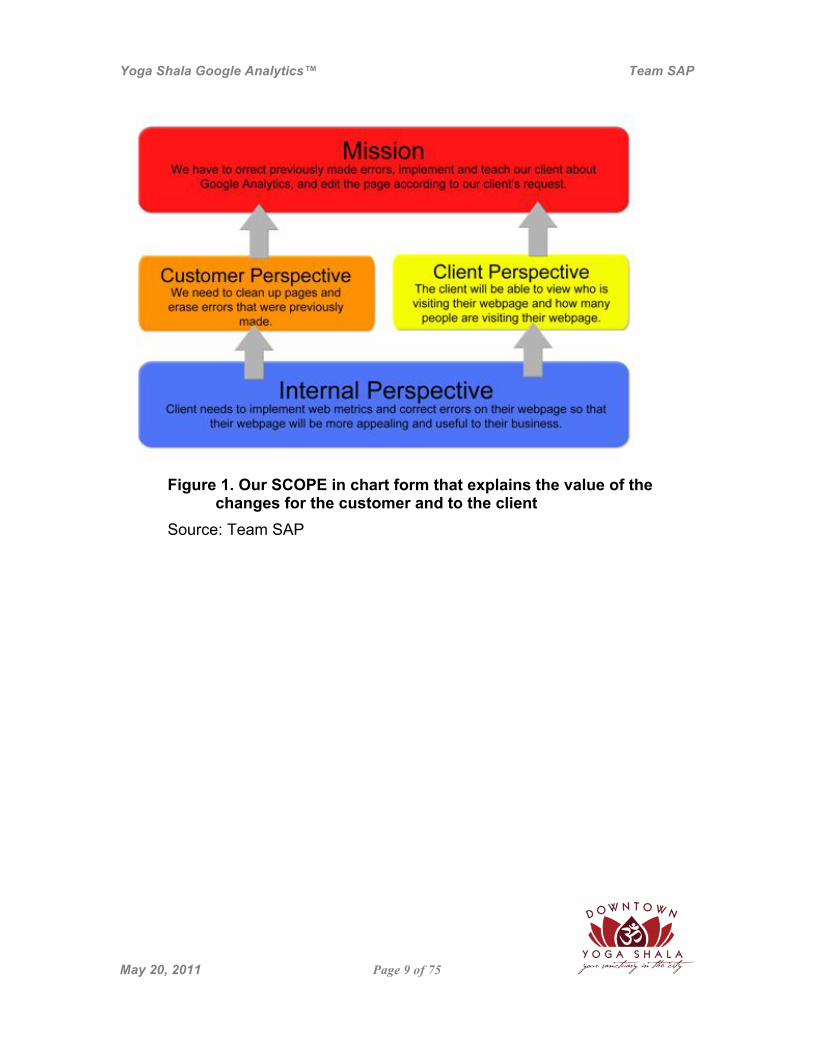
Our SCOPE Our main objectives of this project are to correct previously made errors, implement and teach our client about Google Analytics™, and edit the page according to our client’s request. We will complete these tasks within the time allotted, which is the equivalent of a four month time frame. Our team will not cover fixing the newsletter, helping the client with menial tasks such as their email, helping run their business, and various other tasks that were not described above. We will not be able to fix or create more complex programs due to their nature being out of our knowledge and time range. We will not have enough time to create each part during this time or have the resources to complete them in a timely fashion. Also, we were not given this task in order to fix client-side errors in their business. Figure 1, page 9, illustrates our project’s objectives.
Yoga Shala Google Analytics™ Team SAP
May 20, 2011 Page 9 of 75
Figure 1. Our SCOPE in chart form that explains the value of the
changes for the customer and to the client Source: Team SAP
Yoga Shala Google Analytics™ Team SAP
May 20, 2011 Page 10 of 75
Company Information
History Downtown Yoga Shala is a place where people can find classes for yoga within the busy hustle and bustle of Downtown San José. It has provided many classes to yoga enthusiasts who are willing to support their yoga journey. In addition to that, Downtown Yoga Shala is also committed to supporting local non-profit and charity organizations through donation-based classes. The company was founded by Veronica Cruz who is the owner of Downtown Yoga Shala.
Product and Service Offering Downtown Yoga Shala offers yoga classes that are popular with their clients. They offer different types of yoga classes that customers can choose from such as heated yoga, restorative yoga, and Tibetan meditation yoga. Along with that, they acknowledge that customers need to be connected with their instructor. With that in mind, they hired many excellent instructors to choose from to suit the needs of their customers. All events are wheelchair and handicap accessible.
• Various classes and instructors • Restorative: Through restorative postures, revitalize your body and mind without
extensive techniques. This class is wonderful for all individuals and is recommended to be done at least once a week to fully experience the benefits.
• Yin: To fully cultivate the body, more than just the muscles need to be tended to. Yin yoga focuses on deeper tissues using longer techniques and is wonderful for stress relief or as an addition to an active exercise.
• Yoga for Athletes: Athletes can also benefit from the calming and restorative effects of yoga. This class, working on the core, flexibility and alignment, is specifically designed for any athlete regardless of what activity they do.
o Veronica Cruz: Veronica founded Downtown Yoga Shala after living in Kathmandu, Nepal as a child. She originally had a very successful career but found true happiness in helping others understand and cultivate the practice of yoga.
o Nimmi Kovvali: Nimmi has been practicing yoga since she was young and now uses her knowledge to teach others. She believes strongly in the idea of nonviolence and sets her classes to music so that students can experience a deeper level of practice.
• Discounts and gift cards
Downtown Yoga Shala offers various discounts for students and faculty, seniors (60 years and over), military personnel, employees of the City of San José and downtown businesses. Gift cards are available if customers would like to give other people the gift of yoga. Gift cards vary from $25 to $200.
• Private/semi private Sessions If desired, they offer private/semi private sessions with the instructor for the customer.
• Special Events
During the month occasional special events are held where members are able to come and meet with instructors and meet other yoga enthusiasts.
Yoga Shala Google Analytics™ Team SAP
May 20, 2011 Page 11 of 75
• Free parking
Downtown Yoga Shala will validate 2 hour free parking to customers who take at least one class session.
Functionally complete In addition to our yoga product base, Downtown Yoga Shala offerings consist of:
1. Meeting other yoga enthusiasts 2. Relaxation and meditation 3. Learning from well known yoga teachers 4. Special events where customers meet famous yogis and clients
Yoga Shala Google Analytics™ Team SAP
May 20, 2011 Page 12 of 75
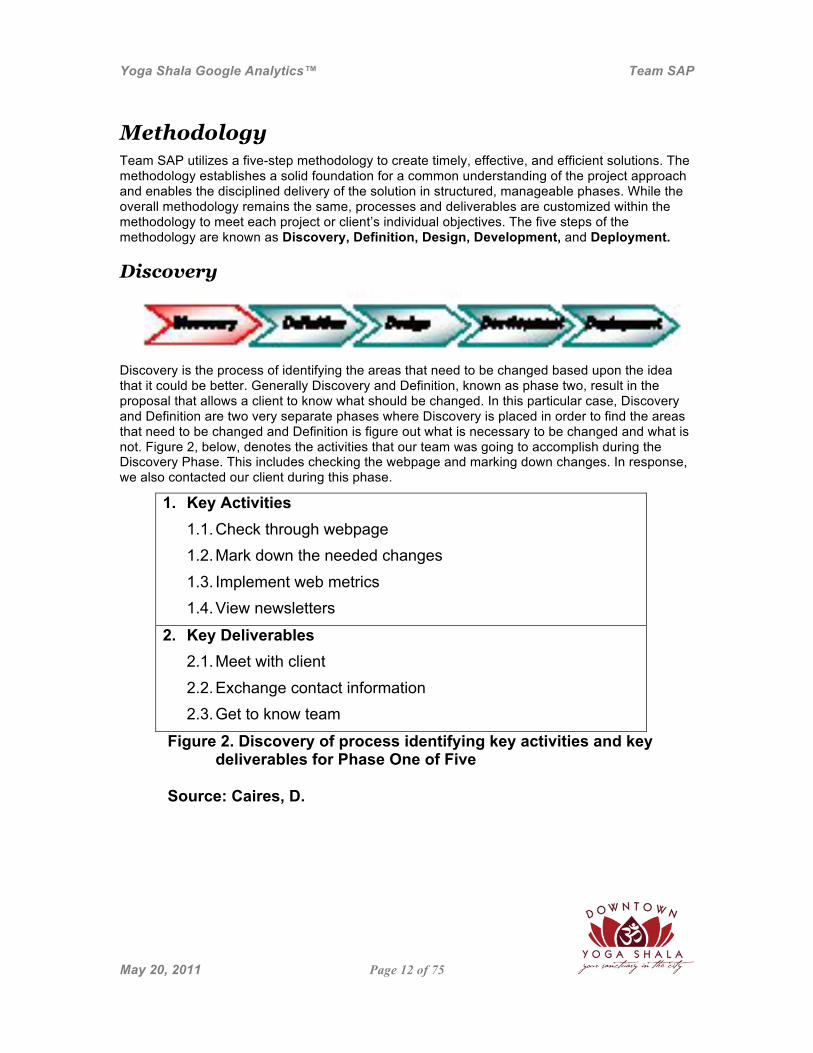
Methodology Team SAP utilizes a five-step methodology to create timely, effective, and efficient solutions. The methodology establishes a solid foundation for a common understanding of the project approach and enables the disciplined delivery of the solution in structured, manageable phases. While the overall methodology remains the same, processes and deliverables are customized within the methodology to meet each project or client’s individual objectives. The five steps of the methodology are known as Discovery, Definition, Design, Development, and Deployment.
Discovery
Discovery is the process of identifying the areas that need to be changed based upon the idea that it could be better. Generally Discovery and Definition, known as phase two, result in the proposal that allows a client to know what should be changed. In this particular case, Discovery and Definition are two very separate phases where Discovery is placed in order to find the areas that need to be changed and Definition is figure out what is necessary to be changed and what is not. Figure 2, below, denotes the activities that our team was going to accomplish during the Discovery Phase. This includes checking the webpage and marking down changes. In response, we also contacted our client during this phase.
1. Key Activities 1.1. Check through webpage 1.2. Mark down the needed changes 1.3. Implement web metrics 1.4. View newsletters
2. Key Deliverables 2.1. Meet with client 2.2. Exchange contact information 2.3. Get to know team
Figure 2. Discovery of process identifying key activities and key deliverables for Phase One of Five
Source: Caires, D.
Yoga Shala Google Analytics™ Team SAP
May 20, 2011 Page 13 of 75
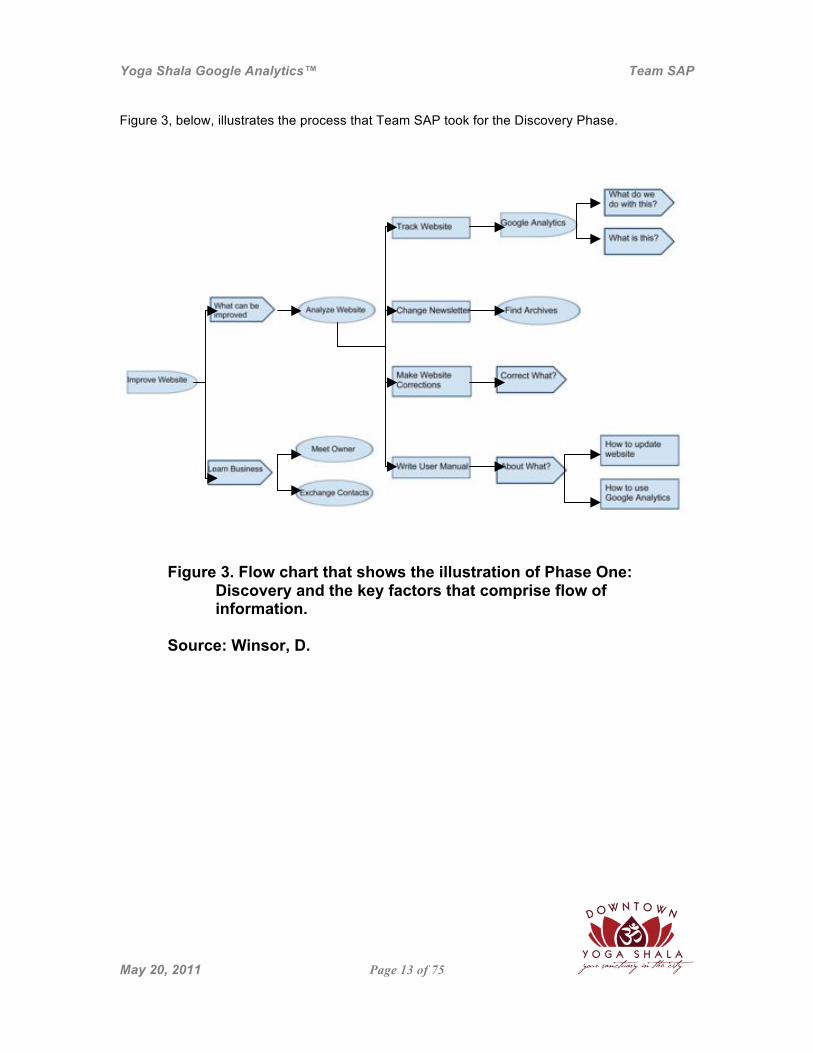
Figure 3, below, illustrates the process that Team SAP took for the Discovery Phase.
Figure 3. Flow chart that shows the illustration of Phase One:
Discovery and the key factors that comprise flow of information.
Source: Winsor, D.
Yoga Shala Google Analytics™ Team SAP
May 20, 2011 Page 14 of 75
Definition
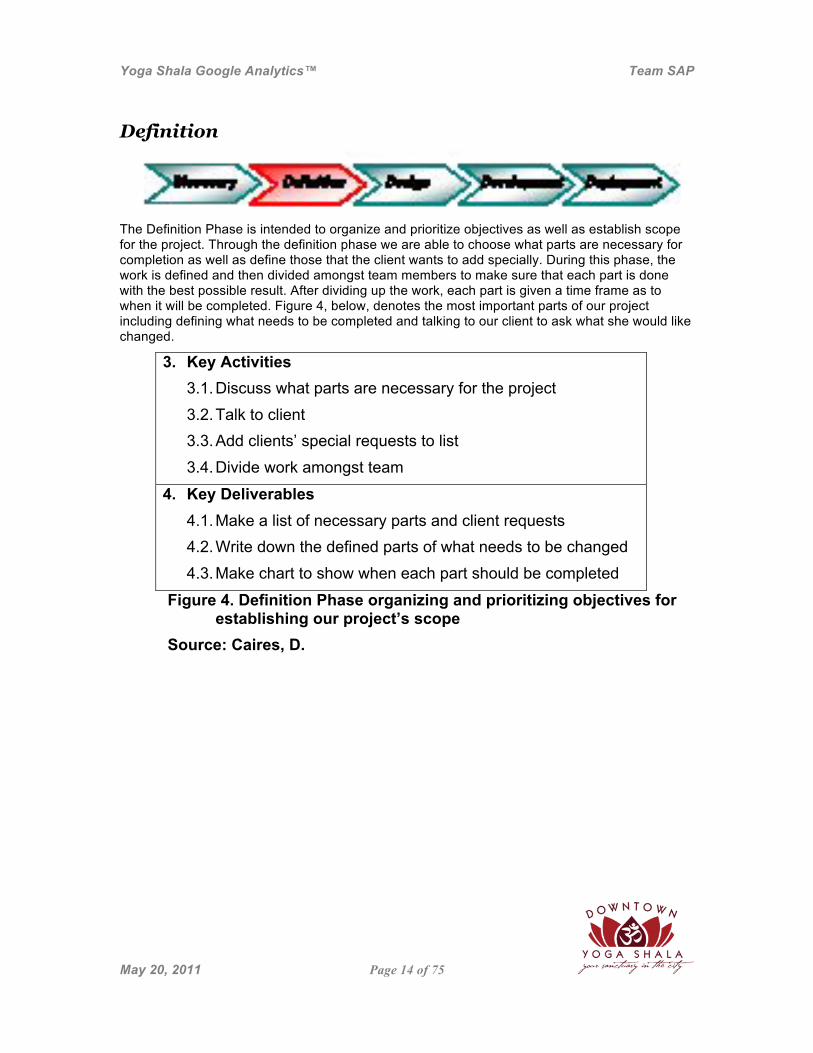
The Definition Phase is intended to organize and prioritize objectives as well as establish scope for the project. Through the definition phase we are able to choose what parts are necessary for completion as well as define those that the client wants to add specially. During this phase, the work is defined and then divided amongst team members to make sure that each part is done with the best possible result. After dividing up the work, each part is given a time frame as to when it will be completed. Figure 4, below, denotes the most important parts of our project including defining what needs to be completed and talking to our client to ask what she would like changed.
3. Key Activities 3.1. Discuss what parts are necessary for the project 3.2. Talk to client 3.3. Add clients’ special requests to list 3.4. Divide work amongst team
4. Key Deliverables 4.1. Make a list of necessary parts and client requests 4.2. Write down the defined parts of what needs to be changed 4.3. Make chart to show when each part should be completed
Figure 4. Definition Phase organizing and prioritizing objectives for establishing our project’s scope
Source: Caires, D.
Yoga Shala Google Analytics™ Team SAP
May 20, 2011 Page 15 of 75
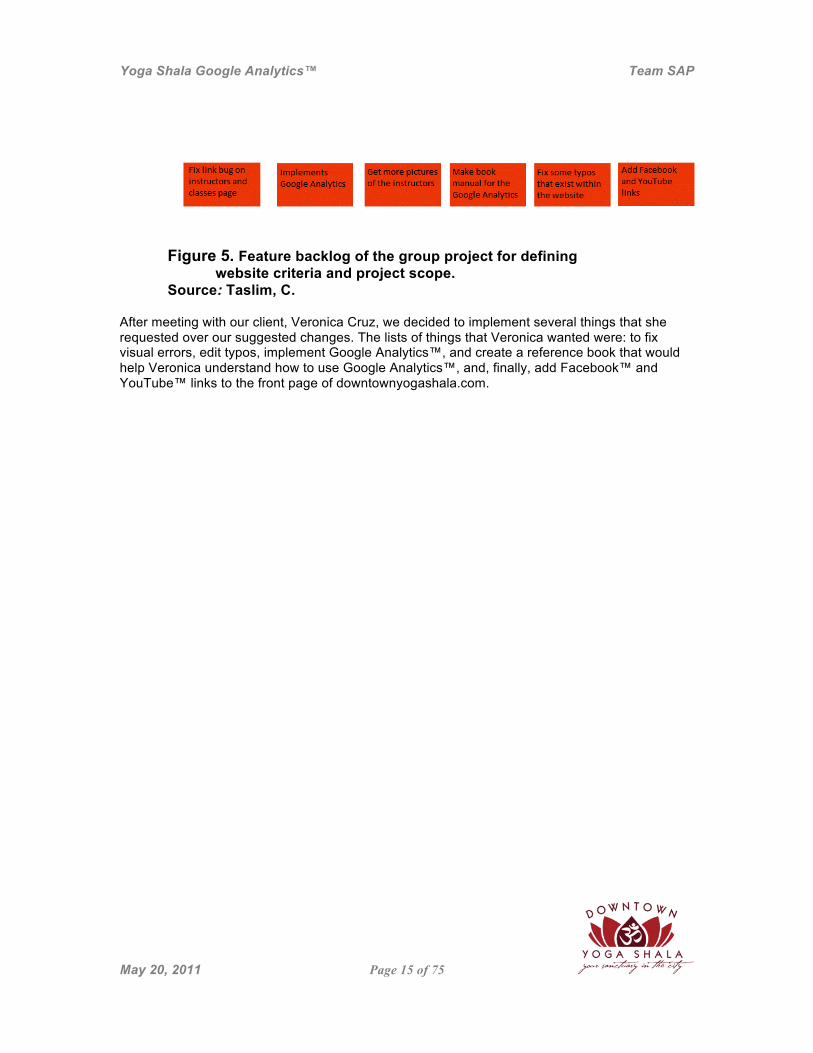
Figure 5. Feature backlog of the group project for defining
website criteria and project scope. Source: Taslim, C.
After meeting with our client, Veronica Cruz, we decided to implement several things that she requested over our suggested changes. The lists of things that Veronica wanted were: to fix visual errors, edit typos, implement Google Analytics™, and create a reference book that would help Veronica understand how to use Google Analytics™, and, finally, add Facebook™ and YouTube™ links to the front page of downtownyogashala.com.
Yoga Shala Google Analytics™ Team SAP
May 20, 2011 Page 16 of 75
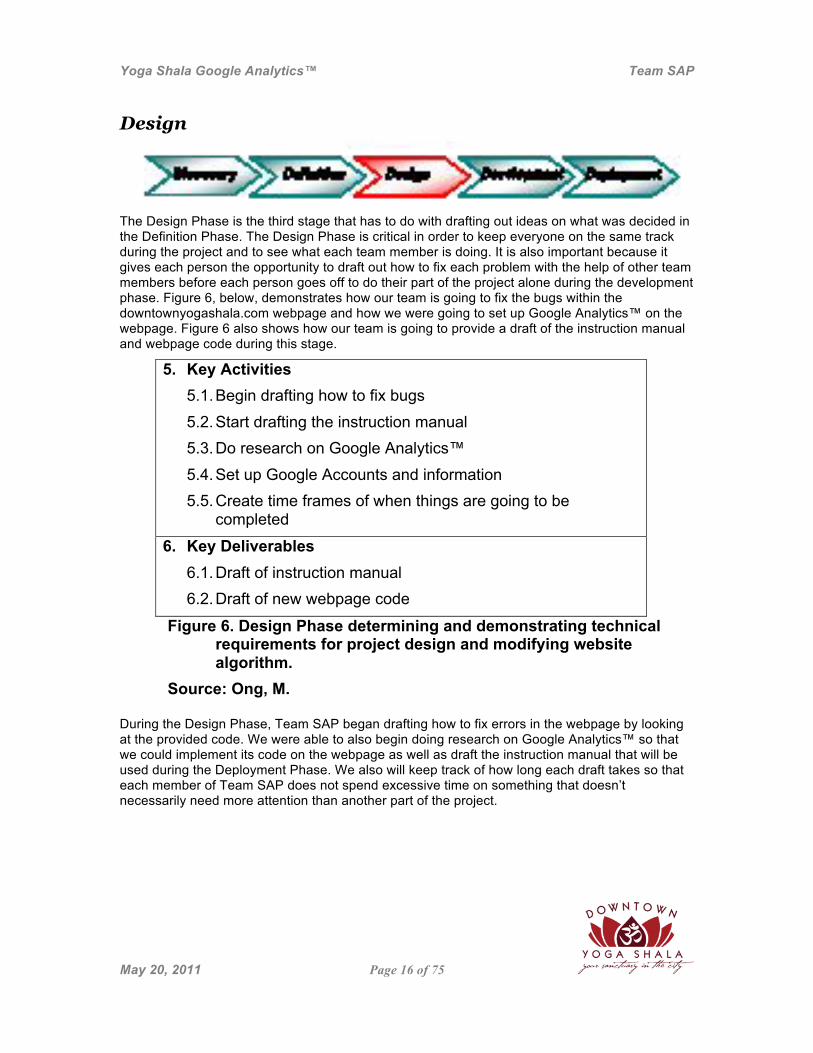
Design
The Design Phase is the third stage that has to do with drafting out ideas on what was decided in the Definition Phase. The Design Phase is critical in order to keep everyone on the same track during the project and to see what each team member is doing. It is also important because it gives each person the opportunity to draft out how to fix each problem with the help of other team members before each person goes off to do their part of the project alone during the development phase. Figure 6, below, demonstrates how our team is going to fix the bugs within the downtownyogashala.com webpage and how we were going to set up Google Analytics™ on the webpage. Figure 6 also shows how our team is going to provide a draft of the instruction manual and webpage code during this stage.
5. Key Activities 5.1. Begin drafting how to fix bugs 5.2. Start drafting the instruction manual 5.3. Do research on Google Analytics™ 5.4. Set up Google Accounts and information 5.5. Create time frames of when things are going to be
completed
6. Key Deliverables 6.1. Draft of instruction manual 6.2. Draft of new webpage code
Figure 6. Design Phase determining and demonstrating technical requirements for project design and modifying website algorithm.
Source: Ong, M. During the Design Phase, Team SAP began drafting how to fix errors in the webpage by looking at the provided code. We were able to also begin doing research on Google Analytics™ so that we could implement its code on the webpage as well as draft the instruction manual that will be used during the Deployment Phase. We also will keep track of how long each draft takes so that each member of Team SAP does not spend excessive time on something that doesn’t necessarily need more attention than another part of the project.

Yoga Shala Google Analytics™ Team SAP
May 20, 2011 Page 17 of 75
Figure 7. Shows how the design phase worked from getting the
inputs of what were needed to complete to the outputs of what was completed.
Source: Ong, M. The end of the Design Phase represents a critical stage in the design phase’s methodology. Client sign-off is required for all key deliverables in order for Team SAP to progress to the Development Phase.

Yoga Shala Google Analytics™ Team SAP
May 20, 2011 Page 18 of 75
Development
During Phase IV, also known as the Development Phase, we start creating and implementing the necessary changes. This is the stage where most of the work is completed and each step of the process is documented in order to ensure that everyone is on task. We also develop and refine the concepts that we came up with during the design stage in order to create the final product. The final product will come in the Deployment Phase as the Development Phase is specifically designed to create the product. Below, Figure 8 shows the stages during the development and the makeshift checklist that was created so our group would know what needed to be completed during the Development Phase. Figure 8, also shows what needs to be shown to the client.
7. Key Activities 7.1. Implement and create code for Google Analytics™ 7.2. Test that the Google Analytics™ script is responding 7.3. Create and send book to printer 7.4. Fix grammatical errors 7.5. Fix missing images 7.6. Fix classes and instructor pages
8. Key Deliverables 8.1. Show book to client 8.2. Google Analytics™ starts responding
Figure 8. Phases leading to the completion of the Development Phase and completion of project for the Deployment Phase
Source: Chan, M. During this phase everything is coming together in order to create the final product. Each person splits off into their own individual section and completes their task(s). This is the stage where drafts from the Design Phase are used in order to complete each part and are tested, in real-time, online so that the members of Team SAP can see if they function as designed.
Yoga Shala Google Analytics™ Team SAP
May 20, 2011 Page 19 of 75
Deliverables Name W Mar Apr Phase IV: Development - Alvin & Megan 2 1 2
Instructor List Bugfix Daniel 1 n
Book Proofing Megan 1 n
Literature Review 1 Entire 100W 1 n n
Contact Veronica Peter 1 n
Google Analytics™ Alvin 1 n
Annotations W Duration (Weeks) n normal d dependent on others c critical
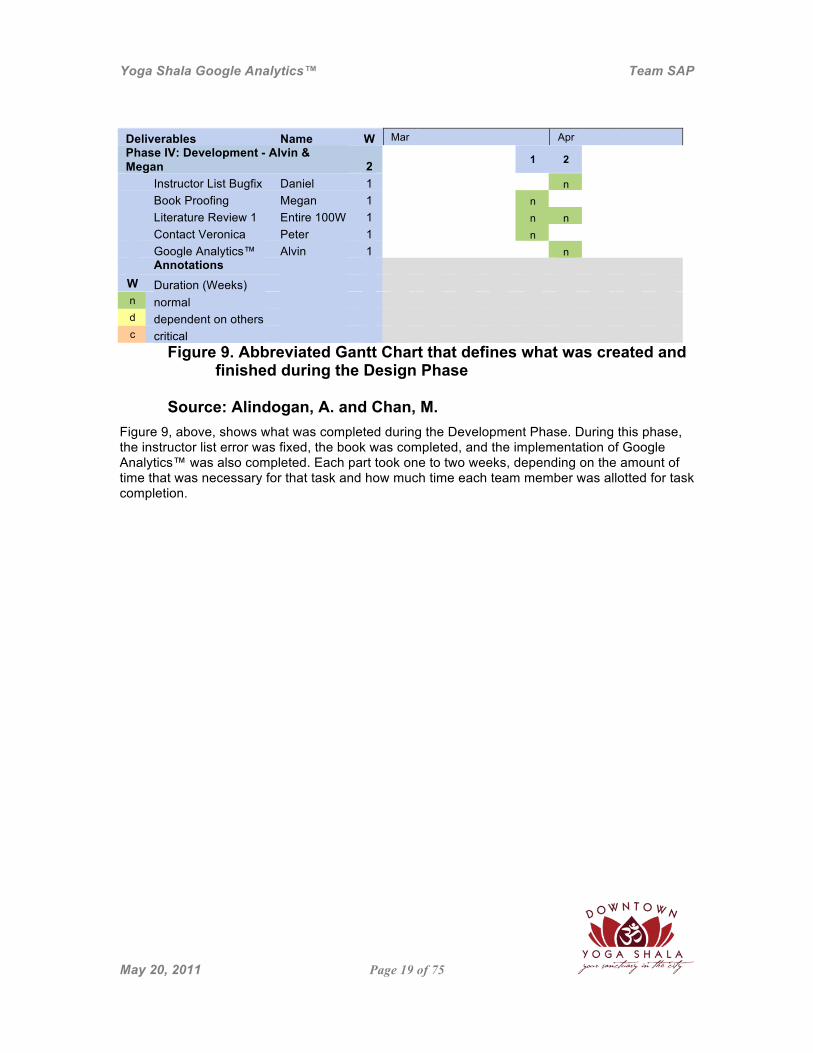
Figure 9. Abbreviated Gantt Chart that defines what was created and finished during the Design Phase
Source: Alindogan, A. and Chan, M.
Figure 9, above, shows what was completed during the Development Phase. During this phase, the instructor list error was fixed, the book was completed, and the implementation of Google Analytics™ was also completed. Each part took one to two weeks, depending on the amount of time that was necessary for that task and how much time each team member was allotted for task completion.

Yoga Shala Google Analytics™ Team SAP
May 20, 2011 Page 20 of 75
Deployment
The changes requested and defined during the Define Phase, were implemented on to the webpage during the Deployment Phase. These changes were checked over to make sure that the final product has no errors in it. For example, the errors on the Instructor and Class page were fixed to show the correct location selected rather than leave the errors on the page. The client was then presented with a book of instructions and was taught how to use Google Analytics™ on the webpage in order to increase her business. Figure 10 shows what activities needed to be completed and what deliverables needed to be shown or worked with the client. These are written out in Figure 10 below and these include making sure that all the activities were completed appropriately.
9. Key Activities 9.1. Check Google Analytics™ is responding to webpage
activity 9.2. Check functionality of the webpage’s changes
10. Key Deliverables 10.1. Present Google Analytics™ book and show changes 10.2. Teach client how to use Google Analytics™
Figure 10. Deployment phase completion objectives and goals Source: Chan, M. This phase is where Team SAP implemented Google Analytics™ on the webpage and monitors the numbers of visitors to the webpage through Google Analytics™. Our group also taught our client how to use Google Analytics™ through a one-on-one tutorial and Google Analytics™ books. After explaining Google Analytics™, we also showed the changes (instructor pages, classes page, and new links) to the client.
Yoga Shala Google Analytics™ Team SAP
May 20, 2011 Page 21 of 75
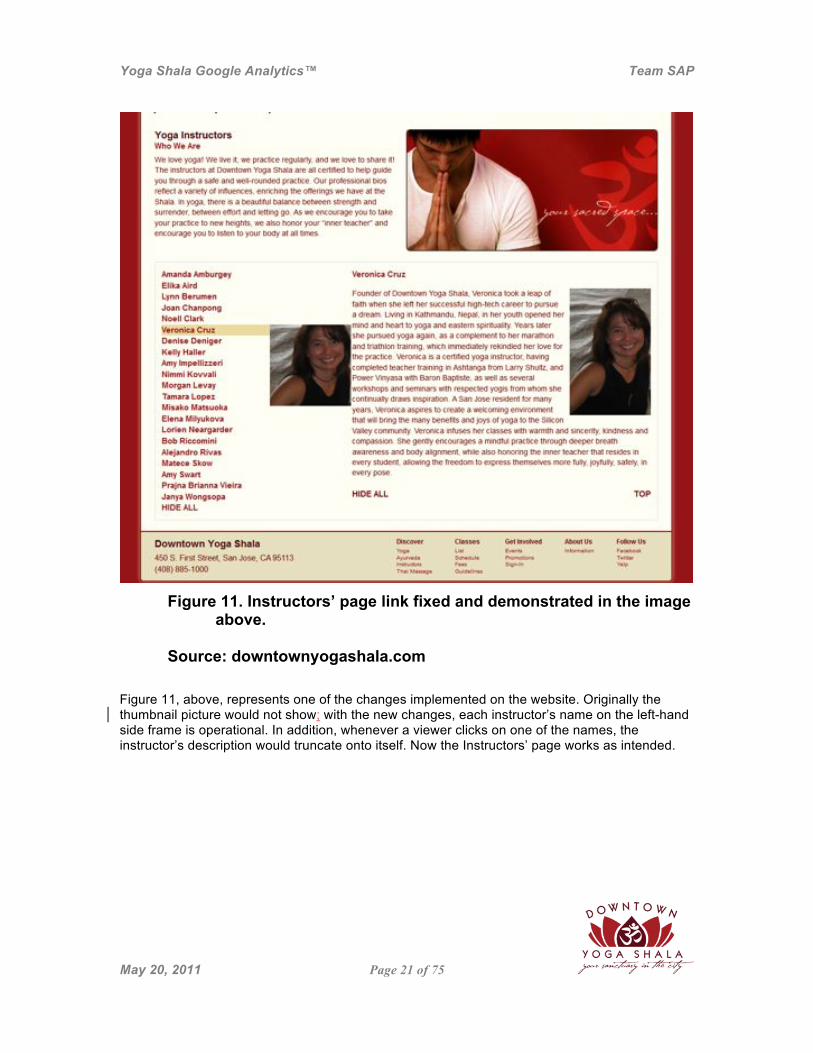
Figure 11. Instructors’ page link fixed and demonstrated in the image
above. Source: downtownyogashala.com
Figure 11, above, represents one of the changes implemented on the website. Originally the thumbnail picture would not show; with the new changes, each instructor’s name on the left-hand side frame is operational. In addition, whenever a viewer clicks on one of the names, the instructor’s description would truncate onto itself. Now the Instructors’ page works as intended.
Yoga Shala Google Analytics™ Team SAP
May 20, 2011 Page 22 of 75
Appendix A: Annotated Bibliography Weischedel, B., and Huizingh, E., (2006). Website optimization with web metrics: a case study.
Proceedings of the 8th international conference on electronic commerce, 463-470. doi: 10.1145/1151454.1151525.
In Dr. Birgit Weischedel’s and Dr Eeldo K.R.E Huizing’s research article, “Website Optimization with Web Metrics,” Weischedel explores the relatively unexplored and under utilized area of web metrics. Web metrics are basically data that informs an owner of a website about how visitors are utilizing a website and based on the data gathered, an owner can tailor his/her website towards the needs of his/her visitors. Weischedel and Huizing first explore clickstream data, basically raw web/server logs, which provides a vast amount of data, but without analysis clickstream data is virtually useless. Secondly, Weischedel and Huizing addresses web metrics by conducting a case study on a major US company, to learn about how they use web metrics to optimize their websites. Weischedel and Huizing find that there are major gaps and flaws in web metrics currently. Which is due to the vast amount of data collected and not being able to utilize the data purposefully. Web sites can be changed on a regular basis. Their text, links, pages, photos, and information can be changed at anytime. However, the most common question for companies is what are the users of their web page interested in? What links, pages, and items are they most interested in. This information has all been gathered through web analytics, which according to Weischedel and Huizingh (2006), web analytics "is the field that is concerned with collecting, analyzing, and interpreting web metrics". (463) The most common form of data that comes from analytics is called clickstream data. "Clickstream data displays the 'when' and 'what' of web visits, but are limited use to answer 'how' and 'why' questions about the customers' site use." (464) The other problem that web analytics has to do with cashes and spiders. Web analytics uses caches in order to help track how the user moves about the page. However, some pages are kept in the cache on
Yoga Shala Google Analytics™ Team SAP
May 20, 2011 Page 23 of 75
the visiting computer and are not recorded. The other problem with has to do with "robot programs that scan the web to keep search engine databases up to date" (464) called spiders. The analytics sometimes identifies this program as a person rather than a spider. The study plans to interview eight employees based on their work in web metrics from all levels of work in order to gain an understanding of web metrics. The study conducted was a case study of “ a provider of products, services and support solutions for building and maintaining network computing environments,” chosen for its market success (Weischedel & Huizingh, 2006). Eight employees were interviewed in a semi-structured face-to-face interview. These interviewees contained both low and high level managers. The researchers were also given access to web metrics collected by the company and relevant company documents. The web metrics were obtained from server logs. A review of the literature was also done before the study, directing the researchers on what to study. Clickstream data, customer surveys and external data, by themselves provide little usable information that is needed in order optimize a website. Web metrics, the use of all these things together, can greatly benefit web managers and websites, and web managers are aware of how valuable web metrics can be. But due to the lack of industry standards, vast amount of data collected, and difficulties actually deciding which statistics are actually meaningful,, web managers are unable to fully utilize web metrics. But the potential of web metrics is understood. Web metrics are a tool that could help someone improve their website. It is based on clickstream data, customer’s survey, and web analytics. These are great tools to answer when, what, why, and how user uses the website. Using it comes with a downside, incomplete and misinterpreted data can create a problem for anyone who is using the tools. The case study finds that despite the problems using it, it is necessary gateway to go through for someone who needs to improve their website.

Yoga Shala Google Analytics™ Team SAP
May 20, 2011 Page 24 of 75
Yang, K., Bernardo, L., Sereika, S., Conroy, M., Balk, J., and Burke, L., “Utilization of 3-Month Yoga Program for Adults at High Risk for Type 2 Diabetes: A Pilot Study,” Evidence-Based Complementary and Alternative Medicine, 2011, Article ID 257891, 6 pages, 2011. doi:10.1093/ecam/nep117
Physical exercise along with dieting is the most prescribed method to prevent or delay type 2 diabetes. In this article, yoga is presented as a form of physical activity that can help reduce the risks of type 2 diabetes, by reducing weight and by improving blood sugar and blood pressure levels. This study took twenty-three adults, between 45-65 years of age, who were at risk for type 2 diabetes and randomly assigned them to two groups, a yoga intervention group and an educational group, the control group. Participants in the study were told to continue their normal physical activities. The yoga group took part in a 3-month yoga program which had two one-hour sessions per week, while the control groups were given general health education materials every 2 weeks. At the end of the 3-month period, it was found that those who belonged to the yoga group had a 81% yoga session attendance rate. Members of the yoga group also expressed high satisfaction at 99%.When comparing blood test results from both groups; members of the yoga group had significant positive changes compared to the control group. This study points to the idea that yoga may be a way to help high-risk individuals from not developing type 2 diabetes. More than 21 million Americans are diagnosed with type 2 diabetes. Since 1987 there has been an 45% increase in the death rate from this form of diabetes. (Yang and Bernardo, 2009) Exercise is important to lower blood pressure, cholesterol, weight, and glucose levels that cause diabetes. Yoga is reported to be effective in reducing all of these. Short-term yoga practice has shown a decrease in glucose and cholesterol levels in adults with hypertension, heart disease, and diabetes. This is most likely due to the relaxation gained in yoga. Yoga has increased in recent years from 3.7% of people practicing yoga in 1997 to 6.1% in 2007. (Yang and Bernardo, 2009) The increase is most likely because "yoga can be
Yoga Shala Google Analytics™ Team SAP
May 20, 2011 Page 25 of 75
practiced at any time on an individual basis, thus reducing common barriers to physical activity such as time conflicts and poor weather." (Yang and Bernardo, 2009) Physical activity has lead to the increase in self-efficacy according to Oleshanky's 2004 study of American adults between the ages of 29-40 years. Higher levels of self-efficacy have been shown while these people were doing physical activity. Despite the current amount of research physical activity has had on type 2 diabetes, it is unclear if type 2 diabetes benefit from yoga. The purpose of the study was to examine the cardio metabolic risks of adults at risk for type 2 diabetes after a 12 week yoga program (Yang and Bernardo, 2009). The study is a case-controlled study of 23 participants selected from an initial pool of 112 respondents. The respondents were screened for eligibility based on age, exercise level, risk of type 2 diabetes, and at least one cardio metabolic risk factor. They were then screened for eligibility with tests for BMI, blood pressure, glucose and cholesterol level. Of the “[t]wenty-three participants (19 Whites and 4 non-Whites)”, 21 were female and 2 were male; 12 completed the intervention program and 11 finished the education program (Yang et al., 2009). Both groups maintained their active exercise levels. The intervention program group attended one hour Vinyasa style yoga classes, taught by a PhD certified nurse, twice a week for three months. Each class had a 5 minute warm up period and a 10 minute relaxation period. The participants were also asked to perform yoga at home, recording the minutes spent doing so, but with no set amount required. The education program (control) group was sent every two weeks for three months informational brochures on the risk factors and prevention of diabetes. The clinical measurements of “BP, blood glucose, insulin, lipid levels, [cholesterol; high-density lipoproteins (HDL); low-density lipoprotein (LDL); triglycerides] and body weight were obtained at baseline and at the end of 3 months” for both groups (Yang et al., 2009). The intervention program group was given questionnaires on “treatment expectation, program satisfaction and
Yoga Shala Google Analytics™ Team SAP
May 20, 2011 Page 26 of 75
exercise log” (Yang et al., 2009). The main purpose of the study is to know whether using yoga would be good for a person who suffers type 2 diabetes. It turned out to be positive. The idea became acceptable and people would recommend other people who suffer the same disease to do yoga. The study also found that yoga helps people to believe in their own competence. With this idea in mind, further research will be needed to be able to understand the relationship between self-efficacy and yoga itself. Overall the pilot study shows that practicing yoga could yield beneficial for people with type 2 diabetes because it showed an increase in exercise self-efficacy. With this increase, it is speculated that practicing yoga may help people embrace a healthier alternative to their lifestyles and incorporate exercise in their daily lives. Not only did the test group’s self-efficacy towards exercise increased but they also felt stronger, nimble, and stable after the pilot study. This though is subjective and needs to be proven in a different pilot study in order to be concrete.
Yoga Shala Google Analytics™ Team SAP
May 20, 2011 Page 27 of 75
Appendix B: Works Cited Caires, D., (2011). Proposal template. CS100W Course Reader. Chan, M., (2011). Google Analytics™ for Downtown Yoga Shala. Google Analytics™, 1-40 Cruz, V. (2011, April 25). Yoga in San José, CA | Downtown Yoga Shala. Retrieved from
http://www.downtownyogashala.com/ Weischedel, B., and Huizingh, E., (2006). Website optimization with web metrics: a case study.
Proceedings of the 8th international conference on electronic commerce, 463-470. doi: 10.1145/1151454.1151525.
Yang, K., Bernardo, L., Sereika, S., Conroy, M., Balk, J., and Burke, L., “Utilization of 3-Month
Yoga Program for Adults at High Risk for Type 2 Diabetes: A Pilot Study,” Evidence-Based Complementary and Alternative Medicine, vol. 2011, Article ID 257891, 6 pages, 2011. doi:10.1093/ecam/nep117
Yoga Shala Google Analytics™ Team SAP
May 20, 2011 Page 28 of 75
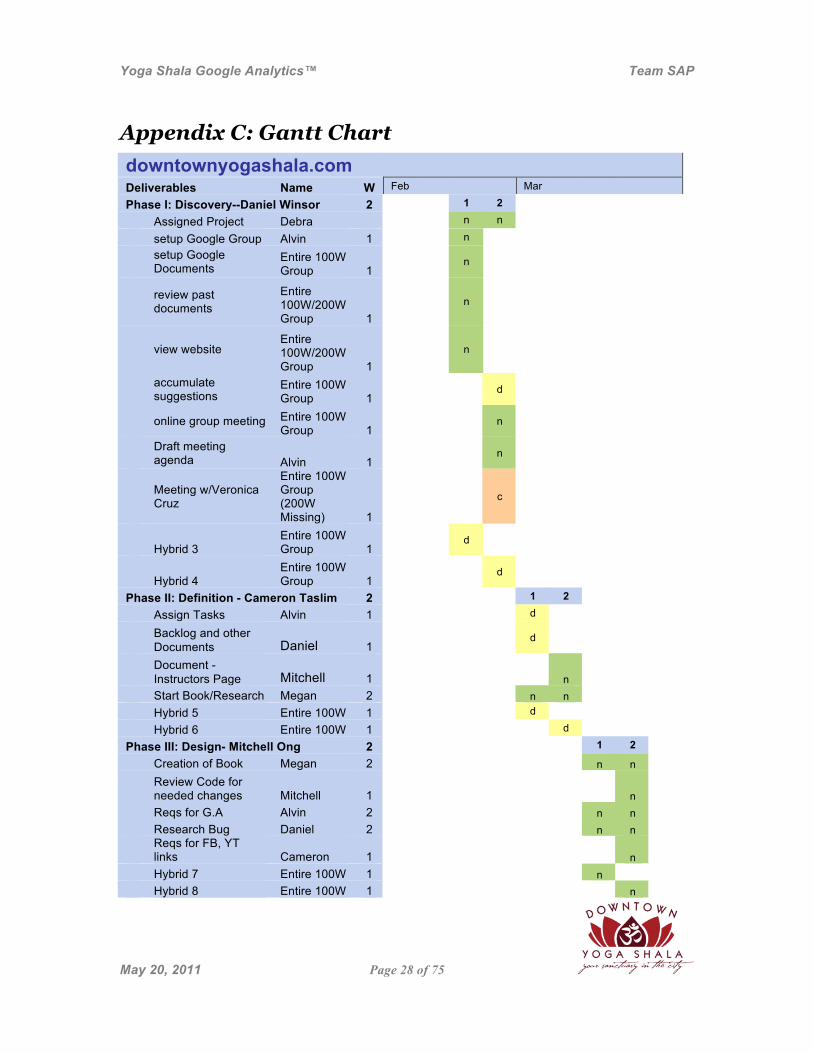
Appendix C: Gantt Chart downtownyogashala.com
Deliverables Name W Feb Mar
Phase I: Discovery--Daniel Winsor 2 1 2
Assigned Project Debra n n
setup Google Group Alvin 1 n
setup Google Documents
Entire 100W Group 1
n
review past documents
Entire 100W/200W Group 1
n
view website
Entire 100W/200W Group 1
n
accumulate suggestions
Entire 100W Group 1
d
online group meeting Entire 100W
Group 1 n
Draft meeting agenda Alvin 1
n
Meeting w/Veronica Cruz
Entire 100W Group (200W Missing) 1
c
Hybrid 3 Entire 100W Group 1
d
Hybrid 4 Entire 100W Group 1
d
Phase II: Definition - Cameron Taslim 2 1 2
Assign Tasks Alvin 1 d
Backlog and other Documents Daniel 1
d
Document - Instructors Page Mitchell 1
n
Start Book/Research Megan 2 n n
Hybrid 5 Entire 100W 1 d
Hybrid 6 Entire 100W 1 d
Phase III: Design- Mitchell Ong 2 1 2
Creation of Book Megan 2 n n
Review Code for needed changes Mitchell 1
n
Reqs for G.A Alvin 2 n n
Research Bug Daniel 2 n n
Reqs for FB, YT links Cameron 1
n
Hybrid 7 Entire 100W 1 n
Hybrid 8 Entire 100W 1 n
Yoga Shala Google Analytics™ Team SAP
May 20, 2011 Page 29 of 75
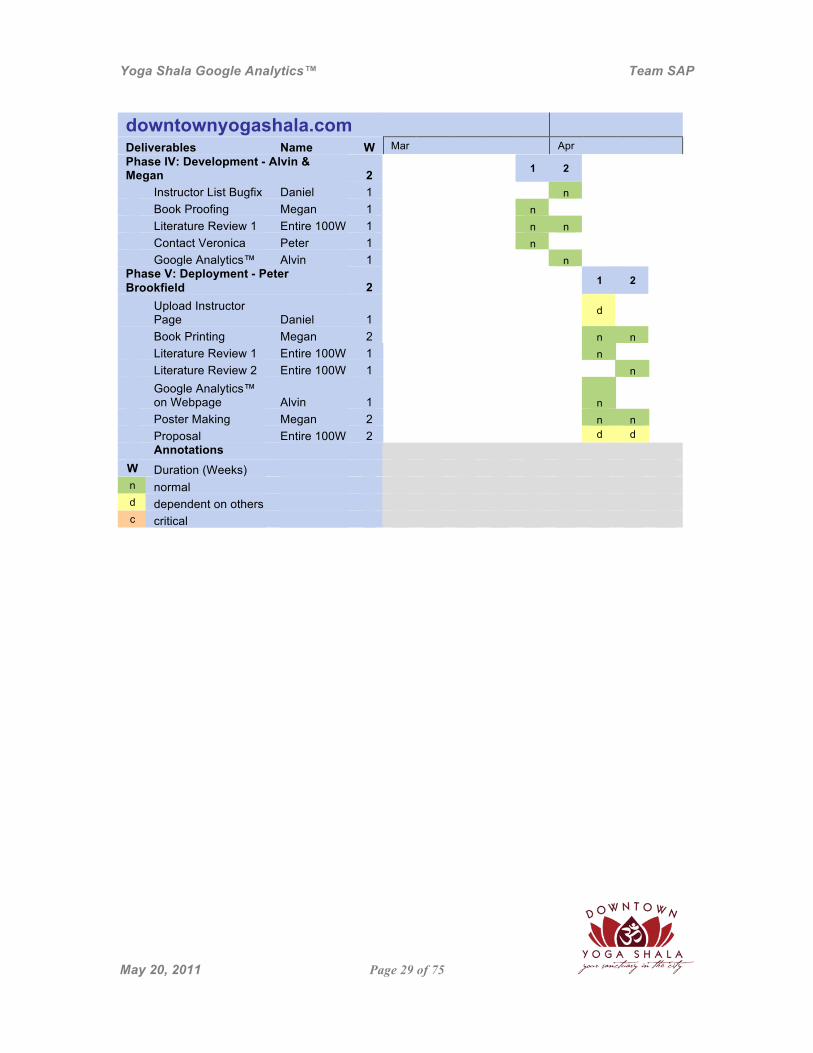
downtownyogashala.com
Deliverables Name W Mar Apr Phase IV: Development - Alvin & Megan 2 1 2
Instructor List Bugfix Daniel 1 n
Book Proofing Megan 1 n
Literature Review 1 Entire 100W 1 n n
Contact Veronica Peter 1 n
Google Analytics™ Alvin 1 n Phase V: Deployment - Peter Brookfield 2 1 2
Upload Instructor Page Daniel 1
d
Book Printing Megan 2 n n
Literature Review 1 Entire 100W 1 n
Literature Review 2 Entire 100W 1 n
Google Analytics™ on Webpage Alvin 1 n
Poster Making Megan 2 n n Proposal Entire 100W 2 d d Annotations W Duration (Weeks) n normal d dependent on others c critical
Yoga Shala Google Analytics™ Team SAP
May 20, 2011 Page 30 of 75
Appendix D: Progress Reports To: Veronica Cruz, Business Owner From: Team SAP Date: Sprint 1 of 5 Subject: Phase I: Discovery Phase Progress Report
Phase I: Discovery The case study that we have chosen is Yoga Shala, a Yoga studio located in Downtown San Jose that has requested help in regards to marketing their web page. According to the professor, we have received this case study in order to further test our abilities in a real world setting in order to pick up where the last group that worked with Yoga Shala left off in order to help install, instruct, and help maintain the web page that Yoga Shala owns. By doing this, we will be able to push our abilities to the limit to help Yoga Shala have a successful web page that is both efficient in intriguing customers to join as well as helping the studio master web page marketing. Team SAP is composed of the following members, in no particular order: 1. Megan Chan is a confident web page and graphic designer who is the Publicity and Web Manager San Jose State University Quidditch web page where she designed, executed, and maintains the web page. She also has created and maintains her own personal web pages in order to keep her skills fresh. As a Computer Science major at San Jose State University and a Web Developer major at Skyline College, she is confident in her skills in the programming languages of Java, HTML, and CSS and can aptly apply them to real life scenarios. 2. Daniel Winsor is a Computer Science major at San Jose State University. His strengths are in algorithms, languages and compilers, but he is willing to take the lead in any area when necessary. 3. Mitchell Ong is a transfer student in his second semester at San Jose State University. His strengths include working with others and having a “will do anything to get it done” attitude when it comes to programming. Although he doesn’t have much experience outside of the classroom, he is eager and excited to finally get his hands dirty with something besides a homework assignment. 4. Alvin Alindogan is a SJSU student majoring in Computer Science. He is knowledgeable in HTML, CSS, Processing, Bash / Bourne scripting, Perl scripting, and proficient in Linux. He also has a strong work ethic , efficient in problem solving, and exemplifies dynamic leadership skills.
Yoga Shala Google Analytics™ Team SAP
May 20, 2011 Page 31 of 75
5. Cameron Taslim is another transfer student in his second semester at San Jose State University. His strengths are having good work ethics, implement an efficient code, and good at problem solving. Even though he does not have much computer language knowledge, he is a good self learner that will be able to get the job done whatever it takes. 6. Peter Brookfield is a Physics major at San Jose State. A stubborn determination to see projects through to completion serves him well in his chosen field. His strengths include objective problem solving, data analysis, and both inductive and deductive reasoning. Once committed to a venture you will find that he is a powerful ally to have. The group’s pre-plan for working through this case study is to look through the original case study and to develop a plan to take over not only where the previous group left off, but also develop a plan to fix mistakes they had along the way. We will develop a master overall plan and some short goals in order to show the client what we have been working on and to keep us on track. By doing this we should be able to figure out how much time the project will take based on our skills and confidence as computer scientists.
Yoga Shala Google Analytics™ Team SAP
May 20, 2011 Page 32 of 75
Phase II: Definition To: Veronica Cruz, Business Owner From: Team SAP Date: Sprint 2 of 5 Subject: Phase II: Definition Phase Progress Report
We came with up with a list of what we wanted to do with the webpage and discussed it with the client, Veronica Cruz, to come up with the items that needed to be worked on. This list is called the feature backlog. The backlog consisted of the following tasks: 1) Fix the link bug on the Instructors and Classes page 2) Implement Google Analytics™ 3) Get more pictures of the instructors 4) Make the Google Analytics™ Manual 5) Fix website typos 6) Add Facebook™ and YouTube™ links The client, Veronica Cruz, decided that only the following changes should be implemented: fix the visual errors, edit typos, implement Google Analytics™, create a Google Analytics™ reference book, and add Facebook™ and YouTube™ links to the website’s front page. Each of these tasks was delegated to different members of the team: 1. Mitchell: Address typos and errors found on the website 2. Daniel: Fix the link on the instructors and classes page 3. Alvin: Implement Google Analytics™ 4. Megan: Create the Google Analytics™ reference manual
5. Cameron: Add Facebook™ and YouTube™ links 6. Peter: Act as spokesperson for Team SAP and serve as liaison between client and team members
Yoga Shala Google Analytics™ Team SAP
May 20, 2011 Page 33 of 75
Phase III: Design To: Veronica Cruz, Business Owner From: Team SAP Date: Sprint 3 of 5 Subject: Phase III: Design Phase Progress Report
As specified in the Phase II Definition section, each task was assigned to one specific person. Roles were assigned based on each individual’s background, expertise in the subject matter, and level of interest in performing the specified task. This careful selection process ensured that time would be used efficiently. After dividing up the work accordingly, we began to make the necessary changes that the client wanted. During the design phase, our goals included devising a plan for fixing the errors on the webpage, researching how to implement Google Analytics™ onto the website, begin drafting the instruction manual, and setting up Google Accounts™ and information. The latter goal proved to be one of the most important tasks. Our group communicated through the creation of a Google Documents™ that served as a forum for discussion. When questions or issues would arise regarding our individual tasks, this document served as the group’s means of communication with each other. It allowed team members to provide feedback or edits and to touch base with each other regarding progress toward task completion.

Yoga Shala Google Analytics™ Team SAP
May 20, 2011 Page 34 of 75
Phase IV: Development To: Veronica Cruz, Business Owner From: Team SAP Date: Sprint 4 of 5 Subject: Phase IV: Development Phase Progress Report After the members of Team SAP became familiar and comfortable with their roles, each person took initiative and responsibility in carrying out their respective tasks. The list of items that were on the feature backlog were finalized and completed which included fixing the errors on the instructors and classes webpage, adding Google Analytics™, and creating the user manual for Veronica Cruz. An extensive amount of time was spent in the preparation stages pertaining to each task. For example, thorough research was done on Google Analytics™ in order to understand how to utilize it before implementing it within the Yoga Shala website. Once Google Analytics™ was implemented, the script had to be tested to ensure that it responded to Internet traffic. The code of the Yoga Shala website was also reviewed carefully and thoroughly for flaws. Once the extent of the flaws was ascertained, appropriate actions were taken to correct these flaws which included rewriting the algorithm on the affected page(s). The Google Analytics™ Reference Manual was also fully conceptualized during this time. Decisions regarding the design, layout, and color scheme for the manual were finalized and its creation was carried out.
Yoga Shala Google Analytics™ Team SAP
May 20, 2011 Page 35 of 75
Phase V: Deployment To: Veronica Cruz, Business Owner From: Team SAP Date: Sprint 5 of 5 Subject: Phase V: Deployment Phase Progress Report Once each part of the project was completed, the individual elements that team members worked on were put together to form the finished product which in this case was an improved website. Thorough checks were performed and repeated on Google Analytics™ to ensure that everything was functional and operational. The corrections made to the instructors' and classes' webpage was also reviewed to ensure that all flaws had been addressed. Once Team SAP was confident with the results of their review, the completed project was presented to the client, Veronica Cruz. She was instructed on how to use Google Analytics™ and was presented with the Google Analytics™ Reference Manual. Team SAP also showed her the changes that were made to her webpage.

Yoga Shala Google Analytics™ Team SAP
May 20, 2011 Page 36 of 75
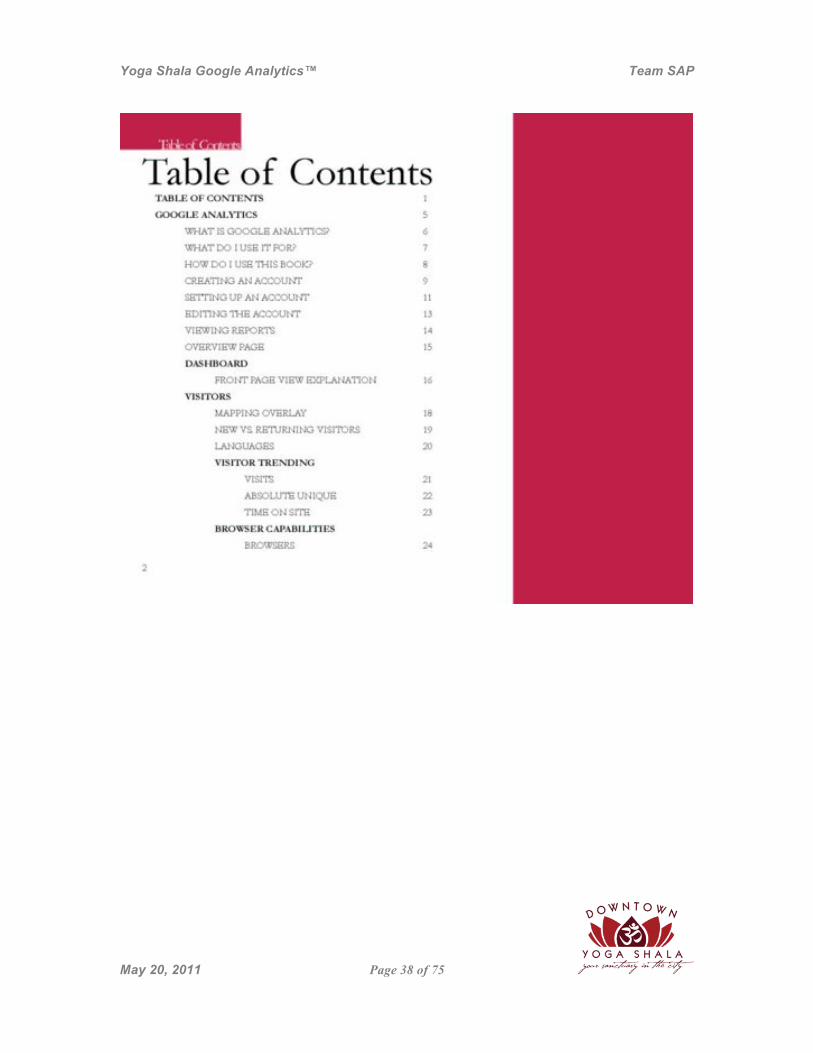
Appendix E: Google Analytics™ Book
Yoga Shala Google Analytics™ Team SAP
May 20, 2011 Page 37 of 75
Yoga Shala Google Analytics™ Team SAP
May 20, 2011 Page 38 of 75
Yoga Shala Google Analytics™ Team SAP
May 20, 2011 Page 39 of 75

Yoga Shala Google Analytics™ Team SAP
May 20, 2011 Page 40 of 75
Yoga Shala Google Analytics™ Team SAP
May 20, 2011 Page 41 of 75
Yoga Shala Google Analytics™ Team SAP
May 20, 2011 Page 42 of 75
Yoga Shala Google Analytics™ Team SAP
May 20, 2011 Page 43 of 75
Yoga Shala Google Analytics™ Team SAP
May 20, 2011 Page 44 of 75

Yoga Shala Google Analytics™ Team SAP
May 20, 2011 Page 45 of 75
Yoga Shala Google Analytics™ Team SAP
May 20, 2011 Page 46 of 75
Yoga Shala Google Analytics™ Team SAP
May 20, 2011 Page 47 of 75
Yoga Shala Google Analytics™ Team SAP
May 20, 2011 Page 48 of 75
Yoga Shala Google Analytics™ Team SAP
May 20, 2011 Page 49 of 75
Yoga Shala Google Analytics™ Team SAP
May 20, 2011 Page 50 of 75
Yoga Shala Google Analytics™ Team SAP
May 20, 2011 Page 51 of 75
Yoga Shala Google Analytics™ Team SAP
May 20, 2011 Page 52 of 75
Yoga Shala Google Analytics™ Team SAP
May 20, 2011 Page 53 of 75
Yoga Shala Google Analytics™ Team SAP
May 20, 2011 Page 54 of 75
Yoga Shala Google Analytics™ Team SAP
May 20, 2011 Page 55 of 75

Yoga Shala Google Analytics™ Team SAP
May 20, 2011 Page 56 of 75

Yoga Shala Google Analytics™ Team SAP
May 20, 2011 Page 57 of 75
Yoga Shala Google Analytics™ Team SAP
May 20, 2011 Page 58 of 75

Yoga Shala Google Analytics™ Team SAP
May 20, 2011 Page 59 of 75

Yoga Shala Google Analytics™ Team SAP
May 20, 2011 Page 60 of 75
Yoga Shala Google Analytics™ Team SAP
May 20, 2011 Page 61 of 75
Yoga Shala Google Analytics™ Team SAP
May 20, 2011 Page 62 of 75
Yoga Shala Google Analytics™ Team SAP
May 20, 2011 Page 63 of 75
Yoga Shala Google Analytics™ Team SAP
May 20, 2011 Page 64 of 75
Yoga Shala Google Analytics™ Team SAP
May 20, 2011 Page 65 of 75
Yoga Shala Google Analytics™ Team SAP
May 20, 2011 Page 66 of 75
Yoga Shala Google Analytics™ Team SAP
May 20, 2011 Page 67 of 75
Yoga Shala Google Analytics™ Team SAP
May 20, 2011 Page 68 of 75

Yoga Shala Google Analytics™ Team SAP
May 20, 2011 Page 69 of 75

Yoga Shala Google Analytics™ Team SAP
May 20, 2011 Page 70 of 75

Yoga Shala Google Analytics™ Team SAP
May 20, 2011 Page 71 of 75
Yoga Shala Google Analytics™ Team SAP
May 20, 2011 Page 72 of 75

Yoga Shala Google Analytics™ Team SAP
May 20, 2011 Page 73 of 75
Yoga Shala Google Analytics™ Team SAP
May 20, 2011 Page 74 of 75
Yoga Shala Google Analytics™ Team SAP
May 20, 2011 Page 75 of 75


