
Werner Schmutz, PMOD/WRC, Switzerland!with contributions from the PREMOS team:!PMOD/WRC, LASP, NPL, LATMOS, CNES!
SORCE 2011, Sedona, September 13, 2011!
PREMOS/PICARD TSI Results
and a revised TSI-composite!

Werner Schmutz!
Overview!
• The absolute value of TSI from first light of PREMOS/PICARD!
• Sensitivity changes of the PREMOS radiometers!
• Re-evaluation of 1996-1998 PMO6V sensitivity corrections new cycle 23 composite!
• Consequence for long term reconstructions!
2 13.09.2011!

Space Measurements!
Werner Schmutz! 3
4.5 W/m2 difference in the absolute level of TIM/SORCE versus all other experiments
13.09.2011!

TSI absolute uncertainty!
Werner Schmutz! 4
All TSI experiments are absolutely characterized, with uncertainties being much smaller than 4.5 W/m2, !typically 300 ppm (0.4 W/m2) !!
! ! thus, the difference was unexplained !!
13.09.2011!

Werner Schmutz! 5 29.06.2011!
A new absolute value of TSIfrom 1st light of PREMOS/PICARD!
PICARD: A French micro satellite
New TSI measurements!

PICARD was launched June 15, 2010!
Werner Schmutz! 6 13.09.2011!
PICARD in DNEPR PICARD satellite PREMOS
PREMOS first light was July 27th, 2010

Werner Schmutz!
PREMOS/PICARD!
7
Total Solar Irradiance
Filter Radiometers
13.09.2011!

Werner Schmutz!
Traceability of PREMOS-TSI!
8
PREMOS B Comparison to cryogenic rad.
(power in vacuum) NPL
Comparison to cryogenic rad.
(power and irradiance in vacuum)
TRF @ LASP PREMOS A3
13.09.2011!

Werner Schmutz!
Irradiance calibration!
9
PREMOS A is the first and only radiometer in space with a SI-traceable irradiance calibration in vacuum!
Traceable to the irradiance calibration facility at LASP in Boulder (TRF)!
13.09.2011!

Werner Schmutz!
Uncertainty of calibration!
10
+ absolute uncertainty of TRF facility (70 ppm)!
= uncertainty of TRF comparison (220 ppm)!
PREMOS A!
TRF radiometer!
13.09.2011!

Werner Schmutz!
Calibration uncertainty!
11
Traceable via TRF, LASP, Boulder to NIST!
• Irradiance in vacuum!! ! PREMOS A uncertainty: !± 280 ppm!
! !(± 0.4 W/m2)!
• new: stray light estimate:!PREMOS A ! ! !1800 ppm!(previously thought to be 250 ppm;! corresponding to 2 W/m2 difference)!
13.09.2011!
Werner Schmutz!
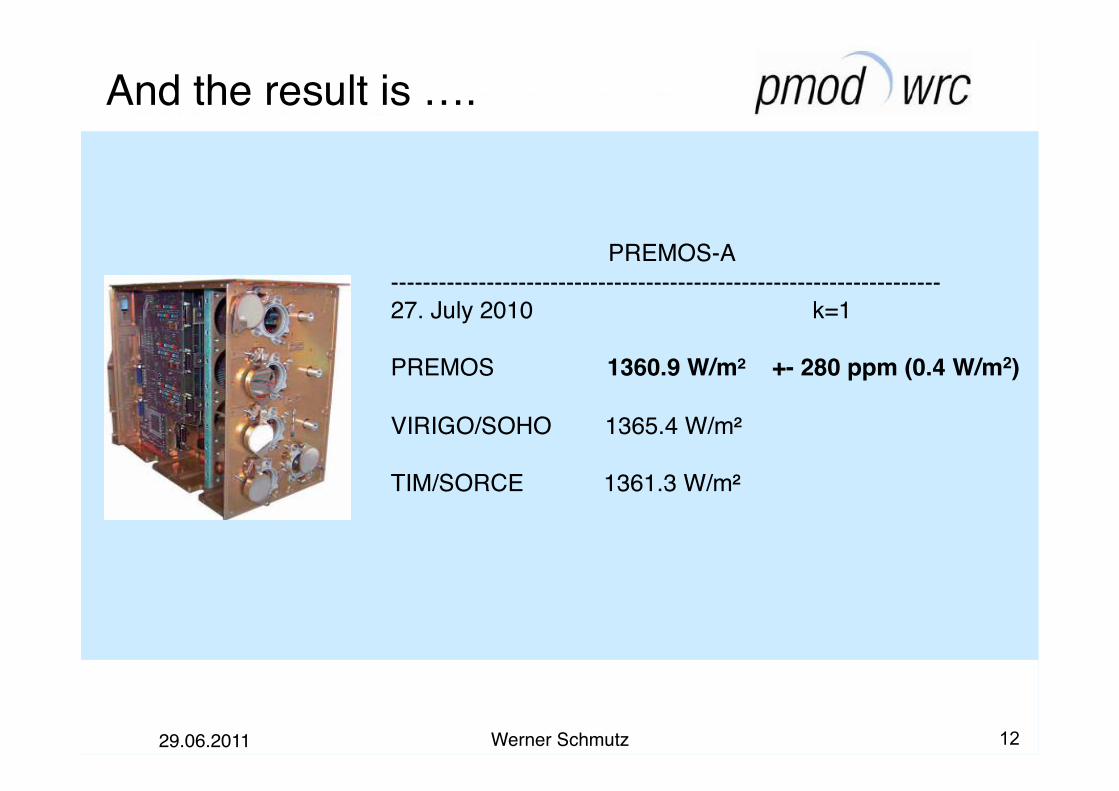
And the result is ….!
12 29.06.2011!
! ! PREMOS-A ! !!---------------------------------------------------------------------!27. July 2010 k=1!
PREMOS ! 1360.9 W/m² +- 280 ppm (0.4 W/m2) !
VIRIGO/SOHO 1365.4 W/m²!
TIM/SORCE 1361.3 W/m² !

Werner Schmutz!
Conclusions on absolute TSI!
13
• TSI-PREMOS-A is calibrated (fully SI-traceable!);!
• Absolute uncertainty is 280 ppm or 0.4 W/m2 (k=1)!
• PICARD/PREMOS measures 0.4 W/m2 lower than SORCE/TIM – thus, agrees with TIM within the uncertainty of the absolute calibration;!
• PICARD/PREMOS is about 4.5 W/m2 lower than SOHO/VIRGO – thus, the high value is outside the uncertainty limit (>11 sigma).!
13.09.2011!

Comparison PREMOS to TIM!
Werner Schmutz! 14 13.09.2011!
PREMOS A regular operation
started in September 2010
First lightJuly 27, 2010

Ratio PREMOS to TIM!
Werner Schmutz! 15 13.09.2011!
±100 ppm (0.1 W/m2)!

Sensitivity changes!
Werner Schmutz! 16 13.09.2011!
• The sensitivity of radiometers in space change with time!
• It is thought the sensitivity change is a function of exposure time, or more accurately, of a (UV-)radiation dose!
• The sensitivity changes are evaluated by comparing two radiometers which are as identical as possible;
! one observing the Sun operationally;! the other only occasionally.
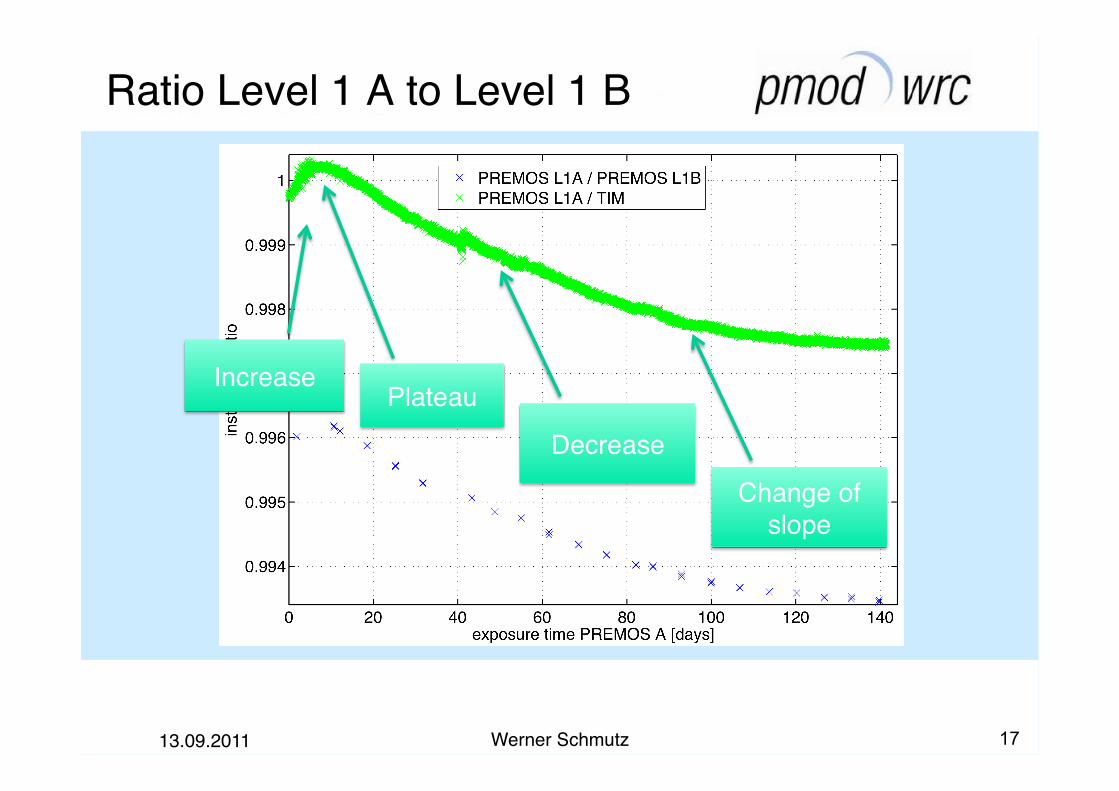
Ratio Level 1 A to Level 1 B!
Werner Schmutz! 17 13.09.2011!
Increase!Plateau!
Decrease!
Change of slope!

Increase of A and B: Ratio to TIM!
Werner Schmutz! 18 13.09.2011!
L1B
B real time: 1 year!
A real time: 4 days!
50 ppm

Discussion!
Werner Schmutz! 19 13.09.2011!
• The ratio of PREMOS to TIM over the first year was constant within ±100 ppm;!
• Over one year PREMOS-B, corrected with the observed sensitivity change of A, drifted relative to TIM systematically by 50 ppm!
• This can be interpreted as either:!• TIM was drifting by 50 ppm!or!• The sensitivity changes of the two radiometers A and B
are not identical as a function of exposure time !!

Compare to VIRGO radiometers
The PREMOS radiometers are of the same type as the VIRGO PMO6V radiometers on SOHO:
What were the sensitivity changes applied to of the PMO6-VIRGO radiometers ?

Applied sensitivity changes to PMO6-V level 1 composite!
Werner Schmutz! 21 13.09.2011!
200 ppm
A
B B-real time: 1 year!
1996! 1997!

Applied sensitivity corrections!
Werner Schmutz! 22 13.09.2011!
PMO6V-B: exposure days 0-6: Increase
exposure days 7 to 10 “flat”
exposure days 10 to 12 increase …
… in contrast to PMO6V-A that decreased after exposure days 10
compare to ACRIM II

PMO6V-B level 1 compared to ACRIM!
Werner Schmutz! 23 13.09.2011!
0 2 4 6 8 10 12 141.0029
1.003
1.0031
1.0032
1.0033
1.0034
1.0035
1.0036
1.0037
1.0038
exposure time B [d]
fit PMO6VB / Acrim

Real time!
Werner Schmutz! 24 13.09.2011!
1996 1996.5 1997 1997.5 1998 1998.5 1999 1999.5 20001.0029
1.003
1.0031
1.0032
1.0033
1.0034
1.0035
1.0036
1.0037
1.0038
date
fit PMO6VB / Acrim

Comparison to ACRIM II!
Werner Schmutz! 25 13.09.2011!
PMO6V-B: exposure days 0-6: Increase confirmed
exposure days 7 to 10 “flat” (confirmed)
exposure days 10 to 12 increase no (but noisy)
compare PMO6V-A to ACRIM II

Comparison of the sensitivity changes of PMO6V-A!
Werner Schmutz! 26 13.09.2011!

Werner Schmutz! 27 13.09.2011!
Re-evaluation of 1996-1998 PMO6V sensitivity corrections!
use ACRIM trend

Werner Schmutz! 28 13.09.2011!
0 200 400 600 800 1000 12001
1.0005
1.001
1.0015
1.002
1.0025
1.003
1.0035
1.004
exposure time A [d]
fit PMO6VA / Acrim
Datafit1fit2fit3

Werner Schmutz! 29 13.09.2011!
0 200 400 600 800 10001
1.0005
1.001
1.0015
1.002
1.0025
1.003
1.0035
1.004
exposure time A [d]
PMO6VA L1 / PMO6V new L2 f1PMO6VA L1 / PMO6V new L2 f2
1996.14 1996.74 1997.3 1997.87 1998.45 1999.32

Werner Schmutz!
New composite 1996-2010!
PMO6V-modified ACRIM
adjusted!PMOD! TIM!
PREMOS composite!
13.09.2011! 30

PREMOS composite 1996-2010!
13.09.2011! 31
0.2 W/m2

Werner Schmutz!
Summary 1!
32
• Absolute level of TSI is 1360 W/m2!• Sensitivity changes are rather complex:
increase – plateau – decrease – change of slope!• Sensitivity increase of PREMOS A and B are not
identical (relative to TIM)!
!this questions the usual assumption that two cavities are sufficient to correct for in flight sensitivity changes !!
13.09.2011!

Werner Schmutz!
Summary 2!
33
• The early (1996-1998) sensitivity changes of PMO6V A and B radiometers on SOHO are different (as applied for the PMOD composite)!
• We suggest to adapt the ACRIM trend to assess the early PMO6V sensitivity changes!
• Observational 1996-1998 TSI data are uncertain!• Observed data do not support a measureable TSI
trend between the minima in 1996 and 2008 !!
13.09.2011!
When assessing long term trends, allow for an uncertainty of at least 0.2 W/m2
for the 1996 solar minimum !

Consequences for long term reconstructions?!
Werner Schmutz! 34 13.09.2011!
variability (young stars). For stars with log R0HK there is a rela-
tively well-defined increase in the amount of photometric vari-ability relative to the chromospheric variability. Six outliers liewell below the rest, including the unusually active star HD 129333.As before, the nine stars with only one usable comparison star areplotted using inverted triangles.
Left of the Sun’s location on this diagram there is considerablescatter, which we attribute mainly to the poorly known level ofphotometric activity of these stars rather than to an astrophysi-cally meaningful effect.
This figure, which we consider a key exhibit in the morphol-ogy of stellar variability for the Sun and its analogs, raises aninteresting question. Is the Sun’s location, just slightly above thedividing line, fixed for historical time or could it shift around abit? Certainly, during the three solar cycles of modern observa-tion, there is nothing to suggest that spot activity could over-take facular activity as the principal component of solar variability.The answer, apart from whatever theoretical ruminations mightarise, lies in expanding the sample of stars and pushing down thelimits of estimated photometric variability as far as possible. Theanswer, therefore, lies in the indefinite future.
4.5. Lessons Learned
In this section we discuss how our results might have beenimproved hadwe known in 1984what we know today.We beganour survey of Sun-like field stars in 1984 with the new knowl-edge that young F7YK2 stars in the Hyades vary at the easilydetected level of a few percent (Radick et al. 1983; Lockwood et al.1984). This was a revelation, since Jerzykiewicz & Serkowski(1966) had shown that stars in this spectral range, if they vary atall, do so at levels below 0.5% on a decadal timescale. The Sunitself, shown from spacecraft observations in 1980 to be a vari-able star on a timescale of days (Willson et al. 1981), had yet toreveal its minuscule cycle timescale 0.1% variation (Frohlich2003a, 2003b).
The challenge, as we perceived it in 1984, was therefore tomap out variability downward from the easily detected several-percent range of Hyades dwarfs to whatever level our instrumen-tation would allow. To be reasonably certain of not coming upempty handed, we included a number of young, presumably ac-tive stars (based on their log R0
HK values) in our sample. Theserewarded us almost immediately by showing variability.
A preliminary reconnaissance of our capabilities based on ob-servations of planetary targets (e.g., Lockwood 1977, 1981) had
Fig. 7.—Long-term (cycle timescale) photometric variation vs. averagechromospheric activity level.
Fig. 8.—Correlation between photometric brightness and HK emission var-iations for long timescales based on 13Y20 yr of observation. (top) and 7Y12 yrof observation from Paper II. (bottom). Many correlations are strengthened andnone of the 32 surviving stars in the longer sample show reversal in the sense ofthe correlation.
Fig. 9.—Slope of the regression of photometric brightness variation on HKemission variation, plotted as a function of average chromospheric level.
PATTERNS OF VARIATION AMONG SUN-LIKE STARS 301No. 1, 2007
Friday, September 9, 11
Lockwood et al. ApJS 171, 2007
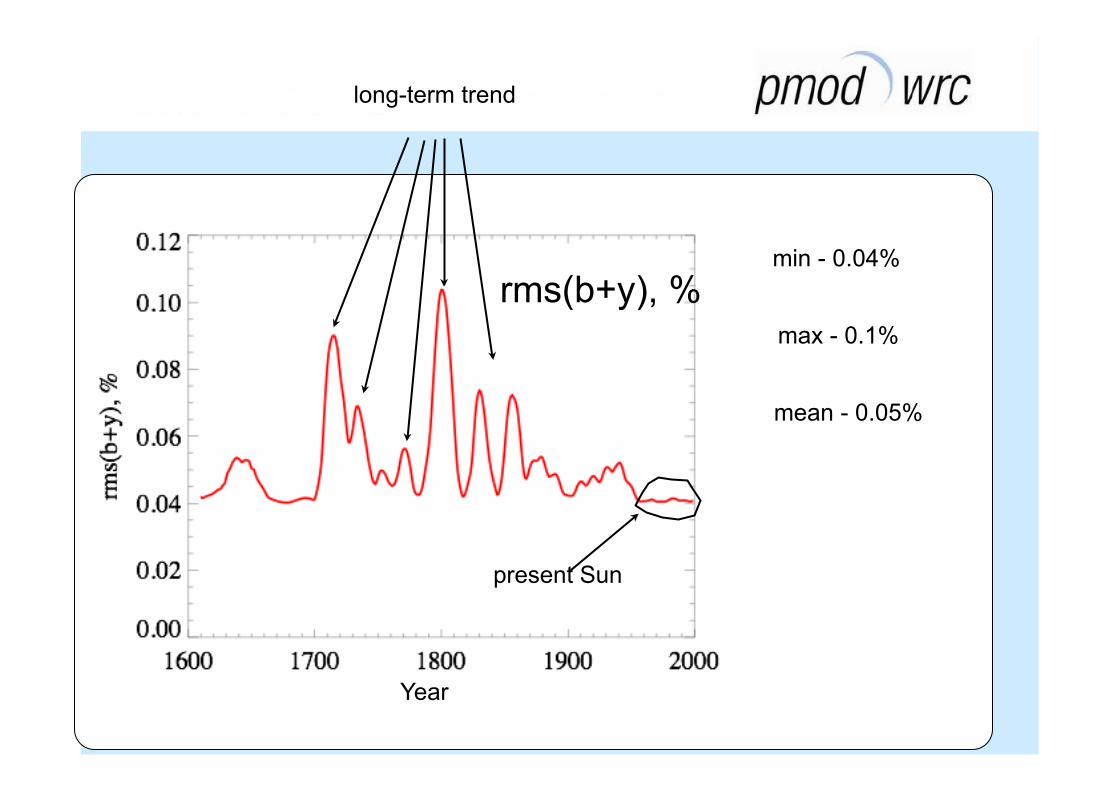
rms(b+y), %
Year
long-term trend
present Sun
min - 0.04%
max - 0.1%
mean - 0.05%

Factor 1.3 “inclination effect”!
Werner Schmutz! 36 13.09.2011!
min - 0.052% max - 0.013% mean - 0.065%
Sun - mean position
(Factor 1.3 from Knaack et al. 2001)

Thank you for your attention!
Werner Schmutz! 37 13.09.2011!
PREMOS PICARD
Acknowledgments to André Fehlmann and Markus Suter for their contributions


