PRCA Membership Benchmarking Survey:Key Findings 2008
June 2008
2
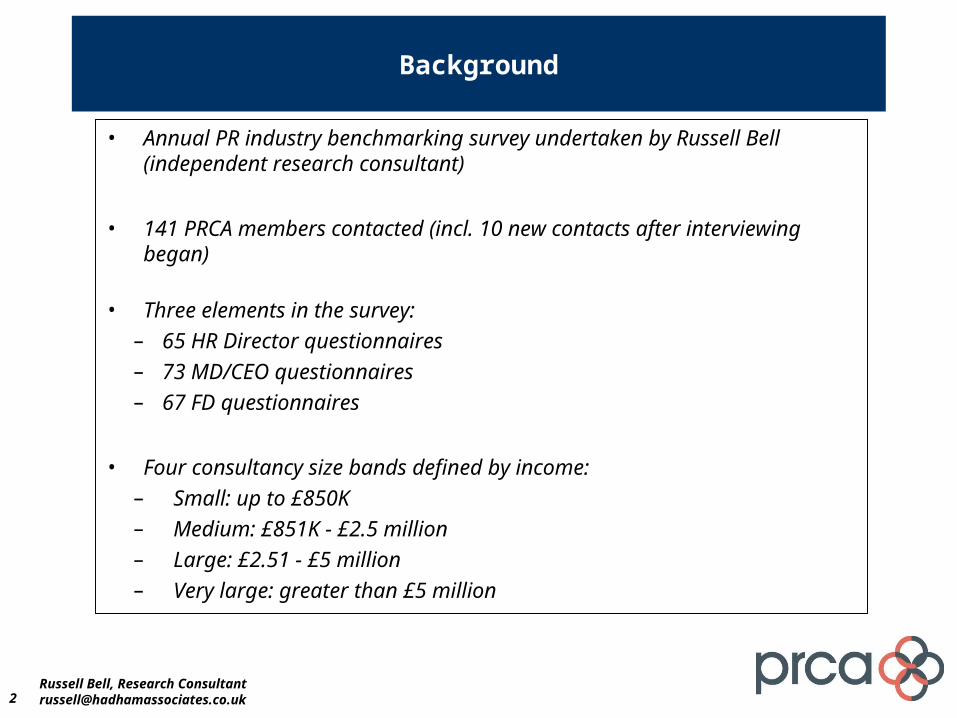
Background
• Annual PR industry benchmarking survey undertaken by Russell Bell (independent research consultant)
• 141 PRCA members contacted (incl. 10 new contacts after interviewing began)
• Three elements in the survey:– 65 HR Director questionnaires– 73 MD/CEO questionnaires– 67 FD questionnaires
• Four consultancy size bands defined by income:– Small: up to £850K– Medium: £851K - £2.5 million– Large: £2.51 - £5 million– Very large: greater than £5 million
Russell Bell, Research [email protected]

Finance Directors
4
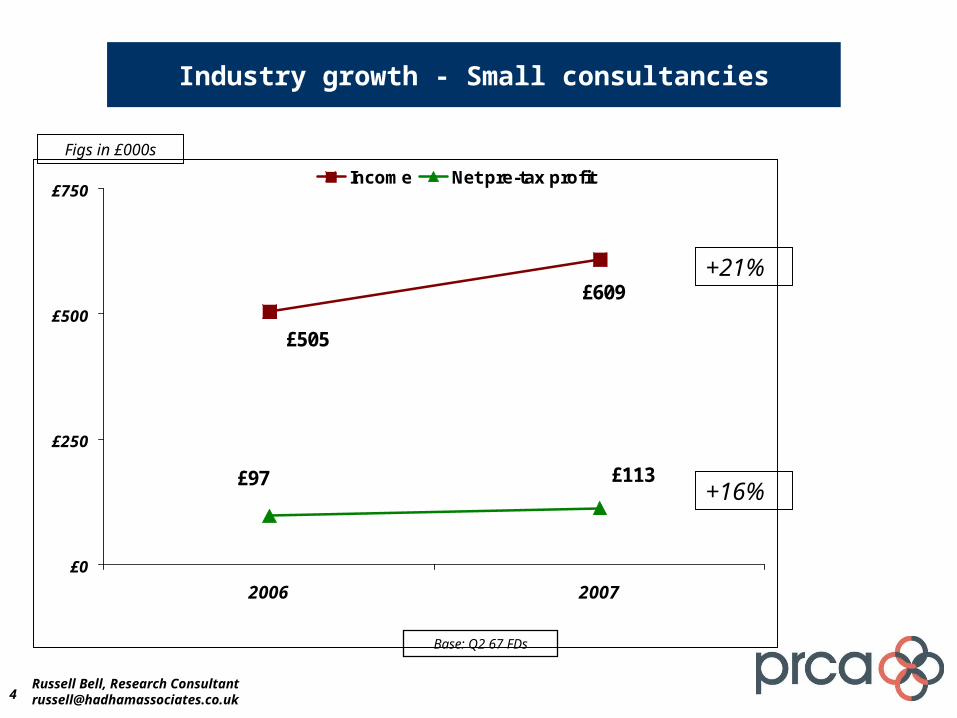
Industry growth - Small consultancies
£609
£505
£113£97
£0
£250
£500
£750
2006 2007
Income Net pre-tax profit
+21%
Figs in £000s
Base: Q2 67 FDs
+16%
Russell Bell, Research [email protected]

5
Industry growth - Medium consultancies
£1,484£1,396
£208£210
£0
£250
£500
£750
£1,000
£1,250
£1,500
£1,750
2006 2007
Income Net pre-tax profit
Figs in £000s
+6%
-1%
Base: Q2 67 FDs
Russell Bell, Research [email protected]

6
Industry growth - Large consultancies
£3,608£3,372
£609£534
£0
£500
£1,000
£1,500
£2,000
£2,500
£3,000
£3,500
£4,000
£4,500
2006 2007
Income Net pre-tax profit
Base: Q2 67 FDs
Figs in £000s
+7%
+14%
Russell Bell, Research [email protected]

7
Industry growth – Very large consultancies
£8,655£8,110
£1,347£1,337
£0
£2,000
£4,000
£6,000
£8,000
£10,000
2006 2007
Income Net pre-tax profit
+7%
+1%
Figs in £000s
Base: Q2 67 FDs
Russell Bell, Research [email protected]
8
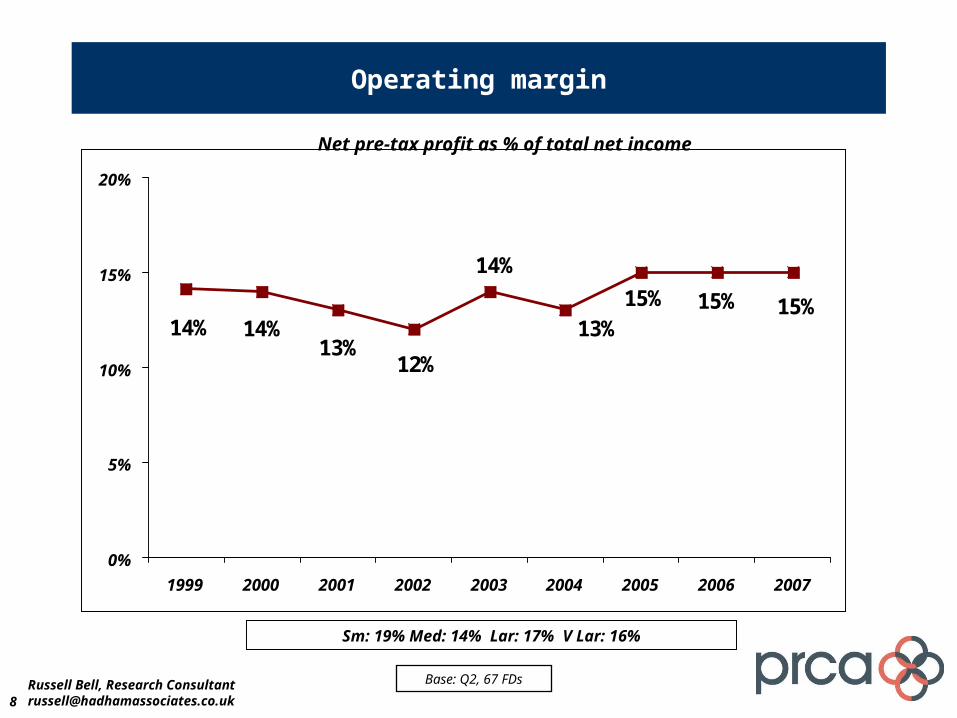
Operating margin
15%15%15%13%
14%
12%13%
14%14%
0%
5%
10%
15%
20%
1999 2000 2001 2002 2003 2004 2005 2006 2007
Base: Q2, 67 FDs
Sm: 19% Med: 14% Lar: 17% V Lar: 16%
Net pre-tax profit as % of total net income
Russell Bell, Research [email protected]
9
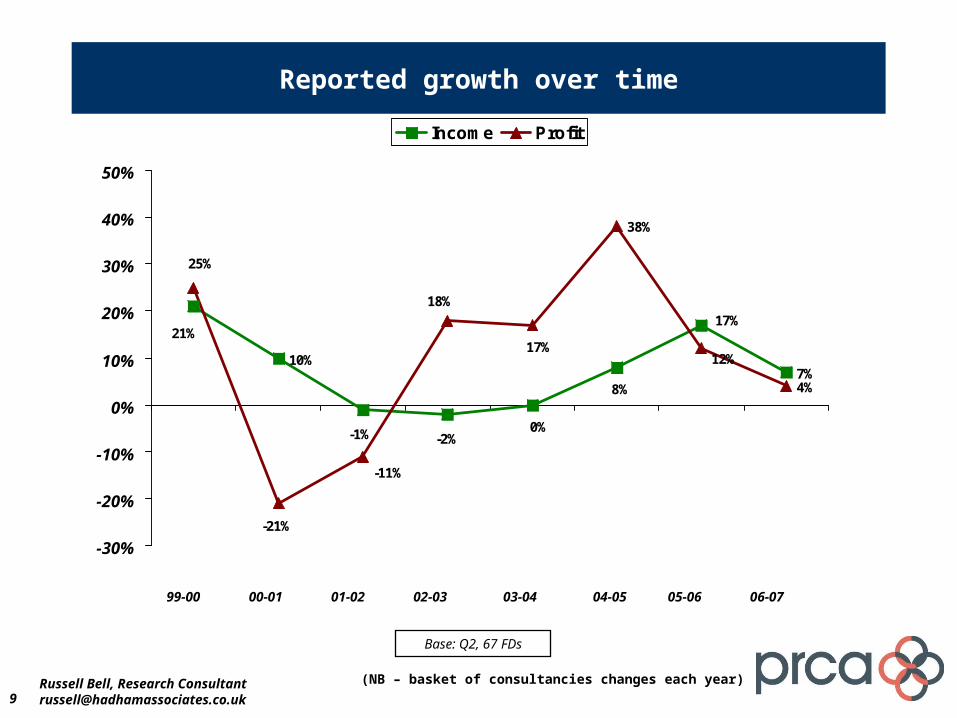
Reported growth over time
Base: Q2, 67 FDs
(NB – basket of consultancies changes each year)
10%7%4%
17%
8%
0%-2%-1%
21%
12%
38%
17%
18%
-11%
-21%
25%
-30%
-20%
-10%
0%
10%
20%
30%
40%
50%
Income Profit
05-0604-0503-0402-0301-0200-0199-00
Russell Bell, Research [email protected]
06-07
10
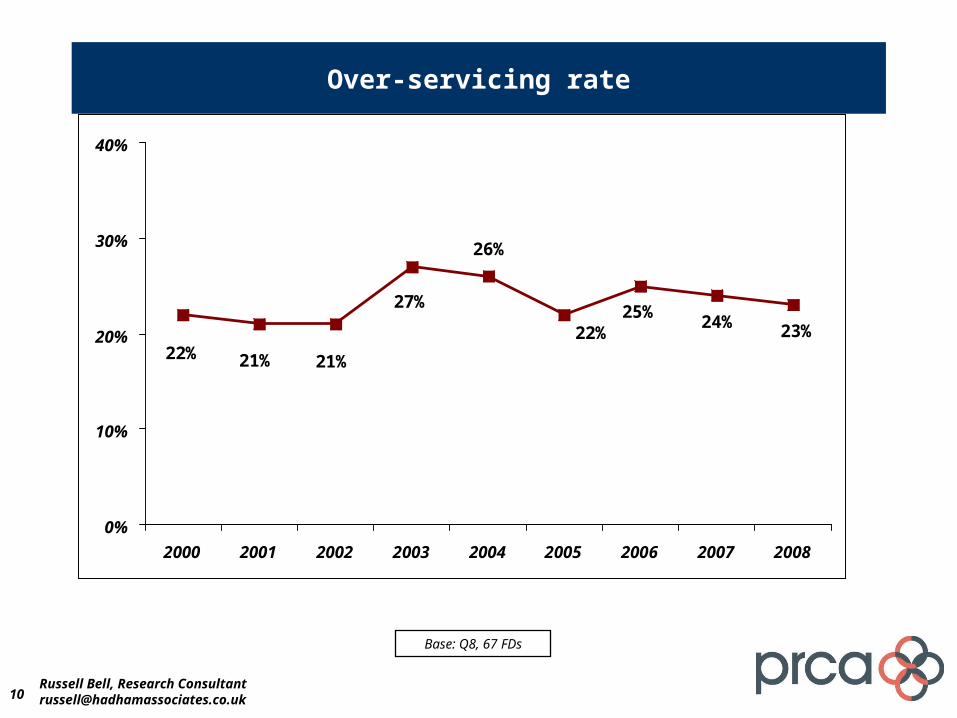
Over-servicing rate
23%24%25%
22%
26%
27%
21%21%22%
0%
10%
20%
30%
40%
2000 2001 2002 2003 2004 2005 2006 2007 2008
Base: Q8, 67 FDs
Russell Bell, Research [email protected]

11
Offer payment by results/performance related pricing
28%
38%
35%36%
27%29%
19%
0%
10%
20%
30%
40%
2002 2003 2004 2005 2006 2007 2008
Base: Q17, 67 FDs
Russell Bell, Research [email protected]

HR Directors
13
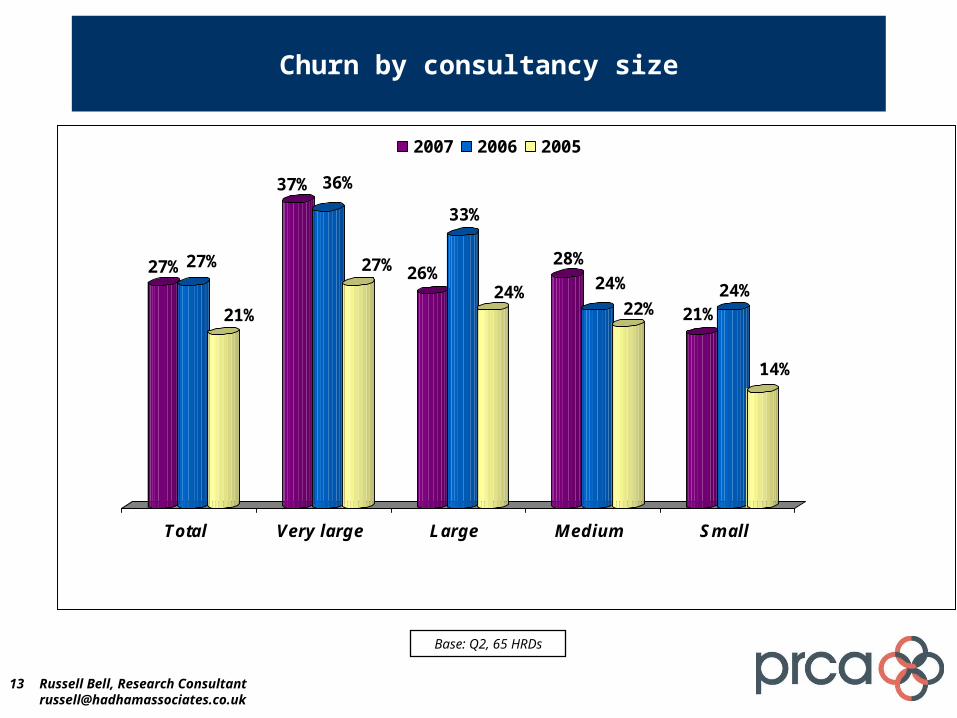
Churn by consultancy size
27% 27%
21%
37% 36%
27% 26%
33%
24%
28%
24%
22% 21%24%
14%
Total Very large Large Medium Small
2007 2006 2005
Base: Q2, 65 HRDs
Russell Bell, Research [email protected]
14
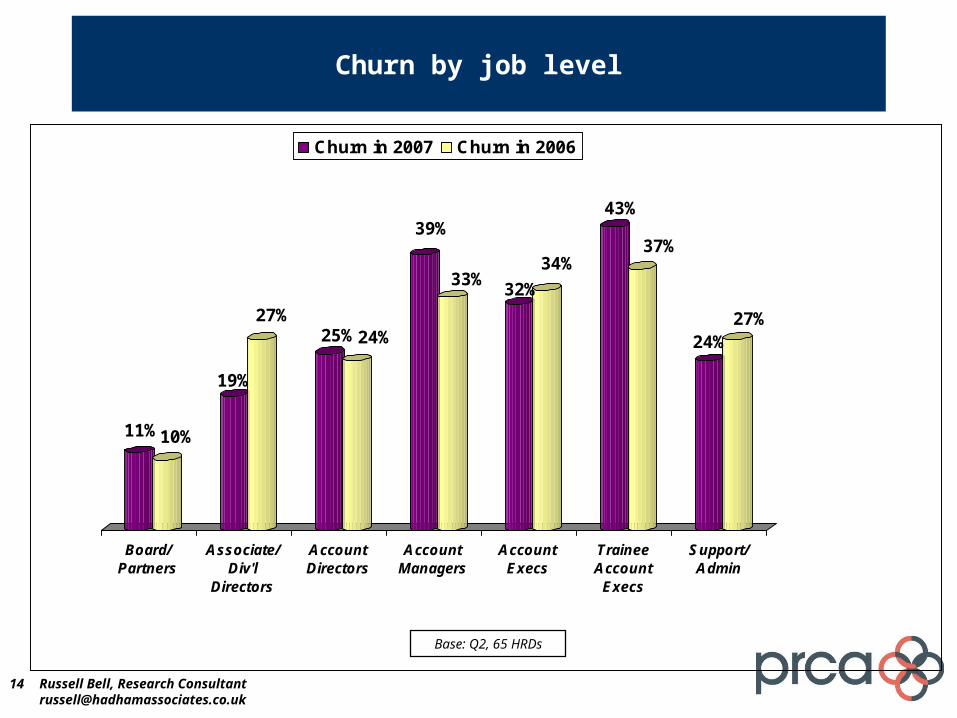
Churn by job level
11%10%
19%
27%25%24%
39%
33%32%
34%
43%
37%
24%27%
Board/Partners
Associate/Div'l
Directors
AccountDirectors
AccountManagers
AccountExecs
TraineeAccount
Execs
Support/Admin
Churn in 2007 Churn in 2006
Base: Q2, 65 HRDs
Russell Bell, Research [email protected]
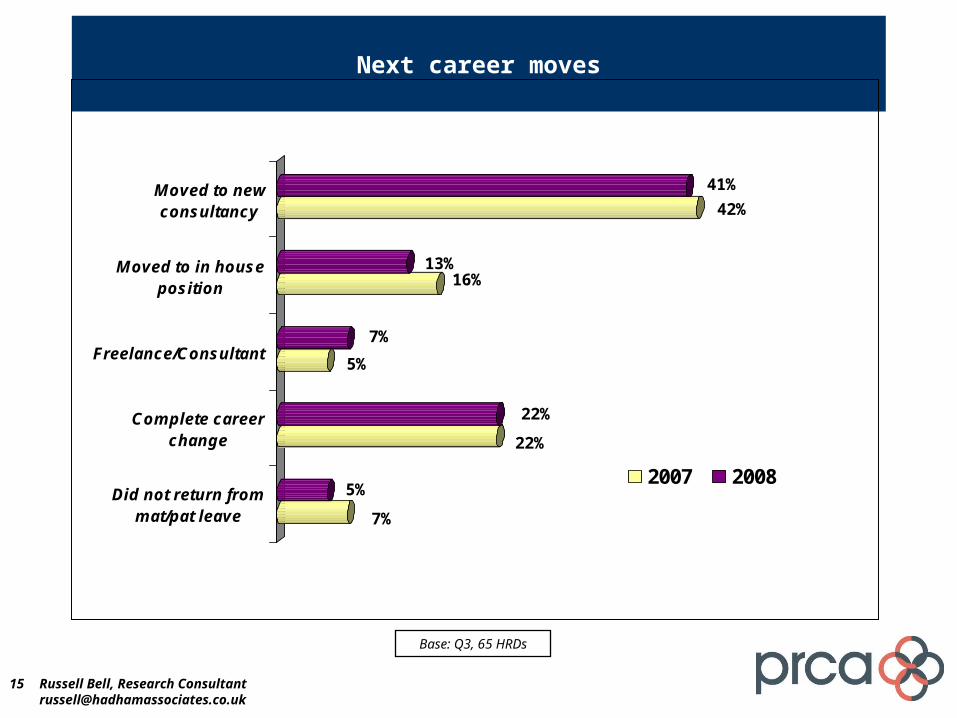
15
Next career moves
7%
5%
22%
22%
5%
7%
16%13%
42%
41%
Did not return frommat/pat leave
Complete careerchange
Freelance/Consultant
Moved to in houseposition
Moved to newconsultancy
2007 2008
Base: Q3, 65 HRDs
Russell Bell, Research [email protected]
16
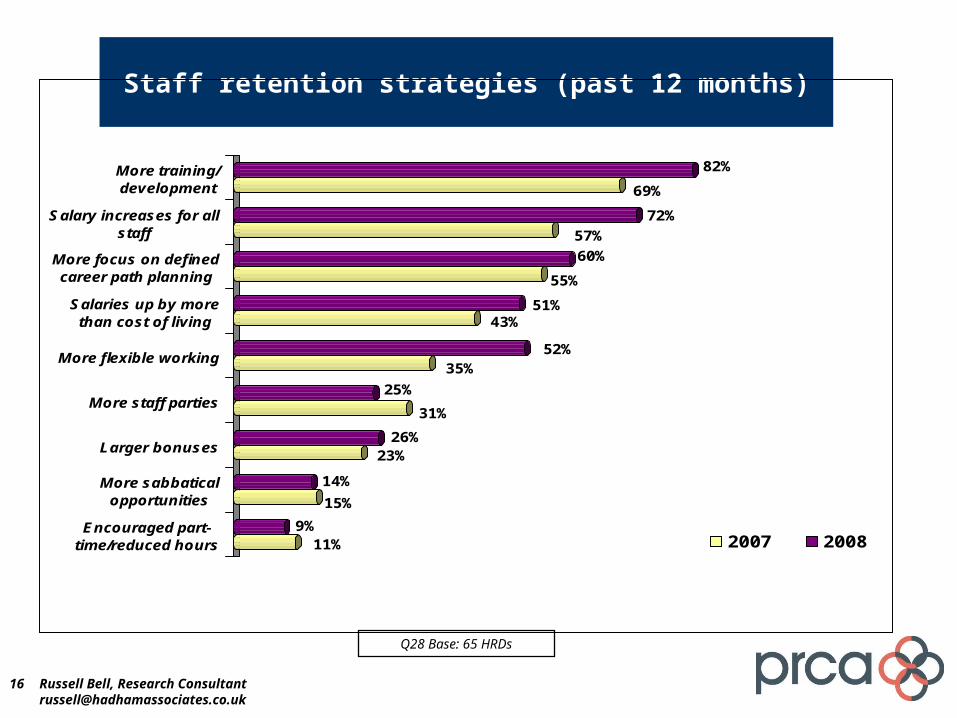
Staff retention strategies (past 12 months)
11%9%
15%
14%
23%26%
31%
25%
35%52%
43%51%
55%
60%
57%
72%
69%
82%
Encouraged part-time/reduced hours
More sabbaticalopportunities
Larger bonuses
More staff parties
More flexible working
Salaries up by morethan cost of living
More focus on definedcareer path planning
Salary increases for allstaff
More training/development
2007 2008
Q28 Base: 65 HRDs
Russell Bell, Research [email protected]

17
Employment prospects: coming 12 months
8%
18%
2%
2%
0
5%
69%
54%
83%
77%
Not clear yet
Redundancies/staffcuts likely
Reduce staffnumbers throughnon-replacement
Likely to berecruiting senior
staff
Likely to berecruiting junior
staff
2007 2008
Q29 Base: 65 HRDs
Russell Bell, Research [email protected]
18
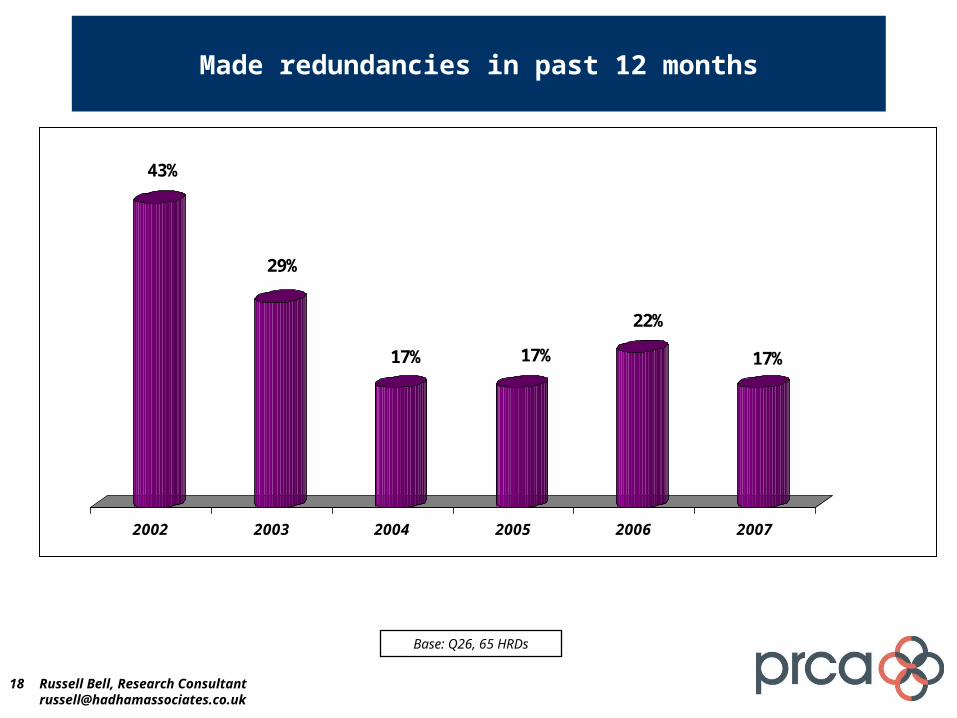
Made redundancies in past 12 months
43%
29%
17% 17%
22%
17%
2002 2003 2004 2005 2006 2007
Base: Q26, 65 HRDs
Russell Bell, Research [email protected]
19
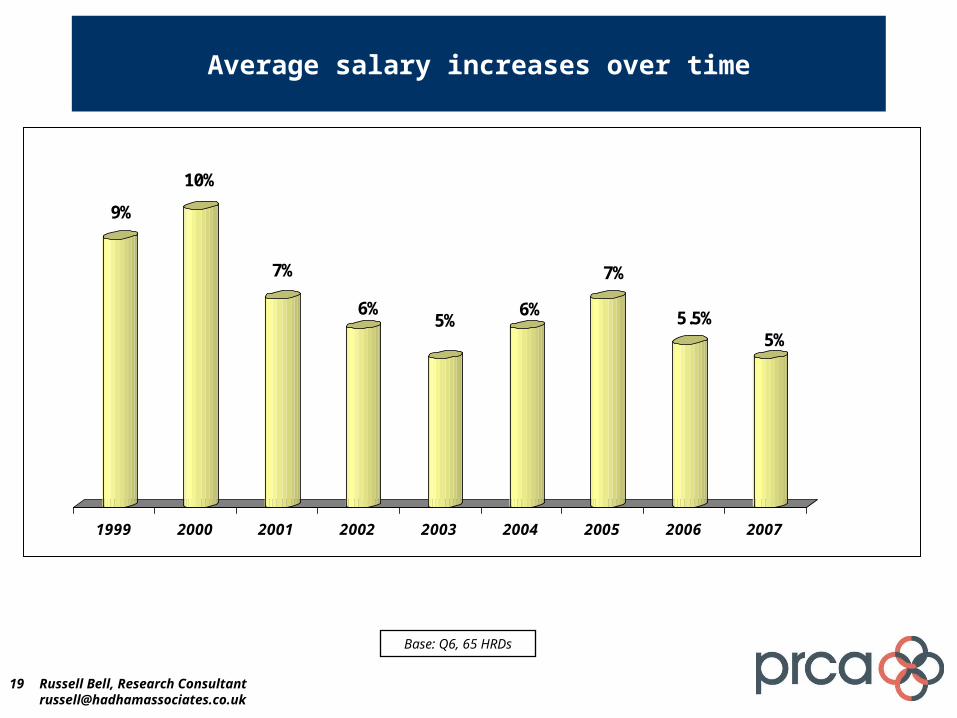
Average salary increases over time
9%
10%
7%
6%5%
6%
7%
5.5%5%
1999 2000 2001 2002 2003 2004 2005 2006 2007
Base: Q6, 65 HRDs
Russell Bell, Research [email protected]
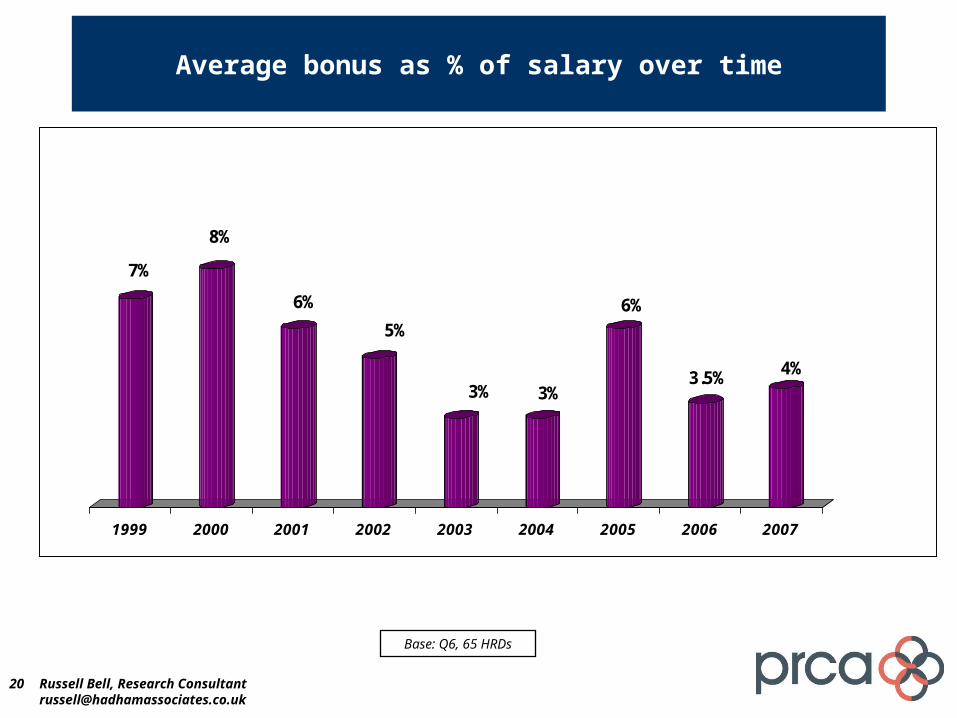
20
Average bonus as % of salary over time
7%
8%
6%
5%
3% 3%
6%
3.5% 4%
1999 2000 2001 2002 2003 2004 2005 2006 2007
Base: Q6, 65 HRDs
Russell Bell, Research [email protected]
21
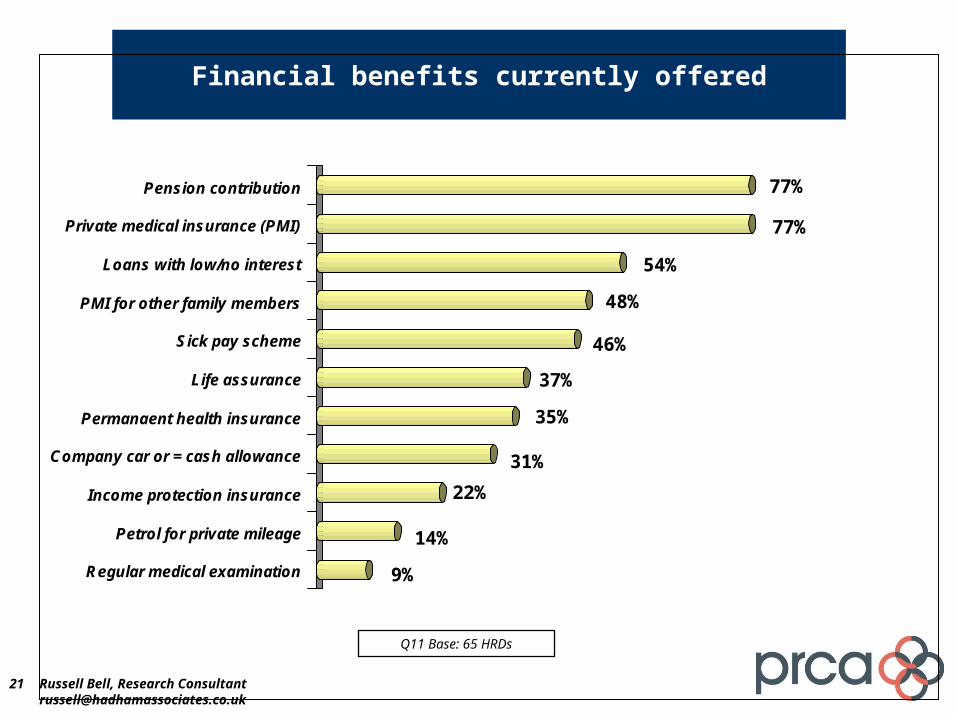
Financial benefits currently offered
9%
14%
22%
31%
35%
37%
46%
48%
54%
77%
77%
Regular medical examination
Petrol for private mileage
Income protection insurance
Company car or = cash allowance
Permanaent health insurance
Life assurance
Sick pay scheme
PMI for other family members
Loans with low/no interest
Private medical insurance (PMI)
Pension contribution
Q11 Base: 65 HRDs
Russell Bell, Research [email protected]
22
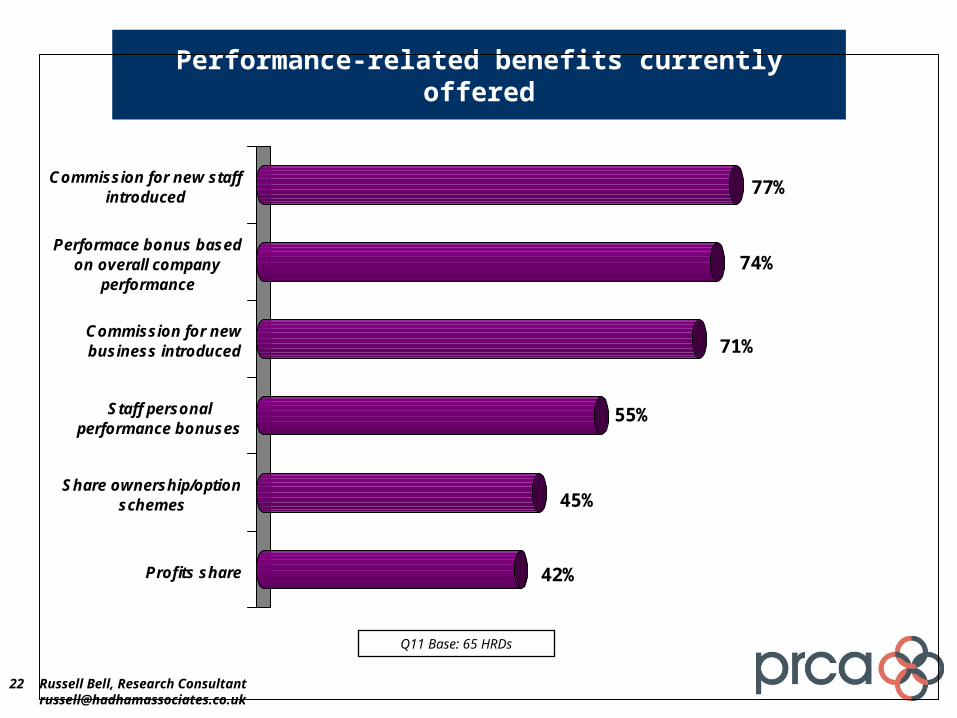
Performance-related benefits currently offered
42%
45%
55%
71%
74%
77%
Profits share
Share ownership/optionschemes
Staff personalperformance bonuses
Commission for newbusiness introduced
Performace bonus basedon overall company
performance
Commission for new staffintroduced
Q11 Base: 65 HRDs
Russell Bell, Research [email protected]
23
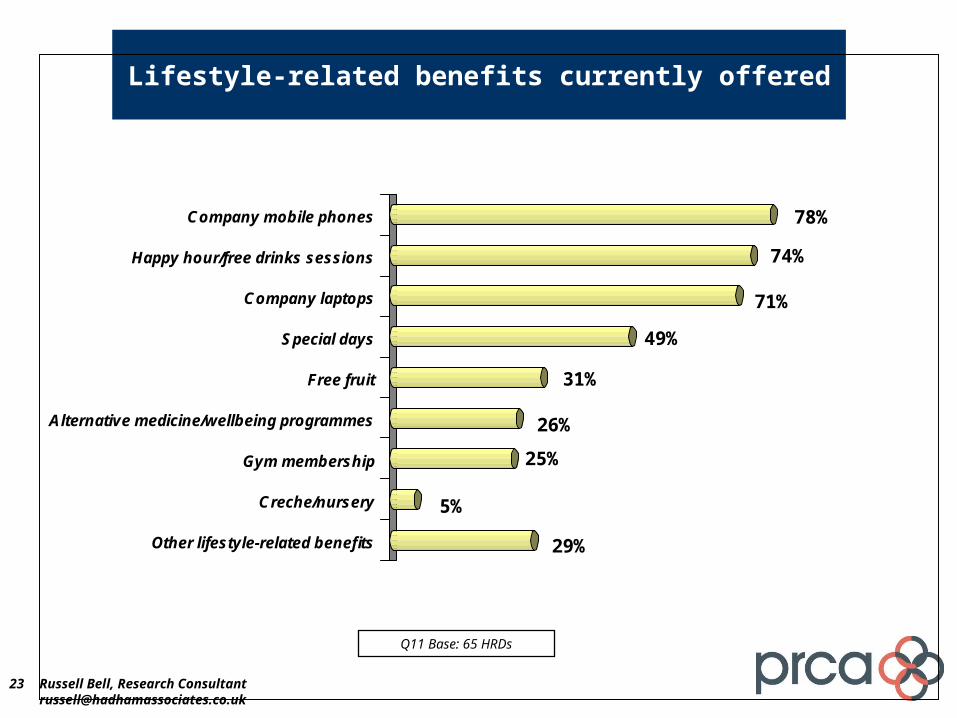
Lifestyle-related benefits currently offered
29%
5%
25%
26%
31%
49%
71%
74%
78%
Other lifestyle-related benefits
Creche/nursery
Gym membership
Alternative medicine/wellbeing programmes
Free fruit
Special days
Company laptops
Happy hour/free drinks sessions
Company mobile phones
Q11 Base: 65 HRDs
Russell Bell, Research [email protected]
24
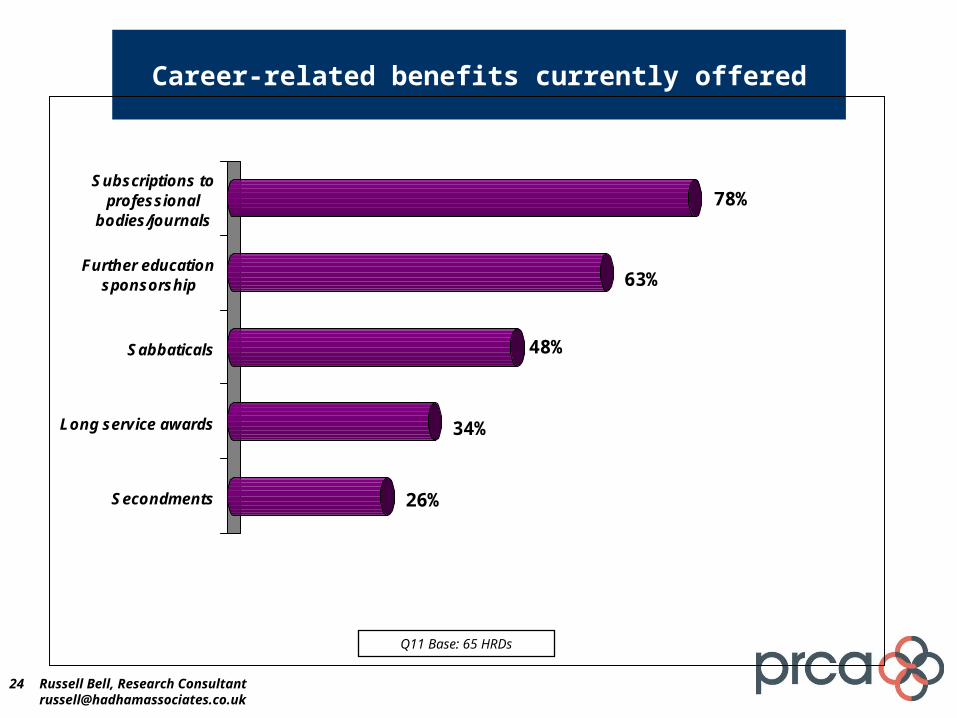
Career-related benefits currently offered
26%
34%
48%
63%
78%
Secondments
Long service awards
Sabbaticals
Further educationsponsorship
Subscriptions toprofessional
bodies/journals
Q11 Base: 65 HRDs
Russell Bell, Research [email protected]

MDs/CEOs
26
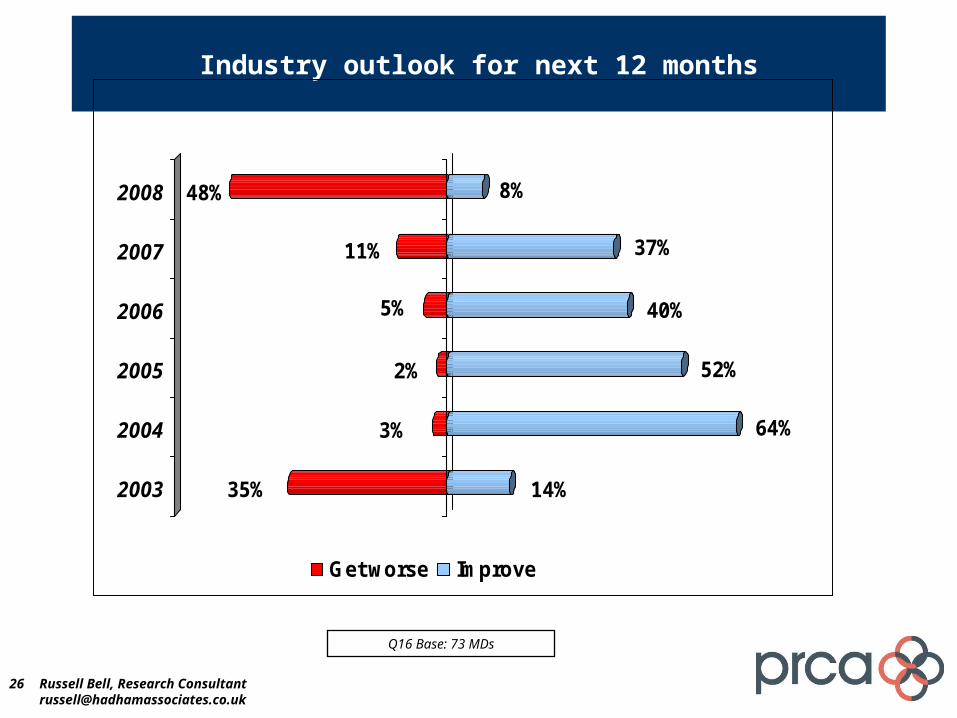
Industry outlook for next 12 months
35% 14%
3% 64%
2% 52%
5% 40%
11% 37%
48% 8%2008
2007
2006
2005
2004
2003
Get worse Improve
Q16 Base: 73 MDs
Russell Bell, Research [email protected]
27
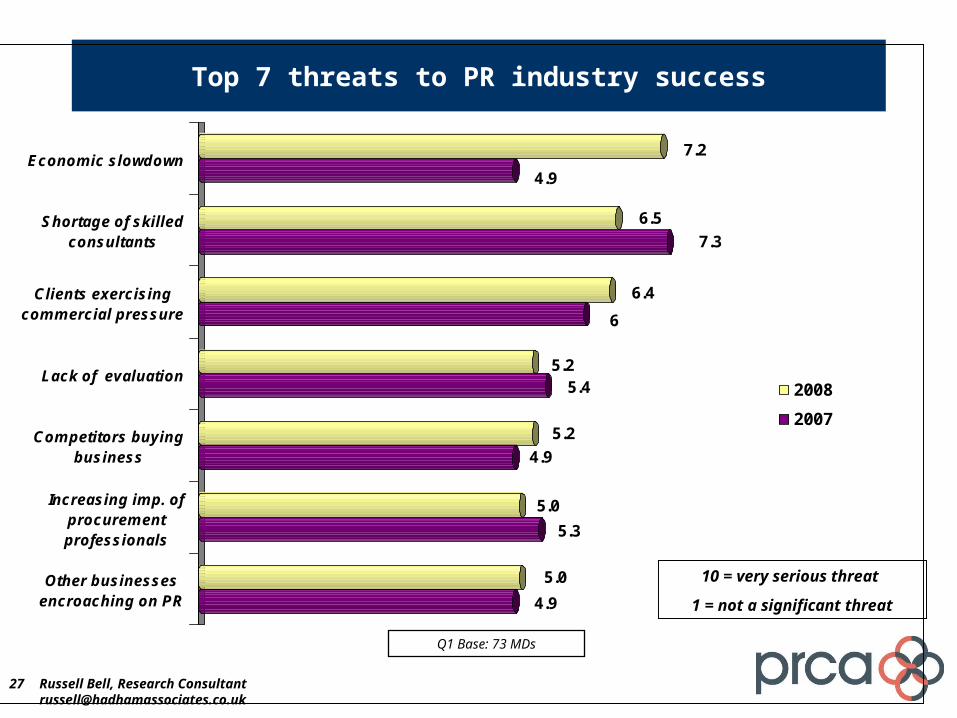
Top 7 threats to PR industry success
4.9
5.0
5.3
5.0
4.9
5.2
5.45.2
6
6.4
7.3
6.5
4.9
7.2
Other businessesencroaching on PR
Increasing imp. ofprocurementprofessionals
Competitors buyingbusiness
Lack of evaluation
Clients exercisingcommercial pressure
Shortage of skilledconsultants
Economic slowdown
2008
2007
10 = very serious threat
1 = not a significant threat
Q1 Base: 73 MDs
Russell Bell, Research [email protected]
28
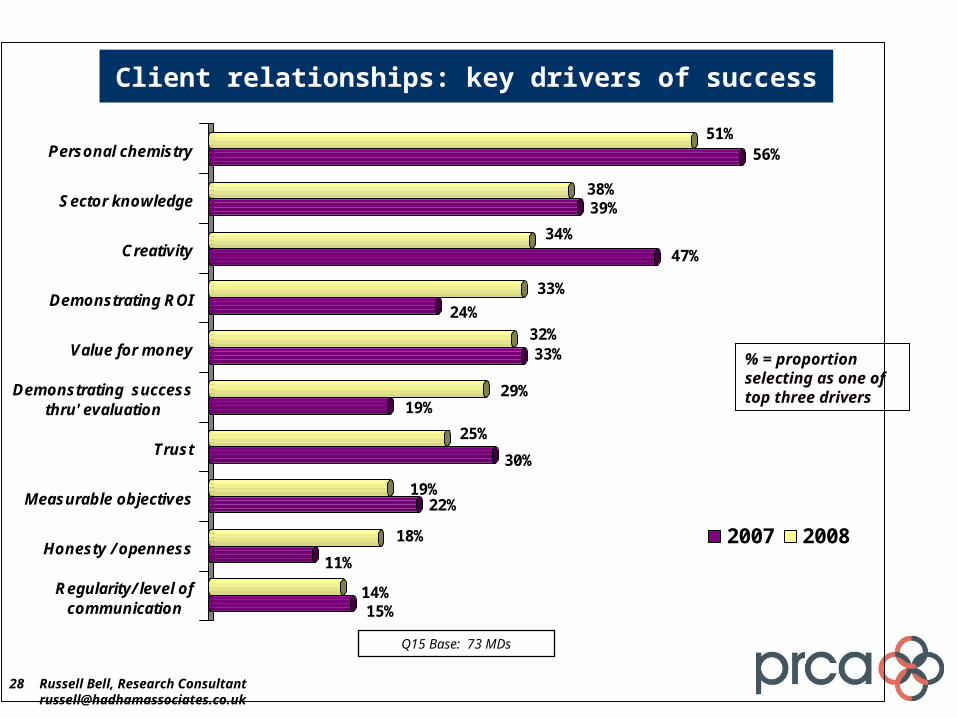
Client relationships: key drivers of success
15%14%
11%
18%
22%19%
30%
25%
19%29%
33%32%
24%
33%
47%34%
39%38%
56%51%
Regularity/ level ofcommunication
Honesty / openness
Measurable objectives
Trust
Demonstrating successthru' evaluation
Value for money
Demonstrating ROI
Creativity
Sector knowledge
Personal chemistry
2007 2008
% = proportion selecting as one of top three drivers
Q15 Base: 73 MDs
Russell Bell, Research [email protected]
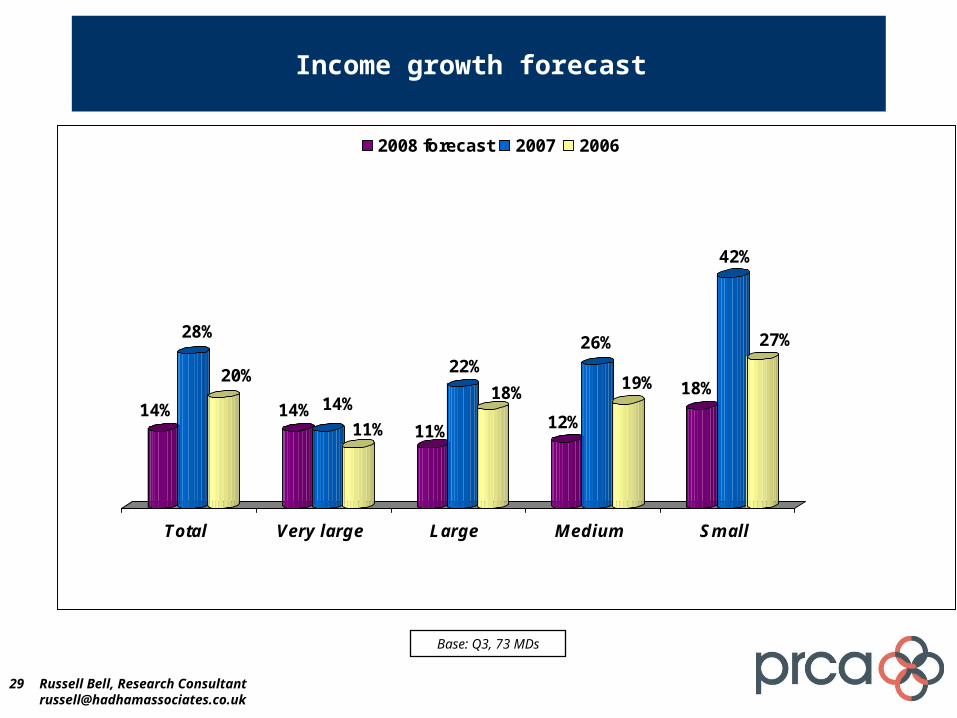
29
Income growth forecast
14%
28%
20%
14% 14%
11% 11%
22%
18%
12%
26%
19% 18%
42%
27%
Total Very large Large Medium Small
2008 forecast 2007 2006
Base: Q3, 73 MDs
Russell Bell, Research [email protected]
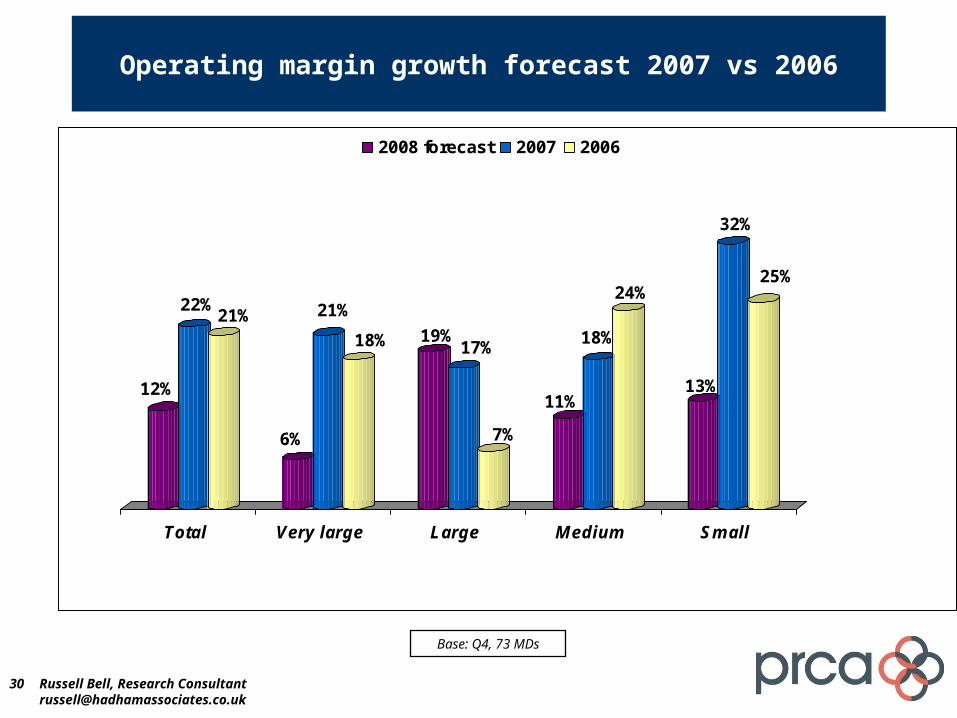
30
Operating margin growth forecast 2007 vs 2006
12%
22%21%
6%
21%
18% 19%17%
7%
11%
18%
24%
13%
32%
25%
Total Very large Large Medium Small
2008 forecast 2007 2006
Base: Q4, 73 MDs
Russell Bell, Research [email protected]
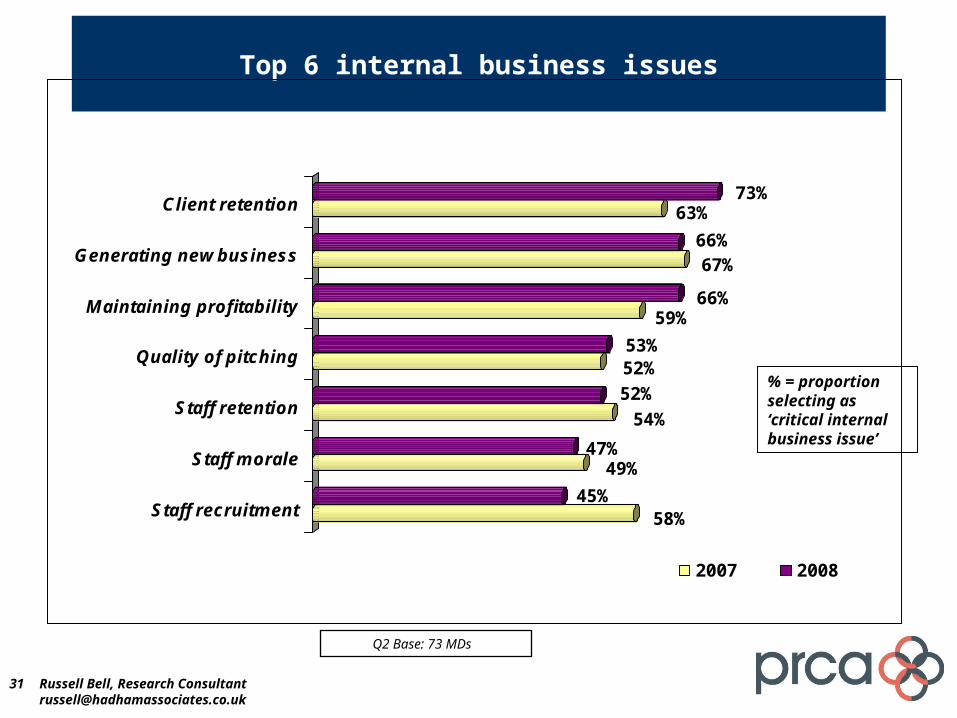
31
Top 6 internal business issues
58%45%
49%47%
54%
52%
52%53%
59%66%
67%66%
63%73%
Staff recruitment
Staff morale
Staff retention
Quality of pitching
Maintaining profitability
Generating new business
Client retention
2007 2008
% = proportion selecting as ‘critical internal business issue’
Q2 Base: 73 MDs
Russell Bell, Research [email protected]
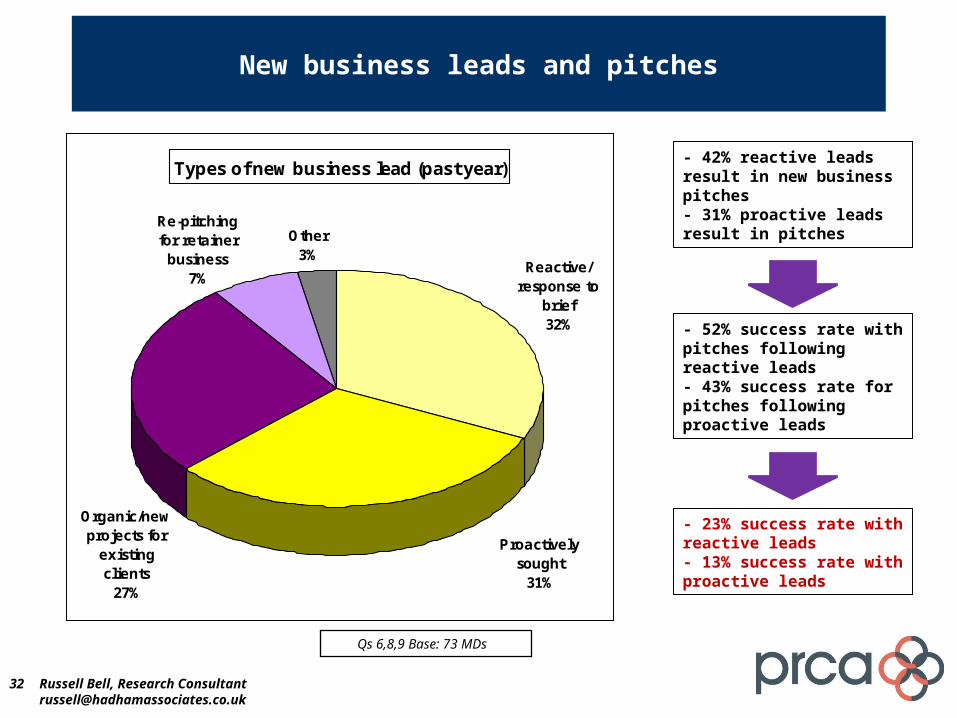
32
New business leads and pitches
Types of new business lead (past year)
Reactive/ response to
brief32%
Other 3%
Re-pitching for retainer
business7%
Proactively sought
31%
Organic/new projects for
existing clients
27%
- 42% reactive leads result in new business pitches- 31% proactive leads result in pitches
- 52% success rate with pitches following reactive leads- 43% success rate for pitches following proactive leads
Qs 6,8,9 Base: 73 MDs
Russell Bell, Research [email protected]
- 23% success rate with reactive leads - 13% success rate with proactive leads
33
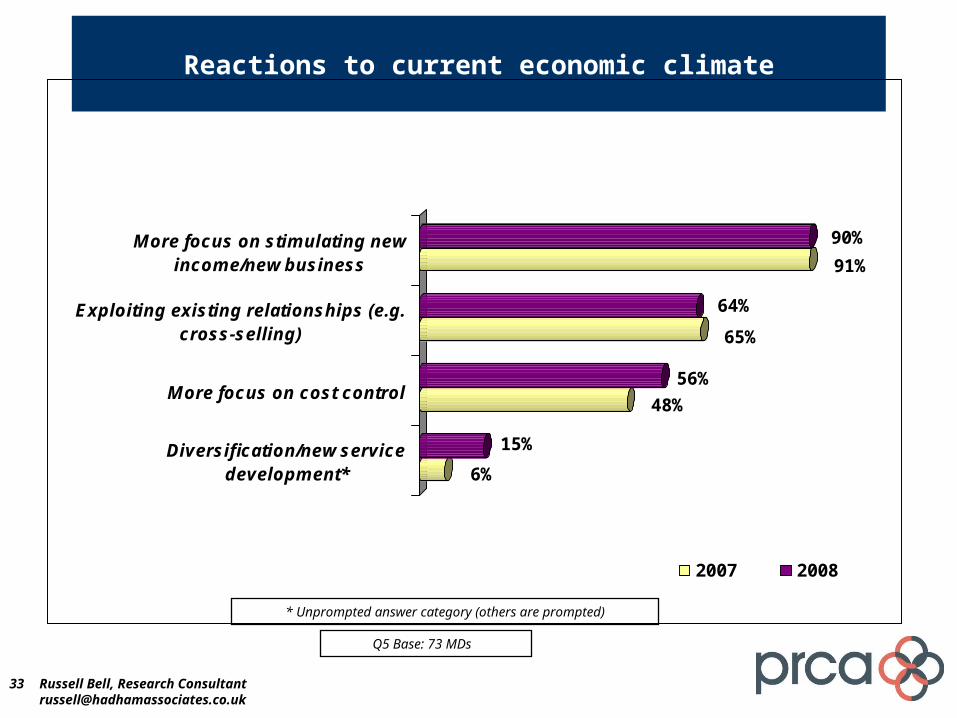
Reactions to current economic climate
6%
15%
48%
56%
65%
64%
91%
90%
Diversification/new servicedevelopment*
More focus on cost control
Exploiting existing relationships (e.g.cross-selling)
More focus on stimulating newincome/new business
2007 2008
Q5 Base: 73 MDs
Russell Bell, Research [email protected]
* Unprompted answer category (others are prompted)
34
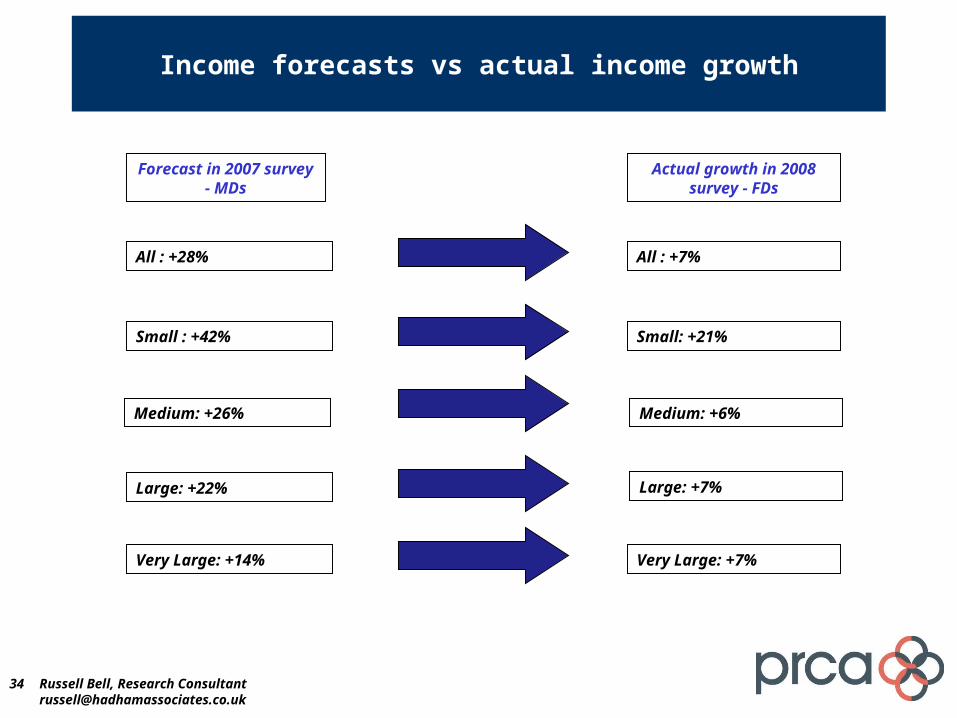
Income forecasts vs actual income growth
Forecast in 2007 survey - MDs
Actual growth in 2008 survey - FDs
All : +28% All : +7%
Small : +42%
Medium: +26%
Large: +22%
Very Large: +14%
Small: +21%
Medium: +6%
Large: +7%
Very Large: +7%
Russell Bell, Research [email protected]
End
For more information, please contact:Russell Bell on 07747 194581 or +44 7867 531557


